Protective effects of lipocalin-2 (LCN2) in acute liver injury suggest a novel function in liver homeostasis ☆ , ☆☆ Erawan Borkham-Kamphorst a, ⁎, Eddy van de Leur a , Henning W. Zimmermann b , Karlin Raja Karlmark b , Lidia Tihaa a , Ute Haas a , Frank Tacke b , Thorsten Berger c , Tak W. Mak c , Ralf Weiskirchen a, ⁎ a Institute of Clinical Chemistry and Pathobiochemistry, RWTH Aachen University Hospital, Germany b Department of Medicine III, RWTH Aachen University Hospital, Germany c The Campbell Family Institute for Breast Cancer Research and the Ontario Cancer, Institute, University Health Network, Toronto, ON, Canada abstract article info Article history: Received 16 November 2012 Received in revised form 10 January 2013 Accepted 16 January 2013 Available online 31 January 2013 Keywords: Lipocalin LCN2 NGAL BDL CCl 4 Acute phase response Lipocalin-2 is expressed under pernicious conditions such as intoxication, infection, inflammation and other forms of cellular stress. Experimental liver injury induces rapid and sustained LCN2 production by injured hepa- tocytes. However, the precise biological function of LCN2 in liver is still unknown. In this study, LCN2 -/- mice were exposed to short term application of CCl 4 , lipopolysaccharide and Concanavalin A, or subjected to bile duct ligation. Subsequent injuries were assessed by liver function analysis, qRT-PCR for chemokine and cytokine expression, liver tissue Western blot, histology and TUNEL assay. Serum LCN2 levels from patients suffering from liver disease were assessed and evaluated. Acute CCl 4 intoxication showed increased liver damage in LCN2 -/- mice indicated by higher levels of aminotransferases, and increased expression of inflammatory cytokines and chemokines such as IL-1β, IL-6, TNF-α and MCP-1/CCL2, resulting in sustained activation of STAT1, STAT3 and JNK pathways. Hepatocytes of LCN2 -/- mice showed lipid droplet accumulation and increased apoptosis. Hepatocyte apoptosis was confirmed in the Concanavalin A and lipopolysaccharide models. In chronic models (4 weeks bile duct ligation or 8 weeks CCl 4 application), LCN2 -/- mice showed slightly increased fibrosis compared to controls. Interestingly, serum LCN2 levels in diseased human livers were significantly higher compared to controls, but no differences were observed between cirrhotic and non-cirrhotic pa- tients. Upregulation of LCN2 is a reliable indicator of liver damage and has significant hepato-protective ef- fect in acute liver injury. LCN2 levels provide no correlation to the degree of liver fibrosis but show significant positive correlation to inflammation instead. © 2013 Elsevier B.V. All rights reserved. 1. Introduction Lipocalins are a distinct family of over thirty small soluble secreted proteins involved in the transport of small hydrophobic proteins [1]. Al- though most of these proteins share three conserved motifs, they have a large degree of diversity with limited regions of sequence homology. However, they contain a single characteristic eight-stranded, continu- ously hydrogen-bonded anti-parallel β-barrel [1]. Lipocalin-2 (LCN2) also known as 24p3 protein was first identified in urine taken from mice with SV40-infected kidneys [2]. Neutrophil gelatinase-associated lipocalin (NGAL), the human homologue of LCN2, was subsequently pu- rified from neutrophils and shown to be associated with gelatinase that does not directly affect its enzymatic activity [3]. Rodent forms of this lipocalin are not associated with gelatinase, and most NGAL is exocytosed from neutrophils in a form that is not complexed with gelatinase [3]. Sev- eral functions of LCN2 have been identified, but the precise cellular and extracellular roles are not yet defined. Functions related to cancer have been suggested [4–6], but overall, the role of LCN2 in cell signaling, pro- liferation, and apoptosis is still unclear. Some data suggest a role in in- flammation [7], while other studies point at an important LCN2 role in iron metabolism [8]. A number of inducers of this gene have been found, including serum, lipopolysaccharide (LPS), various growth factors, retinoic acid, glucocorticoids, and phorbol esters [4,9]. Also MK-886, nordihydroguaiaretic acid (NDGA), and several compounds acting as cyclooxygenase-2 inhibitors that induce apoptosis stimu- late LCN2 expression [10,11]. LCN2 may serve as an acute kidney in- jury biomarker [12] and exhibits important beneficial functions in renal damage in experimental ischemia–reperfusion injury [13,14]. It induces iron-dependent responses, possibly via renal epithelial Biochimica et Biophysica Acta 1832 (2013) 660–673 Abbreviations: HRS, hepatorenal syndrome; NGAL/LCN2, lipocalin 2 protein; LPS, lipopolysaccharide; ConA, Concanavalin A; BDL, bile duct ligation; MCP-1/CCL2, mono- cyte chemoattractant protein-1/C–C chemokine ligand-2 ☆ Conflict of interest: None of the authors have something to declare. ☆☆ Financial support: This work was supported by grants from the Deutsche Forschungsgemeinschaft (SFB/TRR57, P13) and the IZKF Aachen of the RWTH Aachen University. ⁎ Corresponding authors at: Institute of Clinical Chemistry and Pathobiochemistry, RWTH-University Hospital, D-52074 Aachen, Germany. Tel.: +49 241 8088683; fax: +49 241 8082512. E-mail addresses: [email protected] (E. Borkham-Kamphorst), [email protected] (R. Weiskirchen). 0925-4439/$ – see front matter © 2013 Elsevier B.V. All rights reserved. http://dx.doi.org/10.1016/j.bbadis.2013.01.014 Contents lists available at SciVerse ScienceDirect Biochimica et Biophysica Acta journal homepage: www.elsevier.com/locate/bbadis

Welcome message from author
This document is posted to help you gain knowledge. Please leave a comment to let me know what you think about it! Share it to your friends and learn new things together.
Transcript

Biochimica et Biophysica Acta 1832 (2013) 660–673
Contents lists available at SciVerse ScienceDirect
Biochimica et Biophysica Acta
j ourna l homepage: www.e lsev ie r .com/ locate /bbad is
Protective effects of lipocalin-2 (LCN2) in acute liver injury suggest anovel function in liver homeostasis☆,☆☆
Erawan Borkham-Kamphorst a,⁎, Eddy van de Leur a, Henning W. Zimmermann b, Karlin Raja Karlmark b,Lidia Tihaa a, Ute Haas a, Frank Tacke b, Thorsten Berger c, Tak W. Mak c, Ralf Weiskirchen a,⁎a Institute of Clinical Chemistry and Pathobiochemistry, RWTH Aachen University Hospital, Germanyb Department of Medicine III, RWTH Aachen University Hospital, Germanyc The Campbell Family Institute for Breast Cancer Research and the Ontario Cancer, Institute, University Health Network, Toronto, ON, Canada
Abbreviations: HRS, hepatorenal syndrome; NGAL/lipopolysaccharide; ConA, Concanavalin A; BDL, bile duccyte chemoattractant protein-1/C–C chemokine ligand-☆ Conflict of interest: None of the authors have som
☆☆ Financial support: This work was supported bForschungsgemeinschaft (SFB/TRR57, P13) and the IZKFUniversity.
⁎ Corresponding authors at: Institute of Clinical CheRWTH-University Hospital, D-52074 Aachen, Germany. Te241 8082512.
E-mail addresses: [email protected] (E. [email protected] (R. Weiskirchen).
0925-4439/$ – see front matter © 2013 Elsevier B.V. Alhttp://dx.doi.org/10.1016/j.bbadis.2013.01.014
a b s t r a c t
a r t i c l e i n f oArticle history:Received 16 November 2012Received in revised form 10 January 2013Accepted 16 January 2013Available online 31 January 2013
Keywords:LipocalinLCN2NGALBDLCCl4Acute phase response
Lipocalin-2 is expressed under pernicious conditions such as intoxication, infection, inflammation and otherforms of cellular stress. Experimental liver injury induces rapid and sustained LCN2 production by injured hepa-tocytes. However, the precise biological function of LCN2 in liver is still unknown. In this study, LCN2−/− micewere exposed to short term application of CCl4, lipopolysaccharide and Concanavalin A, or subjected to bileduct ligation. Subsequent injuries were assessed by liver function analysis, qRT-PCR for chemokine and cytokineexpression, liver tissueWestern blot, histology and TUNEL assay. Serum LCN2 levels from patients suffering fromliver disease were assessed and evaluated. Acute CCl4 intoxication showed increased liver damage in LCN2−/−
mice indicated by higher levels of aminotransferases, and increased expression of inflammatory cytokines andchemokines such as IL-1β, IL-6, TNF-α and MCP-1/CCL2, resulting in sustained activation of STAT1, STAT3 andJNK pathways. Hepatocytes of LCN2−/− mice showed lipid droplet accumulation and increased apoptosis.Hepatocyte apoptosis was confirmed in the Concanavalin A and lipopolysaccharide models. In chronicmodels (4 weeks bile duct ligation or 8 weeks CCl4 application), LCN2−/− mice showed slightly increasedfibrosis compared to controls. Interestingly, serum LCN2 levels in diseased human livers were significantlyhigher compared to controls, but no differences were observed between cirrhotic and non-cirrhotic pa-tients. Upregulation of LCN2 is a reliable indicator of liver damage and has significant hepato-protective ef-fect in acute liver injury. LCN2 levels provide no correlation to the degree of liver fibrosis but showsignificant positive correlation to inflammation instead.
© 2013 Elsevier B.V. All rights reserved.
1. Introduction
Lipocalins are a distinct family of over thirty small soluble secretedproteins involved in the transport of small hydrophobic proteins [1]. Al-thoughmost of these proteins share three conservedmotifs, they have alarge degree of diversity with limited regions of sequence homology.However, they contain a single characteristic eight-stranded, continu-ously hydrogen-bonded anti-parallel β-barrel [1]. Lipocalin-2 (LCN2)also known as 24p3 protein was first identified in urine taken from
LCN2, lipocalin 2 protein; LPS,t ligation; MCP-1/CCL2, mono-2ething to declare.y grants from the DeutscheAachen of the RWTH Aachen
mistry and Pathobiochemistry,l.: +49 241 8088683; fax: +49
rkham-Kamphorst),
l rights reserved.
mice with SV40-infected kidneys [2]. Neutrophil gelatinase-associatedlipocalin (NGAL), the human homologue of LCN2,was subsequently pu-rified from neutrophils and shown to be associated with gelatinase thatdoes not directly affect its enzymatic activity [3]. Rodent forms of thislipocalin are not associatedwith gelatinase, andmostNGAL is exocytosedfromneutrophils in a form that is not complexedwith gelatinase [3]. Sev-eral functions of LCN2 have been identified, but the precise cellular andextracellular roles are not yet defined. Functions related to cancer havebeen suggested [4–6], but overall, the role of LCN2 in cell signaling, pro-liferation, and apoptosis is still unclear. Some data suggest a role in in-flammation [7], while other studies point at an important LCN2 role iniron metabolism [8]. A number of inducers of this gene have beenfound, including serum, lipopolysaccharide (LPS), various growthfactors, retinoic acid, glucocorticoids, and phorbol esters [4,9]. AlsoMK-886, nordihydroguaiaretic acid (NDGA), and several compoundsacting as cyclooxygenase-2 inhibitors that induce apoptosis stimu-late LCN2 expression [10,11]. LCN2 may serve as an acute kidney in-jury biomarker [12] and exhibits important beneficial functions inrenal damage in experimental ischemia–reperfusion injury [13,14].It induces iron-dependent responses, possibly via renal epithelial

661E. Borkham-Kamphorst et al. / Biochimica et Biophysica Acta 1832 (2013) 660–673
delivery of catechol–iron complexes [15]. Hence, LCN2may comprise anendogenous nephron-protective mechanism limiting repeated bouts oftubular insult [16]. In contrast, LCN2 is on the other hand reported to beessential for chronic kidney disease progression in mice and humans[17].
Inmurine liver, LCN2 is markedly induced during experimental sep-sis and supposed to participate in antimicrobial host defenses by bind-ing and scavenging bacterial iron-containing siderophores [18–21].We recently identified that LCN2 is induced during experimental liverinjury [22]. Moreover, immunohistochemistry and cell-based experi-ments revealed that injured hepatocytes are the main source of hepaticLCN2 [22]. Previous findings further suggest that LCN2 is induced inheart, kidney and liver after X-ray exposure most likely by the activityof reactive oxygen species [23].
To further elucidate the causes of LCN2 induction and its function-ing, we here performed a set of experiments in different models of ex-perimental liver injury. LCN2−/− mice were subjected to acute andchronic liver injury by application of CCl4, Concanavalin A (ConA), LPSand ligation of the common bile duct (BDL). Acute single dose CCl4 in-toxication showed more liver damage in LCN2−/− mice indicated bysignificant higher levels of aminotransferases and increased expressionof inflammatory cytokines and chemokines including IL-1β, TNF-αand the monocyte chemoattractant protein-1/C–C chemokine ligand-2(MCP-1/CCL2). Additionally, hepatocytes of LCN2−/− mice showed en-hanced hepatic lipid droplet accumulation and apoptosis. Increased ap-optosis in LCN2 deficient mice was also found after application of ConAor LPS and in livers of animals that were subjected to BDL for five days.During chronic insult, LCN2−/−mice showedmore severe fibrosis com-pared to wild type controls. In humans, patients with chronic liver dis-ease displayed overall higher serum LCN2 levels that were associatedwith impaired renal function.
2. Material and methods
2.1. Primary liver cell isolation and culturing
Hepatocytes were isolated using the collagenase method of Seglenas described previously [24] and cultured on collagen-coated dishesin Hepatozyme-SFM medium (Gibco, Invitrogen, St. Louis, MO).
2.2. RNA isolation, RT-PCR, and qRT-PCR
Total RNA from hepatocytes and liver tissue were isolated throughQIAzol Lysis Reagent containing a monophasic solution of phenol andguanidine thiocyanate, followed by chloroform and isopropanol precip-itation, DNAse digestion and RNeasy clean up with Mini Kits (Qiagen,Hilden, Germany). Amplification primers were selected from se-quences deposited in the GenBank database (Table 1) using the PrimerExpress software (Applied Biosystems Invitrogen,Darmstadt, Germany).
Table 1Primers used in this study.
Gene1 Acc. no. Forward primer Reverse primer
Col αI NM_007742 catgttcagctttgtggacct gcagctgacttcagggatgtα-SMA NM_009606 aatgagcgtttccgttgc atccccgcagactccatacIL-1α NM_010554 ttggttaaatgacctgcaaca gagcgctcacgaacagttgIL-1β NM_008361 gagctgaaagctctccacctc ctttcctttgaggcccaaggcIL-6 NM_031168 gctaccaaactggatataatcagga ccaggtagctatggtactccagaaTNF-α NM_013693 accacgctcttctgtctactga tccacttggtggtttgctacgCCL2 NM_011333 gtgttggctcagccagatgc gacacctgctgctggtgatccCCR2 NM_009915 tcgctgtaggaatgagaagaagagg caaggattcctggaaggtggtcaaIFN-γ NM_008337 ggaggaactggcaaaaggatgg tgttgctgatggcctgattgtcIL-2 NM_008366 gctgttgatggacctacagga ttcaattctgtggcctgcttIL-4 NM_021283 cgtcctcacagcaacgaagaagcac aagagtctctgcagctccatgaIL-10 NM_010548 ggctgaggcgctgtcatcg tcattcatggccttgtagacaccβ-Actin NM_007393 ctctagacttcgagcaggagatgg atgccacaggattccatacccaagarS6 BC092050 cccatgaagcaaggtgttct acaatgcatccacgaacaga
First-strand cDNA was synthesized from 1 μg RNA in 20 μl volumeusing SuperScriptTM II RNAse H reverse transcriptase and randomhexamer primers (Invitrogen). First-strand cDNA derived from 25 ngRNA was subjected to real-time quantitative PCR, using qPCR Core Kits(Eurogentec, Cologne, Germany). PCR conditions were 50 °C for 2 min,95 °C for 10 min and 40 cycles of 95 °C for 15 s and 60 °C for 1 min.All Taqman primers used in this study are given in Table 1. RNA normal-ization was obtained through Taqman Ribosomal RNA Control Reagents(Applied Biosystems) designed for 18S ribosomal RNA (rRNA) detection.
2.3. Patient samples
We included patients with chronic liver diseases of any etiology,who were treated at our hospital as in- or outpatients [25]. Informedconsent was obtained prior to recruitment. A total of n=192 serumspecimens was analyzed encompassing patients without fibrosis, pa-tients with histologically proven fibrosis and individuals that were di-agnosed for cirrhosis based on the conjunction of imaging studies,liver histology, laboratory parameters and the presence of typicalcirrhosis-related sequela [25]. Cirrhotic patients were further strati-fied according to the Child–Turcotte–Pugh-Score [26]. Healthy blooddonors (n=91) from the local blood bank served as controls.
2.4. Animal experiments and specimen collection
All animal protocols were in full compliance with the guidelinesfor animal care approved by the German Animal Care Committee.
a) acute injurymodels: To investigate the effect of LCN2 in acute liver in-jury in mice, we used 6–8 week-old C57BL/6 wild type and LCN2−/−
mice subjected to either (i) a single intraperitoneal injection of0.8 ml/kg body weight CCl4 (in mineral oil) for 48 h or (ii) a sin-gle intravenous injection of 20 mg/kg body weight ConA (Sigma,Taufkirchen, Germany) for 8 or 24 h or the respective tracer controls,as previously described [27], (iii) single dose i.p. of LPS (2.5 mg/kg)for 2 and 6 h respectively and (iv) 5 day-BDL [28,29].
b) chronic injurymodels: For chronic liver injury,we used long term ap-plication of CCl4 for 8 weeks or BDL for 4 weeks.Micewere sacrificed,serum samples analyzed by standard techniques and liver specimenssnap frozen in liquid nitrogen for protein and RNA isolation. Frozentissue section were preserved with Tissue-Tek (Sakura Finetek, TheNetherlands) in ice-cold 2-methylbutane (Roth, Karlsruhe, Germany)andkept at−80 °C, orfixed in 4%buffered paraformaldehyde for his-tological examination.
2.5. Immunohistochemistry
Paraffin-embedded liver tissue sections were treated as described[30]. Non-specific staining was blocked with 50% FCS and 0.3% TritonX-100 in PBS for 30 min at 37 °C followed by incubationwith peroxidase,avidin and biotin. Blots were incubated with primary antibodies at 4 °Covernight followed by incubationwith biotinylated secondary antibodies(BA-9200, Vector Laboratories, Eching, Germany), avidin-conjugatedperoxidase (Vectastain ABC-Elite reagent, Vector Laboratories) and de-veloped using the 3,3′-diaminobenzidine substrate (DAKO, Hamburg,Germany).
2.6. SDS-PAGE and Western blot analysis
Cell and tissue lysates were prepared using RIPA buffer containing20 mM Tris–HCl (pH 7.2), 150 mM NaCl, 2% (w/v) NP-40, 0.1% (w/v)SDS, 0.5% (w/v) sodium deoxycholate and the Complete™-mixture ofproteinase inhibitors (Roche Diagnostics, Mannheim, Germany). Equalamounts of cellular or liver protein extracts were diluted with Nu-PAGE™ LDS electrophoresis sample buffer and DTT as reducing agent, thenheated at 95 °C for 10 min. and separated in 4–12% Bis–Tris gradient
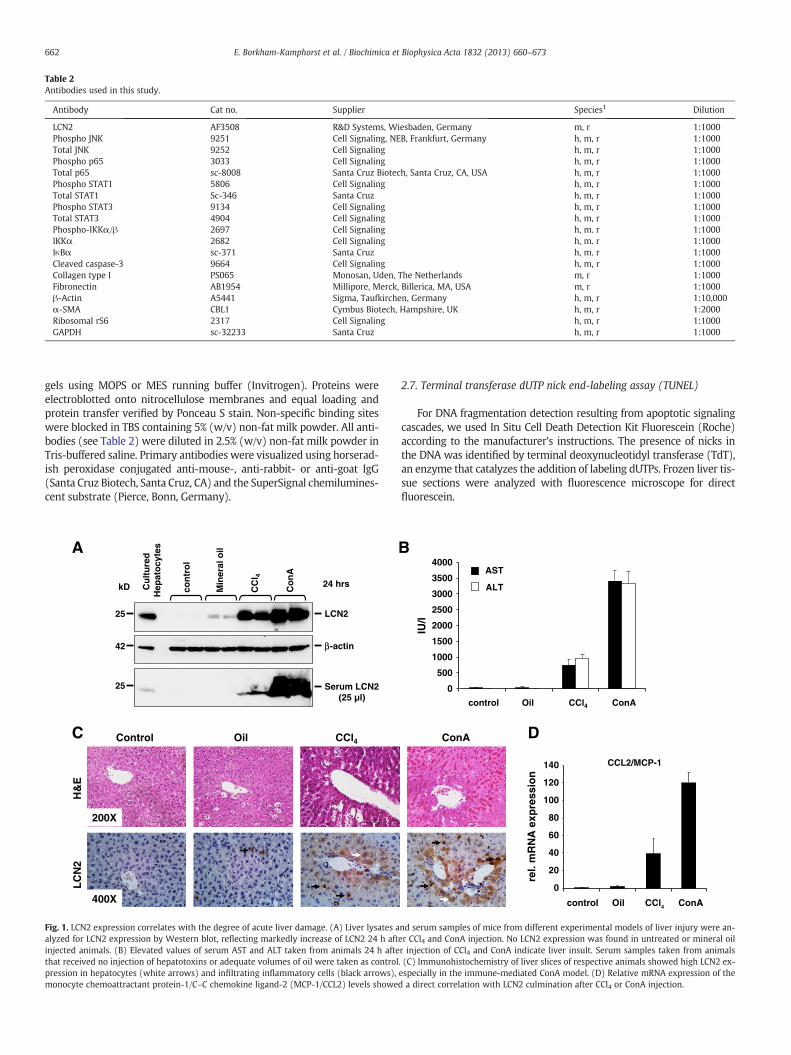
Table 2Antibodies used in this study.
Antibody Cat no. Supplier Species1 Dilution
LCN2 AF3508 R&D Systems, Wiesbaden, Germany m, r 1:1000Phospho JNK 9251 Cell Signaling, NEB, Frankfurt, Germany h, m, r 1:1000Total JNK 9252 Cell Signaling h, m, r 1:1000Phospho p65 3033 Cell Signaling h, m, r 1:1000Total p65 sc-8008 Santa Cruz Biotech, Santa Cruz, CA, USA h, m, r 1:1000Phospho STAT1 5806 Cell Signaling h, m, r 1:1000Total STAT1 Sc-346 Santa Cruz h, m, r 1:1000Phospho STAT3 9134 Cell Signaling h, m, r 1:1000Total STAT3 4904 Cell Signaling h, m, r 1:1000Phospho-IKKα/β 2697 Cell Signaling h, m. r 1:1000IKKα 2682 Cell Signaling h, m. r 1:1000IκBα sc-371 Santa Cruz h, m. r 1:1000Cleaved caspase-3 9664 Cell Signaling h, m, r 1:1000Collagen type I PS065 Monosan, Uden, The Netherlands m, r 1:1000Fibronectin AB1954 Millipore, Merck, Billerica, MA, USA m, r 1:1000β-Actin A5441 Sigma, Taufkirchen, Germany h, m, r 1:10,000α-SMA CBL1 Cymbus Biotech, Hampshire, UK h, m, r 1:2000Ribosomal rS6 2317 Cell Signaling h, m, r 1:1000GAPDH sc-32233 Santa Cruz h, m, r 1:1000
662 E. Borkham-Kamphorst et al. / Biochimica et Biophysica Acta 1832 (2013) 660–673
gels using MOPS or MES running buffer (Invitrogen). Proteins wereelectroblotted onto nitrocellulose membranes and equal loading andprotein transfer verified by Ponceau S stain. Non-specific binding siteswere blocked in TBS containing 5% (w/v) non-fat milk powder. All anti-bodies (see Table 2) were diluted in 2.5% (w/v) non-fat milk powder inTris-buffered saline. Primary antibodies were visualized using horserad-ish peroxidase conjugated anti-mouse-, anti-rabbit- or anti-goat IgG(Santa Cruz Biotech, Santa Cruz, CA) and the SuperSignal chemilumines-cent substrate (Pierce, Bonn, Germany).
Cu
ltu
red
H
epat
ocy
tes
kD con
tro
l
Min
eral
oil
CC
l 4
Co
nA
25
42 -actin
LCN2
24 hrs
25 Serum LCN2(25 µl)
A
C Control Oil CCl4
H&
EL
CN
2
400X
200X
β
Fig. 1. LCN2 expression correlates with the degree of acute liver damage. (A) Liver lysates aalyzed for LCN2 expression by Western blot, reflecting markedly increase of LCN2 24 h aftinjected animals. (B) Elevated values of serum AST and ALT taken from animals 24 h aftethat received no injection of hepatotoxins or adequate volumes of oil were taken as controlpression in hepatocytes (white arrows) and infiltrating inflammatory cells (black arrows),monocyte chemoattractant protein-1/C–C chemokine ligand-2 (MCP-1/CCL2) levels showe
2.7. Terminal transferase dUTP nick end-labeling assay (TUNEL)
For DNA fragmentation detection resulting from apoptotic signalingcascades, we used In Situ Cell Death Detection Kit Fluorescein (Roche)according to the manufacturer's instructions. The presence of nicks inthe DNA was identified by terminal deoxynucleotidyl transferase (TdT),an enzyme that catalyzes the addition of labeling dUTPs. Frozen liver tis-sue sections were analyzed with fluorescence microscope for directfluorescein.
B
0
500
1000
1500
2000
2500
3000
3500
4000
IU/l
control Oil CCl4 ConA
AST
ALT
control Oil CCl4 ConA
CCL2/MCP-1
0
20
40
60
80
100
120
140
rel.
mR
NA
exp
ress
ion
DConA
nd serum samples of mice from different experimental models of liver injury were an-er CCl4 and ConA injection. No LCN2 expression was found in untreated or mineral oilr injection of CCl4 and ConA indicate liver insult. Serum samples taken from animals. (C) Immunohistochemistry of liver slices of respective animals showed high LCN2 ex-especially in the immune-mediated ConA model. (D) Relative mRNA expression of thed a direct correlation with LCN2 culmination after CCl4 or ConA injection.
A
0
2000
4000
6000
8000
10000
WT LCN2-/-
48 h single dose CCl4
IU/l AST
ALT
p=0.0002
p=0.008
B
TU
NE
LD
AP
IM
erg
e
LCN2-/- (48 h 1x CCl4)WT (48 h 1x CCl4)Positive controlNegative controlD
WT
LCN2-/-
WT
LCN2-/-
CH
&E
Oil
Red
C57BL/6
LCN2 knockout
P=0.009 P=0.007
P=0.089 P=0.019
CCL2
0
5
10
15
20
25
30
oil 48h CCl4
Rel
ativ
e m
RN
A
exp
ress
ion
TNF-
0
2
4
6
8
10
12
14
oil 48h CCl4
Rel
ativ
e m
RN
A
exp
ress
ion
IL-1
00.51.01.52.02.53.03.54.04.5
oil 48h CCl4
Rel
ativ
e m
RN
A
exp
ress
ion
IL-10
0
0.5
1
1.5
2
2.5
3
oil 48h CCl4
Rel
ativ
e m
RN
A
exp
ress
ion
β
α
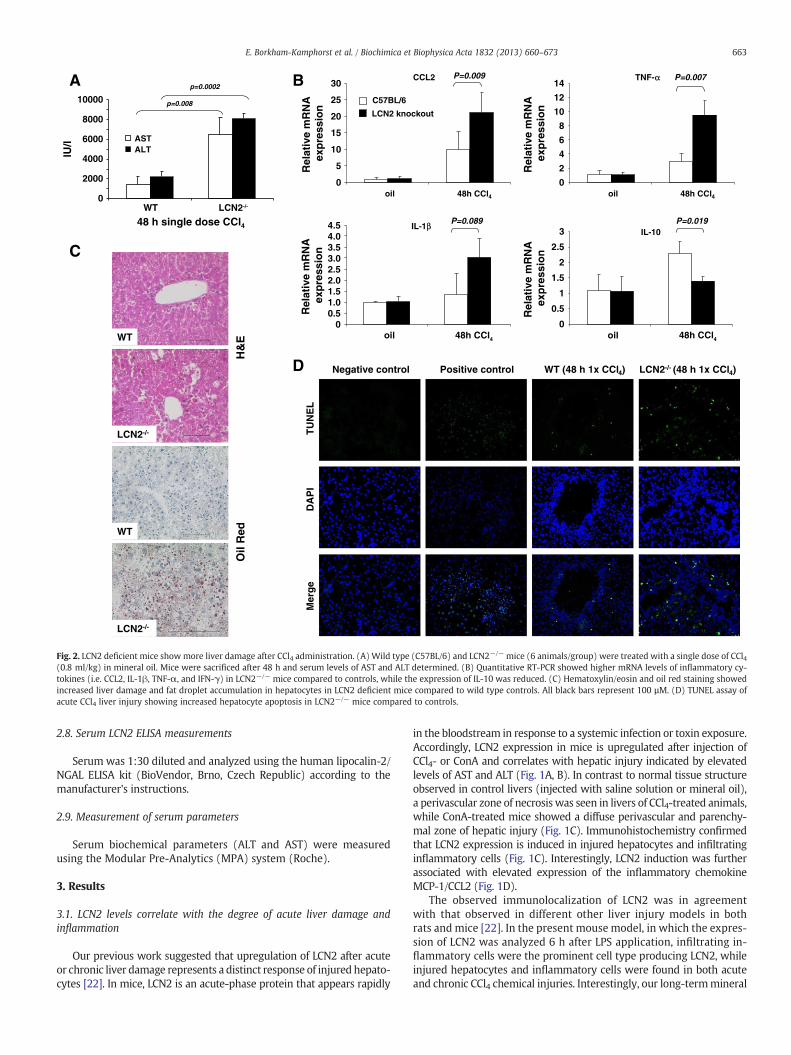
Fig. 2. LCN2 deficient mice showmore liver damage after CCl4 administration. (A) Wild type (C57BL/6) and LCN2−/− mice (6 animals/group) were treated with a single dose of CCl4(0.8 ml/kg) in mineral oil. Mice were sacrificed after 48 h and serum levels of AST and ALT determined. (B) Quantitative RT-PCR showed higher mRNA levels of inflammatory cy-tokines (i.e. CCL2, IL-1β, TNF-α, and IFN-γ) in LCN2−/− mice compared to controls, while the expression of IL-10 was reduced. (C) Hematoxylin/eosin and oil red staining showedincreased liver damage and fat droplet accumulation in hepatocytes in LCN2 deficient mice compared to wild type controls. All black bars represent 100 µM. (D) TUNEL assay ofacute CCl4 liver injury showing increased hepatocyte apoptosis in LCN2−/− mice compared to controls.
663E. Borkham-Kamphorst et al. / Biochimica et Biophysica Acta 1832 (2013) 660–673
2.8. Serum LCN2 ELISA measurements
Serum was 1:30 diluted and analyzed using the human lipocalin-2/NGAL ELISA kit (BioVendor, Brno, Czech Republic) according to themanufacturer's instructions.
2.9. Measurement of serum parameters
Serum biochemical parameters (ALT and AST) were measuredusing the Modular Pre-Analytics (MPA) system (Roche).
3. Results
3.1. LCN2 levels correlate with the degree of acute liver damage andinflammation
Our previous work suggested that upregulation of LCN2 after acuteor chronic liver damage represents a distinct response of injured hepato-cytes [22]. In mice, LCN2 is an acute-phase protein that appears rapidly
in the bloodstream in response to a systemic infection or toxin exposure.Accordingly, LCN2 expression in mice is upregulated after injection ofCCl4- or ConA and correlates with hepatic injury indicated by elevatedlevels of AST and ALT (Fig. 1A, B). In contrast to normal tissue structureobserved in control livers (injected with saline solution or mineral oil),a perivascular zone of necrosis was seen in livers of CCl4-treated animals,while ConA-treated mice showed a diffuse perivascular and parenchy-mal zone of hepatic injury (Fig. 1C). Immunohistochemistry confirmedthat LCN2 expression is induced in injured hepatocytes and infiltratinginflammatory cells (Fig. 1C). Interestingly, LCN2 induction was furtherassociated with elevated expression of the inflammatory chemokineMCP-1/CCL2 (Fig. 1D).
The observed immunolocalization of LCN2 was in agreementwith that observed in different other liver injury models in bothrats and mice [22]. In the present mouse model, in which the expres-sion of LCN2 was analyzed 6 h after LPS application, infiltrating in-flammatory cells were the prominent cell type producing LCN2, whileinjured hepatocytes and inflammatory cells were found in both acuteand chronic CCl4 chemical injuries. Interestingly, our long-termmineral

A
Cont
LCN2-/-WT
pSTAT3
STAT1
STAT3
pSTAT1
LCN2
84918491
kD
25
80
80
GAPDH35
pJNK
JNK
5446
5446
ConA Cont ConA
B
WT WT / Con A LCN2-/- LCN2-/- / Con AC
DH&E
TUNEL
DAPI
CD11b+ F4/80+ (liver)
% o
f C
D45
+ ce
lls
05
1015202530
control 8 h Con A
p=0.04
*WT
LCN2-/-
p=0.003
p=0.005
p=0.020
p=0.0002
p=0.035
p=0.049 p=0.003
p=0.994
WT LCN2-/- WT LCN2-/-
01020304050607080
NSS ConA NSS ConA
IL-6TNF-
020406080
100120140160180200
NSS ConA NSS ConA
IFN-IL-2
02468
10121416
NSS ConA NSS ConA
IL-4IL-10
0
2
4
6
8
10
12
NSS ConA NSS ConA
IL-1IL-1
rel.
mR
NA
ex
pre
ssio
nre
l. m
RN
A
exp
ress
ion
WT LCN2-/- WT LCN2-/-
rel.
mR
NA
ex
pre
ssio
nre
l. m
RN
A e
xpre
ssio
nααβ
γ
Fig. 3. LCN2−/− mice exhibit more injury in T-cell mediated ConA model of experimental liver injury. (A) qRT-PCR of liver RNA reflecting increased expression of thepro-inflammatory cytokines IL-6 and TNF-α (upper left panel), IL-1α and IL-1β (upper right panel) in LCN2−/− mice compared to the wild type controls. In addition, the Th1/Th2cytokines IFN-γ and IL-2 (lower left panel) and IL-4 (lower right panel) also increased, while IL-10 (lower right panel) acting as an anti-inflammatory cytokine remained unchanged.(B) Western blot analysis confirmed the activation of respective signaling pathway during liver insult as shown by phosphorylation/activation of STAT1, STAT3 and JNK. (C) H&Estaining and TUNEL assay of liver tissue showed that ConA increases liver damage and hepatocyte apoptosis in LCN2−/− animals. Black bars represent 100 µM. (D) FACS analysis ofliver leukocyte isolates after ConA challenge showed higher levels of macrophages (CD11b+ F4/80+) in LCN2-deficient mice.
664 E. Borkham-Kamphorst et al. / Biochimica et Biophysica Acta 1832 (2013) 660–673
oil i.p. injection control group showed diffused Kupffer cells andhepatic macrophages as the main source of LCN2 production. Fur-thermore, the BDL models showed a lesser degree of inflammationcompared to the LPS- and CCl4 models. Proliferative bile duct epi-thelia, hepatocytes and infiltrating inflammatory cells stained pos-itive for LCN2 (Suppl. Fig. 1).
3.2. LCN2−/− mice are more susceptible to acute CCl4-induced liverinjury
Eight week-old C57BL/6 wild type and LCN2−/− mice (6 animals/group) were subjected to a single intraperitoneal injection of CCl4(0.8 ml/kg body weight) for 48 h. The serum transaminases AST and
ALT were significantly higher in LCN2−/− mice (Fig. 2A). Moreover, in-flammatory cytokines and chemokines were expressed at higher levelsin LCN2−/− livers (Fig. 2B). Likewise, α-SMA mRNA indicating activa-tion of hepatic stellate cells was higher expressed in livers of respectiveanimals (data not shown). Liver histology showed more inflammatorycell infiltration and fat content in LCN2−/− mice (Fig. 2C). Additionally,TUNEL assay showed more apoptotic hepatocytes around central veins(Fig. 2D).
3.3. LCN2−/− mice are more susceptible to T-cell mediated hepatitis
LCN2 is an acute phase protein in mice and as such part of the in-nate immune response. Upon induction of immune-mediated acute

A
B
Cont
LCN2-/-WT
pSTAT3
STAT1
STAT3
pSTAT1
LCN2
-actin
84918491
kD
42
25
80
80
2 h
GAPDH35
6 h
LPS Cont
2 h 6 h
LPS
C
p=0.274 p=0.070
AST
0
50
100
150
200
250
WT LCN2-/-
IU/l
6h NSS6h LPS
ALT
020406080
100120140160
IU/l
WT LCN2-/-
0
100
200
300
400
500
600
700
800
NSS 2 h LPS 6 h LPS0
50
100
150
200
250
300
350
400
450
500
NSS 2 h LPS 6 h LPS
0
20
40
60
80
100
120
140
160
NSS 2 h LPS 6 h LPS0
100
200
300
400
500
600
700
800
NSS 2 h LPS 6 h LPS
IL-6
TN
F-α
IL-1
β
MC
P-1
/CC
L2
rel.
mR
NA
exp
ress
ion
rel.
mR
NA
exp
ress
ion
rel.
mR
NA
exp
ress
ion
rel.
mR
NA
exp
ress
ion
6h NSS6h LPS
WTLCN2-/-
WTLCN2-/-
WTLCN2-/-
WTLCN2-/-
p=0.034
p=0.810 p=0.863
p=0.001
p=0.812
p=0.001
p=0.569
p=0.004
β
Fig. 4. LCN2−/− mice are prone to more liver damage after LPS injection. (A) Serum AST and ALT were measured in wild type and LCN2 deficient mice at 2 h (left panel) and 6 h(right panel) after i.p. injection of a single dose LPS (2.5 mg/kg). (B) qRT-PCR showing increased expression of pro-inflammatory cytokines IL-6, TNF-α, IL-1β and MCP-1/CCL2 inLCN2−/− livers compared to controls. (C) Western blot analysis showing sustained phosphorylation of STAT1 and STAT3 in LCN2−/− livers. GAPDH and β-actin served as loadingcontrols.
665E. Borkham-Kamphorst et al. / Biochimica et Biophysica Acta 1832 (2013) 660–673
hepatitis by ConA, LCN2−/− mice exhibited more severe liver dam-age than their wild-type counterparts that was associated with in-creased expression levels of pro-inflammatory cytokines including
IL-6, TNF-α, IL-1α, IL-1β, IFN-γ, IL-2, and IL-4 while the expressionof IL-10 was unaffected (Fig. 3A). In line with the activation of sever-al inflammatory cytokines after ConA challenge, we found strong
TUNEL DAPI Merge
LCN2-/- 5d BDL
WT 5d BDL
5d Sham 5d BDL 5d Sham 5d BDL
H&E
WT LCN2-/-A
C
B AST
0
100
200
300
400
500
600
WT LCN2-/-
IU/l
5d Sham5d BDL
ALT
050
100150200250300350400450
WT LCN2-/-
IU/l
5d Sham5d BDL
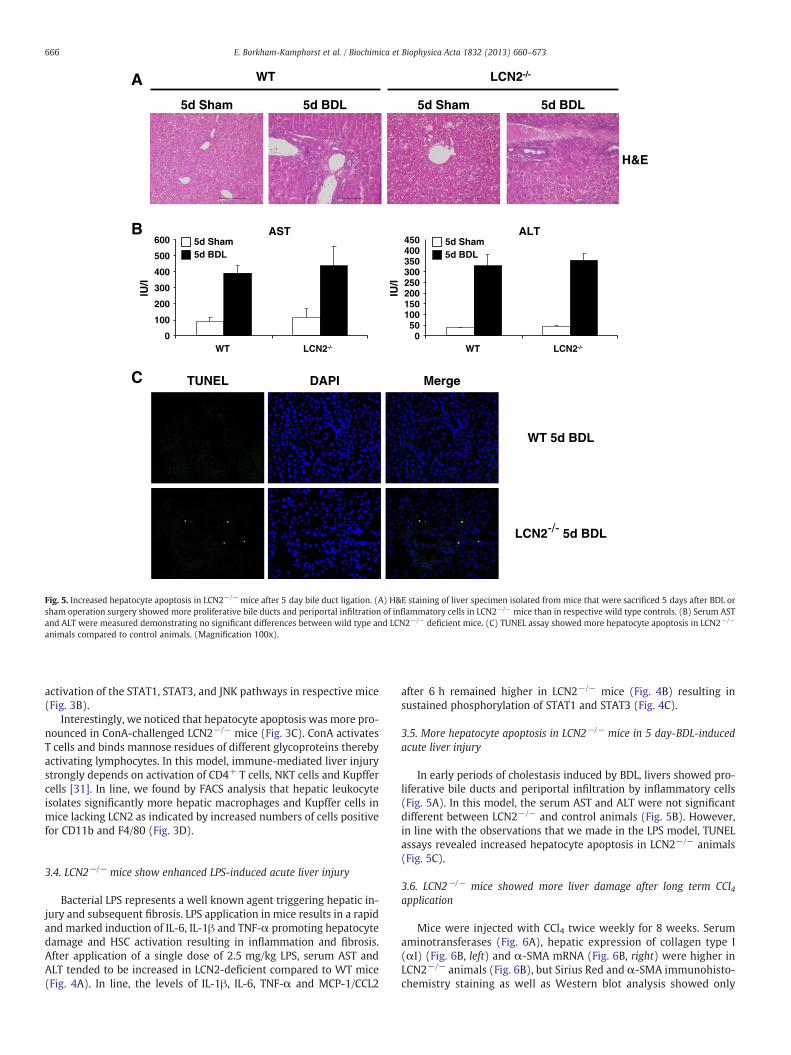
Fig. 5. Increased hepatocyte apoptosis in LCN2−/− mice after 5 day bile duct ligation. (A) H&E staining of liver specimen isolated from mice that were sacrificed 5 days after BDL orsham operation surgery showed more proliferative bile ducts and periportal infiltration of inflammatory cells in LCN2−/− mice than in respective wild type controls. (B) Serum ASTand ALT were measured demonstrating no significant differences between wild type and LCN2−/− deficient mice. (C) TUNEL assay showed more hepatocyte apoptosis in LCN2−/−
animals compared to control animals. (Magnification 100x).
666 E. Borkham-Kamphorst et al. / Biochimica et Biophysica Acta 1832 (2013) 660–673
activation of the STAT1, STAT3, and JNK pathways in respective mice(Fig. 3B).
Interestingly, we noticed that hepatocyte apoptosis was more pro-nounced in ConA-challenged LCN2−/− mice (Fig. 3C). ConA activatesT cells and binds mannose residues of different glycoproteins therebyactivating lymphocytes. In this model, immune-mediated liver injurystrongly depends on activation of CD4+ T cells, NKT cells and Kupffercells [31]. In line, we found by FACS analysis that hepatic leukocyteisolates significantly more hepatic macrophages and Kupffer cells inmice lacking LCN2 as indicated by increased numbers of cells positivefor CD11b and F4/80 (Fig. 3D).
3.4. LCN2−/− mice show enhanced LPS-induced acute liver injury
Bacterial LPS represents a well known agent triggering hepatic in-jury and subsequent fibrosis. LPS application in mice results in a rapidand marked induction of IL-6, IL-1β and TNF-α promoting hepatocytedamage and HSC activation resulting in inflammation and fibrosis.After application of a single dose of 2.5 mg/kg LPS, serum AST andALT tended to be increased in LCN2-deficient compared to WT mice(Fig. 4A). In line, the levels of IL-1β, IL-6, TNF-α and MCP-1/CCL2
after 6 h remained higher in LCN2−/− mice (Fig. 4B) resulting insustained phosphorylation of STAT1 and STAT3 (Fig. 4C).
3.5. More hepatocyte apoptosis in LCN2−/− mice in 5 day-BDL-inducedacute liver injury
In early periods of cholestasis induced by BDL, livers showed pro-liferative bile ducts and periportal infiltration by inflammatory cells(Fig. 5A). In this model, the serum AST and ALT were not significantdifferent between LCN2−/− and control animals (Fig. 5B). However,in line with the observations that we made in the LPS model, TUNELassays revealed increased hepatocyte apoptosis in LCN2−/− animals(Fig. 5C).
3.6. LCN2−/− mice showed more liver damage after long term CCl4application
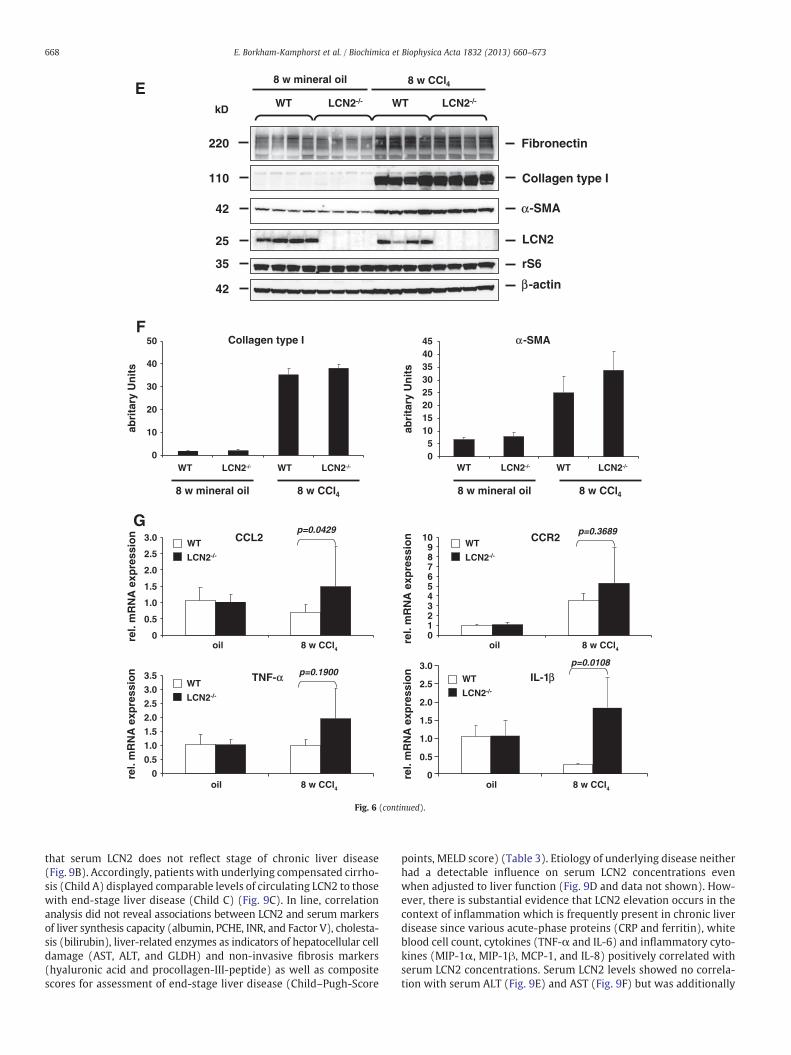
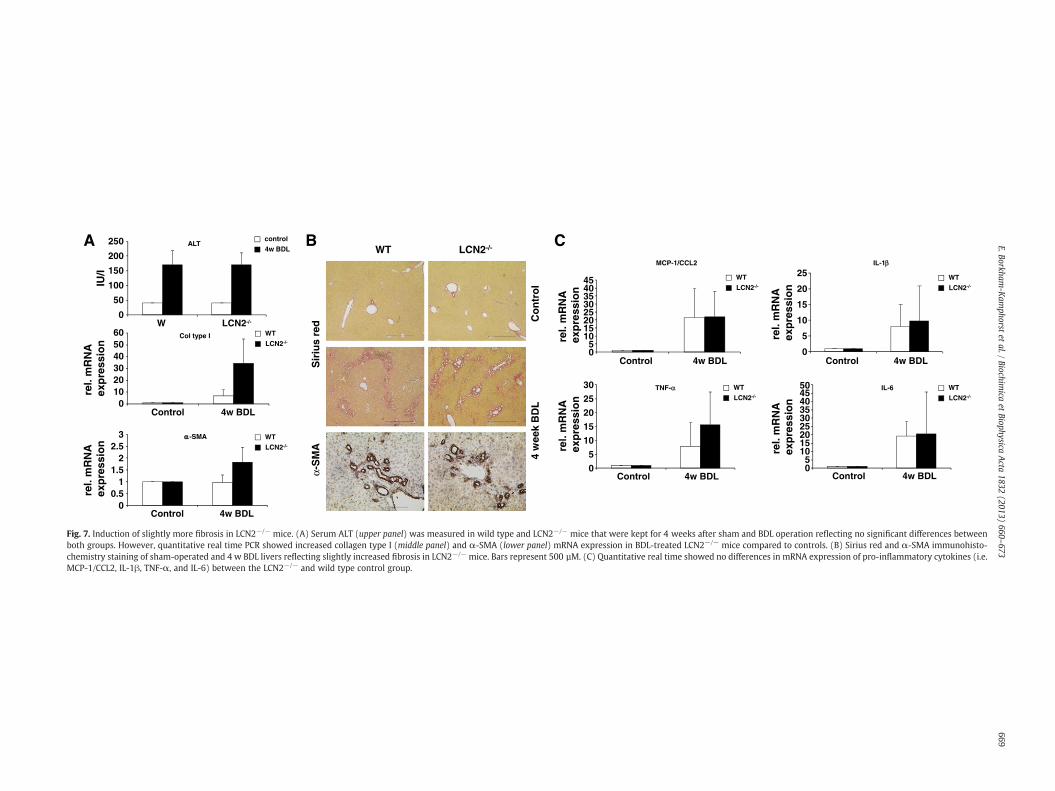
Mice were injected with CCl4 twice weekly for 8 weeks. Serumaminotransferases (Fig. 6A), hepatic expression of collagen type I(αI) (Fig. 6B, left) and α-SMA mRNA (Fig. 6B, right) were higher inLCN2−/− animals (Fig. 6B), but Sirius Red and α-SMA immunohisto-chemistry staining as well as Western blot analysis showed only

667E. Borkham-Kamphorst et al. / Biochimica et Biophysica Acta 1832 (2013) 660–673
slightly differences in both groups (Fig. 6C–F). However, the levelsof several inflammatory cytokines in LCN2−/− mice after treatmentwith CCl4 were significantly higher than in WT controls (Fig. 6G). Asimilar phenomenon was observed when animals were comparedafter setting BDL for 4 weeks (Fig. 7). Surprisingly, long-term i.p. ap-plication of mineral oil did induce sterile peritoneal inflammationand granuloma without liver fibrosis, but also showed significantupregulation of LCN2 in WT mice. Immunohistochemistry of LCN2confirmed the production of LCN2 in residential (i.e. Kupffer cells)and infiltrating inflammatory cells (i.e. macrophages) in livers of ani-mals that were subjected to application of mineral oil for eight weeks(Suppl. Fig. 1).
3.7. Sustained NFκB activation in LCN2−/− hepatocytes
Since hepatic LCN2 production is induced by IL-1β through NFκB ac-tivation [22], we next examinedNFκB signaling in LCN2−/− hepatocytes.Therefore, primary cultured hepatocytes were stimulated with IL-1β,IL-6, TNF-α, as well as a combination of IL-1β and IL-6 in Hepatozymefor 30 min and 24 h. Protein cell extracts were prepared and analyzedby Western blot for NFκB signaling components (Fig. 8). Both TNF-αand IL-1β did activate canonical NFκB signaling pathway, evidenced by
A
Oil CCl4C D
B
p=0.0569
AST
0200400600800
100012001400160018002000
WT LCN2-/-
IU/l
rel.
mR
NA
exp
ress
ion Collagen type I
0
10
20
30
40
50
60
oil CCl4
WT
LC
N2
-/-
8 wk oil
8 wk CCl4
WT
LCN2-/-
Fig. 6. LCN2−/− mice showed more liver pathology after long term application of CCl4. (A) Mand serum AST (left panel) and ALT (right panel) measured. (B) qRT-PCR showing increasedLCN2−/− mice compared to wild type controls. (C, D) Liver specimen were stained with (C)protein lysates were analyzed for expression of fibrotic marker proteins (i.e. fibronectin, coEach lane represents one individual mouse. Please note that LCN2 expression in liver was up(left) and α-SMA (right) obtained in Western blot analysis (E) were quantified densitometrivealed that CCL2, CCR2, IL-1β, and TNF-α show increased levels in livers of LCN2−/− mice.
phosphorylation of IKKα/β, subsequently induced IκBα degradation,and p65 phosphorylation at 30 min. Although we noticed a slight lesserdegree of IKKα/β phosphorylation in hepatocytes isolated from LCN2−/−
mice, we found no differences in pp65. The 24 h incubation, however,showed sustained p65 phosphorylation in LCN2−/− hepatocytes. Con-trary to IL-1β, TNF-α did activate NFκB signaling but failed to induceLCN2 production. Moreover, in LCN2−/− hepatocytes, the stimulationwith TNF-α resulted in hepatocyte apoptosis as evidenced by elevatedlevels of cleaved caspase-3.
3.8. Serum levels of LCN2 in chronic human liver disease
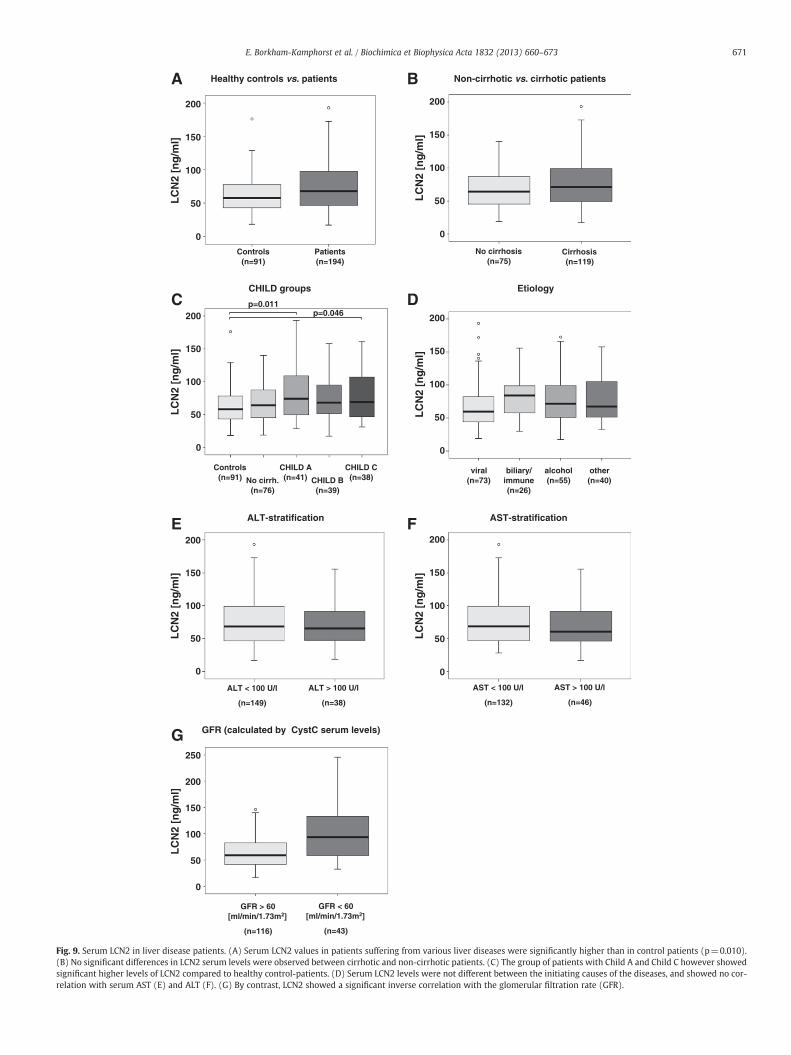
In order to elucidate whether LCN2 is also regulated in humanliver disease, we assessed LCN2 serum levels in 192 patients withchronic liver diseases of variable etiology and clinical severity in com-parison to 91 healthy controls. LCN2 was readily detectable by ELISAin all samples. Patients with chronic liver disease exhibited significantlyhigher concentrations compared to the healthy control cohort (median67.45 ng/mL [range 17.3–401.9] vs. 57.9 ng/mL [range 18.3–176.3];p=0.0127) (Fig. 9A). Evaluating its usefulness to discriminate betweendifferent stages of chronic liver disease, we failed to detect significantlyvarying levels of LCN2 in non-cirrhotic vs. cirrhotic patients indicating
WT
LC
N2
-/-
Oil CCl4
p=0.0205
ALT
0
500
1000
1500
2000
2500
WT LCN2-/-
IU/l
-SMA
0
10
20
30
40
50
oil CCl4
re.l.
mR
NA
exp
ress
ion
8 wk oil
8 wk CCl4
WT
LCN2-/-
*
α
ice were treated for 8 weeks with CCl4 twice weekly while mineral oil served as controlcollagen type I (left panel) and α-SMA (right panel) mRNA expression in CCl4-treatedSirius Red or analyzed for (D) α-SMA expression in immunohistochemistry. (E) Liverllagen type I, and α-SMA) in Western blot. rS6 and β-actin served as loading controls.regulated after injection of both mineral oil and CCl4. (F) The amounts of collagen type Ically. (G) qRT-PCR of pro-inflammatory cytokines after 8 week treatment with CCl4 re-
-SMA
Collagen type I
rS6
LCN2
-actin
Fibronectin
WT WTLCN2-/- LCN2-/-
8 w mineral oil 8 w CCl4
220
110
42
25
35
42
kD
E
8 w mineral oil 8 w CCl4
F
CCL2
rel.
mR
NA
exp
ress
ion CCR2
Collagen type I
WT LCN2-/- WT LCN2-/-
abri
tary
Un
its
-SMA
05
1015202530354045
WT LCN2-/- WT LCN2-/-
abri
tary
Un
its
oil 8 w CCl4
0
0.5
1.0
1.5
2.0
2.5
3.0
0123456789
10
oil 8 w CCl4
TNF- IL-1
0
0.5
1.0
1.5
2.0
2.5
3.0
3.5
oil 8 w CCl4
0
0.5
1.0
1.5
2.0
2.5
3.0
oil 8 w CCl4
8 w mineral oil 8 w CCl4
G
rel.
mR
NA
exp
ress
ion
rel.
mR
NA
exp
ress
ion
rel.
mR
NA
exp
ress
ion
WT
LCN2-/-
WT
LCN2-/-
WT
LCN2-/-
WT
LCN2-/-
p=0.0429 p=0.3689
p=0.0108p=0.1900
0
10
20
30
40
50
α
α
α
β
β
Fig. 6 (continued).
668 E. Borkham-Kamphorst et al. / Biochimica et Biophysica Acta 1832 (2013) 660–673
that serum LCN2 does not reflect stage of chronic liver disease(Fig. 9B). Accordingly, patients with underlying compensated cirrho-sis (Child A) displayed comparable levels of circulating LCN2 to thosewith end-stage liver disease (Child C) (Fig. 9C). In line, correlationanalysis did not reveal associations between LCN2 and serum markersof liver synthesis capacity (albumin, PCHE, INR, and Factor V), cholesta-sis (bilirubin), liver-related enzymes as indicators of hepatocellular celldamage (AST, ALT, and GLDH) and non-invasive fibrosis markers(hyaluronic acid and procollagen-III-peptide) as well as compositescores for assessment of end-stage liver disease (Child–Pugh-Score
points, MELD score) (Table 3). Etiology of underlying disease neitherhad a detectable influence on serum LCN2 concentrations evenwhen adjusted to liver function (Fig. 9D and data not shown). How-ever, there is substantial evidence that LCN2 elevation occurs in thecontext of inflammation which is frequently present in chronic liverdisease since various acute-phase proteins (CRP and ferritin), whiteblood cell count, cytokines (TNF-α and IL-6) and inflammatory cyto-kines (MIP-1α, MIP-1β, MCP-1, and IL-8) positively correlated withserum LCN2 concentrations. Serum LCN2 levels showed no correla-tion with serum ALT (Fig. 9E) and AST (Fig. 9F) but was additionally
WT LCN2-/-
4 w
eek
BD
L C
on
tro
l
α-S
MA
Sir
ius
red
Col type I
0102030405060
Control 4w BDL
rel.
mR
NA
ex
pre
ssio
n
-SMA
00.5
11.5
22.5
3
Control 4w BDL
rel.
mR
NA
exp
ress
ion
ALT
0
50
100
150
200
250
W LCN2-/-
IU/l
control
4w BDLA B
WT
LCN2-/-
WT
LCN2-/-
MCP-1/CCL2
05
1015202530354045
IL-1
0
5
10
15
20
25
TNF-
0
5
10
15
20
25
30 IL-6
05
101520253035404550
C
WT
LCN2-/-
rel.
mR
NA
exp
ress
ion
rel.
mR
NA
exp
ress
ion
rel.
mR
NA
ex
pre
ssio
nre
l. m
RN
A
exp
ress
ion
Control 4w BDL Control 4w BDL
Control 4w BDL Control 4w BDL
WT
LCN2-/-
WT
LCN2-/-
WT
LCN2-/-
αα
α
β
Fig. 7. Induction of slightly more fibrosis in LCN2−/− mice. (A) Serum ALT (upper panel) was measured in wild type and LCN2−/− mice that were kept for 4 weeks after sham and BDL operation reflecting no significant differences betweenboth groups. However, quantitative real time PCR showed increased collagen type I (middle panel) and α-SMA (lower panel) mRNA expression in BDL-treated LCN2−/− mice compared to controls. (B) Sirius red and α-SMA immunohisto-chemistry staining of sham-operated and 4 w BDL livers reflecting slightly increased fibrosis in LCN2−/− mice. Bars represent 500 µM. (C) Quantitative real time showed no differences in mRNA expression of pro-inflammatory cytokines (i.e.MCP-1/CCL2, IL-1β, TNF-α, and IL-6) between the LCN2−/− and wild type control group.
669E.Borkham
-Kam
phorstet
al./Biochim
icaet
BiophysicaActa
1832(2013)
660–673

30 min
con
tro
l
IL-1
(2.5
ng
/ml)
IL-6
(20
ng
/ml)
IL-1
β β ββ
+ IL
-6
TN
F-
(20
ng
/ml)
p65
pp65
pIKK /
LCN2
IKK
I B
-actin
kD
85
85
40
65
65
25
42
con
tro
l
IL- 1
(2.5
ng
/ml)
IL-6
(20
ng
/ml)
IL-1
β
β
β
β
β
+ IL
-6
TN
F-
(20
ng
/ml)
WT LCN2-/-
24 h
con
tro
l
IL-1
(2.5
ng
/ml)
IL-6
(20
ng
/ml)
IL-1
β ββ
+ IL
-6
TN
F-
(20
ng
/ml)
p65
pp65
LCN2
I B
-actin
kD
40
65
65
25
42
con
tro
l
IL- 1
(2.5
ng
/ml)
IL-6
(20
ng
/ml)
IL-1
β+
IL- 6
TN
F-
(20n
g/m
l)
WT LCN2-/-
Cleaved caspase-317
pIKK /
IKK
85
85
A
B
α
α
α
α
α
α
α
αα α
κ
κ
Fig. 8. Sustained NFκB activation in LCN2−/− hepatocytes. Primary hepatocytes from wild type and LCN2-deficient mice were stimulated with IL-1β, IL-6, TNF-α, and IL-1β/IL-6 for30 min (A) and 24 h (B) or left unstimulated (control). Protein extracts were prepared and analyzed for signaling components of the canonical NFκB signaling pathway by Westernblot.
670 E. Borkham-Kamphorst et al. / Biochimica et Biophysica Acta 1832 (2013) 660–673
related to impaired renal function in patients with chronic liver dis-ease given the close correlations to urea and glomerular filtrationrate (GFR) as calculated by cystatin Cmeasurements and the significantLCN2 increase in patients with a GFR below 60 ml/min/1.73 m2
(Table 3 and Fig. 9G). Selecting patients with a creatinine value below1.5 mg/dL LCN2 turned out to be a useful marker to detect patientswith a cystatin-C-based GFR under 50 ml/min/1.73 m2 in a ROC-curveanalysis (AUC 0.652, p=0.015).
4. Discussion
LCN2 is an acute phase protein in mice. We here examined LCN2 ex-pression in different acute liver injury models within the first 24 h andfound that LCN2 increases after application of CCl4, ConA and LPS. Inter-estingly, the levels of hepatic and serum LCN2 correlated well withserum AST and ALT confirming a previous finding that human serumLCN2 correlates significantly with AST, ALT, cholesterol, creatinine andC-reactive protein [32]. Additionally, the LCN2 levels in our analysis alsocorresponded to CCL2 mRNA representing a marker of inflammation.
Serum and urinary LCN2 are now accepted as a sensitivity markerin early stage of acute kidney injury that is independent of serumcreatinine [33,16]. The specific function of LCN2 in kidney injury, as anephroprotective- or a profibrogenic factor is still under debate [14,15].
In liver, the precise function of LCN2 is still enigmatic. We here usedLCN2−/− mice to explore the functional roles of LCN2 in different
experimental liver injury models. Targeted disruption of the murineLCN2 gene is compatible with normal organogenesis and develop-ment to adulthood [20]. In line, we found no differences in liverfunction tests in healthy animals compared to wild type controls. How-ever, during the challengewith acute toxic chemicals or the generation ofmechanical induced cholestasis, LCN2−/− mice showed significantlymore liver damage as evidenced by increased AST and ALT after applica-tion of CCl4, ConA and LPS, while the BDL surgery in short-term revealedno differences in both groups. This suggests that rapid LCN2 inductionprotects hepatocytes from direct toxic injury. In contrast, hepatocyte in-jury resulting from the BDL surgery is more gradual during the progres-sion of cholestasis and LCN2 is produced mainly from proliferative bileduct epithelia.
Additionally, the chemically-induced injury exhibited more in-flammatory responses compared to the mechanically induced BDLas evidenced by more infiltrating inflammatory cells as evidencedby immunohistochemistry (Suppl. Fig. 1) and upregulation of thepro-inflammatory cytokines IL-1β, IL-6, TNF-α and IFN-γ. The LCN2−/−
mice expressed higher levels of the respective cytokines, including theMCP-1/CCL2 chemokine, while the anti-inflammatory cytokine IL-10 ac-tually decreased or remained unchanged.
In the ConA and LPS models, IFN-γ is the major cytokine responsi-ble for STAT1 activation. STAT1 not only plays a key role in antiviraldefense during hepatitis virus infection but also contributes to liverinflammation and injury and suppression of liver regeneration. We
LC
N2
[ng
/ml]
Healthy controls vs. patients
Controls (n=91)
Patients (n=194)
0
50
100
150
200
Non-cirrhotic vs. cirrhotic patients
LC
N2
[ng
/ml]
No cirrhosis (n=75)
Cirrhosis (n=119)
0
50
100
150
200
CHILD groups
LC
N2
[ng
/ml]
Controls (n=91)
CHILD A (n=41)No cirrh.
(n=76)CHILD B
(n=39)
CHILD C (n=38)
p=0.011p=0.046
0
50
100
150
200
LC
N2
[ng
/ml]
Etiology
viral (n=73)
biliary/ immune (n=26)
alcohol (n=55)
other (n=40)
0
50
100
150
200
ALT-stratification
LC
N2
[ng
/ml]
ALT < 100 U/l
(n=149)
ALT > 100 U/l
(n=38)
0
50
100
150
200
AST-stratification
LC
N2
[ng
/ml]
AST < 100 U/l
(n=132)
AST > 100 U/l
(n=46)
0
50
100
150
200
GFR (calculated by CystC serum levels)
LC
N2
[ng
/ml]
GFR > 60 [ml/min/1.73m2]
(n=116)
GFR < 60 [ml/min/1.73m2]
(n=43)
0
50
100
150
200
250
A B
C D
E F
G
Fig. 9. Serum LCN2 in liver disease patients. (A) Serum LCN2 values in patients suffering from various liver diseases were significantly higher than in control patients (p=0.010).(B) No significant differences in LCN2 serum levels were observed between cirrhotic and non-cirrhotic patients. (C) The group of patients with Child A and Child C however showedsignificant higher levels of LCN2 compared to healthy control-patients. (D) Serum LCN2 levels were not different between the initiating causes of the diseases, and showed no cor-relation with serum AST (E) and ALT (F). (G) By contrast, LCN2 showed a significant inverse correlation with the glomerular filtration rate (GFR).
671E. Borkham-Kamphorst et al. / Biochimica et Biophysica Acta 1832 (2013) 660–673

Table 3LCN2 correlation analysis [patients only].
Parameter Correlation coefficient r p-value
MIP-1α .232 .006MIG .212 .016MCP-1 .221 .012IP-10 .199 .030IL-8 .225 .002IL-6 .267 .001Urea .388 b .001Cystatin C .274 b .001GFR [Cystatin C] − .274 b .001Uric acid .207 .007CRP .244 .001PCT .266 .001WBC .430 b .001Lymphocytes [rel. count] − .390 b .001IL-10 .212 .007TNF-α .187 .019Monocytes [rel. PBMC] .221 .003
672 E. Borkham-Kamphorst et al. / Biochimica et Biophysica Acta 1832 (2013) 660–673
found STAT1 phosphorylation in both LCN2−/− and wild type mice,but STAT1 showed sustained activation in LCN2−/−mice after LPS chal-lenge, possibly being causative for more severe liver damage that wenoticed in our analysis.
STAT3 is activated by a wide variety of cytokines (e.g. IL-6) andviral proteins and plays a key role in acute phase response, promotionof regeneration, glucose homeostasis, and hepatic lipid metabolismand protects against liver injury by suppression of IFN-γ signaling[34,35]. Since IL-6 is also one of the cytokines inducing LCN2 expres-sion in cultured hepatocytes [22], LCN2 might be involved in the me-diation of hepatoprotective effects downstream of IL-6 and STAT3.
TNF-α and IL-1β are mainly released from activated Kupffer cells orinfiltratingneutrophils andmacrophages. Both elicit defensive responsesin parenchymal cells, including activation of apoptosis but when thesedefensive responses are overwhelming, cells may die by necrosis andthereby stimulate even more inflammatory responses. Following toxicchemical injury, LCN2−/− mice expressed higher levels of these cyto-kines, culminating in more severe liver damage. TNF-α induces specificsignaling pathways in hepatocytes that lead to activation of either pro-survival mediators or effectors of cell death. Whereas activation of tran-scription factor NFκB promotes cell survival, c-Jun N-terminal ki-nases (JNK) and caspases are strategic effectors of cell death in theTNF-α-mediated signaling pathway.
Notably, stimulation with TNF-α and IL-1β induced prolonged NFκBactivation in LCN2−/− hepatocytes (Fig. 8B). This phenomenon mightbe due to the lack of NFκB negative feedback loops from LCN2 since ourprevious work showed that NFκB is necessary for LCN2 production [22].Additionally, the persistence of NFκB activation may explain the higherdegree of inflammation that we observed in LCN2−/− mice upon liverinjuries.
In order to confirm whether LCN2 levels are also modulated in pa-tients with human liver disease, we assessed LCN2 serum concentrationsin a large,well-characterized patient cohort. To our knowledge, this is thefirst systematic analysis of circulating LCN2 in chronic liver disease pa-tients. Though therewas an increase of LCN2 levels in patients comparedto the non-diseased, LCN2 levels did not vary within the different stagesof liver disease, ranging fromnon-fibrosis to decompensated liver cirrho-sis. These findingsmight reflect the results of a recent in vitro study fromour group indicating that the pro-inflammatory cytokine IL-1β but notthe pro-fibrotic mediators PDGF and TGF-β induce LCN2 production inhepatocytes [22].
In support, LCN2 levels correlated with polymorphonuclear cellcount, a multitude of parameters indicating acute phase responsesand immune cell activation, which corroborates with findings fromprevious works, that could demonstrate a close link of LCN2 serumlevels to sterile and non-sterile inflammatory disease patterns [36–38].This phenomenon was further observed in our long-term i.p. mineral
oil-induced sterile peritoneal inflammation in WT mice showing highlevels of LCN2 expression in Western blot and immunohistochemistry.Recent studies showed LCN2 as an important paracrine chemoattractantthat stimulates polymorphonuclear cell migration and adherence [39]and actively preventing sepsis [40]. Newdata further indicate that differ-ent leukocyte subset compositions result in alterations of circulatingLCN2 levels that may explain why we in contrast to other reports didnot find the correlation of serum LCN2 to the staging of chronic liver dis-ease progression [41]. Noteworthy, sustained inflammation, even on asubclinical level, is a hallmark feature of liver fibrosis and cirrhosis. Fur-thermore, LCN2 concentrations denoted renal insufficiency in our studycohort in congruence to growing evidence that LCN2 is valuable markerof impaired kidney function in liver-related disease settings such as livertransplantation and cirrhosis [42,43]. According to our data and findingsby Gerbes et al., LCN2may detect clinically relevant renal insufficiency inclinical liver disease patients when serum creatinine levels would onlyindicate a modest functional decline. Impairment of kidney function iscommon in cirrhosis and current studies show that patientswith hepat-ic cirrhosis and acute tubular necrosis show strongly increased urineLCN2 levels compared to patients with cirrhosis and classical type 1hepatorenal syndrome (HRS), but this does not apply to HRS patientswith active bacterial infections. Moreover, patients with classical type1 HRS show higher urine LCN2 levels compared to type 2 HRS patients,chronic kidney diseases, and pre-renal azotemia, due to volume deple-tion. Urine LCN2 levels thereforemay be indicative in the differential di-agnosis of kidney function impairment in liver cirrhosis [44,45]. Eventhough systemic LCN2 levels were not directly associated to liver func-tion and disease severity, it is conceivable that LCN2 is regulated locallyin response to acute or chronic damage in human livers. More studiescomprising evaluation of hepatic LCN2 expression in liver biopsies orexplants are therefore essential to further elucidate the precise roleand regulation of LCN2 in human liver disease. The study presentedhere, however, already demonstrates that LCN2 is functionally linkedto the process of inflammatory liver disease and it is reasonable to spec-ulate that this lipocalin is an important mediator that in conjunctionwith other molecular mediators and pathways regulates and controlsliver homeostasis (Suppl. Fig. 2).
In conclusion, upregulation of LCN2 in liver has several aspects: (i) itis a reliable indicator of liver damage, (ii) it has a significant hepato-protective effect in acute liver injury, and (iii) LCN2 levels provide nocorrelation to the degree of liver fibrosis but provide a significant posi-tive correlation to inflammation.
Supplementary data to this article can be found online at http://dx.doi.org/10.1016/j.bbadis.2013.01.014.
References
[1] D.R. Flower, The lipocalin protein family: structure and function, Biochem. J. 318(1996) 1–14.
[2] S. Hraba-Renevey, H. Türler, M. Kress, C. Salomon, R. Weil, SV40-induced expres-sion of mouse gene 24p3 involves a post-transcriptional mechanism, Oncogene 4(1989) 601–608.
[3] L. Kjeldsen, A.H. Johnsen, H. Sengeløv, N. Borregaard, Isolation and primary struc-ture of NGAL, a novel protein associated with human neutrophil gelatinase, J. Biol.Chem. 268 (1993) 10425–10432.
[4] T. Bratt, Lipocalins and cancer, Biochim. Biophys. Acta 1482 (2000) 318–326.[5] T. Berger, C.C. Cheung, A.J. Elia, T.W. Mak, Disruption of the Lcn2 gene in mice
suppresses primary mammary tumor formation but does not decrease lung me-tastasis, Proc. Natl. Acad. Sci. U. S. A. 107 (2010) 2995–3000.
[6] X. Leng, T. Ding, H. Lin, Y.Wang, L. Hu, J. Hu, B. Feig,W. Zhang, L. Pusztai,W.F. Symmans,Y. Wu, R.B. Arlinghaus, Inhibition of lipocalin 2 impairs breast tumorigenesis and me-tastasis, Cancer Res. 69 (2009) 8579–8584.
[7] V.R. Sunil, K.J. Patel, M. Nilsen-Hamilton, D.E. Heck, J.D. Laskin, D.L. Laskin, Acuteendotoxemia is associated with upregulation of lipocalin 24p3/Lcn2 in lung andliver, Exp. Mol. Pathol. 83 (2007) 177–187.
[8] J. Yang, K. Mori, J.Y. Li, J. Barasch, Iron, lipocalin, and kidney epithelia, Am. J. Physiol.Renal Physiol. 285 (2003) F9–F18.
[9] L. Kjeldsen, J.B. Cowland, N. Borregaard, Human neutrophil gelatinase-associatedlipocalin and homologous proteins in rat and mouse, Biochim. Biophys. Acta 1482(2000) 272–283.
[10] Z. Tong, X. Wu, J.P. Kehrer, Increased expression of the lipocalin 24p3 as an apo-ptotic mechanism for MK886, Biochem. J. 372 (2003) 203–210.

673E. Borkham-Kamphorst et al. / Biochimica et Biophysica Acta 1832 (2013) 660–673
[11] Z. Tong, X. Wu, D. Ovcharenko, J. Zhu, C.S. Chen, J.P. Kehrer, Neutrophil gelatinase-associated lipocalin as a survival factor, Biochem. J. 391 (2005) 441–448.
[12] K.M. Schmidt-Ott, K.Mori, A. Kalandadze, J.Y. Li, N. Paragas, T. Nicholas, P. Devarajan,J. Barasch, Neutrophil gelatinase-associated lipocalin-mediated iron traffic in kidneyepithelia, Curr. Opin. Nephrol. Hypertens. 15 (2006) 442–449.
[13] J. Mishra, K. Mori, Q. Ma, C. Kelly, J. Yang, M. Mitsnefes, J. Barasch, P. Devarajan,Amelioration of ischemic acute renal injury by neutrophil gelatinase-associatedlipocalin, J. Am. Soc. Nephrol. 15 (2004) 3073–3082.
[14] K.Mori, H.T. Lee, D. Rapoport, I.R. Drexler, K. Foster, J. Yang, K.M. Schmidt-Ott, X. Chen,J.Y. Li, S. Weiss, J. Mishra, F.H. Cheema, G. Markowitz, T. Suganami, K. Sawai,M. Mukoyama, C. Kunis, V. D'Agati, P. Devarajan, J. Barasch, Endocytic delivery oflipocalinsiderophore–iron complex rescues the kidney from ischemia–reperfusioninjury, J. Clin. Invest. 115 (2005) 610–621.
[15] G. Bao, M. Clifton, T.M. Hoette, K. Mori, S.X. Deng, A. Qiu, M. Viltard, D. Williams,N. Paragas, T. Leete, R. Kulkarni, X. Li, B. Lee, A. Kalandadze, A.J. Ratner, J.C. Pizarro,K.M. Schmidt-Ott, D.W. Landry, K.N. Raymond, R.K. Strong, J. Barasch, Iron trafficsin circulation bound to a siderocalin (Ngal)–catechol complex, Nat. Chem. Biol. 6(2010) 602–609.
[16] K.M. Schmidt-Ott, Neutrophil gelatinase-associated lipocalin as a biomarker ofacute kidney injury—where do we stand today? Nephrol. Dial. Transplant. 26(2011) 762–764.
[17] A. Viau, K. El Karoui, D. Laouari, M. Burtin, C. Nguyen, K. Mori, E. Pillebout, T. Berger,T.W. Mak, B. Knebelmann, G. Friedlander, J. Barasch, F. Terzi, Lipocalin 2 is essentialfor chronic kidney disease progression in mice and humans, J. Clin. Invest. 120(2010) 4065–4076.
[18] D.H. Goetz, M.A. Holmes, N. Borregaard, M.E. Bluhm, K.N. Raymond, R.K. Strong,The neutrophil lipocalin NGAL is a bacteriostatic agent that interferes withsiderophore-mediated iron acquisition, Mol. Cell 10 (2002) 1033–1043.
[19] T.H. Flo, K.D. Smith, S. Sato, D.J. Rodriguez, M.A. Holmes, R.K. Strong, S. Akira,A. Aderem, Lipocalin 2 mediates an innate immune response to bacterial in-fection by sequestrating iron, Nature 432 (2004) 917–921.
[20] T. Berger, A. Togawa, G.S. Duncan, A.J. Elia, A. You-Ten, A. Wakeham, H.E. Fong,C.C. Cheung, T.W. Mak, Lipocalin 2-deficient mice exhibit increased sensitivityto Escherichia coli infection but not to ischemia–reperfusion injury, Proc. Natl.Acad. Sci. U. S. A. 103 (2006) 1834–1839.
[21] C. Ratledge, Iron metabolism and infection, Food Nutr. Bull. 28 (2007) S515–S523.[22] E. Borkham-Kamphorst, F. Drews, R. Weiskirchen, Induction of lipocalin-2 expression
in acute and chronic experimental liver injury moderated by pro-inflammatory cy-tokines interleukin-1β through nuclear factor-κB activation, Liver Int. 31 (2011)656–665.
[23] M.H. Roudkenar, Y. Kuwahara, T. Baba, A.M. Roushandeh, S. Ebishima, S. Abe,Y. Ohkubo, M. Fukumoto, Oxidative stress induced lipocalin 2 gene expression:addressing its expression under the harmful conditions, J. Radiat. Res. 48 (2007)39–44.
[24] E. Borkham-Kamphorst, S. Huss, E. Van de Leur, U. Haas, R. Weiskirchen, AdenoviralCCN3/NOV gene transfer fails to mitigate liver fibrosis in an experimental bile ductligation model because of hepatocyte apoptosis, Liver Int. 32 (2012) 1342–1353.
[25] H.W. Zimmermann, S. Seidler, J. Nattermann, N. Gassler, C. Hellerbrand, A. Zernecke,J.J. Tischendorf, T. Luedde, R.Weiskichen, C. Trautwein, F. Tacke, Functional contribu-tion of elevated circulating and hepatic non-classical CD14CD16 monocytes to in-flammation and human liver fibrosis, PLoS One 5 (6) (2010) e11049.
[26] F. Tacke, G. Brabant, E. Kruck, R. Horn, P. Schöffski, H. Hecker,M.P.Manns, C. Trautwein,Ghrelin in chronic liver disease, J. Hepatol. 38 (2003) 447–454.
[27] K.R. Karlmark, R. Weiskirchen, H.W. Zimmermann, N. Gassler, F. Ginhoux, C. Weber,M.Merad, T. Luedde, C. Trautwein, F. Tacke, Hepatic recruitment of the inflammatoryGr1+ monocyte subset upon liver injury promotes hepatic fibrosis, Hepatology 50(2009) 261–274.
[28] J. Kountouras, B.H. Billing, P.J. Scheuer, Prolonged bile duct obstruction: a new ex-perimental model for cirrhosis in the rat, Br. J. Exp. Pathol. 65 (1984) 305–311.
[29] M. Arias, S. Sauer-Lehnen, J. Treptau, N. Janoschek, I. Theuerkauf, R. Buettner,A.M. Gressner, R. Weiskirchen, Adenoviral expression of a transforming growthfactor-beta1 antisense mRNA is effective in preventing liver fibrosis in bile-ductligated rats, BMC Gastroenterol. 3 (2003) 29.
[30] E. Borkham-Kamphorst, E. Kovalenko, C.R. van Roeyen, N. Gassler, M. Bomble,T. Ostendorf, J. Floege, A.M. Gressner, R. Weiskirchen, Platelet-derived growthfactor isoform expression in carbon tetrachloride-induced chronic liver inju-ry, Lab. Invest. 88 (2008) 1090–1100.
[31] K. Takeda, Y. Hayakawa, L. Van Kaer, H. Matsuda, H. Yagita, K. Okumura, Criticalcontribution of liver natural killer T cells to a murine model of hepatitis, Proc.Natl. Acad. Sci. U. S. A. 97 (2000) 5498–5503.
[32] D. Stejskal, M. Karpísek, V. Humenanska, Z. Hanulova, P. Stejskal, P. Kusnierova,M. Petzel, Lipocalin-2: development, analytical characterization, and clinical test-ing of a new ELISA, Horm. Metab. Res. 40 (2008) 381–385.
[33] M. Haase, P.R. Mertens, Urinary biomarkers—silver bullets to faster drug develop-ment and nephron protection, Nephrol. Dial. Transplant. 25 (2010) 3167–3169.
[34] H. Wang, F. Lafdil, X. Kong, B. Gao, Signal transducer and activator of transcrip-tion 3 in liver diseases: a novel therapeutic target, Int. J. Biol. Sci. 7 (2011)536–550.
[35] F. Hong, B. Jaruga, W.H. Kim, S. Radaeva, O.N. El-Assal, Z. Tian, V.A. Nguyen, B. Gao,Opposing roles of STAT1 and STAT3 in T cell-mediated hepatitis: regulation bySOCS, J. Clin. Invest. 110 (2002) 1503–1513.
[36] S. Sultan, M. Pascucci, S. Ahmad, I.A. Malik, A. Bianchi, P. Ramadori, G. Ahmad,G. Ramadori, LIPOCALIN-2 is a major acute-phase protein in a rat and mousemodel of sterile abscess, Shock 37 (2012) 191–196.
[37] S. Chakraborty, S. Kaur, V. Muddana, N. Sharma, U.A. Wittel, G.I. Papachristou,D.Whitcomb, R.E. Brand, S.K. Batra, Elevated serumneutrophil gelatinase-associatedlipocalin is an early predictor of severity and outcome in acute pancreatitis, Am. J.Gastroenterol. 105 (2010) 2050–2059.
[38] N.I. Shapiro, S. Trzeciak, J.E. Hollander, R. Birkhahn, R. Otero, T.M. Osborn, E. Moretti,H.B. Nguyen, K.J. Gunnerson, D. Milzman, D.F. Gaieski, M. Goyal, C.B. Cairns, L. Ngo,E.P. Rivers, A prospective, multicenter derivation of a biomarker panel to assessrisk of organ dysfunction, shock, and death in emergency department patientswith suspected sepsis, Crit. Care Med. 37 (2009) 96–104.
[39] A. Schroll, K. Eller, C. Feistritzer, M. Nairz, T. Sonnweber, P.A.Moser, A.R. Rosenkranz,I. Theurl, G. Weiss, Lipocalin-2 ameliorates granulocyte functionality, Eur. J. Immunol.42 (2012) 3346–3357.
[40] G. Srinivasan, J.D. Aitken, B. Zhang, F.A. Carvalho, B. Chassaing, R. Shashidharamurthy,N. Borregaard, D.P. Jones, A.T. Gewirtz, M. Vijay-Kumar, Lipocalin 2 deficiencydysregulates iron homeostasis and exacerbates endotoxin-induced sepsis, J. Immunol.189 (2012) 1911–1919.
[41] G. Lippi, G.L. Salvagno, G. Banfi, Serum but not urine concentration of neutrophilgelatinase-associated lipocalin is influenced by acute leukocyte variations, Leuk.Lymphoma 53 (2012) 1643–1645.
[42] C.U. Niemann, A. Walia, J. Waldman, M. Davio, J.P. Roberts, R. Hirose, J. Feiner,Acute kidney injury during liver transplantation as determined by neutrophilgelatinase-associated lipocalin, Liver Transpl. 15 (2009) 1852–1860.
[43] A.L. Gerbes, A. Benesic, M. Vogeser, A. Krag, F. Bendtsen, S. Møller, Serum neutro-phil gelatinase-associated lipocalin — a sensitive novel marker of renal impair-ment in liver cirrhosis? Digestion 84 (2011) 82–83.
[44] C. Fagundes, M.N. Pépin, M. Guevara, R. Barreto, G. Casals, E. Solà, G. Pereira,E. Rodríguez, E. Garcia, V. Prado, E. Poch, W. Jiménez, J. Fernández, V. Arroyo,P. Ginès, Urinary neutrophil gelatinase-associated lipocalin as biomarker in the dif-ferential diagnosis of impairment of kidney function in cirrhosis, J. Hepatol. 57(2012) 267–273.
[45] E.C. Verna, R.S. Brown, E. Farrand, E.M. Pichardo, C.S. Forster, D.A. Sola-Del Valle,S.H. Adkins, M.E. Sise, J.A. Oliver, J. Radhakrishnan, J.M. Barasch, T.L. Nickolas, Uri-nary neutrophil gelatinase-associated lipocalin predicts mortality and identifiesacute kidney injury in cirrhosis, Dig. Dis. Sci. 57 (2012) 2362–2370.
Related Documents

![Lipocalin-2 Acts as a Neuroinflammatogen in ......neuronal cell death in the CNS [21, 22]. LCN2 has been proposed to be linked to experimental autoimmune encephalomyelitis [23], intracerebral](https://static.cupdf.com/doc/110x72/60f85f0dc57a8c2ea30ae028/lipocalin-2-acts-as-a-neuroinflammatogen-in-neuronal-cell-death-in-the-cns.jpg)