1 Protective Effect of Quercetin on Melphalan - induced Oxidative Stress, Impaired Renal and Hepatic Functions in Rat Ebenezer Tunde Olayinka, Ayokanmi Ore, Solomon Olaniyi Ola and Oluwatobi Adewumi Adeyemo Biochemistry unit, Department of Chemical Sciences, PMB 1066, Ajayi Crowther University, Oyo, Oyo State, Nigeria. Correspondence should be addressed to E.Tunde Olayinka e-mail: [email protected] Phone no: +234-8068525502

Welcome message from author
This document is posted to help you gain knowledge. Please leave a comment to let me know what you think about it! Share it to your friends and learn new things together.
Transcript
1
Protective Effect of Quercetin on Melphalan - induced Oxidative
Stress, Impaired Renal and Hepatic Functions in Rat
Ebenezer Tunde Olayinka, Ayokanmi Ore, Solomon Olaniyi Ola and
Oluwatobi Adewumi Adeyemo
Biochemistry unit, Department of Chemical Sciences, PMB 1066, Ajayi Crowther University,
Oyo, Oyo State, Nigeria.
Correspondence should be addressed to E.Tunde Olayinka
e-mail: [email protected]
Phone no: +234-8068525502
2
Abstract
One major challenge with the use of anticancer agents is the phenomenon of drug-induced
toxicity. Melphalan (MPLN) is an alkylating agent indicated for multiple myeloma and ovarian
cancer; while quercetin (QCT) is a flavonol with potent antioxidant activity. We investigated
the protective role of quercetin against MPLN-induced toxicity. Twenty-five male Wistar rats
(160-170g) were randomized into five treatment groups; I: (control), II: MPLN (0.2mg/kg b.w),
III: pre-treated with QCT (20mg/kg b.w) for 7days followed by MPLN (0.2mg/kg b.w) for
7days, IV: co-treated with QCT (20mg/kg b.w) and MPLN (0.2mg/kg b.w) for 7days and V:
QCT (20mg/kg b.w) alone. MPLN caused a significant increase in plasma bilirubin, urea, and
creatinine by 122.2%, 102.3% and 188% respectively (p˂0.05). Similarly, plasma alkaline
phosphatase, alanine aminotransferase, aspartate aminotransferase and gamma glutamyl
transferase activities increased significantly by 57.9%, 144.3%, 71.3% and 307.2%
respectively, relative to control. However, pre or co-treatment with QCT restored the levels of
renal and hepatic function indices relative to MPLN-treated rats. Hepatic ascorbic acid and
reduced glutathione and activities of glutathione-S-transferase, superoxide dismutase and
catalase decreased significantly by 36.2%, 188%, 46.5%, 34.4%; and 55.2% respectively,
followed by increase in MDA content by 46.5% relative to control. Nevertheless, pre- and co-
treatment with QCT re-established the hepatic antioxidant status and level of lipid peroxidation.
Overall, quercetin protected against MPLN-induced renal and hepatic toxicity in rat.

3
1. Introduction
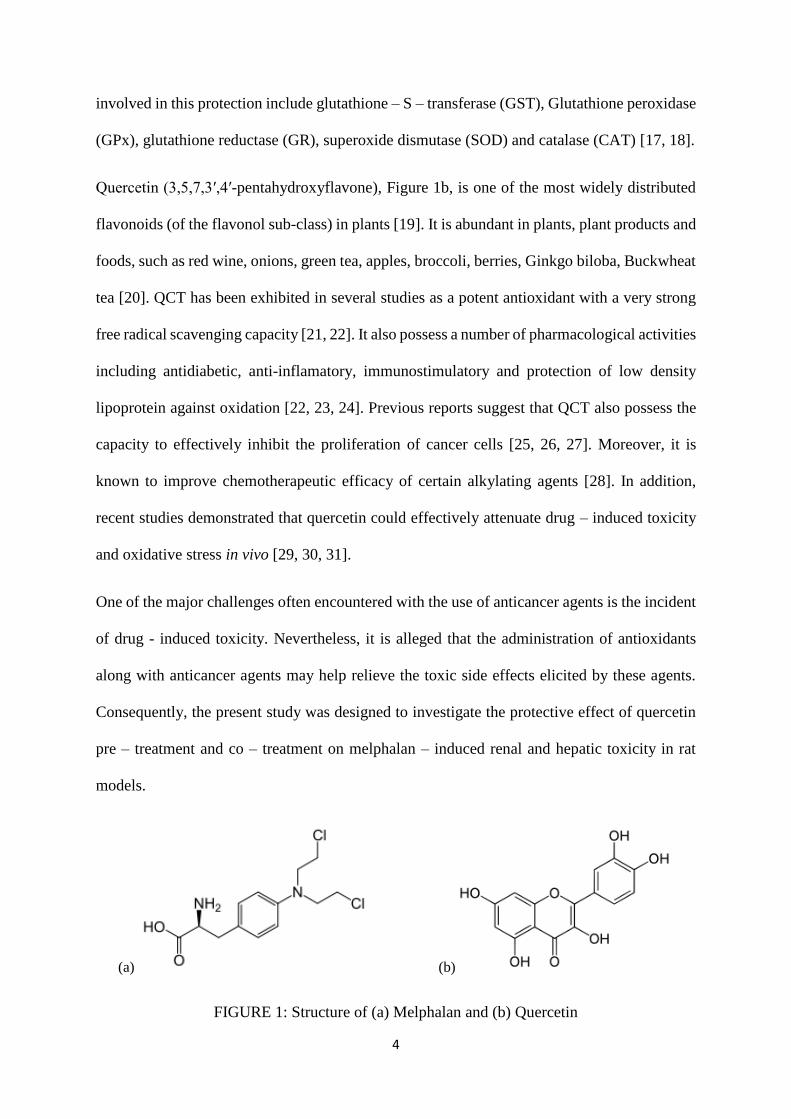
Melphalan (4-[bis(2-chloroethyl)amino]-L-phenylalanine), Figure 1a, is a phenylalanine
derivative of nitrogen mustard. It is a bifunctional alkylating agent and one of the most
aggressive antineoplastic drugs indicated for multiple myeloma and ovarian cancer [1].
Melphalan (MPLN) is classified as a cell cycle phase-nonspecific alkylating agent [2]. Its
mechanism of action involve inhibition of DNA and RNA synthesis through formation of
interstrand cross-links with DNA. Following oral administration, it is distributed mainly to the
liver where microsomal glutathione –S- transferase (GST) plays a significant role in its
metabolism [3]. Among the reported toxicities elicited by melphalan are hematological
suppression [4], hepatotoxicity [5, 6, 7], renal toxicity [8, 9] and bone marrow suppression [10].
One of the cytotoxic-mechanisms of alkylating agents is their ability to generate free radicals
and trigger oxidative stress in vivo [11]. This may also be associated with the toxicities elicited
by these drugs as a result of suppression of cellular antioxidant defence [12, 13, 14]. A free
radical is a reactive atom or group of atoms that has one or more unpaired electrons. They are
produced in the body by natural biological processes or introduced from an exogenous source
such as drugs and environmental toxicants [15]. Excessive production of free radicals which
are not neutralised may result to lipid, proteins, and DNA oxidation and ultimately cell damage
[15].
The liver is the main site of drug metabolism and metabolites generated in the liver and in some
cases, free drug molecules are also distributed to the kidneys, thus exposing these organs to
drug – induced toxicities. These tissues have however evolved an array of antioxidant defence
systems to protect against the harmful effect of drug metabolites and free radicals [15, 16].
Antioxidants are substances that inhibit oxidation or reactions promoted by oxygen, peroxides,
or free radicals or their actions [16]. These include the non-enzymic antioxidants like reduced
glutathione (GSH), ascorbic acid (AA) and vitamin E among others. Enzymic antioxidants
4
involved in this protection include glutathione – S – transferase (GST), Glutathione peroxidase
(GPx), glutathione reductase (GR), superoxide dismutase (SOD) and catalase (CAT) [17, 18].
Quercetin (3,5,7,3′,4′-pentahydroxyflavone), Figure 1b, is one of the most widely distributed
flavonoids (of the flavonol sub-class) in plants [19]. It is abundant in plants, plant products and
foods, such as red wine, onions, green tea, apples, broccoli, berries, Ginkgo biloba, Buckwheat
tea [20]. QCT has been exhibited in several studies as a potent antioxidant with a very strong
free radical scavenging capacity [21, 22]. It also possess a number of pharmacological activities
including antidiabetic, anti-inflamatory, immunostimulatory and protection of low density
lipoprotein against oxidation [22, 23, 24]. Previous reports suggest that QCT also possess the
capacity to effectively inhibit the proliferation of cancer cells [25, 26, 27]. Moreover, it is
known to improve chemotherapeutic efficacy of certain alkylating agents [28]. In addition,
recent studies demonstrated that quercetin could effectively attenuate drug – induced toxicity
and oxidative stress in vivo [29, 30, 31].
One of the major challenges often encountered with the use of anticancer agents is the incident
of drug - induced toxicity. Nevertheless, it is alleged that the administration of antioxidants
along with anticancer agents may help relieve the toxic side effects elicited by these agents.
Consequently, the present study was designed to investigate the protective effect of quercetin
pre – treatment and co – treatment on melphalan – induced renal and hepatic toxicity in rat
models.
(a) (b)
FIGURE 1: Structure of (a) Melphalan and (b) Quercetin

5
2. Materials and Methods
2.1. Chemicals and Reagents. Melphalan tablets was a product of Excella GmbH, Nurnberger,
Almanya. Quercetin, Glutathione, 1-Chloro, 2, 4-dinitrobenzene (CDNB), 5, 5-dithio bis-2-
nitrobenzoic acid (DTNB), epinephrine, and hydrogen peroxide (H2O2) were all purchased
from Sigma Chemical Company (London, UK). Kits for alanine transferase (ALT), aspartate
aminotransferase (AST), alkaline phosphatase (ALP), gamma glutamyl transpeptidase (GGT),
Urea, Creatinine, total Bilirubin were products of Randox® laboratories Ltd. (Antrim, UK). All
other reagents used were of analytical grade and of highest purity.
2.2. Animal Selection and Care. Twenty five male Wistar rats weighing between 160-170g
were obtained from the animal holding unit, Department of Chemical Sciences, Ajayi Crowther
University, Oyo Nigeria. The rats were acclimatized under laboratory conditions prior to
experiment. The animals were housed in wire-meshed cages and provided with food and water
ad libitum. The animals were maintained under standard conditions of temperature and
humidity with 12 hours light/dark cycles. They were fed with commercial rat diet (Ladokun
feeds, Nigeria Ltd). Handling of the experimental animals was in conformity to the National
Institutes of Health, Guide for the Care and Use of Laboratoty Animals (NIH publication No
85-23 revised 1985: U.S. Department of Health, Education and Welfare, Bethesda, MA).
2.3. Animal Grouping and Drug Treatments. The Animals were randomly assigned into five
experimental groups (I-V) of five animals each. The animals of each group were treated as
presented in Table 1. The doses for MPLN and QCT were decided based on the available
literature [32, 33], and were delivered in one mL solution of distilled water once daily by oral
intubation.
6
TABLE 1: Experimental design
TREATMENT
↓GROUPS
TREATMENTS
Duration → Day 1-7 Day 8-14
I (CTRL) - Control; distilled water
II (MPLN) - 0.2 mg/ Kg b.w. MPLN
III (MPLN + QCT-P) 20 mg/ Kg b.w. QCT 0.2 mg/ Kg b.w. MPLN
IV (MPLN + QCT-C) - 0.2 mg/ Kg b.w. MPLN + 20 mg/ Kg b.w. QCT
V (QCT-A) - 20 mg/ Kg b.w. QCT
CTRL – Control, MPLN – melphalan, QCT – quercetin, QCT-P – Quercetin – pretreated,
QCT-C – Quercetin – co-treated, QCT-A – Quercetin-alone, b.w. – body weight
2.4. Animal Sacrifice, Collection of Blood and Liver Samples. Blood samples were collected
from each animal through retro orbitals plexus into heparinized tubes (Li heparin). Animals
were sacrificed and the liver was carefully excised from each animal for preparation of
cytosolic fraction.
2.5. Preparation of Plasma and Cytosolic Fractions. Plasma was obtained by centrifugation of
whole blood sample at 4000 rpm. for 5minutes using a Cencom® bench centrifuge. The plasma
obtained were stored at -40C for subsequent plasma assays. The liver excised from each rat was
blotted of blood stains, rinsed in ice – cold 1.15% KCl and homogenized in 4 volumes of ice-
cold 0.01 M potassium phosphate buffer, (pH 7.4). The homogenates were centrifuged at
12,500g for 15 min at -4°C (Eppendorf, UK) and the supernatants, termed the post-
mitochondrial fractions (PMF) were aliquoted and used for subsequent biochemical assays.
2.6. Determination of Plasma and Liver Protein Content. The protein concentration in the
plasma and liver homogenate was determined by the Biuret method of Gornall et al. [34] using
bovine serum albumin as standard.
2.7. Assay of Plasma Biomarkers of Renal Toxicity. Plasma urea and creatinine was determined
with Randox® diagnostic kits. Method for Creatinine assays was based on colorimetric alkaline
7
picrate methods [35] with creatinine-picrate complex measured at 492nm. Plasma urea
determination was based on the Fenton reaction [36] with the Diazine chromogen formed
absorbing strongly at 540nm.
2.8. Assay of Plasma Biomarkers of Hepatotoxicity. Plasma total bilirubin (TBILI)
determination was done using Randox® diagnostic kits based on the dimethy sulphoxide
method by Tietz et al. [36]. The dimethyl sulphoxide form a coloured compound with
maximum absorption at 550nm. Plasma Alkaline phosphatase (ALP), Alanine
aminotransferase (ALT), and Aspartate aminotransferase (AST) and gamma glutamyl
transferase (γ-GT) activities were determined using Randox® diagnostic kits. ALP activity was
determined in accordance with the principles of Tietz [37]. The p-nitrophenol formed by the
hydrolysis of p-Nitrophenyl phosphate confers yellowish colour on the reaction mixture and
its intensity can be monitored at 405nm to give a measure of enzyme activity. Determination
of plasma ALT and AST activities was based on the principle described by Reltman and
Frankel [38]. ALT activity was measured by monitoring the concentration of pyruvate
hydrazone formed with 2,4-dinitrophenylhydrazine at 546 nm. AST activity was measured by
monitoring the concentration of oxaloacetate hydrazone formed with 2,4-
dinitrophenylhydrazine at 546nm. γ-GT activity was determined following the principle
described by Szasz [39]. The substrate L-γ-glutamyl-3-carboxy-4-nitroanilide, in the presence
of glycylglycine is converted to 5 amino-2-nitrobenzoate by γ-GT measured at 405nm. The
increase in absorbance is proportional to γ-GT activity.
2.9. Assay for non-enzymatic antioxidants in the liver. Hepatic reduced glutathione level was
determined according to the method of Jollow et al. [40]. The chromophoric product resulting
from the reaction of Ellman’s reagent with the reduced glutathione, 2-nitro-5-thiobenzoic acid
possesses a molar absorption at 412 nm which was read in a spectrophotometer. Reduced GSH
is proportional to the absorbance at 412 nm. The ascorbic acid concentration was determined
8
according to the method of Jagota and Dani [41]. AA in biological samples reacts with Folin’s
reagent, an oxidizing agent to give a blue color which has its maximum absorption at 760 nm.
2.10. Assay of hepatic antioxidant enzymes. Hepatic Glutathione S-transferase (GST) activity
was determined by the method described by Habig et al. [42] using 1-chloro-2,4-dinitrobenzene
(CDNB) as substrate. The procedure of Misra and Fridovich [43] was used for the
determination of hepatic superoxide dismutase (SOD) activity by measuring the inhibition of
auto-oxidation of epinephrine at pH 10.2 and 300C. Hepatic Catalase activity was determined
by the method described by Singha [44] based on the reduction of dichromate in acetic acid to
chromic acetate when heated in the presence of hydrogen peroxide (H2O2). The chromic acetate
produced is measured spectrophotometrically at 570nm
2.11. Assay of hepatic level of lipid peroxidation. The extent of lipid peroxidation (LPO) in the
liver was estimated by the method of Vashney and Kale [45]. The method involved the reaction
between malondialdehyde (MDA; product of lipid peroxidation) and thiobarbituric acid to
yield a stable pink chromophore with maximum absorption at 532 nm.
2.12. Statistical analysis. The results were expressed as mean of 5 replicates ± SD. Data
obtained were subjected to one-way Analysis of Variance (ANOVA) followed by Duncan
multiple range test for comparison between control and treated rats in all groups using
SigmaPlot® Statistical application package. P values less than 0.05 were considered statistically
significant.
3. Results
3.1. Plasma Biomarkers of Renal Toxicity. Table 2 shows the protective effects of QCT on
MPLN - induced changes in plasma creatinine and urea in rats. Administration of MPLN
caused a significant increase in the plasma level of creatinine and urea by 188 % and 102.3 %
9
respectively when compared with the control. Pre- and Co- treatment with QCT significantly
restore the plasma level of creatinine and urea in rats.
3.2. Plasma Biomarkers of Hepatotoxicity. Plasma bilirubin level reduced by 122.2% following
MPLN administration (Table 2). Similar trends were also observed for the activities of the liver
enzymes - ALT, AST, ALP, and γ-GT in the plasma of experimental animals. The activities of
ALT, AST, ALP, and γ-GT in the plasma of MPLN-treated rats increased significantly by
144.3%, 71.3%, 57.9% and 307.2% respectively compared to the values of the control animals
(Table 3). However, quercetin pre- and co-treatment significantly ameliorated the MPLN –
induced increase in plasma bilirubin as well as plasma ALT, AST, ALP, and γ-GT in rats.
3.3. Activity of Antioxidant Enzymes (SOD, CAT and GST). Table 4 represent the protective
effect of quercetin on MPLN - induced reduction in the activities of SOD and CAT in the liver
of rats. Hepatic SOD and CAT activities were significantly reduced in the MPLN-treated group
by 34.4% and 52.2% respectively when compared with values of the control group. Hepatic
GST activity was also significantly reduced by 46.5% when compared to control. However,
pre-treatment and co-treatment with quercetin significantly restored the activities of hepatic
SOD, CAT and GST.
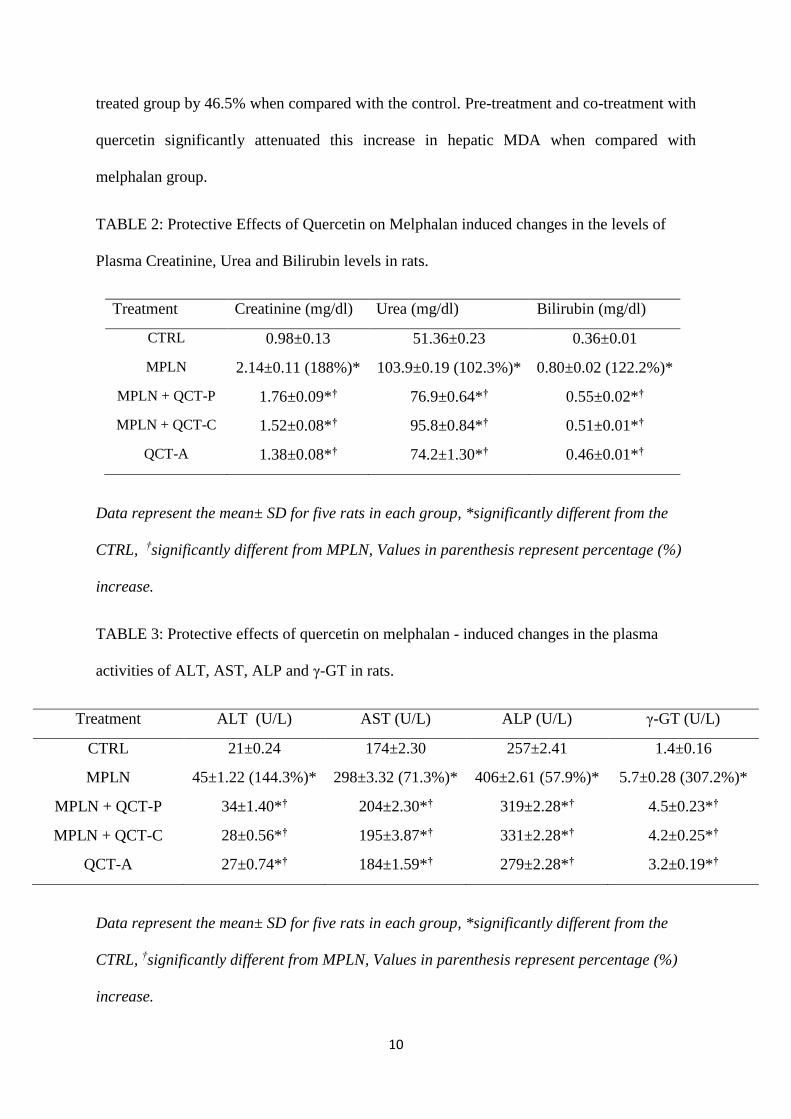
3.4. Non-enzymic antioxidants (AA and GSH). Hepatic AA level also reduced significantly by
36.2 % following oral administration of MPLN to rats (Figure 2). A similar decrease in hepatic
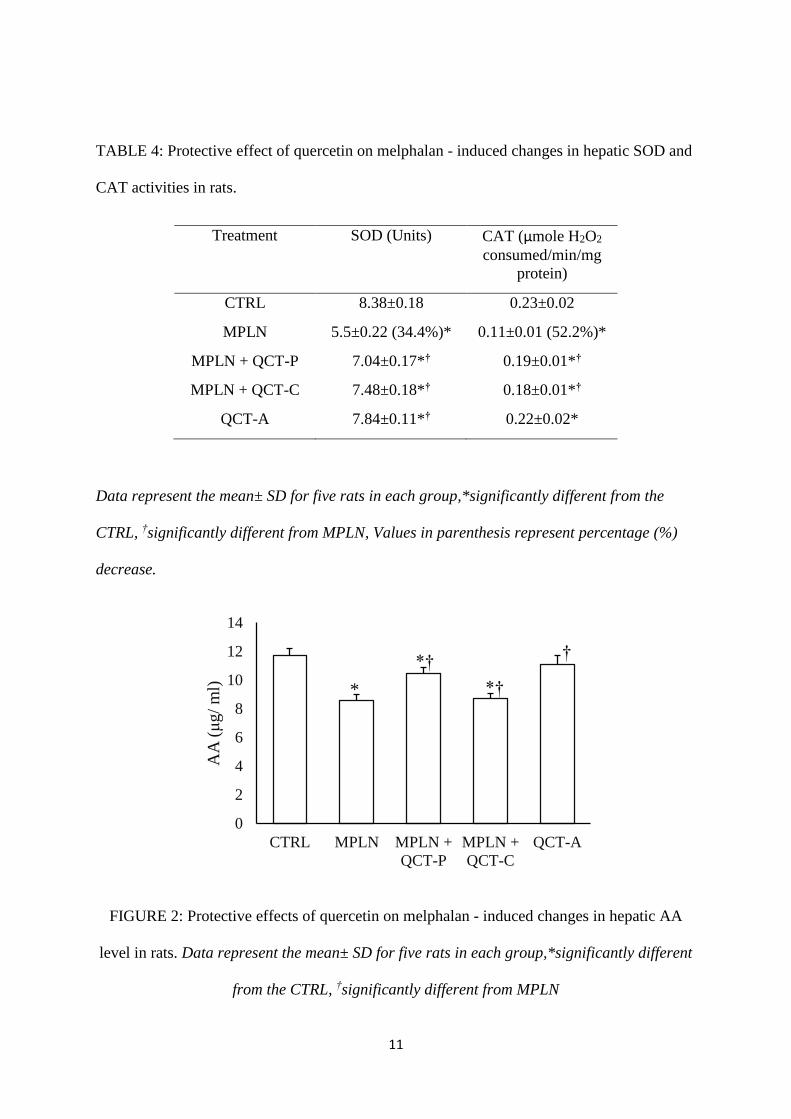
GSH (by 188%) was also observed (Figure 3) in the MPLN – treated animals relative to control.
The level of these non-enzymatic antioxidants was restored following pre- and co-treatment
with quercetin.
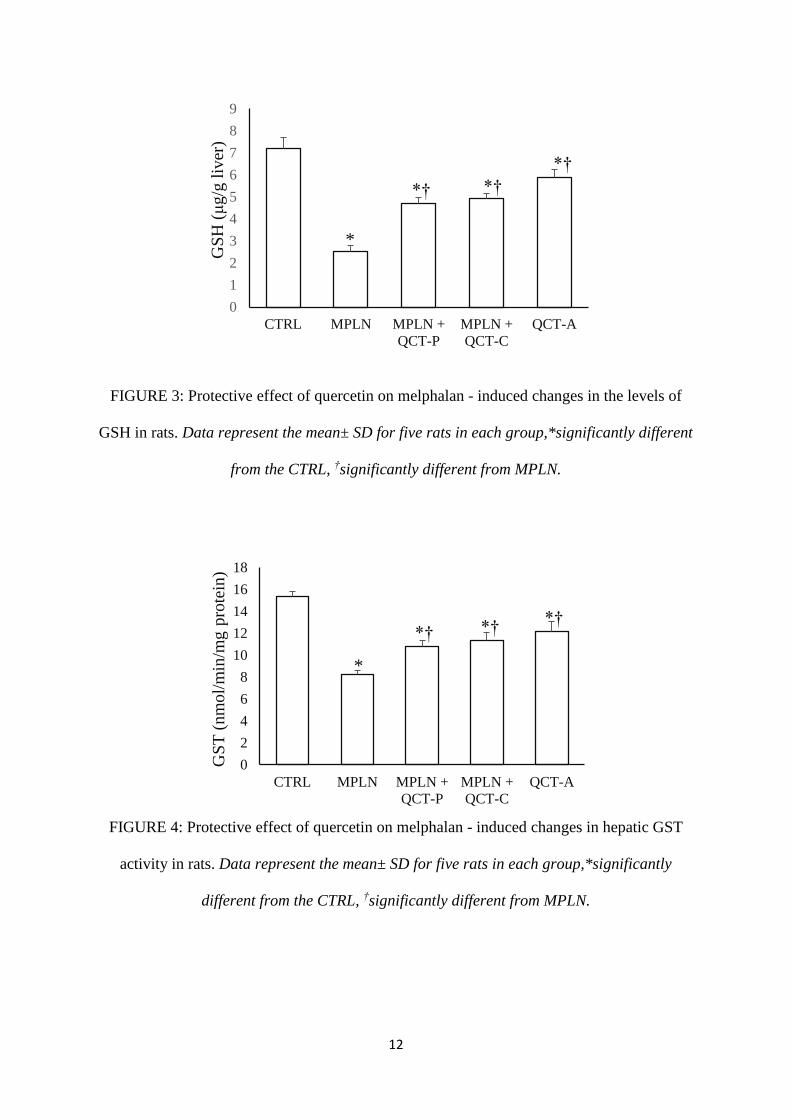
3.5. Lipid Peroxidation. The MPLN-induced reduction in hepatic antioxidant status was
accompanied by a significant increase in the level of lipid peroxidation (as indicated by the
MDA content), Figure 4. The level of lipid peroxidation was significantly increased in MPLN
10
treated group by 46.5% when compared with the control. Pre-treatment and co-treatment with
quercetin significantly attenuated this increase in hepatic MDA when compared with
melphalan group.
TABLE 2: Protective Effects of Quercetin on Melphalan induced changes in the levels of
Plasma Creatinine, Urea and Bilirubin levels in rats.
Treatment Creatinine (mg/dl) Urea (mg/dl) Bilirubin (mg/dl)
CTRL 0.98±0.13 51.36±0.23 0.36±0.01
MPLN 2.14±0.11 (188%)* 103.9±0.19 (102.3%)* 0.80±0.02 (122.2%)*
MPLN + QCT-P 1.76±0.09*† 76.9±0.64*† 0.55±0.02*†
MPLN + QCT-C 1.52±0.08*† 95.8±0.84*† 0.51±0.01*†
QCT-A 1.38±0.08*† 74.2±1.30*† 0.46±0.01*†
Data represent the mean± SD for five rats in each group, *significantly different from the
CTRL, †significantly different from MPLN, Values in parenthesis represent percentage (%)
increase.
TABLE 3: Protective effects of quercetin on melphalan - induced changes in the plasma
activities of ALT, AST, ALP and γ-GT in rats.
Treatment ALT (U/L) AST (U/L) ALP (U/L) γ-GT (U/L)
CTRL 21±0.24 174±2.30 257±2.41 1.4±0.16
MPLN 45±1.22 (144.3%)* 298±3.32 (71.3%)* 406±2.61 (57.9%)* 5.7±0.28 (307.2%)*
MPLN + QCT-P 34±1.40*† 204±2.30*† 319±2.28*† 4.5±0.23*†
MPLN + QCT-C 28±0.56*† 195±3.87*† 331±2.28*† 4.2±0.25*†
QCT-A 27±0.74*† 184±1.59*† 279±2.28*† 3.2±0.19*†
Data represent the mean± SD for five rats in each group, *significantly different from the
CTRL, †significantly different from MPLN, Values in parenthesis represent percentage (%)
increase.
11
TABLE 4: Protective effect of quercetin on melphalan - induced changes in hepatic SOD and
CAT activities in rats.
Treatment SOD (Units) CAT (μmole H2O2
consumed/min/mg
protein)
CTRL 8.38±0.18 0.23±0.02
MPLN 5.5±0.22 (34.4%)* 0.11±0.01 (52.2%)*
MPLN + QCT-P 7.04±0.17*† 0.19±0.01*†
MPLN + QCT-C 7.48±0.18*† 0.18±0.01*†
QCT-A 7.84±0.11*† 0.22±0.02*
Data represent the mean± SD for five rats in each group,*significantly different from the
CTRL, †significantly different from MPLN, Values in parenthesis represent percentage (%)
decrease.
FIGURE 2: Protective effects of quercetin on melphalan - induced changes in hepatic AA
level in rats. Data represent the mean± SD for five rats in each group,*significantly different
from the CTRL, †significantly different from MPLN
0
2
4
6
8
10
12
14
CTRL MPLN MPLN +
QCT-P
MPLN +
QCT-C
QCT-A
AA
(μ
g/
ml) *†
*††
*
12
FIGURE 3: Protective effect of quercetin on melphalan - induced changes in the levels of
GSH in rats. Data represent the mean± SD for five rats in each group,*significantly different
from the CTRL, †significantly different from MPLN.
FIGURE 4: Protective effect of quercetin on melphalan - induced changes in hepatic GST
activity in rats. Data represent the mean± SD for five rats in each group,*significantly
different from the CTRL, †significantly different from MPLN.
0
1
2
3
4
5
6
7
8
9
CTRL MPLN MPLN +
QCT-P
MPLN +
QCT-C
QCT-A
GS
H (
μg/g
liv
er)
*† *†
*†
*
0
2
4
6
8
10
12
14
16
18
CTRL MPLN MPLN +
QCT-P
MPLN +
QCT-C
QCT-A
GS
T (
nm
ol/
min
/mg
pro
tein
)
*† *†*†
*
13
FIGURE 5: Protective effect of quercetin on melphalan - induced changes in the level of lipid
peroxidation (MDA) in rats. Data represent the mean± SD for five rats in each
group,*significantly different from the CTRL, †significantly different from MPLN.
4. Discussion
The present study evaluates renal and hepatotoxic effect of melphalan (MPLN) in wistar rats
and possible protection by the flavonoid antioxidant – quercetin (QCT). The plasma biomarkers
of renal function, creatinine and urea were considered in this study. Creatinine and urea are
metabolic products which are removed from circulation by the kidney to prevent their
accumulation. Increase in plasma level of these substances are regarded as an indication of loss
of renal function [46, 47]. Data from this study suggest that alkylating agents caused a loss of
renal function and this is consistent with previous reports [48, 49]. We observed that QCT
restored the levels of plasma creatinine and urea which is an indication of renal protection. This
also confirms the protective role of QCT against drug - induced renal toxicity as previously
reported [50, 51]. The liver is an organ involve in the biotransformation of drugs and other
hepatotoxicants. The plasma level of bilirubin and activities of the liver enzymes – ALT, AST,
ALP and γ-GT are considered a reliable indices of hepatotoxicity [52, 53]. In this study, MPLN
caused a significant increase in the plasma bilirubin level and activities of ALT, AST, ALP,
0
100
200
300
400
500
600
CTRL MPLN MPLN +
QCT-P
MPLN +
QCT-C
QCT-A
MD
A (
nm
ol/
mg p
rote
in)
*†*†
*†
*
14
and γ-GT. ALT and AST are primarily located in the cytoplasm and mitochondria of
hepatocytes [54]. Increase in plasma ALT and AST may have resulted from leakage from
damaged hepatocytes (hepatocellular injury), [55]. Bilirubin is found in the liver, bile,
intestines and the reticuloendothelial cells of the spleen while ALP and γ-GT are associated
with the cell membrane [56]. Plasma bilirubin and activities of ALP and γ-GT are found to
increase in conditions associated with hepatobiliary injury (decrease hepatic clearance of
bilirubin), overproduction or leakage of ALP and γ-GT) [56]. In this study, pre- and co-
treatment with quercetin restored the plasma levels of bilirubin, ALT, AST, ALP, and γ-GT,
which is an indication of hepatoprotection by QCT. Our observation also corroborates previous
findings showing the hepatoprotective activity of QCT [57, 58].
Several studies have established a connection between hepatotoxicity and oxidative stress [59,
60, 61], thus prompting the consideration of the effect of MPLN on major enzymic as well as
non-enzymic antioxidant systems of rat. Activities of enzymic antioxidants, SOD, CAT and
GST are vital to the maintenance of the cellular redox balance [62]. In this study, MPLN
significantly decrease the activity of SOD, CAT and GST in the liver of rats. SOD catalyzes
the reaction involving a rapid dismutation of superoxide radical to hydrogen peroxide and
dioxygen while CAT converts the hydrogen peroxide formed in this process and other cellular
processes into water and molecular oxygen [63]. Reduction in the activities of SOD and CAT
by MPLN may expose the liver to oxidative stress [37]. Reduction in hepatic SOD activity is
an indication of oxidative stress [51]. Similarly, decrease in the activity of CAT in the liver of
MPLN rats may have resulted from accumulation of superoxide anion radical due to reduction
in hepatic SOD activity [52]. GST is an enzyme found in most tissues and it is involved in the
detoxification of ingested xenobiotics in the liver [64, 65] and also form a vital component of
the antioxidant defense mechanism [65, 66]. In this study, pre- and co-treatment with QCT
15
protected against oxidative stress in the liver by increasing the activities of antioxidant enzymes
in the experimental animals.
The non – enzymic antioxidant molecules, AA and GSH play a crucial role in cellular redox
balance. Both AA and GSH are involved in scavenging ROS and are the first line of defence
against oxidation [15]. AA function in the aqueous environments of the body and is involved
in the regeneration of tocopherol from tocopherol radicals in membranes and lipoproteins [67,
68]. One of the major roles of glutathione against oxidative stress include acting as a cofactor
for several enzymic antioxidants like glutathione peroxidase (GPx), glutathione -S-transferase
and others; scavenging hydroxyl radical and singlet oxygen and regeneration of other
antioxidants such as vitamins C and E back to their active forms [69]. Disturbance in the
cellular redox status of AA and GSH has been reported to enhance oxidative stress and tissue
injury [46]. Pre- and co-treatment with QCT significantly restored the levels of AA and GSH
in rats which supports previous reports by Mishra et al. [30] and Dong et al. [31].
Increase in tissue MDA content (from oxidation of unsaturated fatty acids) is a commonly used
marker of oxidative stress [15]. Lipid peroxidation is initiated by the attack of a free radical on
fatty acid [18] and leads to cell and tissue damage. The observed significant increase in the
concentration of MDA in the liver of MPLN – treated animals may be related to decreased
antioxidant protection from free radicals [31].
5. Conclusion
In conclusion, we report that QCT has the capacity to protect against MPLN-induced
hepatotoxicity and oxidative stress probably through scavenging the free radicals.
16
References
1. G. K. McEvoy, “AHFS 2006 Drug Information,” American Society of Health-System
Pharmacists Inc, Bethesda, Maryland: pp. 1131-1135.
2. V. D. Volpe, and M. K. Warren, “Myeloid clonogenic assays for comparison of the in vitro
toxicity of alkylating agents,” Toxicology In Vitro, vol. 17, pp. 271–277, 2003.
3. J. Zhanga, Z. Yec, and Y. Loua, “Metabolism of melphalan by rat liver microsomal
glutathione S-transferase,” Chemico-Biological Interactions, vol. 152, no. 2–3, pp. 101–
106, 2005.
4. S. M. Devine, “Fludarabine and melphalanbased conditioning for patients with advanced
hematological malignancies relapsing after a previous hematopoietic stem cell transplant,”
Bone Marrow Transplant, vol. 28, pp. 557–562, 2001.
5. M. Kresse, “Mechanism of liver cell injury by the cytostatic drug melphalan,” Dissertation,
pp. 1-169, 2005.
6. P. D. King, and M. C. Perry, “Hepatotoxicity of chemotherapy,” The Oncologist, vol. 6, pp.
162-176, 2001.
7. M. Kresse, M. Latta, G. Kuonstle, H. Riehle, N. Rooijen, H. Hentze, G. Tiegs, M. Biburger,
R. Lucas, and A. Wendel, “Kupffer Cell-Expressed Membrane-Bound TNF Mediates
Melphalan Hepatotoxicity via Activation of Both TNF Receptors,” The Journal of
Immunology, vol. 175, pp. 4076–4083, 2005.
8. V. Sahni, D. Choudhury, and Z. Ahmed, “Chemotherapy-associated renal dysfunction,”
Nature Reviews Nephrology, vol. 5, pp. 450–462, 2009.
9. N. Leung, J. M. Slezak, E. J. Bergstralh, A. Dispenzieri, M. Q. Lacy, R. C. Wolf, and M.
A. Gertz, “Acute renal insufficiency after high-dose melphalan in patients with primary
systemic amyloidosis during stem cell transplantation,” American Journal of Kidney
Diseases, vol. 45, pp. 102–111, 2005.
17
10. O. O. Shevchuk, К. А. Posokhova, A. S. Sidorenko, К. І. Bardakhivska, V. M. Maslenny,
L. A. Yushko, V. F. Chekhun, and V.G. Nikolaev, “The influence of enterosorption on some
haematological and biochemical indices of the normal rats after single injection of
melphalan,” Experimental Oncology, vol. 36, no. 2, pp. 94–100, 2014.
11. C. Gorrini, I. S. Harris, and T. W. Mak, “Modulation of oxidative stress as an anticancer
strategy,” Nature Reviews Drug Discovery, vol. 12, no. 931–947, 2013.
12. S. Khan, J. J. Ramwani, and P. J. O'Brien, “Hepatocyte toxicity of mechlorethamine and
other alkylating anticancer drugs. Biochemical Pharmacology, vol. 43, no. 9, pp. 1963-
1967, 1992.
13. J. Chandra, A. Samali, and S. Orrenius, “Triggering and modulation of apoptosis by
oxidative stress,” Free Radical Biology and Medicine, vol. 29, pp. 323–333, 2000.
14. K. A. Conklin, “Dietary polyunsaturated fatty acids: impact on cancer chemotherapy and
radiation,” Alternative Medicine Review, vol. 7, pp. 4–21, 2002.
15. J. M. C. Gutteridge, “Lipid peroxidation and antioxidants as biomarkers of tissue damage,”
Clinical Chemistry, vol. 41, no. 12, pp. 1819-1828, 1995.
16. R. K. Murray, D. K. Granner, P. A. Mayer, and V. W. Rodwell, Harpers Biochemistry 25th
Edition, pp. 130-136, 2000.
17. T. P. A. Devasagayam, J. C. Tilak, K. K. Boloor, K. S. Sane, S. S. Ghaskadbi, and R. D.
Lele, “Free Radicals and Antioxidants in Human Health: Current Status and Future
Prospects,” JAPI, vol. 52, pp. 794-804, 2004.
18. M. Valko, C.J. Rhodes, J. Moncola, M. Izakovic, and M. Mazura, “Free radicals, metals and
antioxidants in oxidative stress-induced cancer,” Chemico-Biological Interactions, vol. 160,
pp. 1–40, 2006.
18
19. C. A. Rice-Evans, N. J. Miller, and G. Paganga, “Structure antioxidant activity relationships
of flavonoids and phenolic acids,” Free Radical Biology and Medicine, vol. 20, no. 7, pp.
933–956, 1996.
20. K. Murota, and J. Terao, “Antioxidative flavonoid quercetin: implication of its intestinal
absorption and metabolism,” Archives of Biochemistry and Biophysics, vol. 417, pp. 12–17,
2003.
21. L. Stephen-Cole, “Quercetin: A review of clinical applications,” Clinical Sciences, vol. 40,
pp. 234–238, 1998.
22. H. Liu, L. Zhang, and S. Lu, “Evaluation of Antioxidant and Immunity Activities of
Quercetin in Isoproterenol-Treated Rats,” Molecules, vol. 17, pp. 4281-4291, 2012.
23. J. Moskaug, H. Carlsen, M. Myhrstad, and R. Blomhoff, “Molecular imaging of the
biological effects of quercetin and quercetin-rich foods,” Mechanisms in Ageing and
Development, vol. 125, pp. 315–324, 2004.
24. M. A. Abdelmoaty, M. A. Ibrahim, N. S. Ahmed, and M. A. Abdelaziz, “Confirmatory
studies on the antioxidant and antidiabetic effect of quercetin in rats,” Indian Journal of
Clinical Biochemistry, vol. 25, no. 2, pp. 188-192, 2010.
25. J. A. Choi, J. Y. Kim, J. Y. Lee, C. M. Kang, H. D. Kwon, Y. D. Yoo, T. W. Kim, Y. S.
Lee, and S. J. Lee, “Induction of cell cycle arrest and apoptosis in human breast cancer cells
by quercetin,” International Journal of Oncology, vol. 19, pp. 837-844, 2001.
26. C. S. Ong, E. Tran, T. T. Nguyen, C. K. Ong, S. K. Lee, J. J. Lee, C. P. Ng, C. Leong, and
H. Huynh, “Quercetin-induced growth inhibition and cell death in nasopharyngeal
carcinoma cells are associated with increase in Bad and hypophosphorylated retinoblastoma
expressions,” Oncology Repiration, vol. 11, pp. 727-733, 2004.
27. A. Eddeen, M. Seufi, S. S. Ibrahim, T. K. Elmaghraby, and E. E. Hafez, “Preventive effect
of the flavonoid, quercetin, on hepatic cancer in rats via oxidant/antioxidant activity:

19
molecular and histological evidences,” Journal of Experimental and Clinical Cancer
Research, vol. 28, no. 80, pp. 1-8, 2009.
28. K. Sak, “Chemotherapy and Dietary Phytochemical Agents,” Chemotherapy Research and
Practice, vol. 2012, pp. 1-11, 2012.
29. E. Atef, and A. El-Baky, “Quercetin protective action on oxidative stress, sorbitol, insulin
risistance and cells function in expermintal diabetic rats,” International Journal of
Pharmaceutical Studies and Research, vol. 2, no. 2, pp. 11-18, 2011.
30. S. K. Mishra, P. Singh, and S. K. Rath, “Protective effect of quercetin on chloroquine-
induced oxidative stress and hepatotoxicity in mice,” Malaria Research and Treatment, vol.
2013, pp. 1-10, 2013.
31. Y. Dong, J. Wang, D. Feng, H. Qin, H. Wen, Z. Yin, G. Gao, C. Li, “Protective effect of
quercetin against oxidative stress and brain edema in an experimental rat model of
subarachnoid hemorrhage,” International Journal of Medical Sciences, vol. 11, pp. 228-290,
2014.
32. R.C. Park, J. Blom, P.J. Disaia, L.D. Lagasse and J.A. Blessing, “Treatment of women with
disseminated or recurrent advanced ovarian cancer with melphalan alone in combination
with 5-fluorouracil and dactinomycin or with the combination of Cytoxan, 5-fluorouracil
and dactinomycin,” Cancer, vol. 45, no. 10, pp. 2529-2542, 1980.
33. P. Krishnappa, K. Venkatarangaiah, V. S. Kumar, S. Rajanna, R. Kashi and P. Gupta,
“Antioxidant and prophylactic effects of delonix elata l., stem bark extracts, and flavonoid
isolated quercetin against carbon tetrachloride-induced hepatotoxicity in rats, BioMed
Research International, vol. 2014, pp. 1-14, 2014.
34. A. C. Gornall, C. J. Bardwawill, and M. M. David, “Determination of serum protein by
means of the biuret reaction, Journal of Biological Chemistry, vol. 177, pp. 751-756, 1949.
20
35. B. Jaffe, “What made the radical break,” N England Journal of Medicine, vol. 286, p. 156,
1972.
36. N. W. Tietz, “Clinical guide to laboratory tests,” 3rd ed. W. B. Saunders Company,
Philadelphia.
37. N. W. Tietz, E. L. Pruden, O. Siggaard-Andersen: In C. A. Burtis, E. R. Ashwell, eds, “Tietz
textbook of Clinical Chemistry,” WB Saunders Company, London, pp. 1354-1374, 1994.
38. S. Reltman, and S.A. Frankel. Colorimetric method for the determination of serum ALT and
AST. American Journal of Clinical Pathology, vol. 28, pp. 56-63, 1957.
39. G. Szasz, “A kinetic photometric method for serum γ-glutamyl transpeptidase,” vol. 15, pp.
124-136, 1969.
40. D. J. Jollow, J. R. Mitchell, N. Zampaghone, and J. R. Gillete, “Bromobenzene induced liver
necrosis, protective role of glutathione and evidence for 3,4 bromobenzene oxide as the
hepatotoxic metabolite,” Pharmacology, vol. 11, pp. 151-169, 1974.
41. S. K. Jagota, and H. M. Dani, “A new colorimetric technique for the estimation of vitamin
C using Folin phenol reagent,” Analytical Biochemistry, vol. 127, pp. 178-182, 1982.
42. Habig WA, Pabst MJ, Jacoby WB. Glutathione transferases; the first enzymatic step in
mercapturic acid formation. J Biol Chem. 1974; 249,7130-7139.
43. H. P. Misra, and I. Fridovich, “The role of superoxide anion in the auto-oxidation of
epinephrine and a simple assay for superoxide dismutase, Journal of Biological Chemistry,
vol. 247, pp. 3170-3175, 1972.
44. A. K. Singha, “Colorimetric assay of catalase, vol. 47, pp. 389-394, 1972.
45. R. Varshney, and R. K. Kale, “Effect of calmodulin antagonist on radiation induced lipid
peroxidation in microsomes,” International Journal of Radiation Biology, vol. 58, pp. 733-
743, 1990.
21
46. W. K. Han, and J. V. Bonventre, “Biological markers for the early detection of acute kidney
injury,” Current Opinion on Critical Care, vol. 10, pp. 476-482, 2004.
47. G. S. George, M. E. Wakasi, and E. Egoro, “Creatinine and urea levels as critical markers
in end-stage renal failure,” Research and Review: Journal of Medical and Health Sciences,
vol. 3, no. 1, pp. 41-44, 2014.
48. “M. U. Rehman, M. Tahir, F. Ali, W. Qamar, A. Lateef, R. Khan, A. Quaiyoom, O. Hamiza,
S. Sultana, “Cyclophosphamide-induced nephrotoxicity, genotoxicity, and damage in
kidney genomic DNA of Swiss albino mice: the protective effect of ellagic acid,” Molecular
and Cellular Biochemistry, vol. 365, no. 1-2, pp. 119-127, 2012.
49. M. U. Rehman, M. Tahir, F. Ali, W. Qamar, A. Lateef, R. Khan, A. Quaiyoom, O. Hamiza,
S. Sultana, M. Kashimura, M. Kondo, and T. Abe, “A case report of acute renal failure
induced by melphalan in a patient with ovarian cancer,” Gan To Kagaku Ryoho, 34:201-
205, 1986.
50. T. Aktoz, M. kanter, Y. H. Uz, C. Aktas, M. Erboga, and I. H. Atakan, “Protective effect of
quercetin against renal toxicity induced by cadmium in rats, Balkan Medical Journal, vol.
29, pp. 56-61, 2012.
51. M. I. Yousef, S. A. M. Omar, M. I. El-Guendi, and L. A. Abdelmegid, “Potential Protective
effects of guercetin and curcumin on paracetamol-induced histological changes, oxidative
stress, impaired liver and kidney functions and haematoxicity in rat,” Food and Chemical
Toxicology, vol. 48, no. 11, pp. 3246-3261, 2010.
52. L. Boone, D. Meyer, P. Cusick, D. Ennulat, A. P. Bolliger, N. Everds, V. Meador, G. Elliott,
D. Honor, D. Bounous, and H. Jordan, “Selection and interpretation of clinical pathology
indicators of hepatic injury in preclinical studies,” Veterinary Clinical Pathology, vol. 34,
No. 3, pp. 182-188, 2005.
22
53. A. Singh, T. K. Bhat, and O. M. Sharma, “Clinical Biochemistry of Hepatotoxicity,” Journal
of Clinical Toxicology, vol. S4, pp. 1-19, 2011.
54. D. E. Amacher, “A Toxicologist’s Guide to biomarkers of hepatic response,” Human and
Experimental Toxicology, vol. 21, pp. 253-252, 2002.
55. J. Ozer, M. Ratner, M. Shaw, W. Bailey, S. Schomaker et al., “The current state of serum
biomarkers of hepatotoxicity,” Toxicology, vol. 245, pp. 194-205, 2008.
56. S. K. Ramaiah, “A Toxicologist’s Guide to the Diagnostic interpretation of hepatic
biochemical parameters,” Food and Chemical Toxicology vol. 45, pp. 1551-1557, 2007.
57. C. D. David, G. Rodrigues, S. Bona, L. Meurer, J. G. Lez-Gallego, M. A. Jesu, S. Tunon,
and N. P. Marroni, Role of quercetin in preventing thioacetamide-induced liver injury in
rats,” Toxicologic Pathology, vol. 39, pp. 949-957, 2011.
58. S. K. Mishra, P. Singh, and S. K. Rath, “Protective Effect of Quercetin on Chloroquine-
Induced Oxidative Stress and Hepatotoxicity in Mice,” Malaria Research and Treatment,
vol. 2013, pp. 1-10, 2013.
59. X. Guo, G. Sun, Y. S. Shenyang, “Oxidative stress from fluoride-induced hepatotoxicity in
rats,” Fluoride, vol. 36, no. 1, pp. 25-29, 2003.
60. T. Yamamoto, R. Kikkawa, H. Yamada, and I. Horii, “Identification of oxidative stress-
related proteins for predictive screening of hepatotoxicity using a proteomic approach,”
Journal of Toxicological Sciences, vol. 30, no. 3, pp. 213–227, 2005.
61. J. M. Oh, Y. S. Jung, B. S. Jeon, B. I. I. Yoon, K. S. lee, B. H. Kim, S. J. Oh, and S. K.
Kim, “Evaluation of hepatotoxicity and oxidative stress in rats treated with tert-butyl
hydroperoxide,” Food and Chemical Toxicology, vol. 50 no. 5, pp. 1215-1221, 2012.
62. G. Notas, I. E. Koutroubakis, and E. A. Kouroumalis, “Oxidants and Antioxidants in Liver
Disease, In: Antioxidants: New Research, Harold V. Panglossi, (Ed), Nova Science
Publishers, Inc. pp. 2-48, 2012
23
63. W. Droge, “Free Radicals in the Physiological Control of Cell Function,” Physiological
Review, vol. 82, pp. 47–95, 2002.
64. D. Trachootham,W. Lu, M. A. Ogasawara, N. R. Valle, and P. Huang, “Redox Regulation
of Cell Survival,” Antioxidants and Redox Signaling, vol. 10, no. 8, pp. 1343- 1374, 2008.
65. R. Morgenstern, J. Zhang, and K. Johansson, “Microsomal glutathione transferase 1:
mechanism and functional roles,” Drug Metabolism Reviews, Vol. 43, No. 2 , pp. 300-306,
2011.
66. P. J. Sherratt, and J. D. Hayes, “Glutathione S-transferases. In ‘Enzyme systems that
metabolise drugs and other xenobiotics,” C. Ioannides, (Ed). John Wiley and Sons Ltd, UK,
pp. 219-252, 2002.
67. J. Lee, N. Koo, and D.B. Min, “Reactive Oxygen Species, Aging, and Antioxidative
Nutraceuticals, Comprehensive Reviews in Food Science and Food Safety, Vol. 3, pp. 2—
21, 2004.
68. S. Kojo, “Vitamin C: basic metabolism and its function as an index of oxidative stress,”
Current Medicinal Chemistry, vol. 11, pp. 1041–1064, 2004.
69. R. Masella, R. Di Benedetto, R. Vari, C. Filesi, and C. Giovannini, “Novel mechanisms of
natural antioxidant compounds in biological systems: involvement of glutathione and
glutathione-related enzymes,” Journal of Nutritional Biochemistry, vol. 16, pp. 577–586,
2005.
24
Conflict of Interest
The authors declare that there is no conflict of interests regarding the publication of this
article.
Related Documents