PROTECTING AND SERVING $20 TRILLION IN US MARKET VALUE MARKET INTEGRITY PROTECTION FROM SHORT SELLERS REGULATION SHO COMPLIANCE MARKET MAKER SURVEILLANCE PREDICTIVE RESEARCH AUTOMATED SHAREHOLDER INTERACTION PROMOTE VALUE CREATION PREVENT VALUE DESTRUCTION INSIDE SqueezeTrigger Friction Factor Valuation Monitor Insider Timing FINRA Compliant Research Investors, Facebook, Twitter, Press, Blogs

Welcome message from author
This document is posted to help you gain knowledge. Please leave a comment to let me know what you think about it! Share it to your friends and learn new things together.
Transcript

PROTECTING AND SERVING $20 TRILLION IN US MARKET VALUE
MARKET INTEGRITY
PROTECTION FROM SHORT SELLERS
REGULATION SHO COMPLIANCE
MARKET MAKER SURVEILLANCE
PREDICTIVE RESEARCH
AUTOMATED SHAREHOLDER INTERACTION
PROMOTE VALUE CREATION
PREVENT VALUE DESTRUCTION
INSIDE
SqueezeTrigger
Friction Factor
Valuation Monitor
Insider Timing
FINRA Compliant Research
Investors, Facebook, Twitter, Press, Blogs

Tom Ronk / CEO
Registered Investment Advisor
Series 65, Series 3
949-230-7680
Thomas Ronk, RIA, CTA has 23 years of trading experience. As a registered
representative of Transamerica Financial Resources, a division of Transamerica,
Mr. Ronk managed over $150 million in equity accounts. Mr. Ronk is the
principal of Century Pacific Investments, a registered investment advisor in the
state of California. He is also registered with the National Futures Association as
a commodities trading advisor. He is the owner of BUYINS.NET, a research firm
that compiles short sale time and sales data and publishes a proprietary
SqueezeTrigger ® price on all US stocks. He is partners with Harvey Pitt, former
Chairman of the SEC, in RegSHO.com, a short sale compliance and market
surveillance company. He is the Chief Analytics Officer of WealthMakers.com.
He is the President of Casablanca Mining, a publicly traded gold mining entity in
Chile. He also designed and developed the Global Automated Trading System
(“GATS”). Mr. Ronk has been interviewed on Bloomberg Television, CNBC
Television, Wall Street Journal, Dow Jones, CBS MarketWatch, Equities
Magazine, SFO Magazine, Technical Analysis of Stocks and Commodities
Magazine, Red Herring, MSNBC and has been an approved research analyst for
Investor’s Business Daily. Mr. Ronk reached the Top 15 players (out of nearly
600,000 contestants) during CNBC’s first Million Dollar Portfolio Challenge.
BUSINESS IS WAR AND YOUR MARKET CAP IS THE BATTLEFIELD
Every day your stock price is in a tug-of-war battle between buyers, sellers, short-sellers, market-makers and specialists.
These entities employ high frequency trading, analysts, reporters, press releases, websites, bloggers, message boards,
chat rooms, email, faxes, TV, radio, boiler rooms, call centers, conferences, Facebook and Twitter to influence your
stock price in the direction that makes them money, either up or down. There are a multitude of factors and forces that
directly affect the value of your company and its perception amongst its peers, shareholders, employees, customers,
partners, re-sellers, distributors, suppliers, vendors, financiers and bankers. Your management team is focused on day-to
-day operations and providing shareholder value while other forces are doing everything they can to drive your stock
price down and interfere with the company’s operations by creating negative perception in the marketplace.
BUYINS.NET TECHNOLOGY WILL HELP YOU:
Combat illegal short selling / naked short selling
Expose true size and price of short positions
Alert US markets when a short squeeze will begin
Monitor market-makers for Fair Market-Making
Auto-Alert regulators when rule violations occur
Monitor and combat short and distort attacks
Expose negative PR campaigns using hard data
Appropriately time buybacks, insider transactions
Issue FINRA compliant research reports
Communicate valuable info to old / new investors
Monitor and build social media awareness
Monitor peers and identify factors driving higher
comparable valuations in your industry.

SELL-SIDE BUY-SIDE

Commercial Pipeline Field Testing in China Confirms Laboratory Results of STWA's Oil Pipeline Efficiency Technology
Marketwire (Tue, Nov 13)
STWA in Proposal Talks With Multiple Companies Marketwire (Tue, Oct 2)
BUYINS.NET Updates STWA, Inc. SqueezeTrigger Report GlobeNewswire (Wed, Sep 26)
ZERO Has Strong Technology And An Achievable Business Plan at Seeking Alpha (Wed, Sep 26)
STWA Announces Results of Shareholder Meeting & Updates on
Further Technology & Commercial Progress Achieved Marketwire
(Tue, Sep 25)
ZERO's Current Scheme Is Nearly Identical To The Program That
Led To An SEC Halt And Fraud Charges In 2001at Seeking Alpha
(Tue, Sep 25)
STWA Oil Pipeline Efficiency Unit Arrives in China for Phase II
Testing Marketwire (Fri, Sep 14)
STWA Announces Appointment of Its CFO, Gregg Bigger, to the
Additional Role of President Marketwire (Thu, Sep 6)
STWA Begins Commercial Manufacturing of AOT 2.0Marketwire
(Thu, Aug 9)
PetroChina R&D Center Issues Plans for STWA's Oil Pipeline
Efficiency Technology Phase II Field Loop Testing Marketwire
(Tue, Aug 7)
STWA Ships Oil Pipeline Efficiency Unit to PetroChina CPP/CNPC for Phase II Testing Marketwire (Tue, Jul 31)
PetroChina CPP/CNPC Approves STWA Applied Oil Technology for Phase II Testing Marketwire (Fri, Jul 13)
Dr. Tao Presents Latest Findings on STWA Technologies at Global Scientific Conference Marketwire (Wed, Jul 11)
STWA Issues Newsletter Updating Investors on Technology, Regulatory Approvals and Pathway to Commercialization
Marketwire (Mon, Jul 9)
STWA Successfully Completes Lab Testing AOT in China & Schedules Field Test for August Marketwire (Thu, Jun 28)
STWA Begins Pipeline Product Certification Process With TDC and China Petroleum Pipeline Administration Marketwire
(Tue, Jun 12)
STWA Inc. (ZERO) quintupled in value from Q1 to Q3 ‘12
Commercial Pipeline Field Testing in China Confirms Laboratory Results of STWA's Oil Pipeline Efficiency Technology
Marketwire (Tue, Nov 13)
STWA in Proposal Talks With Multiple Companies Marketwire (Tue, Oct 2)
BUYINS.NET Updates STWA, Inc. SqueezeTrigger Report GlobeNewswire (Wed, Sep 26)
ZERO Has Strong Technology And An Achievable Business Plan at Seeking Alpha (Wed, Sep 26)
STWA Announces Results of Shareholder Meeting & Updates on
Further Technology & Commercial Progress Achieved Marketwire
(Tue, Sep 25)
ZERO's Current Scheme Is Nearly Identical To The Program That
Led To An SEC Halt And Fraud Charges In 2001at Seeking Alpha
(Tue, Sep 25)
STWA Oil Pipeline Efficiency Unit Arrives in China for Phase II
Testing Marketwire (Fri, Sep 14)
STWA Announces Appointment of Its CFO, Gregg Bigger, to the
Additional Role of President Marketwire (Thu, Sep 6)
STWA Begins Commercial Manufacturing of AOT 2.0Marketwire
(Thu, Aug 9)
PetroChina R&D Center Issues Plans for STWA's Oil Pipeline
Efficiency Technology Phase II Field Loop Testing Marketwire
(Tue, Aug 7)
STWA Ships Oil Pipeline Efficiency Unit to PetroChina CPP/CNPC for Phase II Testing Marketwire (Tue, Jul 31)
PetroChina CPP/CNPC Approves STWA Applied Oil Technology for Phase II Testing Marketwire (Fri, Jul 13)
Dr. Tao Presents Latest Findings on STWA Technologies at Global Scientific Conference Marketwire (Wed, Jul 11)
STWA Issues Newsletter Updating Investors on Technology, Regulatory Approvals and Pathway to Commercialization
Marketwire (Mon, Jul 9)
STWA Successfully Completes Lab Testing AOT in China & Schedules Field Test for August Marketwire (Thu, Jun 28)
STWA Begins Pipeline Product Certification Process With TDC and China Petroleum Pipeline Administration Marketwire
(Tue, Jun 12)
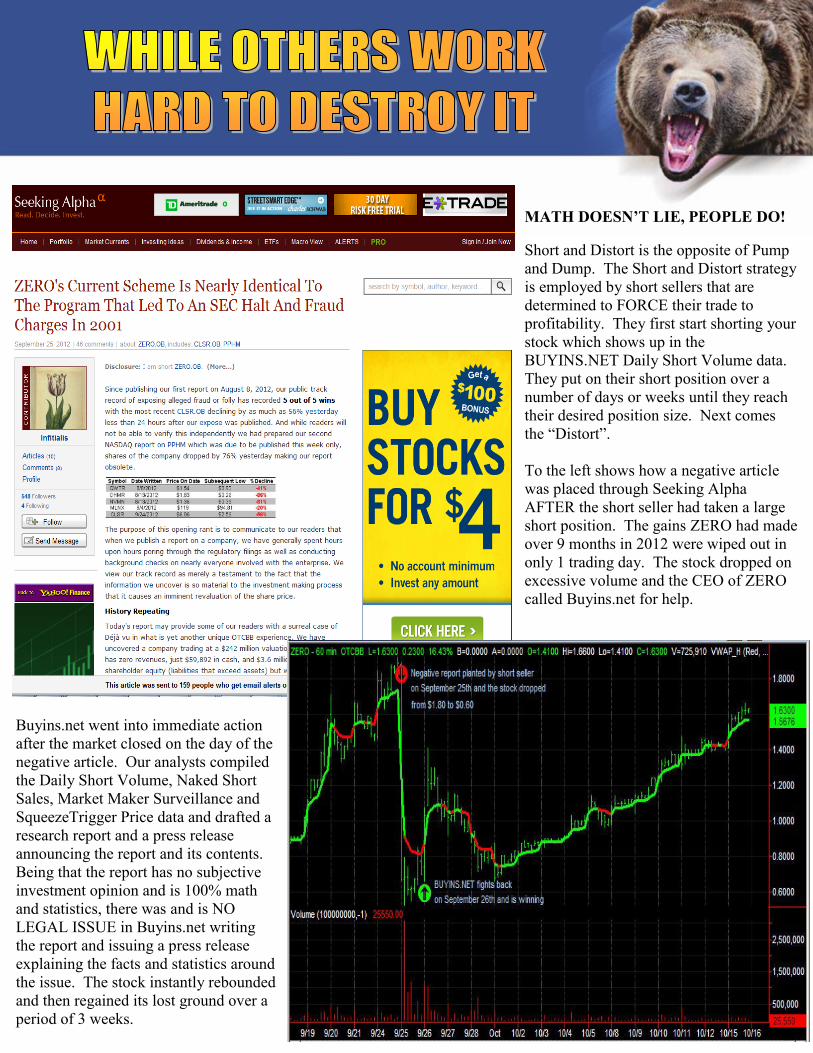
MATH DOESN’T LIE, PEOPLE DO!
Short and Distort is the opposite of Pump
and Dump. The Short and Distort strategy
is employed by short sellers that are
determined to FORCE their trade to
profitability. They first start shorting your
stock which shows up in the
BUYINS.NET Daily Short Volume data.
They put on their short position over a
number of days or weeks until they reach
their desired position size. Next comes
the “Distort”.
To the left shows how a negative article
was placed through Seeking Alpha
AFTER the short seller had taken a large
short position. The gains ZERO had made
over 9 months in 2012 were wiped out in
only 1 trading day. The stock dropped on
excessive volume and the CEO of ZERO
called Buyins.net for help.
Buyins.net went into immediate action
after the market closed on the day of the
negative article. Our analysts compiled
the Daily Short Volume, Naked Short
Sales, Market Maker Surveillance and
SqueezeTrigger Price data and drafted a
research report and a press release
announcing the report and its contents.
Being that the report has no subjective
investment opinion and is 100% math
and statistics, there was and is NO
LEGAL ISSUE in Buyins.net writing
the report and issuing a press release
explaining the facts and statistics around
the issue. The stock instantly rebounded
and then regained its lost ground over a
period of 3 weeks.

TRACKS DAILY SHORT PRICES & VOLUME
POWERFUL COMPUTERS ALERT THE INSTANT A SHORT SQUEEZE STARTS IN YOUR STOCK
Our data center aggregates data feeds from all 12 Trade
Reporting Facilities (Exchanges) in the United States. Every day
we monitor every trade, the type of trade (buy, sell, sell short),
the # of shares and the price at which the trade was executed.
We insert this data into a large relational database and run
proprietary algorithms that ACCURATELY describe what is
truly going on in your stock. For the first time in history, you
will know if your shareholders are selling or if the market maker
or short seller is trading against you.
Market Maker Surveillance Report. MCP, Winning Stocks With Lowest Price Friction For Friday, November 23rd 2012
Market Maker Surveillance Report. NOK, Highest Net Buy Volume With Lowest Price Friction For Friday,
Market Maker Surveillance Report. BAC, Highest Net Buy Volume With Lowest Price Friction For Friday,
Market Maker Surveillance Report. SIRI, Bullishly Biased Price Friction For Friday, November 23rd 2012
Market Maker Surveillance Report. CSX, Bullishly Biased Price Friction For Friday, November 23rd 2012
Market Maker Surveillance Report. SNE, Bearishly Biased Price Friction For Friday, November 23rd 2012
Market Maker Surveillance Report. MU, Bullishly Biased Price Friction For Friday, November 23rd 2012
Market Maker Surveillance Report. JNJ, Bearishly Biased Price Friction For Friday, November 23rd 2012
Market Maker Surveillance Report. SO, Bearishly Biased Price Friction For Friday, November 23rd 2012
Market Maker Surveillance Report. RDN, Bearishly Biased Price Friction For Friday, November 23rd 2012
Market Maker Surveillance Report. CSCO, Highest Net Buy Volume With Lowest Price Friction For Friday
Market Maker Surveillance Report. S, Highest Net Buy Volume With Lowest Price Friction For Friday, November 23rd
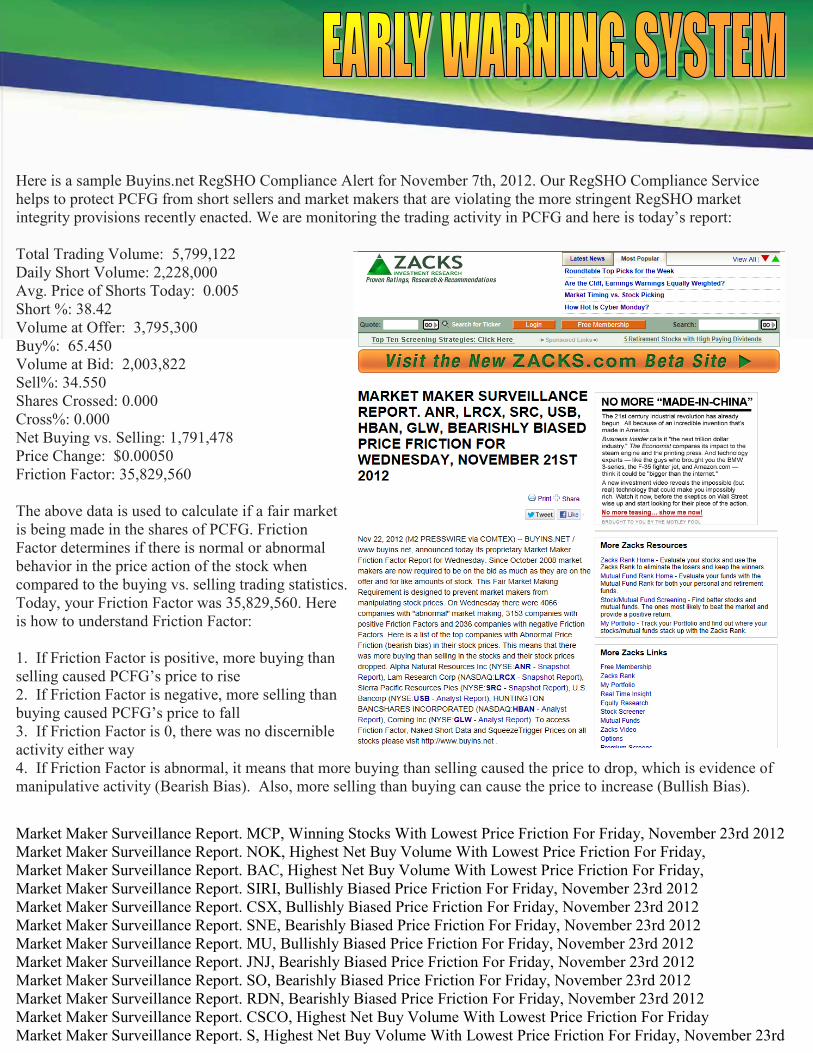
Here is a sample Buyins.net RegSHO Compliance Alert for November 7th, 2012. Our RegSHO Compliance Service
helps to protect PCFG from short sellers and market makers that are violating the more stringent RegSHO market
integrity provisions recently enacted. We are monitoring the trading activity in PCFG and here is today’s report:
Total Trading Volume: 5,799,122
Daily Short Volume: 2,228,000
Avg. Price of Shorts Today: 0.005
Short %: 38.42
Volume at Offer: 3,795,300
Buy%: 65.450
Volume at Bid: 2,003,822
Sell%: 34.550
Shares Crossed: 0.000
Cross%: 0.000
Net Buying vs. Selling: 1,791,478
Price Change: $0.00050
Friction Factor: 35,829,560
The above data is used to calculate if a fair market
is being made in the shares of PCFG. Friction
Factor determines if there is normal or abnormal
behavior in the price action of the stock when
compared to the buying vs. selling trading statistics.
Today, your Friction Factor was 35,829,560. Here
is how to understand Friction Factor:
1. If Friction Factor is positive, more buying than
selling caused PCFG’s price to rise
2. If Friction Factor is negative, more selling than
buying caused PCFG’s price to fall
3. If Friction Factor is 0, there was no discernible
activity either way
4. If Friction Factor is abnormal, it means that more buying than selling caused the price to drop, which is evidence of
manipulative activity (Bearish Bias). Also, more selling than buying can cause the price to increase (Bullish Bias).

BUYINS.NET previously partnered with former SEC Chairman to launch RegSHO.com back in 2008
Our firm pioneered the compiling of nightly Threshold Security Lists to highlight those stocks being naked shorted.

Regulation SHO requires bona-fide market-making
activities to include making purchases and sales in roughly
comparable amounts. The Commission has stated that bona-
fide market-making DOES NOT include activity that is
related to speculative selling strategies or investment
purposes of the broker-dealer and is disproportionate to the
usual market making patterns or practices of the broker-
dealer in that security. Likewise, where a market-maker
posts continually at or near the best offer, but does not also
post at or near the best bid, the market-maker's activities
would not generally qualify as bona-fide market-making.
Moreover, a market-maker that continually executes short
sales away from its posted quotes would generally not be
considered to be engaging in bona-fide market-making.
BUYINS.NET monitors your market-makers daily for
compliance with Fair Market-Making Requirements.
FRICTION FACTOR TECHNOLOGY MONITORS
MARKET MAKERS FOR REG SHO COMPLIANCE
DAILY NAKED SHORTS ARE TRACKED
WE TRACK EACH MARKET MAKER CLOSELY

The service protects companies
from BEAR RAIDS. Once the
short sellers and market makers
start to attack your stock and
drive the price down we report
illegal and manipulative trading
EACH DAY it occurs. FINRA,
SEC and the Whistleblowers
office will receive our
SUSPICIOUS ACTIVITY reports
automatically.
The Company will receive 12 in-
depth (monthly) reports with
correlated data and conclusions
along with 250 (daily) reports
showing exactly the number of
buys, sells, shorts, crosstrades and
market maker surveillance for
each day.
We provide the following data in our reports:
DAILY TOTAL SHARES SHORTED (volume and
price), which includes all shares shorted even by
exempt institutions such as market makers.
FAILURES TO DELIVER (naked shorts).
MARKET MAKER SHARE VOLUME (exposing
exactly how many shares are being traded and the
name of the market making firm traded through).
MARKET MAKER FRICTION FACTOR DATA
(showing whether or not a fair market is being made
in each trading day).
CUMULATIVE TOTAL SHARES SHORTED
data showing large short positions and the volume
weighted average price that a short squeeze will start.

We have spent the last 7 years
building a 750,000 retail investor
following and 35,000 institutional
investors. Through GlobeNewswire
we are approved for Yahoo Finance so
our reports show up in the news of the
stock symbol when we issue the press
release. Additionally, there are 1
million websites carrying our content.
When we issue reports 2 things
happen:
1. PEOPLE READ THEM
2. PEOPLE TRUST AND BELIEVE
IN WHAT WE ARE SAYING
The result is that your shareholders
and our readers understand the forces
that are driving down your stock and
can react to counter them.
Hence, when you look at the time and date
stamp on when our reports cross the
newswires and compare them to the trading
charts, there is no denying that we generate
enough buying interest to get the stock
moving. And when your stock crosses a
SqueezeTrigger Level, the shorts do 2 things:
1. THEY STOP SHORTING
2. THEY START COVERING
This creates an exponential effect of the
offers going away and the bids stepping up.
The result is clear:
YOUR STOCK PRICE FINALLY
ADHERES TO THE ECONOMIC LAW
OF SUPPLY AND DEMAND AND GOES
HIGHER WHEN THERE IS MORE
BUYING THAN SELLING!

When short sellers attack a stock they
first put their short position on and then
try to find reasons that will cause
existing shareholders to sell their
position along with attracting other
short sellers who will join in on the
bear raid. Shorts will use innuendo,
deflection and circumstantial findings
to attempt to persuade others into
hating your stock. Buyins.net has a
powerful answer to this.
Using powerful computers and
ingenious algorithms, we are able to
find the TRUE FORCES that are at
work in your stock and determine,
using math and statistics, what are the
highest probability outcomes in the
next 1-4 weeks of trading in your stock.
We release these findings in the form
of an ADDITIONAL RESEARCH
REPORT and help existing and new
investors see through the spin and bias
and make an informed trading decision!
We then identify ALL the
publicly known shareholders in
your stock. By accessing large
databases from Thomson Reuters,
we are able to identify the fund
name, contact name, email and
phone number of all of your
institutional investors and alert
them instantly when your stock is
under attack and what the true
story is, not the short story.
Because math doesn’t lie, we are
able to show your principal
shareholders what is happening,
why it is happening and what is
expected to happen in the very
near future through easy to
understand statistical analysis.
The charts on these pages show
exactly what we did for Netflix
(NFLX) using this method.

On April 19th, 2010 NFLX was trading around
$86.00 and our technology found that there was a
90% chance that NFLX would rally an average of
+10.3% between April 21st and May 6th due to
earnings that were pending release. Our Earnings
technology on the opposite page shows how over
the 11 previous earnings releases, NFLX had rallied
10 of out 11 times (90%) an average of 10.3% and
within 11 trading days after the event. No
gimmicks, no tricks, no guessing, no maybes. On
the one decline the stock dropped –3.1%. So the
target price for NFLX was $94.72 and AFTER the
company announces its earnings on April 21st.
We issued a press release (see above) over the
newswires on April 19th showing exactly what our
earnings technology had predicted. On April 21st
after the close, NFLX reported a 1.7 million
increases in subscribers and an increase in its
profitability (see report to the right).
On the morning of April 22nd the market reacted
positively to the NFLX earnings results. The stock
jumped +15.6% and went as high as $102.00 (see chart to
the left). Our Earnings technology accurately predicted
how NFLX would react to its earnings report and the
actual price exceeded the target price and instantly,
instead of over 11 trading days, making everyone
exponentially happier.
All of this happened while short sellers had been saying
since $20 per share that “NFLX was overvalued and
would drop at any time now…….”

SEC Approves Short
Selling Restrictions
The SEC recently adopted
an alternative uptick rule
that places certain
restrictions on short
selling when a stock is
experiencing significant
downward pressure. More
SEC Takes Steps to Curtail
Abusive Short Sales and
Increase Market Transparency
Reports, Studies
and Data
Fails to Deliver Data
Impact of Recent SHO Rule
Changes on Fails to Deliver
(April 25, 2011)
Impact of Recent SHO Rule
Changes on Fails to Deliver
(Nov. 4, 2009)
Analysis of Short Sale Price
Test Using Intraday Quote and
Trade Data
Analysis of Short Selling
Activity During Early Sept.
2008
Analysis of Short Sale Price
Restrictions Under Regulation
SHO Pilot Program
Final Rule: Amendments to Regulation
SHO (February 26, 2010)
Final Rule: Amendments to Regulation
SHO (July 27, 2009)
Final Rule: Amendments to Regulation
SHO (October 14, 2008)
Final Rule: Amendments to Regulation
SHO (October 14, 2008)
Final Rule: Amendments to Regulation
SHO (August 7, 2007)
Final Rule: Amendments to Regulation M
(August 6, 2007)
Final Rule: Amendments to Regulation
SHO and Rule 10a-1 (June 28, 2007)
Final Rule: Short Sales (July 28, 2004)
SEC Final Rulemakings
SEC Proposed Rulemakings
No-Action Letters
Small Entity Compliance
Guides:
Short Sale Price Test Restric-
tions
Amendment to Regulation
SHO to Adopt Rule 204
Amendment to Eliminate the
Options Market Maker Excep-
tion
Amendments to Exchange Act
Rules 203(b)(3) and 200(e)
Adoption of Naked Short Sell-
ing Antifraud Rule
Regulation M: Short Selling in
Connection with a Public Of-
fering
ARCHIVE of SEC Actions and
Information on Short Selling
Other Information
Assistance and information from a whistleblower
who knows of possible securities law violations
can be among the most powerful weapons in the
law enforcement arsenal of the Securities and
Exchange Commission. Through their knowledge
of the circumstances and individuals involved,
whistleblowers can help the Commission identify
possible fraud and other violations much earlier
than might otherwise have been possible. That
allows the Commission to minimize the harm to
investors, better preserve the integrity of the
United States' capital markets, and more swiftly
hold accountable those responsible for unlawful
conduct.
News

HERE IS A LAUNDRY LIST OF REG SHO VIOLATIONS
Mismarking a short sale as a long sale
Shorting stock without borrowing it
Market-Maker relying on exemption to short and not borrow
Reversion Conversions using options to falsely skirt RegSHO
Using options to “Reset” the # of days short to skirt Buyin
Shorting stock before a secondary offering and covering after
Kiting stock to a third party to skirt reporting or borrowing
Market-Makers allowing clients to piggyback on exemptions
“Assisting” a third party to circumvent buyins or locates
Brokers falsely reporting stock locates with no actual locate
Market-Maker employing speculative short selling strategy
Broker dealers, market makers, hedge funds and unscrupulous
traders have come up with a variety of ways to try to hide their
illegal and manipulative short selling activity. While the SEC has
rules on the books prohibiting the above referenced violations, the
government does not have the resources or technology to properly
monitor and alert when these complicated techniques are
employed. Buyins.net has reverse-engineered how these
violations occur and automated data collection to expose them!
HERE ARE LINKS TO SEC CASES / BRIEFS
TJM Brokerage http://www.sec.gov/litigation/admin/2009/34-
60440.pdf
Rhino and FTSG http://www.sec.gov/litigation/
admin/2009/34-60941.pdf
Options Express http://www.sec.gov/litigation/admin/2012/33
-9313.pdf
Wolfson Brothers http://www.sec.gov/litigation/
admin/2012/34-66283.pdf
HCM http://www.sec.gov/litigation/admin/2009/34-60441.pdf
GAS http://www.sec.gov/litigation/admin/2011/34-65941.pdf
Goldman Sachs http://www.sec.gov/litigation/admin/2010/34-
62025.pdf
UBS http://www.sec.gov/litigation/admin/2011/34-65733.pdf

TOTAL DAILY SHORT VOLUME MONTHLY TOTAL SHORT INTEREST
DAILY FAIR MARKET MAKING COMPLIANCE
Tom Ronk of Buyins.net
began lobbying for new
short selling rules as far
back as 1996. After nearly
17 years we have created
the most sophisticated
combination of legislation,
data collection, data
analysis, surveillance,
research, reporting,
automation and predictive
capability available in the
markets. In many cases,
we are the ONLY entity
that has compiled the data
you are seeing on these
pages. Combined, this
information is the first line
of defense against attacking
short sellers.

DAILY MARKET MAKER SHARE VOLUME
DAILY FAILURE TO DELIVER DATA BORROWABLE SHARES OUT ON LOAN
Buyins.net is an expert at triangulating all available data surrounding short selling, market-making, back office stock
loans and broker dealer compliance with borrow and close-out requirements pertaining to Regulation SHO.
Additionally, we use both civil and government case history to analyze and the expose the different ways rule offenders
attempt to hide, circumvent or blatantly disregard regulations governing short selling and fair market-making.

HOW IT WORKS. WOPR is a distributed computing system that has hundreds of data feeds (economic, weather,
geopolitical, interest rates, energy, equities, currencies, commodities, etc.) feeding into a relational database that searches
for patterns and determines how a trading instrument has behaved both before and after specific events have taken place in
the past. Only about 25% of stocks display patterns at any given time and only about 1% of stocks exhibit all the
necessary conditions on any given day to make a trade. That means that out of 14,000 stocks, only about 140 trades are
high probability trades that our system would generate a research report on and disseminate the information to clients.
This process eliminates the noise and only tells you which stocks have multiple strategies lining up at the same time, in
the same direction, with no conflicting predictions and the fundamental valuation is in-line with the prediction!
WOPR currently has 12 viewing panes and can be accessed at http://www.wopronline.com. WOPR Online is a visual
display of the actual decision making process taking place in order for stocks to be selected from 14,000 stocks, 10
different strategies and hundreds of datafeeds. The machine is doing millions of calculations and determining which
stocks fit the exact conditions for a trade to take place. When this massive filtering process generates a trade, it feeds that
trade into THE MATRIX. The Matrix is our trading tool that can be accessed at http://www.wealthmakers.com. Read
on and we will show you exactly how to tame this tiger of a research & trading technology!

SEASONALITY GATEARNINGS
SEASONALITY PATTERN
SCANNER
GATS GATS
The chart above shows the actual predictions WOPR
made that made it into the Matrix and resulted in 10
different EBAY Market Reads over the past 12 months.
The reads were ALL LONG and were as follows:
2 PatternScanner, 2 Seasonality, 1 Earnings, 5 GATS
EBAY made its way from $27 to nearly $45 , an $18
per share gain or +66% in just 1 year!
Market Read reports gave investors using our
technology the confidence to stay long EBAY even
though the market was experiencing wide fluctuations
and spooking many investors out of trades and taking
losses. Market Reads stayed the course in EBAY and
steered investors to phenomenal profits while
weathering the market storm!

EARNINGS Most stock price histories show random or unpredictable movements around earnings reports. But some
repeat the same pattern quarter after quarter, year after year. Earnings predicts probability, price move and length of
move before and after all US stock earnings reports.
FRICTION FACTOR Friction Factor is based on the relationship between the price of a stock and the volume at
which it's bought and sold. Normal and abnormal Friction factor patterns can help you time your buying and selling
decisions for maximum earnings potential.
GATS The Global Automated Trading System (GATS) combines neural networks and genetic algorithms to reduce
investment risks. GATS selects the highest probability trades in stocks, bonds, options, commodities, currencies and
private equities, delivering precise, predictive and profitable data.
GROUP SECTOR Certain institutions can exert buying or selling pressure over
an entire industry group, pushing prices higher. Group Sector identifies stocks that
most closely match their group's movement and generate powerful group
consensus trading signals to help you profit from the herd mentality.
PATTERN SCANNER describes the current technical situation in your stock. It
displays the technicals, trend conditions and seasonal factors and automatically
discovers how that stock has performed in the trading days following the
occurrences of the event or combination of events. This technology automatically
scans using complex historical queries based on what event is taking place right
now in the stock. It then displays the probability, expected return and number of
trading days for the expected move.
EVENTS This technology automatically tracks "Trigger Events" that positively
or negatively affect the value of a stock — or its perceived value among analysts — ranging from price fluctuations to
natural disasters and political shifts. The results reveal patterns that can predict market movements.
RegSHO NAKED SHORTS SEC Regulation SHO mandates that if a clearing agent holds a fail-to-deliver position
for 13 consecutive settlement days, it must purchase securities to close out its position, a.k.a. a forced cover.
WealthMakers aggregates data from NYSE, AMEX, NASDAQ, OTCBB and PINKSHEETS to track stocks that are
about to have forced covers.
SEASONALITY Seasonality analyzes more than 20 years of data to determine if stocks have a long or short seasonal
bias, how many trading days the move is expected to last, the probability of that move and the percentage move the
stock is expected to make based on the seasonal bias.
SQUEEZETRIGGER Our proprietary database of more than 3,500,000,000 short sale transactions allows us to
calculate the exact price at which the total short interest is short in each stock. Squeeze Trigger Alerts let you know
exactly when a short squeeze will start and how to trade profitably.
VALUATION A stock's value is a function of its forecasted earnings per share and forecasted earnings growth, as
well as profitability, interest and inflation rates. Valuation use these metrics to determine at what price a stock is
undervalued or overvalued, so that you can make investment decisions accordingly.
INSIDER Significant stock sales or purchases by company "insiders" (officers or directors) can be a predictor of
future price movements, up or down. The Insider strategy tracks these actions and correlates them with historical data
to give you an investment edge.

WealthMakers Market Reads are dynamically
generated 8-10 page research reports that
visually display the specific strategies that are
firing simultaneously to empower you to make a
trading decision RIGHT NOW! Each strategy is
described and specific time windows, percentage
moves and probabilities are explained. Market
Reads give investors concise, logical and
compelling arguments that are easily
understandable and result in the confidence
necessary to MAKE THE TRADE!
EBAY is just one example!
On July 17, 2012 EBAY showed up as a trade in
The Matrix. The Market Read research report to
the right was generated and clients were advised
that EBAY had a high probability of going from
$38.83 to $43.31, had a short squeeze underway
(SqueezeTrigger) and was undervalued
compared to its $50.17 fundamental valuation.
The chart below shows what happened next.
Two days later the stock hit an intraday high of
$44.44! A gain of +14.4% in only two trading
days. Market Reads are a must read!
Knowing what is going to happen BEFORE it happens
is the name of the game on Wall Street. The combined
power of WOPR, The Matrix and Market Read
Research Reports give investors the necessary
confidence to TAKE THE TRADE before the big move
happens! Click here to view the entire EBAY Market
Read:
http://www.buyins.com/reports/ebay7-17-12.pdf

Knowing what your competition is doing and how it effects their market cap is vital to the long term consistent growth of
your company. Our valuation monitor watches the stocks in your industry group, what they are doing strategically, what
valuation the market places on each company and compares it to your company giving you incredible valuable insight
into what Wall Street values and why.

Our technology helps your company time when to buyback
stock, when to price options, entry and exit points for insider
buys and sells and provides a legitimate basis for these
transactions during non-blackout periods. Being able to
substantiate why a decision was made and when, using math and
statistics, not subjective opinion, not only protects the company
and its board, management and insiders, but provides a
compelling financial value proposition as well. The two charts
below show how insider sales (above) and purchases (below) can
affect the stock price over the ensuing 6 month period.

We have built the only Wall Street Ecosystem by automating the communication of our data, research and services
through email, press releases, Facebook and Twitter posts. Each player on Wall Street has a slightly different
motivation, and understanding that motivation is key to creating value to you and your public company:
Mom & Pop Retail: they are upset at Wall Street and want fair profitable advice
Daytrader: they want short term highly profitable trade setups
Stockbroker: want to gather assets under management and put people in mutual funds
RIA: want to gather assets under management and diversify in funds and stock trading
Institution: want to make long term investments in individual stocks (low turnover)
Hedge Funds: want to make as much money as they can and will trade a lot (higher turnover)
Proprietary Trade Desks: want to make money safe, quickly and consistently (market makers)
Insiders: want to time their buybacks, stock options (grants & exercising) and stock purchases / sales.
Executing Broker: simply execute trades for hedge funds using algos (VWAP, dark pools etc.)
Journalist / Reporter: like to write stories that know something that no one else knows

Our Facebook presence has 7,425 fans with a
network of 4,346,378 friends of fans who see our
research. This was accomplished in a few short
months. Our technology integrates with your
Facebook page and auto-posts our research to
your Facebook account and increases awareness
to your existing “fans” and gives you access to
our network of 4.34 million friends of fans. This
is done through an innovative technique we
develop to sync your Facebook page to your
Twitter account and then allowing us to auto-post
our research to your Twitter account, which in-
turn shows up as a post in your Facebook
account. Facebook does not currently have an
open API that allows this so we had to develop
the technology through Twitter that enabled us to
automate to your Facebook page.
Our Twitter presence has 5,827 followers in just
a few months. By auto-posting our research to
your Twitter account, this enhances the
awareness of the data and research that
Buyins.net issues on your company. We
believe that when people see the pure math and
statistics of what is going on in your stock along
with high probability predictions based on
proven strategies, your existing shareholders
will be more comfortable owning your stock
and new investors will be more confident as to
the timing and value of their investment in your
company. Giving people vision where they
have previously been blind creates the
transparency needed to build trust and
confidence with old and new shareholders alike.

Once you have become a client we will
ask you for a SYMBOL USE
AUTHORIZATION EMAIL. This
allows us to include your stock symbol
in press releases we issue announcing
initiation coverage, updated coverage,
or special alerts pertaining to short
selling or other regulatory issues.
GlobeNewswire is owned by NASDAQ
and we are an approved news provider.
Our research will show up under your
stock symbol on thousands of news and
financial websites within the
GlobeNewswire network. More
specifically, Yahoo Finance has over
120 million visitors and our stories will
show up on Yahoo Finance under your
stock symbol.
The graphic to the left shows the
approximately 24 million retail
investor accounts at their
respective online broker dealers.
These investors are mostly self-
directed and rely on third party
research to make their investment
decisions. The importance of
engaging our firm to publicly
announce both our short sale data
promoting market integrity and
our statistical research showing
10 additional proven strategies
cannot be understated. There are
14,000 stocks in the US and
investors need to be guided in a
fair and informative way that
provides guidance based on hard
statistical facts. We offer this!
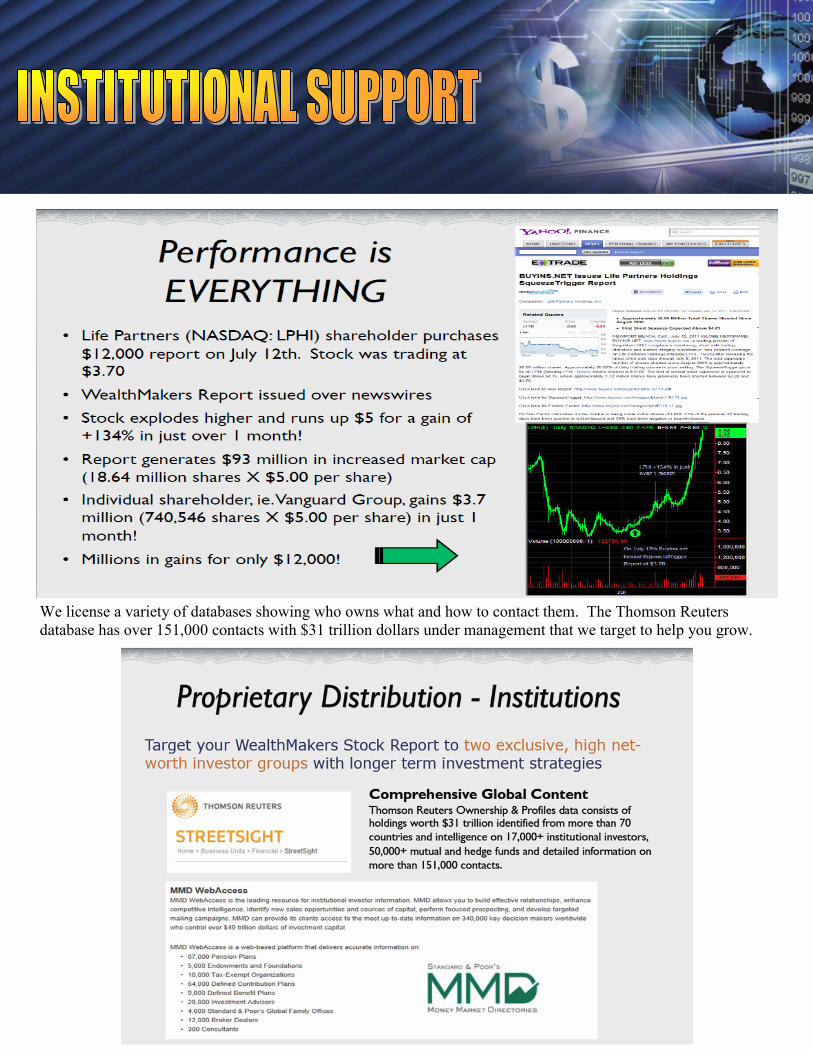
We license a variety of databases showing who owns what and how to contact them. The Thomson Reuters
database has over 151,000 contacts with $31 trillion dollars under management that we target to help you grow.

Since 2005 Buyins.net has issued
approximately 30,000 press releases
over the newswires and over 100,000
predictions on more than 12,000 US
stocks. The purpose of this very
public manner of communicating is to
promote transparency, market
integrity, timely and effective
research and overall peace of mind
that the market, the companies that
trade therein and the investors that
risk their hard earned money are
playing on a level playing field. We
have found that in many cases this is
simply not true. So our mission is to
identify manipulation, expose it
publicly, provide unbiased research
and give all players the same chance
to profit. The data, technologies,
strategies and communication
provided by our firm are unique and
unparalleled in their scope and
design.
Our military-style computer uses
parallel processing, genetic algorithms,
neural networks and unbridled
computing power to analyze exactly
what event ( technicals, fundamentals,
earnings, seasonality, short squeeze,
group rotation, chart patterns, insider
buying/selling and multiple other
factors) will move each stock, in which
direction, to what % degree, in the
specific amount of time and with what
degree of probability. Based on IBMs
work on Deep Blue (now called
"Watson"), this powerful database
technology matched with hundreds of
data feeds and the ability to find
patterns, that humans cannot, has the
ability to do the work of hundreds or
thousands of analysts without getting
tired (24 hours a day, 7 days a week).

Odyssey Marine Exploration Inc (NASDAQ:OMEX), Up By 8.59% ($0.22) After BUYINS.NET SqueezeTrigger Report
Released on Friday, November 23rd 2012 at a Price of $2.514.
Amarin Corp PLC (NASDAQ:AMRN), Up By 8.92% ($0.94) After BUYINS.NET SqueezeTrigger Report Released on
Wednesday, November 21st 2012 at a Price of $10.540.
Omeros Corp (NASDAQ:OMER), Up By 27.88% ($1.99) After BUYINS.NET SqueezeTrigger Report Released on
Wednesday, November 21st 2012 at a Price of $7.124.
Entremed Inc (NASDAQ:ENMD), Up By 11.61% ($0.16) After BUYINS.NET SqueezeTrigger Report Released on
Monday, November 19th 2012 at a Price of $1.335.
OLD NATIONAL BANCORP (INDIANA) (NYSE:ONB),
Up By 5.59% ($0.63) After BUYINS.NET SqueezeTrigger
Report Released on Monday, November 19th 2012 at a
Price of $11.194.
UNIVERSAL FOREST PRODUCTS INCORPORATED
(NASDAQ:UFPI), Up By 6.21% ($2.10) After
BUYINS.NET SqueezeTrigger Report Released on
Monday, November 19th 2012 at a Price of $33.877.
Big 5 Sporting Goods Corp (NASDAQ:BGFV), Up By
6.88% ($0.88) After BUYINS.NET SqueezeTrigger Report
Released on Monday, November 19th 2012 at a Price of
$12.856.
ACADIA Pharmaceuticals Inc (NASDAQ:ACAD), Up
By 16.80% ($0.33) After BUYINS.NET SqueezeTrigger
Report Released on Monday, November 19th 2012 at a
Price of $1.952.
Good Times Restaurants Inc (NASDAQ:GTIM), Up By 9.72% ($0.23) After BUYINS.NET SqueezeTrigger Report
Released on Monday, November 19th 2012 at a Price of $2.397.
Sucampo Pharmaceuticals Inc (NASDAQ:SCMP), Up By 6.15% ($0.28) After BUYINS.NET SqueezeTrigger Report
Released on Monday, November 19th 2012 at a Price of $4.522.
AMERISTAR CASINOS, INC. (NASDAQ:ASCA), Up By 14.24% ($2.48) After BUYINS.NET SqueezeTrigger Report
Released on Friday, November 16th 2012 at a Price of $17.410.
UMH Properties Inc (AMEX:UMH), Up By 21.48% ($2.05) After BUYINS.NET SqueezeTrigger Report Released on
Friday, November 16th 2012 at a Price of $9.549.
Ellie Mae Inc (NYSE:ELLI), Up By 7.01% ($1.54) After BUYINS.NET SqueezeTrigger Report Released on Friday,
November 16th 2012 at a Price of $21.969.
WESTPORT INNOVATIONS INC (NASDAQ:WPRT), Up By 5.13% ($1.36) After BUYINS.NET SqueezeTrigger
Report Released on Tuesday, November 13th 2012 at a Price of $26.530.

The demand for quality institutional and personal financial planning
advice is growing exponentially as the need for counsel on the complexity
of financial security increases. Globalization of financial markets and
greater reliance on the individual investor to make their own investment
decisions drives the need for sophisticated research delivered on a mass
scale. Currently, half of all U.S. households and one in three individuals
own shares of publicly traded stock or stock mutual funds. 56.9 million
U.S. households hold equities in their investment portfolios. The number
of households owning equities has increased more than three-fold since
the early 1980s, compared with a 35 percent increase in the overall
number of households in the United States. The faster growth in the
number of equity investors has led to a significant increase in the
percentage of U.S. households owning equities. (Securities Industry
Association and Investment Company Institute).
The institutional investor has a large investment in their respective
company. There are over 14,000 publicly traded companies in the US and
comprising over $20 trillion in total market capitalization. Buyins.net
offers a product to protect companies and their shareholders and increase
trust and confidence in public market investing. We leverage new and
exclusive technologies to meet the demand for investment advice that’s
growing exponentially as the world of investment options and path to
financial security become increasingly fraught with risk and complexity.
The United States Securities Industry employs almost
800,000 people nationwide. Buyins.net is positioned
to assist the securities professional by putting the
power of information in the hands of its members.
We are a technology facilitator, providing the
conduit through which clients can communicate with
their brokerages and vice versa. For member
brokerage clients, Buyins.net provides a variety of
data products and services to help members research
every aspect of the equities markets and provide a
unique proprietary trading advantage using artificial
intelligence and an advanced data analytics platform
previously available only to large institutional
accounts. The technology, algorithms, data and
research are exclusive and innovative in their ability
to cut through the clutter on Wall Street and provide
consistent quality information that yields the greatest
value based on unique insights.

The vacuum created by the Wall Street meltdown of 2008 and
disappearance of many of the major players in research,
trading and investment banking has created a rare opportunity
for Buyins.net to provide a full suite of Wall Street services
that empower public companies and their institutional and
individual investors to invest with confidence.
Business Ecosystem -“An economic community supported by
a foundation of interacting organizations and individuals—the
organisms of the business world. The economic community
produces goods and services of value to customers, who are
themselves members of the ecosystem. The member
organisms also include suppliers, lead producers, competitors,
and other stakeholders. Over time, they co-evolve their
capabilities and roles, and tend to align themselves with the
directions set by one or more central companies. Those
companies holding leadership roles may change over time,
but the function of ecosystem leader is valued by the
community because it enables members to move toward
shared visions to align their investments, and to find mutually supportive roles.”
The power of an ECOSYSTEM is just now being understood. Apple Computer has built an ecosystem between the iMac,
iPhone, iPod, iTunes, iCloud, iPad, iTV etc. The different components interact with each other (syncing) and the users of
these components can relate to each other (due to the brand) and can interact with each other (due to the technology).
This has created the most valuable company in the world and the concept of “ecosystem” is new. Buyins.net has built one
of the only ecosystems on Wall Street.
We provide unbiased statistical stock market predictions
to empower investors and securities professionals to
make precise, predictive and profitable trading
decisions. The unparalleled technology, trading
algorithms and proprietary data generate confident
predictions, with clear and concise objectives resulting
in unique and innovative research reports that move
markets and create exponential returns to our clients.
The information provided here is intended to be general
in nature and should not be construed as investment
advice. This information is subject to change at any time
based on market and other conditions and should not be
construed as a recommendation to buy or sell any
specific security. Past performance is not indicative of
future results.

Related Documents