C O N T E N T S 4.1 INTRODUCTION 4.2 OVERVIEW 4.3 SKIN 4.3.1 Well Geometry (S geometry ) 4.3.2 Completion Skin (S comp ) 4.3.3 Production Skins (S production ) 4.4 THE FORMATION DAMAGE SKIN 4.5 SOURCES OF FORMATION DAMAGE 4.5.1 Formation Damage: Drilling Operations 4.5.1.1 Formation Damage Mechanisms During Drilling 4.5.1.2 Fluid Loss 4.5.1.2.1 Clay Chemistry 4.5.1.3 Filter-Cake Formation 4.5.1.4 Invasion Profile 4.5.2 Formation Damage During Cementing 4.5.3 Formation Damage During Perforating 4.5.4 Formation Damage During Production 4.5.4.1 Sources of Formation Damage - Fines Movement 4.5.4.2 Sources of Formation Damage - Completion and Workover Fluids 4.5.4.3 Sources of Formation Damage - Scale 4.5.4.3.1 Inorganic Scales 4.5.4.3.2 Organic Scale 4.5.4.4 Sources of Formation Damage - Bacteria 4.5.4.5 Sources of Formation Damage - Pressure Reduction 4.5.4.6 Sources of Formation Damage - Stimulation 4.5.4.7 Sources of Formation Damage - Water Injection 4.6 FORMATION DAMAGE DURING WORKOVER OPERATIONS 4.6.1 Workover Fluid Quality Guidelines to Minimise Formation Damage 4.6.2 Workover Techniques to Minimise Formation Damage 4.6.3 Recognition of the Pressure of Formation Damage 4.7 FURTHER READING 4.8 APPENDIX A 4 Formation Damage 4

Welcome message from author
This document is posted to help you gain knowledge. Please leave a comment to let me know what you think about it! Share it to your friends and learn new things together.
Transcript

C O N T E N T S
4.1 INTRODUCTION4.2 OVERVIEW4.3 SKIN
4.3.1 Well Geometry (Sgeometry
)4.3.2 Completion Skin (S
comp)
4.3.3 Production Skins (Sproduction
)4.4 THE FORMATION DAMAGE SKIN4.5 SOURCES OF FORMATION DAMAGE
4.5.1 Formation Damage: Drilling Operations4.5.1.1 Formation Damage Mechanisms During
Drilling4.5.1.2 Fluid Loss4.5.1.2.1 Clay Chemistry4.5.1.3 Filter-Cake Formation4.5.1.4 Invasion Profile4.5.2 Formation Damage During Cementing4.5.3 Formation Damage During Perforating4.5.4 Formation Damage During Production4.5.4.1 Sources of Formation Damage - Fines
Movement4.5.4.2 Sources of Formation Damage -
Completion and Workover Fluids4.5.4.3 Sources of Formation Damage - Scale4.5.4.3.1 Inorganic Scales4.5.4.3.2 Organic Scale4.5.4.4 Sources of Formation Damage - Bacteria4.5.4.5 Sources of Formation Damage - Pressure
Reduction4.5.4.6 Sources of Formation Damage -
Stimulation4.5.4.7 Sources of Formation Damage - Water
Injection4.6 FORMATION DAMAGE DURING
WORKOVER OPERATIONS4.6.1 Workover Fluid Quality Guidelines to
Minimise Formation Damage4.6.2 Workover Techniques to Minimise
Formation Damage4.6.3 Recognition of the Pressure of Formation
Damage4.7 FURTHER READING4.8 APPENDIX A
4Formation Damage4

1
2
LEARNING OBJECTIVES:
Having worked through this chapter the student will be able to:
• Explain when and how formation damage contributes to poor well performance.
• Identify the crucial near wellbore area susceptible to formation damage.
• Calculate the cost of formation damage (in terms of lost production).
• Identify the major sources of formation damage.
• Select appropriate remedial treatments.
• Calculate the impact of drilling and completion formation damage (depth andextent of impairment).
• Discuss the causes of production related formation damage.
• Identify the types of scale encountered in well operations and the variables whicheffect the severity of the problem.
• Explain how scale inhibitors are used.
• State the scope, underlying cause and remedial action required to deal with a waxdeposition problem.
• State the scope, underlying cause and remedial action required to deal with anasphaltene deposition problem.
• State the scope, underlying cause and remedial action required to deal withperforating damage.
• Provide guidelines for minimising formation damage during workover operations.
• Indicate how the pressure of formation damage can be identified in a production orinjection well.

Department of Petroleum Engineering, Heriot-Watt University 3
4Formation Damage4
4.1 INTRODUCTION
The Reservoir Engineering module discussed how the highest pressure drops areexperienced in the near wellbore regions due to the semi logarithmic nature of thepressure-distance relationships of the fluid inflow equations. The critical parameterdetermining well productivity is thus the condition of the near wellbore region. Anychanges from the original formation permeability are characterised by the “skin”value, introduced by Van Everdingen and Hurst (see Reservoir Inflow Module), adimensionless number mathematically analogous to the film transfer coefficient inheat transfer.
Formation Damage concerns the formation of a volume of rock with a reducedpermeability in the near wellbore zone. This permeability reduction can be due to amultitude of causes - but in all cases it will reduce the “natural” productivity due tothe imposition of an extra pressure drop as the fluid flows to the wellbore. This chapterwill begin with a discussion of the sources, extent and the modelling of formationdamage. It will continue with a more detailed examination of the mechanisms leadingto Drilling and Production induced formation damage; followed by a review oftechniques which can lead to its avoidance.
Modules 5 and 6 will discuss well stimulation treatments. Stimulation treatments aredesigned to increase the well productivity, either by:
(i) reducing or completely removing the formation damage by a chemical matrixtreatment (chapter 5) or
(ii) bypassing the formation damage by creation of a high permeability channel bya hydraulic fracturing treatment (chapter 6) or deep penetration perforationguns.
4.2 OVERVIEW
The potential for the permeability of the near wellbore formation being reduced(damaged) exists from the moment that the drillbit enters the formation until the wellis finally abandoned. Processes which lead to formation damage typically act througha restriction of flow (on a pore throat scale) due to either:
(i) physical blockage or reduction in size of the pore throat
(ii) reduction in the relative (oil) permeability e.g. due to (adverse) formationwettability changes, phase changes in the producing fluids.
(iii) the above effects can be accentuated at high flow rate when turbulent flows mayoccur - leading to much greater pressure losses than occurred for the same flowrate before the formation damage took place.
Formation damage can result from many different sources - drilling, cementing,perforating, completion/gravel packing, production, injection, workover, stimula-tion, etc. These effects will all be discussed in greater detail later. However, first weneed to quantify the skin concept referred to earlier and to evaluate its impact on well inflow.

1
4
4.3 SKIN
The value of the Total Well skin (Stotal
) measured during a production test has manysources other than formation damage. It is very important to be able to identify theformation damage component (S
d), since this can be reduced by better operational
practices or, possibly, be removed or bypassed by a stimulation treatment.
The total well skin is a composite parameter:S
total= S
damage + S
geometry + S
completion + S
production
Typical sources of the latter three skin components are described below. They all havea common cause – a disturbance of the fluid flow streamlines normal to the well.
4.3.1 Well Geometry (Sgeometry
)The well geometry skin reflects geometrical considerations which alter the skin valueform due to the well design. These include:
i) limited entry - well not perforated across the complete reservoir height and/orwell not fully penetrating the reservoir;
ii) well not placed in the centre of the drainage boundary
The above factors always lead to a positive skin - reduced well productivity.
iii) the well is slanted through the formation - deviated wells with their longerexposure to the producing formation show an increasing well productivity(negative skin) as the well deviation increases.
4.3.2 Completion Skin (Scomp
)
(i) The perforations may be insufficient (e.g. low perforation density, too short ortoo narrow shape, incorrect phasing leading to flow convergence or deviationfrom the normal flow lines etc.) and impede flow from reservoir into well.Further, the perforating process results in a crushed (lower permeability) zonearound the perforation which, if not removed, results in a reduced flow rate (seechapter 8.5.3). The inflow into a perforated completion is normally less thatthe (theoretical) inflow to the (unimpaired) open hole originally drilled, i.e.there is a positive skin. However, a high density of long/wide perforations canresult in a sufficient increase in the inflow that a negative skin results. Theinteraction between the various skin components is also important e.g. theperforation design, i.e. the depth of the perforations compared to the depth ofany (near wellbore) formation damage will determine if the formation damagewill effect well productivity. This will be discussed in greater detail later in thischapter.
(ii) Gravel Packing - in which the perforation and part of the wellbore is packedwith a high permeability gravel, frequently leads to positive well skins (seechapter 7) sand control.

Department of Petroleum Engineering, Heriot-Watt University 5
4Formation Damage4
(iii) Fractures - either naturally occurring or (artificially) created propped hydraulicfractures - will lead to increased inflow and negative skins by placing a highpermeability pathway from deep in the formation to the wellbore. Gravelpacking and fracturing can be combined in the “Frac and Pack” process to yieldcompletions with effective sand control and near zero skins.
4.3.3 Production Skins (Sproduction
)Two examples of production skins are:
(i) A rate dependent skin is often observed in high rate gas wells (and very highrate oil wells). This is due to non-Darcy or turbulent flow. Its presence can bea useful indication that the well is a potential stimulation candidate.
(ii) Producing an oil well with:
(a) a flowing bottom hole pressure below the bubble point (presence of gas) or;
(b) a retrograde condensate fluid so that there is two phase region at theperforations. These can both lead to pressure dependent, relativepermeability effects (an apparent increase in skin or a lower thanexpected increase in production as the drawdown is increased). Thepresence of the extra phase reduces the effective permeability to the majorphase. This would normally be interpreted as positive skin.
4.4 THE FORMATION DAMAGE SKIN
Most forms of formation damage reduce the rock permeability to a certain depth awayfrom the well. Figure 1 illustrates the resulting producing pressure profile andcompares it with the equivalent pressure profile for an undamaged well. The resultingextra pressure drop (∆P
d) has to be compensated for either by a reduced pressure drop
across the choke or by a smaller production rate. Figure 2. shows that the pressure dropof the near wellbore zone is only one component of the reservoir-to-stock tank flowsystem.
Ideal Pressure Profile(Undamaged)
Actual Pressure Profile(Damaged) (kd < k)∆Pd
∆Pd
P2
P3
Prkd k
rw rd re- Extra pressure drop due to Formation Damage
ReservoirDamaged
ZoneWellboreCentreline
Figure 1
The effect of skin on well
inflow pressure profiles

1
6
Well Boundary
Pwellhead Pseparator
re
Kd
Pr
P1
P2
P3
P1 = -ve SkinFlowing bottom hole pressure
P2 = Zero SkinP3 = +ve Skin
Gas
GASOil to Tank
Skin (Zone of damaged
permeability)
Reservoir
Choke
Reservoir
Permeability(K)
The need to understand the processes that lead to formation damage, and the othercomponents that make up the total, is illustrated in figure 3 which compares theaverage well skin from several North Sea fields. They were all drilled at around thesame time and some wells in each field were drilled with oil based mud (OBM) andothers with water based mud (WBM) drilling muds. It is clear that the field averagewell skin value is variable between fields. Further, it is consistently lower when oilbased mud is used as a drilling fluid in preference to water based mud. However, itis unclear whether the above values for oil based mud are optimum or whether theycould be further reduced.
1 2 3 4 5 6
> 30 > 50
30
20
10
0
4
WBM OBM
Ave
rage
Wel
l Ski
n
Field
This need to determine whether the optimum skin value has been achieved isaddressed by the Hawkins Equation, this calculates the formation damage skin(S
damage) resulting from a cylinder of reduced permeability around the wellbore:
S damage = = -1 ln ∆Pd2πkh
qµ rwkd
rdk(1)
Figure 3
Average well skin values
for some North Sea fields
Figure 2
The natural flow producing
system

Department of Petroleum Engineering, Heriot-Watt University 7
4Formation Damage4
The parameters are defined in figures 1 and 2 and in addition:
h =formation heightq =fluid flow rateµ =fluid viscosity
Equation [1] shows that the formation damage skin increases as the permeabilitydamage ratio (k/k
d) increases or the radius of damage (r
d) increases. This is illustrated
in figure 4. Thus if the formation permeability is reduced to 10% of its original value(k/k
d = 10) out to a radius of 30 cm, then the formation damage skin (S
d) is equal to 10.
k/kd = 20
k/kd = 10
k/kd = 5
k/kd = 2
Wellbore
60
50
40
30
20
10
00 0.15 0.30 0.45 0.60 0.75 0.90 1.05 1.20 1.35 1.50
rd, Radius of Damage (Meters)
Ski
n (S
dam
age)
0 2 4 6 8 10 12 14 16 18 20 22 24
1000
100
10
1
0.1
0.01
Radius of Damaged Zone Beyond Wellbore, ft
Pro
duct
ion
Rat
e, b
bl/d
ay
kd = 50md
kd = 10md
kd = 1md
Permeability of undamaged resrervoir = 100 mdFormation thickness 10ft.Wellbore radius 0.25ft. Drainage radius 500ft.Oil viscosity 0.5 cpDrawdown 536 psi
Effect of Formation Damage on Well Production
The results of Radial inflow calculations using the above typical, permeabilitydamage ratios are found in figure 5. Well production is rapidly reduced as formationdamage increases, with the damage in the very near wellbore region (first few feet)being the most important.
Figure 4
Skin factor increases with a
larger damage radius and
damage ratio k/kd
Figure 5
Effect of formation damage
on well production

1
8
The impact of this formation damage skin is most conveniently expressed, from theproduction point of view, in terms of the Flow Efficiency (FE).
100qdamageqideal
100{ln(re/rw) + S ideal}{ln(re/rw) + S total}
F E(%) = = (2)
where Sideal
= Stotal
- Sdamage
. i.e. Sideal
contains all skin contributions apart fromformation damage and {q
ideal and
q
damage} are the corresponding production rates.
This relationship between flow efficiency and skin is pictured as figure 6. The impacton the well production of the damage skin of 10, calculated in the example discussedearlier, reduces production to only 40% from what it would have been in the case theformation damage was absent.
1 5 10 15 20 25 30 50 100 1000
90
80
70
60
50
40
30
20
10
0
Skin (S damage)
Flo
w E
ffici
ency
(%
)
Such reductions in flow efficiency will reduce the well’s production - delaying projectpayback as well as reducing Net Present Value profitability (figure 7). Further, theextra pressure losses in the near wellbore area (Figure 2) mean that artificial lift willhave to be installed earlier in order to keep the well on production. This will increasethe wells operating cost.
Undamaged Well
Damaged Well
Undamaged Well
Damaged Well
Wel
l Pro
duct
ion
Pro
ject
Net
P
rese
nt V
alue
Time
Time
Positive
Negative
Deferred production and reduced project value result
from formation damage
Figure 6
Flow efficiency decreases
with increasing formation
damage skin
Figure 7
Formation damage:
Production and profitability

Department of Petroleum Engineering, Heriot-Watt University 9
4Formation Damage4
4.5 SOURCES OF FORMATION DAMAGE
Formation damage can occur throughout the life of the well from the moment that thedrill bit first penetrates the formation. All well activities need to be evaluated for theirpotential for causing formation damage. They include:
• Drilling
• Cementing
• Perforating
• Completion/Gravel Packing
• Production
• Injection
• Workover
• Stimulation
The aim of the Production Technologist is to achieve an initial flow efficiency of100% and to maintain it at this level during the life of the well this is achieved byensuring that proper operation practices and procedures are implemented duringnormal well operations as well as during the drilling and workover campaigns. Someof these sources of formation damage will be discussed in the following sections.
4.5.1 Formation Damage: Drilling Operations(Most) drilling fluids are made up from particulate materials e.g. clays, weightingagents etc., as well as containing drill cuttings. Unless the well is drilled in anunderbalance condition; the pressure (over) balance, required between the drillingfluid and the reservoir pressure to keep the well under control, will result in these mudparticulates being forced into the formation. The pay zone will thus be progressivelyfilled and a filter cake will be formed on the surface of the wellbore. These particulatesolids will not easily flow back into the wellbore when the pressure gradient isreversed (i.e. the or well is placed on production). Formation damage has thus beencreated.
Prior to entering the formation, the drilling fluid should be chosen so as to reduce thetotal drilling cost (this normally implies fast drilling). Once the pay zone has beenpenetrated, maximising the well productivity becomes the key criteria, even at theexpense of slower drilling. The solid particulates in the drilling mud should be chosento have a suitable size so as to form a filter cake on the borehole wall. Typicalrelationships between drilling fluid type, cost and the risk of Formation Damage areshown in figure 8.

1
10
OBM
KCI/Polymer WBM
Seawater/Polymer WBM
Fresh Water/Gel WBM
Risk of Damage
Cos
t
High
HighLow
Low
WBM - Water Based Mud OBM - Oil Based Mud
The permeability of both this filter cake and the formation influence the rate at whichthe drilling mud filtrate invades the formation. This rate of invasion may be calculatedfrom the radial flow equations with a low permeability zone(the mud cake) placed nextto the wellbore. The results are illustrated in figure 9.
1000010001001010.1
Filter C
ake C
ontrol
1E-06 1E-05 0.0001
0.00001
0.0001
0.001
0.001
0.01
0.01
0.1
0.1
1
1
10
10
100
100
Inva
sion
Rat
e (b
bls/
ft/hr
)
Filter Cake Permeability (mD)
Formation Permeability (mD)
Formation Permeability Control
This figure shows two regions:
(i) when the filter cake has a much lower permeability than the formation. Theinvasion rate is described as being under filter cake control.
(ii) the horizontal portion for each formation permeability indicates the zone inwhich the formation permeability has become the dominant factor in controlling the leak off rate. This occurs as the permeability of the filter cake increasesrelative to that of the formation.
Figure 8
Typical relationships
between mud type, cost and
risk of formation damage
formation damage
Figure 9
Formation damage filter
cake control
Department of Petroleum Engineering, Heriot-Watt University 11
4Formation Damage4
The properties (permeability and thickness) of the mudcake are dependent on the typeof drilling mud in use as well as on the drilling parameters and the quality of the mudengineering e.g.
• is the drill solids build up being controlled at a low value?
• are the mud properties being re-adjusted to their correct values?
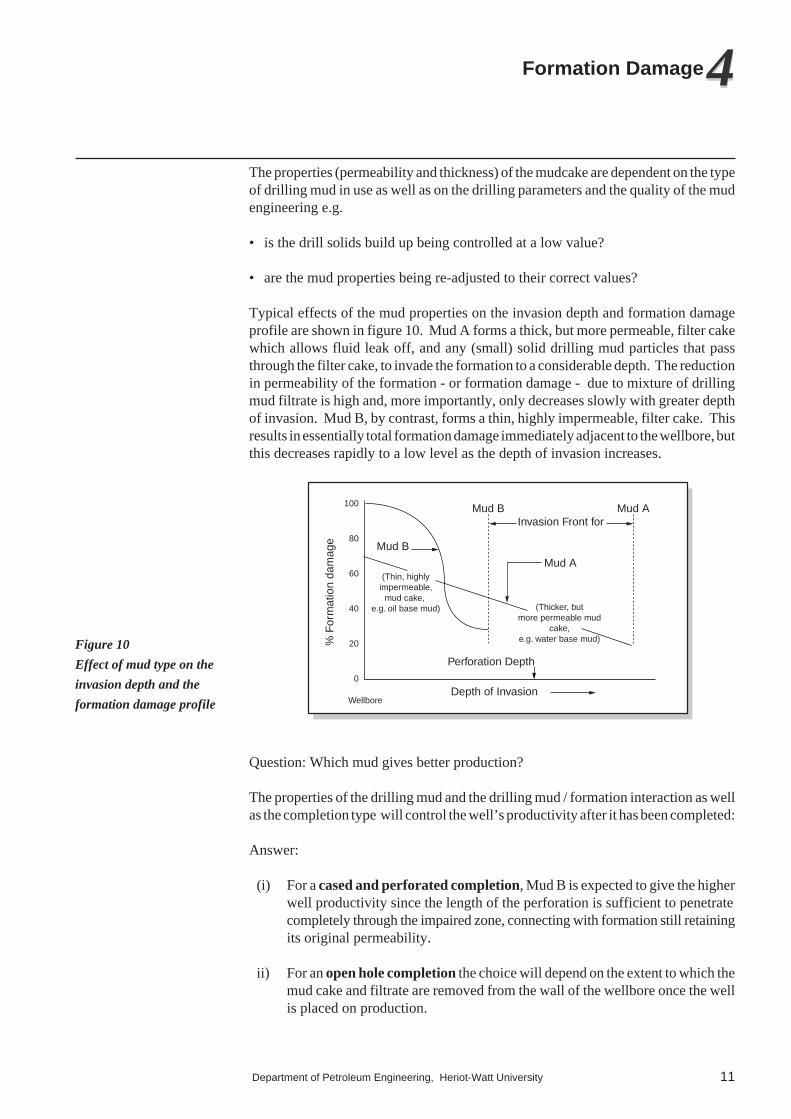
Typical effects of the mud properties on the invasion depth and formation damageprofile are shown in figure 10. Mud A forms a thick, but more permeable, filter cakewhich allows fluid leak off, and any (small) solid drilling mud particles that passthrough the filter cake, to invade the formation to a considerable depth. The reductionin permeability of the formation - or formation damage - due to mixture of drillingmud filtrate is high and, more importantly, only decreases slowly with greater depthof invasion. Mud B, by contrast, forms a thin, highly impermeable, filter cake. Thisresults in essentially total formation damage immediately adjacent to the wellbore, butthis decreases rapidly to a low level as the depth of invasion increases.
100
80
60
40
20
0
Depth of Invasion
% F
orm
atio
n da
mag
e
Mud A
Mud B
Mud AMud BInvasion Front for
Perforation Depth
(Thin, highlyimpermeable,
mud cake, e.g. oil base mud)
Wellbore
(Thicker, butmore permeable mud
cake,e.g. water base mud)
Question: Which mud gives better production?
The properties of the drilling mud and the drilling mud / formation interaction as wellas the completion type will control the well’s productivity after it has been completed:
Answer:
(i) For a cased and perforated completion, Mud B is expected to give the higherwell productivity since the length of the perforation is sufficient to penetratecompletely through the impaired zone, connecting with formation still retainingits original permeability.
ii) For an open hole completion the choice will depend on the extent to which themud cake and filtrate are removed from the wall of the wellbore once the wellis placed on production.
Figure 10
Effect of mud type on the
invasion depth and the
formation damage profile

1
12
ii) For completions in carbonate formations, the cheapest drilling fluid is oftenused since the formation damage can often be easily removed or bypassed bypumping hydrochloric acid to stimulate the well.
N.B. this is only true when the acid is placed over the completion length, i.e. so thatthe acid contacts all the perforations and removes the formation damage from everyperforation.
Many factors, apart from the properties of the drilling fluid, control the depth to whichformation damage can occur.
(i) Formation properties - an increased depth of drill fluid invasion is oftenobserved when a larger pore-size - or higher permeability - formation is beingdrilled due to reduced efficiency of filter cake formation. In fact, highlyimpairing losses of whole mud (i.e. no filter cake formation) can be observedonce the formation permeability is 1 Darcy or greater (depending on thedetailed pore geometry), unless special fluid loss control additives (basically,larger particles to promote filter cake formation) are added to the drilling fluid.
(ii) Open hole time - fluid loss is a continuous process - the longer the open holeis exposed to the drilling mud, the greater the invasion depth. This implies thatthere is a greater risk of impairment for that part of the formation drilled firstcompared to the formations drilled later on. This is particularly important forlong horizontal wells where completion intervals greater than 1000 m are notuncommon.
(iii) Overbalance - fluid loss/invasion depth increases as the difference in pressurebetween the drilling mud and the reservoir pressure (overbalance) increases.Under balance drilling and completion techniques now being used to drillwells so as to avoid this type of formation damage.
(iv) Borehole Dynamics will have a large effect on the fluid loss
(a) Large (long and/or wide diameter) Bottom Hole Assemblies e.g.stabilisers and the carrying out of many round trips e.g. to change thedrill bit or adjust the directional drilling assembly will result in thefrequent scraping of the mud cake. Extra fluid loss will result as themud cake is restored to its equilibrium thickness.
(b) High circulation rates will increase the dynamic overbalance while thehigh fluid velocities will erode the mud cake.The thinner mud cake andthe greater overbalance will both result in increased fluid leak off.
The relative fluid loss rates associated with the various phases of the drilling processare illustrated in figure 11. The corresponding, relative volumes for each phase arealso shown. The relationship between depth of invasion and fluid leak off volume maybe quantified by a simple volumetric calculation as shown in Table 8.1. The tableshows that large volumes of fluid have to be lost to achieve substantial depths ofinvasion in reasonable porous formations.

Department of Petroleum Engineering, Heriot-Watt University 13
4Formation Damage4
4
15
2
1
3
2
4
3
5
Spurt lossat bit faceas freshformation exposed
Near bitturbulent flowfluid loss
Fluid loss oppositestabilizers
Fluid loss while drillingopposite drill pipe
Static filtration whiletripping drill pipe
Fluid loss volume
30 sec 6 min 1 hr 1day 3 days 20 days
Flu
id lo
ss r
ate
(log
scal
e)
Time
10 14 1822 24
184 257 331 405 442
47 66 85
105 114
13 18 23 28 31
0.76 1.06 1.37 1.59 1.75
0.27 0.37 0.48 0.54 0.63
0.04 0.05 0.060.080.09
Leak Off Volume (m3)
3cm 15cm 30cm 150cm 300cm 600cm
Porosity (φ,%)
Depth of Invasion (r)
Wellbore radius (rw) = 10.8cm, Perforated interval (h) = 20.5m
Leak-off Volume = πφh {(rw + r)2 - r
w2} (3)
4.5.1.1 Formation Damage Mechanisms During Drilling
4.5.1.2 Fluid Loss
The mechanisms by which the drilling mud filtrate that leaks off through the filter cakeinto the formation include:
(i) increasing the water saturation in the near wellbore area (reduces the relativepermeability to oil) (figure 12). This is particularly important for low permeability rocks where the removal of the “extra” water saturation may take a longtime, i.e. well “clean up” may take many months. In fact, it may not provepossible to initiate production in a reasonable time if the well drawdown is notsufficient since the (relative) permeability of the hydrocarbon phase hasbecome so low.
Table 1
Leak Off Volume and
Depth of Invasion
Figure 11
Fluid loss during the
drilling process

1
14
(ii) in a gas reservoir the addition of a (third) oil phase to the already existing gas/water phases will reduce the relative permeability to gas (figure 13).
������������������������������������������������������������������������������������������������������������������������
yyyyyyyyyyyyyyyyyyyyyyyyyyyyyyyyyyyyyyyyyyyyyyyyyyyyyyyyyyyyyyyyyyyyyyyyyyyyyyyyyyyyyyyyyyyyyyyyyyyyyyyyyyyyyyyyyyyyyyyy
���������
yyyyyyyyy
���������
yyyyyyyyy
������������������������������������������������������������������������������������������������������������������������
yyyyyyyyyyyyyyyyyyyyyyyyyyyyyyyyyyyyyyyyyyyyyyyyyyyyyyyyyyyyyyyyyyyyyyyyyyyyyyyyyyyyyyyyyyyyyyyyyyyyyyyyyyyyyyyyyyyyyyyy
������yyyyyy
������yyyyyy
Continuous Oil
Connate Water
���������
yyyyyyyyy
�y
������������������������������������������������������������������������������������������������������������������������
yyyyyyyyyyyyyyyyyyyyyyyyyyyyyyyyyyyyyyyyyyyyyyyyyyyyyyyyyyyyyyyyyyyyyyyyyyyyyyyyyyyyyyyyyyyyyyyyyyyyyyyyyyyyyyyyyyyyyyyy
���������
yyyyyyyyy
���������
yyyyyyyyy
������������������������������������������������������������������������������������������������������������������������
yyyyyyyyyyyyyyyyyyyyyyyyyyyyyyyyyyyyyyyyyyyyyyyyyyyyyyyyyyyyyyyyyyyyyyyyyyyyyyyyyyyyyyyyyyyyyyyyyyyyyyyyyyyyyyyyyyyyyyyy
������yyyyyy
������yyyyyyInvaded Filtrate
Before Damage After Damage
Clay Particles Sand Grains Quartz Cement Oil Droplet
Oil
������������������������������������������������������������������������������������������������������������������������
yyyyyyyyyyyyyyyyyyyyyyyyyyyyyyyyyyyyyyyyyyyyyyyyyyyyyyyyyyyyyyyyyyyyyyyyyyyyyyyyyyyyyyyyyyyyyyyyyyyyyyyyyyyyyyyyyyyyyyyy
���������
yyyyyyyyy
���������
yyyyyyyyy
������������������������������������������������������������������������������������������������������������������������
yyyyyyyyyyyyyyyyyyyyyyyyyyyyyyyyyyyyyyyyyyyyyyyyyyyyyyyyyyyyyyyyyyyyyyyyyyyyyyyyyyyyyyyyyyyyyyyyyyyyyyyyyyyyyyyyyyyyyyyy
���������
yyyyyyyyy
���������
yyyyyyyyy
Easy Flow of Gas
���������
yyyyyyyyy
�y
������������������������������������������������������������������������������������������������������������������������
yyyyyyyyyyyyyyyyyyyyyyyyyyyyyyyyyyyyyyyyyyyyyyyyyyyyyyyyyyyyyyyyyyyyyyyyyyyyyyyyyyyyyyyyyyyyyyyyyyyyyyyyyyyyyyyyyyyyyyyy
���������
yyyyyyyyy
���������
yyyyyyyyy
������������������������������������������������������������������������������������������������������������������������
yyyyyyyyyyyyyyyyyyyyyyyyyyyyyyyyyyyyyyyyyyyyyyyyyyyyyyyyyyyyyyyyyyyyyyyyyyyyyyyyyyyyyyyyyyyyyyyyyyyyyyyyyyyyyyyyyyyyyyyy
���������
yyyyyyyyy
���������
yyyyyyyyy
Connate Water Oil Droplet From Oil Based Mud
Before Damage After Damage
Clay Particles Sand Grains Quartz Cement Oil Droplet Gas
Connate Water
Gas Flow Impeded
(iii) surfactants present in the drilling fluid may change the formation wettabilities(oil relative permeability is lower in an oil wet formation than in a water wetone). Further, extraction of the surfactants present in the mud filtrate, e.g. froman invert oil emulsion mud; may cause the generation of a viscous water - in -oil emulsion present in the formation (figure 14).
Figure 12
Formation impairment due
to water block
Figure 13
Addition of third phase
reduces gas flow

Department of Petroleum Engineering, Heriot-Watt University 15
4Formation Damage4
Continuous Oil
Connate Water Invaded Filtrate
Before Damage After Damage
Clay Particles Sand Grains Quartz Cement Oil Droplet
Viscous Oil - In Water Emulsion
(iv) the connate water and the mud filtrate or injection fluid may be incompatible,resulting in precipitates being formed. Such precipitates will reduce thepermeability of the near wellbore formation. Similarly, polymers dissolved inthe mud filtrate may absorb on the formation surfaces, restricting the area opento flow (figure 15).
����������yyyyyyyyyy
����������yyyyyyyyyy�����
�����yyyyyyyyyy
����������yyyyyyyyyy
Before Damage After Damage
(Large) Polymer Molecule
4.5.1.2.1 Clay Chemistry(i) the filtrate may react with the minerals which make up the formation rock. This
interaction may express itself in terms of (clay) particle migration (or mobilisation). These mobilised clay particles can then block the pore throats, leadingto permeability reduction through internal filter cake formation (figure 16).
����������yyyyyyyyyy
����������yyyyyyyyyy
������������yyyyyyyyyyyy
������������yyyyyyyyyyyy
Before Damage After Damage
Bridging and Blocking of PoreThroats
Flow Flow
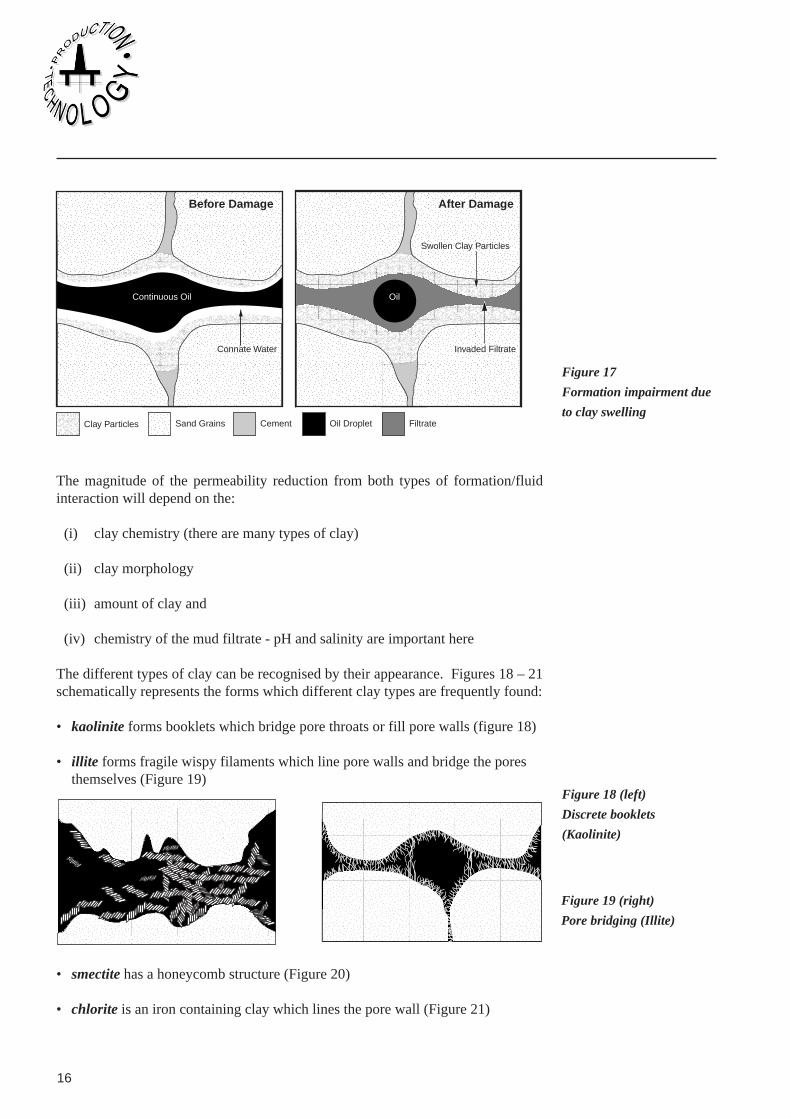
(ii) A second form of interaction is clay swelling in which water is absorbedbetween the clay particle layers (figure 17). This clay particle expansion leadsto a reduction in overall rock permeability. The magnitude of this permeabilityreduction will depend on the clay morphology e.g. the effect will often be smallif the clay particles are situated on the walls of the pore bodies; but will be muchgreater if they are present in the pore throats where small dimensional changescan significantly effect the flow.
Figure 14
Formation impairment due
to water-in-oil emulsion
Figure 15
Formation impairment due
to polymer absorption
Figure 16
Formation impairment due
to fines migration
1
16
Clay Particles Sand Grains Cement Oil Droplet Filtrate
Continuous Oil Oil
Connate Water
Swollen Clay Particles
Invaded Filtrate
Before Damage After Damage
The magnitude of the permeability reduction from both types of formation/fluidinteraction will depend on the:
(i) clay chemistry (there are many types of clay)
(ii) clay morphology
(iii) amount of clay and
(iv) chemistry of the mud filtrate - pH and salinity are important here
The different types of clay can be recognised by their appearance. Figures 18 – 21schematically represents the forms which different clay types are frequently found:
• kaolinite forms booklets which bridge pore throats or fill pore walls (figure 18)
• illite forms fragile wispy filaments which line pore walls and bridge the poresthemselves (Figure 19)
������������yyyyyyyyyyyy
������������yyyyyyyyyyyy
����������yyyyyyyyyy
���������
yyyyyyyyy
���������
yyyyyyyyy
• smectite has a honeycomb structure (Figure 20)
• chlorite is an iron containing clay which lines the pore wall (Figure 21)
Figure 17
Formation impairment due
to clay swelling
Figure 18 (left)
Discrete booklets
(Kaolinite)
Figure 19 (right)
Pore bridging (Illite)

Department of Petroleum Engineering, Heriot-Watt University 17
4Formation Damage4
������������������
yyyyyyyyyyyyyyyyyy
����������yyyyyyyyyy
For most formations, drilling and completion fluids formulated from 3% wt potassiumchloride (KCl) are effective in minimising formation/fluid interactions.
4.5.1.3 Filter-Cake FormationThe ideal drilling mud will form a thin, impermeable mud-cake resulting in a limitedfluid leak-off. Hence, a well designed drilling fluid, on exposure of a fresh rocksurface during the drilling process, rapidly forms an external filter cake on thewellbore surface. This is achieved by the larger particles being “strained out” fromthe drilling mud at an exposed pore throat. This filter cake initially has a largerpermeability - since it is made up of the larger particles - which is subsequentlyreduced as progressively smaller particles are retained. Experiments have shown thatthe particles in the drilling mud can form such external filter cakes (figure 22a) whenthe diameter of the pore throat to be bridged is not more than 3 times the typical drillingmud particle diameter. Special arrangements are required when drilling largergeological features, e.g. fractures, so as to promote filter cake formation and preventuncontrolled losses of large volumes of drilling mud.
Pore
Pore
Pore
Formation
Formation
Formation
External or surface filter cake (large particles)
Adherence to pore surface
Pore plugging or internal filter cake (smaller particles)
Good
Bad
(a)
(b)
(c)
Figure 20 (left)
Grain coating (Smectite)
Figure 21 (right)
Pore lining (Chlorite)
Figure 22
Filter cake formation
1
18
Figure 22 (b and c) illustrates what happens when an external filter cake is not formed- the mud particles can now invade the pores themselves. They may either adhere tothe surface of the pore walls (figure 22b). This depends on the fluid velocity and thesurface properties of the particles and the pore walls. If the particles do not adhere tothe pore walls they can continue to an internal pore throat where blocking may nowoccur (figure 22c). It can be easily imagined that regaining the original permeabilityrequires removal of such an internal filter cake, a difficult process.
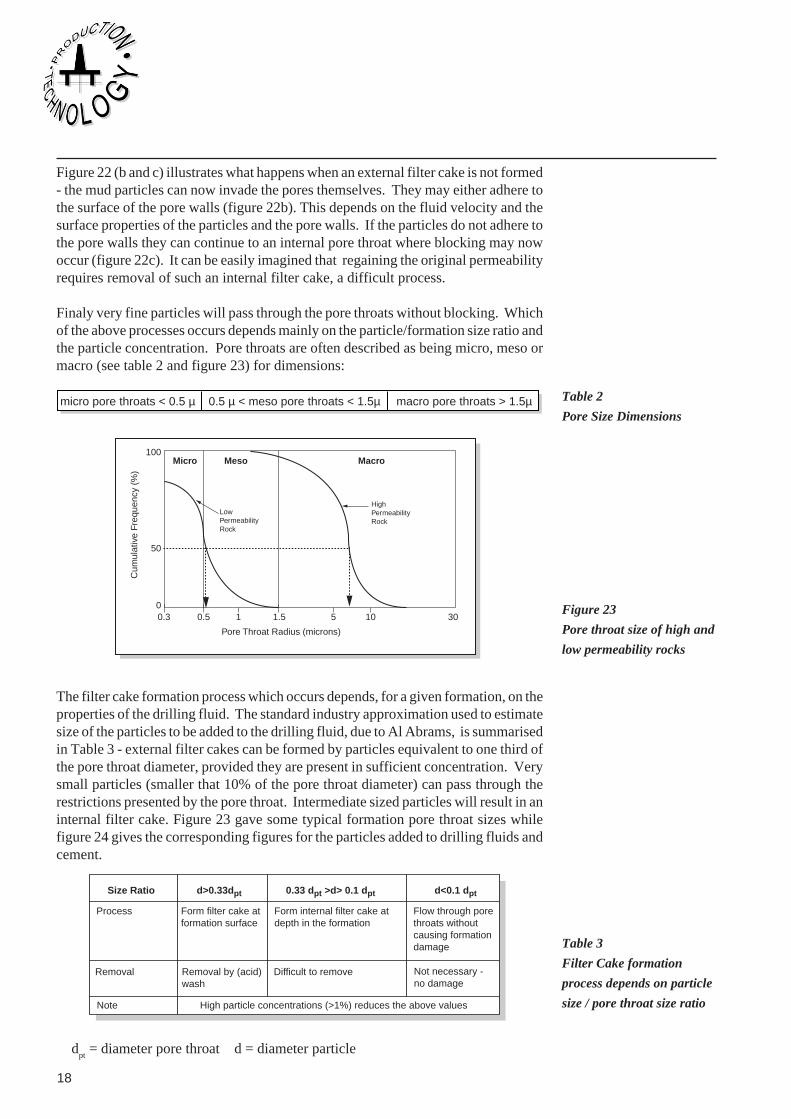
Finaly very fine particles will pass through the pore throats without blocking. Whichof the above processes occurs depends mainly on the particle/formation size ratio andthe particle concentration. Pore throats are often described as being micro, meso ormacro (see table 2 and figure 23) for dimensions:
micro pore throats < 0.5 µ 0.5 µ < meso pore throats < 1.5µ macro pore throats > 1.5µ
Micro Meso Macro
High Permeability Rock
LowPermeability Rock
0.30
50
100
0.5 1 1.5 5 10 30
Pore Throat Radius (microns)
Cum
ulat
ive
Freq
uenc
y (%
)
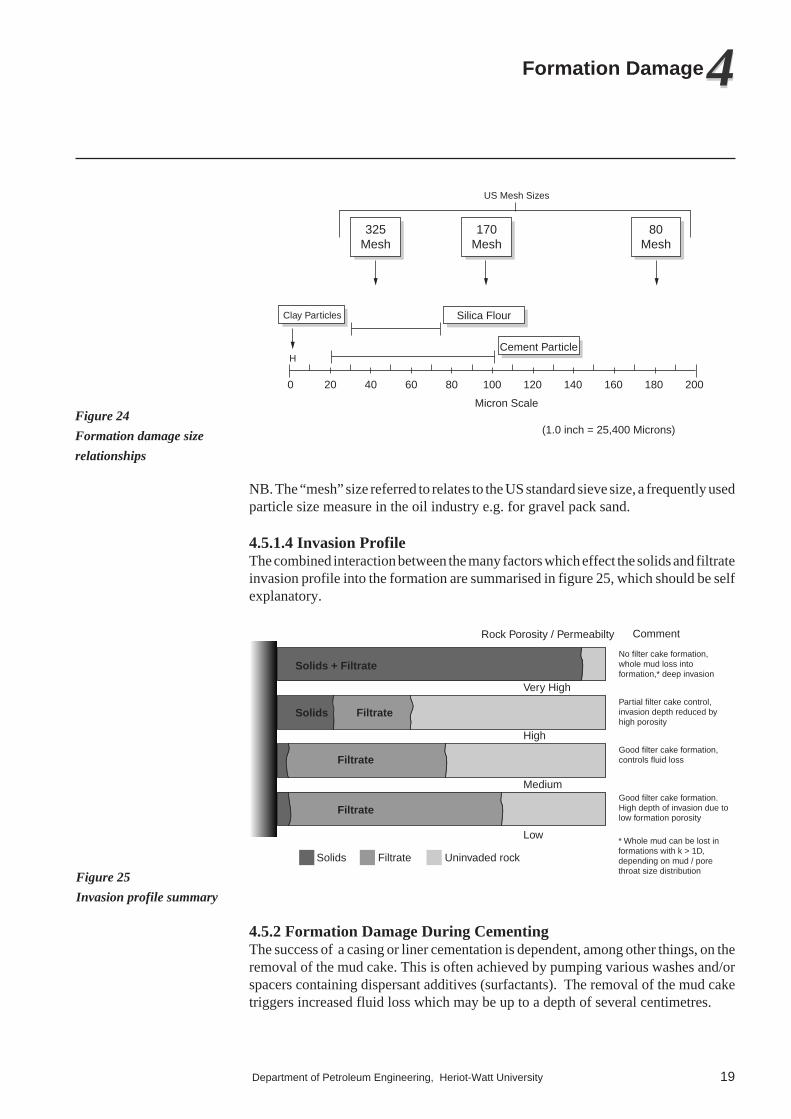
The filter cake formation process which occurs depends, for a given formation, on theproperties of the drilling fluid. The standard industry approximation used to estimatesize of the particles to be added to the drilling fluid, due to Al Abrams, is summarisedin Table 3 - external filter cakes can be formed by particles equivalent to one third ofthe pore throat diameter, provided they are present in sufficient concentration. Verysmall particles (smaller that 10% of the pore throat diameter) can pass through therestrictions presented by the pore throat. Intermediate sized particles will result in aninternal filter cake. Figure 23 gave some typical formation pore throat sizes whilefigure 24 gives the corresponding figures for the particles added to drilling fluids andcement.
Size Ratio d>0.33dpt 0.33 dpt >d> 0.1 dpt d<0.1 dpt
Flow through pore throats without causing formation damage
Form internal filter cake at depth in the formation
Removal by (acid) wash
Form filter cake at formation surface
Process
Note High particle concentrations (>1%) reduces the above values
Not necessary - no damage
Removal Difficult to remove
dpt = diameter pore throat d = diameter particle
Table 2
Pore Size Dimensions
Figure 23
Pore throat size of high and
low permeability rocks
Table 3
Filter Cake formation
process depends on particle
size / pore throat size ratio
Department of Petroleum Engineering, Heriot-Watt University 19
4Formation Damage4
Clay Particles
325Mesh
170Mesh
80Mesh
Silica Flour
Micron Scale
(1.0 inch = 25,400 Microns)
Cement Particle
0 20 40 60 80 100 120 140 160 180 200
H
US Mesh Sizes
NB. The “mesh” size referred to relates to the US standard sieve size, a frequently usedparticle size measure in the oil industry e.g. for gravel pack sand.
4.5.1.4 Invasion ProfileThe combined interaction between the many factors which effect the solids and filtrateinvasion profile into the formation are summarised in figure 25, which should be selfexplanatory.
Comment
No filter cake formation,whole mud loss into formation,* deep invasion
Partial filter cake control,invasion depth reduced byhigh porosity
Good filter cake formation,controls fluid loss
Good filter cake formation.High depth of invasion due to low formation porosity
* Whole mud can be lost in formations with k > 1D,depending on mud / pore throat size distribution
Very High
Rock Porosity / Permeabilty
High
FiltrateSolids
Solids + Filtrate
Medium
Low
Solids Filtrate Uninvaded rock
Filtrate
Filtrate
4.5.2 Formation Damage During CementingThe success of a casing or liner cementation is dependent, among other things, on theremoval of the mud cake. This is often achieved by pumping various washes and/orspacers containing dispersant additives (surfactants). The removal of the mud caketriggers increased fluid loss which may be up to a depth of several centimetres.
Figure 24
Formation damage size
relationships
Figure 25
Invasion profile summary

1
20
Filtrate lost from a cement slurry is highly reactive to any formation clays due to itshighly alkaline (high pH) nature. It also has a high concentration of calcium cationswhich can lead to precipitation of calcium carbonate, calcium hydroxide (lime) orcalcium silicate. Further, cement slurries have a very high natural fluid loss unlesscontrolled by suitable additives. Proper fluid loss control is a necessity since excessivedehydration of the slurry will lead to failure of the cement job; the slurry becoming tooviscous to pump stopping displacement of the cement with some of it remaining in thecasing itself. Thus, despite the damaging nature of the cement fluid loss, it is notnormally a problem since the filtrate volume (and depth of invasion) is limited and canbe bypassed by the perforations.
The effect of drilling an over gauge hole on the perforating efficiency is of muchgreater concern. This is illustrated in figure 26 where the power of the perforating gunwas sufficient for the vertical perforations to penetrate the cement sheath. It wasinsufficiently powerful to penetrate the cement sheath in the horizontal direction. Notonly has money been wasted to make these “perforations”: but more importantly thewell productivity will be reduced since the density of perforations will be only half thedesign value. Further, the remaining perforations will contact less formation than inthe ideal case. On-gauge drilling of the pay zone can avoid this problem (figure 26).
Ineffective Perforation;(Does not penetrate to the formation)
Enlarged Hole
Cement
Steel Liner
Effective Perforation;Penetrates the cementsheath (and formation damage?)
Formation
On-Guage HoleDrill bit diameter
A second form of formation damage occurs when cementing a formation which isnaturally fractured. The fluid loss control additive added to the cement slurry will beineffective in such wider diameter features – so cement will flow into the fractures,potentially permanently blocking them. The perforated well productivity will now bemuch lower than the equivalent value for an open hole completion, since connectionwill have been lost with the fractures which have contributed the majority of the wellinflow.
Change of the completion design to open hole is the simplest way to avoid thisproblem. The integrity of the hole may be protected by a slotted liner or screen. Thisis normally possible since the formation must be strong enough to support openfractures under the prevailing reservoir stress conditions.
Figure 26
Inefficient perforating in a
cemented completion due to
an overgauge hole

Department of Petroleum Engineering, Heriot-Watt University 21
4Formation Damage4
4.5.3 Formation Damage During PerforatingThe perforating process results in an open perforation enclosed within a low perme-ability zone of fractured grains and remnants of the perforating charge (figure 27).This “damaged” area results in a reduced inflow into the perforation. However, themeasured well Productivity Index (i.e. fluid production per unit well drawdown)sometimes increases with time as the well is produced. This “cleaning up” process isoften ascribed to the removal of perforating debris (charge debris, rock fragments andthe low permeability crushed zone); all of which reduce the well inflow. This removalincreases the transmissibility between the well and the formation. Further, someoriginally completely blocked perforations may open to flow as the well drawdownincreases. This “clean up” process can be accelerated by specific well treatments such as:
(i) back flowing (production under high drawdown)
(ii) acidising (to dissolve the impairing material)
(iii) perforating with the well underbalance (the crushed and impaired permeabilityrock as well as the charge debris are removed as soon as it is formed)
Compacted, Pulverized Zone(Low Permeability)
Grain Fracturing(Low Permeability)Reduced Permeability Rock
Undamaged Rock
Perforation Charge Debris
Casing / Cement
Open Perforation Tunnel
4.5.4 Formation Damage During ProductionThe last section discussed a case in which the well productivity index increased withtime during normal well production. Unfortunately, this favourable state of affairsfrequently does not occur - reductions in well productivity index often occur when awell is on production. Typical production formation damage phenomena that lead tosuch reductions in well productivity are:
1. fines movement
2. use of incompatible workover fluids
3. inorganic and organic scale formation
4. bacteria
5. pressure reduction
6. stimulation
Figure 27
Schematic of damaged
region around perforation
formed during the
perforation process

1
22
All these mechanisms will now be discussed in greater detail.
4.5.4.1 Sources of Formation Damage - Fines MovementThe “fines” or small mineral particles (clays, feldspars etc) which are found on thesurface of the sand grains which make up the rock fabric have come into equilibriumwith the reservoir fluids during geological time. Sometimes, the conditions were suchthat the fines remained as discrete particles rather than being cemented together andto the sand grain rock fabric. The fluids in the pore spaces during these geological timeperiods are either static or flow at very slow velocities. However, this equilibriumstate is disturbed once a well is drilled and placed on production - high fluid flowvelocities are experienced in the near wellbore region. It was observed in the field that,particularly for wells located in young, unconsolidated sediments, a dramatic reduc-tion in well productivity could occur when the well production rate (or bean up rate)was increased too quickly.
Oil Flow Only - Permeability Remains Constant
Crtical rate which triggers fines movementfor combined oil / water flow
Cor
e P
erm
eabi
lty
Flow Velocity
Oil / water flow
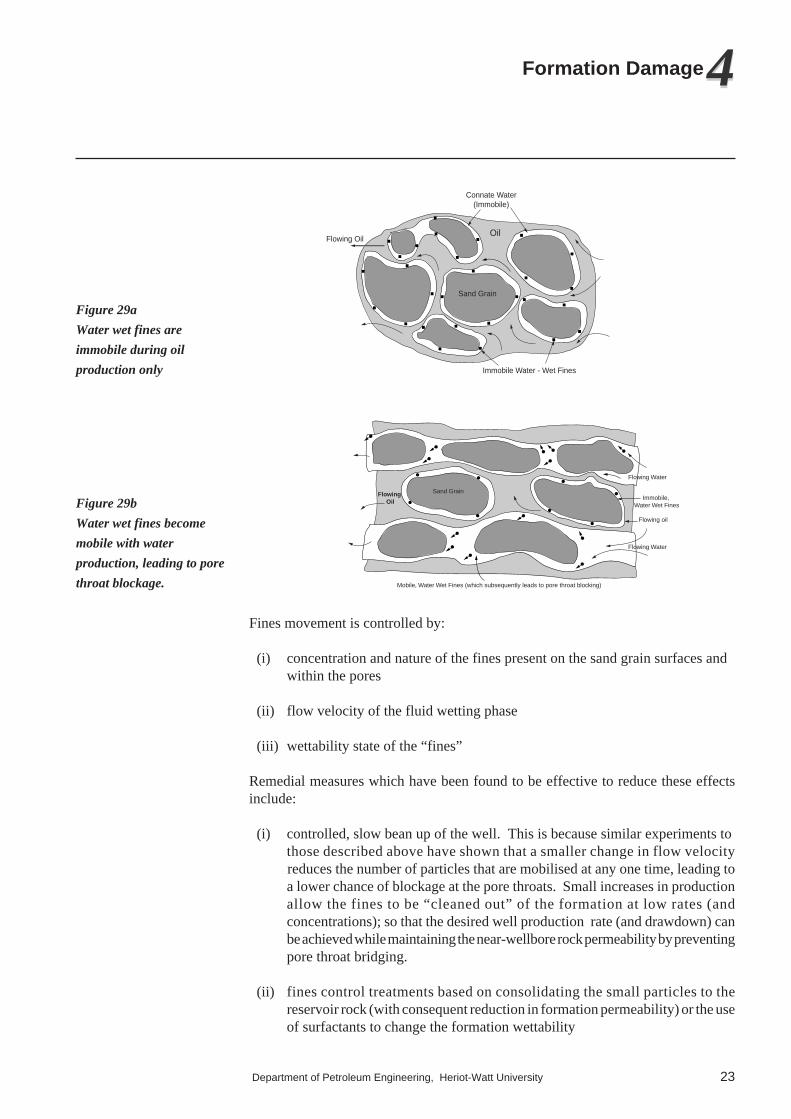
Experiments were carried out in the laboratory to try to reproduce this phenomenon.A core sample from the reservoir was subjected to increasing oil and combined oil/water flow. It was observed that the permeability to oil flow remained constant, evenat reasonable flow velocities, while the permeability began to be reduced at a criticalflow velocity when the core was subjected to a combined oil/water flow regime (figure28). Further experiments were performed in which the actual flow through the porespaces could be observed visually - figure 29a shows that the small, loose particlespresent on the sand grain surface remain in place during oil flow. However, these finesbecome mobile once the wetting phase (water, in this case) is flowing at a rate greaterthan this critical value (figure 29b). Mobilisation of the fines allows them to move tothe pore throats where, if chance dictates that a number of these particles are presentat the same time, blockage can occur. This accounts for the permeability and wellProductivity Index reductions observed as production time increases in the laboratorycore tests and the field measurements.
Figure 28
Effect of flow velocity on
permeability
Department of Petroleum Engineering, Heriot-Watt University 23
4Formation Damage4
Oil
Connate Water(Immobile)
Immobile Water - Wet Fines
Flowing Oil
Sand Grain
Flowing Water
Sand GrainFlowing Oil
Flowing Water
Flowing oil
Mobile, Water Wet Fines (which subsequently leads to pore throat blocking)
Immobile, Water Wet Fines
Fines movement is controlled by:
(i) concentration and nature of the fines present on the sand grain surfaces andwithin the pores
(ii) flow velocity of the fluid wetting phase
(iii) wettability state of the “fines”
Remedial measures which have been found to be effective to reduce these effectsinclude:
(i) controlled, slow bean up of the well. This is because similar experiments tothose described above have shown that a smaller change in flow velocity
reduces the number of particles that are mobilised at any one time, leading toa lower chance of blockage at the pore throats. Small increases in productionallow the fines to be “cleaned out” of the formation at low rates (andconcentrations); so that the desired well production rate (and drawdown) canbe achieved while maintaining the near-wellbore rock permeability by preventingpore throat bridging.
(ii) fines control treatments based on consolidating the small particles to thereservoir rock (with consequent reduction in formation permeability) or the useof surfactants to change the formation wettability
Figure 29a
Water wet fines are
immobile during oil
production only
Figure 29b
Water wet fines become
mobile with water
production, leading to pore
throat blockage.

1
24
However, experience shows that such treatments have a limited lifetime and, ofcourse, changing the formation wettability to oil wet can result in “fines” movementdue to the flow of oil!
4.5.4.2 Sources of Formation Damage - Completion and Workover FluidsThe fluids to which the formation is exposed during the original completion andsubsequent workover operation needs to be chosen carefully to ensure that they arecompatible i.e. do not react with the formation. (This compatibility concept wasintroduced earlier - section 4.5.1.1).
Smectite clay is probably one of the most reactive chemical species found inreservoirs. It shows the widest range of reactions with oilfield brines. This is illustratedin figure 30 where the permeability degradation of a smectite clay containingsandstone core, due to passage of a series of brines is shown. The figure shows that:
(a) 2% wt ammonium chloride (NH4Cl) brine flow gives the highest permeability
measurement
(b) changing to a 5% wt sodium chloride (NaCl) brine gives a reduced permeability
(c) this permeability reduction is accentuated when the sodium chlorideconcentration is reduced to 2% wt NaCl
(d) fresh (distilled) water flow gave the lowest permeability of all the above
(e) flow of a final flush of 2% wt NH4Cl, the brine that gave the original, highest
permeability, is unable to recover this original (higher) permeability. Theformation damage due to the use of incompatible brines is often permanent
20
0
0 100 200 300 400 500 600
Pore Volume Flowed
Prm
eabi
lity,
mD
2% NH4CI
5% NaCI
2% NaCI
Fresh Water
(a)
(b)
(c)(d) (e)
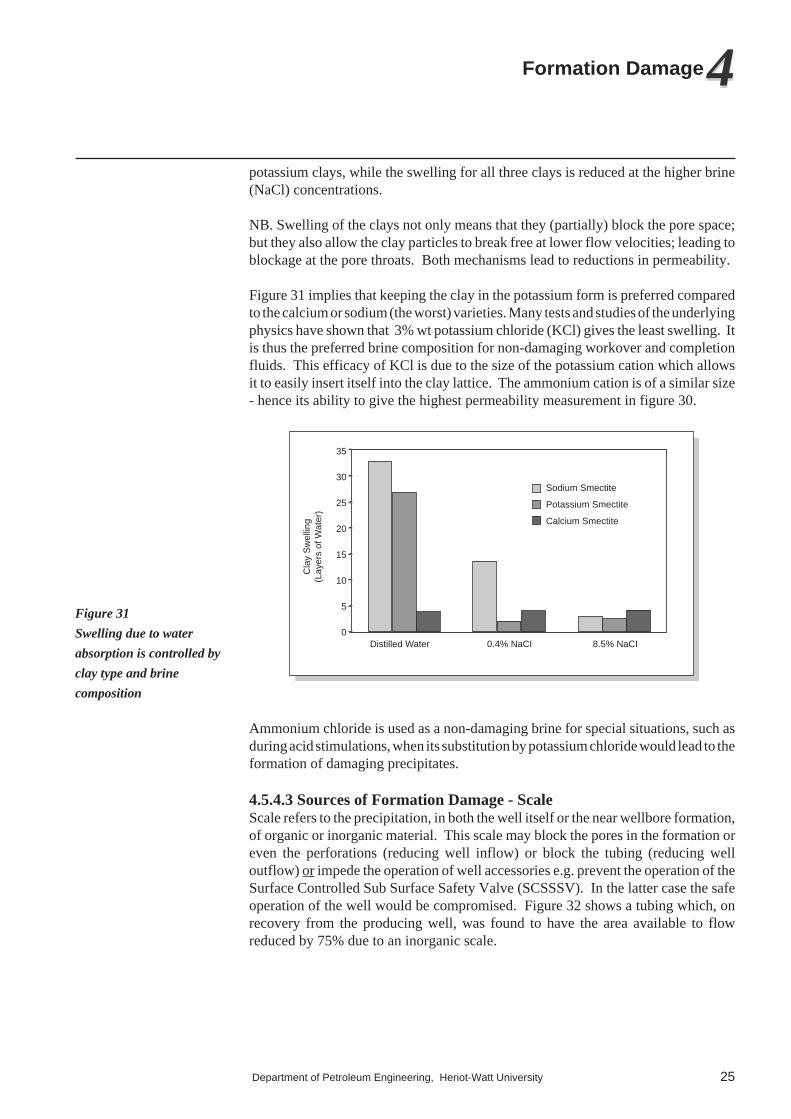
This permeability reduction is caused by the absorption of layers of water between theclay platelets. Clays are naturally negatively charged, this is countered by an adsorbedcation (sodium, potassium or calcium in this case). The clay swelling (number oflayers of water absorbed) is controlled by the cation absorbed and the composition ofthe brine. Figure 31 shows that sodium smectites swell more than the calcium or
Figure 30
Typical permeability
degradation of a smectite
core when flowing various
brines
Department of Petroleum Engineering, Heriot-Watt University 25
4Formation Damage4
potassium clays, while the swelling for all three clays is reduced at the higher brine(NaCl) concentrations.
NB. Swelling of the clays not only means that they (partially) block the pore space;but they also allow the clay particles to break free at lower flow velocities; leading toblockage at the pore throats. Both mechanisms lead to reductions in permeability.
Figure 31 implies that keeping the clay in the potassium form is preferred comparedto the calcium or sodium (the worst) varieties. Many tests and studies of the underlyingphysics have shown that 3% wt potassium chloride (KCl) gives the least swelling. Itis thus the preferred brine composition for non-damaging workover and completionfluids. This efficacy of KCl is due to the size of the potassium cation which allowsit to easily insert itself into the clay lattice. The ammonium cation is of a similar size- hence its ability to give the highest permeability measurement in figure 30.
Cla
y S
wel
ling
(Lay
ers
of W
ater
)
35
30
25
20
15
10
5
0Distilled Water 0.4% NaCI 8.5% NaCI
Sodium Smectite
Potassium Smectite
Calcium Smectite
Ammonium chloride is used as a non-damaging brine for special situations, such asduring acid stimulations, when its substitution by potassium chloride would lead to theformation of damaging precipitates.
4.5.4.3 Sources of Formation Damage - ScaleScale refers to the precipitation, in both the well itself or the near wellbore formation,of organic or inorganic material. This scale may block the pores in the formation oreven the perforations (reducing well inflow) or block the tubing (reducing welloutflow) or impede the operation of well accessories e.g. prevent the operation of theSurface Controlled Sub Surface Safety Valve (SCSSSV). In the latter case the safeoperation of the well would be compromised. Figure 32 shows a tubing which, onrecovery from the producing well, was found to have the area available to flowreduced by 75% due to an inorganic scale.
Figure 31
Swelling due to water
absorption is controlled by
clay type and brine
composition

1
26
Scale
Limited Area remaining Open to Flow
Production Tubing
In all cases the precipitation is triggered by a chemical instability that has been createdby a change to the original equilibrium conditions achieved by the formation fluid overgeological times. This can be due to:
(i) a decrease in temperature during flow up the tubing
(ii) a decrease in pressure during the reservoir depletion or flow up in the tubing
(iii) mixing with a chemically incompatible fluid e.g. connate water with injectionwater or water from a separate reservoir
Two types of organic scales - wax and asphaltenes - are encountered while a multitudeof inorganic scales have been observed. The inorganic scales and bacteria will alsobe discussed in the Water Handling Module (chapter 9).
4.5.4.3.1 Sources of Formation Damage - Inorganic ScalesA wide range of inorganic scales have been encountered during world wide productionoperations. These include:
(i) Precipitation of NaCl salt due to cooling of well fluids and/or evaporation of thewater into the gas phase during production to the surface up the well.
NaCl (soln) → NaCl↓ (solid)
Calcium sulphate can be precipitated due to cooling and to the fact that the less solubleisomorph anhydrite becomes the equilibrium form.
Ca++ + SO4-- → CaSO
4↓ (solid)
(ii) Precipitation of calcium carbonate due to pressure reduction; though once thefluids are in the tubing they undergo a combined effect of pressure andtemperature reduction.
Figure 32
Blocking of tubular flow
area due to scale control
precipitation
Department of Petroleum Engineering, Heriot-Watt University 27
4Formation Damage4
Ca(HCO3)
2 → CaCO
3↓ + CO
2↑ + H
2O
(iii) Unusual scales can be encountered e.g. sulphur precipitation from very sour gaswells has been observed in several producing areas.
NB. Pressure triggered scale formation is self aggravating i.e. an extra pressure dropis created at the onset of scale formation. This leads to a further drop in pressure asthe well operator tries to maintain the target well production. This further pressuredrop creates extra scaling problems.
(iv) Mixing of two reservoir brines (normally in the production tubing) or betweena reservoir brine (e.g. rich in Barium) and an injected fluid (e.g. sea water) canlead to precipitation.
Ba++ (reservoir fluid) + SO4--(injected sea water) → BaSO
4↓ (solid)
Other insoluble materials e.g. SrSO4 are formed by a similar process. Such scales are
frequently found to be contaminated by low level radioactivity. This does notnormally represent a health hazard unless a dry scale sample is drilled (unprotectedbreathing of the dust is hazardous due to radioactive particles lodging in the lungs).
Well productivity can only be reestablished by removing the scale material. This isachieved by:
(i) Dissolving the scale from its precipitation point (in the formation, well orfacilities) using a suitable solvent, e.g:
(a) NaCl salt can be dissolved by water
(b) Calcium Carbonate (CaCO3) can be dissolved by hydrochloric acid
(c) Barium Sulphate (BaSO4) is very difficult to dissolve. Commercially
available solvents tend to be expensive and can only dissolve a limitedamount of material.
(ii) Drilling out the “difficult to dissolve” scales coupled with, if necessary,reperforating to bypass perforations blocked by scale; has been found to be effective.
(iii) The preferred technique is to inhibit the formation of the scale by circulation(in the well) or injection into the formation of a scale inhibitor. In the latter casethe inhibitor absorbs onto the formation some distance from the wellbore andis produced slowly with the produced fluids over a period of many months -protecting the formation, well and facilities from damage by scale precipitation.The inhibitor works by preventing the initially formed, small scale particles(nuclei) from agglomerating and forming massive scale crystals i.e. the minuteparticles of the scaling mineral are retained in suspension. It should beemphasised that the inhibitor is slowing down the kinetics of scale agglomeration,not the thermodynamics of scale formation.

1
28
4.5.4.3.2 Sources of Formation Damage - Organic Scale
(i) WaxMany crude oils will form a solid precipitate when they are cooled. This solid, knownas wax, varies in form from a soft to a brittle solid. It is made up of long, linear,saturated (aliphatic) hydrocarbon molecules with a chain length of 18 to 60 carbonatoms. The (solid) wax is dissolved in the crude oil at reservoir temperatures andforms a crystalline precipitate when the temperature reduces below the cloud point(the temperature at which the first (micro) seed crystals appear). The temperaturedifference between the reservoir temperature and the cloud point ranges from only afew degrees centigrade to many tens of degrees. Pressure changes only have a minoreffect on the value of the cloud point temperature.
The amount of wax dissolved in the crude oil is also highly variable - from less than1% wt to such high values (can be above, 50% wt) that the complete crude sample turnsinto a semi-solid unpumpable mass.
The wax is normally kept in solution in the crude oil by ensuring that the temperatureis maintained above the cloud point at all times. This involves the insulation of flowlines, tanks, etc as well as the use of heaters where appropriate. Heated crude oiltankers are used for sea or road transport. The rate of agglomeration of the wax crystalscan also be reduced by the addition of an inhibitor - once again kinetics of theprecipitation process can be influenced; not the thermodynamics. Proper modellingof the temperature distribution in the wells and facilities needs to be performed toensure that this minimum temperature is maintained at all times.
The maintenance of this minimum temperature is obviously easier while the wells areflowing - since heat is being continually supplied to the system. (Long term) shutdowns represent a problem - especially for long flow lines or pipelines. The problemis accentuated for subsea wells, since water is an effective medium for heat transfer.The long flow lines and low water temperatures (<4˚C) associated with modernsatellite developments in deep waters, represent a challenge that is currently beingresearched e.g. development of more effective insulation materials. In the meantime,suitable operating procedures need to be developed to ensure that the line does notbecome completely blocked and has to be abandoned (e.g. purge the line of crude oilprior to shutdown). This type of pipeline blockage has already happened on more thanone occasion. Hardly any options exist once the pressure required to restart flow aregreater than the available pumps can generate or, more particularly, exceeds thepipeline test pressure. Improved (pipe-in-pipe) insulation systems as well as theheating of flow lines by a water jacket or electrical tracing are being developed. Waxwill typically start to form on the inner surface of the tubing or the flow line; since thisis the coldest point. Once formed, the wax can be removed by:
(i) mechanical action (scraping)
(ii) dissolving in - hot crude oil (cheap, readily available)- solvents (more expensive, but can of dissolve higher
wax concentration. May be hydrocarbon or water based.)

Department of Petroleum Engineering, Heriot-Watt University 29
4Formation Damage4
(ii) AsphaltenesThe name “Asphaltenes” refers to an amorphous, bituminous, solid material whichprecipitates from some crudes. It frequently contains a high multivalent metalconcentration, such as Vanadium. It is made up of a complex mixture of asphaltenes,resins and maltenes which were originally present in the crude oil under originalreservoir conditions as a metastable colloidal dispersion. The precipitation processis triggered by pressure reductions - asphaltene precipitation is often first observednear the bubble point i.e. the change in crude oil composition due to the removal ofsome of the lower molecular weight species from the crude oil destabilises thecolloidal dispersion that maintained the asphaltenic material in suspension.
Laboratory experiments in which the effect of pressure on the stability of anasphaltenic crude was studied have shown that there are two regions of stability. Oneof these is normally above the bubble point pressure (as discussed earlier) while thereis a second region of stability at low pressures. Asphaltenes are thus mainlyprecipitated at intermediate pressures. The fact that there is a second area of“solubility” is of limited practical use because asphaltenes do not easily “redissolve”.This is because they were originally present in the crude oil as a colloidal dispersion,rather than in solution (as is the case of wax).
The following summarises operational field experience from a number of fields:
(i) the severity of operational problems is not related to the crude oils asphaltenecontent. Crude with relatively low asphaltene contents can give the mostintractable problems
(ii) since asphaltene precipitation occurs at a specific pressure, it is only observedin areas of the production system where this or a lower pressure is experiencede.g. asphaltene precipitation may be initially observed in the facilities. As thereservoir depletes, the lowest point of precipitation will move to the top of thetubing and then down the well until asphaltene precipitation can also occur inthe reservoir
(iii) despite this, field reports of formation damage due to asphaltene precipitationin the reservoir are rare
(iv) solid asphaltene is normally removed mechanically from the well and facilities
(v) mechanical removal is necessary because asphaltenes are poorly soluble insolvents
(vi) large scale asphaltene precipitation occurs when the asphaltenic crude oil iscontacted by acid - both fresh (just pumped into the well) or spent acid (aftercontact with the formation). This effect is particularly severe when the acidcontains ferric cations (Fe+++) e.g. from reaction of the acid with rust. Theimpact of this on acid selection is discussed in chapter 5 (matrix acidising).
4.5.4.4 Sources of Formation Damage - BacteriaThe presence of bacterial colonies and, more importantly the residues they produce,can lead to a number of intractable operational problems. Although they are most

1
30
frequently associated with injection wells and flowlines (see chapter 7, WaterHandling). They have been found in all types of wells and facilities - facilities areopened to the atmosphere for inspection and both wells and facilities are at occasionallyexposed to fluids that are pumped from the surface. Such exposure can lead tocontamination and establishment of the bacterial colony. The following summarisessome of the most widely found problems:
(i) Bacterial Slime / cellular remnants etc will physically plug the formationpores if injected into the well. The solution to prevent this is to ensure that thebacterial colonies do not become established in the wells and facilities. Anybacteria present in all the fluids pumped into the wells should be treated witha sufficient concentration of a bactericide to achieve a high “kill” level.However, it only requires one bacterial spore to be missed which can then starta new colony!
(ii) Iron Bacteria are aerobic bacteria which can establish themselves under aniron deposit that they form themselves. Their growth processes then result inthe establishment of an anaerobic bacterial colony e.g. of sulphate reducingbacteria, leading to a pitting type corrosion. They are typically found ininjection flowlines where the fluid is not efficiently deoxygenated. They aredifficult to kill with bactericide since they are protected by the surface irondeposit. Regular mechanical removal, e.g. by pigging the line, is the mosteffective treatment.
(iii) Sulphate Reducing Bacteria are anaerobic bacteria which are capable ofproducing large quantities of hydrogen sulphide (H
2S) when both the sulphate
anion (usually from sea water) and a carbon source (crude oil) are present in theabsence of oxygen. H
2S presents a major safety and corrosions issue since:
(a) exposure to H2S at a concentration of a few tens of ppm is fatal to human life
(b) well and facility components made from conventional steel alloys will failwhen exposed to fluids with a low partial pressure of H
2S.
Injection waters containing even low levels of the ferric cation (Fe+++) will precipitatethe extremely insoluble solid ferric sulphate (Fe
2S
3) when exposed to H
2S. Ferric
cations are normally found in injection water (since it is processed in steel vessels andoxygen has been present in the system etc). The solid Fe
2S
3 will plug the formation.
4.5.4.5 Sources of Formation Damage - Pressure ReductionThe reservoir pressure of the vast majority of hydrocarbon reservoirs will be reducedduring its producing lifetime. This can trigger a number of operational problemswhich result in formation damage.
(i) The precipitation of inorganic and asphaltenic scales was discussed earlier.
(ii) The reduction in reservoir pressure increases the formation effective stress.The impact of this increased stress can lead to formation failure resulting in:

Department of Petroleum Engineering, Heriot-Watt University 31
4Formation Damage4
(a) sand production (see chapter 7 of this module)
(b) compaction of the reservoir producing interval. This reservoir drive mechanismis beneficial since it will lead to an increased recovery of the oil originally inplace in the reservoir; but it may also bring extra operational costs due to surfacesubsidence and damage to the wells themselves {(casing/tubing being squeezedinto an oval shape rather than being round, or even(parting due to shearing)}.
(c) fault creation or reactivation {i.e. (mini) earthquakes). Creation of extra faultsmay lead to improved inflow while fault reactivation may result in previouslysealing faults becoming “leaky.”
(d) reduced formation permeability. This is normally minor, but catastrophic porecollapse to zero permeability has been observed for some chalks when a certainrock effective stress is exceeded.
(iii) Reservoir multiphase flow effects that may be falsely attributed to formationdamage. A sufficient reduction in pressure so that the reservoir fluid passes thebubble or dew point results in the presence of an extra phase in the reservoirwhich will reduce the (relative) permeability to oil or gas flow
4.5.4.6 Sources of Formation Damage - StimulationWell stimulation is probably the most frequent operation when fluids are pumped intoa well. The first three factors discussed below are only applicable to the pumping ofhigh reactivity fluids such as acid. However, the remaining effects can be encounteredwith any fluid that is pumped into the well, unless proper thought is given to itsselection.
(i) Reaction products generated by the reaction between the injected acid and theformation rock may precipitate, causing a reduced permeability (formation damage)
(ii) The acid may weaken (deconsolidate) the rock, by attacking the intergraincement so that (normally temporary) sand production is observed when the wellis returned to production inconsistent
(iii) The above deconsolidation process may generate “fines” which can migrateand block pore throats. This process can occur for other fluids (see section4.5.4.2 on fluid/rock compatibility)
(iv) Acid is often incompatible with crude oil leading to formation of a solid“sludge” which can block pores (c.f. section described the precipitation ofasphaltenes by acid) or a viscous acid / oil emulsion formation.
(v) A further form of acid/crude oil incompatibility is the formation of a highlyviscous water/oil emulsion. This emulsion stability is often increased by thefine particles described in (iii) above
(vi) The near wellbore formation wettability may be changed from oil to water wet(or vice versa). This will alter the rock’s relative permeability to the requiredhydrocarbon phase - either increasing or decreasing its flow rate
1
32
(vii) The increased water saturation in the near wellbore area resulting from theinjection of the treatment fluid
The relative permeability to the hydrocarbon phases will be reduced by this high watersaturation. Long “clean up times”, i.e. the time required to reduce the water saturationto the pre-stimulation value, of months or even longer have been observed for lowpermeability formations.
The key to avoiding all these problems is proper selection of the acid (or other fluid)i.e. it should be formulated so they do not occur.
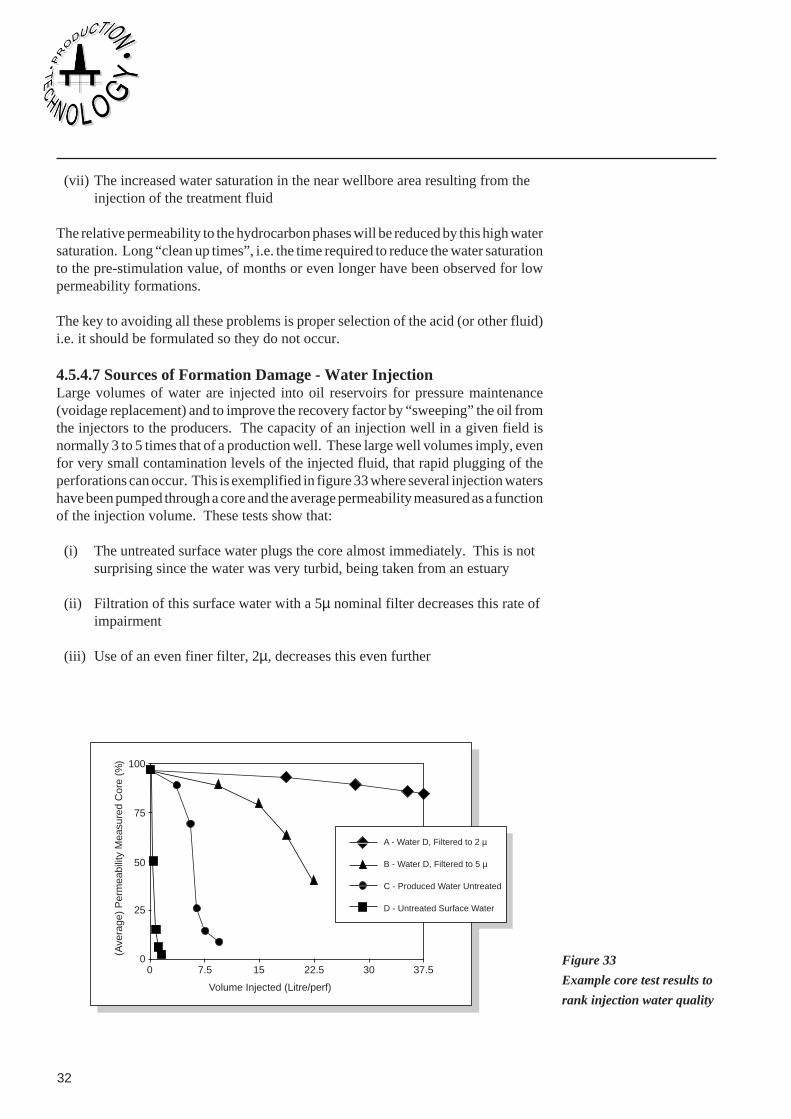
4.5.4.7 Sources of Formation Damage - Water InjectionLarge volumes of water are injected into oil reservoirs for pressure maintenance(voidage replacement) and to improve the recovery factor by “sweeping” the oil fromthe injectors to the producers. The capacity of an injection well in a given field isnormally 3 to 5 times that of a production well. These large well volumes imply, evenfor very small contamination levels of the injected fluid, that rapid plugging of theperforations can occur. This is exemplified in figure 33 where several injection watershave been pumped through a core and the average permeability measured as a functionof the injection volume. These tests show that:
(i) The untreated surface water plugs the core almost immediately. This is notsurprising since the water was very turbid, being taken from an estuary
(ii) Filtration of this surface water with a 5µ nominal filter decreases this rate ofimpairment
(iii) Use of an even finer filter, 2µ, decreases this even further
00
25
50
75
100
7.5 15 22.5 30 37.5
A - Water D, Filtered to 2 µ
B - Water D, Filtered to 5 µ
C - Produced Water Untreated
D - Untreated Surface Water
Volume Injected (Litre/perf)
(Ave
rage
) P
erm
eabi
lity
Mea
sure
d C
ore
(%)
Figure 33
Example core test results to
rank injection water quality

Department of Petroleum Engineering, Heriot-Watt University 33
4Formation Damage4
However, all the above volumes of water injected are small compared to thoserequired in actual injection projects. In practice:
(i)The injection water is often much colder than the reservoir. This cooling of theinjection interval reduces the reservoir stress in the near wellbore area and allowsfracture creation at a much lower pressure than would normally be expected (thermalfracturing). This fracture essentially increases the formation surface area open to thewell, increasing the well injectivity and reducing its sensitivity to formation damage
Needless to say, the filtration requirements depend on
(a) the quality of the available water source
(b) whether thermal fracturing occurs and
(c) the quality of the formation
It should be noted that the fine filtration equipment has been removed from theinjection water treatment train of most North Sea fields because of the good waterquality and the natural tendency for the target formations to form thermal fractures.
(ii)The formation impairment due to solids present in the feed water (figure 33) of realinjection wells is supplemented by many extra sources of damaging particles e.g.corrosion products, oil, bacterial residues and other solids (such as scale precipitates)picked up during its passage through the facilities. The level of corrosion products andbacterial contamination are reduced by the injection of corrosion inhibitor, deoxy-genation of the injection water and its continuous treatment with bactericide (seechapter 8 Oil and Gas Processing, also chapter 9 Water Handling).
Substituting produced water for fresh water brings a new range of problems due to thepresence of (low levels) of oil and small solid particles. The (relative) water qualitycan be judged from line C in figure 33. Further, being hot, thermal fracturing isunlikely to occur.
4.6 FORMATION DAMAGE DURING WORKOVER OPERATIONS
The previous sections of this chapter have discussed the general concept of formationdamage and has given several examples where it occurs. One of the areas whereformation damage frequently occurs during the life of a producing well is duringworkover operations. This is due to impairment of the producing formation by solidparticles.
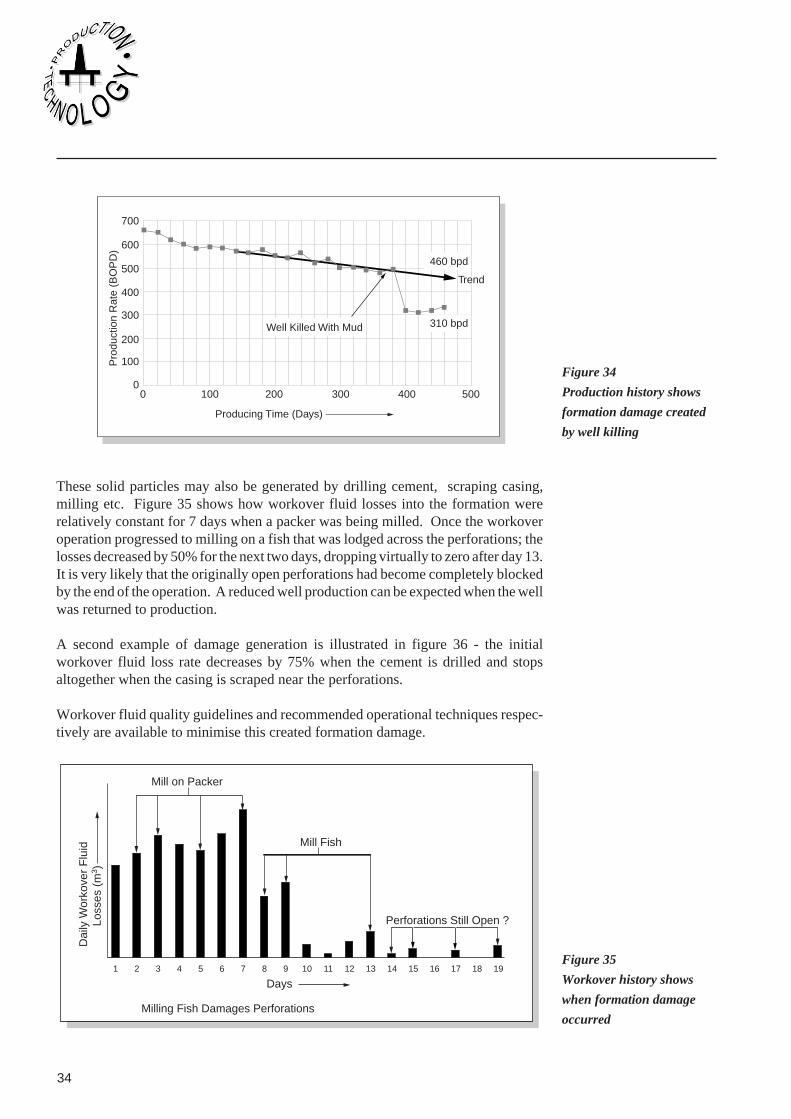
Any solids present in the workover fluid, will be injected into the reservoir during wellkilling operations. This is shown in figure 34 where the well productivity was reducedby nearly a third when the well was killed with drilling mud.
1
34
0 100 200 300 400 500
700
600
500
400
300
200
100
0
Producing Time (Days)
Pro
duct
ion
Rat
e (B
OP
D)
460 bpd
310 bpdWell Killed With Mud
Trend
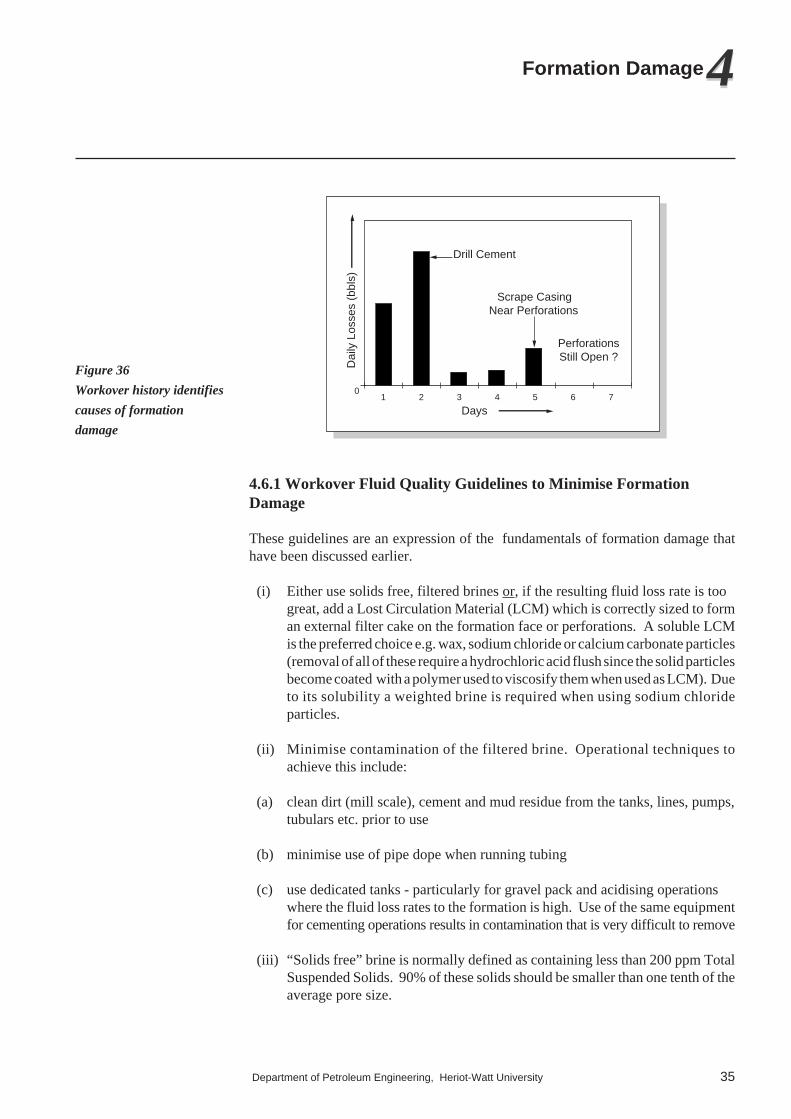
These solid particles may also be generated by drilling cement, scraping casing,milling etc. Figure 35 shows how workover fluid losses into the formation wererelatively constant for 7 days when a packer was being milled. Once the workoveroperation progressed to milling on a fish that was lodged across the perforations; thelosses decreased by 50% for the next two days, dropping virtually to zero after day 13.It is very likely that the originally open perforations had become completely blockedby the end of the operation. A reduced well production can be expected when the wellwas returned to production.
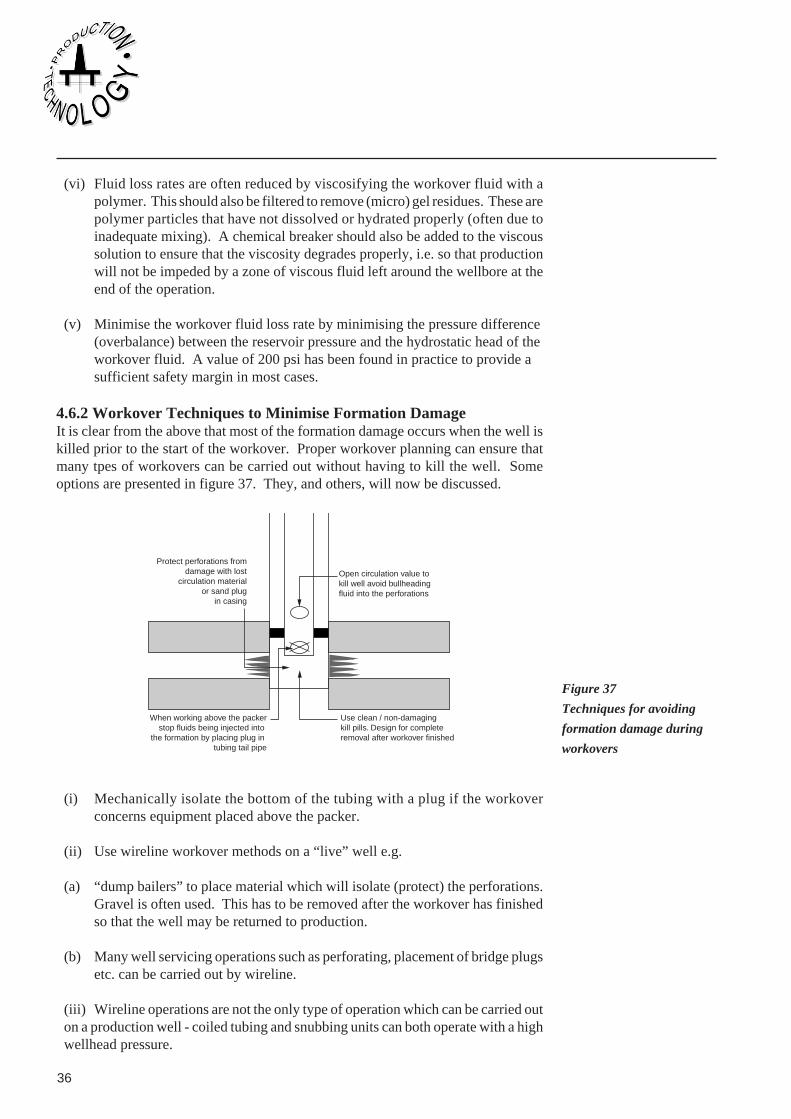
A second example of damage generation is illustrated in figure 36 - the initialworkover fluid loss rate decreases by 75% when the cement is drilled and stopsaltogether when the casing is scraped near the perforations.
Workover fluid quality guidelines and recommended operational techniques respec-tively are available to minimise this created formation damage.
1 2 3 4 5 6 7 8 9 10 11 12 13 14 15 16 17 18 19
Days
Milling Fish Damages Perforations
Dai
ly W
orko
ver
Flu
idLo
sses
(m
3 )
Mill on Packer
Mill Fish
Perforations Still Open ?
Figure 34
Production history shows
formation damage created
by well killing
Figure 35
Workover history shows
when formation damage
occurred
Department of Petroleum Engineering, Heriot-Watt University 35
4Formation Damage4
Drill Cement
Scrape Casing Near Perforations
PerforationsStill Open ?
10
2 3 4 5 6 7
Days
Dai
ly L
osse
s (b
bls)
4.6.1 Workover Fluid Quality Guidelines to Minimise FormationDamage
These guidelines are an expression of the fundamentals of formation damage thathave been discussed earlier.
(i) Either use solids free, filtered brines or, if the resulting fluid loss rate is toogreat, add a Lost Circulation Material (LCM) which is correctly sized to forman external filter cake on the formation face or perforations. A soluble LCMis the preferred choice e.g. wax, sodium chloride or calcium carbonate particles(removal of all of these require a hydrochloric acid flush since the solid particlesbecome coated with a polymer used to viscosify them when used as LCM). Dueto its solubility a weighted brine is required when using sodium chlorideparticles.
(ii) Minimise contamination of the filtered brine. Operational techniques toachieve this include:
(a) clean dirt (mill scale), cement and mud residue from the tanks, lines, pumps,tubulars etc. prior to use
(b) minimise use of pipe dope when running tubing
(c) use dedicated tanks - particularly for gravel pack and acidising operationswhere the fluid loss rates to the formation is high. Use of the same equipmentfor cementing operations results in contamination that is very difficult to remove
(iii) “Solids free” brine is normally defined as containing less than 200 ppm TotalSuspended Solids. 90% of these solids should be smaller than one tenth of theaverage pore size.
Figure 36
Workover history identifies
causes of formation
damage
1
36
(vi) Fluid loss rates are often reduced by viscosifying the workover fluid with apolymer. This should also be filtered to remove (micro) gel residues. These arepolymer particles that have not dissolved or hydrated properly (often due toinadequate mixing). A chemical breaker should also be added to the viscoussolution to ensure that the viscosity degrades properly, i.e. so that productionwill not be impeded by a zone of viscous fluid left around the wellbore at theend of the operation.
(v) Minimise the workover fluid loss rate by minimising the pressure difference(overbalance) between the reservoir pressure and the hydrostatic head of theworkover fluid. A value of 200 psi has been found in practice to provide asufficient safety margin in most cases.
4.6.2 Workover Techniques to Minimise Formation DamageIt is clear from the above that most of the formation damage occurs when the well iskilled prior to the start of the workover. Proper workover planning can ensure thatmany tpes of workovers can be carried out without having to kill the well. Someoptions are presented in figure 37. They, and others, will now be discussed.
Open circulation value tokill well avoid bullheading fluid into the perforations
Use clean / non-damagingkill pills. Design for complete removal after workover finished
When working above the packerstop fluids being injected into
the formation by placing plug in tubing tail pipe
Protect perforations fromdamage with lost
circulation materialor sand plug
in casing
(i) Mechanically isolate the bottom of the tubing with a plug if the workoverconcerns equipment placed above the packer.
(ii) Use wireline workover methods on a “live” well e.g.
(a) “dump bailers” to place material which will isolate (protect) the perforations.Gravel is often used. This has to be removed after the workover has finishedso that the well may be returned to production.
(b) Many well servicing operations such as perforating, placement of bridge plugsetc. can be carried out by wireline.
(iii) Wireline operations are not the only type of operation which can be carried outon a production well - coiled tubing and snubbing units can both operate with a highwellhead pressure.
Figure 37
Techniques for avoiding
formation damage during
workovers

Department of Petroleum Engineering, Heriot-Watt University 37
4Formation Damage4
(iv) Pumping fluids from the surface to the perforations through tubing that hasbeen installed for a number of years creates two problems:
(a) The tubing is cooled by the cold fluid and contracts. If a tubing anchor has beenused i.e. the completion does NOT contain any moving seals, this contractionof the tubing may unseat the downhole packer or pull the tubing apart
(b) The pumped fluid will clean the inside of the old tubing and the resulting debriswill be injected to the perforations.
Use of a string of coiled tubing (or snubbing unit tubing) where the inside of the tubinghas been cleaned before use will avoid both problems. The latter problem may bereduced by a proper pumping schedule if the well and pressure conditions areappropriate. A dilute, inhibited acid is pumped into the tubing and displaced to a safedistance above the perforations (so that none of the fluid comes into contact with theperforations). It is then circulated back to the surface e.g. by opening a sliding sidedoor installed in the tubing above the packer and reverse circulating by pumping intothe annulus.
A similar procedure (without the necessity to open sliding side doors) may be used toclean the inside of the coiled tubing/snubbing unit once it has been inserted into thewell.
4.6.3 Recognition of the Presence of Formation DamageA production log which measures the flow rate at any point in the well is one methodto determine if formation damage has taken place. Figure 38 schematically relatesthe flow rate at various depths to the quality of the (potentially hydrocarbonproducing) sand, as measured by the gamma ray log. It is clear that the bottom sandhas (potentially) been impaired since it is not contributing to the production.
Flow
Flow
No Flow
Pay Zone
Pay Zone
Pay Zone
Gamma Ray Measured Flow Rate
The word potentially is used here since there are other possible reasons, apart fromformation damage, that could also account for this lack of well production, e.g. thebottom sand may have already been depleted and the reservoir pressure is too low toallow the zone to flow.
Figure 38
Production log (e.g. spinner
or video) identifies zones
exhibiting pssible
formation damage

1
38
The removal (matrix acidising) or the bypassing (propped hydraulic fracturing) offormation damage is the subject of Chapter 5. The bypassing of formation damage bya hydraulic fracturing treatment (Chapter 6) is a mechanical process - hence it is onlynecessary to know that formation damage is present when designing such a treatment.However, the removal of formation damage by a (matrix) chemical treatment requiresthat the TYPE (or CAUSE) and location of the formation damage may be identifiedbefore its removal is attempted. This identification process often involves:
(i) examining the well records to identify operations that might have resulted information damage
(ii) carrying out specific laboratory testing, such as a reservoir core flushing, todetermine if the identified operations did indeed lead to core damage for theparticular combination of the fluids in question and the reservoir formation
(iii) examining the damaged core with sophisticated analytical techniques such asthe scanning electron microscope to confirm the damage type and the damagelocation and hence develop ideas on how to remove it.
The many possible types of formation damage discussed in this chapter indicate whyformation change studies have to be carried out in a systematic manner. It will also beseen that each source of formation damage has its own, specific cure.

Department of Petroleum Engineering, Heriot-Watt University 39
4Formation Damage4
4.8 APPENDIX A
Appendix A is a summary of common types of formation damage, diagnostic cluesand remediation techniques from "An introduvtion to the basis of well completionsstimulations and workovers (2nd. edition), courtesy of George King (Tulsa, 1996).
Appendix ACommon Damage Types
Condi tion or Type of Damage Diagnostic Clues Remedial
hydrates (ice) gas well, intermittent flow, near totalshutoff, followed by return to flow in afew minutes; produces a small amount ofwater
glycol or alcohol injection below hydrateformation point. Insulated risers or tubing.
oil well, usually only forms near mud linein arctic regions; may also form in drillingmud
insulated risers
migrating fines kaolinite or fibrous ill ite clay or somefeldspars (non clays); brine salinitychanges may trigger fines movement;sporadic reductions in flow rate, variableproduction rate tests; fines in prod,emulsions rare but possible
clay control for prevention, retarded acidfor removal; may need to limit rate inextreme case
swelling clay smectite clay, sometimes il lite andsmectite interbedded clay; permeability issensitive to change in water salinity orbrine type
acidize with HCI/HF if damage is shallowHydraulic Fracture if damage is deeperthan 12"
water blocks usually gas well, small pore throats,untreated water, low pressure formation; ifvery low pressure (< about 0.2 psi/ft), porethroat size doesn’t matter
matrix treat with alcohol or surface tensionlowering surfactant; inject gas in gasreservoir to distance of 10 ft
poor load fluid rec. usually formation dependent; maydecrease production rate in severe cases orcause long cleanup time. Most common informations with small pores andmicroporous clays
Prevention - avoid or m inimize watercontact and lower surface tension of water.Removal - alcohols and some surfactants
fill in perfs high skin, can inject into well at very lowrates; reperforating may show sharpincreases
cleanout of reperforate
fill in casing high skin, difficult or impossible to injectinto well; partial fill will show skin on abuild up but injection possible at a reducedrate; confirm with a sinker bar on wireline
reverse circulation or regular circulation
particle damage skin on buildup test, difficult to inject;sometimes shows emulsions in oi l wells;poor mud conditioning before cement;frequently encountered in open holecompletions and horizontal wells
HCI or HCI/HF acid in matrix acid jobsolvent wash follow with acid in wellswith oil base mud; foam or jettingcleanups are often useful
may also be encountered following acid orfrac stimulations or workover fluids wherea dirty water was used or the water washauled or stored in a dirty tank
filter treatment fluids - use clean tanks
can reduce injection in flood projects -backflow shows particles and oi l carry-over return
better cleaning of water
fracture plugging large whole mud losses in na turallyfractured formations; intermittentproduction at low and moderate rates;infrequent recovery of whole mud andmud fines. Some emulsions, especiallyafter acid treatments; may also occur ifhole is poorly cleaned during drilling
acid useful if damage is shallow; frac ifdeep; to prevent, improve solids recovery

1
40
coning of water onset of water production after extendedproduction; formation has no verticalpermeability barriers and sufficientvertical perm to allow water to movetoward drawdown
limit rate, some treatments maytemporarily be useful; most water controlproducts are not useful without naturalreservoir barriers
commingled water production initial production of water with oil inprimary, with breakthrough in flood; watercut increases in flood
no treatment or temporary at best
waterflood breakthrough through highpermeability zone
examine produced water analysis andcompare with flood water
high permeability zones should be pluggeddeep (d > 100') from producer and injectorwhen oil recovery from zone is complete
micro porosity caused by some forms of clay; may bindwater and make high Sw readings on log
no treatment necessary
emulsion unstable emulsions, breaks on s tanding;created in tubing at pressure drop points inpiping system from pumps to choke
no down hole treatment suggested; treat onsurface if string redesign is impractical
stabilized emulsion very stable emulsion, partially wetted finesat interface; common after drilling muddispersal or cleanup of mud or cementfines by acid; may also occur on polymercleanup; common in production formunconsolidated formations, especially afteracid or gravel packing operations
treat with mutual solvent and acid; removedownhole source of solids if possible
oil base mud emulsion damage very common in wells drilled with oil basemud; if treated with acid or brine beforethe sulfonate emulsifiers are washed offthe cuttings by production or solventtreatments, an emulsion from that can lockup the well; the first one or two treatmentsmay be short lived as m ore mud and mudfiltrate moves back toward the wellbore,this is of ten the case in naturally fracturedformations
wash with aromatic solvent followed bymutual solvent and acid; may requireseveral treatments; cuttings removal isimportant
surfactant stabilized emuls ion stable to very stable emuls ion; common tosevere after acid treatment; may be able tosee the stabilized skin at the drop interface
treat on surface if temporary; use mutualsolvent or surfactant to prevent emulsionwith next acid job
sludge sludge is an emulsion that is nearly solid;it may be triggered by acid, oil based mud,asphaltenes, or iron compounds; dispersethe sludge in xylene and analyze forcomponents, particularly iron
prevention is best cure; use non sludgingacid systems, test with iron contentexpected in well
paraffin / wax Forms in tubing near surface as oi l coolsand cloud point is reached; may becomeincreasingly a problem as field ages; mostparaffin deposits melt at < 150˚F. Oftenform at pressure restriction in tubulars;soft to hard mass found at press drops;color reddish brown to black; even whiteor gray possible;
scraping, cutting for mechanical removal;hot oil useful if deposit is < 100 ft fromsurface; solvent soaks on deeper deposits;some inhibitors available for pipelines andfew problem wells; some wells requirecontinuous downhole treatment throughmacaroni st ring; special bacteria are alsoused to prevent precipitation
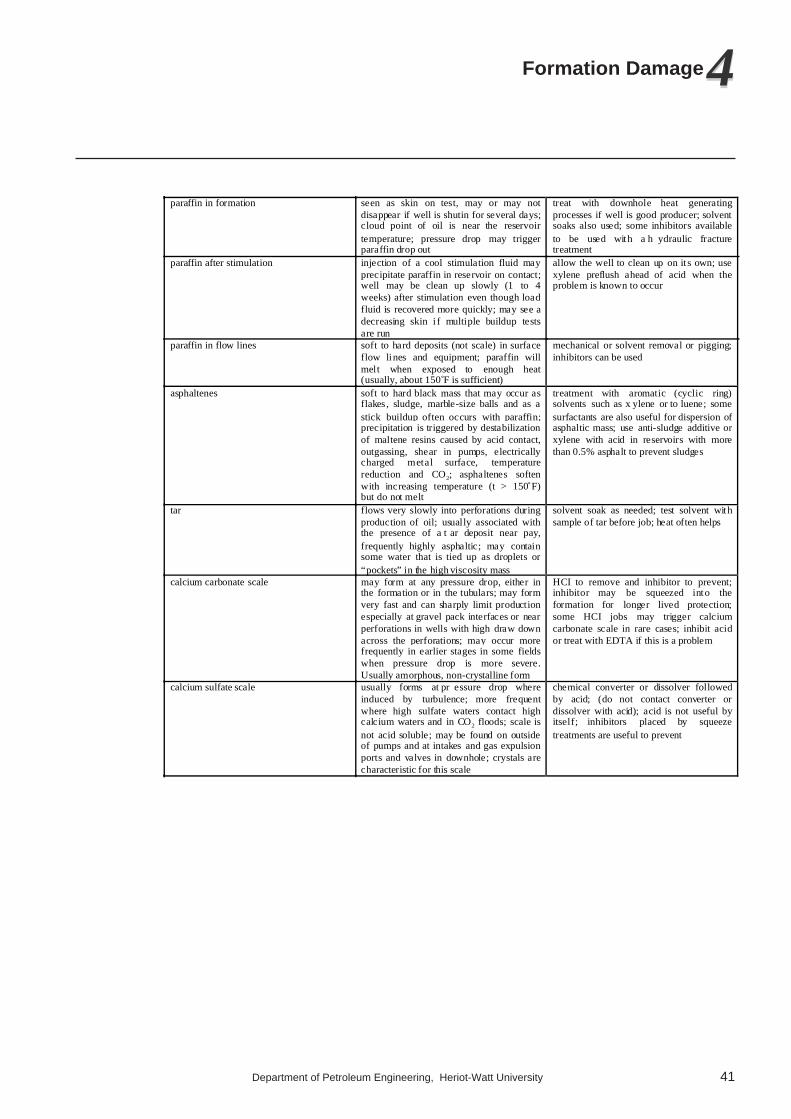
Department of Petroleum Engineering, Heriot-Watt University 41
4Formation Damage4
paraffin in formation seen as skin on test, may or may notdisappear if well is shutin for several days;cloud point of oil is near the reservoirtemperature; pressure drop may triggerparaffin drop out
treat with downhole heat generatingprocesses if well is good producer; solventsoaks also used; some inhibitors availableto be used with a h ydraulic fracturetreatment
paraffin after stimulation injection of a cool stimulation fluid mayprecipitate paraffin in reservoir on contact;well may be clean up slowly (1 to 4weeks) after stimulation even though loadfluid is recovered more quickly; may see adecreasing skin i f multiple buildup testsare run
allow the well to clean up on its own; usexylene preflush ahead of acid when theproblem is known to occur
paraffin in flow lines soft to hard deposits (not scale) in surfaceflow lines and equipment; paraffin willmelt when exposed to enough heat(usually, about 150˚F is sufficient)
mechanical or solvent removal or pigging;inhibitors can be used
asphaltenes soft to hard black mass that may occur asflakes, sludge, marble-size balls and as astick buildup often occurs with paraffin;precipitation is triggered by destabilizationof maltene resins caused by acid contact,outgassing, shear in pumps, electricallycharged metal surface, temperaturereduction and CO2; asphaltenes softenwith increasing temperature (t > 150̊ F)but do not melt
treatment with aromatic (cyclic ring)solvents such as x ylene or to luene; somesurfactants are also useful for dispersion ofasphaltic mass; use anti-sludge additive orxylene with acid in reservoirs with morethan 0.5% asphalt to prevent sludges
tar flows very slowly into perforations duringproduction of oil; usually associated withthe presence of a t ar deposit near pay,frequently highly asphaltic; may containsome water that is tied up as droplets or“pockets” in the high viscosity mass
solvent soak as needed; test solvent withsample of tar before job; heat often helps
calcium carbonate scale may form at any pressure drop, either inthe formation or in the tubulars; may formvery fast and can sharply limit productionespecially at gravel pack interfaces or nearperforations in wells with high draw downacross the perforations; may occur morefrequently in earlier stages in some fieldswhen pressure drop is more severe.Usually amorphous, non-crystalline form
HCI to remove and inhibitor to prevent;inhibitor may be squeezed into theformation for longer lived protection;some HCI jobs may trigger calciumcarbonate scale in rare cases; inhibit acidor treat with EDTA if this is a problem
calcium sulfate scale usually forms at pr essure drop whereinduced by turbulence; more frequentwhere high sulfate waters contact highcalcium waters and in CO2 floods; scale isnot acid soluble; may be found on outsideof pumps and at intakes and gas expulsionports and valves in downhole; crystals arecharacteristic for this scale
chemical converter or dissolver followedby acid; (do not contact converter ordissolver with acid); acid is not useful byitself; inhibitors placed by squeezetreatments are useful to prevent

1
42
barium sulfate scale non reactive scale that forms at pressuredrawdowns or where outgassing occurs;no readily apparent crystal pattern in manydeposits; may occur as radioactive NORMscale in some areas where radioactiveisotopes form in the lattice. NORM scalesare detectable with gamma ray loggingtools
scraping, water blasting or o thermechanical removal; chemical treatment isusually not possible i f scale occurs asnearly pure (> 90%) deposit or as thick (>1/4", 6mm) deposits in pipes. Can beprevented by inhibitors
wettability problems frequently occurs after an acid job wherethe corrosion inhibitor was not mixed inthe acid just before injection; emulsionsand reduced flow are common,particularly after inhibitor loss or oil basemud contact; may be temporary orpermanent but most clean up slowly withtime and flow; attempts to reverse naturalwettability usually are short l ived; naturalwettability is determined by the naturalsurfactants in the produced fields
treat with mutual solvent wash over thepay, displace and soak
relative perm problem may occur when oil is injected into a gaszone or gas is injected into an oil zone thatis above the bubble point
treat with high API gravity solvent such ascondensate or xylene (low flash point);squeeze and produce back
retrograde condensate a special case of relative permeabil ityeffect; a condensate (liquid phase) thatforms from a rich gas; if the condensateforms in the tubing or casing, heading mayoccur; if condensate forms in theformation - creation of another phase willreduce permeability to gas; usually occursnear the wellbore where it manifests itselfas an extra pressure drop
control drawdowns and repressurereservoir; redesign of tubing may berequired
tubing problem well refuses to flow although pressure issufficient with the expected assistancefrom dissolved gas; well may head and dieor liquid slugs may be produced if string istoo large; rate is restricted by friction backpressure if tubing is too small
redesign string; a velocity string that willfit inside existing tubing may help iftubing is too large
salt salt precipitates as a w hite mass in thetubulars or in the formation; usuallyassociated with a cooling of supersaturated water but may also be triggeredby a pressure drop; may be seen early inthe lives of some wells and become less ofa problem as water cut increases; look forproblems in formations with producedwater salinity that is near saturation
fresh water or weak brine wash

Department of Petroleum Engineering, Heriot-Watt University 43
4Formation Damage4
bacterial infestation a difficult problem to p redict; it is morecommon in injection wells where surfaceor produced water is injected, if the colonyis established in the water handlingsystem, it can occur with injection of anywaters; when tubing is pulled, brown toblack slimy masses or an H2S o dor areindications; bacteria may cause slowreductions in the injectivity of a wholefield; complete removal of the bacteria israrely possible - treatment is usually on aremedial basis; untreated water intreatments; drilling fluid or injection watercan sour reservoirs with SRB bacteria
treat with bleach followed by HCI (do notallow contact of bleach and HCI); morethan one treatment may be necessary;alternative treatments are chlorine dioxideand bactericide slugs
poor perforations shows up as damage on a build up test butcannot be cured with acid or mechanicalchanges in the well; problems such asscreenouts of hydraulic fracture jobs, highinjection pressures, sand production,downhole scale occurrence, unstableemulsions, and downhole paraffin andasphaltene deposits are common; problemswith a well that cannot be broken down oreven pumped into should always beapproached by reperforating the well
reperforate
unstable formation may occur in any formation that is poorlyconsolidated or that will fail underpressure; may occur with onset of waterproduction or loss of pressure fromdepletion; problems include embedment ofproppant, closing of acidized channels inacid fractures, spalling of formation intoperfs or wellbore or production of solids
gravel packing, plastic consolidation, orrate limits
collapsed pipe may show up as re duced rate ordestruction of li ft equipment. Check witha gauge ring on wireline or tubing. Has avariety of causes including severecorrosion, malfunctioning perforatingguns, pipe flaws and wear of tubulars fromdrilling or l ift system. Most commoncauses are earth shift loads caused bysubsidence of pr oducing formations withfluid and sand withdrawals, active faults,and formation movements near salt zones
If caused by earth shift forces, use heavierpipe or multiple strings. Liners, cement,and patches used for repair
leaks sudden changes in GOR, WOR, pressure,or chemical analysis of water
repair; consider corrosion control program
1
44
FORMATION DAMAGE TUTORIAL
Question 1.
The Hawkins formula may be used to calculate the skin due to formation damage:
Skk
rrd
o
d
d
w
ln= −
1
A well completed on a 500 mD formation with a well spacing of 40 acres (re = 745 ft).The wellbore radius rw equals 0.328 ft. It is planned to perforate the pay zone with athrough tubing gun where the perforation charges have a depth of penetration of 12in. IF it is decided to case the hole.
The drilling mud used to drill the well controls the extent of permeability impairmentand the depth of damaged region extends beyond the wellbore. The following mudtypes are available:
Mud A B C DPermeability in damaged zone (mD) 100 20 300 200Depth of invasion (ft) 1.6 0.8 2.0 2.3
Which mud system do you recommend from a well productivity point of view for anopenhole and a cased hole completion?
Answer 1.
Applying Hawkins formula
Skk
rr
o
d
d
w
ln= −
1
and using Mud A parameters, i.e. Kd = 100 mD and rd = 1.6
S
S
* ln.
.
.
= −
=
500100
11 6
0 328
6 34
and the Productivity Ratio will be:

Department of Petroleum Engineering, Heriot-Watt University 45
4Formation Damage4
JoJi
rr
rr S
r r r r
e
w
e
w
w e e w
ln
ln
. , ln / .
=+
= = =0 328 745 7 73
JoJi
==+
=
7 737 73 6 34
0 55
.. .
.JoJi
i.e. current Productivity Index is just 55% of the initial value. The following tablesummarises results from the other Mud types.
Mud Type S Jo/JiA 6.34 0.55B 21.40 0.27C 1.21 0.87 D 2.92 0.73
From a Completion Productivity point of view, Drilling Mud type C is recommendedwhen planning an open hole completion, since it creates the minimum damage(S=1.21), reducing the Productivity Index to 87% of the undamaged value.
Mud type B is recommended if a cased hole completion is planned. Mud B producesa highly impaired formation damage zone which has the highest skin and the lowestproductivity ratio of all the drilling muds. However, it is also the thinnest. Theplanned perforating depth (12in.) is 2.4in greater than the formation damage (9.6 in.),hence the perforations will be able to bypass the formation damage. A perforationplan with sufficient perforating density and suitable phasing should be able to deliveran undamaged completion (Jo/Ji = 1).

1
46
4.7 FURTHER READING
Useful books from which further information on the subject of Formation Damage canbe obtained include:
1. Allen, T. and Roberts, A., (1993). Production Operations, Volume 2 (4th Edition).Published by OGCI. ISBN 0-930972-20-1.
2. Economides, M., Hill, A. D. and Ehlig-Economides C., (1993). PetroleumProduction Systems. Published by Prentice Hall. ISBN 0-13-658683-X.
3. Economides, M. and Nolte, K., (1989). Reservoir Stimulation. Published byPrentice Hall. ISBN 0-13-774472-2.