IFPRI Discussion Paper 01610 February 2017 Prospects for the Myanmar Rubber Sector An Analysis of the Viability of Smallholder Production in Mon State Joanna van Asselt Kyan Htoo Paul A. Dorosh Development Strategy and Governance Division

Welcome message from author
This document is posted to help you gain knowledge. Please leave a comment to let me know what you think about it! Share it to your friends and learn new things together.
Transcript
IFPRI Discussion Paper 01610
February 2017
Prospects for the Myanmar Rubber Sector
An Analysis of the Viability of Smallholder Production in Mon State
Joanna van Asselt
Kyan Htoo
Paul A. Dorosh
Development Strategy and Governance Division
INTERNATIONAL FOOD POLICY RESEARCH INSTITUTE
The International Food Policy Research Institute (IFPRI), established in 1975, provides evidence-based policy solutions to sustainably end hunger and malnutrition, and reduce poverty. The institute conducts research, communicates results, optimizes partnerships, and builds capacity to ensure sustainable food production, promote healthy food systems, improve markets and trade, transform agriculture, build resilience, and strengthen institutions and governance. Gender is considered in all of the institute’s work. IFPRI collaborates with partners around the world, including development implementers, public institutions, the private sector, and farmers’ organizations, to ensure that local, national, regional, and global food policies are based on evidence.
AUTHORS Joanna van Asselt ([email protected]) is a senior research assistant in the Development Strategy and Governance Division of the International Food Policy Research Institute, Washington, DC. Kyan Htoo ([email protected]) is a deputy research supervisor at the Centre for Economic and Social Development, Myanmar. Paul A. Dorosh ([email protected]) is a director of the Development Strategy and Governance Division of the International Food Policy Research Institute, Washington, DC.
Notices 1. IFPRI Discussion Papers contain preliminary material and research results and are circulated in order to stimulate discussion and critical comment. They have not been subject to a formal external review via IFPRI’s Publications Review Committee. Any opinions stated herein are those of the author(s) and are not necessarily representative of or endorsed by the International Food Policy Research Institute. 2. The boundaries and names shown and the designations used on the map(s) herein do not imply official endorsement or acceptance by the International Food Policy Research Institute (IFPRI) or its partners and contributors.
3. This publication is available under the Creative Commons Attribution 4.0 International License (CC BY 4.0), https://creativecommons.org/licenses/by/4.0/.
Copyright 2017 International Food Policy Research Institute. All rights reserved. Sections of this material may be reproduced for personal and not-for-profit use without the express written permission of but with acknowledgment to IFPRI. To reproduce the material contained herein for profit or commercial use requires express written permission. To obtain permission, contact [email protected].
iii
Contents
Abstract v
Acknowledgments vi
1. Introduction 1
2. Overview of Myanmar’s Rubber Sector 4
3. Rubber Production, Processing, and Marketing in Mon State 10
4. Profitability of Rubber Investments 20
5. Conclusion 26
References 27
iv
Tables
2.1 World rubber production (’00,000 tons) 4
2.2 World rubber yields (kg/ha) 5
2.3 Myanmar’s principal rubber export partners 8
3.1 Characteristics of Mon rural households 11
3.2 Characteristics of Mon rural rubber-producing households by farm size 12
3.3 Rubber price by grade and type (January 2016) 16
4.1 Mon State rubber farm costs and production: Median 2015 RSS estimates 20
4.2 NPV model base assumptions 22
4.3 Mon State rubber production net present value estimates: Alternative price and wage scenarios (US$/ha) 23
4.4 Mon State rubber production net present value estimates: Alternative yield, price, and wage scenarios (US$/ha) 24
Figure
1.1 World rubber consumption 1
1.2 World rubber prices 2
2.1 Myanmar rubber production estimates 5
2.2 Myanmar total rubber producing and nonproducing area 6
2.3 Myanmar rubber exports 8
4.1 Estimated net present values of new rubber investments 22
4.2 Estimated annual rubber profits with wage rate increases 23
4.3 Mon State rubber production net present value estimates: Alternative grade scenarios 25
v
ABSTRACT
As a result of recent political reforms, Myanmar has the opportunity to enact major policy changes to reinvigorate its agriculture sector. In this context, Myanmar’s rubber sector has the potential to become an even greater source of export earnings and rural household incomes, but there are major challenges related to low rubber productivity and poor rubber quality. Using data from the Mon State Rural Household Survey (MSRHS) conducted from May to June 2015, as well as qualitative data collected from rubber producer focus groups and other interviews with rubber producers, traders, and processors, this paper describes the cost structure of rubber production in Mon State. We then estimate smallholder production costs and the profitability of smallholder rubber production under various alternative yield and price scenarios. The results suggest that if the weaknesses hindering the profitability of the rubber sector are not addressed, the rubber sector will likely stagnate. Moreover, in the absence of a major increase in world prices (substantially above the 2000–2016 average), new rubber investments will not be profitable without major improvements in yield and quality. Further, increasing only yields or only quality, or only improving the institutional environment, will not result in positive returns on investment for smallholders; reforms are needed in all three areas. If these weaknesses are addressed, however, Myanmar’s new investments will be profitable and Myanmar could become an important rubber producer and exporter on the world stage.
Keywords: rubber; agriculture; smallholder; Myanmar
vi
ACKNOWLEDGMENTS
We would like to thank Zaw Oo (executive director of the Centre for Economic and Social Development), Duncan Boughton, Mateusz Filipski, and Aye Mya Thinzar for their comments and suggestions. We are also grateful to the Centre for Economic and Social Development– International Food Policy Research Institute - Michigan State University–research team that conducted the Mon State Rural Household Survey, and to the many households that participated in the survey. Financial support from USAID Burma and the Livelihoods and Food Security Trust Fund is also gratefully acknowledged.
This work was undertaken as part of the CGIAR Research Program on Policies, Institutions, and Markets (PIM), which is led by the International Food Policy Research Institute (IFPRI) and funded by CGIAR Fund Donors. This paper has not gone through IFPRI’s standard peer-review procedure. The opinions expressed here belong to the authors, and do not necessarily reflect those of PIM, IFPRI, or CGIAR. All remaining errors are the responsibility of the authors.
1
1. INTRODUCTION
After nearly three decades of isolation from the world economy, Myanmar is moving forward with political and economic reforms. As a result of this political and economic transformation, Myanmar has tremendous opportunities for growth. Although agriculture accounts for the largest share of employment in Myanmar, its contribution to gross domestic product (GDP) is small. Myanmar’s agriculture value chains are underdeveloped, smallholder capacity is low, and investment in the agriculture sector has been limited. At the same time, Myanmar’s geographic position and climate make agriculture a potential driver for growth and development. In particular, Myanmar is well positioned to become a large exporter of rubber. Following a gradual liberalization of the agriculture sector in the 1990s and a surge in rubber prices in international markets in the 2000s, smallholder rubber investment increased. At present, Myanmar is one of the largest rubber producers in the world, and although rubber yields remain low, they have risen substantially over the past two decades.
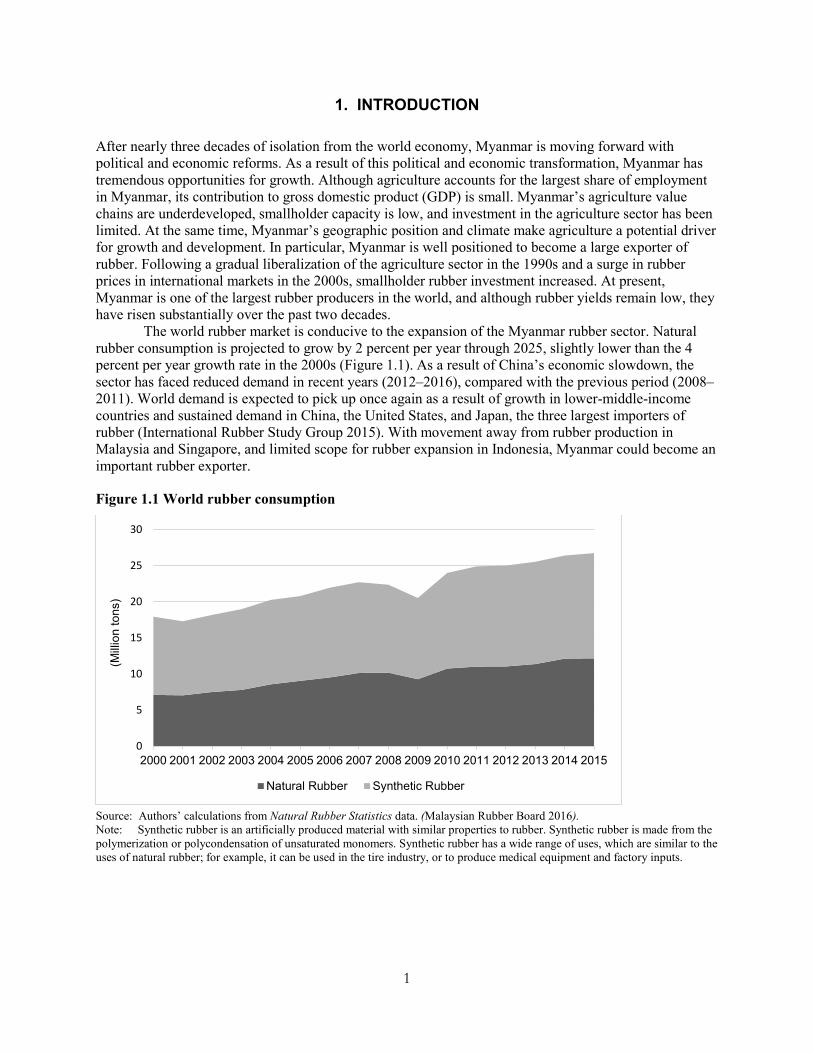
The world rubber market is conducive to the expansion of the Myanmar rubber sector. Natural rubber consumption is projected to grow by 2 percent per year through 2025, slightly lower than the 4 percent per year growth rate in the 2000s (Figure 1.1). As a result of China’s economic slowdown, the sector has faced reduced demand in recent years (2012–2016), compared with the previous period (2008–2011). World demand is expected to pick up once again as a result of growth in lower-middle-income countries and sustained demand in China, the United States, and Japan, the three largest importers of rubber (International Rubber Study Group 2015). With movement away from rubber production in Malaysia and Singapore, and limited scope for rubber expansion in Indonesia, Myanmar could become an important rubber exporter.
Figure 1.1 World rubber consumption
Source: Authors’ calculations from Natural Rubber Statistics data. (Malaysian Rubber Board 2016). Note: Synthetic rubber is an artificially produced material with similar properties to rubber. Synthetic rubber is made from the polymerization or polycondensation of unsaturated monomers. Synthetic rubber has a wide range of uses, which are similar to the uses of natural rubber; for example, it can be used in the tire industry, or to produce medical equipment and factory inputs.
0
5
10
15
20
25
30
2000 2001 2002 2003 2004 2005 2006 2007 2008 2009 2010 2011 2012 2013 2014 2015
(Mill
ion
tons
)
Natural Rubber Synthetic Rubber
2
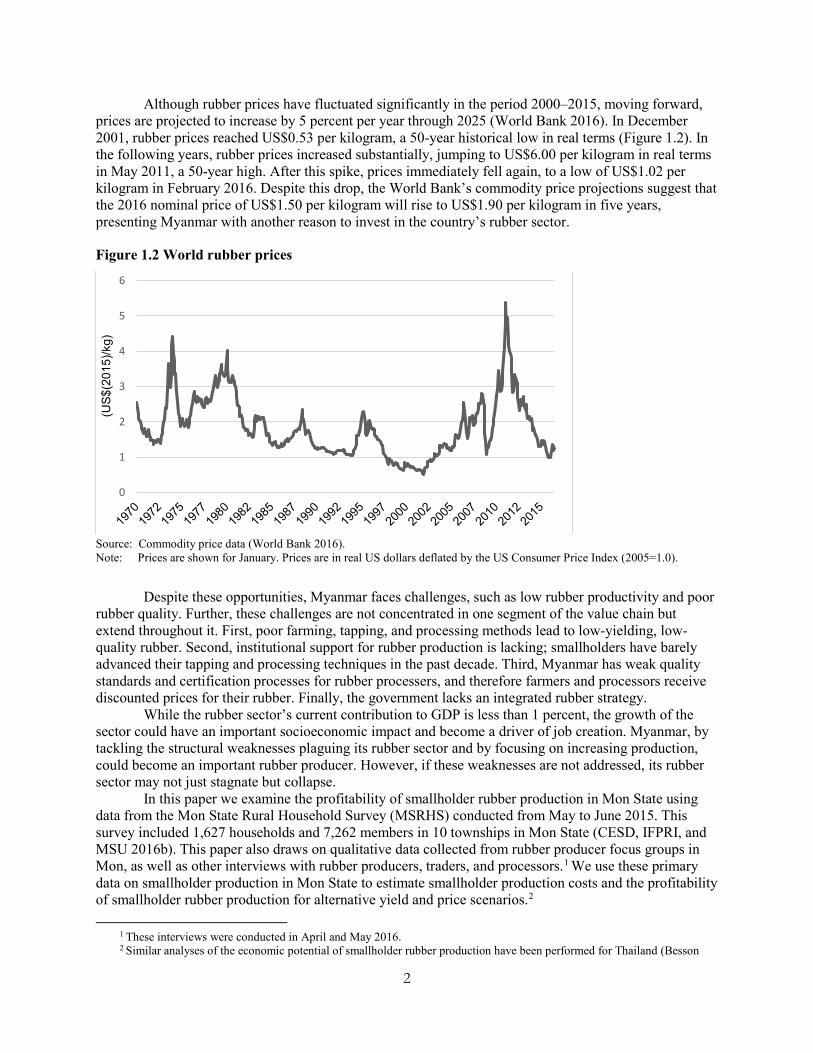
Although rubber prices have fluctuated significantly in the period 2000–2015, moving forward, prices are projected to increase by 5 percent per year through 2025 (World Bank 2016). In December 2001, rubber prices reached US$0.53 per kilogram, a 50-year historical low in real terms (Figure 1.2). In the following years, rubber prices increased substantially, jumping to US$6.00 per kilogram in real terms in May 2011, a 50-year high. After this spike, prices immediately fell again, to a low of US$1.02 per kilogram in February 2016. Despite this drop, the World Bank’s commodity price projections suggest that the 2016 nominal price of US$1.50 per kilogram will rise to US$1.90 per kilogram in five years, presenting Myanmar with another reason to invest in the country’s rubber sector.
Figure 1.2 World rubber prices
Source: Commodity price data (World Bank 2016). Note: Prices are shown for January. Prices are in real US dollars deflated by the US Consumer Price Index (2005=1.0).
Despite these opportunities, Myanmar faces challenges, such as low rubber productivity and poor rubber quality. Further, these challenges are not concentrated in one segment of the value chain but extend throughout it. First, poor farming, tapping, and processing methods lead to low-yielding, low-quality rubber. Second, institutional support for rubber production is lacking; smallholders have barely advanced their tapping and processing techniques in the past decade. Third, Myanmar has weak quality standards and certification processes for rubber processers, and therefore farmers and processors receive discounted prices for their rubber. Finally, the government lacks an integrated rubber strategy.
While the rubber sector’s current contribution to GDP is less than 1 percent, the growth of the sector could have an important socioeconomic impact and become a driver of job creation. Myanmar, by tackling the structural weaknesses plaguing its rubber sector and by focusing on increasing production, could become an important rubber producer. However, if these weaknesses are not addressed, its rubber sector may not just stagnate but collapse.
In this paper we examine the profitability of smallholder rubber production in Mon State using data from the Mon State Rural Household Survey (MSRHS) conducted from May to June 2015. This survey included 1,627 households and 7,262 members in 10 townships in Mon State (CESD, IFPRI, and MSU 2016b). This paper also draws on qualitative data collected from rubber producer focus groups in Mon, as well as other interviews with rubber producers, traders, and processors.1 We use these primary data on smallholder production in Mon State to estimate smallholder production costs and the profitability of smallholder rubber production for alternative yield and price scenarios.2
1 These interviews were conducted in April and May 2016. 2 Similar analyses of the economic potential of smallholder rubber production have been performed for Thailand (Besson
0
1
2
3
4
5
6
(US
$(20
15)/k
g)
3
The plan for the paper is as follows. Section 2 provides an overview of Myanmar’s rubber sector, including a brief history of rubber production; an overview of production levels, yields, and planted area; an introduction to Myanmar rubber producers; and a summary of rubber trade. Section 3 describes rubber production, processing, and marketing in Mon State, as well as highlighting potential interventions or policies for improved rubber sector governance. Section 4 analyzes the profitability of current and future rubber investments under a range of plausible price and wage scenarios, in order to identify priorities for the sector. Section 5 outlines our conclusions.
2002; Simien 2005; Delarue 2011), Indonesia (Jayasuriya and Barlow 1984); and Laos (Manivong and Cramb 2007, 2008; Thongmanivong, et al. 2009; Baird 2009). There are no recent studies of the profitability of the rubber sector in Myanmar based on primary data.
4
2. OVERVIEW OF MYANMAR’S RUBBER SECTOR
History of Rubber Production in Myanmar Although the British introduced rubber (Hevea brasiliensis) to Myanmar as early as 1876, rubber production did not take off in Myanmar for nearly two decades. Compared with neighboring countries, the climate conditions were less favorable in Myanmar, and land markets and transport infrastructure were less developed (Keong 1973). In addition to these limitations, smallholders were unsure of the economic value of rubber and therefore hesitated to invest in the sector. Further, the Myanmar government was unsuccessful in its attempt to develop a large-scale rubber plantation.
In the early 1900s, rubber farming finally began to take hold within European communities. Despite a steep increase in planted area from 1910 to 1920—from 10,000 to 43,000 hectares—economic conditions in the 1930s, followed by the Japanese occupation in the early 1940s and local political conditions in the latter half of the decade, slowed further expansion (Keong 1973). In the 1950s, private rubber production resumed. Production expanded from 56,600 hectares in 1960 to 89,100 acres in 1969 (Burger and Smit 1997). In the following decade, however, production slowed again, as many rubber estates were nationalized. From 1963 to 1988 the government controlled the rubber sector through direct ownership of the majority of production through government estates, procurement of rubber as the sole legal buyer, marketing of rubber both for export and national consumption, and the distribution of rubber imports (Myanmar, MOC and ITC 2015).
In 1989, the production of rubber was partially liberalized from state control. The government still retained control over rubber exports but allowed domestic producers to sell at will to local buyers for a two-year period, after which they were required to sell 45 percent of their production to the government (Woods 2012). The sector was completely liberalized in 2004, and planted acres more than tripled thereafter, from 203,200 hectares in 2004 to 641,100 hectares in 2014–2015 (Figure 2.1) (Myanmar Rubber Planters and Producers Association 2015).
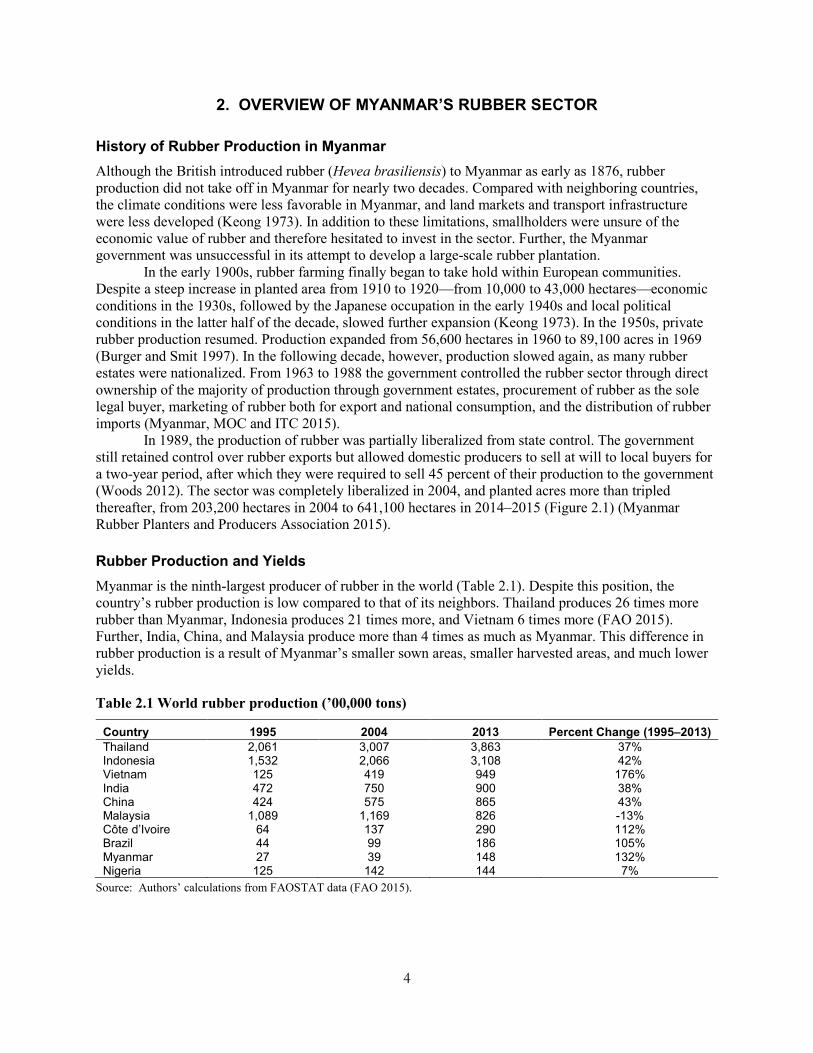
Rubber Production and Yields Myanmar is the ninth-largest producer of rubber in the world (Table 2.1). Despite this position, the country’s rubber production is low compared to that of its neighbors. Thailand produces 26 times more rubber than Myanmar, Indonesia produces 21 times more, and Vietnam 6 times more (FAO 2015). Further, India, China, and Malaysia produce more than 4 times as much as Myanmar. This difference in rubber production is a result of Myanmar’s smaller sown areas, smaller harvested areas, and much lower yields.
Table 2.1 World rubber production (’00,000 tons)
Country 1995 2004 2013 Percent Change (1995–2013) Thailand 2,061 3,007 3,863 37% Indonesia 1,532 2,066 3,108 42% Vietnam 125 419 949 176% India 472 750 900 38% China 424 575 865 43% Malaysia 1,089 1,169 826 -13% Côte d’Ivoire 64 137 290 112% Brazil 44 99 186 105% Myanmar 27 39 148 132% Nigeria 125 142 144 7%
Source: Authors’ calculations from FAOSTAT data (FAO 2015).
5
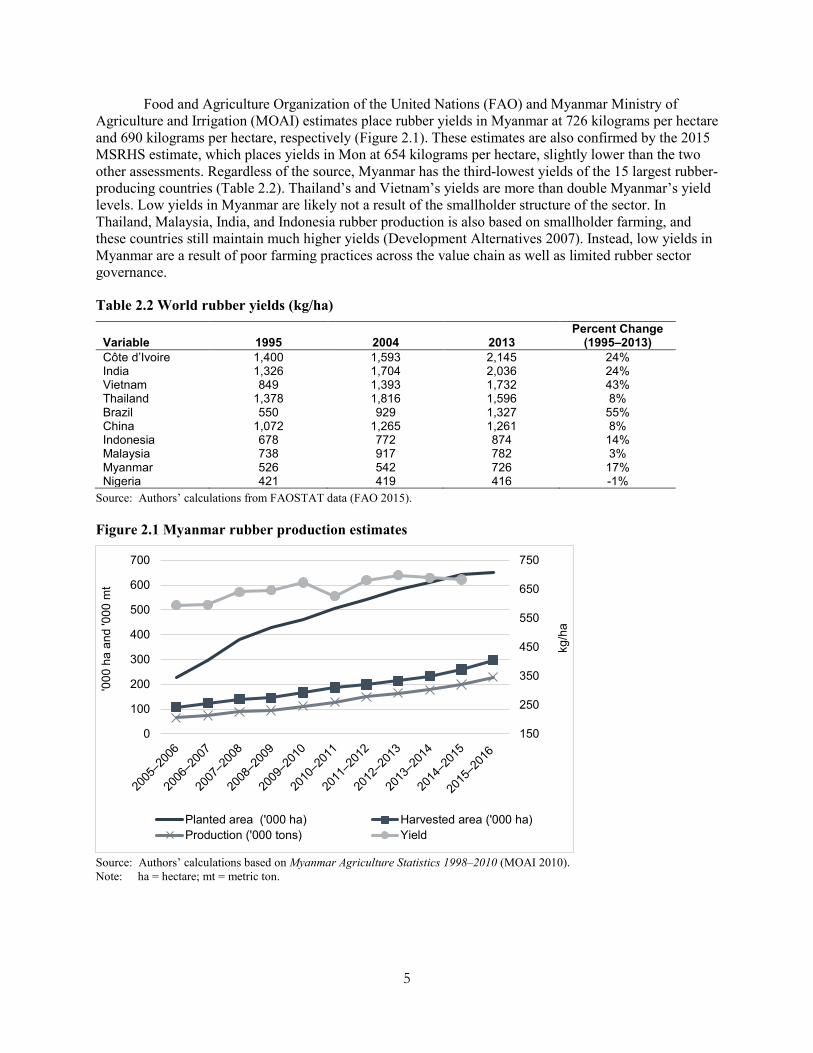
Food and Agriculture Organization of the United Nations (FAO) and Myanmar Ministry of Agriculture and Irrigation (MOAI) estimates place rubber yields in Myanmar at 726 kilograms per hectare and 690 kilograms per hectare, respectively (Figure 2.1). These estimates are also confirmed by the 2015 MSRHS estimate, which places yields in Mon at 654 kilograms per hectare, slightly lower than the two other assessments. Regardless of the source, Myanmar has the third-lowest yields of the 15 largest rubber-producing countries (Table 2.2). Thailand’s and Vietnam’s yields are more than double Myanmar’s yield levels. Low yields in Myanmar are likely not a result of the smallholder structure of the sector. In Thailand, Malaysia, India, and Indonesia rubber production is also based on smallholder farming, and these countries still maintain much higher yields (Development Alternatives 2007). Instead, low yields in Myanmar are a result of poor farming practices across the value chain as well as limited rubber sector governance.
Table 2.2 World rubber yields (kg/ha)
Variable 1995 2004 2013 Percent Change
(1995–2013) Côte d’Ivoire 1,400 1,593 2,145 24% India 1,326 1,704 2,036 24% Vietnam 849 1,393 1,732 43% Thailand 1,378 1,816 1,596 8% Brazil 550 929 1,327 55% China 1,072 1,265 1,261 8% Indonesia 678 772 874 14% Malaysia 738 917 782 3% Myanmar 526 542 726 17% Nigeria 421 419 416 -1%
Source: Authors’ calculations from FAOSTAT data (FAO 2015).
Figure 2.1 Myanmar rubber production estimates
Source: Authors’ calculations based on Myanmar Agriculture Statistics 1998–2010 (MOAI 2010). Note: ha = hectare; mt = metric ton.
150
250
350
450
550
650
750
0
100
200
300
400
500
600
700kg
/ha
'000
ha
and
'000
mt
Planted area ('000 ha) Harvested area ('000 ha)Production ('000 tons) Yield
6
Planted and Harvested Area MOAI estimates that in 2015–2016 total rubber planted area was 652,105 hectares and total harvested rubber area was 297,216 hectares. Total production was estimated at 227,533 tons. These figures show a huge gap between sown area and harvested area. In the past decade, the percentage of trees tapped did not rise above 50 percent of the total trees planted. In 2005–2006, 48 percent of trees planted were tapped; in 2008–2009 during the rubber price spike, only 34 percent of the trees planted were tapped; and in 2015–2016, as a result of the steady rubber price drop, 46 percent of the rubber trees planted were tapped (Myanmar, MOAI 2010). Although we cannot be sure that this difference between planted and harvested area is due to rubber plantation expansion, MSRHS data indicate that this is the case. The survey found that among smallholders in Mon, 44 percent of producers had no mature trees at all. Additionally, 32 percent of rubber farm owners in Mon had acquired their plots after 2008 (CESD, IFPRI, and MSU 2016a). Overall, the low percentage of trees in production implies that the rubber sector will continue to expand, which increases the importance of setting government priorities for rubber.
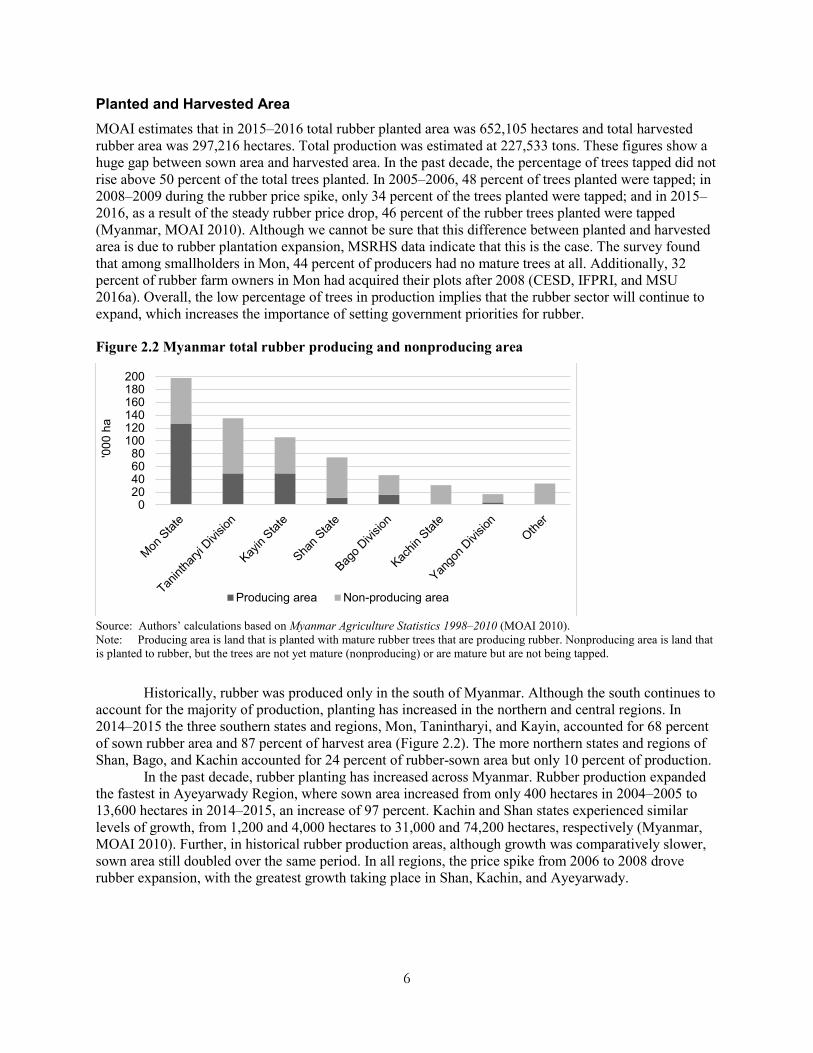
Figure 2.2 Myanmar total rubber producing and nonproducing area
Source: Authors’ calculations based on Myanmar Agriculture Statistics 1998–2010 (MOAI 2010). Note: Producing area is land that is planted with mature rubber trees that are producing rubber. Nonproducing area is land that is planted to rubber, but the trees are not yet mature (nonproducing) or are mature but are not being tapped.
Historically, rubber was produced only in the south of Myanmar. Although the south continues to account for the majority of production, planting has increased in the northern and central regions. In 2014–2015 the three southern states and regions, Mon, Tanintharyi, and Kayin, accounted for 68 percent of sown rubber area and 87 percent of harvest area (Figure 2.2). The more northern states and regions of Shan, Bago, and Kachin accounted for 24 percent of rubber-sown area but only 10 percent of production.
In the past decade, rubber planting has increased across Myanmar. Rubber production expanded the fastest in Ayeyarwady Region, where sown area increased from only 400 hectares in 2004–2005 to 13,600 hectares in 2014–2015, an increase of 97 percent. Kachin and Shan states experienced similar levels of growth, from 1,200 and 4,000 hectares to 31,000 and 74,200 hectares, respectively (Myanmar, MOAI 2010). Further, in historical rubber production areas, although growth was comparatively slower, sown area still doubled over the same period. In all regions, the price spike from 2006 to 2008 drove rubber expansion, with the greatest growth taking place in Shan, Kachin, and Ayeyarwady.
020406080
100120140160180200
'000
ha
Producing area Non-producing area
7
Rubber Producers Prior to policy changes in the early 1990s, the Myanmar government had substantial involvement in the rubber sector. In 1988–1999 the state owned 9.6 percent of the total planted area and produced 16.2 percent of total rubber production. By 2006–2007 the government had already decreased its landholdings to 5.8 percent and its production to 5.9 percent, and by 2010–2011 the Myanmar government controlled less than 3 percent of both planted area and total production (Myint 2013).
Rubber farmers in Myanmar are predominately smallholders. Unfortunately, recent data that disaggregate rubber production by size of plot are limited. An MOAI table from 2005–2006 shows that 40.2 percent of rubber producers were smallholders with less than 2.02 hectares in that year, 50.3 percent were medium holders with between 2.0 and 8.1 hectares, and 9.5 percent were large plantation owners with more than 8.1 sown hectares. In the same year, large holders produced 58.1 percent of output, medium holders 33.3 percent, and smallholders 8.6 percent (Myint 2013). The literature indicates that today, large holders own more rubber land that they ever have (Kenney-Lazar 2016; Global Witness 2014; Woods 2012). This is primarily a result of a new policy preference to give concessions to large holders to bring about significant increases in production and meet agriculture production targets (Woods 2012). The expansion of large-holder production is taking place primarily in northern Myanmar, though our data indicate that there is also increased large-holder production in the south.
Estimates based on data from the 2015 MSRHS indicate that smallholders and medium holders have a combined 126,370 hectares of rubber land in Mon State, equivalent to 63 percent of the total MOAI estimate for sown acres in Mon in that year. Using the latest MOAI estimate for government ownership of rubber land, 2.3 percent, we find that 34.7 percent of plantation owners in Mon owned more than 8.09 hectares in 2015, a considerable increase from the 2005–2006 data. Further research is needed to understand the true extent of large-holder expansion, the implications of large-holder expansion on smallholders, and the likely role of large plantations in Myanmar’s future rubber sector.3
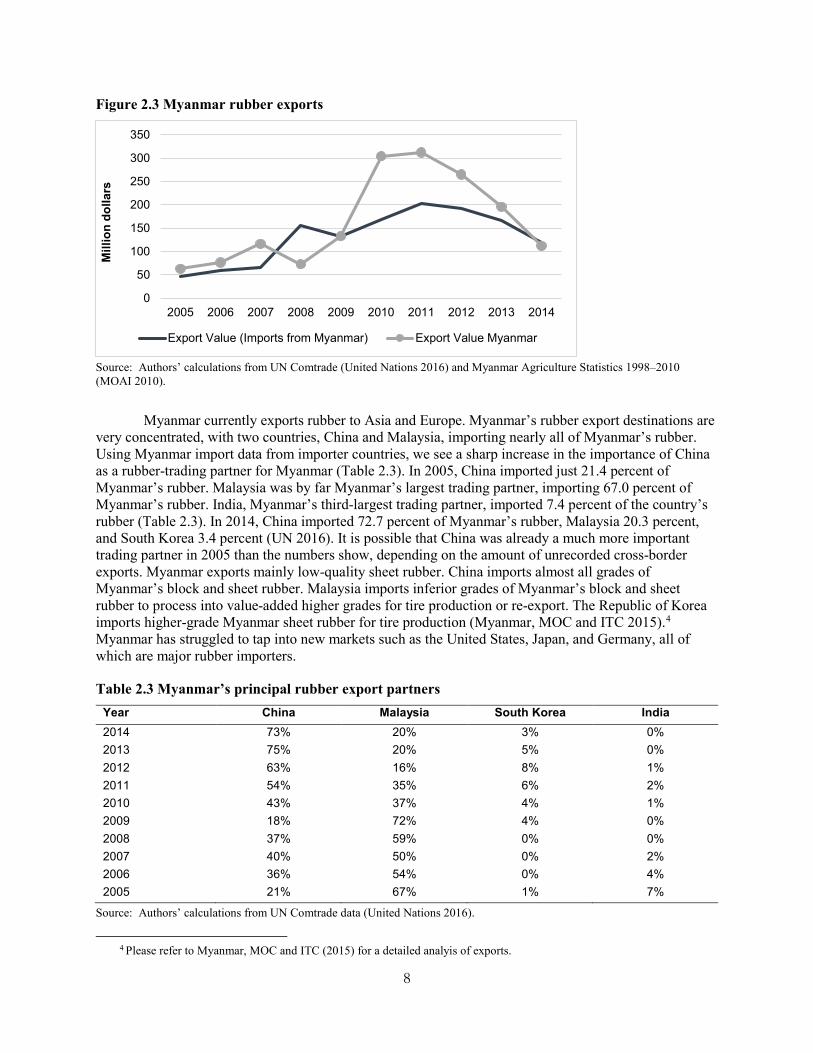
Trade Because the downstream rubber market in Myanmar is small, almost all rubber is exported. Rubber exports have increased significantly over the past decade but have leveled out in recent years (Figure 2.3). After reaching 92,700 tons in 2010, exports have declined slightly, averaging 81,800 tons per year over the following five years. Myanmar export data show a sharp increase in export value from 2008 to 2011, followed by a strong decline. Myanmar import data mirror export data but do not show as sharp an increase or decrease. Further, despite the value decrease in recent years resulting from the drop in rubber prices, overall export value is still much greater than 10 years ago as a result of increases in export quantity.
3 Elsewhere in Southeast Asia, smallholders have been important contributors to rubber sector growth. In Thailand,
Indonesia, Malaysia, and India, the four largest rubber-producing countries in the world, a majority smallholder structure resulted in sector growth as well as improvements to rural welfare (Delarue 2011; Development Alternatives 2007; Malaysian Rubber Board 2016). Smallholders produce around 90 percent of rubber in Thailand, 85 percent in Indonesia, 93 percent in Malaysia, and 89 percent in India (Fox and Castella 2013).
8
Figure 2.3 Myanmar rubber exports
Source: Authors’ calculations from UN Comtrade (United Nations 2016) and Myanmar Agriculture Statistics 1998–2010 (MOAI 2010).
Myanmar currently exports rubber to Asia and Europe. Myanmar’s rubber export destinations are very concentrated, with two countries, China and Malaysia, importing nearly all of Myanmar’s rubber. Using Myanmar import data from importer countries, we see a sharp increase in the importance of China as a rubber-trading partner for Myanmar (Table 2.3). In 2005, China imported just 21.4 percent of Myanmar’s rubber. Malaysia was by far Myanmar’s largest trading partner, importing 67.0 percent of Myanmar’s rubber. India, Myanmar’s third-largest trading partner, imported 7.4 percent of the country’s rubber (Table 2.3). In 2014, China imported 72.7 percent of Myanmar’s rubber, Malaysia 20.3 percent, and South Korea 3.4 percent (UN 2016). It is possible that China was already a much more important trading partner in 2005 than the numbers show, depending on the amount of unrecorded cross-border exports. Myanmar exports mainly low-quality sheet rubber. China imports almost all grades of Myanmar’s block and sheet rubber. Malaysia imports inferior grades of Myanmar’s block and sheet rubber to process into value-added higher grades for tire production or re-export. The Republic of Korea imports higher-grade Myanmar sheet rubber for tire production (Myanmar, MOC and ITC 2015).4
Myanmar has struggled to tap into new markets such as the United States, Japan, and Germany, all of which are major rubber importers.
Table 2.3 Myanmar’s principal rubber export partners Year China Malaysia South Korea India 2014 73% 20% 3% 0% 2013 75% 20% 5% 0% 2012 63% 16% 8% 1% 2011 54% 35% 6% 2% 2010 43% 37% 4% 1% 2009 18% 72% 4% 0% 2008 37% 59% 0% 0% 2007 40% 50% 0% 2% 2006 36% 54% 0% 4% 2005 21% 67% 1% 7%
Source: Authors’ calculations from UN Comtrade data (United Nations 2016).
4 Please refer to Myanmar, MOC and ITC (2015) for a detailed analyis of exports.
0
50
100
150
200
250
300
350
2005 2006 2007 2008 2009 2010 2011 2012 2013 2014
Mill
ion
dolla
rs
Export Value (Imports from Myanmar) Export Value Myanmar
9
In Myanmar, rubber exporters must bear the cost of several cumulative taxes. The Ministry of Finance and Revenue levies an advance 2 percent tax on exporters. Further, a corporate tax of 25 percent is imposed on companies. Finally, rubber is the only agricultural commodity subject to a commercial tax (5 percent) (Myanmar, MOC and ITC 2015). Exporters also face other added charges, such as a licensing fee for membership in the Myanmar Rubber Planters and Producers Association.
10
3. RUBBER PRODUCTION, PROCESSING, AND MARKETING IN MON STATE
Production Area Rubber production in Myanmar is centered in Mon State. In 2014–2015, 31 percent of the rubber sown and 49 percent of the rubber harvested was in Mon State. Mon State is located in the south of Myanmar, bordered by Bago Region to the north, Kayin to the east, and Tanintharyi to the south. It also shares a short southeastern border with Thailand. Mon is one of the smaller states in Myanmar, but, with a population of two million inhabitants, it is relatively densely populated. Despite its small size, its proximity to Yangon and Thailand and its high population density make it an economically important region.
According to the MSRHS, 19 percent of households in Mon own rubber farms, making the sector as large as the state’s rice sector. Of the rubber farms surveyed in the MSRHS, 19 percent were in Thaton, the district bordering Yangon Region, and 71 percent were in Mawlamyine District, which borders Thailand and Tanintharyi Region. The central part of the state has the greatest concentration of rubber farms (in the townships of Kyaikmaraw, Mudon, and Thanbyuzat). This is also where the largest rubber farms are found, averaging 7 hectares in Thanbyuzat. Forty-six percent of rubber farms are located in upland areas, 35 percent in lowland areas, and 19 percent on coastal land. Only 26 percent of rice producers, in contrast, are found in upland areas, and 57 percent are in lowland areas.
As in other states, rubber plantations in Mon are increasing both in size and in terms of their economic contribution to the state. According to MOAI, planted area in Mon has increased 8 percent annually, from 53,400 hectares in 1997–1998 to 197,900 hectares in 2014–2015. Rubber expansion is primarily occurring in upland areas in Mawlamyine District, though rubber producers have expanded in all townships and all geographic zones.
Rubber Producers The majority of Mon State rubber farmers are smallholders, owning less than 2 hectares of land.5 The average Mon State rubber plantation is 2.2 hectares, while the median plot size is 1.6 hectares. Rubber smallholders, for the most part, establish their plantations in their hometowns and work on their rubber farms with their families. In Mon State, 82 percent of rubber farms were built where the household head was born (CESD, IFPRI, and MSU 2016a). Rubber is often the sole source of agricultural income for rubber-producing households. While rubber revenues contributed 45 percent of household income, other crops added only 6 percent, and nonfarm income made up the remaining 49 percent (CESD, IFPRI, and MSU 2016a). Rubber farmers rely mainly on family labor for production. In Mon, 84 percent of heads of rubber-producing households work on their own rubber farms (CESD, IFPRI, and MSU 2016a). Depending on the amount of family labor the plantation has access to, the smallholder will hire outside workers to tap trees, clear weeds from the base of the rubber trees, or apply fertilizer.
Rubber and rice farming are the principal sources of agricultural income in Mon. When comparing rubber-farming households with rice-farming households and other rural households in Mon, we observe important differences between the families. Rubber-farming households are more remote than both rice-farming households and other rural households (Table 3.1). Only 35 percent of rubber farmers have access to electricity, while 47 percent of rice farmers have access and 54 percent of other rural households have access. Further, rubber-producing households are located farther from the coast and predominately in upland areas (Table 3.1). Rubber farmers, despite their more remote location, are not at an economic disadvantage. Per capita expenditures are actually higher among rubber-producing households than all other rural households. In addition, rubber-producing households have much higher ownership of land transportation vehicles, 74 percent, compared with 46 percent for all other groups.
5 Since the largest rubber plantation owners live in urban areas, and our survey focused on rural Mon, the largest plantations
were excluded from the survey. Therefore, these estimates do not include the largest plantations.
11
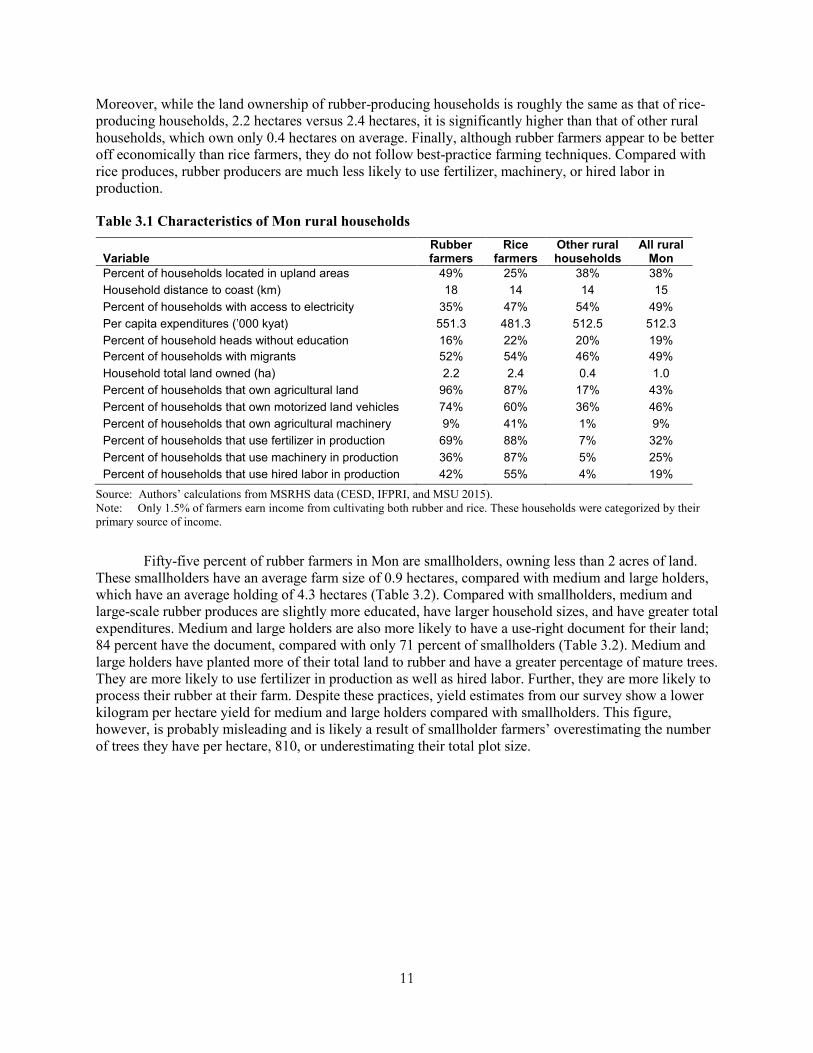
Moreover, while the land ownership of rubber-producing households is roughly the same as that of rice-producing households, 2.2 hectares versus 2.4 hectares, it is significantly higher than that of other rural households, which own only 0.4 hectares on average. Finally, although rubber farmers appear to be better off economically than rice farmers, they do not follow best-practice farming techniques. Compared with rice produces, rubber producers are much less likely to use fertilizer, machinery, or hired labor in production.
Table 3.1 Characteristics of Mon rural households
Variable Rubber farmers
Rice farmers
Other rural households
All rural Mon
Percent of households located in upland areas 49% 25% 38% 38% Household distance to coast (km) 18 14 14 15 Percent of households with access to electricity 35% 47% 54% 49% Per capita expenditures (’000 kyat) 551.3 481.3 512.5 512.3 Percent of household heads without education 16% 22% 20% 19% Percent of households with migrants 52% 54% 46% 49% Household total land owned (ha) 2.2 2.4 0.4 1.0 Percent of households that own agricultural land 96% 87% 17% 43% Percent of households that own motorized land vehicles 74% 60% 36% 46% Percent of households that own agricultural machinery 9% 41% 1% 9% Percent of households that use fertilizer in production 69% 88% 7% 32% Percent of households that use machinery in production 36% 87% 5% 25% Percent of households that use hired labor in production 42% 55% 4% 19%
Source: Authors’ calculations from MSRHS data (CESD, IFPRI, and MSU 2015). Note: Only 1.5% of farmers earn income from cultivating both rubber and rice. These households were categorized by their primary source of income.
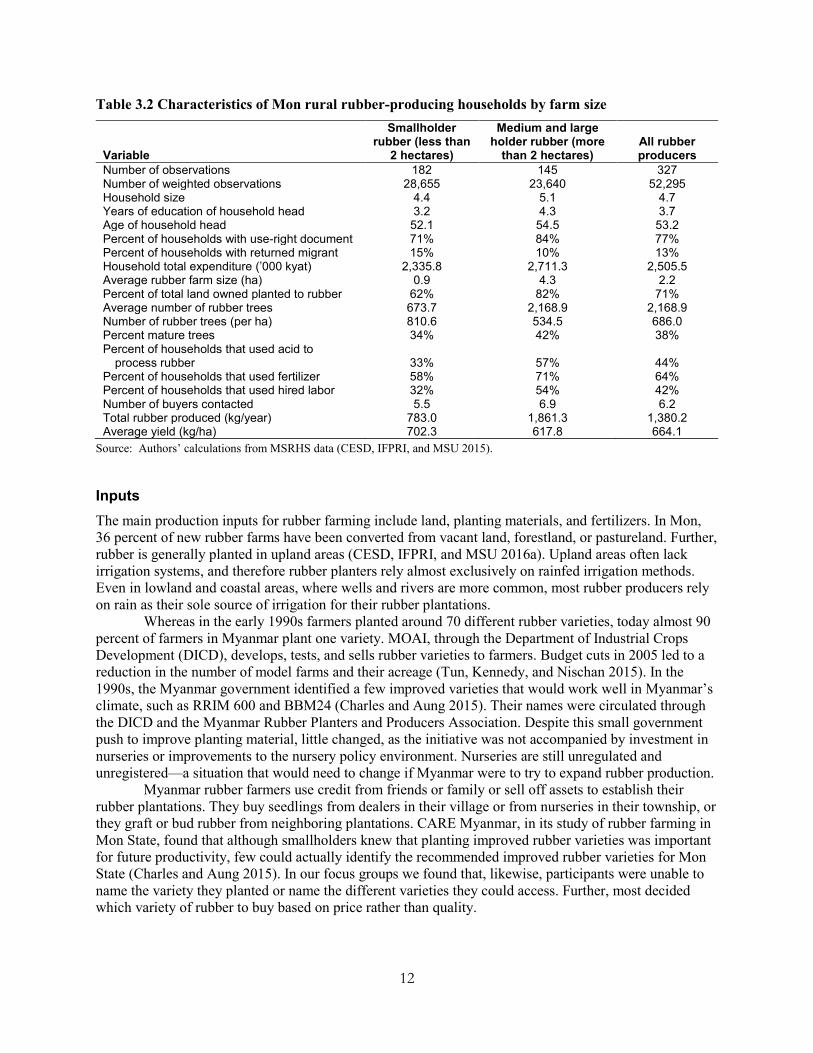
Fifty-five percent of rubber farmers in Mon are smallholders, owning less than 2 acres of land. These smallholders have an average farm size of 0.9 hectares, compared with medium and large holders, which have an average holding of 4.3 hectares (Table 3.2). Compared with smallholders, medium and large-scale rubber produces are slightly more educated, have larger household sizes, and have greater total expenditures. Medium and large holders are also more likely to have a use-right document for their land; 84 percent have the document, compared with only 71 percent of smallholders (Table 3.2). Medium and large holders have planted more of their total land to rubber and have a greater percentage of mature trees. They are more likely to use fertilizer in production as well as hired labor. Further, they are more likely to process their rubber at their farm. Despite these practices, yield estimates from our survey show a lower kilogram per hectare yield for medium and large holders compared with smallholders. This figure, however, is probably misleading and is likely a result of smallholder farmers’ overestimating the number of trees they have per hectare, 810, or underestimating their total plot size.
12
Table 3.2 Characteristics of Mon rural rubber-producing households by farm size
Variable
Smallholder rubber (less than
2 hectares)
Medium and large holder rubber (more
than 2 hectares) All rubber producers
Number of observations 182 145 327 Number of weighted observations 28,655 23,640 52,295 Household size 4.4 5.1 4.7 Years of education of household head 3.2 4.3 3.7 Age of household head 52.1 54.5 53.2 Percent of households with use-right document 71% 84% 77% Percent of households with returned migrant 15% 10% 13% Household total expenditure (’000 kyat) 2,335.8 2,711.3 2,505.5 Average rubber farm size (ha) 0.9 4.3 2.2 Percent of total land owned planted to rubber 62% 82% 71% Average number of rubber trees 673.7 2,168.9 2,168.9 Number of rubber trees (per ha) 810.6 534.5 686.0 Percent mature trees 34% 42% 38% Percent of households that used acid to
process rubber 33% 57% 44% Percent of households that used fertilizer 58% 71% 64% Percent of households that used hired labor 32% 54% 42% Number of buyers contacted 5.5 6.9 6.2 Total rubber produced (kg/year) 783.0 1,861.3 1,380.2 Average yield (kg/ha) 702.3 617.8 664.1
Source: Authors’ calculations from MSRHS data (CESD, IFPRI, and MSU 2015).
Inputs The main production inputs for rubber farming include land, planting materials, and fertilizers. In Mon, 36 percent of new rubber farms have been converted from vacant land, forestland, or pastureland. Further, rubber is generally planted in upland areas (CESD, IFPRI, and MSU 2016a). Upland areas often lack irrigation systems, and therefore rubber planters rely almost exclusively on rainfed irrigation methods. Even in lowland and coastal areas, where wells and rivers are more common, most rubber producers rely on rain as their sole source of irrigation for their rubber plantations.
Whereas in the early 1990s farmers planted around 70 different rubber varieties, today almost 90 percent of farmers in Myanmar plant one variety. MOAI, through the Department of Industrial Crops Development (DICD), develops, tests, and sells rubber varieties to farmers. Budget cuts in 2005 led to a reduction in the number of model farms and their acreage (Tun, Kennedy, and Nischan 2015). In the 1990s, the Myanmar government identified a few improved varieties that would work well in Myanmar’s climate, such as RRIM 600 and BBM24 (Charles and Aung 2015). Their names were circulated through the DICD and the Myanmar Rubber Planters and Producers Association. Despite this small government push to improve planting material, little changed, as the initiative was not accompanied by investment in nurseries or improvements to the nursery policy environment. Nurseries are still unregulated and unregistered—a situation that would need to change if Myanmar were to try to expand rubber production.
Myanmar rubber farmers use credit from friends or family or sell off assets to establish their rubber plantations. They buy seedlings from dealers in their village or from nurseries in their township, or they graft or bud rubber from neighboring plantations. CARE Myanmar, in its study of rubber farming in Mon State, found that although smallholders knew that planting improved rubber varieties was important for future productivity, few could actually identify the recommended improved rubber varieties for Mon State (Charles and Aung 2015). In our focus groups we found that, likewise, participants were unable to name the variety they planted or name the different varieties they could access. Further, most decided which variety of rubber to buy based on price rather than quality.
13
On average, 655 trees are planted per hectare; the median is 577. This is very high compared with the recommended 420 to 445 rubber trees per hectare. Rubber plantations are generally not intercropped. Plantation owners are unfamiliar with the appropriate planting distances for rubber trees (Charles and Aung 2015). Further, plantation owners do not know which other plants can be planted with rubber. Intercropping with other crops could add to the productivity and profitability of a newly developed rubber industry and could, perhaps, help defray some of the costs of upgrading rubber production.
Land is prepared using slash-and-burn or slash-and-clear techniques. Rubber plantation owners or hired labor plant the rubber seedlings. The owners and/or their workers often do not know the size of the hole needed for rubber planting (Charles and Aung 2015). Minimal care is given to the rubber plantation during the first five to seven years of growth. Initial investments in tapping and collecting materials such as knives, buckets, pans, and rubber sheet rollers must be made during this period.
Smallholders underuse fertilizer. Only 65 percent of rubber smallholder farmers in Mon reported using organic or chemical fertilizer in the past year. The farmers who did use fertilizer used on average 1.8 bags of fertilizer per acre (CESD, IFPRI, and MSU 2016a). The fertilizer was applied at the end of the rainy season. Producers understood that they were underusing fertilizer, but because of the low price of rubber, they did not want to invest the extra money to apply the recommended amounts. Compared to farmers in other sectors, rubber farmers were slightly more familiar with which fertilizer type to use, but, nonetheless, their knowledge was rudimentary and based primarily on fertilizer bags that were labeled with the word “rubber.”
Rubber smallholders rely heavily on family labor in maintaining their land. Families whose labor supply has migrated to Thailand use outside labor. Daily wages paid to rubber workers are around 5,000 kyats per day. Limiting fertilizer use and relying on family labor allows smallholders to cut costs.
Training in the varieties of rubber available for planting, in planting techniques, and in the benefits of intercropping with other crops, as well as in the appropriate use of fertilizer, would boost the production and the quality of rubber planted by smallholders.
Tapping and Collection Rubber tapping and collection is an especially weak link in the rubber value chain. Rubber tapping is carried out either by a family member working on the farm or by outside labor. Rubber tappers are generally paid 10 kyats per tree tapped. Smallholders tap their trees every day or two days in a row with knives and buckets. Rubber is tapped year-round, excluding the harshest months of the rainy season. Almost no one follows best practices and taps every other day. CARE Myanmar, in its survey, likewise found that only 4–9 percent of producers tap every other day. Tappers have not been trained in appropriate tapping practices. In Mon, more than 70 percent of farmers had no knowledge of the girth or the height of the tree required in order to start tapping. Further, 70 percent of farmers were also clueless as to the ideal angle to make initial incisions for tapping (Charles and Aung 2015). Finally, smallholders did not know where or how much of the plant to tap. Poor tapping practices lead to life loss for rubber trees. Therefore, government investment in areas such as improved varieties of rubber and marketing and certification schemes are of no value to smallholders if these farmers do not first improve their tapping practices.
After the rubber trees are tapped, the majority of smallholders process their rubber into sheets that they dry on the ground or by hanging. In Myanmar, it is very rare for smallholders to sell nonsheeted latex. The equipment used in most Myanmar farms for tapping—latex cups, collecting bins, grinding machines—is dirty (Phyu 2016). After the rubber is tapped, it is often mixed in containers with leaf or dirt debris. The rubber is then mixed with acid and water to coagulate. Water is oversupplemented, and nonrecommended acids are used to avoid paying high prices for the appropriate acids. After the rubber is sheeted it is dried in the sand or dirt, where it absorbs further debris. The sheets are then sold to traders for smoking. Although rubber sheets can be stored indefinitely, producers prefer to sell their sheets immediately. Traders will further contaminate the rubber by mixing in used rubber from other sources. Smallholders have limited incentive to keep rubber processing clean, as the current price differential
14
between different qualities of rubber is small. These issues must be addressed in some way, either by the government or through donors, in order to improve the quality and even viability of rubber production in Myanmar.
Yields As stated above, overall yield estimates for Myanmar vary depending on the source but range from 689 kilograms per hectare (MOAI estimate) to 726 kilograms per hectare (FAO estimate). The MOAI estimates are slightly higher than our survey estimates of 654 kilograms per hectare (median per tree estimates) (Figure 2.1). All the estimates place Myanmar’s yields below the yields of other major rubber-producing countries in the region, with average yields ranging between 1,500 and 2,000 kilograms per hectare.
Yields in Myanmar vary across township. According to MOAI data for 2014–2015, Kayin State, Mon State, and Ayeyarwady Region had the highest yields, at 855, 819, and 817 kilograms per hectare, respectively. More recent rubber-producing states, with far fewer plantations, such as Kachin, Shan, Saigaing, Yangon, and Rakhine, have yields under 600 kilograms per hectare, which is extremely low. Tanintharyi Region, which is one of the larger, more historical rubber-producing regions, has very low yields, of 621 kilograms per hectare (Myanmar, MOAI 2010). Differences in yields are a result of the differences in rubber varieties used across Myanmar, as well as differences in production regimes. Further, the decision to tap or not tap is reflected in the rubber yield numbers, which reveals differences in labor costs across Myanmar as well as in rubber prices.
Although yields are low, they are increasing. Yields have increased by 17 percent, or at a 2 percent growth rate over the 10-year period from 2004–2005 to 2014–2015. This, however, could simply be a result of overexploitation of trees to take advantage of high market prices or an increase in rubber production on large plantations. Increases in rubber tapping intensity in Mon State demonstrate that, indeed, this increase is probably not a result of improved production and tapping processes or the use of improved varieties.
Quality As a result of poor planting techniques, cultivation management, tapping practices, field-level processing, and factory-level processing, Myanmar rubber is of an extremely low quality. Traders interviewed in Mon felt that the quality of Myanmar’s rubber raw material was among the best in the world, but the quality of the country’s processed rubber was the worst in the world.
There are limited incentives across the value chain for rubber actors to produce higher-quality rubber. At the producer level, traders buy all rubber sheets regardless of quality. There is no formal grading system. Whereas in most countries rubber sheets are generally visually graded based on their characteristics, such as texture, color, and amount of resinous matter, in Myanmar the grade is determined almost entirely by the thickness of the rubber sheet.6 Therefore, prices are paid simply based on weight and not on the true quality of the rubber. Traders also have limited incentive to improve the quality of the rubber they sell to processers. Processors buy almost all rubber from traders, even though they often need to reprocess it due to its poor quality. The traders’ rubber is also graded by weight and not physical quality. At the processor level, there is no certification scheme or public lab to test rubber quality. Therefore, processors will always receive a discounted price on the world market for their rubber, as they cannot guarantee its quality.7
6 In Myanmar weight is used as a proxy to measure rubber quality. The thicker the sheet, the more water or other particles
the sheet has and the lower the quality of the sheet, and the lower the price the producer will receive. 7 Although Myanmar does sell different types of rubber (sheet and block) and different grades of rubber that receive
different prices on the world market, they all face a discounted price within their grade because of the lack of a certification scheme.
15
Rubber Processing Rubber produced in Myanmar is primarily brought to market in the form of Ribbed Smoked Sheets (RSS) and Technically Specified Rubber (TSR), or block rubber. RSS rubber is made directly from latex, which is treated to cause coagulation and then air-dried or smoked. TSR can be produced both from latex coagulum, known as cup lump, and from sheet rubber. RSS made up 60 percent of Myanmar’s raw rubber exports in 2012, while TSR made up 40 percent (Myanmar, MOC and ITC 2015). Myanmar exports low-grade rubber of both types. Increasing production of TSR rubber for export may be an easier target for Myanmar than upgrading RSS production. Whereas smallholder production of clean and uniform sheets is a requirement for the production of higher-grade RSS, it is not necessary for the production of TSR. In order to upgrade RSS rubber production, smallholders would need to deliver raw latex to factories to be treated and dried. This would be a burden for many smallholders, who would have to transport their latex to distant factories every day. Another option for the production of high-grade RSS rubber would be for smallholders to invest in sheeting machinery for their farms, which would be extremely costly. In contrast, to upgrade TSR production, most of the investments would occur at the processing level. Further, farmers could continue to sell their sheeted latex of a slightly poorer quality, because TSR processing involves dewatering, dirt removal, redrying, and blending of rubber sheets.
There are two state-run rubber processors and 10 private processors in Myanmar (Myanmar, MOC and ITC 2015). The majority are located in and around Mudon. Two nongovernment processing companies established themselves in Mon before the 2004 liberalization of the sector. The remaining processing companies set up their facilities after 2010, following the increase in rubber output in the region and the government transition. In recent years, changing investment laws in Myanmar have permitted local companies to enter into joint ventures with foreign companies. So far, two joint ventures have been established with Thai rubber giants (Sri Trang 2016; Southland Holding Company 2013).
Processing factories in Myanmar produce mainly RSS rubber for export to China or Malaysia (Myanmar, MOC and ITC 2015). Because rubber production in Myanmar is still limited compared to world demand, there has not yet been a time when Myanmar supply has outpaced demand, despite the low quality of the rubber.
At the processing level, the technologies used in treating rubber in Myanmar are often inadequate and outdated. Most importantly, infrastructure is limited. Most processing plants do not have reliable electricity and must therefore rely on generators to produce electricity, which is costly and of questionable reliability. There is also a lack of regulations for rubber processors. Although the Ministry of Industry (MOI) issues licenses for rubber factories to operate, there are no regulations regarding rubber production processes. Further, there are no standard operating procedures to control the quality of processed rubber. For example, TSR is not properly labeled, as there are no quality control laboratories.
Rubber Manufacturing Myanmar rubber is primarily exported for use in tire manufacturing. Local industry plays a very small role in the rubber value chain. The Myanmar Times estimated that only 8 percent of the country’s total rubber production is used in manufacturing in Myanmar (Htwe 2015a). The processing of natural rubber is costly because it requires expensive inputs, most of which must be imported. There are four tire factories in Myanmar; two are owned by MOI, one is owned by Myanmar Economic Cooperation, and one is private, the Yangon Tire Factory (Myanmar, MOC and ITC 2015). Other rubber factories include those that weave rubber products and those that manufacture traditional rubber sandals (Mitra 2015). Rubber soles are one of the few value-added rubber products that Myanmar exports. In 2013, Myanmar exported US$6.4 million worth of outer soles to the Republic of Korea and US$107.6 million to Japan. While Myanmar’s rubber sole exports accounted for only 0.9 percent of Korea’s rubber imports, rubber soles accounted for 7.2 percent of Japan’s rubber imports (Myanmar, MOC and ITC 2015). This is clearly a market that could be further developed.
16
Marketing Farmers sell their rubber sheets to traders. If the farmer’s plot size is large enough, the trader will travel to the plantation to buy the rubber. Sometimes, however, the farmer will go to the trader to sell the rubber. In this case, the farmer is responsible for paying for transport. Farmers will sell to the trader who can offer the most money, but the price varies little between traders. Although processers claimed that farmers could sell directly to their factories in addition to selling to traders, we found no instances of this in our fieldwork.
There are three levels of traders in Myanmar’s rubber value chain. Because Mudon is the center of rubber trading in Myanmar, the distance of a smallholder’s plot from Mudon City determines the number of traders the rubber will pass through before arriving at a processor. Traders who collect rubber from rural villages are first-level rubber traders. They are often rubber farmers as well as traders. They sell the rubber they buy to second-level traders, or those located in township city centers. These traders are usually traders only, and not farmers. Further, many of them trade multiple commodities in addition to rubber, such as limes or betel nut. Rubber farmers located close to cities bring their rubber directly to these traders, skipping the first-level traders. Second-level traders sell their rubber to third-level traders, or traders located in Mudon City. These traders have smoking plants, where the rubber undergoes preliminary processing before being sold to processing companies. The traders sell their rubber to the processing company in Mudon that can offer the highest price. In Mudon there are around 70 rubber traders—50 collecting from rural villages and 20 in Mudon City.
Traders finance producers and other collectors down the value chain as well as provide transport. Traders at all levels of the value chain claimed to earn between 10 and 20 kyats per pound of rubber. This implies that a rubber farmer located in a rural township and not in Mudon could receive as much as 60 kyats less per pound of rubber than the rubber purchase price.
In Myanmar the processing factories set the rubber prices, based on international market prices, mainly from Malaysia and Singapore, and international demand. Rubber production in Myanmar has little to no effect on the country’s rubber prices. Therefore, although much more rubber is produced in Myanmar’s cold season than in the hot season, this has no effect on price. Processors claim that there is never a shortage of demand, so they will buy all rubber year-round.
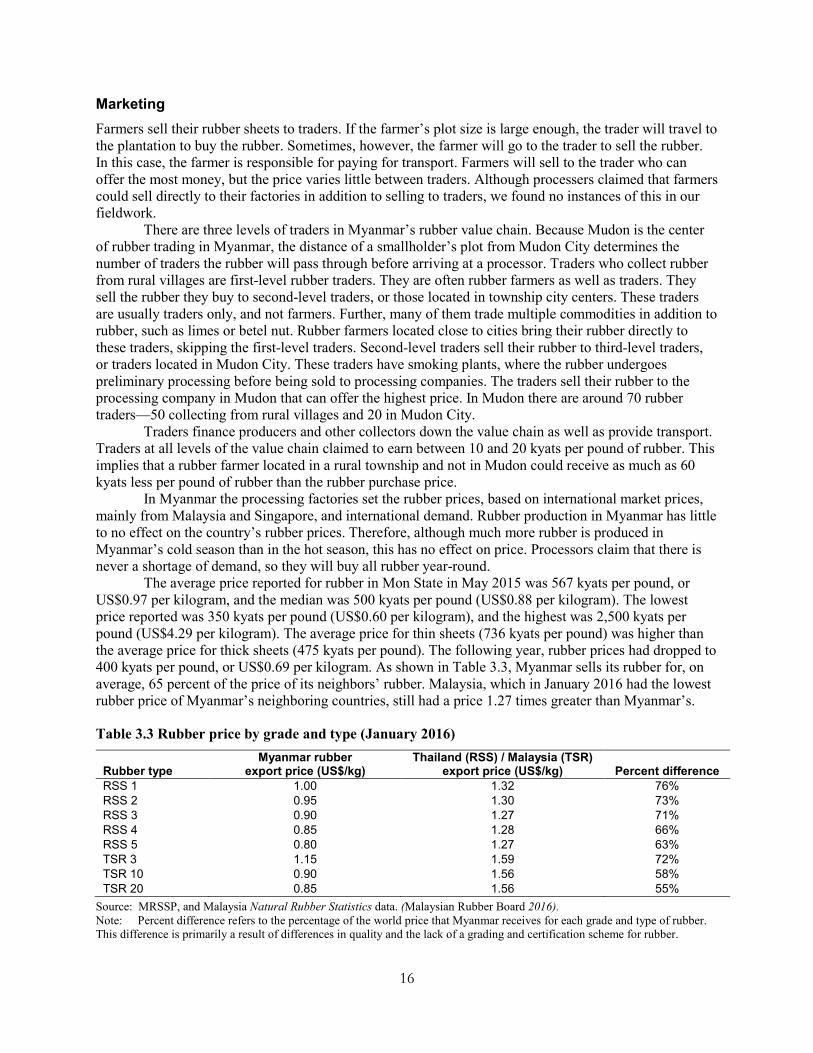
The average price reported for rubber in Mon State in May 2015 was 567 kyats per pound, or US$0.97 per kilogram, and the median was 500 kyats per pound (US$0.88 per kilogram). The lowest price reported was 350 kyats per pound (US$0.60 per kilogram), and the highest was 2,500 kyats per pound (US$4.29 per kilogram). The average price for thin sheets (736 kyats per pound) was higher than the average price for thick sheets (475 kyats per pound). The following year, rubber prices had dropped to 400 kyats per pound, or US$0.69 per kilogram. As shown in Table 3.3, Myanmar sells its rubber for, on average, 65 percent of the price of its neighbors’ rubber. Malaysia, which in January 2016 had the lowest rubber price of Myanmar’s neighboring countries, still had a price 1.27 times greater than Myanmar’s.
Table 3.3 Rubber price by grade and type (January 2016)
Rubber type Myanmar rubber
export price (US$/kg) Thailand (RSS) / Malaysia (TSR)
export price (US$/kg) Percent difference RSS 1 1.00 1.32 76% RSS 2 0.95 1.30 73% RSS 3 0.90 1.27 71% RSS 4 0.85 1.28 66% RSS 5 0.80 1.27 63% TSR 3 1.15 1.59 72% TSR 10 0.90 1.56 58% TSR 20 0.85 1.56 55%
Source: MRSSP, and Malaysia Natural Rubber Statistics data. (Malaysian Rubber Board 2016). Note: Percent difference refers to the percentage of the world price that Myanmar receives for each grade and type of rubber. This difference is primarily a result of differences in quality and the lack of a grading and certification scheme for rubber.
17
When comparing farmgate prices with export prices, we see that that the average farmgate price is 83 percent of the export price for standard block rubber. Mon rubber producers face low farmgate prices because of substandard marketing channels. In practice, most farmers, particularly smallholders, want to liquidate their rubber as soon as possible and therefore sell regardless of market price. Furthermore, most rubber is sold either through two or three levels of traders, which significantly reduces the price received by the farmers.
There is currently no rubber-marketing infrastructure in Myanmar. The government has recognized the need for such infrastructure, and newspapers indicate that Myanmar’s first central rubber market will be set up in Mawlamyine. Exporters will be able to buy rubber through an auction system at the market. Planters can refuse to sell if they are not happy with the bid (Htwe 2015b). At the time of this writing, however, there was no evidence that any such market was being erected, and producers across Mon State had not heard about this plan.
Policy Support Several different state actors manage the various levels of the value chain in the Myanmar rubber sector. The forest department, under the Ministry of Environmental Conservation and Forestry, manages current and future land under rubber cultivation. MOAI manages land use through its Settlement and Land Records Department. MOAI also manages training and education and research and development in both upstream and downstream rubber industries. Inspection and industrial supervision, however, falls under the jurisdiction of MOI, under the Directorate of Industrial Supervision and Inspection. Further, MOI issues business licenses, promotes small and medium-size enterprises, and manages the last components of the state-owned rubber industry. The Ministry of Commerce (MOC) also governs aspects of the rubber industry, as it manages trade policy, import and export licenses, border control, and trade promotion. The Ministry of Science and Technology (MOST) provides research on rubber products, including rubber polymers. Finally, the Ministry of Finance and Revenue (MOFR), through the Myanmar Foreign Trade Bank, the Myanmar Investment and Commercial Bank, and the Myanmar Economic Bank, provides commercial banking and foreign exchange services for the sector (Myanmar, MOC and ITC 2015).
The Department of Agriculture (DOA) runs rubber extension programs under the umbrella of MOAI. In Mon, there is a DOA extension office in each township. While the DOA spoke of an extensive training program, smallholders claimed that they had not benefited from one. Only 2.7 percent of households in Mon had met with a government extension agent in the last 12 months. Meetings with private extension agents were more common (7.6 percent). The majority of these private extension agents worked for fertilizer or pesticide companies, though, and provided extension services only in conjunction with the purchase of their agricultural inputs. Therefore, despite the supposed presence of extension infrastructure, little training is actually taking place.
The institutional capacity of these entities is weak, and there is little cooperation among the different government organizations and private stakeholders. Therefore, despite the myriad state agencies that control aspects of the rubber industry, the laws governing the sector are limited. There are almost no regulations related to the planting of rubber nurseries or the distribution of cultivars. A notification requiring the registration of all rubber nurseries was issued by MOAI in 1992 but was never actually implemented (Myanmar, MOC and ITC 2015). There are no laws governing rubber trading. Traders do not need to be registered, which makes rubber quality control nearly impossible. Processors do need to register with the Directorate of Industrial Supervision and Inspection under MOI; however, this has very little impact on sector governance, as there are no laws regulating processing or the type and quality of processed rubber. Finally, exporters are required to obtain permits from the Department of Commerce and Consumer Affairs under MOC. But, like processors, exporters face no regulations related to the types and grades of rubber exported, and there is no certification system for the quality of rubber exported. Increasing rubber production, rubber quality, and farmers’ incomes will require immense focus and coordination on the part of the government institutions that regulate rubber production.
18
Potential Interventions and Policy Options
Rubber Production Markets for rubber inputs—land, planting material, fertilizer, acid—are weak. Prohibitive land-use regulations are a major obstacle to the expansion of smallholder production and thus seriously hinder the development of the sector. These regulations must be reformed in order to allow smallholders to purchase new rubber plantations or expand their current production sites. Regulations should be passed to control nursery operations such as the importation and distribution of cultivars. Cultivars should be tested locally, prior to distribution among producers. Finally, input regulations should be strengthened to ensure the importation of safe inputs only.
The manner in which rubber trees are planted and maintained throughout their lifetime affects rubber yields. Rubber farmers in Mon are generally not familiar with best practices in planting or plantation upkeep. Education programs and training are necessary to raise awareness of best practices in purchasing planting material, planting rubber, using fertilizer, tapping, and collection. Smallholders will also need to be trained in field-level processing. Smallholders should be made aware of the different processing inputs available and their uses. Extension—either through the government alone or through the government in partnership with universities, agronomists and other experts, local companies, or donors—is essential to improving cultivation management.
Promoting diversification will help defray the costs of rubber investments and therefore increase rubber smallholder income. Combining livestock husbandry with rubber production is another way to increase smallholder income. Rarely are rubber plantations intercropped when rubber trees are young. Farmers are unaware of other crops that would thrive in rubber production areas and are worried about the effect that other plants would have on their rubber trees. Therefore, training in intercropping is also necessary to improve rubber smallholder well-being.
Loan programs should be targeted to rubber producers to help them obtain funds for planting, replanting, intercropping, and fertilizer. Smallholders could also use loans or subsidies from township-wide rubber associations that fund inputs with shareholder money (this model already exists in Mon and could be further encouraged through government support). For example, Mon rubber producers are largely familiar with recommended rubber fertilizer types and application amounts, but smallholder rubber producers nevertheless rarely apply the recommended fertilizer amount. In fact, fertilizer is often the first input dropped by cash-constrained smallholders, as rubber trees will produce with and without fertilizer. Access to formal financing will not only help producers afford materials, such as fertilizer, and technologies, but will also help them pay a higher wage to workers for cleaner rubber processing.
A fund for replanting trees could promote transformation of the rubber sector. As a result of low prices, replanting seems to have stalled in Mon State. In recent years, farmers have not been incentivized to replant their old or underperforming rubber trees. However, as rubber seedling prices are currently low (250 to 350 kyats, on average), this would be a perfect time for producers to replant. Encouraging continued replanting would help guarantee sufficient rubber production for export. The government should encourage replanting either by subsidizing rubber seedling prices or by setting up an investment fund for replanting. The government could seek the support of a development bank or other development financial institution actively looking to invest in Myanmar.
Rubber Processing, Grading, and Certification A rubber grading system as well as a standard payment method for graded rubber will be essential for growth in the rubber sector. Only by adopting these standards will Myanmar be able to improve the cleanliness and consistency of its rubber. Most rubber exporting countries have issued standards concerning the technical specifications for block rubber. These standards have become recognizable brands on the world market. TSR in Thailand is known as STR (Standard Thai Rubber), in Indonesia as SIR (Standard Indonesian Rubber), and in Malaysia as SMR (Standard Malaysian Rubber). These labels comprise different grades—STR 10 and STR 20, for example. Each grade is tested for dirt, ash, volatile
19
matter, and nitrogen content as well as plasticity and color. Although some factories use the label of Myanmar Standard Rubber (MSR) 10 and 20, the quality of MSR 10 or MSR 20 varies significantly within the grade. Moreover, the quality of MSR 20 is much below that of TSR 20 and equivalents, and therefore Myanmar receives a discounted price for what appears to be the same grade.
The Myanmar rubber industry needs to brand the MSR grading system and ensure that products that receive the name MSR are of the correct quality. To enable this, the country needs an appropriate pricing system for MSR. Sheets, slabs, and clumps should not be purchased at farmgate based on wet weight, but instead by sheet thickness and visual qualities (that is, visual contamination). Moreover, grading facilities must be introduced. Before the rubber is sold to the processor it should be graded. The processors should only market their rubber as MSR 10 or MSR 20 if the sheets purchased to make the blocks are indeed of that grade. Only by adopting strict grading, marketing, and payment standards across the rubber value chain will the government be able to improve prices to producers and develop the rubber sector.
A rubber certification system is also necessary. Without a certification system, processors will receive lower prices and will not be able to access important rubber markets. The government, through the Research, Technology, and Training Center for Rubber Products (RTTCRP), is currently in charge of evaluating the quality of processed rubber. Tests are conducted on an irregular basis, however, and the RTTCRP laboratory is not accredited. This certification must be delivered by an independent third party, according to international standards. The ISO 9000 industrial standard series emphasizes quality control, which is required in the rubber manufacturing industry. Creating or inviting a body to provide ISO 9000 certification would be a first step in quality control management of raw rubber production in Myanmar. This would assist Myanmar in the promotion of its rubber products exports, as more and more buyers require the ISO 9000 standard.
Sector Governance Improving rubber-sector governance is crucial. At present, rubber processors do not need to be certified to export rubber. This means that even if processors use the MSR label, there is no way for the rubber quality to be assured, because processors cannot be held accountable. A rubber-specific governance body should be established, similar to the Malaysian Rubber Board or the Thai Rubber Association. The body should not only focus on the manufacture and marketing of rubber and rubber products but also on rubber production, from cultivation to extraction. In this way, the rubber sector could benefit from a coherent sector strategy and standard polices. Through this body, rubber processers could become certified. If creating a rubber-specific body is not desired, then Myanmar should set up a governing body for the sector under MOI, to ensure that processors are certified and producing quality product.
20
4. PROFITABILITY OF RUBBER INVESTMENTS
Mon Rubber Production Structure and Costs The sharp decline in international rubber prices relative to their peaks in 2011–2012 has dramatically affected the profitability of rubber investments in Myanmar. In this section, we construct estimates of overall returns to investments in smallholder rubber, given changes in rubber prices, labor costs, and farming techniques. We use data from the MSRHS to determine Mon rubber farm structure and costs. We also make assumptions about labor costs based on field interviews and focus groups.
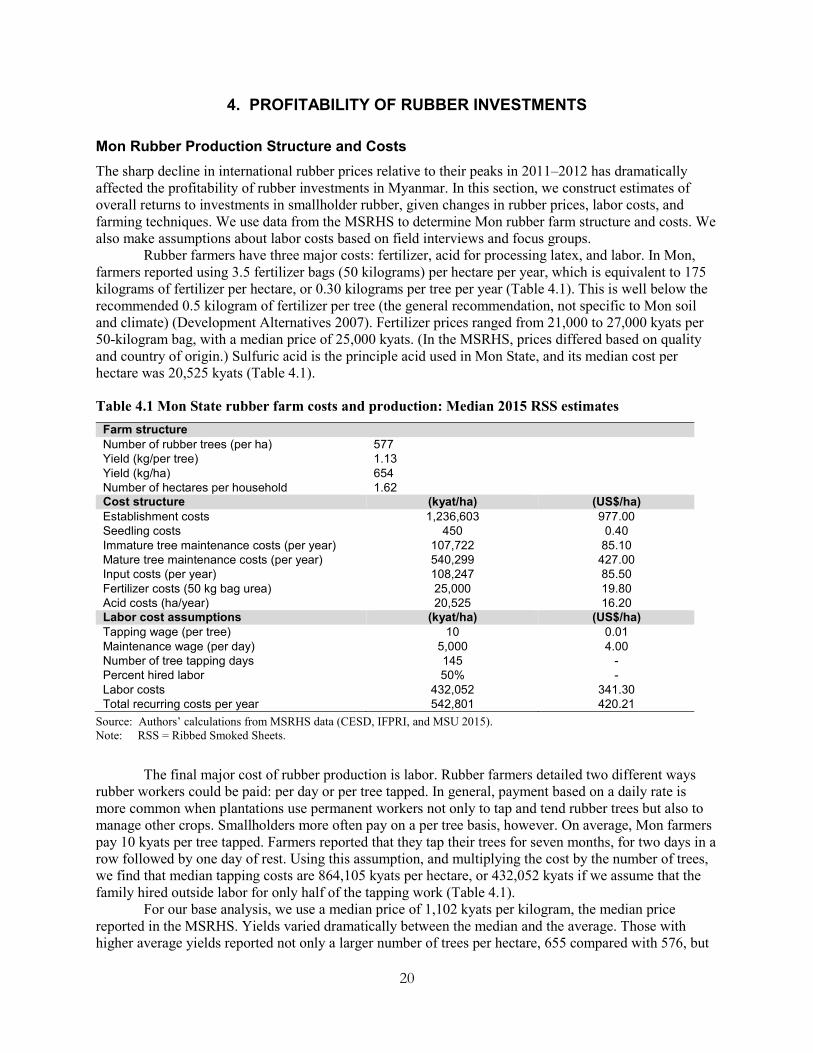
Rubber farmers have three major costs: fertilizer, acid for processing latex, and labor. In Mon, farmers reported using 3.5 fertilizer bags (50 kilograms) per hectare per year, which is equivalent to 175 kilograms of fertilizer per hectare, or 0.30 kilograms per tree per year (Table 4.1). This is well below the recommended 0.5 kilogram of fertilizer per tree (the general recommendation, not specific to Mon soil and climate) (Development Alternatives 2007). Fertilizer prices ranged from 21,000 to 27,000 kyats per 50-kilogram bag, with a median price of 25,000 kyats. (In the MSRHS, prices differed based on quality and country of origin.) Sulfuric acid is the principle acid used in Mon State, and its median cost per hectare was 20,525 kyats (Table 4.1).
Table 4.1 Mon State rubber farm costs and production: Median 2015 RSS estimates Farm structure Number of rubber trees (per ha) 577 Yield (kg/per tree) 1.13 Yield (kg/ha) 654 Number of hectares per household 1.62 Cost structure (kyat/ha) (US$/ha) Establishment costs 1,236,603 977.00 Seedling costs 450 0.40 Immature tree maintenance costs (per year) 107,722 85.10 Mature tree maintenance costs (per year) 540,299 427.00 Input costs (per year) 108,247 85.50 Fertilizer costs (50 kg bag urea) 25,000 19.80 Acid costs (ha/year) 20,525 16.20 Labor cost assumptions (kyat/ha) (US$/ha) Tapping wage (per tree) 10 0.01 Maintenance wage (per day) 5,000 4.00 Number of tree tapping days 145 - Percent hired labor 50% - Labor costs 432,052 341.30 Total recurring costs per year 542,801 420.21
Source: Authors’ calculations from MSRHS data (CESD, IFPRI, and MSU 2015). Note: RSS = Ribbed Smoked Sheets.
The final major cost of rubber production is labor. Rubber farmers detailed two different ways rubber workers could be paid: per day or per tree tapped. In general, payment based on a daily rate is more common when plantations use permanent workers not only to tap and tend rubber trees but also to manage other crops. Smallholders more often pay on a per tree basis, however. On average, Mon farmers pay 10 kyats per tree tapped. Farmers reported that they tap their trees for seven months, for two days in a row followed by one day of rest. Using this assumption, and multiplying the cost by the number of trees, we find that median tapping costs are 864,105 kyats per hectare, or 432,052 kyats if we assume that the family hired outside labor for only half of the tapping work (Table 4.1).
For our base analysis, we use a median price of 1,102 kyats per kilogram, the median price reported in the MSRHS. Yields varied dramatically between the median and the average. Those with higher average yields reported not only a larger number of trees per hectare, 655 compared with 576, but
21
also a higher output per tree, 1.61 kilograms compared with 1.13 kilograms (Table 4.1). Differences in yields resulted in significant differences in revenue for producers. Using median costs and profits and assuming no family labor, rubber-farming revenue is negative. However, using average costs and profits, but keeping all other assumptions constant, revenue is positive. Because median yields are much more in line with the reality on the ground (median MSRHS yields are similar to government and FAO yield estimates), we use these for our analysis. Finally, transportation costs are assumed to be zero, since traders often purchase latex at the farm.
Mon Rubber Current Profitability Estimates First, we evaluate current profitability based on current (2016) costs and prices. In these estimates, only producers with mature trees are considered, and all initial investments are considered to be sunk costs. Using the base parameters presented above, we examine various price, labor, and planting scenarios. Currently, few smallholder farms rely entirely on hired labor for plantation management and tapping. We find that if all else remains constant, in order for smallholders to break even they need to use at least 28 percent family labor for tapping. A realistic estimate of the actual amount of family labor used in Mon is 50 percent. Using this assumption, but making no other changes to the model, we see revenues increase from -236,639 to 180,413 kyats per hectare, or 292,042 kyats overall, assuming a median plot size of 1.6 hectares. This is, however, only 18 percent of median income for rural Mon (1,612,000 kyats). If family labor is not used, yields would need to increase by 33 percent, from 654 to 870 kilograms per hectare, for producers to make a profit.
If the world rubber price continues to fall, or wage prices are driven up by increased migration to Thailand, rubber production with the current technology will not be sustainable. Using 50 percent family labor as the base model, if the price decreases by 25 percent, producers just break even; rubber production is no longer profitable. If prices continue to fall, to 2002 levels (a decline of 36 percent in real terms), rubber net income becomes negative. Likewise, rubber production would no longer be profitable if per tree harvesting costs rise from 10 kyats per tree to 15 kyats per tree, assuming 50 percent family labor.
The profitability of Mon rubber production practices could rise substantially if farmers adopted best practices—increasing fertilizer input from 0.3 to 0.5 kilograms per tree, using better-quality acid (thereby increasing acid costs by 20 percent), and reducing the number of trees per hectare from 576 to 520. Labor costs would decrease because trees would be tapped every other day instead of two or three days in a row. Although the amount of rubber produced would shrink due to fewer days of tapping, rubber yields would increase to 825.5 kilograms per hectare, a 40 percent increase. Assuming 50 percent family labor, revenue would increase to 741,820 kyats. Even if the rubber price were to decrease to 2002 levels, revenue would still be positive, at 212,000 kyats, only slightly below the current median revenue. A wage increase, likewise, would decrease revenue to a similar level but would allow for continued rubber production.
Mon Rubber Net Present Value Estimates Second, we evaluate future profitability through a series of net present value (NPV) calculations. Base assumptions used in these NPV calculations are presented in Table 4.2.8 In these analyses we evaluate potential earnings for smallholders selling both RSS and TSR. We assume that farmers who sell their rubber to TSR factories produce the lowest-quality rubber, and therefore receive the lowest prices, but they also have slightly lower production costs. In our base analysis, producers sell RSS 5 and TSR 50, the most common grades sold in Myanmar and the lowest grades sold on the international market. Further, producers sell low-quality RSS 5 and TSR 50, meaning that there is not only room for within-grade quality improvement, but also for improving quality enough to move up to a higher grade. We run
8 These calculations do not include export taxes, advanced income taxes, or other possible charges and fees that may be
levied on formal-sector exports, especially through Yangon. The application of these taxes and fees on exports would result in a further deterioration of the profitability of rubber exports.
22
analyses for this low-quality rubber but also for improved-quality grade 5 rubber and grade 3 rubber. We assume that these quality improvements are a result of improved producer collection, tapping, and sheeting practices achieved through training and do not require greater smallholder investments or costs. It is important to note that even if quality improvements such as these are made, Myanmar smallholders will continue to receive a discounted price for their higher-quality rubber unless grading and certification schemes are introduced. These analyses assume that these systems have been put in place.
Table 4.2 NPV model base assumptions Variable 2015 2016–2029 Myanmar CPI 3.1 5% inflation per year Myanmar exchange rate (kyat/US$) 1,151 5% depreciation per year Fertilizer urea (US$/mt) 25,713 4% increase per year Wage rate (kyat/day) 5,000 5% increase per year Wage rate (kyat/tree) 10 5% increase per year Discount rate 10% 10%
Source: Model simulations. Note: CPI = consumer price index; NPV = net present value.
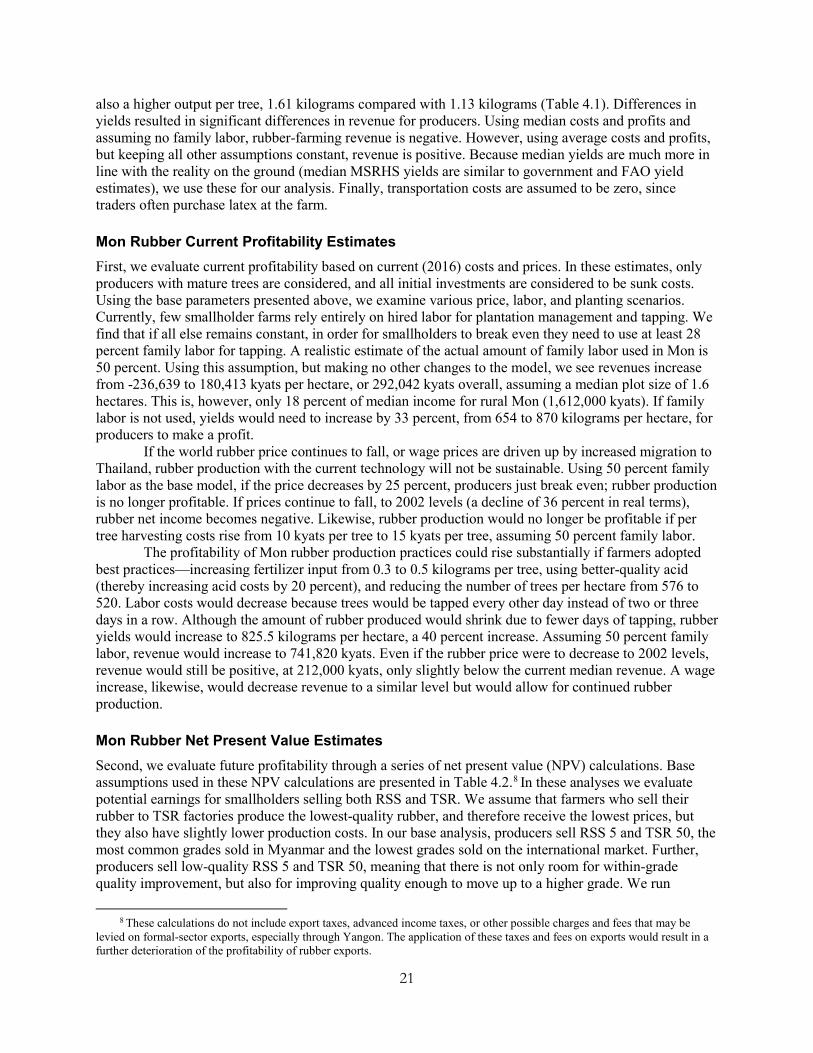
Rubber production in Mon expanded significantly in the late 2000s as Myanmar farmers responded to the sharp increase in world rubber prices. We examine the investment incentives of these Mon smallholders by calculating the NPVs of their new rubber investments using the historical costs and prices that prevailed in the years of initial investments (Figure 4.1). We hold the price and costs in the year of planting constant over the 20-year life of the rubber trees.
In 2009, when rubber prices first rose, the NPV of RSS rubber production was still very low, and the NPV for TSR rubber production was negative. This changed considerably with the rubber price increase of 2010 and 2011. Rubber investments became extremely profitable, rising to US$7,500 for RSS and US$6,800 for TSR per hectare. After 2013, when the price dropped back to pre-2009 levels, NPVs for both RSS and TSR became negative. Further, they became even more negative than NPVs in 2009, because of increasing labor costs. Thus far, at the time of this writing, in 2016 the prices have dropped below 2015 levels, and 2016 NPVs are the lowest for the entire period: -US$1,800 and -US$1,900 per smallholder farm, respectively.
Figure 4.1 Estimated net present values of new rubber investments
Source: Model simulations.
-4,000
-2,000
0
2,000
4,000
6,000
8,000
2009 2010 2011 2012 2013 2014 2015 2016US$
(201
5) /
hect
are
Ribbed Smoked Sheets (RSS) Technically Specified Rubber (TSR)
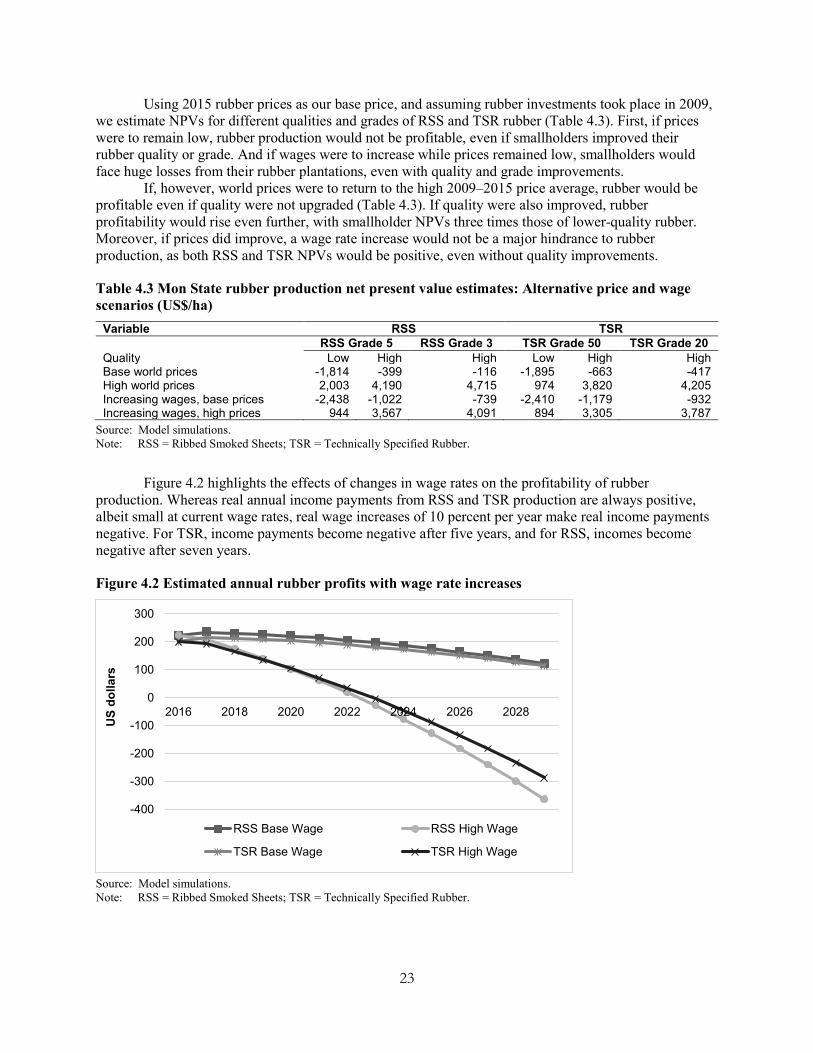
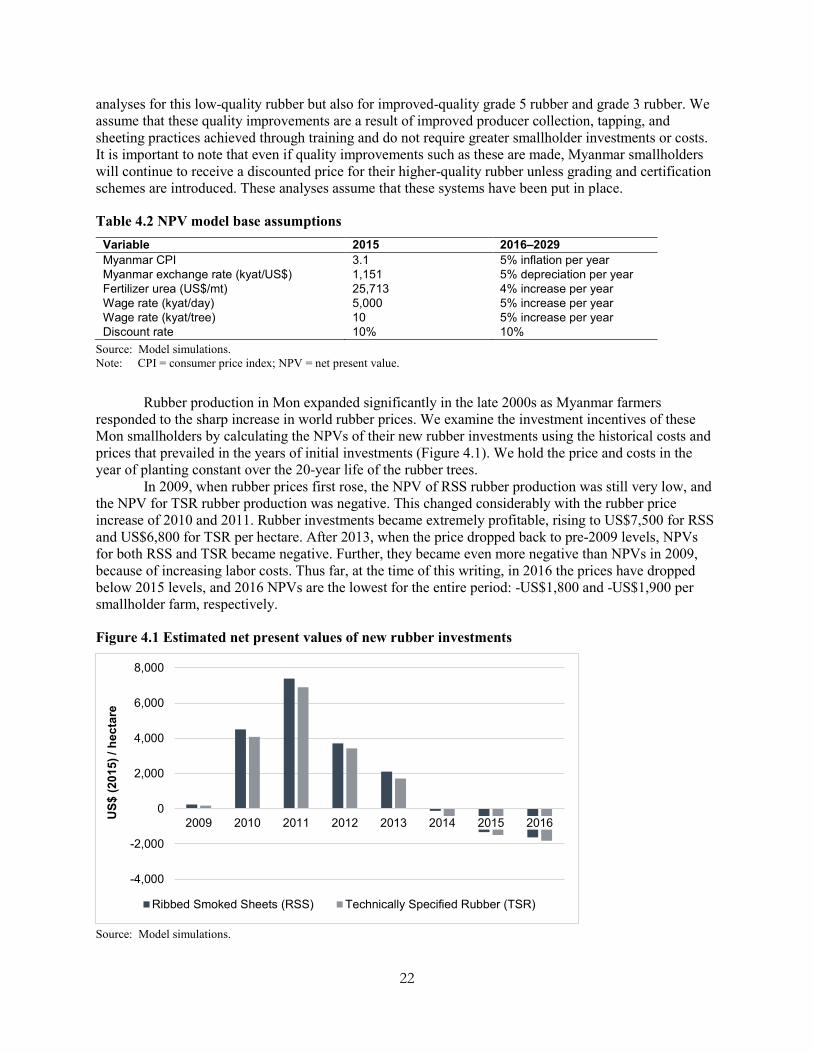
23
Using 2015 rubber prices as our base price, and assuming rubber investments took place in 2009, we estimate NPVs for different qualities and grades of RSS and TSR rubber (Table 4.3). First, if prices were to remain low, rubber production would not be profitable, even if smallholders improved their rubber quality or grade. And if wages were to increase while prices remained low, smallholders would face huge losses from their rubber plantations, even with quality and grade improvements.
If, however, world prices were to return to the high 2009–2015 price average, rubber would be profitable even if quality were not upgraded (Table 4.3). If quality were also improved, rubber profitability would rise even further, with smallholder NPVs three times those of lower-quality rubber. Moreover, if prices did improve, a wage rate increase would not be a major hindrance to rubber production, as both RSS and TSR NPVs would be positive, even without quality improvements.
Table 4.3 Mon State rubber production net present value estimates: Alternative price and wage scenarios (US$/ha)
Variable RSS TSR RSS Grade 5 RSS Grade 3 TSR Grade 50 TSR Grade 20 Quality Low High High Low High High Base world prices -1,814 -399 -116 -1,895 -663 -417 High world prices 2,003 4,190 4,715 974 3,820 4,205 Increasing wages, base prices -2,438 -1,022 -739 -2,410 -1,179 -932 Increasing wages, high prices 944 3,567 4,091 894 3,305 3,787
Source: Model simulations. Note: RSS = Ribbed Smoked Sheets; TSR = Technically Specified Rubber.
Figure 4.2 highlights the effects of changes in wage rates on the profitability of rubber production. Whereas real annual income payments from RSS and TSR production are always positive, albeit small at current wage rates, real wage increases of 10 percent per year make real income payments negative. For TSR, income payments become negative after five years, and for RSS, incomes become negative after seven years.
Figure 4.2 Estimated annual rubber profits with wage rate increases
Source: Model simulations. Note: RSS = Ribbed Smoked Sheets; TSR = Technically Specified Rubber.
-400
-300
-200
-100
0
100
200
300
2016 2018 2020 2022 2024 2026 2028
US
dolla
rs
RSS Base Wage RSS High Wage
TSR Base Wage TSR High Wage
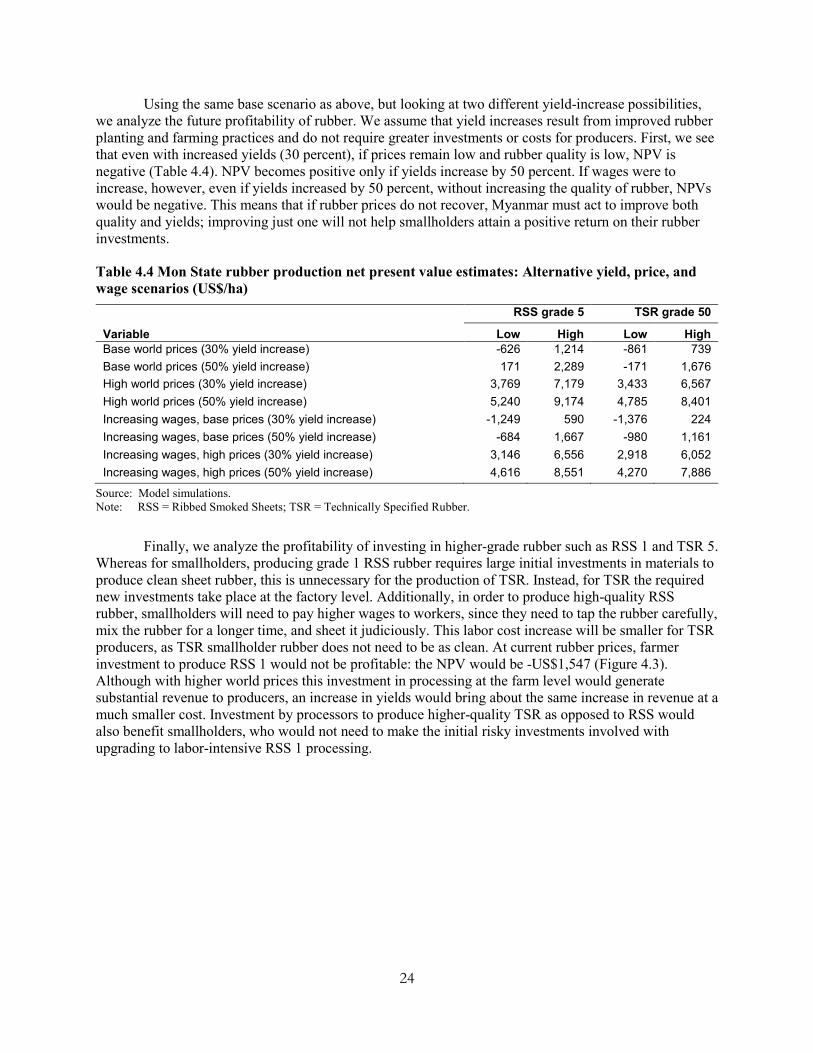
24
Using the same base scenario as above, but looking at two different yield-increase possibilities, we analyze the future profitability of rubber. We assume that yield increases result from improved rubber planting and farming practices and do not require greater investments or costs for producers. First, we see that even with increased yields (30 percent), if prices remain low and rubber quality is low, NPV is negative (Table 4.4). NPV becomes positive only if yields increase by 50 percent. If wages were to increase, however, even if yields increased by 50 percent, without increasing the quality of rubber, NPVs would be negative. This means that if rubber prices do not recover, Myanmar must act to improve both quality and yields; improving just one will not help smallholders attain a positive return on their rubber investments.
Table 4.4 Mon State rubber production net present value estimates: Alternative yield, price, and wage scenarios (US$/ha)
RSS grade 5 TSR grade 50
Variable Low High Low High Base world prices (30% yield increase) -626 1,214 -861 739 Base world prices (50% yield increase) 171 2,289 -171 1,676 High world prices (30% yield increase) 3,769 7,179 3,433 6,567 High world prices (50% yield increase) 5,240 9,174 4,785 8,401 Increasing wages, base prices (30% yield increase) -1,249 590 -1,376 224 Increasing wages, base prices (50% yield increase) -684 1,667 -980 1,161 Increasing wages, high prices (30% yield increase) 3,146 6,556 2,918 6,052 Increasing wages, high prices (50% yield increase) 4,616 8,551 4,270 7,886
Source: Model simulations. Note: RSS = Ribbed Smoked Sheets; TSR = Technically Specified Rubber.
Finally, we analyze the profitability of investing in higher-grade rubber such as RSS 1 and TSR 5. Whereas for smallholders, producing grade 1 RSS rubber requires large initial investments in materials to produce clean sheet rubber, this is unnecessary for the production of TSR. Instead, for TSR the required new investments take place at the factory level. Additionally, in order to produce high-quality RSS rubber, smallholders will need to pay higher wages to workers, since they need to tap the rubber carefully, mix the rubber for a longer time, and sheet it judiciously. This labor cost increase will be smaller for TSR producers, as TSR smallholder rubber does not need to be as clean. At current rubber prices, farmer investment to produce RSS 1 would not be profitable: the NPV would be -US$1,547 (Figure 4.3). Although with higher world prices this investment in processing at the farm level would generate substantial revenue to producers, an increase in yields would bring about the same increase in revenue at a much smaller cost. Investment by processors to produce higher-quality TSR as opposed to RSS would also benefit smallholders, who would not need to make the initial risky investments involved with upgrading to labor-intensive RSS 1 processing.
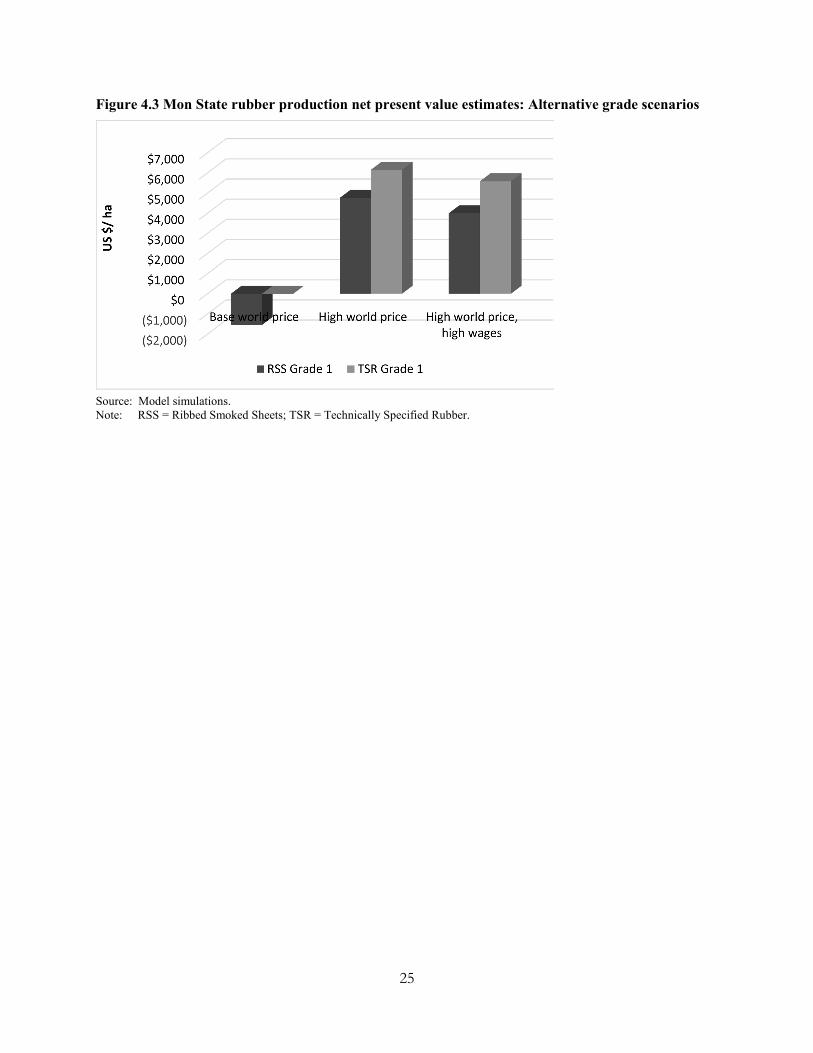
25
Figure 4.3 Mon State rubber production net present value estimates: Alternative grade scenarios
Source: Model simulations. Note: RSS = Ribbed Smoked Sheets; TSR = Technically Specified Rubber.
26
5. CONCLUSION
Myanmar’s rubber sector is at a critical juncture. Rubber production is projected to increase in the coming years as the trees planted during the recent rubber-price spike mature. Despite this production increase, the country will still need to overcome several major problems in order to become a large rubber exporter. Further, if some of these weaknesses are not addressed, the rubber sector will not only fail to grow but may actually collapse. Over the past five years, rubber prices have dropped substantially, making the tapping of rubber too expensive for many smallholders. If rubber prices continue to fall, or wages increase, smallholder rubber production will no longer be sustainable. Rubber prices are projected to increase steadily; however, in order for Myanmar to take advantage of this improved global rubber climate, major changes are needed.
The greatest challenges facing Myanmar’s smallholders are low rubber productivity, poor rubber quality, and lack of rubber policy support. Smallholders plant low-yielding rubber varieties as a result of poor nursery regulation, lack of research, and limited training of extension workers and farmers. Further, poor farming, tapping, and processing techniques result in low-yielding, low-quality rubber. Smallholders are untrained in critical areas, and tapping and processing techniques have seen little improvement over the past decade. Myanmar also lacks quality standards and certification processes for rubber processers, further lowering the prices farmers and processors receive for their rubber. Finally, the government does not have an integrated rubber strategy, so the sector is largely ungoverned and producers receive little or no support in terms of technology, training, or marketing.
Using cost structures built from primary data on Mon smallholders, we find that in the absence of a major increase in world prices (substantially above the 2000–2016 average), new rubber investments will not be profitable without major upgrades in yield and quality. Moreover, wage rates are likely to continue to rise as a result of limited labor surplus and increasing integration with the Thai labor market, further reducing the future profitability of the sector. Assuming prices do not improve, increasing only yields or only quality, or only improving the institutional environment, will not result in positive returns on investment for smallholders. Investments and reforms are needed in all three areas. In addition, maintaining macroeconomic stability and a competitive real exchange rate will be crucial to the profitability of the rubber sector.
Thus, a concerted effort is needed on the part of public institutions, farmers, and processors to improve yields, quality, and sector governance. If this effort is made, the rubber sector may blossom into not only an important supply of export earnings but also a major source of employment and rural income in Mon State. If the sector’s issues are not addressed, rubber production may instead cease to be a sustainable income source for rural smallholders.
27
REFERENCES
Baird, I. G. 2009. Land, Rubber and People: Rapid Agrarian Changes and Responses in Southern Laos. Vancouver, BC, Canada: University of British Columbia.
Besson, L. 2002. “Le Development de l’hévéaculture en Thaïlande Péninsulaire, Essai de Synthèse des Caractères Originaux.” PhD dissertation, Institut National Agronomique Paris-Grignon.
Burger, K., and H. P. Smit. 1997. The Natural Rubber Market: Review, Analysis, Policies and Outlook. London: Woodhead Publishing.
CESD (Centre for Economic and Social Development), IFPRI (International Food Policy Research Institute), and Michigan State University (MSU). 2016a. Mon State Livelihoods and Rural Development Report. Yangon, Myanmar: CESD, IFPRI, and MSU.
———. 2016b. Rural Livelihoods in Mon State: Evidence from a Representative Household Survey. Yangon, Myanmar: CESD, IFPRI, and MSU.
———2015. “Mon State Rural Household Survey (MSRHS).” Unpublished, Yangon, Myanmar: CESD, IFPRI, and MSU.
Charles, R., and U. S. Aung. 2015. Generating Rubber Opportunities for Myanmar (GRO Myanmar). Mawlamyine, Myanmar: CARE.
Delarue, J. 2011. Thailand: The World’s Leading Exporter of Natural Rubber Owing to Its Smallholders. Paris: Agence Française de Développement.
Development Alternatives. 2007. A Value Chain Assessment of the Rubber Industry in Indonesia. Jakarta, Indonesia: United States Agency for International Development.
FAO (Food and Agriculture Organization of the United Nations). 2015. FAOSTAT Production Data. Accessed November 17, 2016. http://faostat3.fao.org/download/Q/*/E.
Fox, J., and J.-C. Castella. 2013. “Expansion of Rubber (Hevea brasiliensis) in Mainland Southeast Asia: What Are the Prospects for Smallholders?” Journal of Peasant Studies 40: 155–170.
Global Witness. 2014. What Future for the Rubber Industry in Myanmar? Yangon, Myanmar.
Htwe, C. M. 2015a. “Low-Quality Rubber Holds Back Tyres.” Myanmar Times, November 19. www.mmtimes.com/index.php/business/17692-low-quality-rubber-holds-back-tyres.html.
———. 2015b. “Rubber Market to Be Built in Mawlamyine.” Myanmar Times, November 11. www.mmtimes.com/index.php/business/17536-rubber-market-to-be-built-in-mawlamyine.html.
International Rubber Study Group. 2015. “Latest World Rubber Industry Outlook Now Available from IRSG.” Accessed November 17, 2016. www.rubberstudy.com/news-article.aspx?id=5092&b=default.aspx.
Jayasuriya, S. K., and C. Barlow. 1984. “Problems of Investment for Technological Advance: The Case of Indonesian Rubber Smallholders.” Journal of Agricultural Economics 35 (1): 85–95.
Kenney-Lazar, M. 2016. Assessment of Governance Mechanisms, Livelihood Outcomes, and Incentives Instruments for Green Rubber in Myanmar. Bogor, Indonesia: Center for International Forestry Research.
Keong, V. P. 1973. “The Rubber Industry of Burma, 1876–1964.” Journal of Southeast Asian Studies 4 (2): 216–228.
Malaysian Rubber Board. Natural Rubber Statistics 2016. Kuala Lumpur, Malaysia. www.lgm.gov.my/nrstat/nrstats.pdf.
Manivong, V., and R. Cramb. 2007. “The Adoption of Smallholder Rubber Production by Shifting Cultivators in Northern Laos: Village Case Study.” In Smallholder Tree Growing for Rural Development and Environmental Services: Lessons from Asia, edited by D. J. Snelder and R. D. Lasco. New York: Springer.
———. 2008. “Economics of Smallholder Rubber Expansion in Northern Laos.” Agroforestry Systems 74: 113.
28
Mitra, S. 2015. “Tapping the White Gold Rubber.” Myanmar Insider, July. www.myanmarinsider.com/tapping-the-white-gold-rubber/.
Myanmar, MOAI (Ministry of Agriculture and Irrigation). 2010. Myanmar Agriculture Statistics 1998–2010. Yangon, Myanmar.
Myanmar, MOC (Ministry of Commerce) and ITC (International Trade Center). 2015. National Export Strategy of the Republic of the Union of Myanmar 2015–2019. Nay Pyi Taw, Myanmar.
Myanmar Rubber Planters and Producers Association. 2015. Myanmar Rubber Planted Area and Production. Yangon, Myanmar: Myanmar Rubber Planters and Producers Association.
Myint, H. 2013. “Rubber Planting Industry in Myanmar: Current Situation and Potentials.” Paper presented at the ASEAN Plus 2013 Rubber Conference, Phuket, Thailand, April 10–12.
Phyu, K. W. 2016. “Rubber Farmers Struggle as Prices Fall.” Myanmar Times, January 29. www.mmtimes.com/index.php/business/18743-rubber-farmers-struggle-as-prices-fall.html.
Simien, A. 2005. Caractérisation Socioéconomique et Modélisation des Exploitations Hévéicoles du Sud de la Thaïlande. Internship Report. Angers, France: Institut National d’Horticulture.
Southland Holding Company. 2013. “Alpha Commodities Pte. Ltd.” Accessed November 17, 2016. www.southlandholding.com/en/investment/alpha-commodities-pte-ltd.
Sri Trang. 2016. “Sri Trang Group Structure (Subsidiaries).” Accessed November 17, 2016. www.sritranggroup.com/en/about/subsidiaries.
Thongmanivong, S., F. Yayoi, K. Phanvilay, and T. Vongvisouk. 2009. “Agrarian Land Use Transformation in Northern Laos: From Swidden to Rubber.” Southeast Asian Studies 47 (3): 330–347.
Tun, T., A. Kennedy, and U. Nischan. 2015. Promoting Agricultural Growth in Myanmar: A Review of Policies and an Assessment of Knowledge Gaps. Yangon, Myanmar: Centre for Economic and Social Development and International Food Policy Research Institute.
UN (United Nations). 2016. Comtrade Data. Accessed November 17, 2016. http://comtrade.un.org/data/.
Woods, K. 2012. The Political Ecology of Rubber Production in Myanmar: An Overview. Yangon, Myanmar:
World Bank. 2016. Commodity Markets Data. Accessed November 17, 2016. www.worldbank.org/en/research/commodity-markets.
RECENT IFPRI DISCUSSION PAPERS
For earlier discussion papers, please go to www.ifpri.org/publications/discussion_papers. All discussion papers can be downloaded free of charge.
1609. How do agricultural development projects aim to empower women?: Insights from an analysis of project strategies. Nancy Johnson, Mysbah Balagamwala, Crossley Pinkstaff, Sophie Theis, Ruth Meinzen-Dick, and Agnes Quisumbing, 2017.
1608. Stimulating agricultural technology adoption: Lessons from fertilizer use among Ugandan potato farmers. Lydia Nazziwa-Nviiri, Bjorn Van Campenhout, and David Amwonya, 2017.
1607. Strengthening and harmonizing food policy systems to achieve food security: A case study and lessons from Ghana. Suresh Chandra Babu and Sylvia Blom, 2017.
1606. Trade and economic impacts of destination-based corporate taxes. Will Martin, 2017.
1605. Can better targeting improve the effectiveness of Ghana’s Fertilizer Subsidy Program?: Lessons from Ghana and other countries in Africa south of the Sahara. Nazaire Houssou, Kwaw Andam, and Collins Asante-Addo, 2017.
1604. The impact of Ethiopia’s Productive Safety Net Programme on the nutritional status of children: 2008–2012. Guush Berhane, John Hoddinott, and Neha Kumar, 2017.
1603. Economic transformation in Africa from the bottom up: Evidence from Tanzania. Xinshen Diao, Josaphat Kweka, and Margaret McMillan, 2017.
1602. Liquid milk: Cash constraints and day-to-day intertemporal choice in financial diaries. Xin Geng, Wendy Janssens, and Berber Kramer, 2017.
1601. A chicken and maize situation: The poultry feed sector in Ghana. Kwaw S. Andam, Michael E. Johnson, Catherine Ragasa, Doreen S. Kufoalor, and Sunipa Das Gupta, 2017.
1600. Gender justice and food security in India: A review. Nitya Rao, Mamata Pradhan, and Devesh Roy, 2017.
1599. Cities and rural transformation: A spatial analysis of rural youth livelihoods in Ghana. Xinshen Diao, Peixun Fang, Eduardo Magalhaes, Stefan Pahl, and Jed Silver, 2017
1598. The changing structure of Africa’s economies. Xinshen Diao, Kenneth Harttgen, and Margaret McMillan, 2017.
1597. Perspectives on the role of the state in economic development: Taking stock of the “Developmental State” after 35 years. Jordan Kyle, 2017.
1596. Imputing nutrient intake from foods prepared and consumed away from home and other composite foods: Exploring extensions of the Subramanian–Deaton cost per calorie approach. Dena Metili Mwangi, John L. Fiedler, and Celeste Sununtnasuk, 2017.
1595. Estimating spatial basis risk in rainfall index insurance: Methodology and application to excess rainfall insurance in Uruguay. Francisco Ceballos, 2016.
1594. The effect of land inheritance on youth employment and migration decisions: Evidence from rural Ethiopia. Katrina Kosec, Hosaena Ghebru, Brian Holtemeyer, Valerie Mueller, and Emily Schmidt, 2016.
1593. How headquarters relocation is affected by rising wages and ownership: Evidence from China's Annual Survey of Industrial Enterprises, 1999–2008. Qingtao Wang, Kevin Chen, Longwen Chiang, and Xuanli Xie, 2016.
1592. External shocks, food security, and development: Exploring scenarios for Central America. Eugenio Diaz-Bonilla, Valeria Piñeiro, and Pablo Elverdin, 2016.
1591. The role of learning in technology adoption: Evidence on hybrid rice adoption in Bihar, India. Jared Gars and Patrick S. Ward, 2016.
1590. Building effective clusters and industrial parks. Xiaobo Zhang, 2016.
1589. Nepal’s 2072 federal constitution: Implications for the governance of the agricultural sector. Jordan Kyle and Danielle Resnick, 2016.
1588. Entitlement fetching or snatching?: Effects of arbitrage on India’s public distribution system. Suman Chakrabarti, Avinash Kishore, and Devesh Roy, 2016.
INTERNATIONAL FOOD POLICY RESEARCH INSTITUTE
www.ifpri.org
IFPRI HEADQUARTERS 2033 K Street, NW Washington, DC 20006-1002 USA Tel.: +1-202-862-5600 Fax: +1-202-467-4439 Email: [email protected]
Related Documents