NIST GCR 21-028 Prospective Economic Impacts of Allowing Government-Operated Federal Laboratories to Assert Copyright Protection for Their Custom Software Products David P. Leech Economic Analysis & Evaluation, LLC John T. Scott, Ph.D. Dartmouth College This publication is available free of charge from: https://doi.org/10.6028/NIST.GCR.21-028

Welcome message from author
This document is posted to help you gain knowledge. Please leave a comment to let me know what you think about it! Share it to your friends and learn new things together.
Transcript

NIST GCR 21-028
Prospective Economic Impacts of
Allowing Government-Operated
Federal Laboratories to Assert
Copyright Protection for Their
Custom Software Products
David P. Leech
Economic Analysis &
Evaluation, LLC
John T. Scott, Ph.D.
Dartmouth College
This publication is available free of charge from:
https://doi.org/10.6028/NIST.GCR.21-028
NIST GCR 21-028
Prospective Economic Impacts of Allowing
Government-Operated Federal Laboratories
to Assert Copyright Protection for Their
Custom Software Products
Prepared for
U.S. Department of Commerce
Technology Partnerships Office
National Institute of Standards and Technology
Gaithersburg, MD 20899
By
David P. Leech
Economic Analysis &
Evaluation, LLC
John T. Scott, Ph.D.
Dartmouth College
This publication is available free of charge from:
https://doi.org/10.6028/NIST.GCR.21-028
May 2021
National Institute of Standards and Technology
James K. Olthoff, Performing the Non-Exclusive Functions and Duties of the Under Secretary of Commerce
for Standards and Technology & Director, National Institute of Standards and Technology
U.S. Department of Commerce Gina M. Raimondo, Secretary

Disclaimer
This publication was produced as part of contract 1333ND19FNB405279 with the
National Institute of Standards and Technology. The contents of this publication do not
necessarily reflect the views or policies of the National Institute of Standards and
Technology or the US Government.

i
This
public
atio
n is
availa
ble
free o
f charg
e fro
m: h
ttps://d
oi.o
rg/1
0.6
02
8/N
IST
.GC
R.2
1-0
28
Preface
This report provides an exploratory assessment of the prospective economic impacts of
allowing U.S. government-operated Federal laboratories to copyright the software products
they develop. Such copyrights are prohibited by current law. To assess the prospective
economic impacts, we surveyed the people engaged with the software developed and used in
the Federal laboratories. We surveyed the laboratories that are government-operated and not
permitted to copyright their software. We also surveyed the contractor-operated Federal
laboratories. The contractor-operated laboratories are permitted to copyright their software.
The survey obtained information about the laboratories’ software development and licensing
activities and about the changes expected for those activities if the government-operated
laboratories are allowed to copyright their software. The survey information is used to model
the revenues and costs associated with the laboratories’ software development and licensing
activity and to predict the economic impacts if the government-operated laboratories are
allowed to copyright the software products that they develop. Because we rely on the survey,
the report would not have been possible without the thoughtful assistance of many
knowledgeable individuals in the Federal agencies and their laboratories.
In addition to thanking the survey respondents, we wish to acknowledge the contributions of
Karen Rogers (NIH), Michael Shmilovich (NIH), Daniel Lockney (NASA), and Amin Mehr
(GSA), for their indispensable advice during the survey design phase of the project. They
helped us understand the language that “makes sense” to developers and managers of custom
software developed within Federal agencies. Sarah Hart (Universal Technical Resource
Services, Inc., formerly with the Federal Laboratory Consortium) and Carolina Olivieri
(Federal Laboratory Consortium) provided critical support in providing points-of-contact for
potential survey respondents and in communicating the launch of the survey phase of the
project to the Federal technology community via the FLC Digest. Finally, we acknowledge
the guidance and project support provided by our NIST project manager, Nicole Gingrich,
and the comments of readers at NIST.
ii
This
public
atio
n is
availa
ble
free o
f charg
e fro
m: h
ttps://d
oi.o
rg/1
0.6
02
8/N
IST
.GC
R.2
1-0
28
Abstract
U.S. copyright laws do not allow government-owned government-operated (GOGO)
laboratories of Federal agencies to obtain copyright protection for the software products they
develop. This report provides an assessment of the likely economic effects of allowing
copyright protection for software products created in the GOGO laboratories. The report
uses a formal survey of Federal agencies’ GOGO laboratories and government-owned
contractor-operated (GOCO) laboratories to describe their software development and
licensing activities over the past five years and to make forecasts about the effects of
eliminating the copyright prohibition. The survey responses indicate that if copyrights for
government-created software are allowed, the availability of the software for use by others
will increase dramatically. Forecasts of the economic impacts of the expected increase in the
available software are made using estimated models of licensing revenues and licensing costs
for the survey respondents. The forecasts for the respondents are extrapolated to their parent
Federal agencies and then to all Federal agencies. Information about the economy-wide
impact for the software industry is combined with the information about the software
activities of the Federal agencies to project economy-wide benefits of lifting the restrictions
on copyrighting software developed by GOGO laboratories. Changing the copyright law to
allow copyright protection for GOGO software is expected to have a positive economic
impact on the U.S. economy because the software made available will increase the
productivity of its users. This report provides a first look at software activity that has not
previously been systematically tracked and reported.
Key words
Copyright; Copyright Act of 1976; Federal agencies; Federal laboratories; Federal
laboratories’ induced productivity effect, software; Federal laboratories’ software
commercialization; Federal laboratories’ software development activities; Federal
laboratories’ software development cost model; Federal laboratories’ software licensing
revenue model; Federal laboratories’ software release categories; Federal Source Code
Policy, 2016; Federal Technology Transfer Act of 1986; Government-owned contractor-
operated (GOCO) laboratories; Government-owned government-operated (GOGO)
laboratories; Government Works software; Invention licenses; Patents; Software; Software
copyrights; Software licenses; Software patents; Technology transfer.
iii
This
public
atio
n is
availa
ble
free o
f charg
e fro
m: h
ttps://d
oi.o
rg/1
0.6
02
8/N
IST
.GC
R.2
1-0
28
Table of Contents
Executive Summary ............................................................................................................................................. vi
ES-1. The Issue Examined ................................................................................................................................. vi
ES-2. Technical Approach ................................................................................................................................ vi
ES-3. General Findings .................................................................................................................................... vii
Introduction ................................................................................................................................................. 1
1.1. Research Question and Focus ............................................................................................................. 1
1.2. Background .......................................................................................................................................... 1
1.3. Setting .................................................................................................................................................. 4
1.4. Technical Approach ............................................................................................................................. 6 1.4.1. On-line Survey Lessons Learned .................................................................................................. 10
Survey Results and Related Economic Analysis ..................................................................................... 11
2.1. Overview of the Sections in the Report .............................................................................................. 11
2.2. A Roadmap of Calculations ............................................................................................................... 12
2.3. Response to the Software Copyright Impact Survey .......................................................................... 13
2.4. Software Licensing & Public Domain Software Release Activity 2015-2019 ................................... 15 2.4.1. The Simple Model of Software Revenues .................................................................................... 15 2.4.2. Overview of the Agencies’ Software Activity for 2015-2019 ...................................................... 20
2.5. Software Development and Management Costs, 2015-2019 ............................................................. 26 2.5.1. The Simple Model of Software Costs ........................................................................................... 26 2.5.2. Overview of the Agencies’ Software Development and Management Costs for 2015-2019 ....... 30
2.6. Counterfactual Software Copyright License & Public Release Activity 2020-2024 ......................... 32 2.6.1. Overview of the Respondents’ Forecasts for 2020-2024 Given Elimination of the Copyright
Prohibition for GOGO Laboratories or Laboratory Facilities ..................................................................... 33
2.7. Predictions of the Effects of Allowing Copyright Protection for Software Created by GOGO
Laboratories and Laboratory Facilities........................................................................................................... 42 2.7.1. Prediction of Licensing Revenues for the GOCO and GOGO Laboratories and Facilities
Providing 2020-2024 Forecasts Assuming Copyrights Are Allowed ......................................................... 43 2.7.2. Projected Costs Associated with the Projected Revenues ............................................................ 48 2.7.3. Comparison of Projected Costs and Projected Revenues. ............................................................ 50 2.7.4. Projection of Effects on the Software Activity of All Federal Agencies ...................................... 55
2.8. Assessment of Potential Economy-Wide Effects of Federal Agencies’ Software .............................. 60
Conclusion .................................................................................................................................................. 64
Appendix A. Software Copyright Impact Survey (OMB Control No. 0693-0033, Expiration Date:
07/31/2022) ........................................................................................................................................................... 68
Appendix B. Economy-Wide Impact of the Software Industry ...................................................................... 69
Appendix C. Estimated Licensing Revenue Functions .................................................................................... 73
Appendix D. Examples of the Custom Software Outreach (“Marketing”) Practices of Federal
Laboratories ........................................................................................................................................................ 84

iv
This
public
atio
n is
availa
ble
free o
f charg
e fro
m: h
ttps://d
oi.o
rg/1
0.6
02
8/N
IST
.GC
R.2
1-0
28
Appendix E. Examples of the Custom Software Developed in Federal Laboratories ................................. 87
List of Tables
Table 1. Survey Response .................................................................................................................................. 14 Table 2. Descriptive Statistics for the Respondents with Complete Data for the Model of Software
Licensing Revenue ..................................................................................................................................... 17 Table 3. Annual Number of Software Products Made Available for Licensing .......................................... 20 Table 4. Approximate Percentage Distribution of Intellectual Property Protection for Software Products
Available for Licensing ............................................................................................................................. 21 Table 5. Annual Number of Software Products Licensed .............................................................................. 22 Table 6. Annual Revenues (in constant 2019 dollars) from Software Products Licensed .......................... 22 Table 7. Annual Number of Software Products Available for Download to the Public without a License23 Table 8. Approximate Percentage Distribution of Release Attributes for Software Products Available:
All Responses ............................................................................................................................................. 24 Table 9. Approximate Percentage Distribution of Release Attributes for Software Products Available:
Smaller Selective Samples (without the respondents that reported zeros for all four release
categories)................................................................................................................................................... 25 Table 10. Descriptive Statistics for the Respondents with Complete Data for the Model of Software
Development and Maintenance Costs...................................................................................................... 28 Table 11. The Software Cost Model: Least-Squares Estimates, Dependent Variable cost_19 ................... 29 Table 12. The Lines of Code (LOC) for the Typical Software Product ........................................................ 30 Table 13. FTE and GS-rating for the Average Size Software Product ......................................................... 30 Table 14. FTE and GS-rating for the Software Maintenance Costs ............................................................. 31 Table 15. FTE and GS-rating for Costs of Managing IP and Licensing ...................................................... 31 Table 16. Annuity fees for Software Patents ................................................................................................... 32 Table 17. External Legal Support Costs for IP and Licensing for Software Portfolio. .............................. 32 Table 18. Forecast of Average Annual Number of Software Products Available for Licensing if
Copyright Prohibition Is Eliminated, 2020-2024 ................................................................................... 33 Table 19. Forecast of Average Annual Number of Licensed Software Products if Copyright Prohibition
Is Eliminated, 2020-2024. .......................................................................................................................... 34 Table 20. Forecast of Average Number of Times Each Licensed Software Product Would Be Licensed if
Copyright Prohibition Is Eliminated, 2020-2024 ................................................................................... 35 Table 21. Forecast of Average Annual Number of Seats per Licensed Software Product if Copyright
Prohibition Is Eliminated, 2020-2024 ...................................................................................................... 36 Table 22. Approximate Percentage Distribution of Release Attributes for Software Products Available:
All Responses ............................................................................................................................................. 38 Table 23. Approximate Percentage Distribution of Release Attributes for Software Products Available:
Smaller Selective Samples (without the respondents that reported zeros for all seven release
categories)................................................................................................................................................... 39 Table 24. Average Annual Growth Rate in Lines of Code for Software Products ...................................... 40 Table 25. Average Annual Growth Rate in Revenues for Software Products ............................................. 42 Table 26. Average Annual Revenue for Software Products for a GOCO or GOGO Respondent: Actual
versus Forecast in 2019 dollars ................................................................................................................ 44 Table 27. Average Annual Costs for Software Products Available for Licensing or Download: Actual
versus Forecast in 2019 dollars ................................................................................................................ 49 Table 28. Forecast Annual Licensing Revenues in 2019 dollars for Software Products Available for
Licensing or Download in 2020-2024 if the Copyright Prohibition is Eliminated .............................. 58
v
This
public
atio
n is
availa
ble
free o
f charg
e fro
m: h
ttps://d
oi.o
rg/1
0.6
02
8/N
IST
.GC
R.2
1-0
28
List of Appendix C Figures
Figure C.1. Histogram of Licensing Revenue in Constant Dollars of 2019 Overlaid with the Normal
Density Having the Same Mean and Standard Deviation ......................................................................75
Figure C.2. Histogram of Residuals for Specification (2) in Table C.1 Overlaid with the Normal Density
Having the Same Mean and Standard Deviation ....................................................................................76
List of Appendix C Tables
Table C.1. The Software Licensing Revenue Model for the GOCO Observations: Least-Squares
Estimates, Dependent Variable revenue19it .............................................................................................79
Table C.2. The Software Licensing Revenue Model for the GOGO Observations: Least-Squares
Estimates, Dependent Variable revenue19it .............................................................................................80
Table C.3. The Software Licensing Revenue Model for the GOGO Observations Plus the Mixed Case:
Least-Squares Estimates, Dependent Variable revenue19it ....................................................................81
Table C.4. Comparison of OLS and Tobit Estimates of the Software Licensing Revenue Model for the
GOCO Observations: Dependent Variable revenue19it ..........................................................................82

vi
This
public
atio
n is
availa
ble
free o
f charg
e fro
m: h
ttps://d
oi.o
rg/1
0.6
02
8/N
IST
.GC
R.2
1-0
28
Executive Summary
The importance of software code to all sectors of the economy has intensified since the 1980s
when laws were enacted to encourage the transfer of technology from Federal agencies and
laboratories to the commercial and non-profit sector. According to a 2016 estimate, the
Federal government spent more than $6 billion annually on purchased software through more
than 42,000 transactions.1 But Federal government employees also develop custom software
in pursuit of the various agencies’ missions. This report provides an exploratory first look at
the Federal agencies’ software development activities. Using the responses to a survey of the
agencies’ laboratories and facilities, the activities are described. Based on the survey
responses, the report concludes, conservatively, that if the agencies were allowed to
copyright and license the software that their laboratories and facilities develop, it could
potentially add as much as $4.3 billion (FY2019 dollars and based on the U.S. GDP in 2019)
in value-added to the annual output of the economy because the use of the Federal agencies’
software would increase the productivity of the industries where the software is used.
ES-1. The Issue Examined
In this report, we provide an assessment of the likely economic effects of allowing copyright
protection for government-created software products. U.S. copyright laws do not allow the
government-owned government-operated (GOGO) laboratories of Federal agencies to obtain
copyright protection for the software products they develop. They are deemed “Government
Works” and, as such, they cannot be protected by copyright.2 In contrast, the Federal
agencies’ government-owned contractor-operated (GOCO) laboratories can obtain
copyrights for the software they create because their employees are not Federal employees
and their software products are not considered Government Works.
In the context of the strong and growing demand for software to support economic activity,
and the belief that commercial software developers prefer that transferred software has strong
intellectual property (IP) protection as a condition for further commercial development and
sale, allowing copyright protection for the software products created by GOGO laboratories
would arguably have a large economic impact, increasing the productivity of the U.S.
economy by enabling the Government Works software to realize commercial potential.
ES-2. Technical Approach
In this report we use a formal survey of Federal agencies’ GOGO and GOCO laboratories
and laboratory facilities to describe their software activities over the past five years and to
make forecasts about the effects of eliminating the copyright prohibition for software
produced by the Federal agencies’ GOGO and GOCO operations.3
1 M-16-12: Improving the Acquisition and Management of Common Information Technology: Software
Licensing. Office of Mgmt. & Budget, Exec. Office of the President, June 2, 2016. 2 For information about U.S. “Government Works” qualifications and exemptions, see
https://www.usa.gov/government-works. 3 The survey, “Software Copyright Impact Survey,” OMB Control No. 0693-0033, Expiration Date: 07/31/2022
is provided in Appendix A. A discussion of potential biases in the survey response is provided in Section 1.4.
vii
This
public
atio
n is
availa
ble
free o
f charg
e fro
m: h
ttps://d
oi.o
rg/1
0.6
02
8/N
IST
.GC
R.2
1-0
28
ES-3. General Findings
The responses to the survey indicate that if copyrights for Government Works software are
allowed, the availability of the software for use by others will increase dramatically.
Respondents to the survey report that as compared with the annual numbers of licensed
software products for the last five years, over the next five years, if copyright protection is
allowed, the annual number of licensed software products by the agencies’ laboratories and
laboratory facilities will increase by almost 60 times for GOGO operations and by about 3
times for GOCO operations. Respondents explained that copyright protection would make
the use of the released software more effective because users would be willing to contribute
to its development for commercial use and share their work with others. Both commercial
users and the government would be protected from users who otherwise might claim
proprietary interests in the developed software and even sell it back to its originators.
The software licensing revenue model developed on the basis of our Software Copyright
Impact Survey posits licensing revenues to be a function of: (1) the number of software
products licensed (swprodlicd); and (2) intellectual property protection afforded by patents or
copyrights (IPprotected). With the revenues measured in constant dollars of 2019, the
estimated revenue model predicts that the expected value of the annual revenue from a
copyrighted software product, using the mean number of products for the sample of the
respondents who are able to copyright their software, ranges from $2,573, when the
respondent does not have copyright or patent protection for its software, to $5,908, when the
software does have copyright protection.4 The average annual license revenues reported by
survey respondents (2015-2019) are about $83,000 for the GOCO respondents, over thirty
times more than the $2,645 average annual revenues reported by the GOGO respondents.5
According to the simple cost model developed from our Software Copyright Impact Survey
responses, the expected annual software costs for a lab or lab facility (cost_19) are a function
of: (1) the average annual number of software products available for licensing + the average
annual number of software products available for download by the public without a license
(total_products); and (2) the average lines of code for the responding lab’s or facility’s
typical software product (avgLOC). Accordingly, with costs measured in 2019 dollars, the
4 From Table 2, during 2015-2019, average annual number of licensed products is 21 for the respondents who
are able to copyright their software. Then, using the estimated revenue model from Appendix C, Table C1, the
expected value of the annual revenue from a copyrighted software product, using the mean number of products
for the sample, is estimated to be $5,908 = (164 + 70042 + 2565 x 21)/21. If the respondent did not have IP
protection for its software products, the expected value for the product’s annual revenue is $2,573 = (164 +
2565 x 21)/21. 5 The survey asked respondents to “Estimate the annual total dollar amount of revenues generated by software
licenses” for each of five fiscal years, 2015-2019.The question stipulated that total revenues should include at
least license issue royalties, minimum annual royalties, earned royalties, sub-licensing royalties, and benchmark
royalties. The GOGO revenues can be for licenses for software that is quite explicitly not copyrighted—stating
so in the licensing agreement. The GOCO revenues, on the other hand, are almost entirely for copyrighted
software. See the discussion in Section 2.4.2.
viii
This
public
atio
n is
availa
ble
free o
f charg
e fro
m: h
ttps://d
oi.o
rg/1
0.6
02
8/N
IST
.GC
R.2
1-0
28
estimated cost model coefficient for total_products shows the marginal effect on costs from
adding an additional software product available for licensing or available for download by
the public without a license. At the margin, holding constant the software product size, for
another product the annual costs increase by $256,976. (The model controls for the product’s
size with avgLOC and the estimated coefficient for avgLOC is $18.98, showing that given
the number of products, costs are higher when the products are larger as measured by their
average number of lines of code.)6 The average annual cost (2015-2019) of custom software,
available for licensing or download without a license, reported by survey respondents is
$1,273,945.
For the 2020-2024 timeframe, survey respondents forecast the number of “software products
licensed,” “licenses per licensed software product,” and “seats per licensed software
product.” GOGO respondents anticipate an almost 60-fold increase in the number of software
products licensed if copyright is allowed; GOCO respondents expect about a 3-fold increase.
The average annual software licensing revenues for the GOGO respondents are expected to
increase by 51 times or 5100%, while the average for the GOCO respondents is expected to
increase by 2.43 times or 243%.7
To forecast the economic effects of eliminating the copyright prohibition on Government
Works, we use the simple models outlined above to predict annual revenues and costs for
2020-2024 across the Federal government. Respondents to the Software Copyright Impact
Survey forecast annual licensing revenues of $3,444,379 (2020-2024) should the copyright
prohibition be eliminated.8 To extrapolate the forecasts to the parent agencies of the
respondents, we use the detailed employment information that is provided by the U.S. Office
of Personnel Management (OPM) in its FedScope database. Based on that data, the licensing
revenue for the parent agencies represented by the survey respondents is estimated at
$44,238,828 in software license revenues annually (2020-2024). Software Copyright Impact
Survey respondents account for 51.4% of the total IT employment for all Federal agencies.9
Thus, for all Federal agencies if the software copyright prohibition is eliminated, the forecast
of the annual 2020-2024 licensing revenues is estimated to be $86,067,759.10
Costs are also projected to grow considerably. For survey respondents, the average annual
cost of software made available (2020-2024) if the GOGO copyright prohibition is
eliminated is estimated to be $18,800,000. Most of these costs would be incurred whether or
not the software is made available for licensing since the software is developed for internal
6 In other words, in terms of lines of code, for an average software product, an additional 100 lines of code costs
$1,898.00. 7 The projected revenues for the 2020-2024 period are quite accurate in the sense that the 95% confidence
intervals for the estimates cover a small range even using the conservative standard errors of the forecast (see
Table 26). 8 Table 1, Section 2.3, describes the responses from the 14 Federal agencies surveyed. 9 From FedScope, the sum of the IT employment for the agencies represented by the 23 respondents is 43,776.
The sum of IT employment for all Federal agencies (summing over the FedScope reports for the cabinet level
agencies, the large independent agencies, the medium independent agencies, and the small independent
agencies) is 85,167. So, the Federal agencies in our sample of respondents take the proportion 0.514 =
43776/85167 of the IT employment at all Federal agencies. 10 $86,067,759 = $44,238,828/0.514.
ix
This
public
atio
n is
availa
ble
free o
f charg
e fro
m: h
ttps://d
oi.o
rg/1
0.6
02
8/N
IST
.GC
R.2
1-0
28
use by the agencies. But if copyrighting the software is allowed, respondents estimate that
more of it will be made available and the additional costs of making the software available
would be the costs associated with obtaining the copyrights and managing the licensing
process.11 For the survey respondents for which the projection was made, the costs (an
overestimate as explained in the report) of making the software available to others would be
approximately the $1,310,360 annually over the years 2020-2024 (6.97% of the projected
costs, based on cost estimates by survey respondents for 2015-2019). Using the same
procedure that we used to extrapolate the expected licensing revenues for those survey
respondents, we estimate the sum of the annual costs for their 10 parent agencies would be
$151.8 million. For all Federal agencies the forecast of the annual additional costs (again,
an overestimate as explained in the report) incurred for making the products available for all
Federal agencies (2020-2024) is $295.3 million.12
While the estimated annual costs of eliminating the copyright restriction on custom software
exceeds the $86 million in additional revenues expected to be generated, those expected
revenues are dwarfed by the estimated potential of $4.3 billion in annual economy-wide
benefits (based on the performance of the U.S. economy in the latest year, 2019, reported by
the Bureau of Economic Analysis) from the increased productivity for the users of
copyrighted GOGO- and GOCO-developed software.
The projected annual licensing revenue of $86 million greatly understates the value of the
software to those using it, in part because much of the agencies’ software is made available
without any charge. To generate estimates of the annual economy-wide benefits of lifting the
restrictions on Government Works copyrighting, we combine information about the
economy-wide impact for the software industry with information about the software
activities of the Federal agencies.
Generally speaking, the economy-wide productivity gains from software result because of the
software’s contribution to capital deepening from the accumulation of information-
technology capital and because of software’s contribution to multifactor productivity growth.
A reliable benchmark—the derivation of which is detailed in Appendix B of this report— is
that the private sector’s software contributes 15% of the annual growth in the nation’s output.
We use the benchmark estimate for the software produced by the software industry to
provide an estimate of the potential economy-wide impact of the Federal agencies’ software
above and beyond its contribution to the economy’s output that is made by the software
operations of the agencies as they accomplish their missions. In light of the anticipated 60-
fold increase in the amount of custom-developed software that is licensed to others if
GOGOs are permitted copyright protection, the indirect or induced economic impact of the
agency’s software will become quantitatively important. The approach taken to estimating
the downstream benefits of allowing for copyright protection of Government Works allows
an estimate of those benefits that could not be obtained by using the agencies’ expected
11 The focus of this report is the software that the agencies make available to others for licensing or download
without a license. A complete inventory of the agencies’ software for their internal use is beyond the scope of
the report. 12 $295.3 million =$151.8 million/0.514.
x
This
public
atio
n is
availa
ble
free o
f charg
e fro
m: h
ttps://d
oi.o
rg/1
0.6
02
8/N
IST
.GC
R.2
1-0
28
licensing revenues. Those revenues vastly understate the amount of the agencies’ software
that is used downstream because some survey respondents report that they envision
continuing to provide their software free of charge. They assess the overall benefits from
maximizing the transfer of their custom-developed software to be more important than the
benefits of generating, let alone maximizing, revenue for their agencies.
In terms of numbers of employees, the proportion taken by the Federal agencies’ software
operations in the total software operations for the economy is conservatively estimated as
0.034. To estimate the downstream productivity effect of the Federal agencies’ software for
the economy as a whole, we use the productivity benchmark of 0.15 multiplied by the growth
in economy-wide value added ($847.5 billion over the year 2018 to 2019) to have the
induced productivity effect for the software industry as a whole during the most recent year
for which the Bureau of Economic Analysis reports the information about value added for the
U.S. economy. We then multiply that by the Federal agency’s software operations’ size, as
measured by employment, relative to the size of the software industry (0.034). Thus, the
estimate of the potential induced productivity effect of the Federal agencies’ software—
induced because (as reported by Software Copyright Impact Survey respondents) allowing
copyright protection for Government Works software will result in a large increase in
custom-developed software made available for licensing—is $4.3 billion annually (0.034 x
0.15 x $847.5 billion) based on the most recent year for which the U.S. economy’s growth in
value added is reported. That $4.3 billion estimate represents the potential value of the
increased output in the economy as a whole from using software made available by the
agencies should the Government Work prohibition on copyright protection for custom
software be eliminated. Of course, until the U.S. economy has recovered from the pandemic
of 2020, we cannot expect the growth in the U.S. economy to be as much as it was from 2018
to 2019, and consequently, the software industry’s contribution to positive economic growth
cannot be expected to be what we observed for the most recent year of data. However, the
potential of software for driving economic growth is well estimated by the 2018-2019
experience.
In conclusion, changing the copyright law to allow copyright protection for GOGO
Government Works software is expected to have a positive economic impact on the U.S.
economy because the software made available will increase the productivity of the users. We
emphasize that findings of this report are a first look at software activity that has not
previously been systematically tracked and reported.13
13 The proportion of public domain software—released to the general public without copyright or copyleft
restrictions—is expected to decline by 30%. The details of that decline are discussed in Section 2.6.1, and
definitions of the terms such as copyleft and the distinctions between open source and public domain software
are provided in Section 1.4. As documented in Section 2.6.1, the reduction in the proportion of Government
Works public domain software is mirrored by an increase in the proportion of copyrighted software. So, despite
the increase in software made available and licensed, the loss of public domain software may lessen
productivity for some users of the agencies’ publicly released software.
1
This
public
atio
n is
availa
ble
free o
f charg
e fro
m: h
ttps://d
oi.o
rg/1
0.6
02
8/N
IST
.GC
R.2
1-0
28
Introduction
1.1. Research Question and Focus
The primary question this report seeks to answer concerns the potential economic impact to the U.S. economy if government-operated laboratories were able to assert copyright
protections for software works produced by government employees.14
The focus of the research is custom-developed computer software developed and
maintained by employees of government-owned government-operated laboratories and
facilities (GOGOs), that, with exceptions, currently may not copyright custom-developed
software, and custom-developed software written by employees of government-owned
contractor-operated laboratories and facilities (GOCOs) that may copyright software.
By definition, custom-developed computer software includes code written for software
projects, modules, plugins, scripts, middleware, and application programing interfaces
(APIs).15
1.2. Background
In the 1980s, Congress began passing a series of laws that have enabled Federal
technology transfer activities. The Stevenson-Wydler Act established technology transfer
as a Federal policy and required Federal labs to set up Offices of Research and
Technology Application (ORTAs). The Stevenson-Wydler Act was amended by the
Federal Technology Transfer Act of 1986 which sets out guidelines to encourage
commercialization through licensing of the inventions developed within Federal
agencies.16 According to a House of Representatives Report accompanying the act:
“The Federal Government funds approximately half of this country's total
research and development, and much of this work is performed in
government-owned laboratories. The national interest demands that these
Federal laboratories be more responsive to our economic need for their
new technologies. Where appropriate these technologies should be
transferred from the Federal sector and translated into new commercial
products and processes.”17
14 A secondary research question was to determine if the experiences of contractor-operated laboratories in
copyrighting and licensing software were applicable to the prospects of government-operated laboratories
doing the same in the event that restrictions on them—discussed below—were eliminated. We return to this
secondary research question in the “Background” and “Setting” subsections below. 15 Executive Office of the President, Office of Management and Budget, Memorandum for the Heads of
Departments and Agencies, “Federal Source Code Policy: Achieving Efficiency, Transparency, and
Innovation through Reusable and Open Source,” August 8, 2016, Appendix A: Definitions, p. 14.
Softwarehttps://www.whitehouse.gov/sites/whitehouse.gov/files/omb/memoranda/2016/m_16_21.pdf 16 Pub. L. No. 99-502, 100 Stat. 1785. 17 U.S. Congress, House of Representatives, Committee on Science and Technology, Federal Technology
Transfer Act of 1985, Report (to accompany H.R. 3773), 99th Cong., 1st Sess., 1985, H. Rep. 99–415, p. 3.
2
This
public
atio
n is
availa
ble
free o
f charg
e fro
m: h
ttps://d
oi.o
rg/1
0.6
02
8/N
IST
.GC
R.2
1-0
28
The House Report goes on to recognize that legislative changes were needed to improve
the ability of the Federal laboratories to identify innovations with commercial potential.18
With regard to one form of intellectual property—copyright—the statutes maintain a
distinction between government-owned government-operated labs (GOGOs) and
government-owned contractor-operated labs (GOCOs).19 The technology transfer statutes
maintain the prohibition of copyright for “Government Works” codified in Copyright Act
of 1976.
With some important exceptions, current U.S. copyright laws do not allow GOGO
laboratories to assert copyright protections over creative works that fall under the
definition of Government Works, defined as works created as part of the official duty of
Federal employees; writings, images, computer code, software, and databases are not
subject to copyright protections in the U.S.20 GOCO labs, however, are able to assert
copyright protections over computer software because (by definition) the employees at
GOCO laboratories are not Federal employees and not subject to the restrictions placed
on GOGO labs.
In retrospect, even though the Federal Technology Transfer Act of 1986 was intended to
“improve the ability of the Federal laboratories to identify innovations with commercial
potential,” it may not have anticipated dramatic changes in the technology landscape,
specifically the rapid expansion of the role of software. That said, the authors of the Act
were cognizant of the issue. The act required the Department of Commerce to identify
barriers which tend to restrict or limit the transfer of Federally funded software to the
private sector and State and local governments.21
18 Ibid. 19 The statutory provision that prohibits the government from securing copyright protection in its own
creative works is rooted in historical legal precedent going back before its codification in the Printing Act
of 1895 and the Copyright Act of 1909. Some of the uncertainties in these laws were rectified by the
Copyright Act of 1976 but that act retained the restriction on copyright protection for Government Works.
See, Ruth L. Okediji, “Government as Owner of Intellectual Property? Considerations for Public Welfare in
the Era of Big Data, Vanderbilt Journal of Entertainment & Technology law, Vol. 18, No. 2, pp. 33-362. 20 Regarding the important exceptions to the current copyright law regarding Government Works, the
United States Government is not precluded from receiving and holding copyrights transferred to it by
assignment, bequest, or otherwise. In addition, works prepared for the government by independent
contractors may be protected by copyright. The U.S. government may also assert copyright outside of the
United States for U.S. Government Works. And works of state and local governments may be protected by
copyright. Exceptions are also available for certain works of the National Institute for Standards and
Technology (NIST)—in accordance with the Standard Reference Data Act, 15 U.S.C. § 290e, which
empowers the Secretary of Commerce to secure copyright on behalf of the United States in Standard
Reference Data (SRD) prepared by NIST—and the U.S. Postal Service. See,
https://www.usa.gov/government-works. The U.S. Postal Service is exempted from Section 105 of Title 17
in accordance with The Postal Reorganization Act of 1970, Pub. L. 91–375, which enacted Title 39, Postal
Service. See, Title 17, Section 105, Historical and Revision Notes, House Report 94–1476,
https://www.govinfo.gov/content/pkg/USCODE-2011-title17/html/USCODE-2011-title17.htm 21 Return on Investment Initiative for Unleashing American Innovation (NIST Special Publication 1234),
April 2019. <https://doi.org/10.6028/NIST.SP.1234>
3
This
public
atio
n is
availa
ble
free o
f charg
e fro
m: h
ttps://d
oi.o
rg/1
0.6
02
8/N
IST
.GC
R.2
1-0
28
NIST’s Return on Investment (ROI) Initiative Green Paper (2019) was the culmination of
a broad-ranging and inclusive review of policies and practices that constrain technology
commercialization. Among these constraints is the absence of copyright protections for
computer software, databases and other relevant Government Works. The report collects
anecdotal evidence that the Government Works exception has created a disincentive for
GOGO researchers to envision and develop software with potential for commercial use
and that this has led to slower and less efficient development of GOGO-developed
software by the private sector.
Summarizing previous research on the matter, as well as recent inputs from study
participants, the report states:
“Agencies’ ability to identify and transfer software is generally more
limited than the system that is in place for patented inventions resulting
from the lack of copyright protection and registration for Federally
developed software. It is, however, possible for private sector actors to add
value to Government Works, creating derivative works which enjoy
copyright protection for the additional material and modifications made by
the private sector author.
According to stakeholders, the ineligibility of the Federal Government to
secure copyright protection for software that results from R&D at
Government-operated laboratories has frustrated endeavors to release and
participate in open source development. … There is an argument that software that qualifies as Government Works must be protected by copyright
in the United States in order to grant public users a copyright license that
complies with the terms of open source use.”22
The NIST report on the copyright constraint concludes with the finding that, “the
‘Government Works’ exception to copyright protection for software products of R&D at
Government-Owned, Government-Operated Laboratories constrains
commercialization.”23
As reported below, the survey and research conducted for this report found additional
evidence supporting many of the claims made in NIST’s “Green Paper” report. Survey
evidence was collected and analyzed to estimate the extent to which commercialization of
Federal laboratory-developed software would add to Federal laboratory licensing revenue
going forward, as well as generate additional economy-wide benefits, if the Government
Works copyright exception was eliminated.24
22 Ibid., pp. 40-41. 23 Ibid. p. 42. 24 “Elimination” of the Government Works exception is a more stark option than that contemplated by
NIST’s ROI Initiative Green Paper (i.e., “a narrowly tailored change to the Government Works exception
would be consistent with the original intent of the Bayh-Dole Act, while recognizing the transformational
shift of including digital products like software in a 21st Century definition of IP.” (p. 43)) but for survey
and economic analysis purposes “elimination” was a more tractable approach.

4
This
public
atio
n is
availa
ble
free o
f charg
e fro
m: h
ttps://d
oi.o
rg/1
0.6
02
8/N
IST
.GC
R.2
1-0
28
1.3. Setting
The first research task (though of secondary overall importance) was to assess the
applicability of data provided to NIST by the Department of Energy (DOE) concerning
GOCO license revenues from software copyrights. NIST requested the following
aggregated data from DOE:
• Total number of software products reported by DOE labs
• Total number of licensed software products; and
• Total dollar amount of royalties received from software licensing.
DOE responded with software product quantities (FY14-18) from 20 GOCO, and 1
GOGO lab, organized, per year, in terms of:
• Open-source products available for licensing
• Open-source products licensed
• Other no-cost software available for licensing
• Other no-cost software licensed.
No revenue estimates were provided. DOE reported that such data was considered
confidential by the labs providing the information and that licensing revenue data
collected by DOE from the labs mingled the licensing revenues for copyrighted software
with the licensing revenues from other sources.25 Without revenue data, the utility of the
DOE GOCO data for modeling GOGO revenues in the absence of the prohibition on
copyright protection for Government Works could not be determined. Furthermore, the
reported categories of software for the DOE GOCO data do not cover all types of
software products, and in the absence the definitions of DOE reporting categories —
“open-source” and “other no-cost software” — even the scope of the information
supplied was somewhat ambiguous.26
In retrospect, DOE’s inability to provide the detailed data needed to model the
relationship between the numbers of various kinds of software products developed by
GOCOs, the nature of the IP protection afforded them, and the annual revenues they
generate was a glimpse of a more general problem of accounting for the custom software
developed across Federal agencies. During the survey phase of this project the authors
communicated with many potential survey respondents. Many of those invited to
participate in the survey conducted by the authors observed that the lack of access to
well-organized information about custom-developed software hampered their ability to
respond — GOGOs and GOCOs alike. Typical reactions to the “Software Copyright
Impact Survey” (discussed in the following section) included the following comments:
25 This rendered impossible a simple, rough derivation of copyright revenue from data annually reported in
NIST’s Federal Laboratory Technology Transfer Summary Report to the President and the Congress.
<https://www.nist.gov/system/files/documents/2019/10/30/fy2016_fed_lab_tech_transfer_rept_fina_9-10-
19.pdf> 26 The authors requested from DOE the data dictionary that accompanied DOE’s “data call” to GOCO
laboratories, but DOE did not provide the information.

5
This
public
atio
n is
availa
ble
free o
f charg
e fro
m: h
ttps://d
oi.o
rg/1
0.6
02
8/N
IST
.GC
R.2
1-0
28
• "Great questions, all things we should start to monitor, but we are no-
where close.” (U.S. Army Corps of Engineers)
• "I just don’t keep track of software.” (Department of Agriculture)
• “As a patent attorney I am intimately familiar with the intellectual
property issues involving software release but have no idea about the
number of software projects, revenue, percentages of software
distributed under any particular IP, development costs, etc.” (Army
Research Laboratory)
• “Things like how much software was released to the public? I have no
idea, nor do I know anyone at the center that does." (Naval
Information Warfare Center)
• “It is very detailed in the requested information. Much of it we do not
currently capture.” (Lawrence Livermore National Laboratory)
• "In view of the … detailed nature of the information sought, we will
be unable to provide responses to a majority of the questions with
sufficient accuracy and quality."(Federal Aviation Administration)
• “I am having trouble collecting the relevant information." (Department
of Transportation)
• “I do not know of any source at [this organization] that would have
such information.” (Department of Commerce)
• “[We] don't really have the tracking and management systems in order
to do much official tech transfer with this type of technology.”
(National Institutes of Health)
We were not completely unprepared for these comments. We had been told by a
technology transfer official during the survey design phase (discussed below) that NASA
is the only agency with a comprehensive inventory of custom software. A technology
transfer professional from a different agency verified that assertion.
Some noted that the cause of poor access to information about custom software was a
“catch-22”: without the incentive to copyright, organizing information about the nature
and extent of efforts to develop custom software has been a low priority for many. Since
some Federal agencies do keep sufficient track of their custom-developed software to
respond to the detailed questions posed in the survey, the “catch-22” rationale may not be
the sufficient cause of the general lack of readily accessible information about custom-
developed software. Clearly though, agencies’ priorities seem to be affected by the
regulatory prohibition on seeking copyright protection for custom software.
With the foregoing background and setting, in the following subsection the technical
approach taken to ascertain the data that forms the basis of the economic analysis
presented in Section 2 is discussed.
6
This
public
atio
n is
availa
ble
free o
f charg
e fro
m: h
ttps://d
oi.o
rg/1
0.6
02
8/N
IST
.GC
R.2
1-0
28
1.4. Technical Approach
A formal survey of Federal agencies was a project requirement. It may be that very few,
if any, surveys of Federal agency custom software practices and operations have ever
been conducted. It is highly likely that the survey discussed here is the first such survey
conducted to assign economic value to Federal agencies’ custom software practices and
operations.
Normally, a survey of Federal agency employees would not require Office of
Management and Budget (OMB) approval under the Paperwork Reduction Act.27
However, since data on GOCO licenses and license revenues provided by DOE was
insufficient for modeling purposes (discussed in the subsection above), a survey
encompassing both GOGOs and GOCOs was required. Since GOCO employees are not
Federal employees—and, therefore, the survey encompassed non-Federal employees—
the process for developing an OMB-approved “Software Copyright Impact Survey” was
required and followed.28
After a review of relevant literature concerning software copyright law and practice, the
origin and nature of the copyright prohibition, and readily available data on Federal
agencies’ licensing revenue, a “red flag” from our communications with DOE analysts
was noted. It appeared that the definition and scope of “custom-developed software”
were not generally understood in the technology transfer community; the community
thought to be the best source of the relevant information by Federal technology transfer
experts.29 It also became clear that “software release” categories—such as “open source”
and “public domain”—were not routinely distinguished in many agencies. To obtain
survey results that reported information that was roughly comparable between survey
respondents required that the various categories be distinguished. The focus (“custom-
developed software”) and scope needed to be articulated within the survey instrument.
Following OMB’s 2016 Federal Source Code Policy, we defined the technical focus of
the survey to be “custom-developed computer software” including code written for
software projects, modules, plugins, scripts, middleware, and application programing
interfaces (APIs).30
27 The Paperwork Reduction Act (PRA) of 1995 (44 U.S.C. 3501 et seq.) requires that agencies obtain
Office of Management and Budget (OMB) approval before requesting most types of information from the
public. 28 In terms of “lessons learned” (discussed further below) it is noteworthy that GOCO employees routinely
(and perhaps are required to) maintain “.gov” email addresses. So, even though our “information
collection” required OMB approval because it encompassed non-governmental survey respondents, the
process of obtaining GOCO points-of-contact was no more difficult than obtaining them for potential
GOGO survey respondents. The FLC maintains points-of-contact for both GOGOs and GOCOs, even
though they cannot distinguish the two groups with certainty. 29 Another “lesson learned” for subsequent Federal agency survey projects is that in addition to the
community of Federal technology transfer agents, the Federal software development community—for
example, “digital.gov”—could well be an excellent source of data and insight regarding the kinds of issues
explored in the Software Copyright Impact Survey discussed here. That “community of practice” was not
identified as a survey target population until late in the survey execution phase. 30 Executive Office of the President, op. cit.
7
This
public
atio
n is
availa
ble
free o
f charg
e fro
m: h
ttps://d
oi.o
rg/1
0.6
02
8/N
IST
.GC
R.2
1-0
28
Working from documents provided by NASA,31 and after communications with
technology transfer officials in NIH as well as a software specialist at GSA (ever mindful
of general considerations of survey length and detail constraints), we settled on the
following software release categories that, combined with the OMB’s definition,
indicated the intended breadth of the survey’s focus on “custom software”:
• Percent released as open source
• Percent released to the general public or other agencies for noncommercial
use (exclusive of open source)
• Percent released to the general public without copyright or copyleft
restrictions
• Percent released under other conditions.
In addition to asking about release categories, we asked about the percentage distribution
of the kinds of intellectual property for their software products available for licensing:
• Percentage copyright only
• Percentage copyleft only
• Percentage patented only
• Percentage copyrighted and patented.
By asking respondents for the release categories of their available software, and also
asking them for the specific kinds of IP protection for their licensed software, we were
able to gather a lot of information in a way that let the respondents, despite their different
perspectives on “open source” and other key terms, tell us about their software and its
release characteristics.
Concerning some of the important terms in the four release categories, there was some
potential for respondents to have different interpretations of “open source.” In the words
of one expert, there are “many different words for the same thing.”32 Software that is
“free” is sometimes considered open source, and there are other terms including FOSS
(Free Open Source Software) and FLOSS (Free/Libre Open Source Software). They are,
for practical purposes, technically the same, but differ in terms of the software
philosophy they promote (with one emphasizing the freedom to distribute the software,
the other emphasizing that the license incurs no license fee, that it is free of cost).33
Moreover, there can be substantial licensing revenues associated with open source
software, typically fees for services supporting the use of the software.34
31 Release of NASA Software (NASA Procedural Requirements, NPR 2210.1C. Expiration Date: December
11, 2020).
https://nodis3.gsfc.nasa.gov/displayDir.cfm?Internal_ID=N_PR_2210_001C_&page_name=Chapter1&sear
ch_term=software%20release 32 Karl Fogel, Producing Open Source Software, Copyright © 2005-2019 under the CreativeCommons
Attribution-ShareAlike (4.0) license. Version: 2.316 p. 193. < https://producingoss.com/ > 33 Ibid. 34 “[That “open source” means the software is free of charge] is a common misconception about what
“open source” implies … . Open source software programmers can charge money for the open source
8
This
public
atio
n is
availa
ble
free o
f charg
e fro
m: h
ttps://d
oi.o
rg/1
0.6
02
8/N
IST
.GC
R.2
1-0
28
Thus, people using software may characterize software products as “open source” for a
variety of reasons. However, the key distinction is that the users of the software can
actually see and modify the source code. The reason for the variety in the characteristics
associated with open source software is that the term “open source” has evolved and now
“designates a broader set of values [that] embrace and celebrate principles of open
exchange, collaborative participation, rapid prototyping, transparency, meritocracy, and
community-oriented development.”35
There are restrictions associated with open source software.36 Within the category of
(licensed) open source software, “copyleft” licenses refers to those that not only grant the
“free” use of the software (at no cost) but also require that the freedom applies to any
derivative work. A GNU General Public License (GPL) is considered the canonical
example of a copyleft license.37 It stipulates that any derivative works must also be
licensed under the GPL. By contrast, a so-called “permissive” open source license (non-
copyleft) does not contain a clause requiring that the license apply to all derivative
works.38
To be in the “public domain” means that no one has the right to restrict copying the
software. Public domain refers to works that may be used by anyone, anywhere, anytime
without permission, license, or royalty payment. Material in the public domain can be
incorporated into a copyrighted work, and the derivative is thus under the same overall
copyright as the original copyrighted work.39 A work may enter the public domain
because the term of copyright protection has expired, because copyright has been
software they create or to which they contribute. But in some cases, because an open source license might
require them to release their source code when they sell software to others, some programmers find that
charging users money for software services and support (rather than for the software itself) is more
lucrative. This way their software remains free of charge, and they make money helping others install, use,
and troubleshoot it.” https://opensource.com/resources/what-open-source, accessed September 15, 2020,
italics in original. 35 The quote is from https://opensource.com/resources/what-open-source, and the discussion there is
insightful, including the following. “Open source software is software with source code that anyone can
inspect, modify, and enhance. “Source code” is the part of software that most computer users don’t ever
see; it’s the code computer programmers can manipulate to change how a piece of software—a “program”
or “application”—works. Programmers who have access to a computer program’s source code can
improve that program by adding features to it or fixing parts that don’t always work correctly. What is the
difference between open source software and other types of software? Some software has source code that
only the person, team, or organization who created it—and maintains exclusive control over it—can
modify. People call this kind of software “proprietary” or “closed source” software.” Only the original
authors of proprietary software can legally copy, inspect, and alter that software.” Accessed Oct. 14, 2020. 36 From https://opensource.com/resources/what-open-source, accessed Oct. 14, 2020: “Open source
licenses affect the way people can use, study, modify, and distribute software. In general, open source
licenses grant computer users permission to use open source software for any purpose they wish. Some
open source licenses—what some people call “copyleft” licenses—stipulate that anyone who releases a
modified open source program must also release the source code for that program alongside it. Moreover,
some open source licenses stipulate that anyone who alters and shares a program with others must also
share that program’s source code without charging a licensing fee for it.” 37 See https://en.wikipedia.org/wiki/GNU, accessed September 13, 2020. 38 Fogel, op. cit., p. 195. 39 Ibid., pp. 194-95.
9
This
public
atio
n is
availa
ble
free o
f charg
e fro
m: h
ttps://d
oi.o
rg/1
0.6
02
8/N
IST
.GC
R.2
1-0
28
abandoned, or in the U.S., because it is a U.S. Government Works and there is currently
no other statutory basis for the government to restrict its access. A work is not in the
public domain simply because it does not have a copyright notice.40
Finally, “other conditions” is a catch-all phrase intended to capture custom software that
is classified or export controlled.
To reemphasize, we were concerned that asking survey respondents about their software
development and licensing activities too narrowly—as in the DOE’s “data call” that
focused only “open source” and “other no-cost software”— would have missed other
kinds of custom software that would turn out to be significant. In addition, we had a
theoretical interest in the question of how much public domain software (considered by
some scholars and developers as an important source of economic benefits) might be
reduced in the wake of the hypothesized change in the IP protection afforded
Government Works. Finally, recognizing that there was likely to be a considerable
amount of custom software deemed sensitive for confidentiality and national security-
related reasons, we wanted to at least indicate that some measure of its quantitative scope
should be included in survey responses.
Unlike the starting point that would have been provided by DOE—wherein “open source
software” and “other no-cost software” could be construed as different names for the
same thing—our focus was intended to be more comprehensive.41
In addition to getting a handle on the kinds of custom software being developed in
GOCOs and GOGOs, the survey also sought estimated quantities, costs, and revenues
associated with custom software historically (2015-2019) and anticipated in a
counterfactual future (2020-2024) free of copyright restrictions on Government Works.
With a survey, there is always concern about whether something about the respondents
would lead them to give a distorted understanding of the true values of the variables
about which we are gathering data. There can be concerns about the credentials and
experience of the respondents. In the case of the Software Copyright Impact Survey,
there is reason to think there may be an upward bias in the reported anticipated increase
in the software made available for licensing if the copyright prohibition for Government
Works software is lifted. As discussed in detail just below, a problem with the execution
of the survey caused many potential respondents not to provide a response because they
were not certain that the survey was a government-sanctioned survey. Although that
problem reduced the number of respondents, there is no reason to expect that it would
lead to biased information from those who did open their invitations, discover that the
survey was sanctioned, and respond. As discussed in subsection 1.3, some respondents
observed that the lack of access to well-organized information about custom-developed
40 https://cendi.gov/publications/04-8copyright.html#216 41 In fact, as will be illustrated in Section 2.4.2 of this report, Table 9, had we focused only on “open
source” software, the focus of the data provided by DOE, we would have excluded as much as 65 percent
of the custom software developed in GOGOs and as much as 36 percent of the custom software developed
in GOCOs.
10
This
public
atio
n is
availa
ble
free o
f charg
e fro
m: h
ttps://d
oi.o
rg/1
0.6
02
8/N
IST
.GC
R.2
1-0
28
software hampered their ability to respond. That problem would be expected to increase
the variance in the responses, but would not be expected to introduce bias in the average
response. Relatedly, NIST did not want to trouble software developers themselves by
attempting to survey members of the digital.gov community of practice. However, all of
the respondents are identified in their role as advocates for technology transfer. Because
the study investigates the argument that allowing copyright protection for Government
Works software would be good for technology transfer, one might reasonably say that the
GOGO survey population would be predisposed to provide answers that reflect positively
on the effects of eliminating the restrictions on copyrighting GOGO software. The
potential “optimistic” bias would come with the information about the counterfactual
scenario that is discussed in Section 2.6. The bias could cause an overestimate of the
anticipated increase in software made available for license. Although the authors of the
report do not believe that the potential “optimistic” bias is severe, it should be kept in
mind when considering the results of this report.
The survey was conducted using a Survey Monkey platform.42 The Federal Laboratory
Consortium (FLC) provided information containing email points of contact for
approximately 280 technology transfer managers in the laboratories of thirteen Federal
agencies. In addition, FLC-identified technology transfer managers, alternative
respondents referred by initial points of contact were invited to participate in the survey.
Ultimately, 361 individuals were invited to take the survey. Individualized URL links
were provided to potential respondents. Appendix A contains a non-interactive PDF
version of the survey. The actual on-line survey had several drop-down menus of pre-
populated answers (yes/no, parent organization, and quantity ranges). The survey opened
April 14, 2020 and closed July 31, 2020. Detailed survey response data is reported in
Section 2.3 below.
1.4.1. On-line Survey Lessons Learned
In addition to “lessons learned” reported in footnotes above—concerning the finding that
“.gov” email addresses are required of GOCO employees and the late realization that
software development communities of practice likely are a good population to tap into in
successive economic impact surveys of Federal agency software activities—it is
important to recognize a significant glitch in the execution of the survey, especially the
use of a commercial (.com) email address by the survey manager and co-author of this
report. Having conducted numerous on-line, email, and telephone surveys in the past—
mostly, but not solely, focused on the commercial world, in search of commercially
propriety information, the authors were, of course, used to suspicion and a relatively low
number of survey responses. But we were taken aback by the level of suspicion exhibited
by several correspondents. (The survey invitation, and the OMB-approved survey
instrument itself, provided the email address for one of the authors, and invited potential
survey respondents to communicate general concerns and questions about the
interpretation of specific survey questions.) We assume that this suspicion accounts for
42 The Survey Monkey platform has multiple subscription plans. See,
https://www.surveymonkey.com/pricing/individual/?ut_source=sem_lp&ut_source2=sem&ut_source3=me
gamenu. The survey conducted for this study employed an annual personal plan subscription.
11
This
public
atio
n is
availa
ble
free o
f charg
e fro
m: h
ttps://d
oi.o
rg/1
0.6
02
8/N
IST
.GC
R.2
1-0
28
the fact that the majority of potential survey respondents (approximately 60%) did not
open the survey invitation.43 One correspondent wrote, in part, “I first suspected that this
is a phishing email, as this does not come from NIST address.” Another correspondent
(who, after assurances, provided a survey response to the best of his ability) asked for
additional information, “if you are truly conducting a sanctioned survey.” The assurances
that were required by many survey respondents were available in the survey introduction,
but that approach assumed, wrongly, that potential survey respondents would open their
invitations.
In future surveys focused on a population of Federal employees, it is strongly advised
that the survey be executed from a Federal agency (.gov) email address.44 Short of that,
detailed assurances about the legitimacy of an on-line survey need to be included in the
subject line of the email inviting survey participation. Where available, too, professional
networks or publications should be invited to announce that a survey is forthcoming and
encourage participation.45
Of course, some glitches seem inevitable. Some correspondents informed us that their
agency’s IT offices blocked potential respondents’ access to on-line survey
applications.46 Other agencies used email clients that were incompatible with the online
Survey Monkey survey application used for this survey.
Survey Results and Related Economic Analysis
2.1. Overview of the Sections in the Report
Section 2.2 provides a roadmap to help the reader follow the sequence of calculations that
are made throughout the report. Section 2.3 describes the response to the survey that we
used to gather information from GOCO and GOGO laboratories and laboratory facilities.
43 Over the course of the three-month survey period, weekly “reminders” were emailed to the survey
population. Approximately mid-way through the survey period, the NIST project manager’s email address
was included in the subject line of the survey “reminder.” No dramatic improvement in survey responses
was observed. In previous surveys the authors have been accused of “phishing.” Still, we found the level of
suspicion on the part of Federal employees, to a survey which, especially after mid-survey adjustments that
included the NIST project leader’s email address, was to all appearances being conducted on behalf of
NIST, to be remarkable. 44 We are not suggesting that time-consuming surveys need to be conducted by Federal agency employees
alone. Rather, we are suggesting that those charged with the survey design and execution be granted
temporary “.gov” email addresses to avoid the suspicions described. 45 One correspondent observed that he “had not heard of this from normal NIST channels like the
Interagency Working Group for Technology Transfer (IAWGTT)." Whether or not such an announcement
was made at the outset of the survey, the mid-survey message adjustments did appeal to the IAWGTT. No
dramatic improvement in survey responses was observed. The NIST study and survey were announced in
the Federal Laboratory Consortium’s FLC Digest but the assurances that this could have provided to the
FLC members targeted by the survey may not have reached the intended audience. 46 This must be a relatively common problem since the support desk of the survey application used for this
survey (Survey Monkey) readily provides written instructions for willing survey respondents to
communicate with their organization’s IT departments concerning the details of how to “white list” Survey
Monkey’s online application.

12
This
public
atio
n is
availa
ble
free o
f charg
e fro
m: h
ttps://d
oi.o
rg/1
0.6
02
8/N
IST
.GC
R.2
1-0
28
Section 2.4 describes the survey respondents’ software licensing and public domain
software release activity for 2015-2019. Section 2.5 describes their software
development and management costs for 2015-2019. Section 2.6 describes the
respondents’ projections, if the copyright prohibition is lifted, for their software copyright
licensing and public release activity for 2020-2024. Section 2.7 uses the respondents’
projections from Section 2.6 to make predictions of the effects of allowing copyright
protection for software created by GOGO laboratories and laboratory facilities. The
predictions are developed first for the respondents, then second for their parent agencies,
and finally for all Federal agencies. Section 2.8 provides a prospective assessment of the
economy-wide impact of the Federal agencies’ software operations. Section 3 concludes
the report with a summary of its key findings. Appendix A provides the Software
Copyright Impact Survey; Appendix B explains the benchmarks used for the economy-
wide impact of the software industry; Appendix C provides the technical details about the
simple licensing revenue function; Appendix D provides examples of the custom
software outreach (marketing) practices of Federal laboratories; and Appendix E provides
examples of the custom software developed in Federal laboratories.
2.2. A Roadmap of Calculations
In case it will be helpful to have a roadmap that describes the sequence of calculations
that are made throughout the report, here is an overview of the road to be traveled.
After describing in Section 2.3 the response to the Software Copyright Impact Survey, in
Section 2.4.1 we provide an overview of the simple model of licensing revenues that we
estimate in Appendix C. The model is used (in Section 2.7) to compare the expected
revenue for a software product with its expected cost. It is also used (in Section 2.7) to
predict annual revenues over the period 2020-2024 if copyright protection is allowed.
Section 2.4.2 describes the GOCO and GOGO respondents’ reports about each of the
items of information about 2015-2019 software activity covered in the survey. A
description of the distribution (in the samples of GOCO and GOGO respondents) is
provided for each item of information about the respondents’ software activity.
In Section 2.5.1, a model of software costs as a function of the number of software
products and the average size (measured by lines of code) of those products is estimated
using the reported experience for the survey respondents during the fiscal years 2015
through 2019. The cost model is used subsequently (in Section 2.7) to calculate the
expected addition to the average cost for a software product if it is protected with IP and
made available for licensing. The cost model is also used (in Section 2.7) to predict the
annual software costs that would be incurred over the period from 2020 to 2024 if
copyright protection is allowed for GOGO software products.
Section 2.5.2 describes the GOCO and GOGO respondents’ answers to each of the
individual questions about their costs. A description of the distribution (in the samples of

13
This
public
atio
n is
availa
ble
free o
f charg
e fro
m: h
ttps://d
oi.o
rg/1
0.6
02
8/N
IST
.GC
R.2
1-0
28
GOCO and GOGO respondents) is provided for each item of information about the
respondents’ costs.
Section 2.6 presents the respondents’ forecasts for their software activity for fiscal years
2020 through 2024 assuming that copyright can be obtained for GOGO software
products. Then, in Section 2.7 the respondents’ forecasts reported in Section 2.6 are
juxtaposed with the revenue and cost models estimated, respectively, in Section 2.4.1 and
Appendix C and in Section 2.5. From the juxtaposition we develop overall predictions
about how the elimination of the software copyright prohibition for GOGO laboratories
and facilities would be expected to affect annual licensing revenues and costs over the
next five years.
From the projected revenues and costs for the respondents to our survey, we estimate the
revenues and costs across all Federal agencies by using information about the proportion
of all Federal agency software activity taken by the respondents. To extrapolate the
forecasts to the parent agencies of the respondents to the survey, we use the detailed
employment information that is provided by the U.S. Office of Personnel Management
(OPM) in its FedScope database.47 The data provide the employment of various types for
each Federal agency and its component organizations. Having extrapolated the
respondents’ forecasts to the parent agencies of the respondents, we then extrapolate the
forecasts for the parent agencies to the have a forecast for all Federal agencies. Thus, we
are able provide a forecast for the respondents who provide sufficient data to use with the
models, a forecast for their parent agencies, and finally a forecast for all Federal agencies.
The final calculation that we make provides an estimate of the potential economy-wide
economic impact of the Federal agencies’ software. The calculation is made and
explained in Section 2.8.
2.3. Response to the Software Copyright Impact Survey
Table 1 describes the response to our “Software Copyright Impact Survey.” The survey
is attached as Appendix A. We cast a wide net across agencies, hoping to receive reports
from places where the Federal agencies would be creating software products. We invited
361 representatives of 14 Federal agencies to complete the survey questions. Those
invited to respond were chosen as persons within the agencies who would be
knowledgeable about the software licensing and public domain software release activity
in the agencies’ laboratories or facilities for which they would be responding. The
agencies are listed in Table 1 along with the number of individuals associated with each
agency who were invited to complete the survey. The table also shows for each agency
the number of individuals who responded, and the percentage who responded from each
agency. Each respondent provided answers for one or more laboratories or laboratory
facilities within an agency.
47 https://www.fedscope.opm.gov

14
This
public
atio
n is
availa
ble
free o
f charg
e fro
m: h
ttps://d
oi.o
rg/1
0.6
02
8/N
IST
.GC
R.2
1-0
28
Table 1. Survey Response
Agency* Number
Invited to
Take the
Survey
Number of
GOCO
respondents
Number of
GOGO
respondents
Total
Number
Responding
Percentage
Responding
DHS 6 0 2 2 33.33
DOC 42 0 9 9 21.43
DOE 44 13 0 13 29.55
DOI 7 0 3 3 42.86
DOL 1 0 0 0 0
DOT 7 0 4 4 57.14
DoD 132 2 27** 29 21.97
EPA 7 0 0 0 0
GSA 1 0 1 1 100
HHS 62 0 11 11 17.74
NASA 21 0 3 3 14.29
NSF 12 4 0 4 33.33
USDA 18 0 4 4 22.22
VA 1 0 1 1 100
All
Agencies
361 19 65 84 23.27
*Department of Agriculture (USDA), Department of Commerce (DOC), Department of Defense (DoD),
Department of Energy (DOE), General Services Administration (GSA), Department of Health and Human
Services (HHS), Department of Homeland Security (DHS), Department of the Interior (DOI), Department
of Labor (DOL), National Science Foundation (NSF), Department of Transportation (DOT), Department of
Veterans Affairs (VA), Environmental Protection Agency (EPA), National Aeronautics and Space
Administration (NASA).
**Includes one respondent reporting on multiple labs/facilities that were predominantly GOGO but
included some GOCO activity.
Source: Authors’ tabulations from “Software Copyright Impact Survey,” OMB Control No. 0693-0033,
Expiration Date: 07/31/2022
For the entire group of 361 potential respondents, 84 or 23.3% responded. Of the
respondents, 77.4% were GOGO respondents (counting the one respondent that was
predominately GOGO), and 22.6% were GOCO respondents. Not all of the responses
shown in Table 1 were complete; a few were so incomplete that they provided no useful
information at all. The numbers of observations for each part of the questionnaire will be
reported with the overview, provided subsequently, of the responses for the items.
Most responses had at least some useful information, and we will describe in overview
the information provided about the various items in the survey. Moreover, there were
enough respondents with sufficiently complete information to estimate some simple
models of the revenues and costs for the software products of the agencies’ laboratories
and facilities. We will provide and discuss those estimated models and use them with the
survey results to predict what might be expected if the copyright prohibition for GOGO
laboratories was lifted.

15
This
public
atio
n is
availa
ble
free o
f charg
e fro
m: h
ttps://d
oi.o
rg/1
0.6
02
8/N
IST
.GC
R.2
1-0
28
We have looked at the agencies to gather information about the agencies’ custom
software activities that have not previously been tracked. Because the information that
we gathered with the Software Copyright Impact Survey has not previously been tracked
and reported systematically, providing responses to the survey was a challenge for many
respondents. The report should be considered to be only an exploratory first look that
develops new information about the agencies’ software activities and about the possible
effects of allowing agencies to copyright government-works software.
2.4. Software Licensing & Public Domain Software Release Activity 2015-2019
As explained in Section 2.3, not all of the responses shown in Table 1 were complete;
consequently, the number of observations available will vary as we describe various
aspects of the agencies’ software activity for the five years from 2015 through 2019. For
the overview of the relationship between licensing revenues and the number of licensed
software products, there were enough complete responses to estimate a very simple
model of the revenue function separately for the GOCO laboratories or laboratory
facilities and for the GOGO laboratories or laboratory facilities.
2.4.1. The Simple Model of Software Revenues
For the relationship between licensing revenues and the number of licensed software
products, for each of the respondents who answered the relevant questions, there are five
observations—one for each fiscal year from 2015 through 2019. Some GOGO labs,
despite the prohibition on copyrighting their software, have revenues from licensed
software products either because the products were patented or because they were
copyrighted software that had been transferred to the agency or were protected with
copyrights outside of the United States. Most GOGO labs, however, because they lack
the ability to copyright their software, do not have software products available for
licensing. The GOCO labs, in contrast, do typically have copyrighted software products
available for licensing.
To describe the simple relationship between licensed software products and licensing
revenues, we use three variables. For the ith responding laboratory/laboratories or
laboratory facility/facilities, the annual number of licensed software products in fiscal
year t is denoted swprodlicdit. The ith respondent’s software licensing revenue for fiscal
year t was reported in nominal dollars, but we have used the U.S. Bureau of Economic
Analysis gross domestic product implicit price deflator to convert it to constant dollars of
2019. The ith respondent’s software licensing revenue in constant 2019 dollars is for
fiscal year t denoted revenue19it. To describe whether or not there was intellectual
property (IP) protection with either copyrights or patents or both, the variable
IPprotectedit = 1 when there were copyrights or patents, and = 0 when there was no
copyright or patent protection.
For the respondents providing complete information for the three variables, there were 7
GOCO respondents, 26 GOGO respondents, and 1 respondent reporting a mixed case
where for multiple laboratories, the majority were GOGO. Separating the GOCO and
16
This
public
atio
n is
availa
ble
free o
f charg
e fro
m: h
ttps://d
oi.o
rg/1
0.6
02
8/N
IST
.GC
R.2
1-0
28
GOGO respondents, Table 2 shows the descriptive statistics for the revenue model’s
variables for those respondents. The descriptive statistics for the one respondent
reporting for a collection of GOGO and GOCO laboratories are not included in Table 2.
However, in Appendix C we present the estimated revenue model with and without that
observation and with a control for its presence.
There are marked differences among GOGO respondents and also among the GOCO
respondents, and the samples are small for this exploratory study. It is especially
interesting then to have a complete picture of the distributions for the variables about
which the respondents have reported. Thus, in the tables of descriptive statistics, in
addition to the usual report of the number of observations, the mean, and the standard
deviation for each variable, the tables show the value of each variable at the 25th, 50th,
75th, and 100th percentiles of the distribution. The value at the 50th percentile is the
median. Additionally, the skewness and kurtosis of the distribution for each variable is
provided.48 Because the GOGO and GOCO labs and facilities differ greatly in their
software operations, the distributions for the variables are asymmetric (skewed right,
excepting the IP protection variable for the GOCO sample) and more peaked than the
normal distribution, especially so for the GOGO respondents.
Subsequently, we develop a simple model of licensing revenues (in order to be able to
predict what might happen if GOGOs are allowed to copyright their software). It is
important to understand that the distribution for the reported licensing revenues can be
asymmetric (as they clearly are), and yet we can estimate a useful descriptive model. The
model explains the revenue with explanatory variables, and it is the distribution of the
error (the part of revenue that is not explained by the model) that we need to address. We
describe the distribution of the error with the presentation in Appendix C of the technical
details of the simple model.
48 Skewness measures the asymmetry of the variable’s distribution. Skewness is zero for a symmetric
distribution. Typically, if the median is greater than the mean, there is negative skewness—the distribution
is skewed to the left. Typically when the median is less than the mean, the skewness measure is positive
and the distribution is skewed to the right. Kurtosis measures the peakedness of the variable’s distribution.
A smaller kurtosis measure accompanies a flatter distribution. As a benchmark, the normal distribution has
a skewness measure of zero and a kurtosis measure of 3. Stata Base Reference Manual, Release 12, A
Stata Press Publication, StataCorp LP, College Station, Texas, 2011, Version 12, p. 2087.
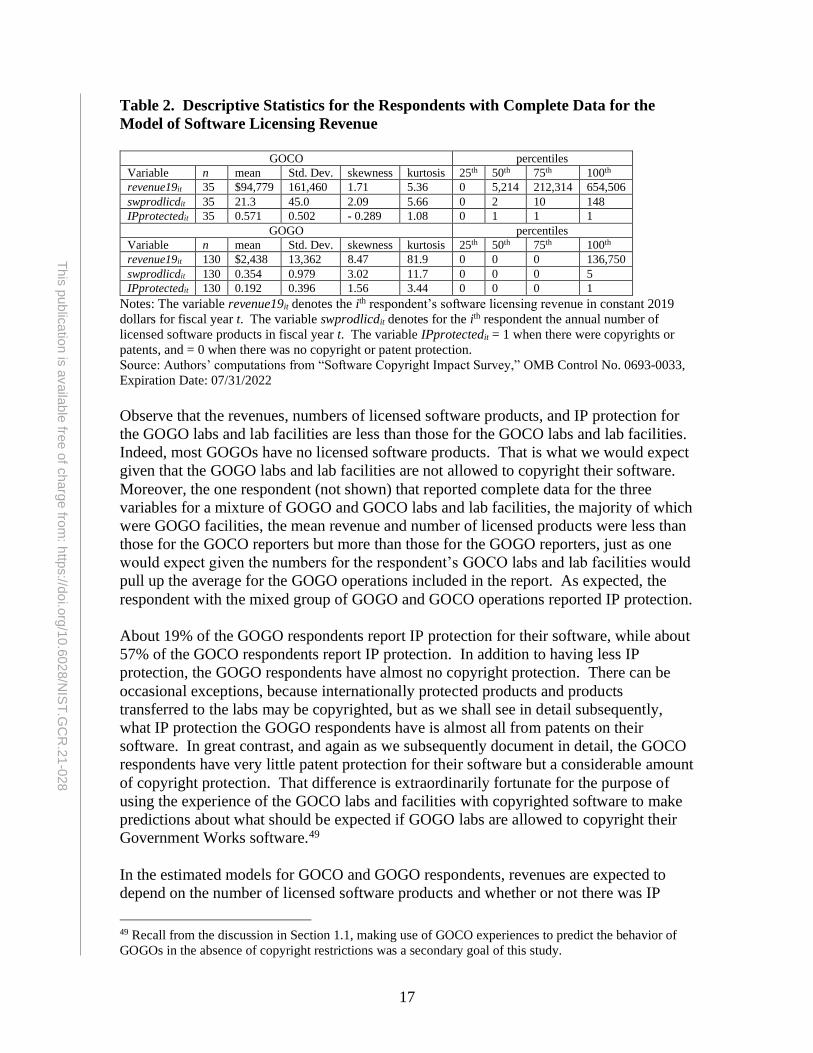
17
This
public
atio
n is
availa
ble
free o
f charg
e fro
m: h
ttps://d
oi.o
rg/1
0.6
02
8/N
IST
.GC
R.2
1-0
28
Table 2. Descriptive Statistics for the Respondents with Complete Data for the
Model of Software Licensing Revenue
GOCO percentiles
Variable n mean Std. Dev. skewness kurtosis 25th 50th 75th 100th
revenue19it 35 $94,779 161,460 1.71 5.36 0 5,214 212,314 654,506
swprodlicdit 35 21.3 45.0 2.09 5.66 0 2 10 148
IPprotectedit 35 0.571 0.502 - 0.289 1.08 0 1 1 1
GOGO percentiles
Variable n mean Std. Dev. skewness kurtosis 25th 50th 75th 100th
revenue19it 130 $2,438 13,362 8.47 81.9 0 0 0 136,750
swprodlicdit 130 0.354 0.979 3.02 11.7 0 0 0 5
IPprotectedit 130 0.192 0.396 1.56 3.44 0 0 0 1
Notes: The variable revenue19it denotes the ith respondent’s software licensing revenue in constant 2019
dollars for fiscal year t. The variable swprodlicdit denotes for the ith respondent the annual number of
licensed software products in fiscal year t. The variable IPprotectedit = 1 when there were copyrights or
patents, and = 0 when there was no copyright or patent protection.
Source: Authors’ computations from “Software Copyright Impact Survey,” OMB Control No. 0693-0033,
Expiration Date: 07/31/2022
Observe that the revenues, numbers of licensed software products, and IP protection for
the GOGO labs and lab facilities are less than those for the GOCO labs and lab facilities.
Indeed, most GOGOs have no licensed software products. That is what we would expect
given that the GOGO labs and lab facilities are not allowed to copyright their software.
Moreover, the one respondent (not shown) that reported complete data for the three
variables for a mixture of GOGO and GOCO labs and lab facilities, the majority of which
were GOGO facilities, the mean revenue and number of licensed products were less than
those for the GOCO reporters but more than those for the GOGO reporters, just as one
would expect given the numbers for the respondent’s GOCO labs and lab facilities would
pull up the average for the GOGO operations included in the report. As expected, the
respondent with the mixed group of GOGO and GOCO operations reported IP protection.
About 19% of the GOGO respondents report IP protection for their software, while about
57% of the GOCO respondents report IP protection. In addition to having less IP
protection, the GOGO respondents have almost no copyright protection. There can be
occasional exceptions, because internationally protected products and products
transferred to the labs may be copyrighted, but as we shall see in detail subsequently,
what IP protection the GOGO respondents have is almost all from patents on their
software. In great contrast, and again as we subsequently document in detail, the GOCO
respondents have very little patent protection for their software but a considerable amount
of copyright protection. That difference is extraordinarily fortunate for the purpose of
using the experience of the GOCO labs and facilities with copyrighted software to make
predictions about what should be expected if GOGO labs are allowed to copyright their
Government Works software.49
In the estimated models for GOCO and GOGO respondents, revenues are expected to
depend on the number of licensed software products and whether or not there was IP
49 Recall from the discussion in Section 1.1, making use of GOCO experiences to predict the behavior of
GOGOs in the absence of copyright restrictions was a secondary goal of this study.

18
This
public
atio
n is
availa
ble
free o
f charg
e fro
m: h
ttps://d
oi.o
rg/1
0.6
02
8/N
IST
.GC
R.2
1-0
28
protection. The simple models might be thought of as testing the theory that revenues
would depend on those two explanatory variables. The causal relationship is
commonsensical and uncontroversial. Regarding the underlying theory, the licensing
revenues that are collected do of course reflect some of the market value to those outside
the agency who use the software.50 However, given what the GOGO respondents to the
Software Copyright Impact Survey have told us (discussed in detail subsequently) about
what would happen if copyright protection for Government Works software is allowed,
any negotiated fees for federal licenses to use the agencies’ software will be expected to
be far less than the value of the software to the private sector, and moreover, much of the
software would be provided without any charge. For that reason, all of our
interpretations in this report are based on the expectation that software licensing revenues
will not reflect all of the market value that is created by the use of the software that the
agencies make available to others. Still, from the licensee side of the negotiating table,
fees paid for the licenses will reflect a portion of the future market value—but not all of
that value—of the features the software will enable.51
For this exploratory study, as a part of providing a first glimpse at the software activity of
the federal agencies’ labs and facilities, the models provide a way to describe the
relationship between licensing revenues and the number of licensed products and the
extent to which those products are protected with IP. The descriptive relationships are
subsequently used to provide predictions about how licensing revenues would be
expected to change if GOGO labs and facilities were allowed to copyright their software.
The simple variable describing whether or not there was IP protection is used in the
model because there is not enough information in either the GOCO or the GOGO
samples to estimate each sample’s model with a more refined breakdown of the types of
intellectual property. As we have explained, and as we will see in detail subsequently,
for the GOCO respondents almost all of the IP for their software is from copyrights. In
contrast, almost all of the IP for the GOGO respondents is from patents simply because
they are not allowed to copyright their software. The result, as we have said (but it bears
repeating) is fortunate. It is fortunate because we need to use the GOCO respondents’
experience with copyrights to provide a glimpse of what might happen if the GOGO
50 Here in this paragraph we focus on the views from legal authorities and economic reasoning about
licensing revenues and market values. In the very simple revenue model that can be estimated from limited
data, we see that a statistically significant descriptive relationship can be estimated between licensing
revenues and the number of licensed products and the extent of their IP. Stated differently, an observed
relationship is discerned apart from the random error. Future research, with much larger samples of
respondents, will be able to refine the estimated revenue function. 51 Instructive is Jacob Erlich’s observation, “How, then, can reasonable royalty payments be established?
As stated in Georgia-Pacific Corporation v. Plywood-Champion Papers, Inc. (166 USPQ 239) “Where a
willing licensor and a willing licensee are negotiating for a royalty the hypothetical negations would not
occur in a vacuum of pure logic. They would involve a marketplace confrontation of the parties,
the outcome of which would depend upon such factors as their relative bargaining strength; the anticipated
amount of profits … and any other economic factor that normally prudent businessmen would … take into
consideration in negotiating the hypothetical license.” (Jacob N. Erlich, “Licensing Government-Owned
Inventions and Establishing Royalty Payments Thereon,” chapter 5, pp. 89-100, in Valuation of Intangible
Assets in Global Operations, edited by Farok J. Contractor, (Westport, Connecticut: Quorum Books,
2001), at p. 91.
19
This
public
atio
n is
availa
ble
free o
f charg
e fro
m: h
ttps://d
oi.o
rg/1
0.6
02
8/N
IST
.GC
R.2
1-0
28
respondents were allowed to copyright their software. It is also fortunate that within the
GOCO sample, not all of the respondents have copyright protection for their software,
because with the variance in the copyright protection within the GOCO sample, we can
estimate the effect of the IP protection on revenues.
Abolishing the copyright prohibition would put GOGOs on equal footing with GOCOs in
terms of their opportunities for licensing software products. The GOGOs would be free
to choose the same types of IP protection as the GOCOs. We then make a prediction of
what might happen if GOGOs are allowed to copyright their software. To get the
prediction, we combine the estimated model for the GOCOs (who have the freedom to
copyright) with the choices that the GOGOs tell us that they would make (if they were
allowed to copyright their software) about their number of licensed products and their IP.
In other words, we estimate for the GOCO respondents a model of revenues that shows
the opportunity for revenues given the ability to copyright, but use in the model the
numbers of licensed products and IP that the GOGOs say they would choose if they were
allowed to copyright their software. The GOCO estimated model (used to make
predictions about what would happen if the GOGOs are permitted to copyright their
software) is especially appropriate because the IP effect in the estimated model is coming
from copyrights.
The prediction from the foregoing procedure shows the potential for the GOGOs should
they decide to take advantage of the opportunity for revenues. Copyright protection is
what is driving the results for the GOCO estimated model. So we can use the GOCO
observations to see what effect having copyright protection has for licensing
revenues. Of course, the GOGO respondents could choose to offer no licensed products
and to simply make software available for download without any charge even if the
software is copyrighted. So they may choose not to take full advantage of the
opportunity to earn more revenues, and we have taken pains to include those respondents
that say they would do just that and consequently have no licensing revenues. We are
careful to include such respondents so that we get a better picture of what revenues might
actually be for GOGO respondents if they were allowed to copyright their software. But
many respondents do say that they will increase the number of products available for
licensing. The use of the simple model to forecast their revenues merely shows the
potential for their revenues.
Appendix C provides the details of the estimated models of licensing revenue. A model
is estimated for the GOGO respondents for comparison, but as explained in the foregoing
discussion it is the estimated model for the GOCO respondents that will be useful for
providing an exploratory look at what might be expected to happen if GOGO labs and
facilities were allowed to copyright their software. The estimated function for the GOCO
respondents in Appendix C shows that for a GOCO respondent with the average number
(21 from Table 2) of licensed software products, the expected average annual licensing
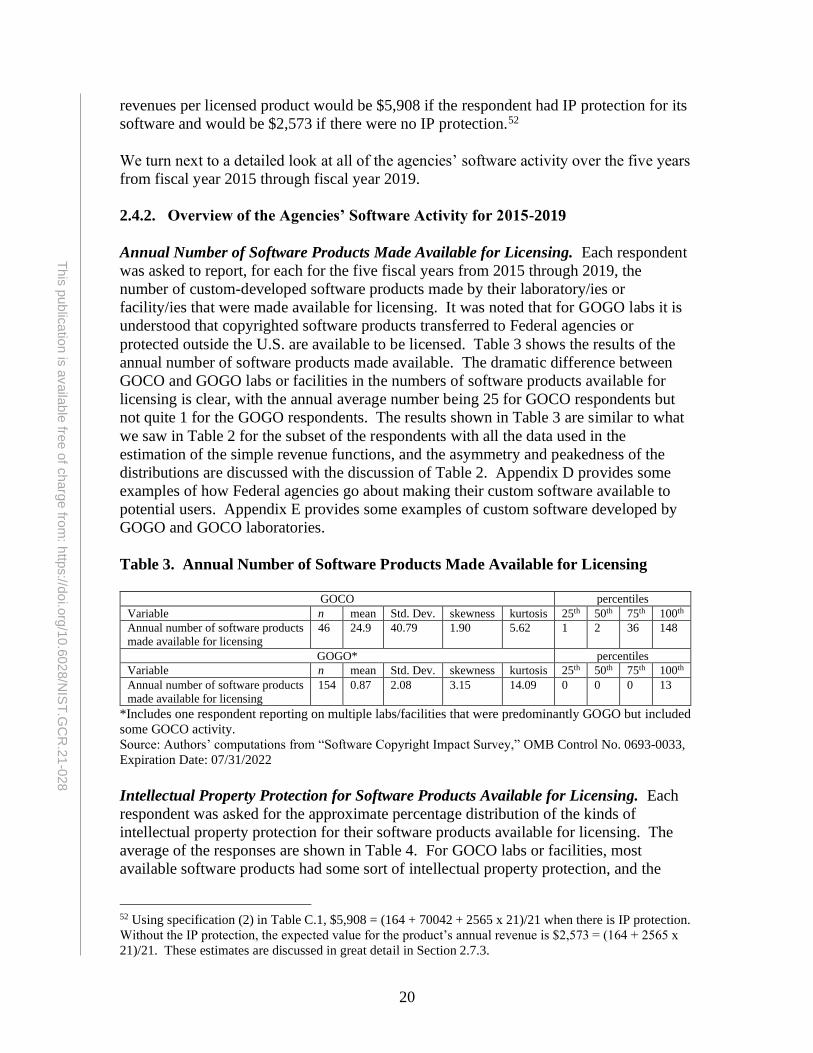
20
This
public
atio
n is
availa
ble
free o
f charg
e fro
m: h
ttps://d
oi.o
rg/1
0.6
02
8/N
IST
.GC
R.2
1-0
28
revenues per licensed product would be $5,908 if the respondent had IP protection for its
software and would be $2,573 if there were no IP protection.52
We turn next to a detailed look at all of the agencies’ software activity over the five years
from fiscal year 2015 through fiscal year 2019.
2.4.2. Overview of the Agencies’ Software Activity for 2015-2019
Annual Number of Software Products Made Available for Licensing. Each respondent
was asked to report, for each for the five fiscal years from 2015 through 2019, the
number of custom-developed software products made by their laboratory/ies or
facility/ies that were made available for licensing. It was noted that for GOGO labs it is
understood that copyrighted software products transferred to Federal agencies or
protected outside the U.S. are available to be licensed. Table 3 shows the results of the
annual number of software products made available. The dramatic difference between
GOCO and GOGO labs or facilities in the numbers of software products available for
licensing is clear, with the annual average number being 25 for GOCO respondents but
not quite 1 for the GOGO respondents. The results shown in Table 3 are similar to what
we saw in Table 2 for the subset of the respondents with all the data used in the
estimation of the simple revenue functions, and the asymmetry and peakedness of the
distributions are discussed with the discussion of Table 2. Appendix D provides some
examples of how Federal agencies go about making their custom software available to
potential users. Appendix E provides some examples of custom software developed by
GOGO and GOCO laboratories.
Table 3. Annual Number of Software Products Made Available for Licensing
GOCO percentiles
Variable n mean Std. Dev. skewness kurtosis 25th 50th 75th 100th
Annual number of software products
made available for licensing
46 24.9 40.79 1.90 5.62 1 2 36 148
GOGO* percentiles
Variable n mean Std. Dev. skewness kurtosis 25th 50th 75th 100th
Annual number of software products
made available for licensing
154 0.87 2.08 3.15 14.09 0 0 0 13
*Includes one respondent reporting on multiple labs/facilities that were predominantly GOGO but included
some GOCO activity.
Source: Authors’ computations from “Software Copyright Impact Survey,” OMB Control No. 0693-0033,
Expiration Date: 07/31/2022
Intellectual Property Protection for Software Products Available for Licensing. Each
respondent was asked for the approximate percentage distribution of the kinds of
intellectual property protection for their software products available for licensing. The
average of the responses are shown in Table 4. For GOCO labs or facilities, most
available software products had some sort of intellectual property protection, and the
52 Using specification (2) in Table C.1, $5,908 = (164 + 70042 + 2565 x 21)/21 when there is IP protection.
Without the IP protection, the expected value for the product’s annual revenue is $2,573 = (164 + 2565 x
21)/21. These estimates are discussed in great detail in Section 2.7.3.
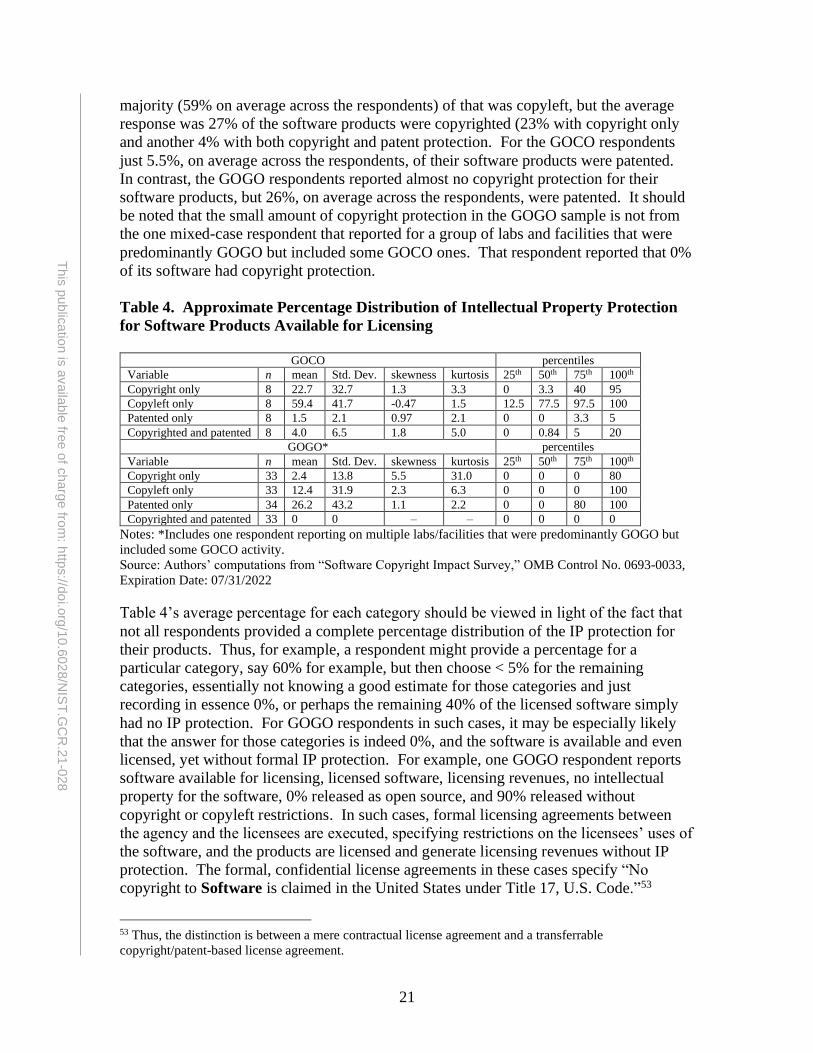
21
This
public
atio
n is
availa
ble
free o
f charg
e fro
m: h
ttps://d
oi.o
rg/1
0.6
02
8/N
IST
.GC
R.2
1-0
28
majority (59% on average across the respondents) of that was copyleft, but the average
response was 27% of the software products were copyrighted (23% with copyright only
and another 4% with both copyright and patent protection. For the GOCO respondents
just 5.5%, on average across the respondents, of their software products were patented.
In contrast, the GOGO respondents reported almost no copyright protection for their
software products, but 26%, on average across the respondents, were patented. It should
be noted that the small amount of copyright protection in the GOGO sample is not from
the one mixed-case respondent that reported for a group of labs and facilities that were
predominantly GOGO but included some GOCO ones. That respondent reported that 0%
of its software had copyright protection.
Table 4. Approximate Percentage Distribution of Intellectual Property Protection
for Software Products Available for Licensing
GOCO percentiles
Variable n mean Std. Dev. skewness kurtosis 25th 50th 75th 100th
Copyright only 8 22.7 32.7 1.3 3.3 0 3.3 40 95
Copyleft only 8 59.4 41.7 -0.47 1.5 12.5 77.5 97.5 100
Patented only 8 1.5 2.1 0.97 2.1 0 0 3.3 5
Copyrighted and patented 8 4.0 6.5 1.8 5.0 0 0.84 5 20
GOGO* percentiles
Variable n mean Std. Dev. skewness kurtosis 25th 50th 75th 100th
Copyright only 33 2.4 13.8 5.5 31.0 0 0 0 80
Copyleft only 33 12.4 31.9 2.3 6.3 0 0 0 100
Patented only 34 26.2 43.2 1.1 2.2 0 0 80 100
Copyrighted and patented 33 0 0 – – 0 0 0 0
Notes: *Includes one respondent reporting on multiple labs/facilities that were predominantly GOGO but
included some GOCO activity.
Source: Authors’ computations from “Software Copyright Impact Survey,” OMB Control No. 0693-0033,
Expiration Date: 07/31/2022
Table 4’s average percentage for each category should be viewed in light of the fact that
not all respondents provided a complete percentage distribution of the IP protection for
their products. Thus, for example, a respondent might provide a percentage for a
particular category, say 60% for example, but then choose < 5% for the remaining
categories, essentially not knowing a good estimate for those categories and just
recording in essence 0%, or perhaps the remaining 40% of the licensed software simply
had no IP protection. For GOGO respondents in such cases, it may be especially likely
that the answer for those categories is indeed 0%, and the software is available and even
licensed, yet without formal IP protection. For example, one GOGO respondent reports
software available for licensing, licensed software, licensing revenues, no intellectual
property for the software, 0% released as open source, and 90% released without
copyright or copyleft restrictions. In such cases, formal licensing agreements between
the agency and the licensees are executed, specifying restrictions on the licensees’ uses of
the software, and the products are licensed and generate licensing revenues without IP
protection. The formal, confidential license agreements in these cases specify “No
copyright to Software is claimed in the United States under Title 17, U.S. Code.”53
53 Thus, the distinction is between a mere contractual license agreement and a transferrable
copyright/patent-based license agreement.
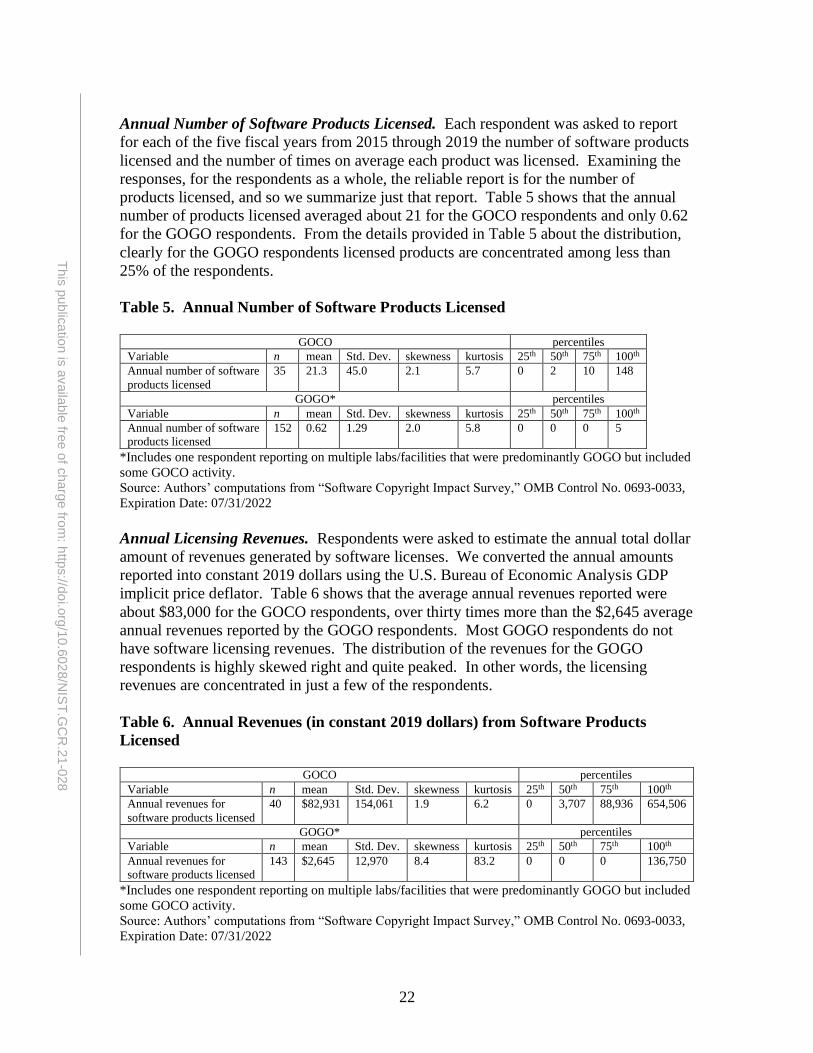
22
This
public
atio
n is
availa
ble
free o
f charg
e fro
m: h
ttps://d
oi.o
rg/1
0.6
02
8/N
IST
.GC
R.2
1-0
28
Annual Number of Software Products Licensed. Each respondent was asked to report
for each of the five fiscal years from 2015 through 2019 the number of software products
licensed and the number of times on average each product was licensed. Examining the
responses, for the respondents as a whole, the reliable report is for the number of
products licensed, and so we summarize just that report. Table 5 shows that the annual
number of products licensed averaged about 21 for the GOCO respondents and only 0.62
for the GOGO respondents. From the details provided in Table 5 about the distribution,
clearly for the GOGO respondents licensed products are concentrated among less than
25% of the respondents.
Table 5. Annual Number of Software Products Licensed
GOCO percentiles
Variable n mean Std. Dev. skewness kurtosis 25th 50th 75th 100th
Annual number of software
products licensed
35 21.3 45.0 2.1 5.7 0 2 10 148
GOGO* percentiles
Variable n mean Std. Dev. skewness kurtosis 25th 50th 75th 100th
Annual number of software
products licensed
152 0.62 1.29 2.0 5.8 0 0 0 5
*Includes one respondent reporting on multiple labs/facilities that were predominantly GOGO but included
some GOCO activity.
Source: Authors’ computations from “Software Copyright Impact Survey,” OMB Control No. 0693-0033,
Expiration Date: 07/31/2022
Annual Licensing Revenues. Respondents were asked to estimate the annual total dollar
amount of revenues generated by software licenses. We converted the annual amounts
reported into constant 2019 dollars using the U.S. Bureau of Economic Analysis GDP
implicit price deflator. Table 6 shows that the average annual revenues reported were
about $83,000 for the GOCO respondents, over thirty times more than the $2,645 average
annual revenues reported by the GOGO respondents. Most GOGO respondents do not
have software licensing revenues. The distribution of the revenues for the GOGO
respondents is highly skewed right and quite peaked. In other words, the licensing
revenues are concentrated in just a few of the respondents.
Table 6. Annual Revenues (in constant 2019 dollars) from Software Products
Licensed
GOCO percentiles
Variable n mean Std. Dev. skewness kurtosis 25th 50th 75th 100th
Annual revenues for
software products licensed
40 $82,931 154,061 1.9 6.2 0 3,707 88,936 654,506
GOGO* percentiles
Variable n mean Std. Dev. skewness kurtosis 25th 50th 75th 100th
Annual revenues for
software products licensed
143 $2,645 12,970 8.4 83.2 0 0 0 136,750
*Includes one respondent reporting on multiple labs/facilities that were predominantly GOGO but included
some GOCO activity.
Source: Authors’ computations from “Software Copyright Impact Survey,” OMB Control No. 0693-0033,
Expiration Date: 07/31/2022

23
This
public
atio
n is
availa
ble
free o
f charg
e fro
m: h
ttps://d
oi.o
rg/1
0.6
02
8/N
IST
.GC
R.2
1-0
28
Annual Number of Software Products Available for Download without a License.
Each respondent was asked to report, for each fiscal year from 2015 through 2019, the
number of software products available for download to the public without a license.
Table 7 shows only a small difference between the GOCO and GOGO respondents for
the average number, with the GOCO respondents averaging 1.6 such products available
annually, and the GOGO respondents averaging 1.3. The distributions shown in Table 7
show that, as compared with the GOCO respondents, a larger percentage of the GOGO
respondents have software available for download without a license.
Table 7. Annual Number of Software Products Available for Download to the
Public without a License
GOCO percentiles
Variable n mean Std. Dev. skewness kurtosis 25th 50th 75th 100th
Annual number available for
download without a license
25 1.6 3.27 1.5 3.2 0 0 0 8
GOGO* percentiles
Variable n mean Std. Dev. skewness kurtosis 25th 50th 75th 100th
Annual number available for
download without a license
145 1.3 2.63 2.5 8.1 0 0 2 10
*Includes one respondent reporting on multiple labs/facilities that were predominantly GOGO but included
some GOCO activity.
Source: Authors’ computations from “Software Copyright Impact Survey,” OMB Control No. 0693-0033,
Expiration Date: 07/31/2022
Release Attributes. Each respondent was asked to estimate, for the five fiscal years from
2015 through 2019 as a whole, the percentage distribution of the software products
available from the respondent’s laboratory/laboratories (or laboratory facility/facilities)
across the categories for release attributes shown in Table 8. Using all responses from
the survey recipients, GOCO respondents are 2.4 times as likely (56% compared with
23%) as GOGO respondents to release a software product as open source, while GOGO
respondents are 2.5 times as likely (15% compared with 6%) to release a product to the
general public for noncommercial use exclusive of the open source releases. While none
of the GOCO respondents report releasing software to the general public without
copyright or copyleft restrictions, the GOGO respondents report that 25% of their
software is released in that way. For GOCO respondents, the percentage of software
released under “other conditions” is 3.4 times as much (24% compared with 7%) as for
GOGO respondents. The “other conditions” include releases restricted for national
security reasons. The reason, presumably, is that the majority of the GOCOs are DOE
labs working with military-related software (see Table 1).

24
This
public
atio
n is
availa
ble
free o
f charg
e fro
m: h
ttps://d
oi.o
rg/1
0.6
02
8/N
IST
.GC
R.2
1-0
28
Table 8. Approximate Percentage Distribution of Release Attributes for Software
Products Available: All Responses
GOCO percentiles
Variable n mean Std. Dev. skewness kurtosis 25th 50th 75th 100th
Percent released as
Open source
7 55.7 37.2 -0.70 1.8 0 70 85 95
Percent released to the
general public or other
agencies for noncommercial
use (exclusive of open
source)
6 6.25 8.27 0.77 1.8 0 1.2 15 20
Percent released to
general public without
copyright or copyleft
restrictions
6 0 0 – – 0 0 0 0
Percent released under
other conditions
6 23.75 37.7 1.3 3.1 0 1.2 40 100
GOGO* percentiles
Variable n mean Std. Dev. skewness kurtosis 25th 50th 75th 100th
Percent released as
Open source
34 22.5 35.7 1.3 3.1 0 0 30 100
Percent released to the
general public or other
agencies for noncommercial
use (exclusive of open
source)
34 15.1 28.9 1.8 5.2 0 0 15 100
Percent released to
general public without
copyright or copyleft
restrictions
34 25.3 39.3 1.1 2.5 0 0 50 100
Percent released under
other conditions
33 7.3 24.1 3.5 13.5 0 0 0 100
*Includes one respondent reporting on multiple labs/facilities that were predominantly GOGO but included
some GOCO activity.
Source: Authors’ computations from “Software Copyright Impact Survey,” OMB Control No. 0693-0033,
Expiration Date: 07/31/2022
In Table 8, for the GOCO respondents, the 7 responses for open source releases includes
a respondent who reported 70% for the open source category and then left all of the
others three fields blank. One of the remaining 6 respondents has licensed software and
revenues, reports nothing available for download to the public, and fills out 0s for the
distribution percentages for each category. The remaining 5 respondents report
percentages that sum to 100% for the four distribution categories. For those 5
respondents, the averages for the four categories for open source, noncommercial use
exclusive of open source, releases without copyright or copyleft restrictions, and then the
other releases are respectively 64%, 7.5%, 0%, and 28.5% as compared with the 55.7%,
6.25%, 0%, and 23.7% shown in Table 8 for all of the GOCO respondents that provided
an answer. The results for the smaller, selective sample of the six GOCO respondents,
including the one who reported 70% for open source releases and then left the other fields
blank are shown in Table 9. Thus, Table 9 eliminates the one respondent whose answer
for the distribution of release types was zero in all four categories.
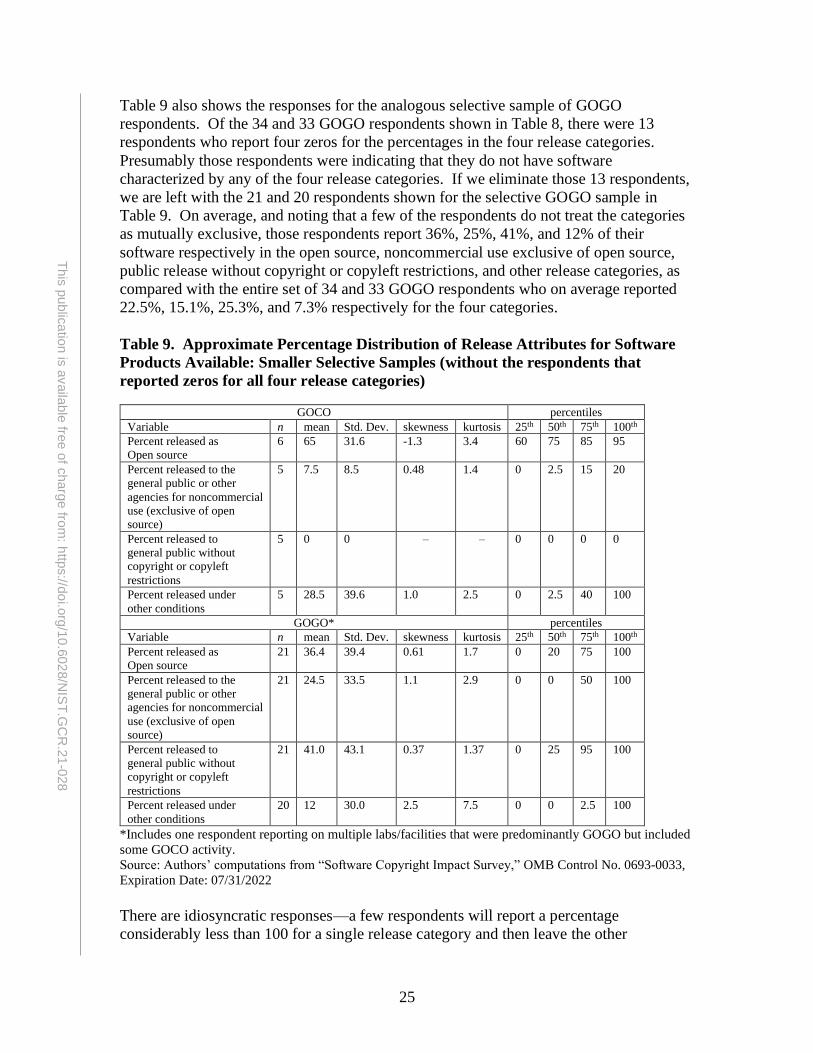
25
This
public
atio
n is
availa
ble
free o
f charg
e fro
m: h
ttps://d
oi.o
rg/1
0.6
02
8/N
IST
.GC
R.2
1-0
28
Table 9 also shows the responses for the analogous selective sample of GOGO
respondents. Of the 34 and 33 GOGO respondents shown in Table 8, there were 13
respondents who report four zeros for the percentages in the four release categories.
Presumably those respondents were indicating that they do not have software
characterized by any of the four release categories. If we eliminate those 13 respondents,
we are left with the 21 and 20 respondents shown for the selective GOGO sample in
Table 9. On average, and noting that a few of the respondents do not treat the categories
as mutually exclusive, those respondents report 36%, 25%, 41%, and 12% of their
software respectively in the open source, noncommercial use exclusive of open source,
public release without copyright or copyleft restrictions, and other release categories, as
compared with the entire set of 34 and 33 GOGO respondents who on average reported
22.5%, 15.1%, 25.3%, and 7.3% respectively for the four categories.
Table 9. Approximate Percentage Distribution of Release Attributes for Software
Products Available: Smaller Selective Samples (without the respondents that
reported zeros for all four release categories)
GOCO percentiles
Variable n mean Std. Dev. skewness kurtosis 25th 50th 75th 100th
Percent released as
Open source
6 65 31.6 -1.3 3.4 60 75 85 95
Percent released to the
general public or other
agencies for noncommercial
use (exclusive of open
source)
5 7.5 8.5 0.48 1.4 0 2.5 15 20
Percent released to
general public without
copyright or copyleft
restrictions
5 0 0 – – 0 0 0 0
Percent released under
other conditions
5 28.5 39.6 1.0 2.5 0 2.5 40 100
GOGO* percentiles
Variable n mean Std. Dev. skewness kurtosis 25th 50th 75th 100th
Percent released as
Open source
21 36.4 39.4 0.61 1.7 0 20 75 100
Percent released to the
general public or other
agencies for noncommercial
use (exclusive of open
source)
21 24.5 33.5 1.1 2.9 0 0 50 100
Percent released to
general public without
copyright or copyleft
restrictions
21 41.0 43.1 0.37 1.37 0 25 95 100
Percent released under
other conditions
20 12 30.0 2.5 7.5 0 0 2.5 100
*Includes one respondent reporting on multiple labs/facilities that were predominantly GOGO but included
some GOCO activity.
Source: Authors’ computations from “Software Copyright Impact Survey,” OMB Control No. 0693-0033,
Expiration Date: 07/31/2022
There are idiosyncratic responses—a few respondents will report a percentage
considerably less than 100 for a single release category and then leave the other

26
This
public
atio
n is
availa
ble
free o
f charg
e fro
m: h
ttps://d
oi.o
rg/1
0.6
02
8/N
IST
.GC
R.2
1-0
28
categories blank or enter essentially zero (choosing < 5% when from the context of their
answers throughout it is clear that is denoting zero); there are respondents who record
essentially zeros (choosing < 5%) for all four categories; although most respondents treat
the release categories as mutually exclusive, there are a couple of cases where a
respondent reports software characterized by multiple release categories. For example, a
respondent reports that 100% of its software is released as open source, but also 100% of
it is released without copyright or copyleft restrictions. Or another reports that 100% of
its software is in the category for release to the general public for noncommercial use
exclusive of open source and also reports 100% of its software is released without
copyright or copyleft restrictions. Being aware of the idiosyncrasies in the reporting,
Table 9 is probably the best characterization of the release categories for the GOCO and
GOGO respondents. However, Table 8 also provides the perspective of GOGO
respondents that have software but, presumably because they do not release it, report
essentially zero percent of the software in any of the release categories.
2.5. Software Development and Management Costs, 2015-2019
For the overview of the relationship between software development and management
costs and the number of software products available for licensing or for download
without a license, there were enough complete responses to estimate a very simple model
of the cost function for the agencies’ laboratories or laboratory facilities. We describe the
simple model here in this section, and then we use the model (in conjunction with the
simple revenue model) subsequently when we make predictions about how lifting the
prohibition on GOGO software copyright might be expected to affect the agencies’
software licensing activity. After describing the simple cost model for the laboratories
with sufficient data to estimate the model, we will describe, for each item about costs on
the survey, the detailed information provided by the respondents for their 2015-2019
software development and management costs.
2.5.1. The Simple Model of Software Costs
To describe the relationship between software development and management costs and
the number of software products available for licensing or for download without a
license, we use five variables.
For the period over fiscal years 2015 through 2019, the average annual cost of software
development and management for the ith responding laboratory or laboratory facility (or
laboratories or laboratory facilities if the respondent is submitting a report for multiple
labs or facilities) is denoted cost_19. The respondents reported the cost for the software
development and management as annual FTEs required for the various types of costs, and
also reported the GS-rating for the personnel associated with the FTEs. We estimated the
2019 amount of the annual salary and wages and benefits for the GS-ratings by using (1)
the U.S. OPM’s 2019 General Schedule (GS) schedule of salary and wages.54 Then, (2)
54 https://www.opm.gov/policy-data-oversight/pay-leave/salaries-wages/2019/general-schedule-gs-salary-
calculator/.

27
This
public
atio
n is
availa
ble
free o
f charg
e fro
m: h
ttps://d
oi.o
rg/1
0.6
02
8/N
IST
.GC
R.2
1-0
28
figuring the annual amount of total compensation using the GAO’s assessment of the
relationship of the salary and benefits.55
The dependent variable in the simple model of software costs measures, for software
products available for licensing or download without a license, the laboratory or
laboratory facility’s annual software development and maintenance cost in 2019 dollars.
The annual software cost, denoted cost_19, is computed, based on respondents’
assessment of the annual averages over the fiscal years 2015-2019, as the sum of (1)
[(average annual full-time equivalent (FTE) person years to develop the typical—in terms
of having the average lines of code for the lab’s software products—software
product)x(2019 annual total compensation for the GS-rating of the FTE)]x[average
annual number of software products available for licensing + average annual number of
software products available for download to the public without a license], and (2)
(average annual FTE for writing supporting software to maintain the developed software
products)x(2019 annual total compensation for the GS-rating of the FTE), and (3)
(average annual FTE for administrative support of the inventory of developed software
products)x((2019 annual total compensation for the GS-rating of the FTE), and (4)
(average annual FTE for IP protection and licensing administration for the software
portfolio)x(2019 annual total compensation for the GS-rating of the FTE), and (5)
average annual annuity fees to maintain software patents, and (6) average annual external
legal expenses for software portfolio. Summarizing, the variable cost_19 equals the sum
of the 2015-2019 annual averages for the cost of (1) software development, (2)
supporting software to maintain developed software, (3) administrative support for
managing developed software, (4) licensing administration, (5) annuity fees for software
patents, and (6) external legal support expenses for IP protection and licensing for
software portfolio.
The variable total_products is, for the fiscal years from 2015 through 2019, the sum of
the respondent’s average annual number of software products available for licensing and
its average annual number of software products available for download by the public
without a license. The variable avgLOC is the average lines of code for the responding
lab’s or facility’s typical software product. The labs and lab facilities will be developing
different types of software, and the variable avgLOC is used as a way to control for such
differences. Another control for differences in the types of software products is with the
qualitative variable dGOCO; it equals 1 if the lab or facility is government owned and
contractor operated and is zero otherwise. Controlling for the variable dGOCO allows
the costs for the GOCO operations to differ from the costs of the GOGO operations. To
describe whether or not there was intellectual property (IP) protection with either
copyrights or patents or both, the variable IPprotected = 1 when there were copyrights or
patents, and = 0 when there was no copyright or patent protection.56
55 HUMAN CAPITAL: Trends in Executive and Judicial Pay Suggest a Reexamination of the Total
Compensation Package, GAO-06-1116T, September 20, 2006, which stated: “[For] the balance of total
compensation between pay and benefits within and across executive-level positions, overall Federal civilian
employees receive, in broad terms, most of their compensation—about 67 percent—in salary and wages
and about 33 percent in the form of benefits or deferred compensation.” 56 If there were a much larger sample of GOCO respondents, and if for that larger sample there was
experience with both copyrights and patents, and if there was variance across the observations in that

28
This
public
atio
n is
availa
ble
free o
f charg
e fro
m: h
ttps://d
oi.o
rg/1
0.6
02
8/N
IST
.GC
R.2
1-0
28
For the respondents with complete information for the five variables, there were 2 GOCO
respondents, 13 GOGO respondents, and 1 respondent reporting a mixed case where for
multiple laboratories, the majority were GOGO. Table 10 shows the descriptive statistics
for the cost model’s variables for those 16 respondents. Observe that the average annual
cost for the 16 respondents is highly skewed, with the mean considerably greater than the
median. The average lines of code for the respondents’ typical software products are also
highly skewed. The cost model estimated in Table 11, and discussed next, supports the
view that the skewed distribution for cost is the result of the skewed distribution of
product sizes.
Table 10. Descriptive Statistics for the Respondents with Complete Data for the
Model of Software Development and Maintenance Costs
percentiles
Variable n mean Std. Dev. skewness kurtosis 25th 50th 75th 100th
cost_19 16 $1,273,945 2,599,641 3.0 11.2 71,838 221,813 1,332,334 10,500,000
total_products 16 2.15 2.32 0.89 2.6 0 2 3.4 7.2
avgLOC 16 44,822 124,186 3.4 12.8 550 3,575 18,152 500,000
IPprotected 16 0.375 0.50 0.52 1.3 0 0 1 1
dGOCO 16 0.125 0.34 2.3 6.1 0 0 0 1
Notes: The variable cost_19 is, for the fiscal years from 2015-2019, the respondent’s average annual cost of
software development and management. The variable total_products is, for the fiscal years from 2015
through 2019, the sum of the respondent’s average annual number of software products available for
licensing and its average annual number of software products available for download by the public without
a license. The variable avgLOC is the average lines of code for the responding lab’s or facility’s typical
software product. The variable dGOCO equals 1 if the responding lab or facility is government owned and
contractor operated and is zero otherwise. The variable IPprotected = 1 when there were copyrights or
patents, and = 0 when there was no copyright or patent protection.
Source: Authors’ computations from “Software Copyright Impact Survey,” OMB Control No. 0693-0033,
Expiration Date: 07/31/2022
For the 16 respondents with complete observations for the model’s variables, Table 11
shows the estimation of the simple cost model. The estimated model shows the expected
annual software costs for a lab or lab facility as a function of the annual number of
software products, available for licensing or for download by the public without license,
and the average size of those products as measured by their lines of code. The annual
cost of software products available for licensing or download is assumed to be zero if the
number of such products is zero. Column (1) shows cost_19 as a function of
total_products (the average annual number of software products available for licensing
plus the average annual number of software products available for download by the
public without a license) and avgLOC (the average lines of code for the responding lab’s
or facility’s typical software product) used as a control for differences across the
responding labs in the software developed. With costs measured in 2019 dollars, the
estimated coefficient for total_products shows the marginal effect on costs from adding
an additional software product available for licensing or available for download by the
public without a license. At the margin, holding constant a product’s size, for another
experience, it would be useful to develop a more detailed cost function that could identify the separable
effects of copyrights and patents on costs. However, the sample of GOCO respondents is small, and their
experience is primarily with copyrights.
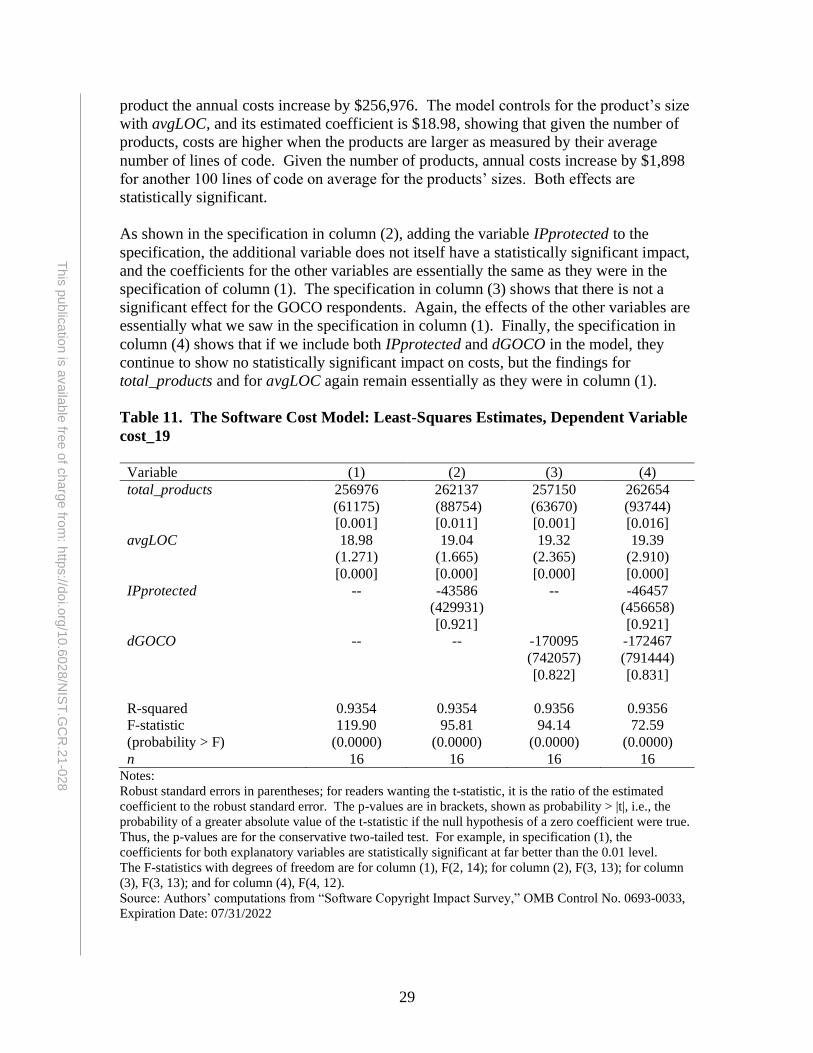
29
This
public
atio
n is
availa
ble
free o
f charg
e fro
m: h
ttps://d
oi.o
rg/1
0.6
02
8/N
IST
.GC
R.2
1-0
28
product the annual costs increase by $256,976. The model controls for the product’s size
with avgLOC, and its estimated coefficient is $18.98, showing that given the number of
products, costs are higher when the products are larger as measured by their average
number of lines of code. Given the number of products, annual costs increase by $1,898
for another 100 lines of code on average for the products’ sizes. Both effects are
statistically significant.
As shown in the specification in column (2), adding the variable IPprotected to the
specification, the additional variable does not itself have a statistically significant impact,
and the coefficients for the other variables are essentially the same as they were in the
specification of column (1). The specification in column (3) shows that there is not a
significant effect for the GOCO respondents. Again, the effects of the other variables are
essentially what we saw in the specification in column (1). Finally, the specification in
column (4) shows that if we include both IPprotected and dGOCO in the model, they
continue to show no statistically significant impact on costs, but the findings for
total_products and for avgLOC again remain essentially as they were in column (1).
Table 11. The Software Cost Model: Least-Squares Estimates, Dependent Variable
cost_19
Variable (1) (2) (3) (4)
total_products 256976
(61175)
[0.001]
262137
(88754)
[0.011]
257150
(63670)
[0.001]
262654
(93744)
[0.016]
avgLOC 18.98
(1.271)
[0.000]
19.04
(1.665)
[0.000]
19.32
(2.365)
[0.000]
19.39
(2.910)
[0.000]
IPprotected -- -43586
(429931)
[0.921]
-- -46457
(456658)
[0.921]
dGOCO -- -- -170095
(742057)
[0.822]
-172467
(791444)
[0.831]
R-squared 0.9354 0.9354 0.9356 0.9356
F-statistic
(probability > F)
119.90
(0.0000)
95.81
(0.0000)
94.14
(0.0000)
72.59
(0.0000)
n 16 16 16 16 Notes:
Robust standard errors in parentheses; for readers wanting the t-statistic, it is the ratio of the estimated
coefficient to the robust standard error. The p-values are in brackets, shown as probability > |t|, i.e., the
probability of a greater absolute value of the t-statistic if the null hypothesis of a zero coefficient were true.
Thus, the p-values are for the conservative two-tailed test. For example, in specification (1), the
coefficients for both explanatory variables are statistically significant at far better than the 0.01 level.
The F-statistics with degrees of freedom are for column (1), F(2, 14); for column (2), F(3, 13); for column
(3), F(3, 13); and for column (4), F(4, 12).
Source: Authors’ computations from “Software Copyright Impact Survey,” OMB Control No. 0693-0033,
Expiration Date: 07/31/2022
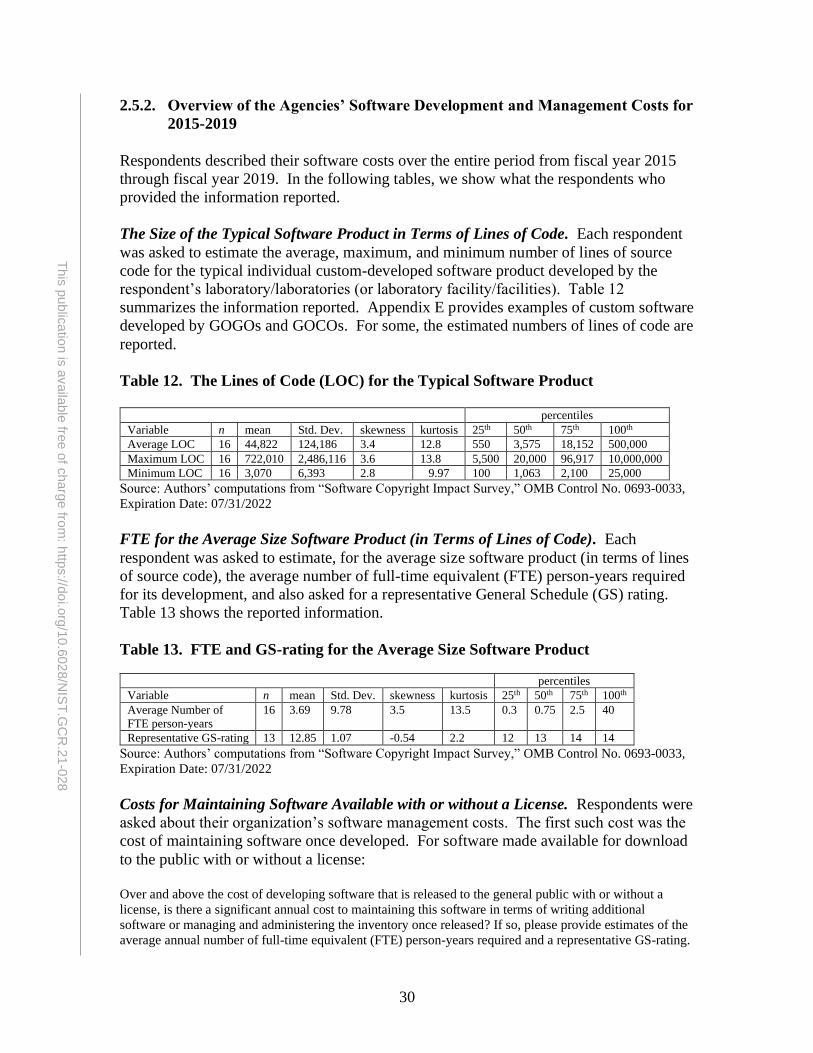
30
This
public
atio
n is
availa
ble
free o
f charg
e fro
m: h
ttps://d
oi.o
rg/1
0.6
02
8/N
IST
.GC
R.2
1-0
28
2.5.2. Overview of the Agencies’ Software Development and Management Costs for
2015-2019
Respondents described their software costs over the entire period from fiscal year 2015
through fiscal year 2019. In the following tables, we show what the respondents who
provided the information reported.
The Size of the Typical Software Product in Terms of Lines of Code. Each respondent
was asked to estimate the average, maximum, and minimum number of lines of source
code for the typical individual custom-developed software product developed by the
respondent’s laboratory/laboratories (or laboratory facility/facilities). Table 12
summarizes the information reported. Appendix E provides examples of custom software
developed by GOGOs and GOCOs. For some, the estimated numbers of lines of code are
reported.
Table 12. The Lines of Code (LOC) for the Typical Software Product
percentiles
Variable n mean Std. Dev. skewness kurtosis 25th 50th 75th 100th
Average LOC 16 44,822 124,186 3.4 12.8 550 3,575 18,152 500,000
Maximum LOC 16 722,010 2,486,116 3.6 13.8 5,500 20,000 96,917 10,000,000
Minimum LOC 16 3,070 6,393 2.8 9.97 100 1,063 2,100 25,000
Source: Authors’ computations from “Software Copyright Impact Survey,” OMB Control No. 0693-0033,
Expiration Date: 07/31/2022
FTE for the Average Size Software Product (in Terms of Lines of Code). Each
respondent was asked to estimate, for the average size software product (in terms of lines
of source code), the average number of full-time equivalent (FTE) person-years required
for its development, and also asked for a representative General Schedule (GS) rating.
Table 13 shows the reported information.
Table 13. FTE and GS-rating for the Average Size Software Product
percentiles
Variable n mean Std. Dev. skewness kurtosis 25th 50th 75th 100th
Average Number of
FTE person-years
16 3.69 9.78 3.5 13.5 0.3 0.75 2.5 40
Representative GS-rating 13 12.85 1.07 -0.54 2.2 12 13 14 14
Source: Authors’ computations from “Software Copyright Impact Survey,” OMB Control No. 0693-0033,
Expiration Date: 07/31/2022
Costs for Maintaining Software Available with or without a License. Respondents were
asked about their organization’s software management costs. The first such cost was the
cost of maintaining software once developed. For software made available for download
to the public with or without a license:
Over and above the cost of developing software that is released to the general public with or without a
license, is there a significant annual cost to maintaining this software in terms of writing additional
software or managing and administering the inventory once released? If so, please provide estimates of the
average annual number of full-time equivalent (FTE) person-years required and a representative GS-rating.
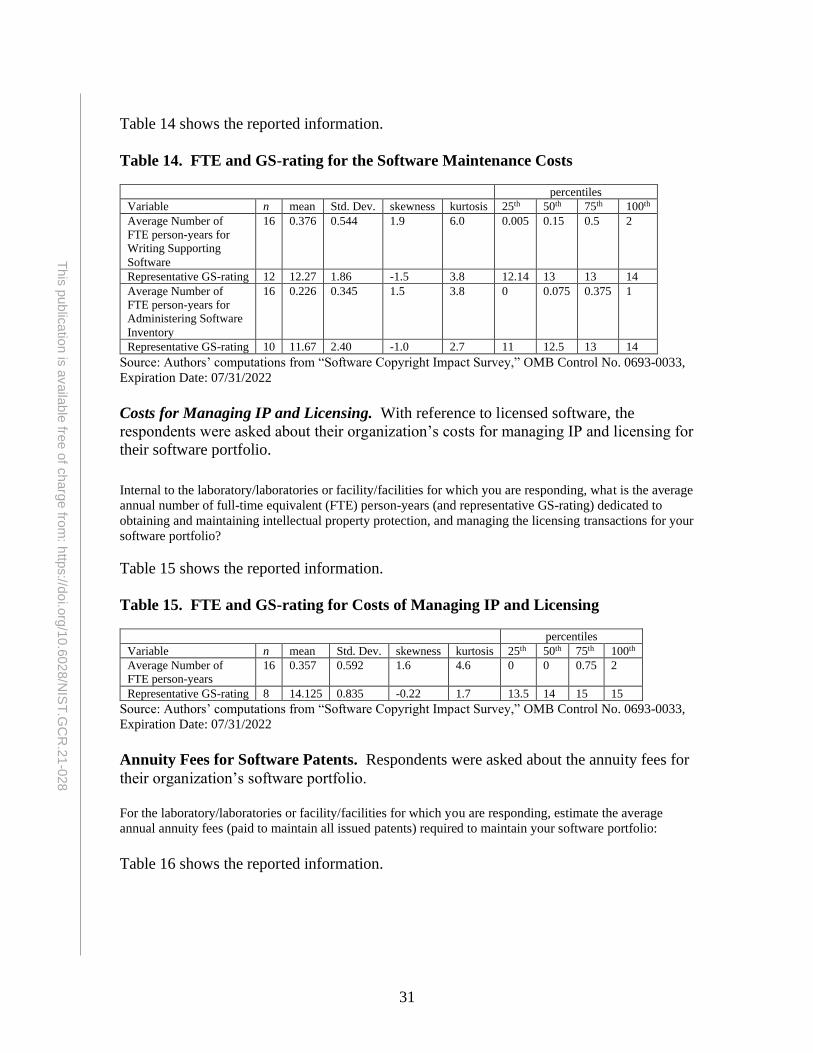
31
This
public
atio
n is
availa
ble
free o
f charg
e fro
m: h
ttps://d
oi.o
rg/1
0.6
02
8/N
IST
.GC
R.2
1-0
28
Table 14 shows the reported information.
Table 14. FTE and GS-rating for the Software Maintenance Costs
percentiles
Variable n mean Std. Dev. skewness kurtosis 25th 50th 75th 100th
Average Number of
FTE person-years for
Writing Supporting
Software
16 0.376 0.544 1.9 6.0 0.005 0.15 0.5 2
Representative GS-rating 12 12.27 1.86 -1.5 3.8 12.14 13 13 14
Average Number of
FTE person-years for
Administering Software
Inventory
16 0.226 0.345 1.5 3.8 0 0.075 0.375 1
Representative GS-rating 10 11.67 2.40 -1.0 2.7 11 12.5 13 14
Source: Authors’ computations from “Software Copyright Impact Survey,” OMB Control No. 0693-0033,
Expiration Date: 07/31/2022
Costs for Managing IP and Licensing. With reference to licensed software, the
respondents were asked about their organization’s costs for managing IP and licensing for
their software portfolio.
Internal to the laboratory/laboratories or facility/facilities for which you are responding, what is the average
annual number of full-time equivalent (FTE) person-years (and representative GS-rating) dedicated to
obtaining and maintaining intellectual property protection, and managing the licensing transactions for your
software portfolio?
Table 15 shows the reported information.
Table 15. FTE and GS-rating for Costs of Managing IP and Licensing
percentiles
Variable n mean Std. Dev. skewness kurtosis 25th 50th 75th 100th
Average Number of
FTE person-years
16 0.357 0.592 1.6 4.6 0 0 0.75 2
Representative GS-rating 8 14.125 0.835 -0.22 1.7 13.5 14 15 15
Source: Authors’ computations from “Software Copyright Impact Survey,” OMB Control No. 0693-0033,
Expiration Date: 07/31/2022
Annuity Fees for Software Patents. Respondents were asked about the annuity fees for
their organization’s software portfolio.
For the laboratory/laboratories or facility/facilities for which you are responding, estimate the average
annual annuity fees (paid to maintain all issued patents) required to maintain your software portfolio:
Table 16 shows the reported information.
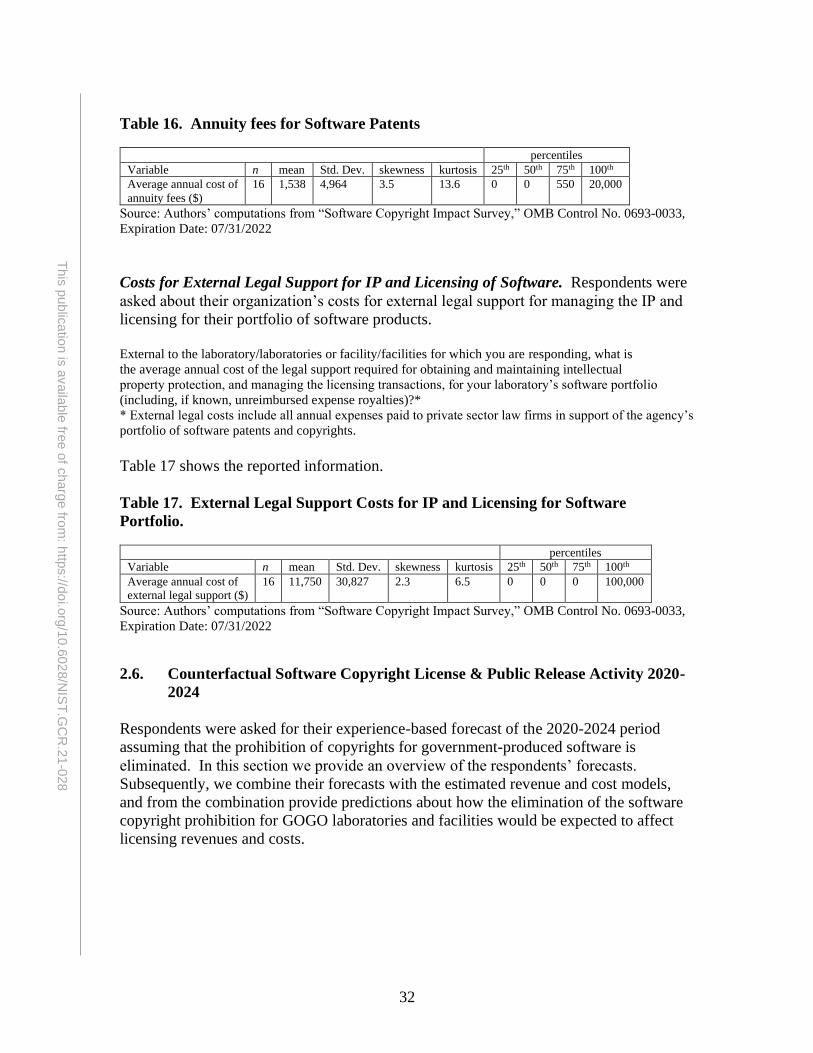
32
This
public
atio
n is
availa
ble
free o
f charg
e fro
m: h
ttps://d
oi.o
rg/1
0.6
02
8/N
IST
.GC
R.2
1-0
28
Table 16. Annuity fees for Software Patents
percentiles
Variable n mean Std. Dev. skewness kurtosis 25th 50th 75th 100th
Average annual cost of
annuity fees ($)
16 1,538 4,964 3.5 13.6 0 0 550 20,000
Source: Authors’ computations from “Software Copyright Impact Survey,” OMB Control No. 0693-0033,
Expiration Date: 07/31/2022
Costs for External Legal Support for IP and Licensing of Software. Respondents were
asked about their organization’s costs for external legal support for managing the IP and
licensing for their portfolio of software products.
External to the laboratory/laboratories or facility/facilities for which you are responding, what is
the average annual cost of the legal support required for obtaining and maintaining intellectual
property protection, and managing the licensing transactions, for your laboratory’s software portfolio
(including, if known, unreimbursed expense royalties)?*
* External legal costs include all annual expenses paid to private sector law firms in support of the agency’s
portfolio of software patents and copyrights.
Table 17 shows the reported information.
Table 17. External Legal Support Costs for IP and Licensing for Software
Portfolio.
percentiles
Variable n mean Std. Dev. skewness kurtosis 25th 50th 75th 100th
Average annual cost of
external legal support ($)
16 11,750 30,827 2.3 6.5 0 0 0 100,000
Source: Authors’ computations from “Software Copyright Impact Survey,” OMB Control No. 0693-0033,
Expiration Date: 07/31/2022
2.6. Counterfactual Software Copyright License & Public Release Activity 2020-
2024
Respondents were asked for their experience-based forecast of the 2020-2024 period
assuming that the prohibition of copyrights for government-produced software is
eliminated. In this section we provide an overview of the respondents’ forecasts.
Subsequently, we combine their forecasts with the estimated revenue and cost models,
and from the combination provide predictions about how the elimination of the software
copyright prohibition for GOGO laboratories and facilities would be expected to affect
licensing revenues and costs.
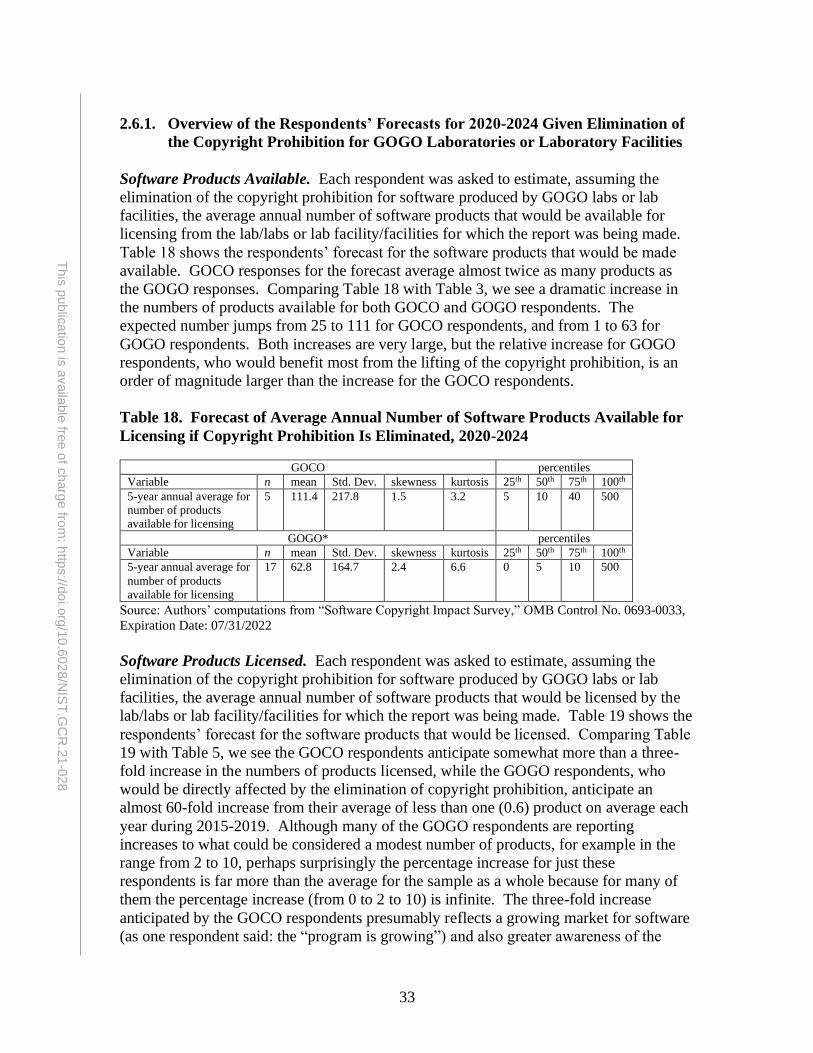
33
This
public
atio
n is
availa
ble
free o
f charg
e fro
m: h
ttps://d
oi.o
rg/1
0.6
02
8/N
IST
.GC
R.2
1-0
28
2.6.1. Overview of the Respondents’ Forecasts for 2020-2024 Given Elimination of
the Copyright Prohibition for GOGO Laboratories or Laboratory Facilities
Software Products Available. Each respondent was asked to estimate, assuming the
elimination of the copyright prohibition for software produced by GOGO labs or lab
facilities, the average annual number of software products that would be available for
licensing from the lab/labs or lab facility/facilities for which the report was being made.
Table 18 shows the respondents’ forecast for the software products that would be made
available. GOCO responses for the forecast average almost twice as many products as
the GOGO responses. Comparing Table 18 with Table 3, we see a dramatic increase in
the numbers of products available for both GOCO and GOGO respondents. The
expected number jumps from 25 to 111 for GOCO respondents, and from 1 to 63 for
GOGO respondents. Both increases are very large, but the relative increase for GOGO
respondents, who would benefit most from the lifting of the copyright prohibition, is an
order of magnitude larger than the increase for the GOCO respondents.
Table 18. Forecast of Average Annual Number of Software Products Available for
Licensing if Copyright Prohibition Is Eliminated, 2020-2024
GOCO percentiles
Variable n mean Std. Dev. skewness kurtosis 25th 50th 75th 100th
5-year annual average for
number of products
available for licensing
5 111.4 217.8 1.5 3.2 5 10 40 500
GOGO* percentiles
Variable n mean Std. Dev. skewness kurtosis 25th 50th 75th 100th
5-year annual average for
number of products
available for licensing
17 62.8 164.7 2.4 6.6 0 5 10 500
Source: Authors’ computations from “Software Copyright Impact Survey,” OMB Control No. 0693-0033,
Expiration Date: 07/31/2022
Software Products Licensed. Each respondent was asked to estimate, assuming the
elimination of the copyright prohibition for software produced by GOGO labs or lab
facilities, the average annual number of software products that would be licensed by the
lab/labs or lab facility/facilities for which the report was being made. Table 19 shows the
respondents’ forecast for the software products that would be licensed. Comparing Table
19 with Table 5, we see the GOCO respondents anticipate somewhat more than a three-
fold increase in the numbers of products licensed, while the GOGO respondents, who
would be directly affected by the elimination of copyright prohibition, anticipate an
almost 60-fold increase from their average of less than one (0.6) product on average each
year during 2015-2019. Although many of the GOGO respondents are reporting
increases to what could be considered a modest number of products, for example in the
range from 2 to 10, perhaps surprisingly the percentage increase for just these
respondents is far more than the average for the sample as a whole because for many of
them the percentage increase (from 0 to 2 to 10) is infinite. The three-fold increase
anticipated by the GOCO respondents presumably reflects a growing market for software
(as one respondent said: the “program is growing”) and also greater awareness of the

34
This
public
atio
n is
availa
ble
free o
f charg
e fro
m: h
ttps://d
oi.o
rg/1
0.6
02
8/N
IST
.GC
R.2
1-0
28
opportunities for using software created in the labs and facilities of Federal agencies (as
one respondent providing a rationale for growth said: “increased awareness”).
Table 19. Forecast of Average Annual Number of Licensed Software Products if
Copyright Prohibition Is Eliminated, 2020-2024.
GOCO percentiles
Variable n mean Std. Dev. skewness kurtosis 25th 50th 75th 100th
5-year annual average for
number of products
licensed
4 67.2 122.1 1.1 2.3 1 9.5 133.5 250
GOGO* percentiles
Variable n mean Std. Dev. skewness kurtosis 25th 50th 75th 100th
5-year annual average for
number of products
licensed
16 34.3 124.2 3.6 14.0 0 1.5 7 500
Notes: Two of the 22 respondents who provided an estimate of the number of products available did not
make an estimate of how many of their products available would actually be licensed.
*Includes one respondent reporting on multiple labs/facilities that were predominantly GOGO but included
some GOCO activity.
Source: Authors’ computations from “Software Copyright Impact Survey,” OMB Control No. 0693-0033,
Expiration Date: 07/31/2022
Licenses per Licensed Software Product. Each respondent was asked to estimate,
assuming the elimination of the copyright prohibition for software produced by GOGO
labs or lab facilities, the average annual number of times each licensed software product
would be licensed. In the counterfactual scenario here where there is no copyright
prohibition, these details about the number of times a product would be licensed become
relevant for the GOGO respondents. Table 20 shows the respondents’ forecast for the
average number of times that a software product would be licensed. The one outlier is
not a data-entry error, but instead a respondent who anticipates that the software created
by the lab will have a lot of use, and given the type of software that the lab creates, the
expectation is completely sensible. However, because the observation far greater than the
others, we present the averages with and without it.
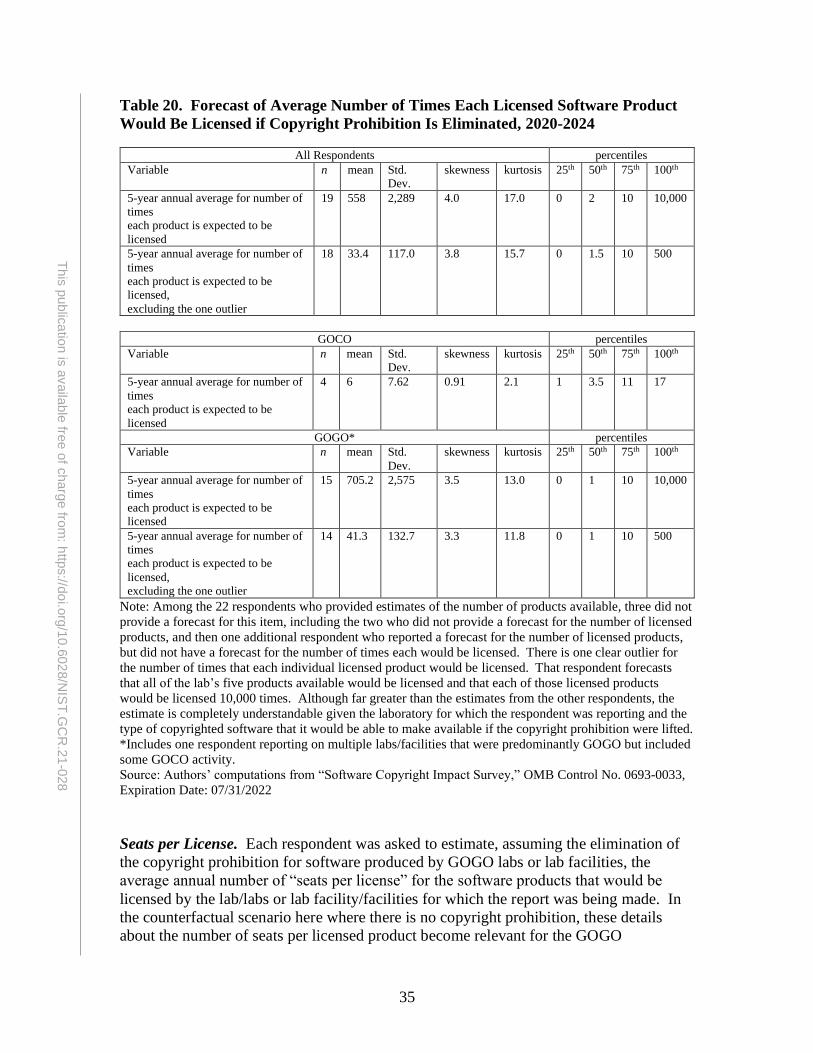
35
This
public
atio
n is
availa
ble
free o
f charg
e fro
m: h
ttps://d
oi.o
rg/1
0.6
02
8/N
IST
.GC
R.2
1-0
28
Table 20. Forecast of Average Number of Times Each Licensed Software Product
Would Be Licensed if Copyright Prohibition Is Eliminated, 2020-2024
All Respondents percentiles
Variable n mean Std.
Dev.
skewness kurtosis 25th 50th 75th 100th
5-year annual average for number of
times
each product is expected to be
licensed
19 558 2,289 4.0 17.0 0 2 10 10,000
5-year annual average for number of
times
each product is expected to be
licensed,
excluding the one outlier
18 33.4 117.0 3.8 15.7 0 1.5 10 500
GOCO percentiles
Variable n mean Std.
Dev.
skewness kurtosis 25th 50th 75th 100th
5-year annual average for number of
times
each product is expected to be
licensed
4 6 7.62 0.91 2.1 1 3.5 11 17
GOGO* percentiles
Variable n mean Std.
Dev.
skewness kurtosis 25th 50th 75th 100th
5-year annual average for number of
times
each product is expected to be
licensed
15 705.2 2,575 3.5 13.0 0 1 10 10,000
5-year annual average for number of
times
each product is expected to be
licensed,
excluding the one outlier
14 41.3 132.7 3.3 11.8 0 1 10 500
Note: Among the 22 respondents who provided estimates of the number of products available, three did not
provide a forecast for this item, including the two who did not provide a forecast for the number of licensed
products, and then one additional respondent who reported a forecast for the number of licensed products,
but did not have a forecast for the number of times each would be licensed. There is one clear outlier for
the number of times that each individual licensed product would be licensed. That respondent forecasts
that all of the lab’s five products available would be licensed and that each of those licensed products
would be licensed 10,000 times. Although far greater than the estimates from the other respondents, the
estimate is completely understandable given the laboratory for which the respondent was reporting and the
type of copyrighted software that it would be able to make available if the copyright prohibition were lifted.
*Includes one respondent reporting on multiple labs/facilities that were predominantly GOGO but included
some GOCO activity.
Source: Authors’ computations from “Software Copyright Impact Survey,” OMB Control No. 0693-0033,
Expiration Date: 07/31/2022
Seats per License. Each respondent was asked to estimate, assuming the elimination of
the copyright prohibition for software produced by GOGO labs or lab facilities, the
average annual number of “seats per license” for the software products that would be
licensed by the lab/labs or lab facility/facilities for which the report was being made. In
the counterfactual scenario here where there is no copyright prohibition, these details
about the number of seats per licensed product become relevant for the GOGO
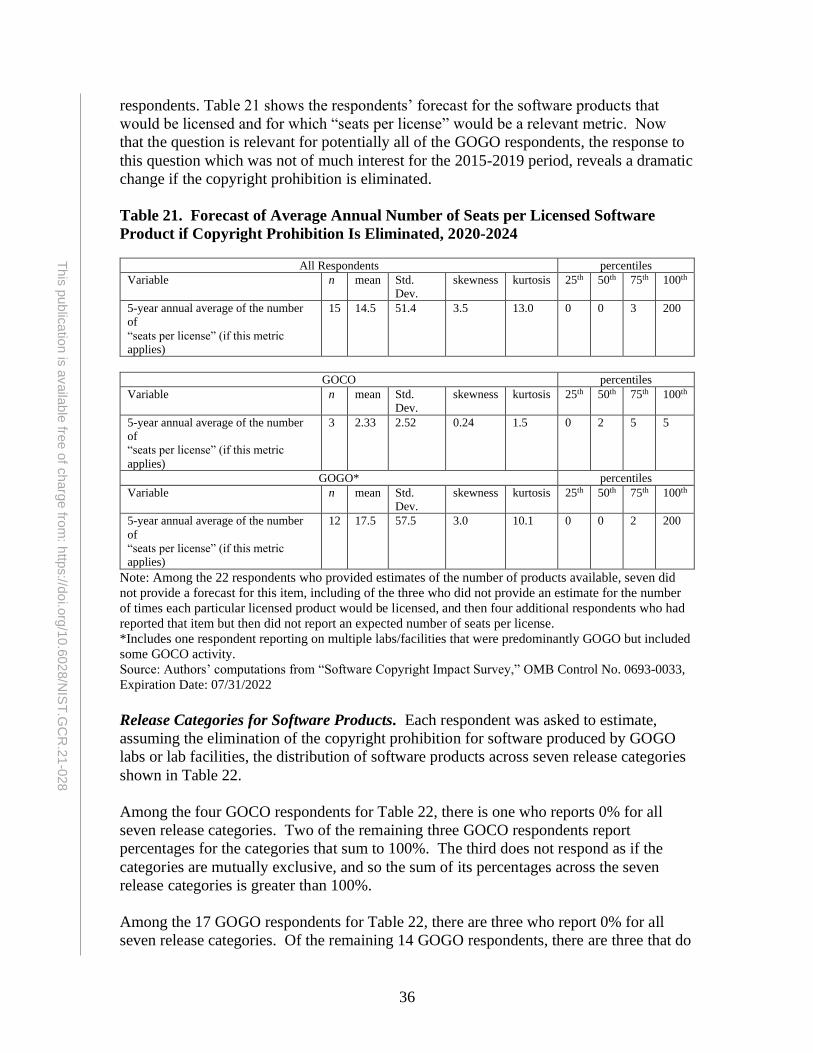
36
This
public
atio
n is
availa
ble
free o
f charg
e fro
m: h
ttps://d
oi.o
rg/1
0.6
02
8/N
IST
.GC
R.2
1-0
28
respondents. Table 21 shows the respondents’ forecast for the software products that
would be licensed and for which “seats per license” would be a relevant metric. Now
that the question is relevant for potentially all of the GOGO respondents, the response to
this question which was not of much interest for the 2015-2019 period, reveals a dramatic
change if the copyright prohibition is eliminated.
Table 21. Forecast of Average Annual Number of Seats per Licensed Software
Product if Copyright Prohibition Is Eliminated, 2020-2024
All Respondents percentiles
Variable n mean Std.
Dev.
skewness kurtosis 25th 50th 75th 100th
5-year annual average of the number
of
“seats per license” (if this metric
applies)
15 14.5 51.4 3.5 13.0 0 0 3 200
GOCO percentiles
Variable n mean Std.
Dev.
skewness kurtosis 25th 50th 75th 100th
5-year annual average of the number
of
“seats per license” (if this metric
applies)
3 2.33 2.52 0.24 1.5 0 2 5 5
GOGO* percentiles
Variable n mean Std.
Dev.
skewness kurtosis 25th 50th 75th 100th
5-year annual average of the number
of
“seats per license” (if this metric
applies)
12 17.5 57.5 3.0 10.1 0 0 2 200
Note: Among the 22 respondents who provided estimates of the number of products available, seven did
not provide a forecast for this item, including of the three who did not provide an estimate for the number
of times each particular licensed product would be licensed, and then four additional respondents who had
reported that item but then did not report an expected number of seats per license.
*Includes one respondent reporting on multiple labs/facilities that were predominantly GOGO but included
some GOCO activity.
Source: Authors’ computations from “Software Copyright Impact Survey,” OMB Control No. 0693-0033,
Expiration Date: 07/31/2022
Release Categories for Software Products. Each respondent was asked to estimate,
assuming the elimination of the copyright prohibition for software produced by GOGO
labs or lab facilities, the distribution of software products across seven release categories
shown in Table 22.
Among the four GOCO respondents for Table 22, there is one who reports 0% for all
seven release categories. Two of the remaining three GOCO respondents report
percentages for the categories that sum to 100%. The third does not respond as if the
categories are mutually exclusive, and so the sum of its percentages across the seven
release categories is greater than 100%.
Among the 17 GOGO respondents for Table 22, there are three who report 0% for all
seven release categories. Of the remaining 14 GOGO respondents, there are three that do
37
This
public
atio
n is
availa
ble
free o
f charg
e fro
m: h
ttps://d
oi.o
rg/1
0.6
02
8/N
IST
.GC
R.2
1-0
28
not report the categories as mutually exclusive (i.e., the percentages sum to more than
100%). For the remaining 11 GOGO respondents, each reports percentages across the
categories that sum to 100%.
The summary responses for all four GOCO respondents and for all 17 GOGO
respondents are shown in Table 22. Table 23 shows the summary of the responses for the
samples of GOCO and GOGO respondents who do not report all zeros for the seven
release categories.
From the complete sample of respondents in Table 22, we see that the release category
with the highest percentage on average is software copyrighted as open source and for the
GOCO respondents the percentage of the products within that category is more than
twice the percentage in any other category. For the GOGO respondents, the percent
copyrighted as open source is about half as large as for the GOCO respondents. For the
GOGO group, the “copyrighted-as-open-source” category is also the largest percentage
across the seven categories, but it is half as likely to be a category characterizing their
software in the counterfactual scenario in which they could copyright their software. The
same result, although it is more pronounced, shows up in Table 23 with the samples that
exclude respondents reporting all zeros for the percentages of their software in each of
the seven release categories.
From Table 9, for the GOGO operations, 41% of the software products made available
during the period 2015-2019 were released to the general public without copyright or
copyleft restrictions, and therefore those products were clearly in the public domain.
From Table 23, for the GOGO operations, that percentage falls to less than 11%. Thus,
however helpful copyrights may be for strengthening the effectiveness of making GOGO
software available for others, there is a social cost—or unintended consequence—of
eliminating the copyright prohibition.57 Namely, the proportion of public domain
software is expected to decline by 30% (41% – 11%). Considering the accounting for
GOGO IP and release categories described in Table 4 and Table 9, from Table 23’s
accounting of the release attributes for GOGO software, the proportion of public domain
software lost is transferred into the proportion taken by copyrighted software. Offsetting
that relative decline is the very large increase in the number of software products licensed
and, presumably, used productively. As we have seen by comparing Table 19 with Table
5, the GOGO respondents anticipate an almost 60-fold increase in the number of software
products licensed if copyright is allowed; GOCO respondents expect about a 3-fold
increase. Also, comparing Table 18 with Table 3, for products made available for
licensing, a 72-fold increase is expected for GOGO respondents, and a 4.5-fold increase
for GOCO respondents. Despite the increase in software made available and software
licensed, the loss of public domain software may lessen productivity for some users of
the agencies’ publicly released software.
57 On the loss of public domain software as a social cost or unintended consequence of eliminating the
copyright prohibition, see Alfonso Gambardella and Bronwyn H. Hall, “Proprietary vs. Public Domain
Licensing of Software and Research Products,” National Bureau of Economic Research, Working Paper
11120, February 2005, http://www.nber.org/papers/w11120.
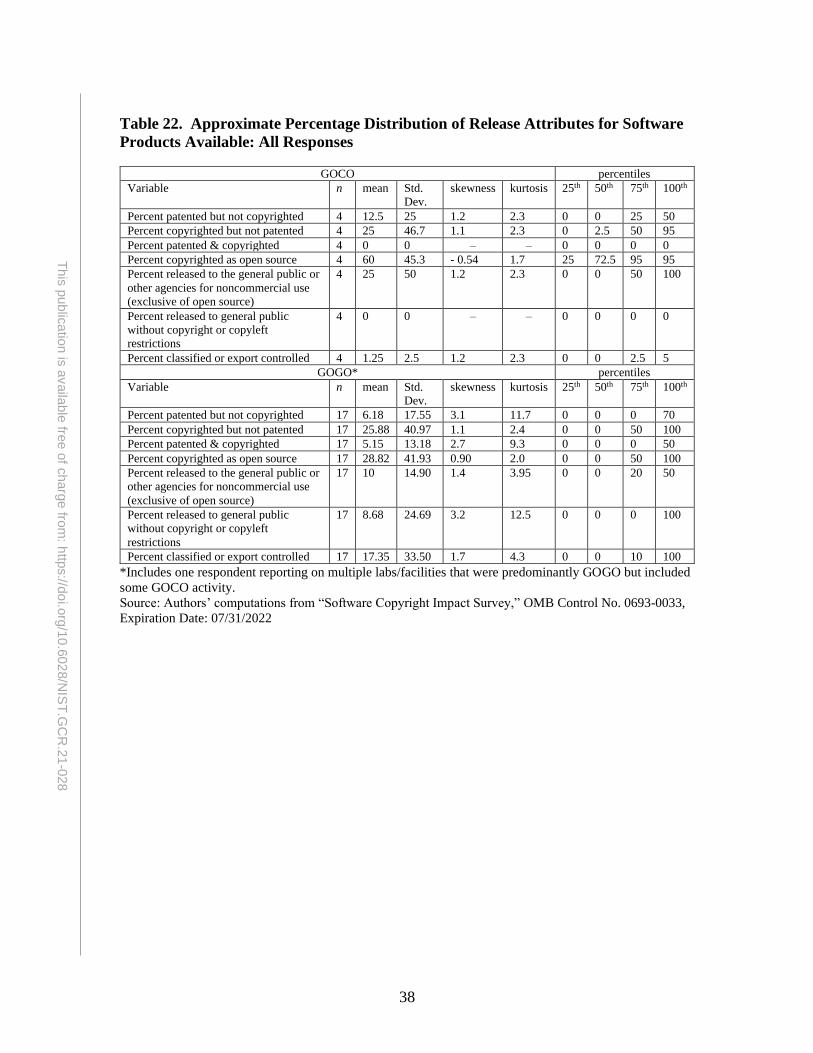
38
This
public
atio
n is
availa
ble
free o
f charg
e fro
m: h
ttps://d
oi.o
rg/1
0.6
02
8/N
IST
.GC
R.2
1-0
28
Table 22. Approximate Percentage Distribution of Release Attributes for Software
Products Available: All Responses
GOCO percentiles
Variable n mean Std.
Dev.
skewness kurtosis 25th 50th 75th 100th
Percent patented but not copyrighted 4 12.5 25 1.2 2.3 0 0 25 50
Percent copyrighted but not patented 4 25 46.7 1.1 2.3 0 2.5 50 95
Percent patented & copyrighted 4 0 0 – – 0 0 0 0
Percent copyrighted as open source 4 60 45.3 - 0.54 1.7 25 72.5 95 95
Percent released to the general public or
other agencies for noncommercial use
(exclusive of open source)
4 25 50 1.2 2.3 0 0 50 100
Percent released to general public
without copyright or copyleft
restrictions
4 0 0 – – 0 0 0 0
Percent classified or export controlled 4 1.25 2.5 1.2 2.3 0 0 2.5 5
GOGO* percentiles
Variable n mean Std.
Dev.
skewness kurtosis 25th 50th 75th 100th
Percent patented but not copyrighted 17 6.18 17.55 3.1 11.7 0 0 0 70
Percent copyrighted but not patented 17 25.88 40.97 1.1 2.4 0 0 50 100
Percent patented & copyrighted 17 5.15 13.18 2.7 9.3 0 0 0 50
Percent copyrighted as open source 17 28.82 41.93 0.90 2.0 0 0 50 100
Percent released to the general public or
other agencies for noncommercial use
(exclusive of open source)
17 10 14.90 1.4 3.95 0 0 20 50
Percent released to general public
without copyright or copyleft
restrictions
17 8.68 24.69 3.2 12.5 0 0 0 100
Percent classified or export controlled 17 17.35 33.50 1.7 4.3 0 0 10 100
*Includes one respondent reporting on multiple labs/facilities that were predominantly GOGO but included
some GOCO activity.
Source: Authors’ computations from “Software Copyright Impact Survey,” OMB Control No. 0693-0033,
Expiration Date: 07/31/2022
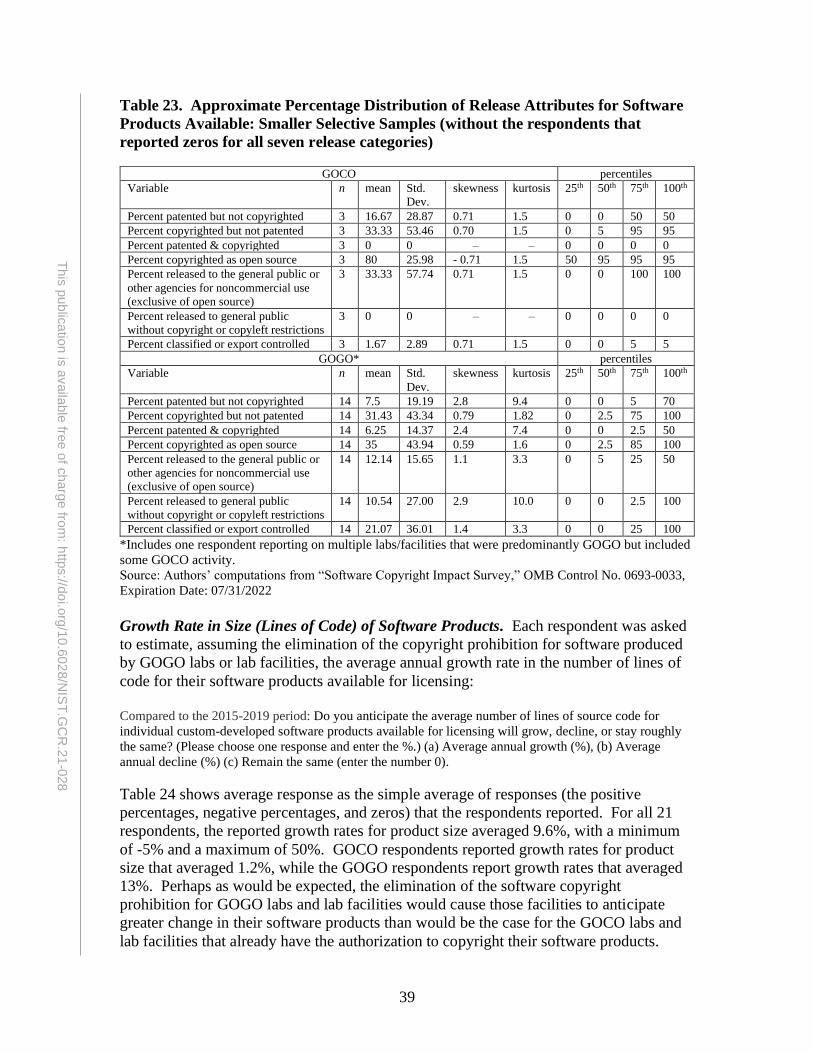
39
This
public
atio
n is
availa
ble
free o
f charg
e fro
m: h
ttps://d
oi.o
rg/1
0.6
02
8/N
IST
.GC
R.2
1-0
28
Table 23. Approximate Percentage Distribution of Release Attributes for Software
Products Available: Smaller Selective Samples (without the respondents that
reported zeros for all seven release categories)
GOCO percentiles
Variable n mean Std.
Dev.
skewness kurtosis 25th 50th 75th 100th
Percent patented but not copyrighted 3 16.67 28.87 0.71 1.5 0 0 50 50
Percent copyrighted but not patented 3 33.33 53.46 0.70 1.5 0 5 95 95
Percent patented & copyrighted 3 0 0 – – 0 0 0 0
Percent copyrighted as open source 3 80 25.98 - 0.71 1.5 50 95 95 95
Percent released to the general public or
other agencies for noncommercial use
(exclusive of open source)
3 33.33 57.74 0.71 1.5 0 0 100 100
Percent released to general public
without copyright or copyleft restrictions
3 0 0 – – 0 0 0 0
Percent classified or export controlled 3 1.67 2.89 0.71 1.5 0 0 5 5
GOGO* percentiles
Variable n mean Std.
Dev.
skewness kurtosis 25th 50th 75th 100th
Percent patented but not copyrighted 14 7.5 19.19 2.8 9.4 0 0 5 70
Percent copyrighted but not patented 14 31.43 43.34 0.79 1.82 0 2.5 75 100
Percent patented & copyrighted 14 6.25 14.37 2.4 7.4 0 0 2.5 50
Percent copyrighted as open source 14 35 43.94 0.59 1.6 0 2.5 85 100
Percent released to the general public or
other agencies for noncommercial use
(exclusive of open source)
14 12.14 15.65 1.1 3.3 0 5 25 50
Percent released to general public
without copyright or copyleft restrictions
14 10.54 27.00 2.9 10.0 0 0 2.5 100
Percent classified or export controlled 14 21.07 36.01 1.4 3.3 0 0 25 100
*Includes one respondent reporting on multiple labs/facilities that were predominantly GOGO but included
some GOCO activity.
Source: Authors’ computations from “Software Copyright Impact Survey,” OMB Control No. 0693-0033,
Expiration Date: 07/31/2022
Growth Rate in Size (Lines of Code) of Software Products. Each respondent was asked
to estimate, assuming the elimination of the copyright prohibition for software produced
by GOGO labs or lab facilities, the average annual growth rate in the number of lines of
code for their software products available for licensing:
Compared to the 2015-2019 period: Do you anticipate the average number of lines of source code for
individual custom-developed software products available for licensing will grow, decline, or stay roughly
the same? (Please choose one response and enter the %.) (a) Average annual growth (%), (b) Average
annual decline (%) (c) Remain the same (enter the number 0).
Table 24 shows average response as the simple average of responses (the positive
percentages, negative percentages, and zeros) that the respondents reported. For all 21
respondents, the reported growth rates for product size averaged 9.6%, with a minimum
of -5% and a maximum of 50%. GOCO respondents reported growth rates for product
size that averaged 1.2%, while the GOGO respondents report growth rates that averaged
13%. Perhaps as would be expected, the elimination of the software copyright
prohibition for GOGO labs and lab facilities would cause those facilities to anticipate
greater change in their software products than would be the case for the GOCO labs and
lab facilities that already have the authorization to copyright their software products.
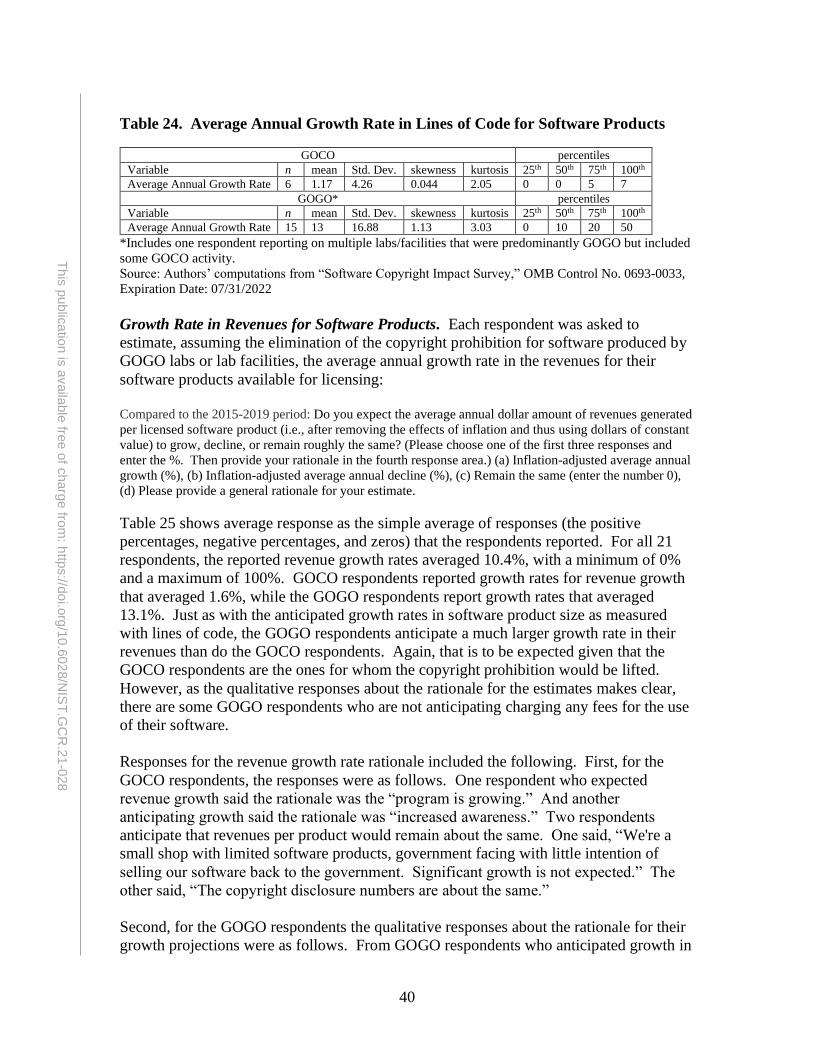
40
This
public
atio
n is
availa
ble
free o
f charg
e fro
m: h
ttps://d
oi.o
rg/1
0.6
02
8/N
IST
.GC
R.2
1-0
28
Table 24. Average Annual Growth Rate in Lines of Code for Software Products
GOCO percentiles
Variable n mean Std. Dev. skewness kurtosis 25th 50th 75th 100th
Average Annual Growth Rate 6 1.17 4.26 0.044 2.05 0 0 5 7
GOGO* percentiles
Variable n mean Std. Dev. skewness kurtosis 25th 50th 75th 100th
Average Annual Growth Rate 15 13 16.88 1.13 3.03 0 10 20 50
*Includes one respondent reporting on multiple labs/facilities that were predominantly GOGO but included
some GOCO activity.
Source: Authors’ computations from “Software Copyright Impact Survey,” OMB Control No. 0693-0033,
Expiration Date: 07/31/2022
Growth Rate in Revenues for Software Products. Each respondent was asked to
estimate, assuming the elimination of the copyright prohibition for software produced by
GOGO labs or lab facilities, the average annual growth rate in the revenues for their
software products available for licensing:
Compared to the 2015-2019 period: Do you expect the average annual dollar amount of revenues generated
per licensed software product (i.e., after removing the effects of inflation and thus using dollars of constant
value) to grow, decline, or remain roughly the same? (Please choose one of the first three responses and
enter the %. Then provide your rationale in the fourth response area.) (a) Inflation-adjusted average annual
growth (%), (b) Inflation-adjusted average annual decline (%), (c) Remain the same (enter the number 0),
(d) Please provide a general rationale for your estimate.
Table 25 shows average response as the simple average of responses (the positive
percentages, negative percentages, and zeros) that the respondents reported. For all 21
respondents, the reported revenue growth rates averaged 10.4%, with a minimum of 0%
and a maximum of 100%. GOCO respondents reported growth rates for revenue growth
that averaged 1.6%, while the GOGO respondents report growth rates that averaged
13.1%. Just as with the anticipated growth rates in software product size as measured
with lines of code, the GOGO respondents anticipate a much larger growth rate in their
revenues than do the GOCO respondents. Again, that is to be expected given that the
GOCO respondents are the ones for whom the copyright prohibition would be lifted.
However, as the qualitative responses about the rationale for the estimates makes clear,
there are some GOGO respondents who are not anticipating charging any fees for the use
of their software.
Responses for the revenue growth rate rationale included the following. First, for the
GOCO respondents, the responses were as follows. One respondent who expected
revenue growth said the rationale was the “program is growing.” And another
anticipating growth said the rationale was “increased awareness.” Two respondents
anticipate that revenues per product would remain about the same. One said, “We're a
small shop with limited software products, government facing with little intention of
selling our software back to the government. Significant growth is not expected.” The
other said, “The copyright disclosure numbers are about the same.”
Second, for the GOGO respondents the qualitative responses about the rationale for their
growth projections were as follows. From GOGO respondents who anticipated growth in

41
This
public
atio
n is
availa
ble
free o
f charg
e fro
m: h
ttps://d
oi.o
rg/1
0.6
02
8/N
IST
.GC
R.2
1-0
28
revenues, one respondent stated, “Our workforce is growing 10% a year. I cannot release
much info due to [security reasons].” Another reported, “Right now we have nothing.
This effort will move [our organization] closer to understanding the value of software
written at [its facilities].” Yet another simply said, “growth in software as an R&D
product”. Another respondent said, “Currently there is almost no revenue generated from
software products. This might change if copyright restrictions are lifted.” From the
GOGO respondents who did not anticipate any growth in revenues, one respondent
simply said, “Open Source, no charge.” Another said, “They will always be freely
available products.” Another respondent said, “There is no licensed software.” Another
said, “[Our lab] has no plans, at this time, to develop any software. Our lab works on
processes and equipment [for internal use].” And another respondent said, “Don't intend
to charge for software as this is counterproductive to getting people to use it.”
Thus, although there are a significant number of respondents who do not anticipate
revenue growth per licensed software product, there are clearly many who do, with the
average response shown in Table 25. Note well that the question here is about the growth
in revenue per licensed product. From the preceding tables we know that considerable
growth in the numbers of licensed products is anticipated, and here in Table 25 we can
see that for many respondents, revenue per licensed product is also expected to grow if
the copyright prohibition is lifted.
Also observe that although there are some GOGO respondents who are not anticipating
charging any fees for the use of their software, nonetheless, lifting the software copyright
prohibition would be expected to increase use of software if the copyright protection
made users of open source software more willing to contribute to its development without
concern that other users would appropriate the developments and then incorporate them
in proprietary software for which fees were charged. As one GOGO respondent stated:
I am glad that someone is asking the question about lifting the restriction on
copyrighting government employee created software. I’d like to present a different
case why it would be so valuable. I’m a scientist. I want to be able to collaborate
with other scientists in all sectors – commercial, academic, government, NGO
etc. Part of how I collaborate is by developing software that helps us to advance our
science. Typically, I start the project and give away the code. Other people find the
code *almost* does exactly what they want. So, they make a small change or
addition. Often, they want to contribute the change back to the project so that others
can benefit but they find the lack of a copyright a problem. They don’t want to
contribute back without some basic copyright protections. So, they don’t and their
enhancement remains proprietary. I don’t get to benefit and nor does anyone else.
What I’d like to do is make the code available with some well understood but
permissive license – I like the “MIT license” – so other people feel comfortable
collaborating. I benefit because my product has been improved and they benefit
because they get the benefit of all my effort. Being able to license our code using a
permissive Open Source license would actually enhance reuse and collaboration – in
other words enhance its value to the citizens of the United States.
In a related vein, the IP attorney for the software group at a different responding GOGO
facility wrote:
42
This
public
atio
n is
availa
ble
free o
f charg
e fro
m: h
ttps://d
oi.o
rg/1
0.6
02
8/N
IST
.GC
R.2
1-0
28
Two basic benefits [from eliminating the copyright prohibition]. (1) Gov employee
produced software can be licensed to commercialization partners who could then
make improvements to tech data or software and then protect their investment
better. This reduces uncertainty. When certainty as to ability to get RoI increases,
then so does investment. (2) Contractors have been known to take Gov employee
produced designs or software and then make marginal changes then try to sell this
Government employee produced recorded information back to the Gov without
making any real private investment. If the Gov had copyright protection, it could file
a lawsuit against the company and force them to disgorge their unearned profits from
sale of Gov employee produced recorded information.58
Table 25. Average Annual Growth Rate in Revenues for Software Products
GOCO percentiles
Variable n mean Std. Dev. skewness kurtosis 25th 50th 75th 100th
Average Annual Growth Rate 5 1.6 2.30 0.68 1.75 0 0 3 5
GOGO* percentiles
Variable n mean Std. Dev. skewness kurtosis 25th 50th 75th 100th
Average Annual Growth Rate 16 13.1 26.8 2.5 8.2 0 0 15 100
*Includes one respondent reporting on multiple labs/facilities that were predominantly GOGO but included
some GOCO activity.
Source: Authors’ computations from “Software Copyright Impact Survey,” OMB Control No. 0693-0033,
Expiration Date: 07/31/2022
2.7. Predictions of the Effects of Allowing Copyright Protection for Software
Created by GOGO Laboratories and Laboratory Facilities
In this section, we juxtapose the respondents’ forecasts and the simple revenue and cost
models. From the juxtaposition we develop overall predictions about how the
elimination of the software copyright prohibition for GOGO laboratories and facilities
would be expected to affect licensing revenues and costs. From the estimated effects for
the respondents to our survey, we estimate the effects across all Federal agencies by
using information about the proportion of all Federal agency software activity taken by
the respondents.
58 Of course, the observer here is discussing what could be done if copyright protection is allowed. The
observation is about what could happen in the counterfactual scenario that allows copyright of Government
Works software. Government works software cannot be copyrighted, and therefore one would not find
evidence that the government has brought a lawsuit to claim infringement of the copyrights that it does not
possess. However, copyright infringement cases have been prosecuted by GOCO laboratories operating
under the authorities granted to them by the agencies for whom they operate the laboratories. For example,
see, https://www.govinfo.gov/content/pkg/USCOURTS-idd-4_13-cv-00442/pdf/USCOURTS-idd-4_13-cv-
00442-2.pdf. So, perhaps, in the event that the restrictions on Government Works are lifted, more copyright
infringement cases would be prosecuted.
43
This
public
atio
n is
availa
ble
free o
f charg
e fro
m: h
ttps://d
oi.o
rg/1
0.6
02
8/N
IST
.GC
R.2
1-0
28
2.7.1. Prediction of Licensing Revenues for the GOCO and GOGO Laboratories
and Facilities Providing 2020-2024 Forecasts Assuming Copyrights Are
Allowed
From Table 6, for all of the software licensing revenue reported by the survey
respondents over 2015-2019, the annual revenue in constant 2019 U.S. dollars averaged
$82,931 for the 8 GOCO respondents that provided the revenue data. The annual revenue
in 2019 dollars averaged $2,645 for the 28 GOGO respondents and 1 predominantly
GOGO respondent that provided the revenue data. Based on what we have learned from
studying the respondents’ survey responses, how would we expect those licensing
revenues to change over the next five years if the copyright prohibition on copyrights for
software produced by GOGO labs and lab facilities is lifted?
To answer, we combine the respondents’ forecasts for products licensed, release
categories, and growth in revenues per licensed product with our simple estimated model
of licensing revenue. The answer that we find for the forecast for 2020-2024 under the
assumption that the copyright prohibition is lifted is as follows. The average annual
revenue in 2019 dollars for GOCO respondents is forecast to be $201,677. The average
annual revenue in 2019 for the GOGO respondents is forecast to be $135,333. Thus,
compared with the actual annual revenues for 2015-2019, the forecast for the expected
value of annual licensing revenues is 2.43 times as great (an increase of 243%) for
GOCO labs or lab facilities, and it is 51.2 times as great (an increase of 5100%) for
GOGO labs or lab facilities. Table 26 summarizes the forecasts for 2020-2024, including
the confidence intervals for the estimates, and the comparisons with the actual revenues
for 2015-2019.
44
This
public
atio
n is
availa
ble
free o
f charg
e fro
m: h
ttps://d
oi.o
rg/1
0.6
02
8/N
IST
.GC
R.2
1-0
28
Table 26. Average Annual Revenue for Software Products for a GOCO or GOGO
Respondent: Actual versus Forecast in 2019 dollars
GOCO
Variable
Average Annual Revenue 2015-2019
(from Table 6)
$82,931
Average Forecast Annual Revenue 2020-2024
if GOGO copyright prohibition eliminated
n = 5
$201,677
($154,773 to $248,581)
GOGO*
Variable
Average Annual Revenue 2015-2019
(from Table 6)
$2,645
Average Forecast Annual Revenue 2020-2024
if GOGO copyright prohibition eliminated
n = 18
$135,333
($107,500 to $163,166)
Note: In parentheses with each forecast is the 95% confidence interval that uses the standard error of the
forecast for the mean of the forecasts. That larger standard error rather than the standard error of the
prediction (i.e. fitted value) is the appropriate one in the present context. The smaller standard error of the
prediction would show a tighter distribution of the random variable (the prediction for the dependent
variable) that would result if within-sample observations of the explanatory variables were used, while the
larger standard error of the forecast is appropriate since we are using the out-of-sample 2020-2024
projections for the explanatory variables. The standard error of the mean of the forecasts is the square root
of the product of (1) the reciprocal of the square of the number of respondents in the subsample and (2) the
sum, over the respondents in the subsample, of the squared standard errors of the forecast for each
respondent. The 95% confidence interval ranges from two standard errors below the mean to two standard
errors above the mean.
*Includes one respondent reporting on multiple labs/facilities that were predominantly GOGO but included
some GOCO activity.
Source: Authors’ computations from “Software Copyright Impact Survey,” OMB Control No. 0693-0033,
Expiration Date: 07/31/2022
The opportunities would be the same for the GOGOs given that they can copyright their
software, but notice that their average annual revenues are still less than those for
GOCOs. That is because we have the observations that do not anticipate licensing
software, and more generally, the GOGOs anticipate licensing less software than the
GOCOs, as we saw in the overview tables for their forecasts for 2020-2024. That is,
despite the dramatic increase in the mean number of licensed products for the GOGO
respondents, the number is still considerably less than for the GOCO respondents. The
GOGO respondents on average had practically no licensed products for 2015-2019, and
then anticipate the dramatic increase if the copyright prohibition is lifted, but the number
of licensed products anticipated is nonetheless less than what the GOCO respondents
anticipate.
To derive the forecasts in Table 26, we began with the information described in Section
2.6.1 for the respondents’ expectations for the 2020-24 period if the copyright prohibition
for government created software is eliminated. Respondents reported about their
expectations, should copyrights become obtainable, for their software products available,
for products licensed, and for the types of intellectual property protection obtained
45
This
public
atio
n is
availa
ble
free o
f charg
e fro
m: h
ttps://d
oi.o
rg/1
0.6
02
8/N
IST
.GC
R.2
1-0
28
(implicit in the report of software release types). We use those expectations with the
model of licensing revenues, described in Section 2.4.1 and estimated in Appendix C, to
provide the forecasts shown in Table 26 about the likely effects on licensing revenues of
eliminating the copyright prohibition. We turn now to the detailed explanation of the
forecasts.
GOGO respondents especially were understandably cautious about providing their
forecasts for products and IP in the counterfactual situation that copyrights for their
software could be obtained. The result is that some respondents would provide responses
to some questions, but then leave others blank. In some cases, the blanks and the
resulting missing data may be because the respondent considered the answer was implied
by other responses. In other cases, it could simply be that the respondent was uncertain
about what the right answer would be—uncertain about what will happen over the next
five years if the copyright prohibition is lifted. In a few cases, the most accurate
projections, and also the most conservative projections, of what will happen require
filling in a few of the blanks to add a few more observations to be used for the
projections. It is a conservative approach because the observations added result in lower
projections of licensing revenues for the set of respondents, and hence lower expected
revenues when the results are extrapolated to the level of all the software activity for all
Federal agencies. The reason that completing the missing data for a handful of
observations lowers the projections is because on the whole, the additional observations
are cases where absolutely no software is projected to be available for licensing. Using
these observations is not only more conservative, it also allows more accurate
projections. Those respondents anticipating no licensing of software are those where
software production has been for internal use only. It is those respondents who may have
found completing the survey somewhat frustrating, because it was asking for projections
about something that they did not anticipate doing. Some of these respondents completed
all the necessary questions for use in the projections, but some, perhaps in their
frustration with the questions that did not seem pertinent to their circumstances, did not.
To leave them out of the projections would bias the findings toward much higher
licensing revenues that would actually be anticipated.
For the foregoing reasons, we have for the projections filled in a few incomplete
responses. The tables in Section 2.6.1 show the reported numbers, i.e., the forecasts that
the respondents made. For the projections that we make in this section, both to be
conservative and also to be more accurate in our projections, we have “filled in the
blanks” in the following cases.
First, there are two cases where the respondents answered the question about the number
of products expected to be available for 2020-2024, but then did not complete the
question about the distribution of software products across the software release
categories. For our projection model for revenues, we do not need all of the information
about the categories, but simply need to know about whether there will be IP protection.
For these two cases, it was possible to use the two respondents’ answers to the two
multipart questions about intellectual property and about release categories during 2015-

46
This
public
atio
n is
availa
ble
free o
f charg
e fro
m: h
ttps://d
oi.o
rg/1
0.6
02
8/N
IST
.GC
R.2
1-0
28
2019, as well as the collection of their other responses, to ascertain the appropriate setting
for the variable IPprotected during the period 2020-2024.
Second, for one case, a respondent provided the forecast of the number of products
expected to be available over 2020-2024 assuming the elimination of the copyright
prohibition, but then left blank the forecast of the number of products that would be
licensed. In the context of all of the respondent’s answers, it appeared that there would
be licensed products, but the number was not forecast. For this one respondent, for the
observation to use in our projection, we filled in the missing expected number of licensed
products with the respondent’s reported number of products available for licensing
multiplied by the proportion—on average in the sample of reported 2020-2024
forecasts—of licensed products to available products.
Third, for two cases where the respondents had reported zero products available and also
zero products licensed and also, consistently, no intellectual property for 2015-2019, the
respondents completed the 2020-2024 forecast for product release types with all zeros,
again indicating no intellectual property. However, they left blank the forecasts for
products available and products licensed. The zeros for the release categories and the full
context of all of their responses for 2020-2024 make it clear that for these two
respondents again there would be no products available for licensing and no products
licensed. These are cases where the respondents do a lot of software work for their
organizations’ internal use, but they have not, and do not anticipate, products to license.
As explained above, the conservative and also more accurate approach is to fill in the
missing data for the 2020-2024 forecast and enter 0 for products available and for
products licensed for these two observations.
With the set of forecasts in hand, we turn now to the predictions. We provide predictions
for the GOCO respondents, and for the GOGO respondents. The predictions can then be
compared with the actual licensing revenues during 2015-2019.
First, we use the simple estimated model—specification (2) of Table C.1—of revenues
for GOCO respondents; the model is estimated for the actual 2015-2019 experience, with
revenue in 2019 dollars as a function of the number of software products licensed and the
dummy variable to indicate IP protection. Then we use the estimated model to predict
the average annual licensing revenues for the next five years, 2020-2024, assuming that
the copyright prohibition for GOGO software is eliminated. With the discussion, in
Section 2.4.1 and Appendix C, of the revenue models estimated in Tables C.1, C2, and
C3 of Appendix C, we concluded that if copyright protection is allowed, the potential
revenues for the GOGO operations can be predicted with the estimated GOCO model
since the difference in the functions estimated for the 2015-2019 period is because of the
availability of copyright protection for the GOCOs and the lack of it for the GOGOs, and
because of good fortune in the distribution of types of IP protection in the two samples.
To make the predictions for the GOCO respondents, we use the estimated model with the
projected values for the explanatory variables provided by the GOCO respondents. To
make the predictions for the GOGO respondents, we use the estimated model with the
47
This
public
atio
n is
availa
ble
free o
f charg
e fro
m: h
ttps://d
oi.o
rg/1
0.6
02
8/N
IST
.GC
R.2
1-0
28
explanatory variables’ projected values provided by those respondents. There are two
reasons that the average projected annual revenues for 2020-2024 shown in Table 26 are
lower for the GOGO respondents than for the GOCO respondents. First, we know that
some GOGO respondents will choose not to make products available for licensing, and
that will result in lower projected 2020-2024 annual revenues on average for the GOGO
respondents. Some GOGO respondents not offering products for licensing will plan to
offer products for download without a license and without any charge for their use. The
second reason that the average of the projected 2020-2024 annual revenues for the
GOGO respondents is less than for the GOCO respondents is that, although on average
the numbers of licensed products for GOGO respondents are expected to increase
dramatically, the mean annual average number of products licensed for the GOGO
respondents is, despite the large percentage increase, still considerably less than the
number for the GOCO respondents.
For both samples, in addition to the predicted value for annual licensing revenue for each
respondent, we calculated the standard error of the forecast for each respondent. We then
multiplied the predicted value for annual revenue in 2020-2024 (as predicted based on the
2015-2019 experience for the relationship between revenue and the number of products)
for each respondent by the sum of 1 and the respondent’s projected growth rate (as a
proportion) in the revenue per software product for 2020-2024 as compared with 2015-
2019. The standard error of the forecast for each respondent is also multiplied by the
sum of 1 and the projected growth rate.59 For the GOCO and the GOGO samples, we
then compute the average of the respondents’ predicted annual licensing revenues and
also the standard error of the forecast for that average.
It is important to emphasize that the predicted licensing revenues are at best rough
projections of what might happen in the counterfactual situation where copyrighting
Government Works software is allowed. In projecting the revenues for the counterfactual
situation, we are careful to include GOGO respondents who do not anticipate
copyrighting and licensing products even if allowed to do so. Hence, for such
respondents, the predictions provide good estimates of actual revenues in the
counterfactual situation, but underestimate potential revenues should the GOGO
respondents take advantage of copyright to realize revenues to the extent that GOCO
respondents do. Potential revenues for such respondents are underestimated because they
choose not to copyright and offer licensed products and collect revenues, and the
projections reflect that. On the other hand, the projection of the revenues is indeed a
projection of potential revenues rather than actual revenues for those GOGO respondents
who report that they will copyright and license software projects. For such respondents
59 The forecast using the model estimated for 2015-2019 is a random variable; denote it as x. Its standard
error is the estimate of that random variable’s standard deviation, and that standard deviation is the square
root of the variance of the random variable. The forecast for the 2020-2024 period is ax, where a = 1 + the
projected growth rate. With E denoting the mathematical expectation operator, the variance of ax is:
E(ax – E(ax))2 = E(a(x – E(x)))2 = E(a2 (x – E(x))2) = a2E(x – E(x))2 = a2Var(x).
Thus, the standard deviation of the forecast for 2020-2024 is the square root of a2Var(x), alternatively
denoted a2σ2, and so the standard deviation is aσ. Thus, the standard error for the forecast for the 2020-
2024 period, which is the estimate of the standard deviation for the forecast for the 2020-2024 period, is the
product of the standard error of x multiplied by 1 plus the projected growth rate.

48
This
public
atio
n is
availa
ble
free o
f charg
e fro
m: h
ttps://d
oi.o
rg/1
0.6
02
8/N
IST
.GC
R.2
1-0
28
the projection is of their potential revenues because the forecasting equation assumes that
they will take advantage of the revenue-generating opportunities to the same extent as the
GOCO respondents do. In fact, many may choose not to take similar advantage to
generate licensing revenue from an ability to copyright the software. In that sense, the
forecasted revenues will be potential revenues, and the actual revenues received are
expected to be even less than what is forecast. So, to summarize, the projection of the
expected licensing revenues of the GOGO respondents in the counterfactual situation
where they can copyright their software is a very rough estimate. Nonetheless, it is a
rough estimate well worth making and describing in order to develop some initial
understanding about what might happen if copyright is allowed for Government Works
software. Moreover, the understanding developed makes clear that the forecasted
licensing revenues greatly understate the value of the licensed software to those who use
it.
2.7.2. Projected Costs Associated with the Projected Revenues
In Section 2.5.1, in column (1) of Table 11, we show the results for estimating a very
simple cost function for the production of software products available for licensing or
download. In Table 11, annual costs in constant 2019 dollars are estimated as a function
of the respondent’s total software products available and the average lines of code for its
typical software product. As shown in Table 11, neither the type of laboratory or facility
(GOCO or GOGO) nor the qualitative variable for intellectual property added
significantly to the simple model. We use the simple model to predict for 2020-2024 the
annual software costs corresponding the predicted annual revenues (shown in Table 26)
assuming elimination of the copyright prohibition.
Table 27 shows the projected average annual costs for the software products made
available for licensing or download by the government laboratories and facilities. The
cost projections in Table 27 correspond to the revenue projections shown in Table 26.
The number of software products and the lines of code for the typical product are the
explanatory variables, and the expectations for those variables during 2020-2024 are used
with the estimated equation shown in column (1) of Table 11 to predict each respondent’s
average annual costs for software products available for licensing or download. Each
respondent provided an estimate of the number of software products it would have
available in 2020-2024 if the copyright prohibition is lifted. Also provided is an estimate
of the size (in terms of lines of code) of its typical software product for 2015-2019, and
also provided is the expected growth from 2015-2019 to 2020-2024 in the size of the
typical software product. As with the revenue projections, for a few cases appropriate
substitutions for missing data were made in the interest of both being conservative and
being accurate as explained in the discussion of the revenue projections.
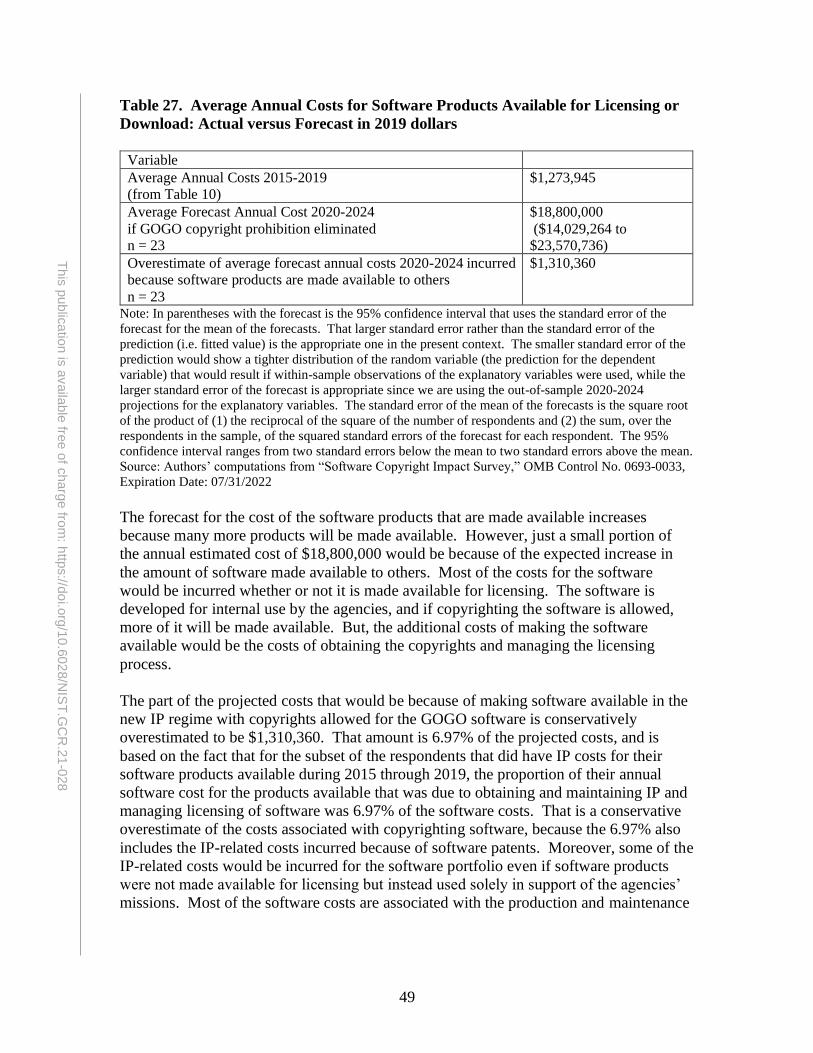
49
This
public
atio
n is
availa
ble
free o
f charg
e fro
m: h
ttps://d
oi.o
rg/1
0.6
02
8/N
IST
.GC
R.2
1-0
28
Table 27. Average Annual Costs for Software Products Available for Licensing or
Download: Actual versus Forecast in 2019 dollars
Variable
Average Annual Costs 2015-2019
(from Table 10)
$1,273,945
Average Forecast Annual Cost 2020-2024
if GOGO copyright prohibition eliminated
n = 23
$18,800,000
($14,029,264 to
$23,570,736)
Overestimate of average forecast annual costs 2020-2024 incurred
because software products are made available to others
n = 23
$1,310,360
Note: In parentheses with the forecast is the 95% confidence interval that uses the standard error of the
forecast for the mean of the forecasts. That larger standard error rather than the standard error of the
prediction (i.e. fitted value) is the appropriate one in the present context. The smaller standard error of the
prediction would show a tighter distribution of the random variable (the prediction for the dependent
variable) that would result if within-sample observations of the explanatory variables were used, while the
larger standard error of the forecast is appropriate since we are using the out-of-sample 2020-2024
projections for the explanatory variables. The standard error of the mean of the forecasts is the square root
of the product of (1) the reciprocal of the square of the number of respondents and (2) the sum, over the
respondents in the sample, of the squared standard errors of the forecast for each respondent. The 95%
confidence interval ranges from two standard errors below the mean to two standard errors above the mean.
Source: Authors’ computations from “Software Copyright Impact Survey,” OMB Control No. 0693-0033,
Expiration Date: 07/31/2022
The forecast for the cost of the software products that are made available increases
because many more products will be made available. However, just a small portion of
the annual estimated cost of $18,800,000 would be because of the expected increase in
the amount of software made available to others. Most of the costs for the software
would be incurred whether or not it is made available for licensing. The software is
developed for internal use by the agencies, and if copyrighting the software is allowed,
more of it will be made available. But, the additional costs of making the software
available would be the costs of obtaining the copyrights and managing the licensing
process.
The part of the projected costs that would be because of making software available in the
new IP regime with copyrights allowed for the GOGO software is conservatively
overestimated to be $1,310,360. That amount is 6.97% of the projected costs, and is
based on the fact that for the subset of the respondents that did have IP costs for their
software products available during 2015 through 2019, the proportion of their annual
software cost for the products available that was due to obtaining and maintaining IP and
managing licensing of software was 6.97% of the software costs. That is a conservative
overestimate of the costs associated with copyrighting software, because the 6.97% also
includes the IP-related costs incurred because of software patents. Moreover, some of the
IP-related costs would be incurred for the software portfolio even if software products
were not made available for licensing but instead used solely in support of the agencies’
missions. Most of the software costs are associated with the production and maintenance

50
This
public
atio
n is
availa
ble
free o
f charg
e fro
m: h
ttps://d
oi.o
rg/1
0.6
02
8/N
IST
.GC
R.2
1-0
28
of the software, and those costs are incurred whether or not the software is copyrighted
and licensed.60
2.7.3. Comparison of Projected Costs and Projected Revenues.
Producing software products is expensive, but to understand the costs of making software
available for licensing or for download without a license one cannot simply compare the
revenue projections in Table 26 with the full costs shown in Table 27 for the software.
That is not the appropriate comparison because the costs of producing the products are
primarily the production and maintenance costs for the software, and those costs are
incurred primarily to have the products to use in accomplishing the agencies’ missions,
not to have the products available for licensing. Annual costs for the products are
justified by the need for the products to accomplish the agencies’ missions, and of course
those costs will be considerably more than any annual licensing revenues from making
the software that is produced for the agencies’ internal needs also available to others who
might find it useful.
Moreover, if one wanted to compare revenues with production costs, the reported costs
for software development should be capitalized over the useful lifetime of the software.
The useful commercial lifetime for the software developed in the labs of the Federal
agencies can reasonably be estimated to be 10 years.61 For purposes of comparison with
the annual revenues, the software development costs, the first of our six cost items that
are summed to have the annual software costs, would then be capitalized over a 10-year
lifetime of the software. The average annual software costs during the period 2015-2019,
i.e., the average for the 16 respondents for cost_19, equals $1,273,945, and the proportion
60 Recall cost_19 was computed based on the number of software products available for licensing or
download without a license and equals the sum of each respondent’s 2015-2019 annual averages for the
cost of (1) software development, (2) supporting software to maintain developed software, (3)
administrative support for managing developed software, (4) licensing administration, (5) annuity fees for
software patents, and (6) external legal support expenses for IP protection and licensing for the software
portfolio. The IP costs are the sum of items (4), (5), and (6). Conservatively, for the proportion of the
projected costs using the model of cost_19 (but evaluated at the new values for the explanatory variables
that the respondents forecast for 2020-2014 given that copyright of GOGO software is allowed) that is due
to the IP costs, we use the proportion of IP costs in total software costs during the 2015-2019 period for
those respondents that reported IP costs. The reported IP costs are observed for respondents with different
sizes for their IP-protected software portfolios, and the sum of their IP costs divided by the sum of their
software costs provides the benchmark for the proportion of software costs taken by IP costs. Thus, 6.97%
is the cost-weighted average of the IP cost as a proportion of total software costs for the respondents that
had IP costs. That follows because ∑ (𝑠𝑖 𝑡𝑖⁄𝑖 )(𝑡𝑖 ∑ 𝑡𝑖𝑖⁄ ) = ∑ 𝑠𝑖𝑖 ∑ 𝑡𝑖𝑖⁄ , where si is the ith respondent’s sum
of the IP costs—cost items (4), (5), and (6)—and ti is the ith respondent’s sum of all costs—cost items (1)
through (6). 61 “Studies have shown the average software program lifespan over the last 20 years to be around 6-8
years. Longevity increases somewhat for larger programs, so that for extremely large complex programs
(i.e., over a million Lines of Code – LOC) the average climbs as high as 12-14 years. This increased
longevity for large programs is related directly to the huge cost and inconvenience to an organization of
replacing them. Nonetheless, 12-14 years is not very long when one considers the risk and the investment
of time and money required to develop and maintain a 1M+ LOC program. Over the lifetime, such
programs can easily cost $10’s or $100’s of millions.” Mitopia Technologies, Inc.,
https://mitosystems.com/software-evolution/, accessed August 29, 2020.
51
This
public
atio
n is
availa
ble
free o
f charg
e fro
m: h
ttps://d
oi.o
rg/1
0.6
02
8/N
IST
.GC
R.2
1-0
28
of the annual software costs that is due to the software development costs is 0.8812 or
88.12%. Thus, the amount of the software development costs is $1,122,563.
Capitalizing (at the OMB mandated 7% annual rate of return for Federal investment
projects) the development costs over a 10-year useful life for the software yields the
annual production costs of $159,853.62 Thus, for comparison with the annual licensing
revenues, we have annual costs of $159,853 + ($1,273,945 - $1,122,563) = $311,235.
However, the annual production costs and also the annual software maintenance costs (so
our cost items (1), (2), and (3)) would be incurred whether or not the software is made
available for licensing, because it is developed for an agency’s internal use. The portion
of the annual 2015-2019 software costs that is incurred because the software has IP
protection and is made available to others is a subset of $88,794 = 0.0697 x $1,273,945.
Similarly, for a comparison to the projected 2020-2024 licensing revenues, the relevant
2020-2024 annual costs are not the $18,800,000 in annual costs as computed with the
sum of all the cost items, and moreover they are not the costs using the capitalized annual
production costs, but instead they are just a subset of the annual costs of obtaining and
managing the intellectual property, i.e., the sum of cost items (4), (5), and (6), and that
sum is 1,310,360.
Thus, a simple comparison of the annual licensing revenues with the reported annual the
software costs is misleading for three reasons. First, the licensing revenues will
understate the commercial value to the users of the software that the agencies make
available for licensing or download. As we have seen, much of the software is made
available without charge, and many respondents’ say that freely available software will
continue to be the rule even if copyright is allowed. The copyright protection would, as
respondents have reported, allow more software to be used and to be used more
effectively, but much software will still be available without charge. Second, the
software development costs should be capitalized over the useful lifetime of the software.
Third, the software is certainly costly to produce, but it is produced for the agencies’
internal use in accomplishing their primary missions. That value from the software is not
reflected in the licensing revenues at all. The software produced is used by the agencies
to accomplish their primary missions, and the costs are incurred to support that use.
Then, essentially the same software can be made available for others to use, and the
additional costs of making it available would be relatively small and not the full costs the
agencies incur in producing the software for internal use. As reported just above, the
additional costs of making the software available are conservatively estimated to be less
than 6.97% of the full costs for the software.
Thus, for the sample of 23 respondents, from Table 26, the projected average annual
licensing revenue is $201,677 for the 5 GOCO respondents, and it is $135,333 for the 18
GOGO respondents. The projected average annual cost (n = 23) that is incurred because
of making licensing their software products available—that is, the cost that would not be
62 $1,122,563 = $159,853 x (1/(1.07)1 + 1/(1.07)2 + 1/(1.07)3 + 1/(1.07)4 + 1/(1.07)5 + 1/(1.07)6 + 1/(1.07)7
+ 1/(1.07)8 + 1/(1.07)9 + 1/(1.07)10). For the 7% discount rate, see U.S. Office of Management and Budget
(OMB), Circular number A-94, Guidelines and Discount Rates for Benefit-cost Analysis of Federal
Programs (Washington D.C.: Government Printing Office, 1992).
52
This
public
atio
n is
availa
ble
free o
f charg
e fro
m: h
ttps://d
oi.o
rg/1
0.6
02
8/N
IST
.GC
R.2
1-0
28
incurred if the costs of managing licensing were avoided—is an amount less than
$1,310,360.
Comparing the simple model for costs in Table 11 and the simple model for revenues in
specification (2) of Table C.1 of Appendix C, based on the average experience of GOCO
respondents for 2015-2019, we estimate just below that the average revenue of a
copyrighted software product is $5,908 while the average cost of that product is $297,487
(and capitalizing the development costs over the product’s useful commercial lifetime
reduces that amount considerably as we have illustrated). However, just 6.97% of those
costs, or $20,735, is the rough overestimate of the part of the costs that would not have
been incurred if the product was not copyrighted and licensed. The gap between a
product’s average cost and its licensing revenue is not surprising at all, given that the
software is produced for use by the laboratory or laboratory facility and then made
available, often free of any charge, for others who find it useful for their own work. The
software is not developed solely or even at all for its ability to generate licensing
revenues. Recall the comments from respondents that were discussed with the forecast
growth rates shown in Table 25—in particular, “Don't intend to charge for software as
this is counterproductive to getting people to use it.” Nonetheless, the value of
distributing such software, making it available for licensing or download without a
license, is potentially quite large, outweighing the costs of producing it, because of the
economy-wide impact that distributing the software has, and we return to an estimation of
that impact in Section 2.8. Here we shall explain the estimated gap between licensing
revenues and the costs for producing the software products.
To understand the estimated gap, begin with specification (2) of Table C.1 in Appendix
C, where using the estimated coefficients, annual licensing revenue is estimated to be
$164, plus $2,565 multiplied by the number of licensed products, plus $70,042 if the
respondent has IP protection for its software. From Table 2, during 2015-2019, average
annual number of licensed products is 21 for the respondents who are able to copyright
their software, i.e., the GOCO respondents. Also, from Table 2, 57% of the GOCO
respondents had IP protection for their software. Using the estimated licensing revenue
model, the expected value of the annual revenue from a copyrighted software product
(the average revenue for copyrighted software products), using the mean number of
products for the sample, is estimated to be $5,908 = (164 + 70042 + 2565 x 21)/21. The
average cost of such a product is much more as we now describe, but over 90% of the
costs for the product are in their entirety incurred not to make it available for licensing,
but instead for the agencies’ internal uses of the software to support their primary
missions. Moreover, much of the remaining costs would be incurred for IP-related costs
of the software portfolio even if there were no licensing and the software was used solely
in support of the agencies’ missions.
From Table 11, the annual cost for software products is estimated to be $256,976
multiplied by total products available, plus 18.98 multiplied by the size of the typical
software product in terms of lines of code. For the sample of respondents, from Table 10,
the average size is 44,822 lines of code. Thus, while the annual revenue from a
copyrighted product is estimated to be $5,908, the annual average cost for the product is

53
This
public
atio
n is
availa
ble
free o
f charg
e fro
m: h
ttps://d
oi.o
rg/1
0.6
02
8/N
IST
.GC
R.2
1-0
28
estimated to be $297,487 = ((256976 x 21) + (18.98 x 44822)) / 21. With the costs of
skilled software engineers who develop the product, the maintenance and support costs
for the software, and the costs of the obtaining and maintaining IP protection, the
estimated cost should not be surprising. Moreover, 93% of the cost is in its entirety
incurred not to provide IP protection for the product and make it available for licensing,
but to have the product to support the agencies’ primary missions. The part of the
average cost incurred to make an IP-protected product available for licensing is estimated
to be less than $20,735.63 Because that figure includes the costs of patenting software as
well as the costs of copyrights, and because some IP-related costs for the software
portfolio would be incurred to support the agencies’ missions even if there were no
licensed software, it is a conservative overestimate of the expected impact on the average
cost of a copyrighted software product that is made available to others. Thus, the
estimate of about $21,000 is an overestimate of the part of the costs for the software
product that would not have been incurred if the product was not copyrighted and made
available, and there is not enough information to make a more refined estimate.64, 65
The foregoing estimates—for the expected annual revenues of $5,908 for a licensed
software product and for expected annual copyright-and-licensing costs of less than
$20,735—are derived from our forecasting models of licensing revenues and costs. The
estimates provide a reliable summary of the information about revenues and costs
because they are based in the respondents’ observed 2015-2019 experience, and because
they are evaluated at the means for the explanatory variables. In contrast, the comparison
of Table 26 and Table 27 is for the counterfactual scenario, with the estimates derived by
using the estimated equations for revenues (specification (2) of Table C.1 in Appendix C)
and costs (Table 11) that were based on the 2015-2019 experience, but evaluated using
the respondents’ projections for numbers of products and their typical size during 2020-
2024 assuming copyright is allowed. It is very important to note that those projections
for the annual numbers of products are in some cases two orders of magnitude higher (for
example, 500 rather than 5) than what actually occurred during 2015-2019. The result is
63 To have a good estimate of the revenue per product, we evaluate the simple revenue function at the mean
number of licensed products in the sample used to estimate the function. We have used that same number
of products in the cost function in order to have an estimate of the corresponding cost per product.
However, observe that if we instead estimated the cost per product at the mean (or equivalently the median
as seen in Table 10) for the number of products in the sample used to estimate the cost function, and (for
consistency since the mean and the median are the same, but the lines-of-code variable is highly skewed)
use the median of the lines of code, the cost per product is essentially the same. Namely, $290,903 =
((256976 x 2) + (18.98 x 3575)) / 2. Then the overestimate of the part of the costs that is due to making
copyrighted products available to others would be 6.97% of $290,903, or $20,276, as compared with
$20,735. 64 Asking directly for such detail in the information gathered in the survey would of course not have
worked. The level of detail as it is created challenges for the respondents. However, knowing that, the
survey and the research design were planned to allow separating the costs that could be avoided if software
products were not copyrighted and licensed. The original plan was to estimate a detailed cost function that
broke out the marginal impacts on costs of copyrighted versus patented software conditional on whether the
software was licensed or not. That plan could not be executed given the limited number of GOCO
laboratories and facilities responding to the survey with complete responses. 65 For strategic reasons, the agencies might want to copyright software even if they did not plan to license
it. For example, with the copyright, the agency would avoid the risk that a vendor would want to charge
the agency for essentially the same software that the agency’s labs or facilities had created.
54
This
public
atio
n is
availa
ble
free o
f charg
e fro
m: h
ttps://d
oi.o
rg/1
0.6
02
8/N
IST
.GC
R.2
1-0
28
that our estimated equations based on the 2015-2019 experience may not be good
predictors of what will happen to revenues and costs in the counterfactual circumstances
for 2020-2024. There is good reason to think that both the projection of revenues and the
projection of costs are too conservative—i.e., the projected revenues are too low and the
projected costs are too high.
The revenue projections are conservative because the effect of IP protection had to be
estimated as a shift in the function. The alternative to estimating the shift in the revenue
function if the respondent has IP protection for its software is to estimate different slope
effects for software with IP protection as well as the shift effect. There is not enough
data to estimate that model—or, stated differently, if one tries to estimate it with the
limited amount of data available, one gets the same result as what we find in the model of
specification (2) of Table C.1 in Appendix C, both in the size and significance of the two
explanatory variables for the number of products and the IP protection shift effect, and
then additionally the slope effect of IP is wholly insignificant both in absolute size and in
statistical significance.66 Thus, with the revenue model estimated (and even the one with
the insignificant IP slope effect estimated), if the number of products jumps dramatically,
as is the case for the forecast if copyrights are allowed for the GOGO respondents, then
the estimated effect for the IP protection that was made with the experience during 2015-
2019 is diluted—as the number of products increases, the estimated $70,000 effect of IP
protection is divided over far more products. As just discussed, in the estimating sample,
the sample average number of products is 21, but the sample average number in the
counterfactual forecasts is much greater (67 for GOCO respondents and 34 for GOGO
respondents, with several respondents anticipating numbers of licensed products much
higher than those averages) as shown in Table 19. However, the limitation in the
functional form because the data were insufficient to estimate a slope effect as well as a
shift effect for IP will not be an important limitation for most of the GOGO respondents.
For all but a few GOGO respondents, the functional-form limitation is not an important
one because even in the counterfactual situation the numbers of licensed products that
they forecast are less than the mean number of licensed products for the GOCO
respondents in the sample used to estimate the forecasting equation.
Turning to the cost forecasts, the costs that are forecasted using the model estimated with
the experience in 2015-2019 may be too high because, with the dramatic anticipated jump
in licensed products for 2020-2024, there may be pronounced economies of scale that
would not appear in the cost equation estimated for the experience in 2015-2019.
Moreover, the forecasted costs are for products that will primarily be used to support the
agencies’ primary missions, and so they are not intended to be weighed against the
licensing revenues generated when the products are made available for use by others.
66 For additional discussion of difficulties posed by limited information, see Section 1.4 about the
constraints on gathering detailed information in general, Section 2.4.1 about the restrictions imposed on the
revenue function because of the distribution of IP within the GOCO and the GOGO samples, and Section
2.5.1 about the restrictions imposed on the cost function because of the limited number of GOCO
respondents who provided complete data.

55
This
public
atio
n is
availa
ble
free o
f charg
e fro
m: h
ttps://d
oi.o
rg/1
0.6
02
8/N
IST
.GC
R.2
1-0
28
In sum, because of the expected dramatic increase in the numbers of products to be made
available, the projected revenues may be too low and the projected costs may be too high.
After projecting the software effects from our sample to the entire group of Federal
agencies, we return to the potential economy-wide benefits—benefits that far exceed
those captured by licensing revenues—that would be generated by the greater availability
of the software if the copyright prohibition is eliminated.
2.7.4. Projection of Effects on the Software Activity of All Federal Agencies
Recall that we estimated expected annual revenue from a copyrighted software product,
using the mean number of products for the sample of respondents, to be $5,908, and the
expected part of average cost that is incurred to copyright the product and make it
available for licensing is, as explained above, overestimated to be something less than
$20,735, again at the average values of the explanatory variables for the sample of
respondents. However, for our projections of revenues and costs, we begin with the
predicted revenues and predicted costs for the individual respondents. That is because
the values of the explanatory values for the respondents are not at the means – some
respondents will have more products available, others less, and some will have larger
products as measured by lines of code, while others have smaller products. Thus, the
values for revenues and costs that are projected to the Federal agency level will depend
on the actual distribution across respondents of their forecasts for the number of products,
growth rates in revenue for the typical product, size of the products, and growth rates in
the size of the products, as well as on the proportions of their parent agencies taken by the
respondents.
Table 26 shows the average annual software licensing revenues that are forecasted for
2020-2024 for 23 respondents to the Software Copyright Impact Survey. From the
averages reported in Table 26, the sum of the forecasted annual licensing revenues for the
23 respondents is $3,444,379.67
Because we have cast a wide net, looking into the agencies to find places where the
agencies may be creating software products that could be made available to others, we
use information about the IT employment for the laboratories or facilities of the
respondents and about the IT employment of their parent agencies to extrapolate from the
respondents’ activities to the activities of the agencies. To extrapolate the forecasts to the
parent agencies of the 23 respondents, we use the detailed employment information that
is provided by the U.S. Office of Personnel Management (OPM) in its FedScope data.68
The data provide the employment of various types for each Federal agency and its
component organizations. To get what will be a very rough estimate of the portion of its
parent agency’s software work that is taken by the laboratory or laboratory facility (or
laboratories or laboratory facilities) for which a respondent reports, we use FedScope’s
reported number of IT management employees for each agency as whole and for the
organizations within it.
67 $3,444,379 = $201,677x5 + $135,333x18. 68 https://www.fedscope.opm.gov

56
This
public
atio
n is
availa
ble
free o
f charg
e fro
m: h
ttps://d
oi.o
rg/1
0.6
02
8/N
IST
.GC
R.2
1-0
28
From the FedScope menu, we selected “STEM and Health Occupations,” then “STEM
Occupations,” then “Technology Occupations,” and then “Information Technology
Management.”69 So for example, if a respondent from NASA reports for the Ames
Research Center, from FedScope we have that the number of “IT management”
employees for NASA is 476, and that the number is 41 for the Ames Research Center.
Thus, the rough estimate of the proportion of NASA’s software activity that is done by
the Ames Research Center would be 0.086 or 8.6%. For another example, if a DoD
respondent reported on the software activity for Defense Microelectronics Activity, in
FedScope we find Defense Microelectronics Activity as a part of the Department of
Defense activity not separately provided under Department of the Air Force, Department
of the Army, and the Department of the Navy. The “IT management” employment for the
most current quarter is 7411 for the Department of Defense not including the Air Force,
the Army, or the Navy. The “IT management” employment for Defense Microelectronics
Activity is 23. So, the estimate of the proportion of the total DoD IT activity (apart from
the activity in the Air Force, Army, and Navy) is 23/7411 = 0.0031 or .31%.
In most cases, we have multiple respondents within a single agency. For example,
among the 23 respondents used for Table 26, there are multiple respondents from two of
the armed forces departments that are listed separately in OPM’s FedScope data. Also,
there are multiple respondents from DOC, DOE, DOT, and HHS. In these cases of
multiple respondents for an agency, for many cases each respondent represented a
different organizational part of the parent agency. In these cases, where we have multiple
respondents from a parent agency, for a set of multiple respondents with the same parent
agency, we add their shares of the parent’s IT employment to have an estimate of their
collective share of the parent agency’s software activity. For such a set of multiple
respondents, we also sum their forecasted licensing revenues to have the forecasted
revenues for the set. Then to estimate the parent agency’s forecasted licensing revenues,
we divide the sum of the forecasted licensing revenues for the respondents that belong to
the parent by the sum of their shares of the parent’s IT employment.
When the FedScope data do not break down an agency’s component organizations in
sufficient detail to find the IT employees for a respondent’s organization, we use the
information for the subset of the agency containing the respondent’s organization. For
example, the total IT employment as reported by FedScope for HHS as a whole is 3249.
For NIH within HHS, the reported IT employment is 718, and for FDA within HHS the
reported IT employment 470. A single respondent from a part of NIH, absent additional
information would conservatively be assigned the overestimated proportion 0.221, but
multiple respondents reporting on different parts of NIH within HHS would together, as
the sum of their shares of HHS software activity, be assigned the proportion 0.221 or
69 https://www.fedscope.opm.gov/ibmcognos/bi/v1/disp?b_action=powerPlayService&m_encoding=UTF-
8&BZ=1AAABpu3eKwh42o1OwW6CQBD9mR3Ug2Z2EAsHDiwLkYOgwqWnhuJqmsJiFjz4983Cwfb
W9zKZycx7L_OUxaasinOSyXAYe6MyuQSiL19yLgN3J4X~thXoCY8LN8DAE37i7tItEK0c602ic7w~Rt
U_BEqbXo9Kj0DptW8vyoAnYIu67hS4cnGsm_~6poaPpLu3~bNTelyAJ4HS_3z5K3_pgLAySl_AcPmuar
Me_7XtK2t3ZBlv4iLPk7jKijyPDkn4D6sjTuEVkXFE5BwZY8g8ZITMkrHopnTzBEIga47aFjA49INNjB~
GzNmnR21GZQADBuQDuQikONAnUDAv_GvBJgC5Vv4LfOI0zQ9NNb8x4wcrtG_w

57
This
public
atio
n is
availa
ble
free o
f charg
e fro
m: h
ttps://d
oi.o
rg/1
0.6
02
8/N
IST
.GC
R.2
1-0
28
22.1%. A respondent reporting on FDA’s software activity would be assigned the
proportion of 0.145 or 14.5%. The result is a very conservative extrapolation. The
predicted amount of licensing revenues for the parent agency will often be too small
because the proportion used to extrapolate the respondents’ forecasted revenues is too
large.
In some cases, Internet search uncovered information that allowed refining the estimated
proportion used to extrapolate a respondent’s forecast. So for example, a respondent was
a part of the Air Force’s Material Command. The Air Force’s total IT management
employment reported in FedScope is 8453, and its Material Command has IT
management employment reported as 1847 by FedScope. Internet information about the
respondent showed that it was one of six specialized centers assigned to the Material
Command, and for a rough approximation its IT employment is estimated as a sixth of
the IT employment for the Material Command. In the case of another respondent that
was just a part of one of the parent agency’s organizations identified in FedScope,
Internet search revealed the particular software group exactly as named by the
respondent, and the information for its IT employment was thereby found and could be
used instead of the IT employment of the organization, identified in FedScope, of which
it was a part.
Given the 23 respondents for which forecasts could be estimated, the foregoing
extrapolation process provided very rough forecasts for the annual 2020-2024 licensing
revenues for HHS, DOT, VA, NASA, DOC, DOE, DoD apart from the branches of the
armed forces separately reported by FedScope, Department of the Air Force, Department
of the Navy, and GSA. The sum of these agency-wide forecasts totals $44,238,828,
extrapolated from the forecasts for the 23 individual respondents for which the sum of the
forecast annual licensing revenues was $3,444,379 as reported in Table 26.
From FedScope, the IT employment in the agencies represented by the 23 respondents
takes 51.4% of the total IT employment for all Federal agencies.70 Thus, if the software
copyright prohibition is eliminated, the forecast of the annual 2020-2024 licensing
revenues for all Federal agencies is $86,067,759 = $44,238,828/0.514. Table 28 shows
the overall forecast for annual licensing revenues for the 23 respondents in Table 26, for
their parent agencies, and finally for all Federal agencies.
70 From FedScope, the sum of the IT employment for the agencies represented by the 23 respondents is
43,776. The sum of IT employment for all Federal agencies (summing over the FedScope reports for the
cabinet level agencies, the large independent agencies, the medium independent agencies, and the small
independent agencies) is 85,167. So, the Federal agencies in our sample of respondents take the proportion
0.514 = 43776/85167 of the IT employment at all Federal agencies.

58
This
public
atio
n is
availa
ble
free o
f charg
e fro
m: h
ttps://d
oi.o
rg/1
0.6
02
8/N
IST
.GC
R.2
1-0
28
Table 28. Forecast Annual Licensing Revenues in 2019 dollars for Software
Products Available for Licensing or Download in 2020-2024 if the Copyright
Prohibition is Eliminated
Group for the Forecast Forecast of Annual
Licensing Revenues
For 23 Respondents
(from Table 26) $3,444,379
For the Parent Agencies
of the 23 Respondents $44,238,828
For All Federal Agencies $86,067,759
Source: Authors’ computations from “Software Copyright Impact Survey,” OMB Control No. 0693-0033,
Expiration Date: 07/31/2022
Summarizing, across all Federal agencies, if copyrights are allowed for GOGO software,
the software made available over the next five years is expected to generate $86 million
in annual licensing revenues, a pronounced increase over the annual licensing revenues
generated over the preceding five years. The pronounced increase that is projected is
largely driven by the expected increase in the GOGO licensing revenues. From Table 26,
the average annual software licensing revenues for the GOGO respondents are expected
to increase by 51 times or 5100%, while the average for the GOCO respondents is
expected to increase by 2.43 times or 243%.71 Moreover, because (1) the software is
developed for the agencies’ internal use in support of their missions, and (2) the costs are
largely incurred in the production and maintenance of the software, the costs of the
software would largely be incurred whether or not the software is made available for
others to use. As discussed earlier, the additional costs of obtaining and maintaining
copyrights is expected, (conservatively overestimated because all IP-related costs are
included, and because IP-costs for the software portfolio will be incurred even if the
software is used exclusively to support agencies’ missions and there is no licensed
software) to be less than about 6.97% of the total costs of the software. Most importantly
from an evaluation perspective, the $86 million from making the software available for
others to use is only a small part of the economy-wide value that is created for users
outside the agencies. The next subsection provides an estimate of that economy-wide
value. Before turning to the estimate of economy-wide economic impact of the software,
we provide the overestimate of the agencies’ costs for making the software available.
From our earlier estimates, we know that the overestimate, or upper bound for the
additional costs will exceed the $86 million in revenue.
Turning to the costs of making available the large number of software products expected
to be made available if copyright protection is allowed, we estimated in Table 27 that on
average for the 23 respondents for which the projection was made, an overestimate of
those annual costs (incurred because of making the software available to others) would be
$1,310,360 over the years 2020-2024. Using the same procedure that we used to
extrapolate the expected licensing revenues for those 23 respondents, we estimate the
71 The 95% confidence intervals, shown in Table 26, for the projected average revenues cover a relatively
small range even using the conservative standard errors of the forecast.

59
This
public
atio
n is
availa
ble
free o
f charg
e fro
m: h
ttps://d
oi.o
rg/1
0.6
02
8/N
IST
.GC
R.2
1-0
28
sum of the annual costs (that is an overestimate of the costs for making the products
available) for their 10 parent agencies (HHS, DOT, VA, NASA, DOC, DOE, DoD apart
from the branches of the armed forces separately reported by FedScope, Department of
the Air Force, Department of the Navy, and GSA) would be $151.8 million. Remember
that this figure is the cost, projected from the responding sample to their parent agencies,
of obtaining IP protection and making available for licensing almost 60 times as many
software products for the GOGO respondents and about three times as many for the
GOCO respondents. Recall that from FedScope, the IT employment in the agencies
represented by the 23 respondents takes 51.4% of the total IT employment for all Federal
agencies. Thus, if the software copyright prohibition is eliminated, the upper bound
forecast of the annual 2020-2024 additional costs incurred for making the products
available is for all Federal agencies $295.3 million = $151.8 million/0.514. Although a
substantial sum, and one that exceeds the $86 million in additional revenues expected to
be generated, as we have emphasized, the expected revenues will not even come close to
the benefits to the users of the software, and much of the IP-related costs would be
incurred even if there were no licensed software products and the software is used solely
in support of agencies’ missions.
Summarizing the information that compares licensing revenues with the costs for IP
protection and licensing, we have the following. For an individual software product,
evaluating the licensing revenue model and the cost model at the average number of
software products for the GOCO respondents over the period 2015 through 2019 for
which the models were estimated, we found that the average revenue for the typical
software product was about $6000, while the part of its average cost that was due to
obtaining and maintaining IP and licensing the product was about $21,000. As explained,
that cost estimate is an overestimate of the contribution of IP and licensing (to the typical
product’s average cost) that would be due to making copyrighted software products
available to others. So, an overestimate of the ratio of the cost per product to the revenue
per product is 3.5 ($21,000/$6,000). After extrapolating from the costs and revenues for
the respondents to the costs and revenues for all Federal agencies, the projected 2020-
2024 overestimated ratio of IP and licensing costs to revenue is 3.4 (295.3 million in IP
and licensing costs divided by $86.1 million). However, as we have discussed, the
projection of licensing revenues is just a rough estimate, and, more importantly, even if it
were a perfect estimate, it would far underestimate the value of the software to the
economy.
The $86.1 million projection of the annual licensing revenues is just a rough estimate of
what the actual revenues from Federal agencies’ software might be in the counterfactual
situation where copyright for Government Works software is allowed. As an estimate of
potential revenues should the GOGO respondents take advantage of copyright to realize
revenues to the extent that GOCO respondents do, the projection is an underestimate
because, in projecting the revenues for the counterfactual situation, we are careful to
include respondents who do not anticipate copyrighting and licensing products even if
allowed to do so. Such respondents choose not to copyright and offer licensed products
and collect revenues, and the projections reflect their actual expected revenues of zero.
On the other hand, the projection of the revenues is indeed a projection of potential
60
This
public
atio
n is
availa
ble
free o
f charg
e fro
m: h
ttps://d
oi.o
rg/1
0.6
02
8/N
IST
.GC
R.2
1-0
28
revenues rather than actual revenues for the respondents who report that they will
copyright and license software projects. For such respondents it is a projection of the
potential revenues because the forecasting equation assumes that they will take advantage
of the revenue-generating opportunities to the same extent as the GOCO respondents do.
In fact, many may choose not to take similar advantage to generate licensing revenue
from an ability to copyright the software. In that sense, the forecasted revenues will be
potential revenues, and the actual revenues received are expected to be even less than
what is forecast. In all, it is important to emphasize that the projection of $86.1 million in
licensing revenues is surely a very rough estimate. The rough estimate is worth making
and describing in order to develop an initial understanding about what might happen and,
even more importantly, to develop understanding that the licensing revenues, whatever
they actually would turn out to be, vastly understate the value of the Federal agencies’
software to the economy.
We turn now to an estimate of the potential magnitude of that value. In the next section,
we estimate that the potential annual economy-wide benefits from the use of the software
would, based on the U.S. economy’s performance in 2019, be $4.3 billion in additional
output for the economy because the use of the agencies’ software would increase the
productivity of those using the software.
2.8. Assessment of Potential Economy-Wide Effects of Federal Agencies’
Software
Software enables a large amount economic activity beyond the activity of producing the
software itself. What would be the expected impact, on the U.S. economy as a whole, of
the software produced in the laboratories and laboratory facilities of the U.S. Federal
agencies if the copyright prohibition is eliminated for software produced by the agencies’
GOGO laboratories and laboratory facilities? If the copyright prohibition is lifted, we
have conservatively estimated that over the next five years the annual licensing revenues
generated from the agencies’ software that would be made available for licensing or
download would be $86 million. What would be the economy-wide impact from the
dissemination of the software that would generate those revenues? The projected annual
licensing revenues greatly understate the value of the software to those using it, in part
because much of the agencies’ software is made available without any charge. Because
much of the Federal agencies’ software would be made available without charge, to
develop an answer about its likely contribution to economy-wide economic value, we
combine information about the economy-wide impact for the software industry with
information about the software activities of the Federal agencies.
The software produced by the software industry makes a direct contribution to the
nation’s output. Additionally, over and above that direct contribution to output, the
software contributes to productivity gains throughout the economy. The economy-wide
productivity gains from software result because of the software’s contribution to capital
deepening from the accumulation of information-technology capital and because of
software’s contribution to multifactor productivity growth. Appendix B reviews the
assessment of those productivity effects beyond the direct contribution of the software
61
This
public
atio
n is
availa
ble
free o
f charg
e fro
m: h
ttps://d
oi.o
rg/1
0.6
02
8/N
IST
.GC
R.2
1-0
28
industry to economy-wide output, GDP, i.e., value added.72 As detailed in Appendix B,
in addition to the direct contribution of the software industry to GDP, it is estimated that
software contributes 15% of the annual growth in the nation’s output. We use that
benchmark estimate to provide an assessment of the potential economy-wide impact of
the Federal agencies’ software if copyright is allowed and the anticipated increase in their
software that is made available to others occurs.
Application of the Benchmark to the Federal Agencies’ Software Operations. The
software created by the laboratories and laboratory facilities of the Federal agencies
covers a wide range of applications. Hence, the estimated economic impact for the
software industry can reasonably be applied to the Federal agencies’ software. We use
the benchmark estimate for the software produced by the software industry to provide an
estimate of the potential economy-wide impact of the agencies’ software above and
beyond its contribution to the economy’s output that is made by the software operations
of the agencies as they accomplish their missions. So what we are interested in is the
induced impact because the use of the agencies’ software increases the productivity of
those outside the agency who use software. The argument is that the indirect or induced
impact of the agency’s software will become important if copyright is allowed and we
then have the anticipated 60-fold increase in the amount of GOGO software that is
licensed to others.
However, the difficult part of such an application is that the revenues from the agencies’
software will, as compared with the situation for the software industry as a whole, vastly
understate the amount of the agencies’ software that is used downstream. Because of that
downstream use, the software increases productivity in the economy beyond the direct
effects of the use of the software by the Federal agencies. The reason—that the licensing
revenues will understate the use of the software as compared to the relationship between
revenues and use for the software industry as a whole—is that, as we have reported,
many software managers for the Federal agencies quite deliberately make the software
available as a public service without charge and intend to continue doing so even if the
copyright prohibition for government-created software is eliminated.
Recall from the discussion of Table 25, the comments of the GOGO respondents who did
not anticipate any growth in revenues per software product. Three of the 16 GOGO
respondents made it quite clear that they did not intend to charge for the software that
72 The Bureau of Economic Analysis in its glossary of terms with its latest news releases emphasizes that
GDP, the economy-wide measure of output, is value added: “Gross domestic product (GDP) or value added
is the value of the goods and services produced by the nation’s economy less the value of the goods and
services used up in production.” Bureau of Economic Analysis, U.S. Department of Commerce, News
Release, July 6, 2020, “Gross Domestic Product by Industry, First Quarter 2020,” p. 4,
https://www.bea.gov/data/gdp/gdp-industry. Value added is the measure of output that is used when
describing economy-wide output and the contributions to economy-wide output made by individual
industries. “Value added is a measure of output after accounting for the intermediate inputs used in
production. As such, it is also a measure of an industry’s contribution to GDP.” Mary L. Streitwieser,
Measuring the Nation’s Economy: An Industry Perspective—A Primer on BEA’s Industry Accounts,
Bureau of Economic Analysis (BEA), www.bea.gov, U.S. Department of Commerce, Revised May 2011,
p. 7.
62
This
public
atio
n is
availa
ble
free o
f charg
e fro
m: h
ttps://d
oi.o
rg/1
0.6
02
8/N
IST
.GC
R.2
1-0
28
they made available, copyrighted on not. One said, “Open Source, no charge.” Another
said, “They will always be freely available products.” And the third said, “Don't intend
to charge for software as this is counterproductive to getting people to use it.” Moreover,
even respondents that do not say they will not charge for distributed software will
typically have a significant proportion of their software, copyrighted or not, available
without charge or for a fee far less than it would be possible to obtain if it were marketed
by a private sector firm.
Because the forecasted potential licensing revenues of $86 million vastly underestimate
the value of the Federal agencies’ software, to evaluate the economy-wide impact of the
agencies’ software we need to find a way to assess its value. Our respondents’
expectations support the belief that the elimination of copyright prohibition for
government produced software would be accompanied by a dramatic increase in the
amount of the Federal agencies’ software that would be made available for others to use.
Recall that, if the software copyright prohibition is lifted, for the upcoming five-year
period the GOGO respondents predicted about a 60-fold increase in the amount of
software that would be made available for licensing, and the GOCO respondents also
expected about a three-fold increase. Arguably, if the copyright prohibition is eliminated
and the dramatic increase in licensed software products does occur for the Federal
agencies’ laboratories, the economy-wide effects of the agencies’ software will, given
appropriate adjustment for the scale of the activity, be similar to the effects that have
been observed for the software industry as a whole. Under the assumption that the
agencies’ software, once the protections of copyright law are available, will realize such
commercial potential, we use the benchmark estimates developed for the software
industry to forecast the potential economy-wide effects of the Federal agencies’ software
if the copyright prohibition is eliminated.
Appendix B’s benchmark estimate is that 15% of the annual growth in the nation’s output
is because software increases the productivity of the organizations that use it. For the
development of the benchmark estimate, the number of employees in the software
industry totaled 2.34 million.73 The corresponding total number of IT employees in all
Federal agencies as reported by FedScope was 79,850.74
73 As explained in Appendix B, the benchmark estimate uses 2012 data, and the employment number is
documented in Robert J. Shapiro, “The U.S. Software Industry as an Engine for Economic Growth and
Employment,” September 2014, Sonecon, https://sonecon.com/docs/studies/Report_for_SIIA-
Impact_of_Software_on_the_Economy-Robert_Shapiro-Sept2014-Final.pdf, p. 13. 74 FedScope provides the IT employment for all Federal agencies for 2014, 2015, 2016, 2017, and 2018.
The employment increases every year, and the average increase is 886. The IT employment for all the
agencies totaled 81,622 in 2014, and extrapolating back using the average yearly change, the estimated IT
employment for 2012 is 79,850.
https://www.fedscope.opm.gov/ibmcognos/bi/v1/disp?b_action=powerPlayService&m_encoding=UTF-
8&BZ=1AAABpu3eKwh42o1OwW6CQBD9mR3Ug2Z2EAsHDiwLkYOgwqWnhuJqmsJiFjz4983Cwfb
W9zKZycx7L_OUxaasinOSyXAYe6MyuQSiL19yLgN3J4X~thXoCY8LN8DAE37i7tItEK0c602ic7w~Rt
U_BEqbXo9Kj0DptW8vyoAnYIu67hS4cnGsm_~6poaPpLu3~bNTelyAJ4HS_3z5K3_pgLAySl_AcPmuar
Me_7XtK2t3ZBlv4iLPk7jKijyPDkn4D6sjTuEVkXFE5BwZY8g8ZITMkrHopnTzBEIga47aFjA49INNjB~
GzNmnR21GZQADBuQDuQikONAnUDAv_GvBJgC5Vv4LfOI0zQ9NNb8x4wcrtG_w
63
This
public
atio
n is
availa
ble
free o
f charg
e fro
m: h
ttps://d
oi.o
rg/1
0.6
02
8/N
IST
.GC
R.2
1-0
28
The relative size, estimated as the ratio of the employment amounts, of the Federal
agencies’ software operations as compared with the total software operations for the
economy is 0.034 = 79,850/2,340,000. That estimate of the agencies’ relative size is an
underestimate, because FedScope’s reported number of IT employees uses a narrow
definition of an IT employee while the employment figure from the Bureau of Economic
Analysis for the total employment in the software industry includes employees working
in the industry that would not be classified as IT workers for purposes of the FedScope
report of employees by type of employment. Because our estimate is an underestimate of
the relative size of the Federal agencies’ software operations as compared with the
economy-wide software activity, our estimate of the potential economy-wide impact for
the agencies’ software products is a conservative underestimate.
To estimate the potential downstream productivity effect of the Federal agencies’
software for the economy as a whole, we use the productivity benchmark of 0.15
multiplied by the growth in economy-wide value added to have the induced productivity
effect for the software industry as a whole. We then multiply that by the Federal
agency’s software operations’ size, as measured by employment, relative to the size of
the software industry.
The induced output effect from the agencies’ software would be the agencies’ proportion,
0.034, of the total induced effect of software on the output in the economy. That total
induced effect would be 0.15 multiplied by the growth in output which, over the year
2018 to 2019 was $847.5 billion as gross domestic product increased from $20,580.2
billion to $21,427.7 billion.75 Thus the estimate of the potential annual induced
productivity effect for the Federal agencies’ software operations is $4.3 billion = 0.034 x
0.15 x $847.5 billion. The potential $4.3 billion economy-wide impact is an induced
effect because the use of the Federal agencies’ software would increase the productivity
of the industries where the software was used.76
The potential $4.3 billion economy-wide impact is based on the most recent year for
which the U.S. economy’s growth in value added is reported. Until the U.S. economy
has recovered from the pandemic of 2020, we cannot expect the growth in the U.S.
economy to be as much as it was from 2018 to 2019, and consequently, the software
75 Bureau of Economic Analysis, U.S. Department of Commerce, News Release, July 6, 2020, “Gross
Domestic Product by Industry, First Quarter 2020,” p. 9, Table 5, https://www.bea.gov/data/gdp/gdp-
industry. 76 In addition to the induced productivity, or “downstream” effect of the agencies’ software, there is the
“upstream” employment effect from the Federal agencies’ demand for inputs that are used in their software
operations. Applying the benchmark employment multiplier of 1.5 derived from the input-output tables
(see Appendix B), to the direct employment effect of the 86,053 IT employees for all Federal agencies in
2019, the combined direct and indirect employment effects from the agencies’ software operations sum to
129,079 employees. (FedScope reports that the total IT employment for the agencies in 2018 was 85,167.
Extrapolating to 2019 using the average yearly change over the years 2014-2018 reported by FedScope
gives estimated IT employment of 86,053 for the agencies in 2019.) To the direct effect of providing
86,053 jobs, there is an induced effect of 43,026 = 0.5 x 86,053 employees that are hired in the upstream
industries to produce goods and services purchased by the Federal agencies to support their software
operations.

64
This
public
atio
n is
availa
ble
free o
f charg
e fro
m: h
ttps://d
oi.o
rg/1
0.6
02
8/N
IST
.GC
R.2
1-0
28
industry’s contribution to positive economic growth cannot be expected to be what we
observed for the most recent year of data.
Conclusion
This report has used the responses to a survey of the Federal agencies’ GOCO and
GOGO laboratories and facilities to develop projections for the economic impact of the
agencies’ software products if the copyright law is changed so that Federal agencies are
allowed to copyright the software that is created in their GOGO laboratories and
facilities. The projections are:
• As compared with the annual numbers of licensed software products for the last
five years, over the next five years, if copyright protection is allowed, the
averaged forecasts of the survey respondents suggest that the annual number of
licensed software products by the agencies’ laboratories and facilities will
increase by almost 60 times for GOGO operations and by about 3 times for
GOCO operations. Respondents explained that copyright protection would make
the use of the released software more effective because users would be willing to
contribute to its development for commercial use and share their work with
others. Both commercial users and the government would be protected from
users who otherwise might claim proprietary interests in the developed software
and even sell it back to its originators.
• Across all Federal agencies, if copyrights are allowed for GOGO software, the
software made available over the next five years is expected, based on a very
simple forecasting model, to generate $86 million in annual licensing revenues, a
pronounced increase over the annual licensing revenues generated over the
preceding five years. The increase that is projected for the next five years is
largely driven by the expected increase in the GOGO licensing revenues. The
annual licensing revenues for the GOGO software are, on average for the
respondents, again based on the very simple model, expected to increase by 51
times or 5100%, while GOCO licensing revenues on average for the respondents,
are expected to increase by 2.43 times or 243%. Because the software is
developed for the agencies’ internal use in support of their missions, and because
the costs are largely incurred in the production and maintenance of the software,
the costs of the software would largely be incurred whether or not the software is
made available for others to use. The $86 million from making the software
available for others vastly understates the value that the software would create for
others using it, because the software developed for internal agency use is made
available as a public service rather than as a profit-maximizing endeavor, and
indeed much of the software would be made available without charge.
• We estimate that if the copyright prohibition for government produced software is
eliminated, the potential annual contribution from making Federal agencies’
software available to others would be an addition to the U.S. economy’s output of
$4.3 billion because the use of the Federal agencies’ software would increase the
productivity of the industries where the software is used. The projection is based
65
This
public
atio
n is
availa
ble
free o
f charg
e fro
m: h
ttps://d
oi.o
rg/1
0.6
02
8/N
IST
.GC
R.2
1-0
28
on the most recent year, 2019, for which the requisite data are available from the
U.S. Bureau of Economic Analysis. Thus, for the near term, as the economy
recovers from the unanticipated shock of the pandemic of 2020, the projection
based on 2019 data should be taken as no more than an illustration of the potential
for a significant economy-wide impact from Federal agencies’ software.
• Although this report’s assessment supports the view that the Government Works
software made available for others to use would create far more value for the
economy as a whole than the additional IP-related costs incurred by the Federal
agencies, it should be emphasized that based on the projections from the
information provided by the respondents to the Software Copyright Impact
Survey, the agencies would probably incur costs of making the products available
that exceed the licensing revenues anticipated. Based on the information provided
by respondents to the survey, making a copyrighted software product available for
licensing would on average contribute about $6,000 to expected annual licensing
revenues while it would add an amount less than $21,000 to expected average cost
for a software product. The $21,000 includes IP-related costs that would be
incurred even if there were no licensing of products and the software were used
solely in support of the agencies’ missions. It is thus an overestimate of the part
of the costs for the software product that would not have been incurred if the
product was not copyrighted and made available. The software is produced for
use by the laboratory or laboratory facility and then made available, often free of
any charge, for others who find it useful for their own work. The software is not
developed solely or even at all for its ability to generate licensing revenues, and
many respondents indicate that they expect to make software available without
charge even if copyright protection is allowed.
• Although the availability of copyright protection would strengthen the
effectiveness of making GOGO software available for others, there is a social
cost—perhaps an unintended consequence—of eliminating the copyright
prohibition. Namely, the proportion of public domain software—released to the
general public without copyright or copyleft restrictions—is expected to decline
by 30%. Offsetting that relative decline is the very large increase in the number
of software products licensed and, presumably, used productively. GOGO
respondents on average anticipate an almost 60-fold increase in the number of
software products licensed if copyright is allowed; GOCO respondents on average
expect about a 3-fold increase. Also, for products made available for licensing,
on average a 72-fold increase is expected for GOGO respondents, and a 4.5-fold
increase for GOCO respondents. Despite the increase in software made available
and software licensed, the loss of public domain software may lessen productivity
for some users of the agencies’ publicly released software. That possibility and
its importance should be the subject of future research.
One of the GOGO respondents wrote about the potential for an economy-wide impact
from the large increase in licensed government software that is anticipated if copyright
66
This
public
atio
n is
availa
ble
free o
f charg
e fro
m: h
ttps://d
oi.o
rg/1
0.6
02
8/N
IST
.GC
R.2
1-0
28
protection for software created by the government is allowed. The GOGO respondent
observed:
I really believe greater ability to protect and distribute government created
software would be a boon to both private industry and the [Federal agency]. …
[Let me describe] the nature of the software work done [in organizations like
mine]. Typically [the agency’s] contractors give software maintenance duties to
the government after they develop a system or give those duties to the
government in a few years after maintenance becomes less lucrative. This means
the majority of the total software work done [in organizations like mine] entails
updates that fix bugs, provide new features, or enable systems to work in new
environments. This is not to say traditional software development does not occur,
it does but usually in regard to tools and software that support these [agency]
contractor systems. With that said, I am certain that government created …
software is an untapped resource for [the agency]. I tried working on this problem
for the past few years. … The assumption ... is that nothing of public value comes
out of [organizations like mine] since most of their software work is maintenance
work on classified systems. The truth is that many of these ... systems have
commercial versions that experience the same problems. Many of these software
updates, with a little repackaging, could find their way into commercial systems.
Also, many [of the agency’s] contractor systems were developed entirely with
government money making them additional candidates to be publicly shared and
licensed by the government as long as export controls and classification levels are
accounted for. Last those supporting systems developed 100% by government
employees are the low hanging fruit of sharing software. As I write this, [my
organization’s] first software license for internally developed software is being
written and there are many more software items that are good candidates.
Allowing greater copyright protection on government software would help drive a
culture change where more of the software that [organizations like mine] create is
shared with the public. Licensing software is motivating for [software] engineers,
but also encourages better knowledge shared with industry and open source
groups. We don't need to reinvent the wheel every time we create software.
The results of the study suggest that to effectively realize the potential for the economy-
wide productivity-enhancing economic impact of copyrighted, licensed software from the
Federal agencies, additional management resources will be needed. After providing
information about an agency’s limited number of software license agreements and limited
royalty income, one respondent observed, “[Our agency does not] really have the tracking
and management systems in order to do much official technology transfer with this type
of technology. This is probably an area where the USG doesn't need a separate tech
transfer office at each agency to make things work better. I would like to see a "mega -
distribution platform" housed at NIST to deal with it better.” Appendix D provides
examples of how Federal agencies are conducting outreach concerning custom software
technologies. One agency, the General Services Administration (GSA) maintains such a
“mega-distribution platform,” but it is focused on custom software that is developed as
“open source.”
67
This
public
atio
n is
availa
ble
free o
f charg
e fro
m: h
ttps://d
oi.o
rg/1
0.6
02
8/N
IST
.GC
R.2
1-0
28
In conclusion, based on the projections developed from the responses of the GOCO and
GOGO respondents to the Software Copyright Impact Survey, changing the copyright
law to allow copyright protection for GOGO Government Works software is expected to
have a positive economic impact on the U.S. economy. However, because the survey
asked the respondents at the agencies for information about their software activities that
have not previously been tracked and reported systematically, providing responses to the
survey was a challenge for many respondents. The report should be considered as only
an exploratory first look to develop new information about the agencies’ software
activities and thereby to describe the potential economy-wide impact for allowing
copyright for government-works software.

68
This
public
atio
n is
availa
ble
free o
f charg
e fro
m: h
ttps://d
oi.o
rg/1
0.6
02
8/N
IST
.GC
R.2
1-0
28
Appendix A. Software Copyright Impact Survey (OMB Control No. 0693-0033,
Expiration Date: 07/31/2022)
The Software Copyright Impact Survey was attached as a separate PDF file in the
original report to preserve its formatting and complete contents. For the GCR report, the
Software Copyright Impact Survey is appended at the end of the PDF file of GCR 21-
028.
69
This
public
atio
n is
availa
ble
free o
f charg
e fro
m: h
ttps://d
oi.o
rg/1
0.6
02
8/N
IST
.GC
R.2
1-0
28
Appendix B. Economy-Wide Impact of the Software Industry
For software production in general, apart from the direct economic effects from the
revenues generated and employment provided by the software production itself, the
literature about the software industry has documented both downstream effects on the
productivity of the users of the software and upstream effects of increased demand for the
products that are used in software production. To provide an assessment of the probable
economy-wide impact of the forecast of increased software available from the Federal
agencies’ labs and lab facilities if copyright prohibition is eliminated, we first explain the
literature’s development of two benchmarks. The first benchmark is for the downstream
effect on the productivity of users of the Federal agencies’ software. The first benchmark
will allow forecasting the potential economy-wide productivity effect of the agencies’
software made available for licensing or downloading without a license. The second
benchmark is for the upstream effect on employment because of the demands for inputs
used in the Federal agencies’ software operations. The second benchmark will allow
projecting the effect of the agencies’ software activity on economy-wide employment.
The Definition of the Software Industry Used to Develop the Benchmarks. The
software industry is typically defined as a combination of industry categories. For
example, Shapiro defines the industry as a combination of industrial classification
industries:
The … software industry [is defined as the] operations of companies in three sub-
industries: computer systems design and related services; software publishing; and data
processing, hosting and information services. The computer systems design industry
(NAICS code 5415) covers companies that write, modify, test, and provide support for
software, and so would include enterprise software companies such as IBM, Hewlett-
Packard, and Oracle, as well as IT consulting companies like Accenture. The software
publishing industry (NAICS code 5112) covers companies that produce and distribute
computer software, including the development, publishing and installation of software,
as well as providing support for software customers. This sub-industry is comprised of
1) prepackaged software produced by companies such as Apple and Microsoft (25.6
percent of software publishing); 2) custom software built by companies such as IBM
and Hewlett Packard (37.6 percent); and 3) software developed by companies in-house
for their own use (36.8 percent). Finally, the data processing, hosting, and other
information services industry (NAICS codes 518 and 519) covers companies that
provide web-based software, infrastructure and data storage, as well as search engines,
social networks, auction sites, and web publishing companies. Services included under
this designation include web-based platforms and applications, cloud computing
services, and streaming services. The companies include Google, eBay, Salesforce, and
Netflix.77
77 Robert J. Shapiro, “The U.S. Software Industry as an Engine for Economic Growth and Employment,”
September 2014, Sonecon, https://sonecon.com/docs/studies/Report_for_SIIA-
Impact_of_Software_on_the_Economy-Robert_Shapiro-Sept2014-Final.pdf.

70
This
public
atio
n is
availa
ble
free o
f charg
e fro
m: h
ttps://d
oi.o
rg/1
0.6
02
8/N
IST
.GC
R.2
1-0
28
The definition is essentially the same as used in a 2016 report from BSA | The Software
Alliance that commissioned The Economist Intelligence Unit (EIU) to assess the
economic impact of the software industry.
The modern definition of the software industry used in the study reflects recent
technological advancements in the software industry — from one that focused on
tangible and packaged software products to one that includes software related services
like the cloud based software as a service (SaaS), cloud storage and computing, mobile
app development and hosting. As a result, the EIU analysis has defined the US software
industry to include the following software sub-industries: NAICS 5112: Software
Publishers; NAICS 5415: Computer Systems Design and Related Services; NAICS 518:
Data Processing, Hosting and Related Services; NAICS 519130: Internet Publishing
and Broadcasting and Web Services.78
The Benchmark for the Downstream Economy-wide Productivity Effect. In a
sophisticated study, Byrne, Oliner, and Sichel estimate the contribution of software to the
1.56% growth in labor productivity over the period from 2004 to 2012. They estimate
that the productivity effect of software contributed 0.24% in percentage points to the
1.56% of the growth in labor productivity. Of software’s contribution of percentage
points to the 1.56% total, 0.16% was from software’s contribution to the capital
deepening from the accumulation of IT capital, and 0.08% was software’s contribution to
multifactor productivity growth.79 Shapiro observes that software’s contribution to labor
productivity growth is then 0.154 = 0.24/1.56, or 15.4%, and then observes that since real
nonfarm business output grew 1.6%, software accounted for about 15% of that growth in
output from 2004 to 2012. Labor productivity growth explained 97.5% (1.56/1.6) of the
growth in output; and 15.4% of that 97.5% of the growth in output was explained by
software. Thus, 0.154 x .975 x 1.6% = 0.24% of the 1.6% growth in output is contributed
by software, and therefore software contributed 0.15 or 15% of the growth in output
(0.24%/1.6% = 0.15).80 Shapiro observes that software value added in 2012 was $425
billion; that was the direct contribution to GDP.81 Also, in addition to the direct
contribution of the software industry to GDP, it contributed to productivity gains
throughout the economy. Using the foregoing analysis, Shapiro observes that software’s
contributions to the productivity gains were 15% of the growth in output from 2011 to
2012, and that amounted to $101 billion.82 Thus, Shapiro concludes, “All told, the
78 BSA | The Software Alliance, “The $1 Trillion Economic Impact of Software,” with data from The
Economist Intelligence Unit, June 2016, https://softwareimpact.bsa.org. 79 David M. Byrne, Stephen D. Oliner, and Daniel E. Sichel, “Is the Information Technology Revolution
Over?” 2013-36, Finance and Economics Discussion Series, Divisions of Research & Statistics and
Monetary Affairs, Federal Reserve Board, Washington, D.C., March 2013, Table 1, “Contributions to
Growth of Labor Productivity in the Nonfarm Business Sector,” p. 22. Shapiro, op cit., Table 5, p. 10
shows and works with these facts from Byrne, Oliner, and Sichel. 80 Shapiro, Ibid., p. 10. 81 Value added is the measure of output that is used when describing economy-wide output and the
contributions to economy-wide output made by individual industries. See the discussion of GDP, i.e.,
value added, and the definitions, provided in Section 2.8 of this report, from the Bureau of Economic
Analysis. 82 Careful reading of Shapiro’s analysis, op. cit., will not find an explicit statement of the 15% being
applied to the growth in output from 2011 to 2012. It is certainly implicit, however, and it is the
71
This
public
atio
n is
availa
ble
free o
f charg
e fro
m: h
ttps://d
oi.o
rg/1
0.6
02
8/N
IST
.GC
R.2
1-0
28
software industry in 2012 contributed $526 billion to GDP—$425 billion + $101
billion—or 3.2 percent of GDP.”83 Hence, based on the experience during a period when
the impact of software was considerably less than it was during the 1995-2004 period,
and hence a period yielding a conservative estimate for the productivity effect, in addition
to the annual value added contributed directly, software has a large indirect productivity
effect on the entire economy. The benchmark effect is the direct effect of value added
provided by the software industry plus the indirect effect of value added from other
industries throughout the economy because their use of the software increases their
productivity. The benchmark tells us that the indirect effect is estimated by multiplying
0.15 times the growth in value added for the economy.
The circa 2012 benchmark for the economy-wide productivity effect of software is an
appropriate one because the effect has been based on the experience over the 2004-2012
period, when the effects of software were grounded in the reality of the period after the
mid-1990s to early 2000s outsized impact of information technology, and at the same
time the output share of software was large. As Byrne, Oliner, and Sichel observe:
As for the separate contributions from the use of IT (capital deepening) and from
efficiency gains in the production of IT, the patterns are similar, with the contributions
over 2004-2012 well off from the rapid pace during 1995-2004 and a little below the
contribution from 1974 to 1995. The slowdown in the contribution from the production
of IT reflects both a slower pace of advance of MFP in each IT sector and a sizable
step-down in the current-dollar output share of the industries producing computer
hardware, communication equipment, and semiconductors. This drop reflects
substantial movement of IT manufacturing from the United States to foreign locations.
Indeed, as shown in figure 1, the share of current-dollar nonfarm business output
represented by the production of computer hardware, communication equipment, and
semiconductors has fallen more than 70 percent from its peak in 2000. In contrast, the
output share of the software industry was higher from 2004 to 2012 than in either of the
earlier periods.84
The Benchmark for the Upstream Economy-wide Employment Effect. For software’s
economy-wide impact that is from the upstream effect of increased demand for the
products and services used as inputs for the software industry, Shapiro uses the Input-
Output tables from the Bureau of Economic Analysis. The approach is also used in the
2016 report from BSA using EIU research.
Shapiro explains the analysis that produces the benchmark for the upstream effect that we
apply to the Federal agencies’ software activity.
Input-output analysis relies on a series of statistics issued regularly by the Bureau of
appropriate procedure, and it is what was done in the report. We verified the procedure used by using the
historical data from the Bureau of Economic Analysis archival files. Although the data have been revised,
the result is essentially the same as what Shapiro reports. 83 Ibid., p. 1. 84 Byrne, Oliner, and Sichel, op. cit., p. 9.

72
This
public
atio
n is
availa
ble
free o
f charg
e fro
m: h
ttps://d
oi.o
rg/1
0.6
02
8/N
IST
.GC
R.2
1-0
28
Economic Analysis tracking the commodity outputs produced by each industry, called
the “Make” tables, and the commodity inputs used by each industry to produce its
output, called the “Use” tables. … I-O analysis can track and estimate an industry’s
indirect effects on output, employment and income generated by its purchases of
intermediate inputs from other industries or supply chains. …
We define the software industry here as the … NAICS categories which, according to
the Bureau of Labor Statistics, employ the largest number of software developers and
programmers: 1) computer systems design industry (NAICS code 5415); software
publishing (NAICS code 5112); and data processing, hosting, and information services
(NAICS codes 518 and 519). As noted earlier, the Bureau of Economic Analysis reports
that the output of these three categories in 2012 totaled $425 billion. Further, the
Bureau of Labor Statistics reports that these sub-industries in 2012 employed 2.34
million workers, and they earned a total of $308.4 billion.
To estimate the software industry’s indirect employment impact across other industries,
we begin with the BEA “Use” table to calculate the amount of each commodity
consumed by software companies as intermediate inputs, and the BEA “Make” table
identify the source of these intermediate inputs by industry. Next, we aggregate the
industry totals to estimate the value of goods and services consumed by the software
industry on an industry-by-industry basis. We find that that in order to produce its $425
billion in output in 2012, U.S. software companies consumed $212 billion in goods and
services produced by other industries. Further, we estimate that this economic demand
from the software industry supported 1.1 million jobs in other industries, including
145,000 workers in the accommodation and food services industry, 364,000 workers in
the administrative services industry (office administration, clerical services, security,
cleaning, and waste disposal services), and 181,000 jobs in the professional, scientific,
and technical services industry.
Based on these data, we calculate that every ten jobs in the software industry supported
five more jobs in other industries – that is, the software industry had an employment
multiplier of about 1.5 in 2012.85
Other Effects. Software industry associations have used the foregoing approaches that
generate a value-added multiplier and an employment multiplier to describe the
economy-wide impact of the software industry. They have also in some cases added
another effect, namely an induced effect “… associated with the consumption by workers
employed by the software industry: Their earnings create additional demand for goods
and services, which in turn require employment to satisfy that demand.”86 However, we
agree with Shapiro that such estimates are difficult to determine because if the employees
were not working in the software industry, presumably they would be earning incomes in
another occupation.87
85 Shapiro, op. cit., pp. 12-13. 86 Shapiro, op. cit., p. 13. BSA, op. cit., provides an example where such induced effects are estimated and
discussed. 87 Shapiro, op. cit., p. 13.

73
This
public
atio
n is
availa
ble
free o
f charg
e fro
m: h
ttps://d
oi.o
rg/1
0.6
02
8/N
IST
.GC
R.2
1-0
28
Appendix C. Estimated Licensing Revenue Functions
In this appendix, we discuss and present the simple revenue model that we use to
describe, for the sample of GOCO respondents, the relationship between licensing
revenues and the number of licensed software products and their IP protection. In the
report, we use the simple model to describe the average revenue for licensed software
products with and without IP protection, and we also use the model to provide a forecast
of what might be expected if the Government Works software of GOGOs could be
copyrighted. In the report we provide a full discussion of those applications of the simple
revenue model. Here in the appendix we focus on the technical details of why the very
simple model is appropriate, and we compare the results obtained with the simple model
to what is found when instead a more elaborate model is used. We show in this appendix
that the simple model—that is easily explained and readily understood by a general
audience—actually yields the same predictions and statistical inferences as the more
elaborate model. Everything that we do with the simple model can be replicated with the
more elaborate one, but the elaborate one is not one that can be readily understood by a
general audience.
In the simple model, observed licensing revenues are determined by the number of
licensed software products, by whether or not the products have IP protection, and by
random error, as specified in equation (1).
(1) revenue19it = α + β swprodlicdit + γ IPprotectedit + εit
The variable revenue19it denotes the ith respondent’s software licensing revenue in
constant 2019 dollars for fiscal year t. The variable swprodlicdit denotes for the ith
respondent, the annual number of licensed software products in fiscal year t. The
variable IPprotectedit = 1 when there were copyrights or patents, and = 0 when there was
no copyright or patent protection. The variable εit denotes the independently distributed
random error with expected value equal to zero. In the classical, normal Ordinary Least
Squares (OLS) model that random error is assumed to be normally distributed. Therein
lies the problem that we need to address in this appendix.
Table 2 showed and discussed the asymmetry and peakedness of the distributions for the
variables across the different GOGO and GOCO respondents. As observed with the
discussion of Table 2, when estimating the model of the licensing revenues, it is the
distribution of the random error that must be addressed.
The first point about the disturbances in the model is that their mean is zero. The second
point is that the variance in the error may not be the same for each observation. The very
different situations for the respondents—differences that cause their different outcomes
for the variables—suggests that the error in the model’s estimated equation may be
heteroskedastic, that is, the error variance may differ across the observations. For that
reason, we estimate the OLS models shown in the tables of this appendix with robust
standard errors. (Although, as it turns out, whether estimated with robust standard errors
or not, the results are essentially the same.)

74
This
public
atio
n is
availa
ble
free o
f charg
e fro
m: h
ttps://d
oi.o
rg/1
0.6
02
8/N
IST
.GC
R.2
1-0
28
For our estimates of the model using simple regression and allowing for different error
variances to be unbiased, we need only the assumption that the expected value for
randomly distributed disturbances is zero. That is the key for our very exploratory use of
the model. We hope for unbiased estimates for the model’s coefficients, and then we can
use the estimated model to predict what would happen if copyright protection were
allowed for the GOGO respondents. Observe that while the mean for the licensing
revenues in the GOCO and GOGO samples is positive as shown in Table 2, the mean for
our observations of the errors—i.e., our observations of the residuals in the regression
models that we estimate—is zero. For example, among the models estimated in this
appendix, it turns out that the key model for our predictions is specification (2) in Table
C.1 (that will be presented after we have explained a bit more about why the simple
model that will be shown in Table C.1 is appropriate). For that specification, the mean
(estimated with double precision) of the model’s residuals is -0.00000000000477 (-
4.77x10⁻¹²). However, while the mean of the residuals is zero, the distribution is skewed
and more peaked than the normal distribution.
To compare the distributions of the licensing revenues, the dependent variable in the
model, with the distribution of the residuals for the estimated model, we show
appropriate histograms. The histogram in Figure C.1 shows the density for the licensing
revenues for the GOCO respondents whose data is used in specification (2) in Table C.1.
The density metric has scaled the height of the histogram’s bars so that the sum of their
areas equals 1 (as would be the case for a probability distribution for the continuous
variable, licensing revenues). The licensing revenues have been divided into five “bins”
with each bin having width $130,901.29. Observe that 5 x $130,901.29 = $654,506.4
which is the maximum in the sample for licensing revenue. The range of revenues for the
five bins begins at 0.0, the minimum revenue reported by the GOCO respondents, and the
range ends at $654,506.4, the maximum revenue reported. For comparison,
superimposed on the histogram is an appropriately scaled normal density. The overlaid
normal distribution has the same mean and standard deviation as the GOCO respondents’
data for licensing revenues in constant dollars of 2019.
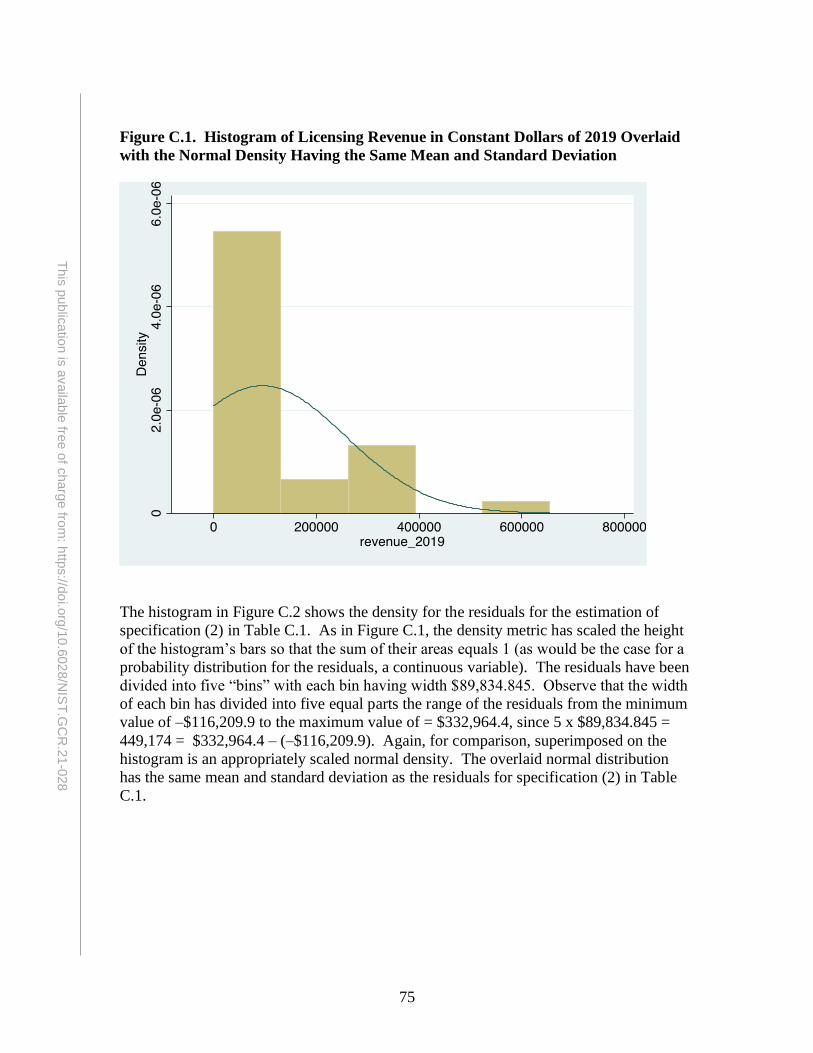
75
This
public
atio
n is
availa
ble
free o
f charg
e fro
m: h
ttps://d
oi.o
rg/1
0.6
02
8/N
IST
.GC
R.2
1-0
28
Figure C.1. Histogram of Licensing Revenue in Constant Dollars of 2019 Overlaid
with the Normal Density Having the Same Mean and Standard Deviation
The histogram in Figure C.2 shows the density for the residuals for the estimation of
specification (2) in Table C.1. As in Figure C.1, the density metric has scaled the height
of the histogram’s bars so that the sum of their areas equals 1 (as would be the case for a
probability distribution for the residuals, a continuous variable). The residuals have been
divided into five “bins” with each bin having width $89,834.845. Observe that the width
of each bin has divided into five equal parts the range of the residuals from the minimum
value of –$116,209.9 to the maximum value of = $332,964.4, since 5 x $89,834.845 =
449,174 = $332,964.4 – (–$116,209.9). Again, for comparison, superimposed on the
histogram is an appropriately scaled normal density. The overlaid normal distribution
has the same mean and standard deviation as the residuals for specification (2) in Table
C.1.

76
This
public
atio
n is
availa
ble
free o
f charg
e fro
m: h
ttps://d
oi.o
rg/1
0.6
02
8/N
IST
.GC
R.2
1-0
28
Figure C.2. Histogram of Residuals for Specification (2) in Table C.1 Overlaid with
the Normal Density Having the Same Mean and Standard Deviation
Although the mean for the residuals is zero; and the estimated coefficients are unbiased
for randomly distributed errors, the distribution of the residuals from the usual regression
model with the software survey data is not normal. Thus, the inferential statistics that
accompany our unbiased estimated coefficients for equation (1) will not necessarily
provide the same inferences as what would be shown by a different type of estimating
model that accounted for the skewness in the randomly distributed errors as indicated by
the distribution of the residuals. However, the OLS regression model typically provides
good inferences with samples for which the regression disturbances with mean zero are
not normally distributed. Moreover, we shall show that for our sample, OLS provides
essentially the same inferences as the formal Tobit model that accounts for the limited
dependent variable that is “left-censored” at zero.88
A well-known example for which OLS and the appropriate formal statistical model for
the limited dependent variable provide similar inferences is the case where the dependent
variable is a qualitative (“dummy”) variable—that is, either a 0 or a 1, indicating whether
or not an event occurs. The so-called “linear probability model” which simply regresses
88 See G. S. Maddala, Limited-Dependent and Qualitative Variables in Econometrics (Cambridge, U.K.:
Cambridge University Press, 1983) for the exposition of the Tobit model.
77
This
public
atio
n is
availa
ble
free o
f charg
e fro
m: h
ttps://d
oi.o
rg/1
0.6
02
8/N
IST
.GC
R.2
1-0
28
the 0-1 dependent variable on the explanatory variables, will often provide the same
inferences as a formal probit model that estimates the probability of the event. When
compared to the probit model’s results, the estimated coefficients from the ordinary least
squares estimator predict the same probabilities and the statistics reach the same
conclusions about the statistical significance of the model and its estimated effects. Link
and Scott (2009) provide a carefully documented example. Comparing their probit
model’s estimates (Table 4, p. 273) with the linear probability model’s estimates (Table
A3, p. 279), Link and Scott conclude (p. 274): “[T]he simple linear probability model
(i.e. ordinary least squares (OLS)) yields essentially the same conclusions, although of
course the assumptions making ordinary least squares appropriate are not satisfied.”89
For another example of the robustness of the OLS estimator, Marchenko and Genton
(2010) develop a maximum-likelihood estimator that assumes skewed distributions for
the disturbances rather than the symmetric normal distribution. They compare OLS
estimates with skewed residual error with the estimates from the skewed distribution
estimator and find that coefficient estimates and inferential conclusions are similar.90 For
the Marchenko and Genton example, the residuals for the OLS regression model are
somewhat skewed, with a longer left tail, and they are more peaked than the normal
distribution (Marchenko and Genton, Figure 4, p. 524). The residuals for specification
(2) in Table C.1 (the key model for the prediction of licensing revenue) are also more
peaked than the normal distribution, and also skewed, but with a longer right tail. In the
Marchenko and Genton example, despite the distribution of the OLS regression’s
residuals being somewhat skewed and more peaked than the normal distribution, the
normal regression model provides similar inferential conclusions (p. 531).
Given the small number of respondents for our model, in our exploratory look at the
relationship between licensing revenues and the number of licensed software products
with or without IP protection, we use the OLS estimator rather than work with maximum-
likelihood estimators that ideally require large numbers of observations (and, with
smaller samples, may not even be estimable because they may not converge to a
maximum likelihood). For both our descriptions and predictions, we use the estimates
from the OLS regression model. The simple model is expected to provide good
inferences about the descriptive relationship between licensing revenue and the
explanatory variables. Moreover, discussing and explaining the OLS model’s results is
much easier than discussing the results of the formal model—the Tobit model—designed
to deal with a limited dependent variable that, like licensing revenue, is left-censored at
zero.91 In fact, after presenting and discussing the OLS model, we show that the Tobit
model yields similar inferential results to what we find with the OLS model.
89 A. N. Link and J. T. Scott, “Private Investor Participation and Commercialization Rates for Government-
sponsored Research and Development: Would a Prediction Market Improve the Performance of the SBIR
Programme?” Economica, Volume 76, Issue 302 (April 2009). 90 Yulia V. Marchenko and Marc G. Genton, “A Suite of Commands for Fitting the Skew-Normal and
Skew-t Models,” The Stata Journal, Vol. 10, No. 4 (2010), pp. 507-539, at p. 531. 91 An example of a full discussion of an application of the Tobit model is provided in J. T. Scott and T. J.
Scott, “Innovation Rivalry: Theory and Empirics,” Economia e Politica Industriale-Journal of Industrial
and Business Economics, Vol. 41, No. 1 (March 2014), pp. 25-53.

78
This
public
atio
n is
availa
ble
free o
f charg
e fro
m: h
ttps://d
oi.o
rg/1
0.6
02
8/N
IST
.GC
R.2
1-0
28
For the seven GOCO respondents with complete observations for the three variables,
Table C.1 shows the estimation of the simple revenue model. Column (1) shows the
licensing revenues as a function of the number of licensed software products, swprodlicd.
With the revenues measured in constant dollars of 2019, the estimated coefficient for
swprodlicd shows the marginal effect on revenue from adding an additional licensed
product. At the margin, for another product the annual licensing revenues increase by
$2,884. The estimated constant term is large, $33,389 in constant dollars, and
significantly different from zero. Thus, the slope of the ray from the origin to the total
revenue function’s value, at a given number of licensed products, shows a relatively large
average revenue per product for the licensed software products of the GOCO
respondents. As shown in the specification in column (2), that large constant term is
explained by the presence of intellectual property protection. Adding the variable
IPprotected to the specification, the coefficient estimated for swprodlicd is $2,565 and
the estimated coefficient for IPprotected is $70,042, reflecting the advantage, for the
observations in the sample, of having an appropriate combination of IP protection of
copyrights, patents, or both. With the addition of the control for the presence of
intellectual property protection from copyrights or patents, the estimated constant term is
small and not significantly different from zero. That change from what we observed in
column (1) where, before the addition of IPprotected we found a constant term that was
large and significantly different from zero, tells us that the high average revenues
associated with the licensed software products reflect the IP protection of copyrights or
patents. For the GOCO observations, the IP protection is coming mostly from copyright
protection, although there are some respondents that report patents for their software as
well as copyrights. The GOCO respondents providing the three variables used in the
revenue model report, on average, that 19% of their licensed software had copyright
protection while 3% of their licensed software had patent protection.
Rather than report the t-statistics directly, we have followed current practice in the
economics journals and reported the coefficient, its standard error, and the p-value for the
conservative two-tailed test of the coefficient’s statistical significance against the null
hypothesis. Dividing the estimated coefficient by the standard error gives the t-statistic
that some readers might want to see. Observing whether the |t| > 2 provides a quick test
for statistical significance. In that case, if the null hypothesis that the estimated
coefficient is zero is true, then the probability that the t-statistic would have a higher
absolute value (denoted as probability > |t| or p > |t|) is the two-tailed p-value, and, given
the number of degrees of freedom for our model, it would be about 0.05 for |t| > 2, i.e.
about 0.025 in each tail of the distribution for the t-statistic against the null
hypothesis. Thus, an estimated coefficient for which p > |t| = 0.000 means the probability
in the two tails of the t distribution is < 0.0005. So the estimated coefficient is highly
statistically significant. Note, for example, that the p-value for the estimated coefficient
on swprodlicdit in specification 2 of Table C.1 is 0.000, and the t-statistic (the ratio of the
estimated coefficient to its standard error) is 4.90. For specification 2 in Table C.1, we
see that both explanatory variables have estimated coefficients that are statistically
significant.

79
This
public
atio
n is
availa
ble
free o
f charg
e fro
m: h
ttps://d
oi.o
rg/1
0.6
02
8/N
IST
.GC
R.2
1-0
28
Table C.1. The Software Licensing Revenue Model for the GOCO Observations:
Least-Squares Estimates, Dependent Variable revenue19it Variable (1) (2)
swprodlicdit 2884.1
(515.2)
[0.000]
2564.6
(523.6)
[0.000]
IPprotectedit -- 70042.4
(26287)
[0.012]
Intercept 33388.9
(13174)
[0.016]
164.0
(323.1)
[0.615]
R-squared 0.647 0.686 F-statistic
(probability > F)
31.3
(0.0000)
21.3
(0.0000)
n 35 35 Notes: The variable revenue19it denotes the ith respondent’s software licensing revenue in constant 2019
dollars for fiscal year t. The variable swprodlicdit denotes for the ith respondent the annual number of
licensed software products in fiscal year t. The variable IPprotectedit = 1 when there were copyrights or
patents, and = 0 when there was no copyright or patent protection.
Robust standard errors in parentheses, probability > |t| in brackets.
The F-statistic degrees of freedom for column (1) is F(1, 33) and for column (2) is F(2, 32).
Source: Authors’ computations from “Software Copyright Impact Survey,” OMB Control No. 0693-0033,
Expiration Date: 07/31/2022
For the 26 GOGO respondents with complete observations for the three variables, Table
C.2 shows the estimation of the simple revenue model. Column (1) shows the licensing
revenues as a function of the number of licensed software products, swprodlicd. With the
revenues measured in constant dollars of 2019, the estimated coefficient for swprodlicd
shows the marginal effect on revenue from adding an additional licensed product. At the
margin, for another product the annual licensing revenues increase by $3,167. The
estimated constant term is $1,317 in constant dollars. Thus, the slope of the ray from the
origin to the total revenue function’s value, at a given number of licensed products,
shows, compared with the situation for the GOCO respondents, a relatively small average
revenue per product for the licensed software products of the GOGO respondents. As
shown in the specification in column (2), both the estimated coefficient for swprodlicd
and the estimated constant term in the first specification are explained by the presence of
intellectual property protection. Adding the variable IPprotected to the specification, the
coefficient estimated for swprodlicd falls to $1,977, and the estimated constant term falls
to $460. The estimated coefficient for IPprotected is $6,648, reflecting the advantage,
for the observations in the GOGO sample, of having IP protection of copyrights, patents,
or both, but the value of the IP protection actually obtained for the typical software
product is clearly an order of magnitude less for the GOGO sample, where copyright
protection, excepting internationally protected products and products transferred to the
labs, cannot be obtained. Thus, the average revenues associated with the licensed
software products of the respondents in the GOGO sample reflect the lack of IP
protection as compared with the respondents in the GOCO sample. For the GOGO
observations, the IP protection observed is coming mostly from some patent protection,
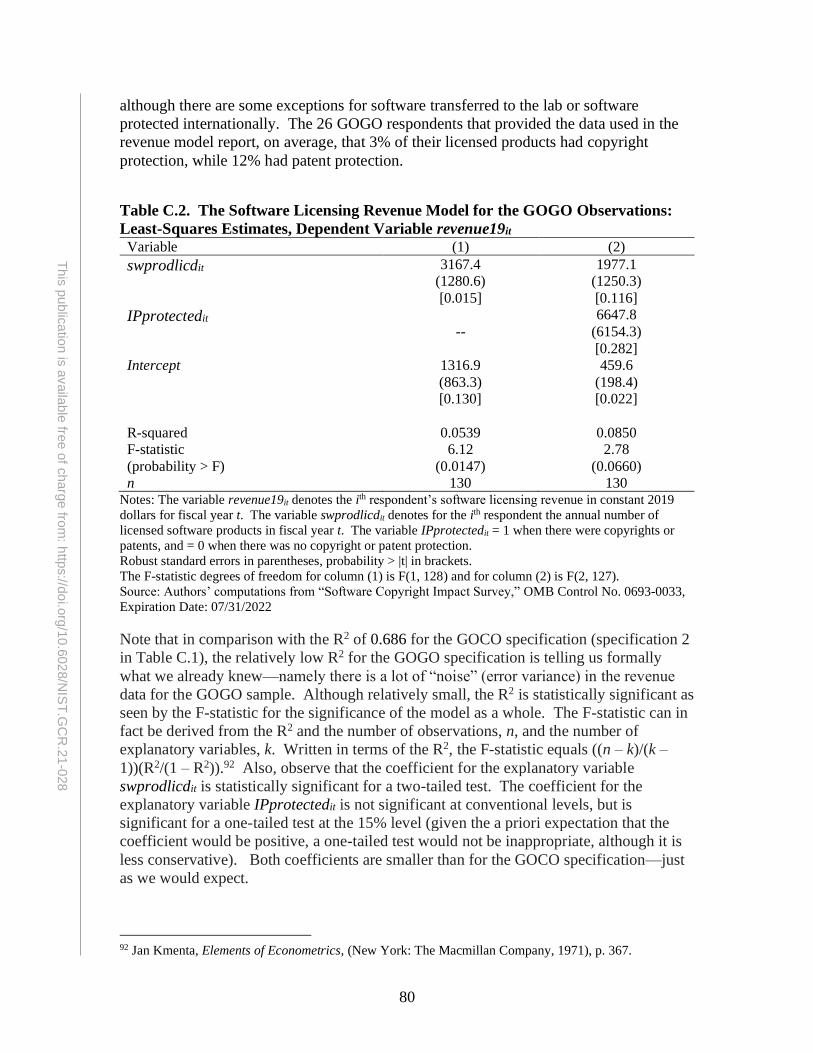
80
This
public
atio
n is
availa
ble
free o
f charg
e fro
m: h
ttps://d
oi.o
rg/1
0.6
02
8/N
IST
.GC
R.2
1-0
28
although there are some exceptions for software transferred to the lab or software
protected internationally. The 26 GOGO respondents that provided the data used in the
revenue model report, on average, that 3% of their licensed products had copyright
protection, while 12% had patent protection.
Table C.2. The Software Licensing Revenue Model for the GOGO Observations:
Least-Squares Estimates, Dependent Variable revenue19it Variable (1) (2)
swprodlicdit 3167.4
(1280.6)
[0.015]
1977.1
(1250.3)
[0.116]
IPprotectedit
--
6647.8
(6154.3)
[0.282]
Intercept 1316.9
(863.3)
[0.130]
459.6
(198.4)
[0.022]
R-squared 0.0539 0.0850
F-statistic
(probability > F)
6.12
(0.0147)
2.78
(0.0660)
n 130 130 Notes: The variable revenue19it denotes the ith respondent’s software licensing revenue in constant 2019
dollars for fiscal year t. The variable swprodlicdit denotes for the ith respondent the annual number of
licensed software products in fiscal year t. The variable IPprotectedit = 1 when there were copyrights or
patents, and = 0 when there was no copyright or patent protection.
Robust standard errors in parentheses, probability > |t| in brackets.
The F-statistic degrees of freedom for column (1) is F(1, 128) and for column (2) is F(2, 127).
Source: Authors’ computations from “Software Copyright Impact Survey,” OMB Control No. 0693-0033,
Expiration Date: 07/31/2022
Note that in comparison with the R2 of 0.686 for the GOCO specification (specification 2
in Table C.1), the relatively low R2 for the GOGO specification is telling us formally
what we already knew—namely there is a lot of “noise” (error variance) in the revenue
data for the GOGO sample. Although relatively small, the R2 is statistically significant as
seen by the F-statistic for the significance of the model as a whole. The F-statistic can in
fact be derived from the R2 and the number of observations, n, and the number of
explanatory variables, k. Written in terms of the R2, the F-statistic equals ((n – k)/(k –
1))(R2/(1 – R2)).92 Also, observe that the coefficient for the explanatory variable
swprodlicdit is statistically significant for a two-tailed test. The coefficient for the
explanatory variable IPprotectedit is not significant at conventional levels, but is
significant for a one-tailed test at the 15% level (given the a priori expectation that the
coefficient would be positive, a one-tailed test would not be inappropriate, although it is
less conservative). Both coefficients are smaller than for the GOCO specification—just
as we would expect.
92 Jan Kmenta, Elements of Econometrics, (New York: The Macmillan Company, 1971), p. 367.

81
This
public
atio
n is
availa
ble
free o
f charg
e fro
m: h
ttps://d
oi.o
rg/1
0.6
02
8/N
IST
.GC
R.2
1-0
28
Table C.3 shows what happens when to the 26 GOGO respondents with complete
observations for the three variables we add the additional observation that was
predominately for GOGO operations, but that also included some GOCO operations.
Column (1) shows the licensing revenues as a function of the number of licensed
software products, swprodlicd. With the revenues measured in constant dollars of 2019,
the estimated coefficient for swprodlicd shows that for each additional licensed product,
the annual licensing revenues increase by $3,312, which as we would expect is somewhat
higher than the $3167 estimated before the addition of the mixed case including some
GOCO labs and lab facilities. The estimated constant term $1,256 about the same as the
$1,317 estimated before the addition of the mixed case. As shown in the specification in
column (2), both the constant term and the coefficient on swprodlicd in the column (1)
specification are again explained to an extent by the presence of intellectual property
protection. Adding the variable IPprotected to the specification, the coefficient estimated
for swprodlicd drops to $2095, and the estimated constant term drops to $443. The
estimated coefficient for IPprotected is $6,215, capturing the advantage, for the
observations in the sample, of having an appropriate combination of IP protection of
copyrights, patents, or both. If a dummy variable for the additional respondent (reporting
for several labs and facilities that are predominantly GOGO, but some are GOCO) that
has been added to the estimation in Table C.3, the variable never has a significant effect
and the other results seen in Table C.3 remain essentially the same.
Table C.3. The Software Licensing Revenue Model for the GOGO Observations
Plus the Mixed Case: Least-Squares Estimates, Dependent Variable revenue19it Variable (1) (2)
swprodlicdit 3312.0
(891.1)
[0.000]
2094.7
(1148.5)
[0.070]
IPprotectedit
--
6215.3
(5840.3)
[0.289]
Intercept 1255.9
(878.3)
[0.155]
442.8
(200.2)
[0.029]
R-squared 0.0799 0.107
F-statistic
(probability > F)
13.8
(0.0003)
6.46
(0.0021)
n 135 135 Notes: The variable revenue19it denotes the ith respondent’s software licensing revenue in constant 2019
dollars for fiscal year t. The variable swprodlicdit denotes for the ith respondent the annual number of
licensed software products in fiscal year t. The variable IPprotectedit = 1 when there were copyrights or
patents, and = 0 when there was no copyright or patent protection.
Robust standard errors in parentheses, probability > |t| in brackets.
The F-statistic degrees of freedom for column (1) is F(1, 133) and for column (2) is F(2, 132).
Source: Authors’ computations from “Software Copyright Impact Survey,” OMB Control No. 0693-0033,
Expiration Date: 07/31/2022
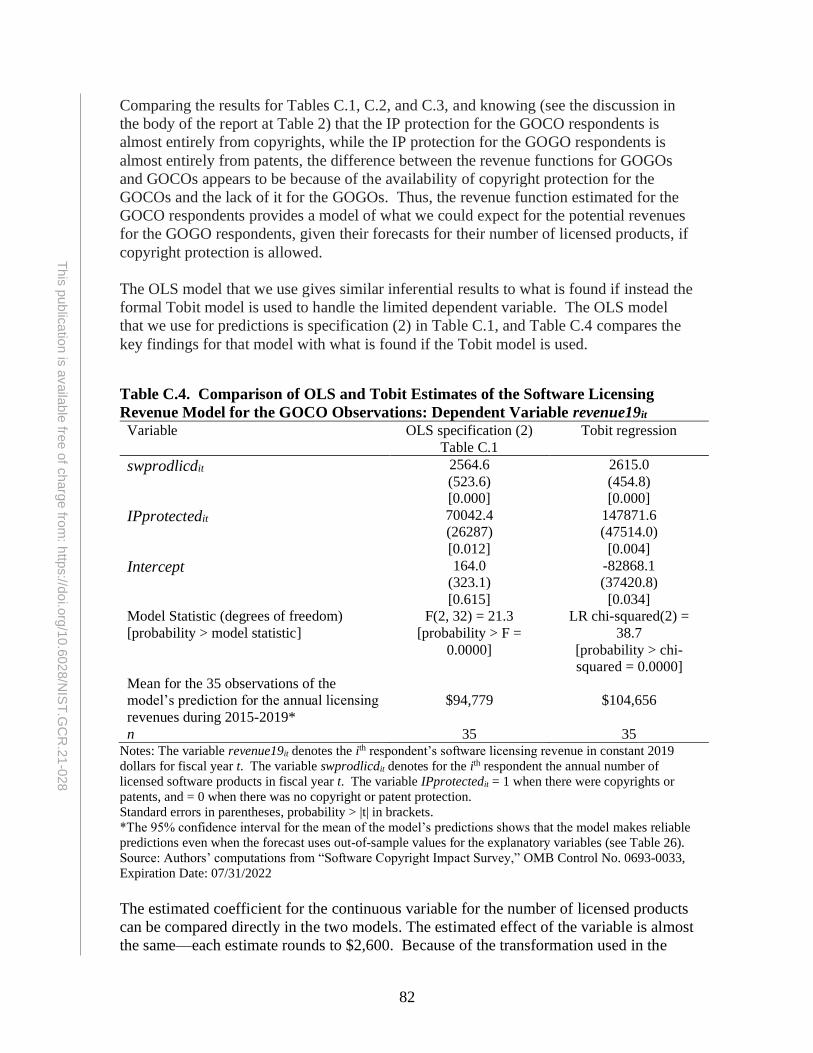
82
This
public
atio
n is
availa
ble
free o
f charg
e fro
m: h
ttps://d
oi.o
rg/1
0.6
02
8/N
IST
.GC
R.2
1-0
28
Comparing the results for Tables C.1, C.2, and C.3, and knowing (see the discussion in
the body of the report at Table 2) that the IP protection for the GOCO respondents is
almost entirely from copyrights, while the IP protection for the GOGO respondents is
almost entirely from patents, the difference between the revenue functions for GOGOs
and GOCOs appears to be because of the availability of copyright protection for the
GOCOs and the lack of it for the GOGOs. Thus, the revenue function estimated for the
GOCO respondents provides a model of what we could expect for the potential revenues
for the GOGO respondents, given their forecasts for their number of licensed products, if
copyright protection is allowed.
The OLS model that we use gives similar inferential results to what is found if instead the
formal Tobit model is used to handle the limited dependent variable. The OLS model
that we use for predictions is specification (2) in Table C.1, and Table C.4 compares the
key findings for that model with what is found if the Tobit model is used.
Table C.4. Comparison of OLS and Tobit Estimates of the Software Licensing
Revenue Model for the GOCO Observations: Dependent Variable revenue19it Variable OLS specification (2)
Table C.1
Tobit regression
swprodlicdit 2564.6
(523.6)
[0.000]
2615.0
(454.8)
[0.000]
IPprotectedit 70042.4
(26287)
[0.012]
147871.6
(47514.0)
[0.004]
Intercept 164.0
(323.1)
[0.615]
-82868.1
(37420.8)
[0.034]
Model Statistic (degrees of freedom)
[probability > model statistic]
F(2, 32) = 21.3
[probability > F =
0.0000]
LR chi-squared(2) =
38.7
[probability > chi-
squared = 0.0000]
Mean for the 35 observations of the
model’s prediction for the annual licensing
revenues during 2015-2019*
$94,779
$104,656
n 35 35 Notes: The variable revenue19it denotes the ith respondent’s software licensing revenue in constant 2019
dollars for fiscal year t. The variable swprodlicdit denotes for the ith respondent the annual number of
licensed software products in fiscal year t. The variable IPprotectedit = 1 when there were copyrights or
patents, and = 0 when there was no copyright or patent protection.
Standard errors in parentheses, probability > |t| in brackets.
*The 95% confidence interval for the mean of the model’s predictions shows that the model makes reliable
predictions even when the forecast uses out-of-sample values for the explanatory variables (see Table 26).
Source: Authors’ computations from “Software Copyright Impact Survey,” OMB Control No. 0693-0033,
Expiration Date: 07/31/2022
The estimated coefficient for the continuous variable for the number of licensed products
can be compared directly in the two models. The estimated effect of the variable is almost
the same—each estimate rounds to $2,600. Because of the transformation used in the

83
This
public
atio
n is
availa
ble
free o
f charg
e fro
m: h
ttps://d
oi.o
rg/1
0.6
02
8/N
IST
.GC
R.2
1-0
28
Tobit model to formally account for the limited dependent variable, the estimated
constant term and the estimate for the qualitative variable for IP protection differ from
those estimates in the OLS model, but the differences are offset in the predictions of
licensing revenue that we are interested in. For the Tobit model’s maximum likelihood
prediction of expected licensing revenues, if the linear combination of the variables plus
normally distributed error is less than or equal to zero, the licensing revenue is predicted
to be zero; if the linear combination plus error exceeds zero, the licensing revenue is
predicted to be the expected value of the given linear combination plus the error. The
levels of statistical significance for the coefficients of the two explanatory variables and
for the model statistics are essentially the same for the OLS and the Tobit regressions.
We can directly compare the expected value of the average annual revenues predicted by
the two models, and the prediction is the reason we are interested in the model. That is,
we want the model to predict annual revenues for the counterfactual circumstances where
copyright of Government Works software is allowed. We see that the two models reach
similar conclusions. Thus, the OLS model predicts that on average during the period
2015-2019 the annual revenues for the GOCO respondents are $94,779 in constant
dollars of 2019, while the Tobit model that has reformulated the problem to treat the left-
censoring of the data predicts that the average annual revenues are $104,656 in constant
dollars of 2019. The two estimates differ by about 10%. The average OLS prediction is
the average of the OLS fitted values. Denoting the actual value of the dependent variable
as y , the fitted value as y , and the OLS residual as e , the average of the OLS fitted
values is (1/𝑛)∑ ��𝑖𝑖 = (1/𝑛)∑ (𝑦𝑖𝑖 − 𝑒𝑖) = (1/𝑛)∑ 𝑦𝑖𝑖 because the sum of the least squares
residuals is zero. Thus, the OLS model’s mean estimate of expected annual licensing
revenue during the period 2015-2019 equals the actual mean for annual licensing revenue
reported by the respondents and shown in Table 2. As seen in Table 2, the actual average
of the annual revenue in constant 2019 dollars for the GOCO sample was $94,779.
In all, we see that the simple OLS model and the Tobit model—that formally deals with
the issue that 11 of the observations have no licensing revenue—reach similar inferences.
Most importantly for the purposes of using the simple revenue model for predictions, the
two models yield similar predictions for the dependent variable.

84
This
public
atio
n is
availa
ble
free o
f charg
e fro
m: h
ttps://d
oi.o
rg/1
0.6
02
8/N
IST
.GC
R.2
1-0
28
Appendix D. Examples of the Custom Software Outreach
(“Marketing”) Practices of Federal Laboratories
As discussed throughout this report, Federal agencies are enabled and, to variable extents,
motivated to share and transfer the software developed for agency missions within their
laboratories. Their approaches are similar even though the licensing arrangements they
employ vary. Obviously, GOCO laboratories can license copyrights whereas, for the
most part, GOGO laboratories cannot. But beyond that, licensing arrangements vary
according to technology “release type” (discussed in Sections 1.4; 2.4.2, Tables 8 and 9;
and 2.6.1, Tables 22 and 23, of this report) and other factors specific to the technology at
issue.
That said, four agencies exemplify the approaches Federal agencies take to “getting the
word out” and making their custom-software readily available to users: NASA, NIH,
USDA, and DOE.
NASA features outreach (“marketing”) for custom software. They maintain a website —
NASA SOFTWARE <https://software.nasa.gov> — that allows potential external users to
search for software applications in the following 15 technology categories: aeronautics,
autonomous systems, business systems and project management, crew and life support,
data and image processing, data servers processing and handling, design and integration
tools, electronics and electric power, environmental science, materials and processes,
operations, propulsion, structures and mechanisms, systems testing, and vehicle
management.
Dozens of individual software projects are listed in each technology category and each
software product is described along with its “release type” — general public, government
purpose, open source, U.S. only, U.S. and foreign — and points of contact.
In addition, like other Federal agencies with substantial R&D capabilities, NASA
maintains a more general technology transfer website <https://technology.nasa.gov> that
allows searches for licensing opportunities using key words. Entering “software” as a
search term returns 326 items.
Most of NASA’s laboratories are government operated (GOGO). One, the Joint
Propulsion Laboratory (JPL), is contractor operated (GOCO). JPL, too, features software
licensing opportunities <https://ott.jpl.nasa.gov/index.php?page=software> declaring that,
“Caltech elects ownership of copyrights to all JPL developed software” and that they
“grant the U.S. Government and its contractors a license to use the software at no cost”
on the basis of a "government use" license.
The approach taken by NIH is less software-specific than that of NASA but it too
involves their technology transfer website <https://www.ott.nih.gov> and keyword
searching for licensing opportunities <https://www.ott.nih.gov/opportunities>. Entering
“software” as an unrestricted search terms returns 1,642 items. Entering “software” as a
85
This
public
atio
n is
availa
ble
free o
f charg
e fro
m: h
ttps://d
oi.o
rg/1
0.6
02
8/N
IST
.GC
R.2
1-0
28
search term and restricting the “technology” category to “software” returns 64 items.
(Examples of NIH custom software technology are described in Appendix E.)
The USDA, too, organizes access to licensing opportunities through its Office of
Technology Transfer website <https://www.ars.usda.gov/ott/office-of-technology-transfer/>.
Like NIH, USDA does not focus on software per se. And, rather than a “search engine”
approach, USDA identifies categories of “available technologies”
<https://www.ars.usda.gov/ott/available-technologies/>: animal protection & production;
bioenergy & environment; crop production & protection; food processing & products;
materials & methods; and biological materials. Each category features descriptions of
specific technology projects, characterizations of associated benefits, application areas,
and points of contact.
The DOE also organizes a range of collaborative approaches to technology transfer,
including copyright licensing, through an elaborate website interface
<https://www.labpartnering.org/about> that creates Internet access to individual DOE
experts, identifies the capabilities of numerous facilities, and technology summaries. The
“Technology Summaries” page includes a multi-dimensional filter that allows general
searching of more than 1400 technology summaries.
According to the DOE’s Laboratory Partnering Service (LPS) website:
“It delivers a myriad of information to provide access to a portfolio of
investment opportunities. The LPS enables fast discovery of expertise and
serves as a conduit between the investor and the innovator, by providing
multi-faceted search capabilities across numerous technology areas and
the national laboratories.”
The LPS website offers no specific focus on software (as the NASA portal does) but
entering “software” as a search term results in 283 informative project summaries across
the DOE laboratories. (An example of DOE/INL custom software technology is
described in Appendix E.)
Finally, as discussed in Section 1.3 of this report, the technology transfer offices of
agencies whose R&D laboratories are predominantly government-operated have paid
very uneven attention to software technologies per se. NASA’s focus on the transfer of
software technology appears to be exceptional. For government-operated labs that have
paid less attention to software specifically, according to one agency expert, “more
informal aspects of marketing are probably more important for software licensing --
activities related to the inventor/developer,” including their publications and
presentations at conferences. Many Federal employee inventors also post information or
links to their software on their individual laboratory web sites. This practice appears true
of contractor-operated laboratories as well. In addition to centralized, Internet-accessed
“collaboration” portals, time dedicated to publications and conference presentations are
likely an important vehicle for communicating (“marketing”) internally-developed
technologies, including custom software technology.

86
This
public
atio
n is
availa
ble
free o
f charg
e fro
m: h
ttps://d
oi.o
rg/1
0.6
02
8/N
IST
.GC
R.2
1-0
28
The General Services Administration’s (GSA) Code.gov program office is worth
mention as a Federal government-wide vehicle to provide access to Federal agency
custom-software. It is exclusively focused on Open Source software, indicating that some
form of copyright property protection is afforded its software projects. Nonetheless, its
mission is expanding access to Open Source custom software developed by Federal
agencies and, “to become the primary platform where America shares its code.”93 The
Federal Source Code Policy requires agencies to provide an inventory of their custom-
developed code to support government-wide reuse and make Federal open source code
easier to find.94 Agencies are required to publish their inventories using a standard
metadata schema and to make those inventories available on their agency websites. Using
these inventories, Code.gov provides a platform to search Federally funded open source
software and software available for government-wide reuse.95 Currently, Code.gov’s
inventory contains 6854 open source software repositories (<https://code.gov/browse-
projects?&page=1&size=10&sort=a-z>), searchable by programming language, agency,
copyright license, and release type (“open source” and “government-wide reuse”).
93 https://open.gsa.gov/api/codedotgov/ 94 Executive Office of the President, Office of Management and Budget, Memorandum for the Heads of
Departments and Agencies, “Federal Source Code Policy: Achieving Efficiency, Transparency, and
Innovation through Reusable and Open Source,” August 8, 2016. 95 https://code.gov/federal-agencies/compliance/inventory-code

87
This
public
atio
n is
availa
ble
free o
f charg
e fro
m: h
ttps://d
oi.o
rg/1
0.6
02
8/N
IST
.GC
R.2
1-0
28
Appendix E. Examples of the Custom Software Developed in Federal
Laboratories
Predict the Behavior of Blackbody Heated Surfaces software (NASA/AFRC)96
Understanding of the radiation that emits from a heated surface is important in many
areas of science and engineering. Thus, researchers at NASA's Armstrong Flight
Research Center developed a set of computer functions for predicting the behavior of
heated surfaces written in Microsoft® Visual Basic® for Applications (VBA) software
that incorporates functions specific to Microsoft Excel® software.
The software enables the calculation of important derivative and integration functions
over a range of blackbody wavelengths.97 Because it is based on widely available
computer software tools from the Microsoft suite it can be integrated with other
engineering software.
In addition to aerospace applications, this software is useful for researchers developing
new materials and other technologies in a wide range of applications, including: thermal
management (for application to integrated circuits, computer chassis, remote sensors);
heat shields (for application in automotive, appliances, safety equipment); insulation (for
application in architecture, textiles and clothing); energy storage (for applications in
collecting and storing thermal energy); infrared surveillance; and earth science (for
understanding the composition of clouds, volcanoes, etc.).
Currently this custom software product is freely available from the NASA’s Armstrong
Flight Research Center website.
Source Lines Counter (SLiC) version 4.098
Source lines of code is a software metric used to measure the size of a computer program
for comparative purposes.99 SLiC has been used in a variety of projects and missions at
JPL. It is the official code counter endorsed by the Software Quality Improvement (SQI)
project for its metrics collections effort across JPL. It is SQIs most requested software
product. SLiC provides data for cost models used during all major JPL pre-Phase A
software estimation activities as well as cost validation activities throughout project
lifecycles. SLiC is used to gather metrics for the JPL State of Software report to measure
process trends in flight projects and multi-mission ground system services.
The tool is used mostly by NASA centers, U.S. Government contractors and NOAA.
SLiC can be used by any organization to measure software size. Since it has wide-
96 https://software.nasa.gov/software/DRC-015-017 97 A blackbody is defined as a perfect absorber for all incident radiation. <
https://en.wikipedia.org/wiki/Black_body> 98 https://software.nasa.gov/software/NPO-45962-1 99 https://en.wikipedia.org/wiki/Source_lines_of_code
88
This
public
atio
n is
availa
ble
free o
f charg
e fro
m: h
ttps://d
oi.o
rg/1
0.6
02
8/N
IST
.GC
R.2
1-0
28
ranging support for the logical statement standard used in cost estimation, it may also be
of use to those using the popular public-domain COCOMO cost model. Any software
project that wishes to track development size metrics for a variety of languages not
supported by COTS tools may also find SLiC useful.100
The size of this custom software is about 4,000 lines of code, about the median for the
survey sample discussed in this report.101 The average for the typical software product
from the survey sample is approximately 45,000 lines of code, but the distribution is
highly skewed, and the median is 3,575 lines of code.102
This software is only available for use by Federal employees and contractors to the
Federal government working on projects where this tool would be applicable.
Detected Emitter Display Tool103
This custom software was created to assist with testing passive radar detection systems
used by many aircraft.104 Previously, testing was slow and cumbersome. There was no
way to visualize how emitters were being detected by the equipment in a simulated
environment. This software tool allowed quick testing of emitter identification errors and
errors related to emitter locations.
The software was written in C# and became integral to the Air Force Life Cycle
Management Center’s testing process. Its utility to external organizations has never been
examined. It could be useful to aircraft that use passive detection systems.
The size of this custom software is estimates to be 1000 lines of code.105 From Table 12
in Section 2.5.2, the size of this software product is the median for the minimum lines of
code for their products as reported by the respondents to the survey. This software is not
to be protected by a license.
Computer-Aided Diagnostic for Use in Multiparametric MRI for Prostate Cancer
(NIH/ NIHCC)106
Researchers at the National Institutes for Health Clinical Center (NIHCC) have
developed computer-aided diagnostics (CAD) that may further improve the already
100 Personal communication with Brian Morrison, Joint Propulsion Laboratory, October 5, 2020. 101 Ibid. 102 See Table 10. Descriptive Statistics for the Respondents with Complete Data for the Model of Software
Development and Maintenance Costs. For more detail, see Table 12. The Lines of Code (LOC) for the
Typical Software Product. 103 Personal communication with Christopher Young, Air Force Life Cycle Management Center, October 5,
2020. 104 So-called electronic support measures (ESM) gather intelligence through passive "listening" to
electromagnetic radiations of military interest. <
https://en.wikipedia.org/wiki/Electronic_warfare_support_measures> 105 Christopher Young, op cit. 106 https://techtransfer.cancer.gov/availabletechnologies/e-183-2016

89
This
public
atio
n is
availa
ble
free o
f charg
e fro
m: h
ttps://d
oi.o
rg/1
0.6
02
8/N
IST
.GC
R.2
1-0
28
superior capabilities of multiparametric magnetic resonance imaging (MRI) for detection
and imaging of prostate cancer. This system produces an accurate probability map of
potential cancerous lesions in multiparametric MRI images that is superior to other
systems and may have multiple product applications.
The system uses specialized algorithms trained against the results of conventional
information from hand drawn contours, recorded biopsy results, and normal cases from
randomly sampled patient images weighted for lesion size. This CAD system produces a
more accurate probability map of potential cancerous lesions in multiparametric MRI
images.
The CAD system may be used in several applications and settings including, cloud-based
prostate cancer screening, use in under-resourced clinical settings with few or
underexperienced radiologists, integration into a work station or a picture archiving and
communication system (PACS), or serve as standalone software to be used on existing
systems.
This technology is currently available for licensing and co-development partnerships.
Convolutional Neural Networks for Organ Segmentation (NIH/ NIHCC)107
Computer automated segmentation of high variability organs and disease features in
medical images is uniquely difficult. The pancreas, for example, is a small, soft, organ
with low uniformity of shape and volume between patients. Because of the lack of
uniform image patterns, there are few features that can be used to aid in automated
identification of anatomy and boundaries. High variability anatomical features are
currently analyzed and determined only by trained physicians who can read the images
and there is a shortage of trained physicians relative to the amount of image data
generated. Computer automation has been difficult to achieve but could improve image
analysis capabilities and lead to better diagnostics, disease monitoring, and surgical
planning for many diseases.
Researchers at the National Institutes of Health Clinical Center (NIHCC) have developed
a technology that trains a computer to read and segment certain highly variable images
features by employing Holistically-Nested Convolutional Neural Network (HNNs) and
deep learning. The resulting biomarkers are far more precise.
The Training methods may be generalizable to enable automation of segmentation for
many high variability image structures, such as tumors and diseased organs.
This technology is currently available for licensing and co-development partnerships.
Human Research Information System (NIH/ NIHCC)108
107 https://techtransfer.cancer.gov/availabletechnologies/e-056-2017 108 https://techtransfer.cancer.gov/availabletechnologies/e-266-2014

90
This
public
atio
n is
availa
ble
free o
f charg
e fro
m: h
ttps://d
oi.o
rg/1
0.6
02
8/N
IST
.GC
R.2
1-0
28
Human Research Information System (HuRIS) software automates all major functions of
a clinical-research entity. The system is designed for commercial healthcare providers,
community treatment centers, and clinical research facilities. HuRIS is an intelligent
electronic environment for the collection, organization and retrieval of information in
clinical/scientific decision support which enables data and resource sharing in real time
among authorized users at NIHCC clinics.
At the core of this informatics infrastructure reside the clinical charts and research
records of participants compiled over the entire history of their study participation, and
sometimes across multiple studies. The resulting information can be accessed, on-
demand, by doctors writing medication orders or nurses recording participants’ vital signs
as well as researchers conducting data analysis or completing reporting requirements.
HuRIS has potential commercial applications across the spectrum of medical care
information management systems, including clinical research, pharmacies, biospecimens
tracking, laboratories, and behavioral modification and addiction treatment.
This technology is available for licensing.
Battery Diagnostic Software (INL/DOE)109
Researchers at DOE's Idaho National Laboratory developed an advanced software
diagnostic tool to assess batteries currently in use. Known as CellSage (or Cell’s Age),
this technology characterizes battery performance, diagnoses the health of a battery, and
predicts how much longer it will be able to function under specific conditions or
scenarios.110
The CellSage software tool closes knowledge gaps in understanding how to measure,
monitor, and manage complex battery systems used in a wide variety of applications.111
Prior to INL’s more sophisticated approach, battery diagnostics tend to be chemistry or
application specific. They correlated simple measurements of voltage, current, and
temperature with empirical trends of aging. As such the less sophisticated approaches
could not accurately predict battery aging trends outside these specific diagnostics.
CellSage software provides a more complete picture of battery health metrics such as
kinetic performance, capacity loss, conductance fade, power loss, and ancillary
quantities. The tool expands understanding of how specific battery chemistries react to
usage conditions and environments.
CellSage’s computational architecture uses Fortran at its core, making it easily converted
to a number of other scientific computing languages. It runs on most standard laptop and
desktop systems. CellSage software can be used in electric vehicles and for applications
109 https://www.labpartnering.org/success-story/0b1e5b9e-b112-4c77-ab7f-1e90ac26c055 110 Ibid. 111 https://www.ridgetopgroup.com/wp-content/uploads/CellSage-Document.pdf
91
This
public
atio
n is
availa
ble
free o
f charg
e fro
m: h
ttps://d
oi.o
rg/1
0.6
02
8/N
IST
.GC
R.2
1-0
28
in the military, space, medicine, electric utilities, telecommunications, and some
consumer electronics.112
The size of this custom software is estimated to be between 9,000 and 10,000 lines of
code.113 The average for the typical software product from the survey sample discussed in
this report was approximately 45,000 lines of code, but the distribution is highly skewed.
The median is 3,575 lines of code, and the 75th percentile is 18,152 lines of code.114 This
software is patented, copyrighted, and was licensed in 2017.
112 Ibid. 113 Personal correspondence with Ryan Bills, Idaho National Laboratory, October 7, 2020. 114 See Table 10. Descriptive Statistics for the Respondents with Complete Data for the Model of Software
Development and Maintenance Costs. For more detail, see Table 12. The Lines of Code (LOC) for the
Typical Software Product.

Introduction
OMB Control No. 0693-0033Expiration Date: 07/31/2022
Software Copyright Impact Survey
NIST’s Return on Investment (ROI) Initiative supports the President’s Management Agenda goal ofmodernizing federal government practices to further fuel the nation’s engines of innovation bymaximizing the transfer of Federal investments in science and technology to the private sector.
The ROI Initiative is the culmination of a broad-ranging and inclusive review of policies and practicesthat constrain technology commercialization. One of these constraints is the regulatory prohibition ofcopyright protection on software developed by federal agency employees (Title 17, Section 105, of theUnited States Code).
This survey is part of a NIST-sponsored study to assess the future economic benefits of eliminatingthe prohibition of copyright protection for software developed in government-operated federallaboratories. Contractor-operator federal laboratories are included because of their extensiveexperience with copyrighted software.
The survey covers two time periods, 2015-2019 and 2020-2024. Based on your informed judgement,we want to obtain, for the laboratory or facility (or laboratories or facilities) that you are respondingfor, estimates of the approximate number of software products (and associated revenue) that havebeen subject to copyright protection in federal laboratories (either because the lab is contractor-operated or because of exceptions that apply to government-operated labs), and the number ofsoftware products without copyright protection that could be available for copyright protection if theprohibition was eliminated. We will use the information you provide to estimate the net economicbenefits of such a policy action. Please answer all questions to the best of your ability. Theinformation provided will be used to estimate costs and revenues as functions of numbers and typesof software products. Individual responses will not be attributed to you, the survey respondent, or thespecific laboratory or facility with which you are associated. Issues concerning specific surveyquestions should be directed to David Leech <[email protected]>.
Disclaimer: By design, the data entry fields in this survey form are not intended for the insertion ofsensitive personally identifiable information (SPII)—nor are they intended for any proprietary businessidentifiable information (BII). Please take Federal best practice precautions in not inserting any datathat is not explicitly requested.——————————————Note: This collection of information contains Paperwork Reduction Act (PRA) requirements approved by the Office of
Management and Budget (OMB). Notwithstanding any other provisions of the law, no person is required to respond to,
nor shall any person be subject to a penalty for failure to comply with, a collection of information subject to the
requirements of the PRA unless that collection of information displays a currently valid OMB control number. Public
1
reporting burden for this collection is estimated to be thirty (30) minutes per response, including the time for reviewing
instructions, searching existing data sources, gathering and maintaining the data needed and completing and
reviewing the collection of information. Send comments regarding this burden estimate or any aspect of this collection
of information, including suggestions for reducing this burden, to the National Institute of Standards and Technology,
Attn: Nicole Gingrich <[email protected]>; Phone: 301-975-8034.
2

Section 1Laboratory Identification, Agency Affiliation, and Operator Type
OMB Control No. 0693-0033Expiration Date: 07/31/2022
Software Copyright Impact Survey
1. Identify the laboratory/laboratories (or laboratory facility/facilities) for which you are responding.
2. Name the parent federal agency of which your laboratory/laboratories (or laboratoryfacility/facilities) is/are a part.
Other (please specify) and identify as either GOGO or GOCO.
3. Is/Are the laboratory/laboratories (or laboratory facility/facilities) you are responding for consideredgovernment-operated or contractor-operated? (Choose one, or if you are responding for multiplelaboratories or facilities and they are not all considered to be in the same operation category, pleaselist each in the "other" box and identify each as GOGO or GOCO.)
Government Owned Government Operated (GOGO)
Government Owned Contractor Operated (GOCO)
If answering for multiple labs or facilities, from this point on just respond to each question for the collection of those labs orfacilities.
3
Section 2Software Licensing & Public Domain Software Release Activity 2015-2019
OMB Control No. 0693-0033Expiration Date: 07/31/2022
Software Copyright Impact Survey
(in the laboratory/laboratories or laboratory facility/facilities for which you are responding) For fiscal years, FY15-FY19:
Percent of parent federal agency
Software exclusive ofopen source
Open source software
4. For the FY15-FY19 period as a whole, approximate the percentage of the two custom-developedsoftware* product categories that your laboratory/laboratories (or laboratory facility/facilities)contributed to your parent Federal agency’s ({{ Q2 }}) total output in those categories: *Custom-developed computer software refers to software developed by agency employees as part of their official duties and software written as part of a federal
contract or otherwise fully funded by the federal government. It includes computer software projects, modules, plugins, scripts, middleware, and application
programing interfaces (APIs).
FY15
FY16
FY17
FY18
FY19
5. How many custom-developed software products made by your laboratory/laboratories orfacility/facilities were made available for licensing? (For GOGO labs it is understood that copyrightedsoftware products transferred to federal agencies or protected outside the U.S. are available to belicensed.) Number available for licensing (numerical only please):
4

Percent
Copyright only
Copyleft only
Patented only
Copyrighted and patented
6. Estimate the approximate percentage distribution of the kinds of intellectual property protectionapplied to software products available for licensing:
Number of products licensedNumber of times (on average for
those products) each product waslicensed
Number of “seats per license” (onaverage for those licenses, if this
metric applies)
FY15
FY16
FY17
FY18
FY19
7. Estimate how many custom-developed computer software products were licensed and the averagenumber of times each product was licensed in each fiscal year:
FY15 ($)
FY16 ($)
FY17 ($)
FY18 ($)
FY19 ($)
8. Estimate the annual total dollar amount of revenues generated by software licenses:** Total revenues should include at least license issue royalties, minimum annual royalties, earned royalties, sub-licensing royalties, and benchmark royalties but not
unreimbursed expense royalties. The latter will be included as part of licensing costs.
Annual revenue (nominal dollars):
5
FY15
FY16
FY17
FY18
FY19
9. How many custom-developed computer software products were available for download to thepublic without a license*?*Such public release software includes software released to the general public or other federal agencies without copyright or copyleft restrictions, and software
released to the general public or other federal agencies for non-commercial use (exclusive of open source).
Percent
Percent released as opensource
Percent released to thegeneral public or otheragencies for non-commercial use(exclusive of opensource)
Percent released togeneral public withoutcopyright or copyleftrestrictions
Percent released underother conditions
10. To the best of your knowledge, for FY15-FY19 as a whole, estimate the percentage distribution ofthe software products available from your laboratory/laboratories (or laboratory facility/facilities)across the following categories:
6
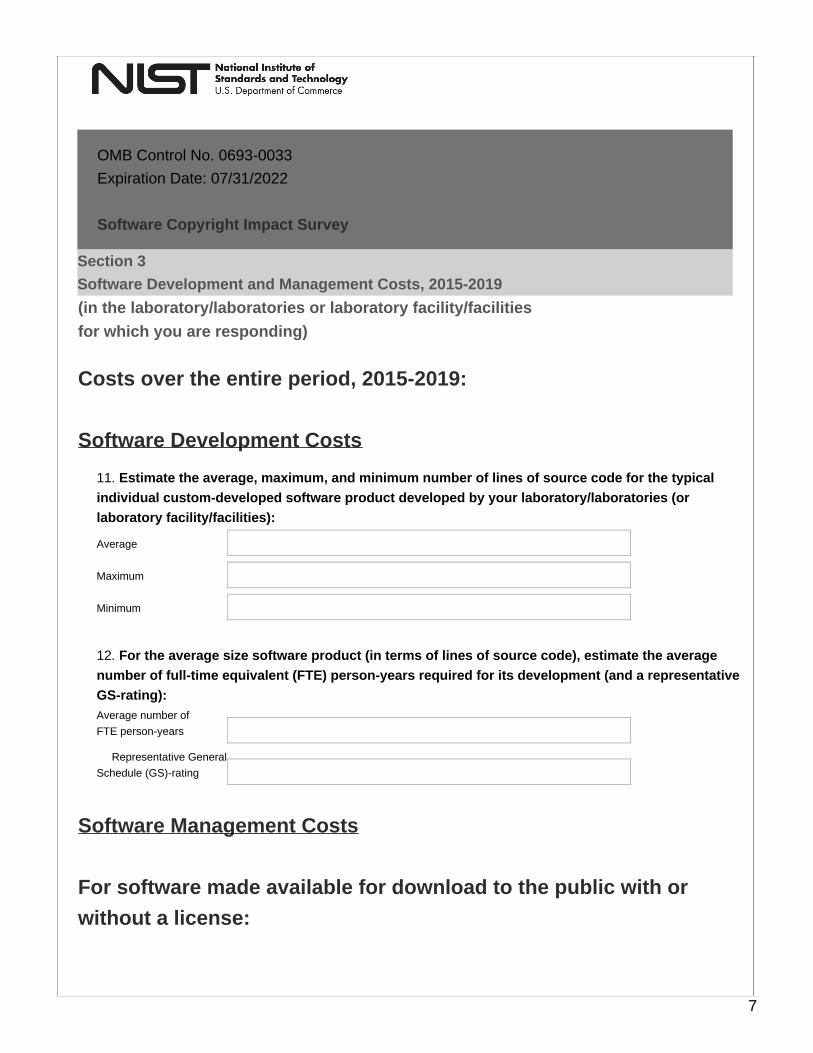
Section 3Software Development and Management Costs, 2015-2019
OMB Control No. 0693-0033Expiration Date: 07/31/2022
Software Copyright Impact Survey
(in the laboratory/laboratories or laboratory facility/facilities for which you are responding)
Costs over the entire period, 2015-2019: Software Development Costs
Average
Maximum
Minimum
11. Estimate the average, maximum, and minimum number of lines of source code for the typicalindividual custom-developed software product developed by your laboratory/laboratories (orlaboratory facility/facilities):
Average number ofFTE person-years
Representative GeneralSchedule (GS)-rating
12. For the average size software product (in terms of lines of source code), estimate the averagenumber of full-time equivalent (FTE) person-years required for its development (and a representativeGS-rating):
Software Management Costs For software made available for download to the public with orwithout a license:
7

Average annualFTE person-years writingsupporting software
Representative GeneralSchedule (GS)-rating
Average annualFTE person-yearsadministering softwareinventory
Representative GeneralSchedule (GS)-rating
13. Over and above the cost of developing software that is released to the general public with orwithout a license, is there a significant annual cost to maintaining this software in terms of writingadditional software or managing and administering the inventory once released? If so, please provideestimates of the average annual number of full-time equivalent (FTE) person-years required and arepresentative GS-rating:
With reference to licensed software
Average annual numberof FTE person-years
Representative GeneralSchedule (GS)-rating
14. Internal to the laboratory/laboratories or facility/facilities for which you are responding, what is theaverage annual number of full-time equivalent (FTE) person-years (and representative GS-rating)dedicated to obtaining and maintaining intellectual property protection, and managing the licensingtransactions for your software portfolio?
Average annual cost ofannuity fees ($)
15. For the laboratory/laboratories or facility/facilities for which you are responding, estimate theaverage annual annuity fees (paid to maintain all issued patents) required to maintain your softwareportfolio:
Average annual cost ofexternal legal support ($)
16. External to the laboratory/laboratories or facility/facilities for which you are responding, what isthe average annual cost of the legal support required for obtaining and maintaining intellectualproperty protection, and managing the licensing transactions, for your laboratory’s software portfolio(including, if known, unreimbursed expense royalties)?** External legal costs include all annual expenses paid to private sector law firms in support of the agency’s portfolio of software patents and copyrights.
8

Section 4Counterfactual Software Copyright License & Public Release Activity 2020-2024
OMB Control No. 0693-0033Expiration Date: 07/31/2022
Software Copyright Impact Survey
(in the laboratory/laboratories or laboratory facility/facilities for which you are responding)
Assuming Elimination of the Copyright Prohibition for Government Works
We would be grateful for your experience-based forecast of the 2020-2024 period assuming thecopyright prohibition for government-produced software is eliminated.
5-year annual average fornumber of productsavailable for licensing
17. Assuming the elimination of the copyright prohibition for government works, estimate the averageannual number of custom-developed software products that will be available for licensing:
5-year annual average forthe number of softwareproducts
5-year annual average fornumber of times eachproduct is expected to belicensed
5-year annual average ofthe number of “seats perlicense” (if this metricapplies)
18. Assuming the elimination of the copyright prohibition for government works, estimate the averageannual number (and frequency) of custom-developed software products that will be licensed:
9

Percent
Percent patented but notcopyrighted
Percent copyrighted butnot patented
Percent patented ©righted
Percent copyrighted asopen source
Percent released to thegeneral public or otheragencies for non-commercial use(exclusive of opensource)
Percent released togeneral public withoutcopyright or copyleftrestrictions
Percent classified orexport controlled
19. If the copyright prohibition for government works was eliminated, estimate the distribution ofcustom-developed software products across the following software release categories: (Note that withthe prohibition eliminated, software inventions could be covered by both copyrights and patents.)
Compared to the 2015-2019 period:
Average annual growth (%)
Average annual decline(%)
Remain the same (enterthe number 0)
20. Do you anticipate the average number of source lines of code for individual custom-developedsoftware products available for licensing will grow, decline, or stay roughly the same? (Please chooseone response and enter the %.)
10

Inflation-adjusted averageannual growth (%)
Inflation-adjusted averageannual decline (%)
Remain the same (enterthe number 0)
Please provide a generalrationale for your estimate.
21. Do you expect the average annual dollar amount of revenues generated per licensed softwareproduct (i.e., after removing the effects of inflation and thus using dollars of constant value) to grow,decline, or remain roughly the same? (Please choose one of the first three responses and enter the %.Then provide your rationale in the fourth response area.)
Please click "Done" when you are ready to submit your responses.
You Have Completed the Survey.Thank You!
11
Related Documents