The information in this preliminary prospectus is not complete and may be changed. We may not sell these securities until the registration statement filed with the Securities and Exchange Commission is effective. This preliminary prospectus is not an offer to sell these securities and it is not soliciting an offer to buy these securities in any jurisdiction where the offer or sale is not permitted. Prospectus (Subject to Completion) Dated April 4, 2014 44,736,842 Shares Sabre Corporation Common Stock This is our initial public offering, and no public market currently exists for our common stock. Sabre Corporation is offering 44,736,842 shares of common stock. After this offering, we will be a “controlled company” within the meaning of the NASDAQ rules. Prior to this offering, there has been no public market for our common stock. The initial public offering price of the common stock is expected to be between $18.00 and $20.00 per share. We have applied to list our common stock on the NASDAQ Stock Market under the symbol “SABR.” Investing in our common stock involves a high degree of risk. See “Risk Factors” beginning on page 22. Price $ A Share Per Share Total Initial public offering price ............................................... $ $ Underwriting discounts (1) ................................................. $ $ Proceeds to us (before expenses) ............................................. $ $ (1) See “Underwriting (Conflicts of Interest)” on page 267 for additional information regarding underwriter compensation. We have granted the underwriters an option to purchase up to an additional 6,710,526 shares of common stock at the offering price less the underwriting discount. The underwriters can exercise this right at any time and from time to time, in whole or in part, within 30 days after the offering. Delivery of the shares of common stock will be made on or about , 2014. Neither the Securities and Exchange Commission nor any state securities commission has approved or disapproved these securities or determined if this prospectus is truthful or complete. Any representation to the contrary is a criminal offense. MORGAN STANLEY GOLDMAN, SACHS & CO. BofA MERRILL LYNCH DEUTSCHE BANK SECURITIES Evercore Jefferies TPG Capital BD, LLC Cowen and Company Sanford C. Bernstein William Blair Mizuho Securities Natixis The Williams Capital Group, L.P. The date of this prospectus is , 2014.

Welcome message from author
This document is posted to help you gain knowledge. Please leave a comment to let me know what you think about it! Share it to your friends and learn new things together.
Transcript
The
info
rmat
ion
inth
ispr
elim
inar
ypr
ospe
ctus
isno
tcom
plet
ean
dm
aybe
chan
ged.
We
may
nots
ellt
hese
secu
ritie
sun
tilth
ere
gist
ratio
nst
atem
entf
iled
with
the
Secu
ritie
san
dEx
chan
geCo
mm
issi
onis
effe
ctiv
e.Th
ispr
elim
inar
ypr
ospe
ctus
isno
tan
offe
rto
sell
thes
ese
curit
ies
and
itis
nots
olic
iting
anof
fert
obu
yth
ese
secu
ritie
sin
any
juris
dict
ion
whe
reth
eof
fero
rsal
eis
not
perm
itted
.Prospectus (Subject to Completion)Dated April 4, 2014
44,736,842 Shares
Sabre CorporationCommon Stock
This is our initial public offering, and no public market currently exists for our common stock. Sabre Corporationis offering 44,736,842 shares of common stock. After this offering, we will be a “controlled company” within themeaning of the NASDAQ rules.
Prior to this offering, there has been no public market for our common stock. The initial public offering price of thecommon stock is expected to be between $18.00 and $20.00 per share. We have applied to list our common stockon the NASDAQ Stock Market under the symbol “SABR.”
Investing in our common stock involves a high degree of risk. See “Risk Factors”beginning on page 22.
Price $ A Share
Per Share Total
Initial public offering price . . . . . . . . . . . . . . . . . . . . . . . . . . . . . . . . . . . . . . . . . . . . . . . $ $Underwriting discounts(1) . . . . . . . . . . . . . . . . . . . . . . . . . . . . . . . . . . . . . . . . . . . . . . . . . $ $Proceeds to us (before expenses) . . . . . . . . . . . . . . . . . . . . . . . . . . . . . . . . . . . . . . . . . . . . . $ $
(1) See “Underwriting (Conflicts of Interest)” on page 267 for additional information regardingunderwriter compensation.
We have granted the underwriters an option to purchase up to an additional 6,710,526 shares of common stockat the offering price less the underwriting discount. The underwriters can exercise this right at any time and fromtime to time, in whole or in part, within 30 days after the offering.
Delivery of the shares of common stock will be made on or about , 2014.
Neither the Securities and Exchange Commission nor any state securities commission has approved ordisapproved these securities or determined if this prospectus is truthful or complete. Any representation tothe contrary is a criminal offense.
MORGANSTANLEY GOLDMAN, SACHS&CO. BofAMERRILLLYNCH DEUTSCHEBANKSECURITIES
Evercore Jefferies TPG Capital BD, LLC
Cowen and Company Sanford C. Bernstein William Blair
Mizuho Securities Natixis TheWilliams Capital Group, L.P.
The date of this prospectus is , 2014.

TABLE OF CONTENTS
Prospectus Page
Summary . . . . . . . . . . . . . . . . . . . . . . . . . . . . . . 1Risk Factors . . . . . . . . . . . . . . . . . . . . . . . . . . . 22Cautionary Note Regarding Forward-LookingStatements . . . . . . . . . . . . . . . . . . . . . . . . . . . 56
Method of Calculation . . . . . . . . . . . . . . . . . . . 59Trademarks and Trade Names . . . . . . . . . . . . . 60Non-GAAP Financial Measures . . . . . . . . . . . . 61Market and Industry Data and Forecasts . . . . . 62Use of Proceeds . . . . . . . . . . . . . . . . . . . . . . . . 63Dividend Policy . . . . . . . . . . . . . . . . . . . . . . . . 65Capitalization . . . . . . . . . . . . . . . . . . . . . . . . . . 66Dilution . . . . . . . . . . . . . . . . . . . . . . . . . . . . . . . 69Selected Historical Consolidated FinancialData . . . . . . . . . . . . . . . . . . . . . . . . . . . . . . . . 72
Management’s Discussion and Analysis ofFinancial Condition and Results ofOperations . . . . . . . . . . . . . . . . . . . . . . . . . . . 78
Prospectus Page
Industry . . . . . . . . . . . . . . . . . . . . . . . . . . . . . . . 129Business . . . . . . . . . . . . . . . . . . . . . . . . . . . . . . 138Management and Board of Directors . . . . . . . . 184Compensation Discussion and Analysis . . . . . . 192Principal Stockholders . . . . . . . . . . . . . . . . . . . 239Certain Relationships and Related PartyTransactions . . . . . . . . . . . . . . . . . . . . . . . . . 242
Description of Capital Stock . . . . . . . . . . . . . . . 248Description of Certain Indebtedness . . . . . . . . . 254Shares Eligible for Future Sale . . . . . . . . . . . . . 260Material U.S. Federal Income and Estate TaxConsiderations to Non-U.S. Holders . . . . . . 264
Underwriting (Conflicts of Interest) . . . . . . . . 267Legal Matters . . . . . . . . . . . . . . . . . . . . . . . . . . 276Experts . . . . . . . . . . . . . . . . . . . . . . . . . . . . . . . 277Where You Can Find More Information . . . . . 278Index to Consolidated Financial Statements . . F-1
We are responsible for the information contained in this prospectus and in any related free-writingprospectus we may prepare or authorize to be delivered to you. We have not authorized anyone to give youany other information, and we take no responsibility for any other information that others may give you.We are not, and the underwriters are not, making an offer of these securities in any jurisdiction where theoffer is not permitted. You should not assume that the information contained in this prospectus is accurateas of any date other than the date on the front of this prospectus, regardless of the time of delivery of thisprospectus or any sale of our common stock.
The information contained on our website or that can be accessed through our website will not bedeemed to be incorporated into this prospectus or the registration statement of which this prospectusforms a part, and investors should not rely on any such information in deciding whether to purchase ourcommon stock.
i

[THIS PAGE INTENTIONALLY LEFT BLANK]

SUMMARY
This summary highlights information contained elsewhere in this prospectus. It may not contain all theinformation that may be important to you. You should read the entire prospectus carefully, including the sectionentitled “Risk Factors” and our financial statements and the related notes included elsewhere in this prospectusbefore making an investment decision to purchase shares of our common stock.
In this prospectus, unless we indicate otherwise or the context requires, references to the “company,”“Sabre,” “we,” “our,” “ours” and “us” refer to Sabre Corporation and its consolidated subsidiaries,references to “Sabre GLBL” refer to Sabre GLBL Inc., formerly known as Sabre Inc., references to “TPG” referto TPG Global, LLC and its affiliates, references to the “TPG Funds” refer to one or more of TPG Partners IV,L.P. (“TPG Partners IV”), TPG Partners V, L.P. (“TPG Partners V”), TPG FOF V-A, L.P. (“TPG FOF V-A”)and TPG FOF V-B, L.P. (“TPG FOF V-B”), references to “Silver Lake” refer to Silver Lake ManagementCompany, L.L.C. and its affiliates and references to “Silver Lake Funds” refer to either or both of Silver LakePartners II, L.P. and Silver Lake Technology Investors II, L.P. In the context of our Travel Network business,references to “travel buyers” refer to buyers of travel, such as online and offline travel agencies, travelmanagement companies (“TMCs”) and corporate travel departments, and references to “travel suppliers” referto suppliers of travel services such as airlines, hotels, car rental brands, rail carriers, cruise lines and touroperators. The following summary is qualified in its entirety by the more detailed information and consolidatedfinancial statements and notes thereto included elsewhere in this prospectus.
Our Company
We are a leading technology solutions provider to the global travel and tourism industry. We span the breadth of ahighly complex $6.6 trillion global travel ecosystem, providing key software and services to a broad range of travelsuppliers and travel buyers. Through our Travel Network business, we process hundreds of millions of transactionsannually, connecting the world’s leading travel suppliers, including airlines, hotels, car rental brands, rail carriers,cruise lines and tour operators, with travel buyers in a comprehensive travel marketplace. We offer efficient, globaldistribution of travel content from approximately 125,000 travel suppliers to approximately 400,000 online and offlinetravel agents. To those agents, we offer a platform to shop, price, book and ticket comprehensive travel content in atransparent and efficient workflow. We also offer value-added solutions that enable our customers to better manageand analyze their businesses. Through our airline solutions business (“Airline Solutions”) and hospitality solutionsbusiness (“Hospitality Solutions” and, together with Airline Solutions, “Airline and Hospitality Solutions”), we offertravel suppliers an extensive suite of leading software solutions, ranging from airline and hotel reservations systems tohigh-value marketing and operations solutions, such as planning airline crew schedules, re-accommodating passengersduring irregular flight operations and managing day-to-day hotel operations. These solutions allow our customers tomarket, distribute and sell their products more efficiently, manage their core operations, and deliver an enhanced travelexperience. Through our complementary Travel Network and Airline and Hospitality Solutions businesses, we believewe offer the broadest, end-to-end portfolio of technology solutions to the travel industry.
Our portfolio of technology solutions has enabled us to become the leading end-to-end technology provider inthe travel industry. For example, we are one of the largest global distribution systems (“GDSs”) providers in theworld, with a 36% share of GDS-processed air bookings in 2013. More specifically, we are the #1 GDS provider inNorth America and also in higher growth markets such as Latin America and Asia Pacific (“APAC”), in each casebased on GDS-processed air bookings in 2013. In those three markets, our GDS-processed air bookings share wasapproximately 50% on a combined basis in 2013. In our Airline and Hospitality Solutions business, we believe wehave the most comprehensive portfolio of solutions. In 2013, we had the largest third-party hospitality CentralReservation System (“CRS”) room share based on our approximately 27% share of third-party hospitality CRShotel rooms distributed through our GDS, and, according to T2RL’s Market for Airline Passenger ServicesSystems-2013 (“T2RL PSS”) data for 2012, we had the second largest airline reservations system globally. We alsobelieve that we have the leading portfolio of airline marketing and operations products across the solutions that we
1
provide. In addition, we operate Travelocity, one of the world’s most recognizable brands in the online consumertravel e-commerce industry, which provides us with business insights into our broader customer base.
Through our solutions, which span the breadth of the travel ecosystem, we have developed deep domainexpertise. Our success is built on this expertise, combined with our significant technology investment and focuson innovation. This foundation has enabled us to develop highly scalable and technology-rich solutions thatdirectly address the key opportunities and challenges facing our customers. For example, we have invested toscale our GDS platform to meet massive transaction processing requirements. In 2013, our systems processedover $100 billion of estimated travel spending and more than 1.1 trillion system messages, with nearly 100,000system messages per second at peak times. Our investment in innovation has enabled our Travel Networkbusiness to evolve into a dynamic marketplace providing a broad range of highly scalable solutions fromdistribution to workflow to business intelligence. Our investment in our Airline and Hospitality Solutionsofferings has allowed us to create a broad portfolio of value-added products for our travel supplier customers,ranging from reservations platforms to operations solutions typically delivered via highly scalable and flexiblesoftware-as-a-service (“SaaS”) and hosted platforms. We have a long history of engineering innovative traveltechnology solutions. For example, we believe we were the first GDS to enable airlines to sell ancillary productslike premium seats through the GDS, the first third-party provider to automate passenger reaccommodationduring large operational disruptions and the first GDS to launch a business-to-business (“B2B”) app marketplacefor our travel agency customers that allows them to customize and augment our Travel Network platform. Ourinnovation has been consistently recognized in the market, with awards including the Business TravelerInnovation Award from the Global Business Travel Association, an unaffiliated entity, in 2011 and 2012, forwhich we applied and were one of eight award winners chosen by popular vote. We were also recognized by theInformationWeek 500 in 2013 as one of the Most Innovative Users of Business Technology for the eleventhconsecutive year. These 500 companies are invited to apply and are chosen by InformationWeek, an unaffiliatedentity, based on their unconventional approaches and new ways of solving complex business problems with IT.
Our SaaS and hosted technology platforms allow us to serve our customers primarily through a recurring,transaction-based revenue model based primarily on travel events such as air segments booked, passengers boarded(“PBs”) or other relevant metrics. For the year ended December 31, 2013, 91% of our Travel Network and Airlineand Hospitality Solutions revenue, on a weighted average basis, was Recurring Revenue. See “Method ofCalculation” for a description of Recurring Revenue. This model has benefits for both our customers and for us. Forour customers, our delivery model allows otherwise fixed technology investments to be variable, providingflexibility in their cost base and smoothing investment cycles as they grow, while enabling them to benefit from thecontinuous evolution of our platform. For us, this recurring, transaction-based revenue model allows us to expandwith our customers in the travel industry, a segment of the economy which has grown significantly faster thanglobal GDP over the last 40 years. Since our revenues are primarily linked to our customers’ transaction volumes,rather than to airline budget cycles or cyclical end-customer pricing, which we believe are more volatile thantransaction volumes, this model facilitates greater stability in our business, particularly during negative economiccycles. In addition, as a technology solutions and transaction processing company, we do not take airline, hotel orother inventory risk, nor are we directly exposed to fuel price volatility or labor unions.
Our recurring, transaction-based revenue model, combined with our high-quality products, reinvestment inour technology, multi-year customer contracts and disciplined operational management, has contributed to ourstrong growth profile, as demonstrated by our Adjusted EBITDA having increased each year since 2008 despitethe global economic downturn and resulting travel slowdown. From 2009 through 2013, we grew our revenueand Adjusted EBITDA at 7% and 11% compound annual growth rates (“CAGRs”), respectively, and increasedAdjusted EBITDA margins by 394 basis points (“bps”), in each case, excluding Travelocity and intersegmenteliminations. During the same period, net loss attributable to Sabre Corporation decreased 37% and net lossmargin decreased by 258 bps. See “Non-GAAP Financial Measures” and “—Summary Consolidated FinancialData” for additional information regarding Adjusted EBITDA, including a reconciliation of Adjusted EBITDA tothe most directly comparable GAAP measure.
2
Our Business
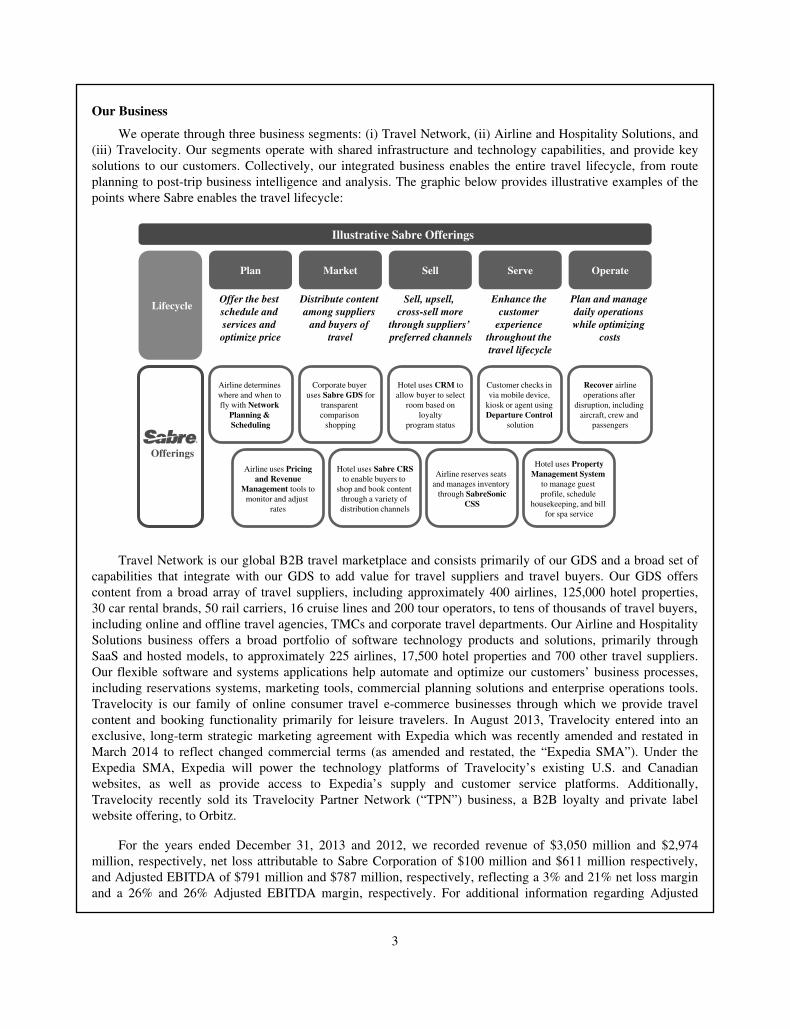
We operate through three business segments: (i) Travel Network, (ii) Airline and Hospitality Solutions, and(iii) Travelocity. Our segments operate with shared infrastructure and technology capabilities, and provide keysolutions to our customers. Collectively, our integrated business enables the entire travel lifecycle, from routeplanning to post-trip business intelligence and analysis. The graphic below provides illustrative examples of thepoints where Sabre enables the travel lifecycle:
Illustrative Sabre Offerings
Airline uses Pricingand Revenue
Management tools tomonitor and adjust
rates
Airline reserves seats and manages inventory
through SabreSonicCSS
Hotel uses PropertyManagement System
to manage guest profile, schedule
housekeeping, and bill for spa service
Offer the best schedule and services and optimize price
Sell, upsell, cross-sell more
through suppliers’ preferred channels
Enhance the customer
experience throughout the travel lifecycle
Plan and manage daily operations while optimizing
costs
Distribute content among suppliers
and buyers of travel
Airline determines where and when to fly with Network
Planning & Scheduling
Recover airlineoperations after
disruption, including aircraft, crew and
passengers
Corporate buyer uses Sabre GDS for
transparentcomparison
shopping
Hotel uses CRM toallow buyer to select
room based onloyalty
program status
Customer checks in via mobile device,
kiosk or agent using Departure Control
solution
Hotel uses Sabre CRSto enable buyers to
shop and book content through a variety of distribution channels
Lifecycle
Offerings
Plan Market Sell Serve Operate
Travel Network is our global B2B travel marketplace and consists primarily of our GDS and a broad set ofcapabilities that integrate with our GDS to add value for travel suppliers and travel buyers. Our GDS offerscontent from a broad array of travel suppliers, including approximately 400 airlines, 125,000 hotel properties,30 car rental brands, 50 rail carriers, 16 cruise lines and 200 tour operators, to tens of thousands of travel buyers,including online and offline travel agencies, TMCs and corporate travel departments. Our Airline and HospitalitySolutions business offers a broad portfolio of software technology products and solutions, primarily throughSaaS and hosted models, to approximately 225 airlines, 17,500 hotel properties and 700 other travel suppliers.Our flexible software and systems applications help automate and optimize our customers’ business processes,including reservations systems, marketing tools, commercial planning solutions and enterprise operations tools.Travelocity is our family of online consumer travel e-commerce businesses through which we provide travelcontent and booking functionality primarily for leisure travelers. In August 2013, Travelocity entered into anexclusive, long-term strategic marketing agreement with Expedia which was recently amended and restated inMarch 2014 to reflect changed commercial terms (as amended and restated, the “Expedia SMA”). Under theExpedia SMA, Expedia will power the technology platforms of Travelocity’s existing U.S. and Canadianwebsites, as well as provide access to Expedia’s supply and customer service platforms. Additionally,Travelocity recently sold its Travelocity Partner Network (“TPN”) business, a B2B loyalty and private labelwebsite offering, to Orbitz.
For the years ended December 31, 2013 and 2012, we recorded revenue of $3,050 million and $2,974million, respectively, net loss attributable to Sabre Corporation of $100 million and $611 million respectively,and Adjusted EBITDA of $791 million and $787 million, respectively, reflecting a 3% and 21% net loss marginand a 26% and 26% Adjusted EBITDA margin, respectively. For additional information regarding Adjusted
3
EBITDA, including a reconciliation of Adjusted EBITDA to the most directly comparable GAAP measure, see“Non-GAAP Financial Measures” and “—Summary Consolidated Financial Data.” For the year endedDecember 31, 2013, Travel Network contributed 58%, Airline and Hospitality Solutions contributed 23%, andTravelocity contributed 19% of our revenue (excluding intersegment eliminations). During this period, shares ofAdjusted EBITDA for Travel Network, Airline and Hospitality Solutions, and Travelocity were approximately77%, 21% and 2%, respectively (excluding corporate overhead allocations such as finance, legal, humanresources and certain information technology shared services).
Our Industry
The travel and tourism industry is one of the world’s largest industry segments, contributing $6.6 trillion toglobal GDP in 2012, according to the World Travel & Tourism Council’s Economic Impact of Travel & Tourism2013 (“WTTC”). The industry encompasses travel suppliers, including airlines, hotels, car rental brands, railcarriers, cruise lines and tour operators around the world, as well as travel buyers, including online and offlinetravel agencies, TMCs and corporate travel departments.
The travel and tourism industry has been a growing area of the broader economy. For example, based on 40years of data from the IATA Monthly Traffic Analysis Archives (“IATA Traffic”), air traffic has historicallygrown at an average rate of approximately 1.5x the rate of global GDP growth. Going forward, EuromonitorInternational Passport Travel and Tourism Database (“Euromonitor Database”) expects a 4% CAGR in air traveland hotel spending from 2013 to 2017, with air traffic in developing markets such as APAC, Latin America andthe Middle East expected to grow at even faster rates of 6%, 6% and 7%, respectively, from 2012 to 2032,according to Airbus Global Market Forecast 2013-2032 (“Airbus”). In addition to growth in emerginggeographies, hybrid carriers and low-cost carriers (“LCCs”, and collectively, “LCC/hybrids”) have continued togrow, with LCCs’ share of global air travel volume expected to increase from 17% of revenue passengerkilometers in 2012 to 21% of revenue passenger kilometers by 2032, according to Airbus.
Technology is integral to that growth, enabling the operation of the modern travel ecosystem by poweringthe industry lifecycle from distribution to operations. With the increasing complexity created by the large,fragmented and global nature of the travel industry, reliance on technology will only increase. That reliancedrove technology spending by the air transportation and hospitality industries to $60 billion in 2013, withexpenditures expected to exceed $70 billion in 2017, according to Gartner Enterprise IT Spending by VerticalIndustry Market, Worldwide, 2011-2017 (“Gartner Enterprise”). Some recent trends in the travel industry whichwe expect to further technology innovation and spending include:
Outsourcing: Historically, technology solutions were built in-house by travel suppliers and travelbuyers. As complexity and the pace of innovation have increased, third-party providers have emerged tooffer more cost-effective and advanced solutions. Additionally, the travel technology industry has shifted toa more flexible and scalable technology delivery model including SaaS and hosted implementations thatallow for shared development, reduced deployment costs, increased scalability and a “pay-as-you-go” costmodel.
Airline Ancillary Revenue: The sale of ancillary products is now a major source of revenue for manyairlines worldwide, and has grown to comprise as much as 20% of total revenues for some carriers and morethan $36 billion in the aggregate across the travel industry in 2012, according to CarTrawler WorldwideEstimate of Ancillary Revenue (“IdeaWorks”). Enabling the sale of ancillary products is technologicallycomplex and requires coordinated changes to multiple interdependent systems including reservationsplatforms, inventory systems, point of sale locations, revenue accounting, merchandising, shopping,analytics and other systems. Technology providers such as Sabre have already significantly enhanced theirsystems to provide these capabilities and we expect these providers to take further advantage of thissignificant opportunity going forward.
4

Mobile: Mobile platforms have created new ways for customers to research, book and experiencetravel, and are expected to account for over 30% of online travel sales by 2017, according toEuromonitor International World Travel Market Global Trends Report 2013 (“Euromonitor Report”).Accordingly, travel suppliers, including airlines and hospitality providers, are upgrading their systemsto allow for delivery of services via mobile platforms from booking to check-in to travel management.According to SITA’s 2013 Air Transport Industry Insights: The Airline IT Trends Survey (“SITASurvey”), 97% of airlines are investing in mobile channels with the intention of increasing mobileaccess across the entire travel experience. This mobile trend also extends to the use of tablets andwireless connectivity by the airline workforce, such as automating cabin crew services and providingflight crews with electronic flight bags. Travel technology companies like Sabre are enabling andbenefitting from this trend as travel suppliers upgrade their systems and travel buyers look for newsources of client connectivity.
Personalization: Concurrently with the rise of ancillary products and mobile devices as a customerservice tool, travel suppliers have an opportunity to provide increased personalization across the customertravel experience, from seat selection and on-board entertainment to loyalty program management andmobile concierge services. Data-driven business intelligence products can help travel companies useavailable customer data to identify the types of products, add-ons and upgrades customers are more likely topurchase and market these products effectively to various customer segments according to their needs andpreferences. In addition to providing the technology platform to facilitate these services, we believetechnology providers like Sabre can leverage their data-rich platforms and travel technology domainexpertise to offer analytics and business intelligence to support travel suppliers in delivering morepersonalized service offerings.
Increasing Use of Data and Analytics: The use of data has always been an asset in the travel industry.Airlines were pioneers in the use of data to optimize seat pricing, crew scheduling and flight routing.Similarly, hotels employed data to manage room inventory and optimize pricing. The travel industry wasalso one of the first to capitalize on the value of customer data by developing products such as customerloyalty programs. Historically, this data has largely been transaction-based, such as booking reservations,recording account balances, and tracking points in loyalty programs. Today, analytics-driven businessintelligence products are evolving to further and better utilize available data to help travel companies makedecisions, serve customers, optimize their operations and analyze their competitive landscape. Technologyproviders like Sabre have developed and continue to develop large-scale, data-rich platforms that includethese business intelligence and data analytics tools that can identify new business opportunities and global,integrated and high-value solutions for travel suppliers.
Our Competitive Strengths
We believe the following attributes differentiate us from our competitors and have enabled us to become aleading technology solutions provider to the global travel industry.
Broadest Portfolio of Leading Technology Solutions in the Travel Industry
We offer the broadest, most comprehensive technology solutions portfolio available to the travel industryfrom a single provider, and our solutions are key to the operations of many of our travel supplier and travelagency customers. Travel Network, for example, provides a key technology platform that enables efficientshopping, booking and management of travel itineraries for online and offline travel agencies, TMCs andcorporate travel departments. In addition to offering these and other advanced functionalities, it is a valuabledistribution and merchandising channel for travel suppliers to market to a broad array of customers, particularlyoutside their home countries and regions. Additionally, we provide SaaS and hosted solutions that run many ofthe most important operations systems for our travel supplier customers, such as airline and hotel reservationssystems, revenue management, crew scheduling and flight operations. We believe that our Travel Network and
5

Airline and Hospitality Solutions offerings address customer needs across the entire travel lifecycle, and that weare the only company that provides such a broad portfolio of technology solutions to the travel industry. Thisbreadth affords us significant competitive advantages including the ability to leverage shared infrastructure, acommon technology organization and product development. Beyond scale and efficiency, our position spanningthe breadth of the travel ecosystem helps us to develop deep domain expertise and to anticipate the needs of ourcustomers. Taken together, the value, quality, and breadth of our technology, software and related customerservices contribute to our strong competitive position.
Global Leadership Across Growing End Markets
We operate in areas of the global travel industry that have large and growing addressable customer bases.Each of our businesses is a leader in its respective area. Sabre is the leading GDS provider in North America,Latin America, and APAC, with 55%, 57%, and 39% share of GDS-processed air bookings, respectively, in2013. Additionally, Airline Solutions is the second largest provider of reservations systems, with an 18% globalshare of 2012 PBs, according to T2RL PSS. We believe that we have the leading portfolio of airline marketingand operations products across the solutions that we provide. We also believe our Hospitality Solutions businessis the leader in hotel reservations, handling 27% of third-party hospitality CRS hotel rooms through our GDS in2013. See “Method of Calculation” for an explanation of the methodology underlying our GDS-processed airbookings share and third-party hospitality CRS hotel room share calculations.
Looking forward, we expect to benefit from attractive growth in our end markets. Euromonitor expects a 4%CAGR in air travel and hotel spending from 2013 to 2017. Gartner, Inc. (“Gartner”) expects technology spendingby the air transportation and hospitality sectors to grow significantly from $60 billion in 2013 to over $70 billionin 2017. Within our Travel Network business, we also expect our presence in economies with strong GDP growthand regions with faster air traffic growth, such as APAC, Latin America and the Middle East and Africa(“MEA”), will further contribute to the growth of our businesses. Similarly, our Airline Solutions reservationsproducts customers are weighted toward faster-growing LCC/hybrids, which represented approximately 45% ofour 2012 PBs.
Innovative and Scalable Technology
Two pillars underpin our technology strategy: innovation and scalability. To drive innovation in our travelmarketplace business, we make significant investments in technology to develop new products and addincremental features and functionality, including advanced algorithms, decision support, data analysis and othervaluable intellectual property. This investment is supported by our global technology teams comprisingapproximately 4,000 employees and contractors. This scale and cross-business technology organization createsefficiency and a flexible environment that allows us to apply knowledge and resources across our broad productportfolio, which in turn fuels innovation. In addition, our investments in technology have created a highlyscalable set of solutions across our businesses. For example, we believe our GDS is one of the most heavilyutilized Service Oriented Architecture (“SOA”) environments in the world, processing more than 1.1 trillionsystem messages in 2013, with nearly 100,000 system messages per second at peak times. Our Airline andHospitality Solutions business employs highly reliable software technology products and SaaS and hostedinfrastructure. Compared to traditional in-house software installations, SaaS and hosted technology offers ourcustomers advantages in terms of cost savings, more robust functionality, increased flexibility and scale, andfaster upgrades. As an example of the SaaS and hosted scalability benefit, our delivery model has facilitated anincrease in the number of PBs in our Airline Solutions business from 288 million to 478 million from 2009 to2013. Our investments in technology maintain and extend our technology platform which has supported ourindustry-leading product innovation. On the scale at which we operate, we believe that the combination of anexpanding network and technology investments continues to create a significant competitive advantage for us.
6
Stable, Resilient, and Diversified Business Models
Travel Network and much of Airline and Hospitality Solutions operate with a transaction-based businessmodel that ties our revenue to a travel supplier’s transaction volumes rather than to its unit pricing for an airplaneticket, hotel room or other travel product. Travel-related businesses with volume-based revenue models havegenerally shown strong visibility, predictability and resilience across economic cycles because travel suppliershave historically sought to maintain traveler volumes by reducing prices in an economic downturn.
Our resilience is also partially attributable to our non-exclusive, multi-year contracts in our Travel Networkbusiness. For example, although most of our contracts have terms of one to three years, contracts with our majortravel buyer and travel supplier customers, which represent the majority of Travel Network revenue, have five toten year terms and three to five year terms, respectively. Similarly, our Airline Solutions business has contractsthat typically range from three to seven years in length, and our Hospitality Solutions business has contracts thattypically range from one to five years in length. Our Travel Network and Airline and Hospitality Solutionsbusinesses also deliver solutions that are integral components of our customers’ businesses and have historicallyremained in place once implemented. In our Travel Network business and our Airline and Hospitality Solutionsbusiness, 94% and 84% of our revenue was Recurring Revenue, respectively, in 2013.
In addition to being stable, our businesses are also diversified. Travel Network and Airline and HospitalitySolutions generate a broad geographic revenue mix, with a combined 43% of revenue generated outside theUnited States in 2013. None of our travel buyers or travel suppliers accounted for more than 10% of our revenuefor the years ended December 31, 2013 or 2012.
Strong, Long-Standing Customer Relationships
We have strong, long-standing customer relationships with both travel suppliers and travel buyers. Theserelationships have allowed us to gain a deep understanding of our customers’ needs, which positions us well tocontinue introducing new products and services that add value by helping our customers improve their businessperformance. In our Travel Network business, for example, by providing efficient and quality services, we havedeveloped and maintained strong customer relationships with TMCs, major corporate travel departments andtravel suppliers, with some of these relationships dating back over 20 years. Through our Travelocity business,we have gained important insights into what online travel companies need in order to best serve their customers,and we are able to leverage that knowledge to develop products and services to address those needs.
We believe that our strong value proposition is demonstrated by our ability to retain customers in a highlycompetitive marketplace. For each of the years ended December 31, 2013, 2012 and 2011, our CustomerRetention rate for Travel Network was 99%. For our Airline Solutions business, our Customer Retention rate was98%, 96% and 96% for the years ended December 31, 2013, 2012 and 2011 respectively, and our CustomerRetention rate for our Hospitality Solutions business was 96%, 96% and 98% for the same periods, respectively.See “Method of Calculation” for a description of Customer Retention.
Deep and Experienced Leadership Team with Informed Insight into the Travel Industry
Our management team is highly experienced, with comprehensive expertise in the travel and technologyindustries. Many of our leaders have more than 20 years of experience in multiple segments of the travel industryand have held positions in more than one of our businesses, which provides them with a holistic andinterdisciplinary perspective on our company and the travel industry.
By investing in training, skills development and rotation programs, we seek to develop leaders with broadknowledge of our company, the industry, technology, and specific customer needs. We also hire externally asneeded to bring in new expertise. Our blend of experience and new hires across our team provides a solidfoundation on which we develop new capabilities, new business models and new solutions to complex industryproblems.
7
Our Growth Strategy
We believe we are well-positioned for future growth. First, we expect the continued macroeconomic recoveryto generate travel growth, compounded by the continuing trend towards the outsourcing of travel technology. Inaddition, we are well-positioned in market segments which are growing faster than the overall travel industry, withleading market positions in our Travel Network business in Latin America and APAC. In our Airline Solutionsreservations systems, LCC/hybrids, which are growing traffic faster than traditional airlines, accounted forapproximately 45% of our PBs in 2012. Supported by these industry trends, we believe both our Travel Networkand our Airline and Hospitality Solutions businesses have significant opportunities to expand their customer bases,further penetrate existing customers, extend their geographic footprint and develop new products. By executing onthe following strategies and, when appropriate, selective strategically aligned acquisitions, we intend to capitalizeon these positive trends:
Leverage our Industry-Leading Technology Platforms
We have made significant investments in our technology platforms and infrastructure to develop robust,scalable software as well as SaaS and hosted solutions. We plan to continue leveraging these investments acrossour organization, particularly in our Travel Network and Airline and Hospitality Solutions businesses, to catalyzeproduct innovation and speed-to-market. We will also continue to shift toward SaaS and hosted infrastructure andsolutions as we further develop our product portfolio.
Expand our Global Travel Marketplace Leadership
Travel Network intends to remain the global B2B travel marketplace of choice for travel suppliers and travelbuyers by executing on the following initiatives:
• Targeting Geographic Expansion: From 2009 to 2013, we increased our GDS-processed air bookingsshare in the Middle East, Russia and Brazil by 744 bps, 327 bps and 267 bps, respectively. Wecurrently have initiatives in place across Europe, APAC and Latin America to further expand in thoseregions.
• Attracting and Enabling New Marketplace Content: We are actively adding new travel supplier contentwhich generates revenue directly through incremental booking volumes associated with the new contentand reinforces the virtuous cycle of our Travel Network business: as we add more supplier content to ourmarketplace, we experience increased participation from travel buyers, which, in turn, encourages travelsuppliers to contribute additional content to our marketplace. We have been successful in convertingnotable carriers that previously only used direct distribution, such as JetBlue and Norwegian, to join ourGDS, and we believe there is a similar opportunity to increase the participation of less-penetrated contenttypes like hotel properties, where we estimate that only approximately one-third participate in a GDS. Inaddition to attracting new supplier content, we aim to expand the content available for sale from existingtravel suppliers, including ancillary revenue—a category of airline revenue worth more than $36 billion inthe aggregate across the travel industry in 2012, according to IdeaWorks. We seek additionalopportunities to capitalize on this trend, such as by supporting our airline customers’ branded fareinitiatives.
• Continuing to Invest in Innovative Products and Capabilities: The development of cutting-edgeproducts and capabilities has been critical to our success. We plan to continue to invest significantresources in solutions that address key customer needs, including mobility (e.g., TripCase), dataanalytics and business intelligence (e.g., Sabre Dev Studio, Hotel Heatmaps, Contract OptimizationServices), and workflow optimization (e.g., Sabre Red App Centre, TruTrip).
8

Drive Continued Airline and Hospitality Solutions Growth and Innovation
Our Airline and Hospitality Solutions business has been a key growth engine for us, increasing both revenueand Adjusted EBITDA by 72% from 2009 to 2013. We believe Airline and Hospitality Solutions will continue todrive company growth through a combination of underlying customer and market growth, as well as through thefollowing strategic growth initiatives:
• Invest in Innovative Airline Products and Capabilities: We have a long history of investment ininnovation. For example, we believe we were the first technology solutions provider to provide real-time revenue integrity and the first third-party provider to automate passenger reaccommodation duringlarge operational disruptions. We see a continued opportunity to innovate in areas such as retailingsolutions, mobile capabilities, data analytics and business intelligence offerings.
• Continue to Add New Airline Reservations Customers: Over the last four years, we have added airlinecustomers representing over 110 million annual PBs from many innovative, fast-growing airlines suchas Etihad Airways, Virgin Australia, JetBlue and LAN. Although the number of new reservationsopportunities varies materially by year, in 2013, T2RL estimated that contracts representing over1.3 billion PBs will come up for renewal between 2014 to 2017, of which over 1.1 billion PBs are fromairlines who do not pay us PB fees today. As of this filing, airlines won but not yet implemented bySabre boarded over 220 million PBs in 2012, according to T2RL. This includes a long-term agreementannounced in January 2014 with American Airlines for Sabre to be its reservations system providerfollowing its merger with US Airways.
• Further Penetrate Existing Airline Solutions Customers: We believe there is an opportunity to sell more ofour extensive solution set to our existing customers. Of our 2013 customers in T2RL’s top 100 passengerairlines, 35% had one or two non-reservations solution sets, 36% had three to five and 29% had more thanfive. Historically, the average revenue would have approximately tripled if a customer moved from thefirst category to the second, and nearly tripled again if a customer moved to the third category.Leveraging our brand, we intend to continue to promote the adoption of our products within and acrossour existing customers.
• Invest Behind Rapidly Growing Hospitality Solutions Business: Our Hospitality Solutions business hasgrown rapidly, with 19% revenue CAGR from 2009 to 2013, and we are focused on continuing that growthgoing forward. We currently have initiatives to grow in our existing footprint and expand our presence inAPAC and in Europe, the Middle East and Africa (“EMEA”), which collectively accounted for only 32%of our Hospitality Solutions business revenue in 2013. We plan to accomplish this through a combinationof cross-selling additional products to our existing customers, expanding our global reseller network andenhancing our product offering.
Continue to Focus on Operational Efficiency Supported by Leading Technology
As an organization, we have a track record of improving operational efficiency and capitalizing on our scalabletechnology platform and operating leverage in our business model. We have expanded Adjusted EBITDA marginsby over 550 bps since 2009 in our Travel Network business while growing the business and introducing newproducts. We intend to continue to increase our operational efficiency by following a shared capabilities, technologyand insights approach across our businesses. For example, through the Expedia SMA, we intend to reduce directcosts associated with Travelocity and expect to improve our Adjusted EBITDA by providing our customers with thebenefit of Expedia’s long-term investment in its technology platform to increase conversion, improve operationalefficiency, and shift our focus to Travelocity’s strengths in marketing and retailing. Additionally, Travelocityrecently sold its TPN business, a B2B loyalty and private label website offering, to Orbitz. We will continue to worktoward identifying operational and technological efficiencies while continuing to support our investments andstrategic priorities to maintain our leadership position in the travel industry.
9

Summary of Risks
Significant risks that could materially and adversely affect our business, financial condition and results ofoperations include:
• factors affecting transaction volumes in the global travel industry, particularly air travel transactionvolumes, including global and regional economic and political conditions, financial instability orfundamental corporate changes to travel suppliers, natural or man-made disasters, safety concerns orchanges to regulations governing the travel industry;
• our ability to renew existing contracts or to enter into new contracts with travel supplier and buyercustomers, third-party distributor partners and joint ventures on economically favorable terms or at all;
• our Travel Network business’ exposure to pricing pressures from travel suppliers and its dependenceon relationships with several large travel buyers;
• the fact that travel supplier customers may experience financial instability, consolidate with one another,pursue cost reductions, change their distribution model or experience other changes adverse to us;
• travel suppliers’ use of alternative distribution models, such as direct distribution channels,technological incompatibilities between suppliers’ travel content and our GDS, and the diversion ofconsumer traffic to other channels;
• our reliance on third-party distributors and joint ventures to extend GDS services to certain regions,which exposes us to risks associated with lack of direct management control and potential conflicts ofinterest;
• competition in the travel distribution market from other GDS providers, direct distribution by travelsuppliers and new entrants or technologies that could challenge the existing GDS business model;maintaining and growing our Airline and Hospitality Solutions business could be negatively impactedby competition from other third-party solutions providers and from new participants entering thesolutions market;
• risks associated with implementing the Expedia SMA and the fact that the benefits anticipated by theparties to the Expedia SMA may not materialize;
• availability and performance of information technology services provided by third parties, such as HP,which manages a significant portion of our systems;
• systems and infrastructure failures or other unscheduled shutdowns or disruptions, including those dueto natural disasters or cybersecurity attacks;
• the fact that we qualify as a “controlled company” within the meaning of the NASDAQ Stock Market(the “NASDAQ”) rules and, therefore we also qualify to be exempt from certain corporate governancerequirements, which means that our stockholders may not have the same protections afforded tostockholders of companies that are subject to such requirements;
• the fact that our Principal Stockholders (as defined below) will, following the completion of theoffering, retain significant influence over us and key decisions about our business, with approximately80% of our voting power to be held by our affiliates following the completion of the offering, whichmay prevent new investors from influencing significant corporate decisions and result in conflicts ofinterest; and
• our significant amount of long-term indebtedness and the related restrictive covenants in theagreements governing our indebtedness.
See “Risk Factors” beginning on page 22 for additional risks that could impact our business.
10
Concurrent Transactions
Redemption of Preferred Stock
Prior to the closing of this offering, we will exercise our right to redeem (the “Redemption”) all of ourSeries A Preferred Stock (the “Series A Preferred Stock”). The redemption price will be paid with a mix of cashand stock, which we will deliver pro rata to the holders thereof concurrently with the closing of this offering.Assuming we sell the total number of shares set forth on the cover of this prospectus at an initial public offeringprice equal to the midpoint of the price range on the cover of this prospectus, we will deliver an estimatedaggregate of $235 million in cash and 21,470,518 shares of our common stock in payment of the relatedredemption price plus accumulated but unpaid dividends as of March 31, 2014 (the “Redemption Payment”). A$1.00 increase in the estimated net proceeds of this offering would increase the aggregate cash component of theRedemption Payment by $1.00 and decrease the common stock component by 0.053 shares, which represents avalue of $1.00 based on the assumed offering price. Conversely, a $1.00 decrease in the estimated net proceedsof this offering would cause us to decrease the aggregate cash component of the Redemption Payment by $1.00and to increase the common stock component by 0.053 shares, which represents a value of $1.00 based on theassumed offering price. In all cases, the common stock delivered in the Redemption will be valued at the actualinitial public offering price and will also reflect shares of our common stock to be issued in satisfaction ofdividends that accrue on or after April 1, 2014 and to, but excluding, the closing date of this offering.
The Redemption of the Series A Preferred Stock will simplify our capital structure by leaving only one classof capital stock – our common stock – outstanding following the closing of this offering. For more information,see “Description of Capital Stock—Series A Preferred Stock.”
Tax Receivable Agreement
Immediately prior to the completion of this offering, we will enter into a tax receivable agreement (“TRA”)that provides the right to receive future payments from us to certain of our stockholders and equity award holdersthat are our stockholders and equity award holders, respectively, prior to the completion of this offering(collectively, the “Existing Stockholders”) of 85% of the amount of cash savings, if any, in U.S. federal incometax that we and our subsidiaries realize as a result of the utilization of certain tax assets attributable to periodsprior to our initial public offering, including federal net operating losses, capital losses and the ability to realizetax amortization of certain intangible assets (collectively, the “Pre-IPO Tax Assets”). Based on current tax lawsand assuming that we and our subsidiaries earn sufficient taxable income to realize the full tax benefits subject tothe TRA, (i) we expect that future payments under the TRA relating to the Pre-IPO Tax Assets could aggregateto between $330 million and $380 million over the next six years (assuming no changes to current limitations onour ability to utilize our net operating loss carryforwards (“NOLs”) under Section 382 of the Internal RevenueCode (the “Code”)), which we estimate will represent approximately 85% to 95% of the total payments we willbe required to make under the TRA and (ii) we do not expect material payments to occur before 2016. See“Certain Relationships and Related Party Transactions—Tax Receivable Agreement.”
Redemption of the Sabre GLBL 2019 Notes
We intend to use a portion of the net proceeds from this offering to redeem $320 million in aggregateprincipal amount of Sabre GLBL’s 8.5% senior secured notes due 2019 at a redemption price of 108.5% of theprincipal amount of the notes redeemed, plus accrued and unpaid interest to, but excluding, the date ofredemption. Substantially concurrent with the launch of this offering, Sabre GLBL will issue a notice ofredemption, pursuant to which we will effect such redemption on May 7, 2014 contingent on the consummationof this offering. In the event that consummation of this offering has not occurred on or prior to such date, SabreGLBL may extend such date one or more times to a date not later than 60 days after the date of
11

the redemption notice. After giving effect to this redemption, Sabre GLBL will have $480 million in aggregateprincipal amount of our 2019 Notes outstanding. See “Description of Other Indebtedness” for a description of the8.5% senior secured notes due 2019.
Corporate and Other Information
Sabre Holdings Corporation is a Delaware corporation formed in 1996. It was operated as a division ofAMR Corporation, its parent company, until it was spun off completely in 2000. Sabre Corporation is a Delawarecorporation formed in December 2006 and is the parent company of Sabre Holdings Corporation and SabreGLBL. Prior to our acquisition in 2007 by the Principal Stockholders (as defined below), we were previously apublicly-held travel technology company. We are headquartered in Southlake, Texas, and employ approximately10,000 people in approximately 60 countries around the world. We serve our customers through cutting-edgetechnology developed in six facilities located across four continents.
Our principal executive offices are located at 3150 Sabre Drive, Southlake, TX 76092, and our telephonenumber is (682) 605-1000. Our corporate website address is www.sabre.com. The information contained on ourwebsite or that can be accessed through our website will not be deemed to be incorporated into this prospectus orthe registration statement of which this prospectus forms a part, and investors should not rely on any suchinformation in deciding whether to purchase our common stock.
Principal Stockholders
Our Relationship with the TPG Funds and Silver Lake Funds
We are currently privately held as a result of our acquisition in 2007 by the TPG Funds and the Silver LakeFunds. On March 30, 2007, we entered into a Stockholders’ Agreement by and among the TPG Funds, the SilverLake Funds, Sovereign Co-Invest, LLC (“Sovereign Co-Invest,” an entity co-managed by TPG and Silver Lake,and together with the TPG Funds and the Silver Lake Funds, the “Principal Stockholders”), and SabreCorporation (formerly known as Sovereign Holdings, Inc.), which will be amended and restated in connectionwith the completion of this offering (as amended and restated, the “Stockholders’ Agreement”). See “CertainRelationships and Related Party Transactions—Stockholders’ Agreement.”
Following the completion of this offering, the Principal Stockholders will own approximately 79% of ourcommon stock, or 77% if the underwriters’ option to purchase additional shares is fully exercised. The TPGFunds, the Silver Lake Funds and the Sovereign Co-Invest will own approximately 37%, 23% and 19%,respectively, of our common stock, or 36%, 22% and 19%, respectively, if the underwriters’ option to purchaseadditional shares is fully exercised. As a result, we expect to be a “controlled company” within the meaning ofthe corporate governance requirements of the NASDAQ on which we have applied to list our shares of commonstock. See “Risk Factors—Risks Related to the Offering and Our Common Stock—We expect to be a “controlledcompany” within the meaning of the NASDAQ rules and, as a result, we will qualify for exemptions from certaincorporate governance requirements. You may not have the same protections afforded to stockholders ofcompanies that are subject to such requirements.”
TPG
TPG is a leading global private investment firm founded in 1992 with over $59 billion of assets undermanagement as of December 31 2013, as adjusted for commitments accepted on January 2, 2014 and offices inSan Francisco, Fort Worth, Austin, Beijing, Chongqing, Hong Kong, London, Luxembourg, Melbourne,Moscow, Mumbai, New York, Paris, São Paulo, Shanghai, Singapore and Tokyo. TPG has extensive experiencewith global public and private investments executed through leveraged buyouts, recapitalizations, spinouts,
12
growth investments, joint ventures and restructurings. The firm’s investments span a variety of industries,including financial services, travel and entertainment, technology, energy, industrials, retail, consumer, realestate, media and communications, and healthcare. For more information please visit www.tpg.com.
Silver Lake
Silver Lake is a global investment firm focused on the technology, technology-enabled and related growthindustries with offices in Silicon Valley, New York, London, Hong Kong, Shanghai and Tokyo. Silver Lake wasfounded in 1999 and has over $20 billion in combined assets under management and committed capital across itslarge-cap private equity, middle-market private equity, growth equity and credit investment strategies.
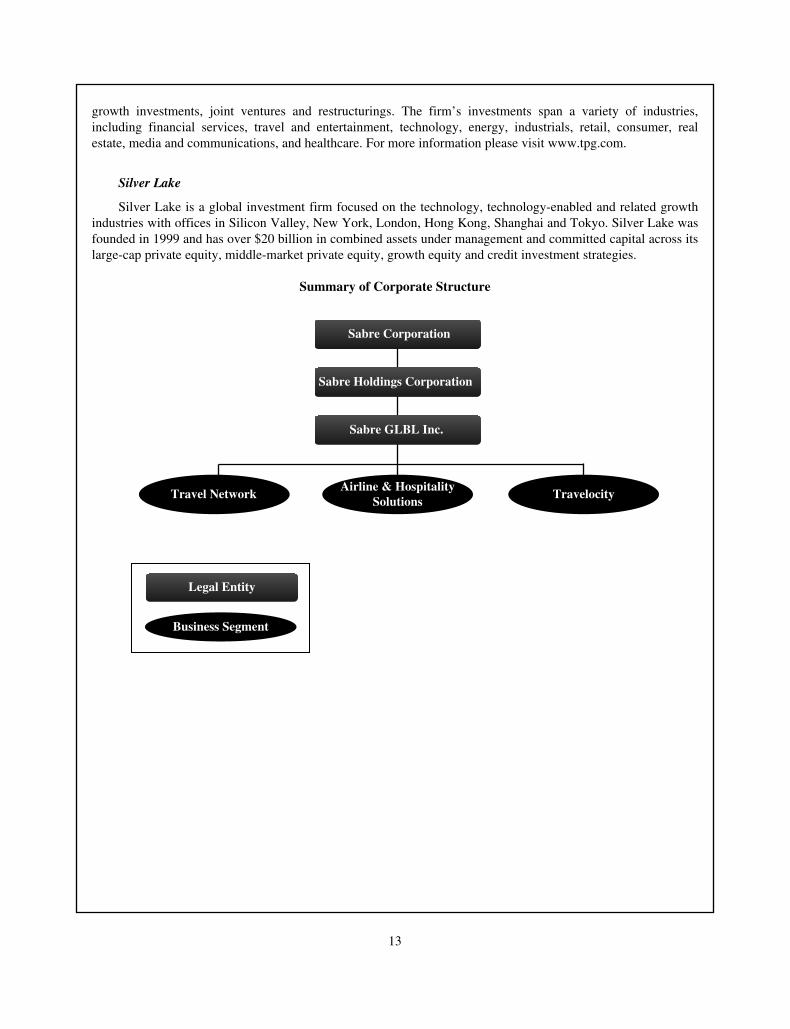
Summary of Corporate Structure
Sabre Corporation
Sabre Holdings Corporation
Sabre GLBL Inc.
Travel NetworkAirline & Hospitality
SolutionsTravelocity
Legal Entity
Business Segment
13
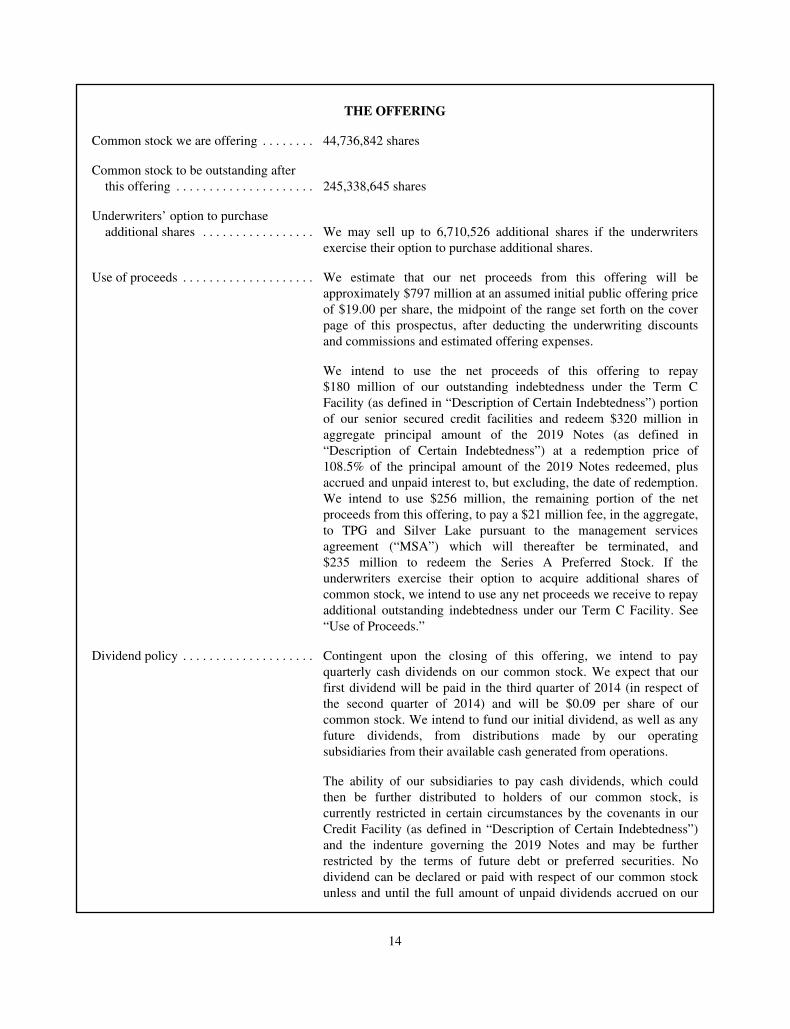
THE OFFERING
Common stock we are offering . . . . . . . . 44,736,842 shares
Common stock to be outstanding afterthis offering . . . . . . . . . . . . . . . . . . . . . 245,338,645 shares
Underwriters’ option to purchaseadditional shares . . . . . . . . . . . . . . . . . We may sell up to 6,710,526 additional shares if the underwriters
exercise their option to purchase additional shares.
Use of proceeds . . . . . . . . . . . . . . . . . . . . We estimate that our net proceeds from this offering will beapproximately $797 million at an assumed initial public offering priceof $19.00 per share, the midpoint of the range set forth on the coverpage of this prospectus, after deducting the underwriting discountsand commissions and estimated offering expenses.
We intend to use the net proceeds of this offering to repay$180 million of our outstanding indebtedness under the Term CFacility (as defined in “Description of Certain Indebtedness”) portionof our senior secured credit facilities and redeem $320 million inaggregate principal amount of the 2019 Notes (as defined in“Description of Certain Indebtedness”) at a redemption price of108.5% of the principal amount of the 2019 Notes redeemed, plusaccrued and unpaid interest to, but excluding, the date of redemption.We intend to use $256 million, the remaining portion of the netproceeds from this offering, to pay a $21 million fee, in the aggregate,to TPG and Silver Lake pursuant to the management servicesagreement (“MSA”) which will thereafter be terminated, and$235 million to redeem the Series A Preferred Stock. If theunderwriters exercise their option to acquire additional shares ofcommon stock, we intend to use any net proceeds we receive to repayadditional outstanding indebtedness under our Term C Facility. See“Use of Proceeds.”
Dividend policy . . . . . . . . . . . . . . . . . . . . Contingent upon the closing of this offering, we intend to payquarterly cash dividends on our common stock. We expect that ourfirst dividend will be paid in the third quarter of 2014 (in respect ofthe second quarter of 2014) and will be $0.09 per share of ourcommon stock. We intend to fund our initial dividend, as well as anyfuture dividends, from distributions made by our operatingsubsidiaries from their available cash generated from operations.
The ability of our subsidiaries to pay cash dividends, which couldthen be further distributed to holders of our common stock, iscurrently restricted in certain circumstances by the covenants in ourCredit Facility (as defined in “Description of Certain Indebtedness”)and the indenture governing the 2019 Notes and may be furtherrestricted by the terms of future debt or preferred securities. Nodividend can be declared or paid with respect of our common stockunless and until the full amount of unpaid dividends accrued on our
14
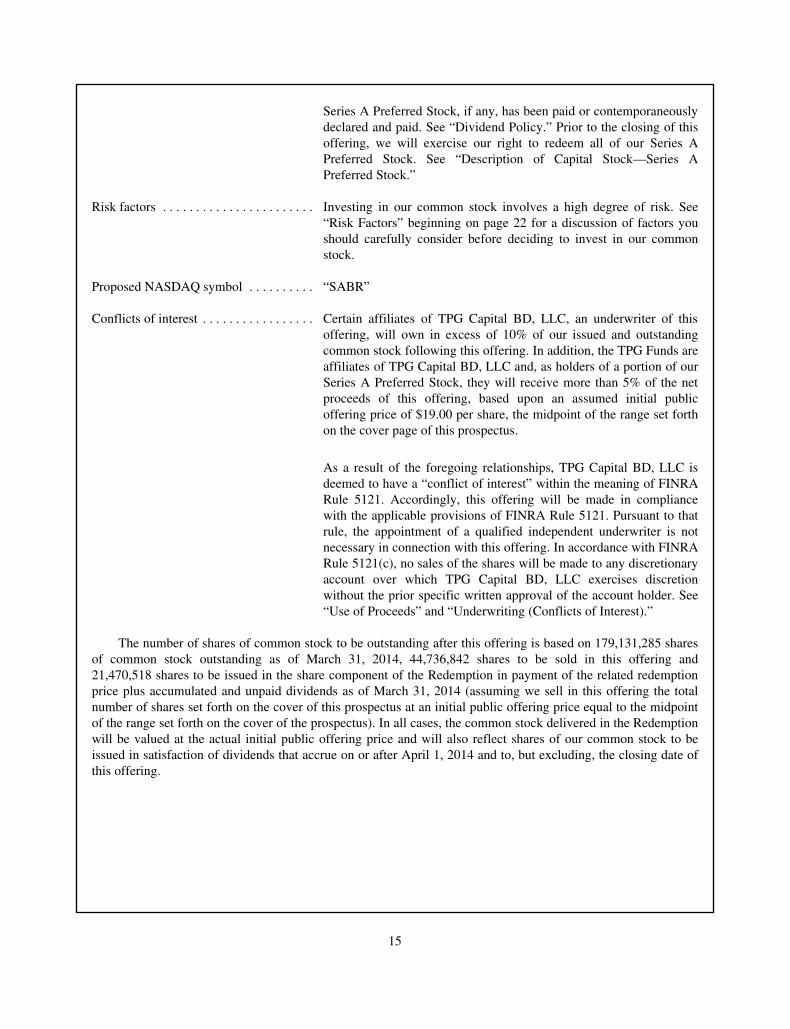
Series A Preferred Stock, if any, has been paid or contemporaneouslydeclared and paid. See “Dividend Policy.” Prior to the closing of thisoffering, we will exercise our right to redeem all of our Series APreferred Stock. See “Description of Capital Stock—Series APreferred Stock.”
Risk factors . . . . . . . . . . . . . . . . . . . . . . . Investing in our common stock involves a high degree of risk. See“Risk Factors” beginning on page 22 for a discussion of factors youshould carefully consider before deciding to invest in our commonstock.
Proposed NASDAQ symbol . . . . . . . . . . “SABR”
Conflicts of interest . . . . . . . . . . . . . . . . . Certain affiliates of TPG Capital BD, LLC, an underwriter of thisoffering, will own in excess of 10% of our issued and outstandingcommon stock following this offering. In addition, the TPG Funds areaffiliates of TPG Capital BD, LLC and, as holders of a portion of ourSeries A Preferred Stock, they will receive more than 5% of the netproceeds of this offering, based upon an assumed initial publicoffering price of $19.00 per share, the midpoint of the range set forthon the cover page of this prospectus.
As a result of the foregoing relationships, TPG Capital BD, LLC isdeemed to have a “conflict of interest” within the meaning of FINRARule 5121. Accordingly, this offering will be made in compliancewith the applicable provisions of FINRA Rule 5121. Pursuant to thatrule, the appointment of a qualified independent underwriter is notnecessary in connection with this offering. In accordance with FINRARule 5121(c), no sales of the shares will be made to any discretionaryaccount over which TPG Capital BD, LLC exercises discretionwithout the prior specific written approval of the account holder. See“Use of Proceeds” and “Underwriting (Conflicts of Interest).”
The number of shares of common stock to be outstanding after this offering is based on 179,131,285 sharesof common stock outstanding as of March 31, 2014, 44,736,842 shares to be sold in this offering and21,470,518 shares to be issued in the share component of the Redemption in payment of the related redemptionprice plus accumulated and unpaid dividends as of March 31, 2014 (assuming we sell in this offering the totalnumber of shares set forth on the cover of this prospectus at an initial public offering price equal to the midpointof the range set forth on the cover of the prospectus). In all cases, the common stock delivered in the Redemptionwill be valued at the actual initial public offering price and will also reflect shares of our common stock to beissued in satisfaction of dividends that accrue on or after April 1, 2014 and to, but excluding, the closing date ofthis offering.
15

The number of shares of common stock to be outstanding after this offering assumes no issuance of sharesof common stock reserved for issuance under our equity incentive plans. As of March 31, 2014, an aggregate of16,099,118 shares of common stock were reserved for future issuance under the Sabre Corporation 2014Omnibus Incentive Compensation Plan (the “2014 Omnibus Plan”) which includes 2,599,118 shares of commonstock that were available for future issuance under our prior equity plans. Additionally, the number of shares ofcommon stock to be outstanding after this offering assumes:
• no exercise of performance-based stock options outstanding under our Sovereign MEIP plan. As ofMarch 31, 2014 there were 724,337 performance-based stock options outstanding under this plan witha weighted average exercise price of $5.00;
• no exercise of time-based stock options outstanding under our Sovereign MEIP plan. As of March 31,2014 there were 15,352,970 time-based stock options outstanding under this plan with a weightedaverage exercise price of $4.80;
• no exercise of time-based stock options outstanding under our Sovereign 2012 MEIP plan. As ofMarch 31, 2014 there were 4,200,683 time-based stock options outstanding under this plan with aweighted average exercise price of $11.31;
• no vesting and settlement of the 960,151 performance-based restricted stock units unvested andoutstanding as of March 31, 2014 under our Sovereign 2012 MEIP plan;
• no vesting and settlement of time-based restricted stock units outstanding as of March 31, 2014 underthe Sovereign RSU Agreement, with a value equal to $520,000;
• no vesting and settlement of the 140,000 restricted stock unit award, unvested and outstanding as ofMarch 31, 2014; and
• no exercise of time-based stock options or Tandem SARs under our TVL.com SOA or TravelocityEquity 2012 plans, respectively. It is expected that these plans will be terminated in connection andconcurrent with this offering and all awards under these plans will be cancelled.
In addition, except as otherwise noted, all information in this prospectus assumes the underwriters do notexercise their option to purchase additional shares.
16
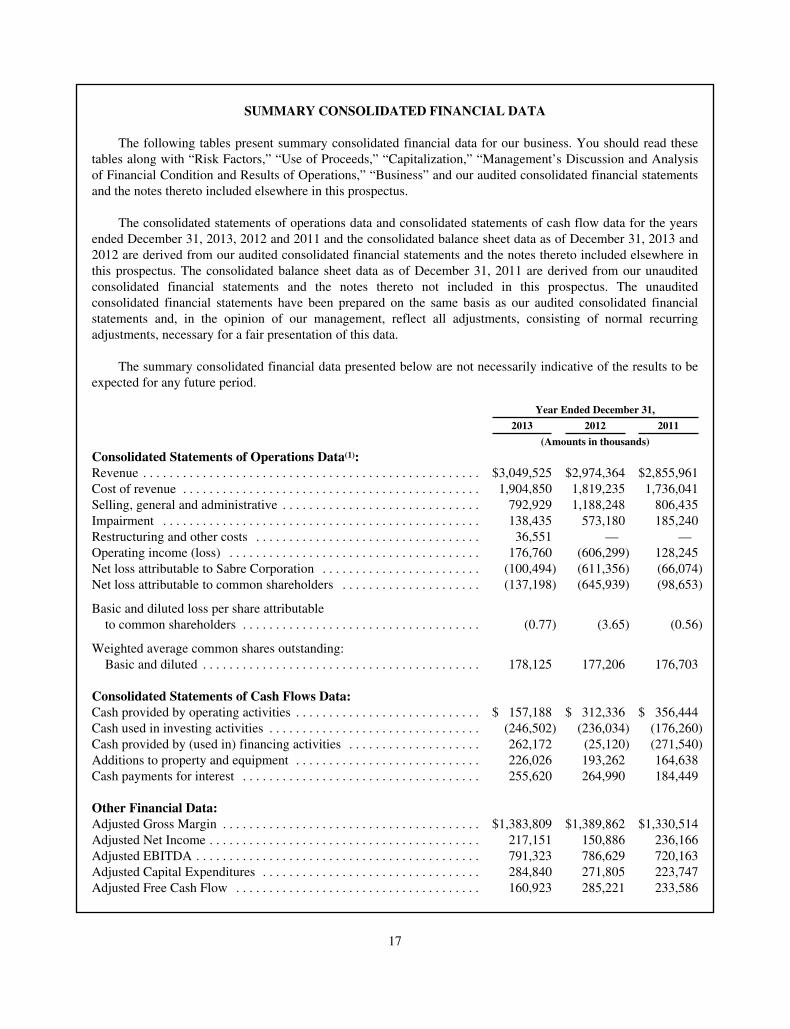
SUMMARY CONSOLIDATED FINANCIAL DATA
The following tables present summary consolidated financial data for our business. You should read thesetables along with “Risk Factors,” “Use of Proceeds,” “Capitalization,” “Management’s Discussion and Analysisof Financial Condition and Results of Operations,” “Business” and our audited consolidated financial statementsand the notes thereto included elsewhere in this prospectus.
The consolidated statements of operations data and consolidated statements of cash flow data for the yearsended December 31, 2013, 2012 and 2011 and the consolidated balance sheet data as of December 31, 2013 and2012 are derived from our audited consolidated financial statements and the notes thereto included elsewhere inthis prospectus. The consolidated balance sheet data as of December 31, 2011 are derived from our unauditedconsolidated financial statements and the notes thereto not included in this prospectus. The unauditedconsolidated financial statements have been prepared on the same basis as our audited consolidated financialstatements and, in the opinion of our management, reflect all adjustments, consisting of normal recurringadjustments, necessary for a fair presentation of this data.
The summary consolidated financial data presented below are not necessarily indicative of the results to beexpected for any future period.
Year Ended December 31,
2013 2012 2011
(Amounts in thousands)
Consolidated Statements of Operations Data(1):Revenue . . . . . . . . . . . . . . . . . . . . . . . . . . . . . . . . . . . . . . . . . . . . . . . . . . . $3,049,525 $2,974,364 $2,855,961Cost of revenue . . . . . . . . . . . . . . . . . . . . . . . . . . . . . . . . . . . . . . . . . . . . . 1,904,850 1,819,235 1,736,041Selling, general and administrative . . . . . . . . . . . . . . . . . . . . . . . . . . . . . . 792,929 1,188,248 806,435Impairment . . . . . . . . . . . . . . . . . . . . . . . . . . . . . . . . . . . . . . . . . . . . . . . . 138,435 573,180 185,240Restructuring and other costs . . . . . . . . . . . . . . . . . . . . . . . . . . . . . . . . . . 36,551 — —Operating income (loss) . . . . . . . . . . . . . . . . . . . . . . . . . . . . . . . . . . . . . . 176,760 (606,299) 128,245Net loss attributable to Sabre Corporation . . . . . . . . . . . . . . . . . . . . . . . . (100,494) (611,356) (66,074)Net loss attributable to common shareholders . . . . . . . . . . . . . . . . . . . . . (137,198) (645,939) (98,653)
Basic and diluted loss per share attributableto common shareholders . . . . . . . . . . . . . . . . . . . . . . . . . . . . . . . . . . . . (0.77) (3.65) (0.56)
Weighted average common shares outstanding:Basic and diluted . . . . . . . . . . . . . . . . . . . . . . . . . . . . . . . . . . . . . . . . . . 178,125 177,206 176,703
Consolidated Statements of Cash Flows Data:Cash provided by operating activities . . . . . . . . . . . . . . . . . . . . . . . . . . . . $ 157,188 $ 312,336 $ 356,444Cash used in investing activities . . . . . . . . . . . . . . . . . . . . . . . . . . . . . . . . (246,502) (236,034) (176,260)Cash provided by (used in) financing activities . . . . . . . . . . . . . . . . . . . . 262,172 (25,120) (271,540)Additions to property and equipment . . . . . . . . . . . . . . . . . . . . . . . . . . . . 226,026 193,262 164,638Cash payments for interest . . . . . . . . . . . . . . . . . . . . . . . . . . . . . . . . . . . . 255,620 264,990 184,449
Other Financial Data:Adjusted Gross Margin . . . . . . . . . . . . . . . . . . . . . . . . . . . . . . . . . . . . . . . $1,383,809 $1,389,862 $1,330,514Adjusted Net Income . . . . . . . . . . . . . . . . . . . . . . . . . . . . . . . . . . . . . . . . . 217,151 150,886 236,166Adjusted EBITDA . . . . . . . . . . . . . . . . . . . . . . . . . . . . . . . . . . . . . . . . . . . 791,323 786,629 720,163Adjusted Capital Expenditures . . . . . . . . . . . . . . . . . . . . . . . . . . . . . . . . . 284,840 271,805 223,747Adjusted Free Cash Flow . . . . . . . . . . . . . . . . . . . . . . . . . . . . . . . . . . . . . 160,923 285,221 233,586
17

As of December 31,
2013 2012 2011
(Amounts in thousands)
Consolidated Balance Sheet DataCash and cash equivalents . . . . . . . . . . . . . . . . . . . . . . . . . . . . . . . . . . . . . $ 308,236 $ 126,695 $ 58,350Total assets . . . . . . . . . . . . . . . . . . . . . . . . . . . . . . . . . . . . . . . . . . . . . . . . 4,755,708 4,711,245 5,252,780Long-term debt . . . . . . . . . . . . . . . . . . . . . . . . . . . . . . . . . . . . . . . . . . . . . 3,643,548 3,420,927 3,307,905Working capital deficit . . . . . . . . . . . . . . . . . . . . . . . . . . . . . . . . . . . . . . . (273,591) (428,569) (411,482)Redeemable preferred stock . . . . . . . . . . . . . . . . . . . . . . . . . . . . . . . . . . . 634,843 598,139 563,557Noncontrolling interest . . . . . . . . . . . . . . . . . . . . . . . . . . . . . . . . . . . . . . . 508 88 (18,693)Total stockholders’ equity (deficit) . . . . . . . . . . . . . . . . . . . . . . . . . . . . . . (952,536) (876,875) (196,919)
Key MetricsTravel Network
Direct Billable Bookings—Air . . . . . . . . . . . . . . . . . . . . . . . . . . . . . 314,275 326,175 328,200Direct Billable Bookings—Non-Air . . . . . . . . . . . . . . . . . . . . . . . . . 53,503 53,669 53,683Total Direct Billable Bookings . . . . . . . . . . . . . . . . . . . . . . . . . . . . . 367,778 379,844 381,883
Airline Solutions Passengers Boarded . . . . . . . . . . . . . . . . . . . . . . . . . . . 478,088 405,420 364,420
(1) Certain amounts previously reported in our December 31, 2012 and 2011 financial statements have beenreclassified to conform to the December 31, 2013 presentation. See Note 2, Summary of Significant AccountingPolicies—Reclassifications, to our audited consolidated financial statements included elsewhere in this prospectus.In June 2013, we sold certain assets of our Holiday Autos operations to a third party and in November 2013, wecompleted the closing of the remainder of the Holiday Autos operations such that it represented a discontinuedoperation. See Note 4, Discontinued Operations and Dispositions, to our audited consolidated financial statementsincluded elsewhere in this prospectus. The impact on our revenue was a reduction of $65 million and $76 millionfor the years ended December 31, 2012 and 2011, respectively. The impact on our operating income was anincrease of $12 million for the year ended December 31, 2012 and a reduction of less than $1 million for the yearended December 31, 2011.
Non-GAAP Measures
The following table sets forth the reconciliation of Adjusted Gross Margin to operating income (loss), themost directly comparable GAAP measure:
Year Ended December 31,
2013 2012 2011
(Amounts in thousands)
Operating income (loss) . . . . . . . . . . . . . . . . . . . . . . . . . . . . . . . . . . . . . . $ 176,760 $ (606,299) $ 128,245Add back:
Selling, general and administrative . . . . . . . . . . . . . . . . . . . . . . . . . . 792,929 1,188,248 806,435Impairment . . . . . . . . . . . . . . . . . . . . . . . . . . . . . . . . . . . . . . . . . . . . 138,435 573,180 185,240Restructuring charges . . . . . . . . . . . . . . . . . . . . . . . . . . . . . . . . . . . . 36,551 — —Depreciation and amortization in cost of revenue(3) . . . . . . . . . . . . . 202,485 198,206 172,846Amortization of upfront incentive consideration(8) . . . . . . . . . . . . . . 36,649 36,527 37,748
Adjusted gross margin . . . . . . . . . . . . . . . . . . . . . . . . . . . . . . . . . . . . . . . . $1,383,809 $1,389,862 $1,330,514
18
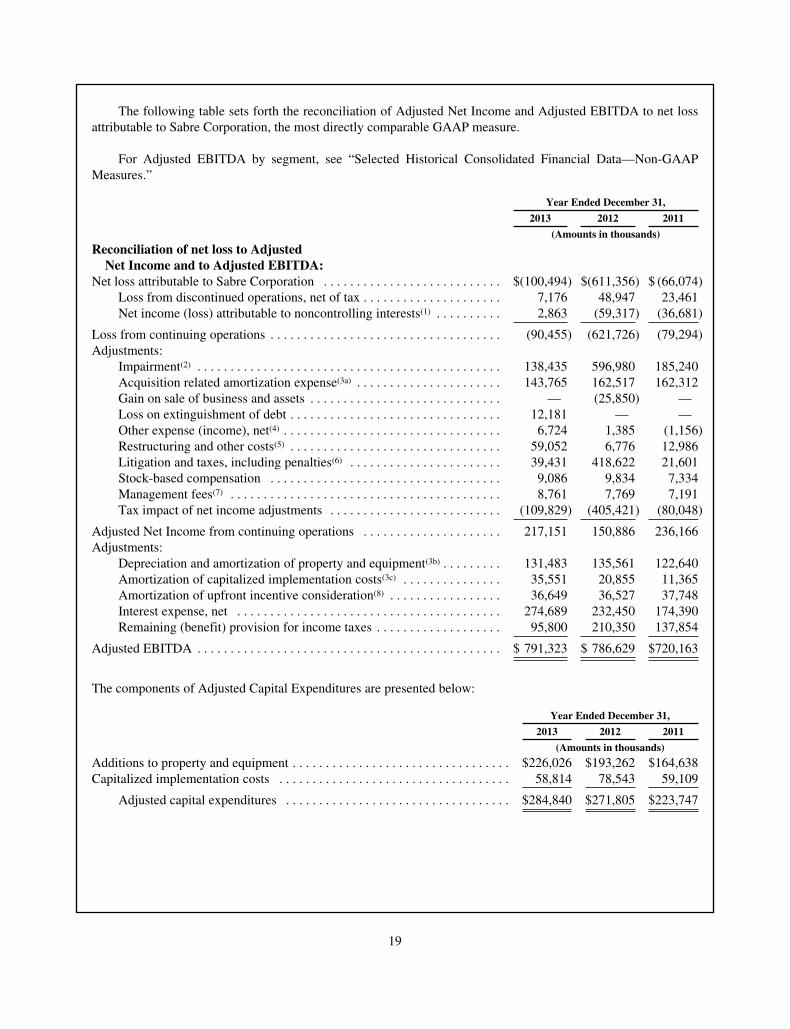
The following table sets forth the reconciliation of Adjusted Net Income and Adjusted EBITDA to net lossattributable to Sabre Corporation, the most directly comparable GAAP measure.
For Adjusted EBITDA by segment, see “Selected Historical Consolidated Financial Data—Non-GAAPMeasures.”
Year Ended December 31,
2013 2012 2011
(Amounts in thousands)
Reconciliation of net loss to AdjustedNet Income and to Adjusted EBITDA:
Net loss attributable to Sabre Corporation . . . . . . . . . . . . . . . . . . . . . . . . . . . $(100,494) $(611,356) $ (66,074)Loss from discontinued operations, net of tax . . . . . . . . . . . . . . . . . . . . . 7,176 48,947 23,461Net income (loss) attributable to noncontrolling interests(1) . . . . . . . . . . 2,863 (59,317) (36,681)
Loss from continuing operations . . . . . . . . . . . . . . . . . . . . . . . . . . . . . . . . . . . (90,455) (621,726) (79,294)Adjustments:
Impairment(2) . . . . . . . . . . . . . . . . . . . . . . . . . . . . . . . . . . . . . . . . . . . . . . 138,435 596,980 185,240Acquisition related amortization expense(3a) . . . . . . . . . . . . . . . . . . . . . . 143,765 162,517 162,312Gain on sale of business and assets . . . . . . . . . . . . . . . . . . . . . . . . . . . . . — (25,850) —Loss on extinguishment of debt . . . . . . . . . . . . . . . . . . . . . . . . . . . . . . . . 12,181 — —Other expense (income), net(4) . . . . . . . . . . . . . . . . . . . . . . . . . . . . . . . . . 6,724 1,385 (1,156)Restructuring and other costs(5) . . . . . . . . . . . . . . . . . . . . . . . . . . . . . . . . 59,052 6,776 12,986Litigation and taxes, including penalties(6) . . . . . . . . . . . . . . . . . . . . . . . 39,431 418,622 21,601Stock-based compensation . . . . . . . . . . . . . . . . . . . . . . . . . . . . . . . . . . . 9,086 9,834 7,334Management fees(7) . . . . . . . . . . . . . . . . . . . . . . . . . . . . . . . . . . . . . . . . . 8,761 7,769 7,191Tax impact of net income adjustments . . . . . . . . . . . . . . . . . . . . . . . . . . (109,829) (405,421) (80,048)
Adjusted Net Income from continuing operations . . . . . . . . . . . . . . . . . . . . . 217,151 150,886 236,166Adjustments:
Depreciation and amortization of property and equipment(3b) . . . . . . . . . 131,483 135,561 122,640Amortization of capitalized implementation costs(3c) . . . . . . . . . . . . . . . 35,551 20,855 11,365Amortization of upfront incentive consideration(8) . . . . . . . . . . . . . . . . . 36,649 36,527 37,748Interest expense, net . . . . . . . . . . . . . . . . . . . . . . . . . . . . . . . . . . . . . . . . 274,689 232,450 174,390Remaining (benefit) provision for income taxes . . . . . . . . . . . . . . . . . . . 95,800 210,350 137,854
Adjusted EBITDA . . . . . . . . . . . . . . . . . . . . . . . . . . . . . . . . . . . . . . . . . . . . . . $ 791,323 $ 786,629 $720,163
The components of Adjusted Capital Expenditures are presented below:
Year Ended December 31,
2013 2012 2011
(Amounts in thousands)
Additions to property and equipment . . . . . . . . . . . . . . . . . . . . . . . . . . . . . . . . . $226,026 $193,262 $164,638Capitalized implementation costs . . . . . . . . . . . . . . . . . . . . . . . . . . . . . . . . . . . 58,814 78,543 59,109
Adjusted capital expenditures . . . . . . . . . . . . . . . . . . . . . . . . . . . . . . . . . . $284,840 $271,805 $223,747
19
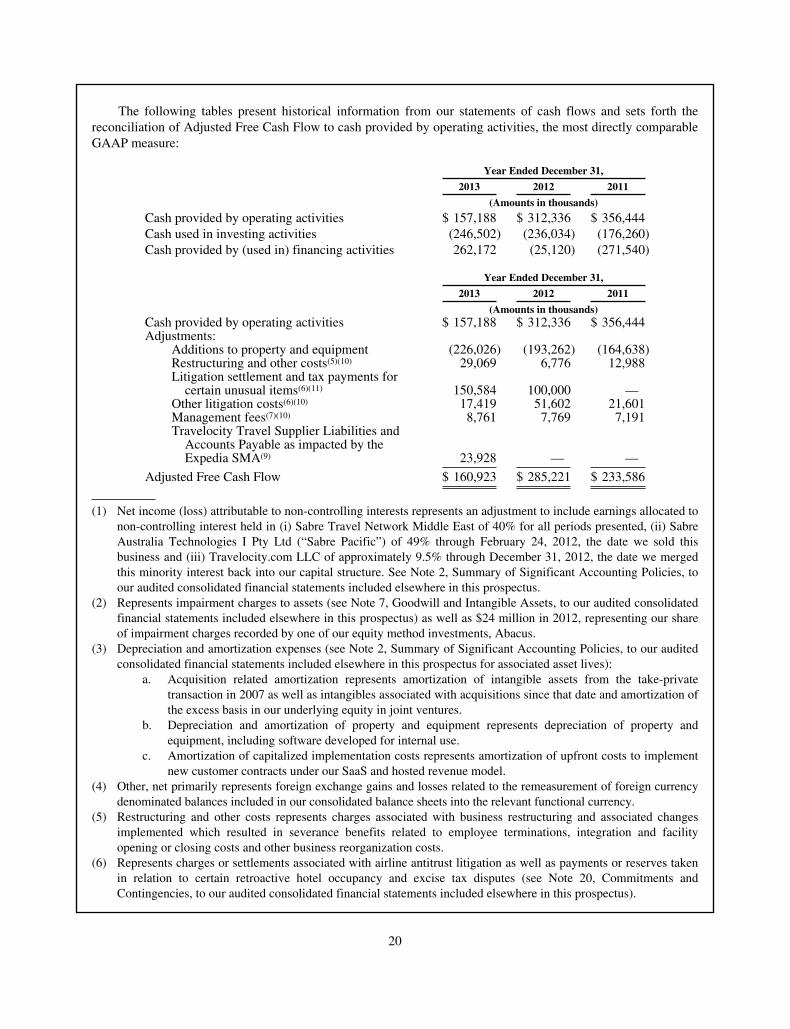
The following tables present historical information from our statements of cash flows and sets forth thereconciliation of Adjusted Free Cash Flow to cash provided by operating activities, the most directly comparableGAAP measure:
Year Ended December 31,
2013 2012 2011
(Amounts in thousands)
Cash provided by operating activities $ 157,188 $ 312,336 $ 356,444Cash used in investing activities (246,502) (236,034) (176,260)Cash provided by (used in) financing activities 262,172 (25,120) (271,540)
Year Ended December 31,
2013 2012 2011
(Amounts in thousands)Cash provided by operating activities $ 157,188 $ 312,336 $ 356,444Adjustments:
Additions to property and equipment (226,026) (193,262) (164,638)Restructuring and other costs(5)(10) 29,069 6,776 12,988Litigation settlement and tax payments forcertain unusual items(6)(11) 150,584 100,000 —
Other litigation costs(6)(10) 17,419 51,602 21,601Management fees(7)(10) 8,761 7,769 7,191Travelocity Travel Supplier Liabilities andAccounts Payable as impacted by theExpedia SMA(9) 23,928 — —
Adjusted Free Cash Flow $ 160,923 $ 285,221 $ 233,586
(1) Net income (loss) attributable to non-controlling interests represents an adjustment to include earnings allocated tonon-controlling interest held in (i) Sabre Travel Network Middle East of 40% for all periods presented, (ii) SabreAustralia Technologies I Pty Ltd (“Sabre Pacific”) of 49% through February 24, 2012, the date we sold thisbusiness and (iii) Travelocity.com LLC of approximately 9.5% through December 31, 2012, the date we mergedthis minority interest back into our capital structure. See Note 2, Summary of Significant Accounting Policies, toour audited consolidated financial statements included elsewhere in this prospectus.
(2) Represents impairment charges to assets (see Note 7, Goodwill and Intangible Assets, to our audited consolidatedfinancial statements included elsewhere in this prospectus) as well as $24 million in 2012, representing our shareof impairment charges recorded by one of our equity method investments, Abacus.
(3) Depreciation and amortization expenses (see Note 2, Summary of Significant Accounting Policies, to our auditedconsolidated financial statements included elsewhere in this prospectus for associated asset lives):
a. Acquisition related amortization represents amortization of intangible assets from the take-privatetransaction in 2007 as well as intangibles associated with acquisitions since that date and amortization ofthe excess basis in our underlying equity in joint ventures.
b. Depreciation and amortization of property and equipment represents depreciation of property andequipment, including software developed for internal use.
c. Amortization of capitalized implementation costs represents amortization of upfront costs to implementnew customer contracts under our SaaS and hosted revenue model.
(4) Other, net primarily represents foreign exchange gains and losses related to the remeasurement of foreign currencydenominated balances included in our consolidated balance sheets into the relevant functional currency.
(5) Restructuring and other costs represents charges associated with business restructuring and associated changesimplemented which resulted in severance benefits related to employee terminations, integration and facilityopening or closing costs and other business reorganization costs.
(6) Represents charges or settlements associated with airline antitrust litigation as well as payments or reserves takenin relation to certain retroactive hotel occupancy and excise tax disputes (see Note 20, Commitments andContingencies, to our audited consolidated financial statements included elsewhere in this prospectus).
20

(7) We have been paying an annual management fee to TPG and Silver Lake in an amount between (i) $5 million and(ii) $7 million, the actual amount of which is calculated based upon 1% of Adjusted EBITDA, as defined in theMSA, earned by the company in such fiscal year up to a maximum of $7 million. In addition, the MSA providesfor the reimbursement of certain costs incurred by TPG and Silver Lake, which are included in this line item. Inconnection with the completion of this offering, we will pay to TPG and Silver Lake, in the aggregate, a$21 million fee pursuant to the MSA and the MSA will be terminated.
(8) Our Travel Network business at times provides upfront incentive consideration to travel agency subscribers at theinception or modification of a service contract, which are capitalized and amortized to cost of revenue over anaverage expected life of the service contract, generally over three to five years. Such consideration is made withthe objective of increasing the number of clients or to ensure or improve customer loyalty. Such service contractterms are established such that the supplier and other fees generated over the life of the contract will exceed thecost of the incentive consideration provided upfront. Such service contracts with travel agency subscribers requirethat the customer commit to achieving certain economic objectives and generally have terms requiring repaymentof the upfront incentive consideration if those objectives are not met.
(9) Represents the impact of the Expedia SMA on travel supplier liabilities of $19 million and accounts payable of$5 million for the period November 1, 2013 through December 31, 2013 compared to the period November 1,2012 through December 31, 2012, which is primarily attributable to the migration of bookings from ourtechnology platform to Expedia’s platform during this period in 2013 (see “Management’s Discussion andAnalysis of Financial Condition and Results of Operations—Factors Affecting our Results—Travelocity”).
(10) The adjustments to reconcile cash provided by operating activities to Adjusted Free Cash Flow reflect the amountsexpensed in our statements of operations in the respective periods adjusted for non-cash portions in instanceswhere material.
(11) Includes payment credits totaling $16 million used by American Airlines to pay for purchases of our technologyservices in 2013. The payment credits were provided by us as part of our litigation settlement with AmericanAirlines (see Note 20, Commitments and Contingencies, to our audited consolidated financial statements includedelsewhere in this prospectus).
21

RISK FACTORS
Investing in our common stock involves a high degree of risk. We have disclosed all known, material risksassociated with an investment in our common stock in the risk factors described below. If any of the risksdescribed below actually occur, our business, financial condition and results of operations could be materiallyand adversely affected. In such case, the trading price of our common stock could decline and you may lose allor part of your investment. You should carefully consider all the information in this prospectus, including therisks and uncertainties described below, before making an investment decision.
Risks Related to Our Business and Industry
Our revenue is highly dependent on transaction volumes in the global travel industry, particularly airtravel transaction volumes.
Although for the year ended December 31, 2013, 94% and 84% of our Travel Network and Airline andHospitality Solutions revenue, respectively, was Recurring Revenue in that it is largely tied to travel suppliers’transaction volumes rather than to their unit pricing for an airplane ticket, hotel room or other travel product (see“Method of Calculation”), this revenue is generally not contractually committed to recur annually under ouragreements with our travel suppliers. As a result, our revenue is highly dependent on the global travel industry,particularly air travel from which we derive a substantial amount of our revenue, and directly correlates withglobal travel, tourism and transportation transaction volumes. For example, the terrorist attacks of September 11,2001, the most recent global economic downturn and the U.S. government sequestration that began in 2013significantly affected and may continue to affect travel volumes worldwide and had a significant impact on ourbusiness during the relevant reporting periods. Our revenue is therefore highly susceptible to declines in ordisruptions to leisure and business travel that may be caused by factors entirely out of our control, and thereforemay not recur if these declines or disruptions occur.
Various factors may cause temporary or sustained disruption to leisure and business travel. The impact suchdisruptions would have on our business depends on the magnitude and duration of such disruption. These factorsinclude, among others:
• financial instability of travel suppliers and the impact of any fundamental corporate changes to suchtravel suppliers, such as airline bankruptcies or consolidations, on the cost and availability of travelcontent;
• factors that affect demand for travel such as increases in fuel prices, changing attitudes towards theenvironmental costs of travel, safety concerns and outbreaks of contagious diseases;
• inclement weather, natural or man-made disasters or political events like acts or threats of terrorism,hostilities and war;
• factors that affect supply of travel such as changes to regulations governing airlines and the travelindustry, like government sanctions that do or would prohibit doing business with certain state-ownedtravel suppliers, work stoppages or labor unrest at any of the major airlines, hotels or airports; and
• general economic conditions.
Our Travel Network business and our Airline and Hospitality Solutions business depend on maintainingand renewing contracts with their customers and other counterparties.
In our Travel Network business, we enter into participating carrier distribution and services agreements withairlines. Our contracts with major carriers typically last for three to five year terms and are generally subject toautomatic renewal at the end of the term, unless terminated by either party with the required advance notice. Ourcontracts with smaller airlines generally last for one year and are also subject to automatic renewal at the end of
22
the term, unless terminated by either party with the required advance notice. Airlines are not contractuallyobligated to distribute exclusively through our GDS during the contract term and may terminate their agreementswith us upon providing the required advance notice after the expiration of the initial term. We have 28 plannedrenewals in 2014 (representing approximately 22% of our Travel Network revenue for the year ended December31, 2013) and 24 planned renewals in 2015 (representing approximately 5% of our Travel Network revenue forthe year ended December 31, 2013), assuming we reach multi-year agreements for the contracts expected to berenewed in 2014. Although we renewed 24 out of 24 planned renewals in 2013 (representing approximately 25%of Travel Network revenue for the year ended December 31, 2013), we cannot guarantee that we will be able torenew our airline contracts in the future on favorable economic terms or at all.
We also enter into contracts with travel buyers. Although most of our travel buyer contracts have terms ofone to three years, we typically have non-exclusive, five to ten year contracts with our major travel agencycustomers. We also typically have three to five year contracts with corporate travel departments, which generallyrenew automatically unless terminated with the required advance notice. A meaningful portion of our travelbuyer agreements, typically representing approximately 15% to 20% of our bookings, are up for renewal in anygiven year. We cannot guarantee that we will be able to renew our travel buyer agreements in the future onfavorable economic terms or at all.
Similarly, our Airline and Hospitality Solutions business is based on contracts with travel suppliers for atypical duration of three to seven years for airlines and one to five years for hotels. As of December 31, 2013, wehad contracts with approximately 225 airlines for the provision of one or more of our airline solutions. Althoughairline reservations contracts representing less than 5% of Airline Solutions’ 2013 revenue are scheduled forrenewal in each of 2014 and 2015, airline reservations contracts representing approximately 10% of AirlineSolutions’ 2013 revenue are scheduled for renewal in each of 2016 and 2017. Hospitality Solutions contractrenewals are relatively evenly spaced, with approximately one-third of contracts representing approximately one-third of Hospitality Solutions’ 2013 revenue coming up for renewal in any given year. We cannot guarantee thatwe will be able to renew our solutions contracts in the future on favorable economic terms or at all.
Additionally, we use several third-party distributor partners and joint ventures to extend our GDS services inAPAC and EMEA. The termination of our contractual arrangements with any such third-party distributorpartners and joint ventures could adversely impact our Travel Network business in the relevant markets. See“Business—Our Businesses—Travel Network—Geographic Scope” and “—We rely on third-party distributorpartners and joint ventures to extend our GDS services to certain regions, which exposes us to risks associatedwith lack of direct management control and potential conflicts of interest” for more information on ourrelationships with our third-party distributor partners and joint ventures.
Our failure to renew some or all of these agreements on economically favorable terms or at all, or the earlytermination of these existing contracts, would adversely affect the value of our Travel Network business as amarketplace due to our limited content and distribution reach, which could cause some of our subscribers tomove to a competing GDS or use other travel technology providers for the solutions we provide and wouldmaterially harm our business, reputation and brand. Our business therefore relies on our ability to renew ouragreements with our travel buyers, travel suppliers, third-party distributor partners and joint ventures ordeveloping relationships with new travel buyers and travel suppliers to offset any customer losses.
We are subject to a certain degree of revenue concentration among a portion of our customer base. Our topfive Travel Network customers were responsible for 32% and 36% of our Travel Network revenue for the yearsended December 31, 2013 and December 31, 2012, respectively. Over the same period, our top five Airline andHospitality Solutions customers represented 22% and 20% of our Airline and Hospitality Solutions revenues,respectively. Because of this concentration among a small number of customers, if an event were to adverselyaffect one of these customers, it would have a material impact on our business.
23
Our Travel Network business is exposed to pricing pressure from travel suppliers.
Travel suppliers continue to look for ways to decrease their costs and to increase their control overdistribution. For example, the consolidation in the airline industry and the recent economic downturn, amongother factors, have driven some airlines to negotiate for lower fees during contract renegotiations, therebyexerting increased pricing pressure on our Travel Network business, which, in turn, negatively affects ourrevenues and margins. In addition, travel suppliers’ use of alternative distribution channels, such as directdistribution through supplier-operated websites, may also adversely affect our contract renegotiations with thesesuppliers and negatively impact our transaction fee revenue. For example, as we attempt to renegotiate newagreements with our travel suppliers, they may withhold some or all of their content (fares and associatedeconomic terms) for distribution exclusively through their direct distribution channels (for example, the relevantairline’s website) or offer travelers more attractive terms for content available through those direct channels aftertheir contracts expire. As a result of these sources of negotiating pressure, we may have to decrease our prices toretain their business. If we are unable to renew our contracts with these travel suppliers on similar economicterms or at all, or if our ability to provide such content is similarly impeded, this would also adversely affect thevalue of our Travel Network business as a marketplace due to our more limited content. See “—Travel suppliers’use of alternative distribution models, such as direct distribution models, could adversely affect our TravelNetwork and Travelocity businesses.”
Our Travel Network business depends on relationships with travel buyers.
Our Travel Network business relies on relationships with several large travel buyers, including TMCs andonline travel agencies (“OTAs”), to generate a large portion of its revenue through bookings made by these travelcompanies. Although no individual travel buyer accounts for more than 10% of our Travel Network revenue, thefive largest travel buyers of our Travel Network business were responsible for bookings that representedapproximately 32% and 36% of our Travel Network revenue for the years ended December 31, 2013 and 2012,respectively. Such revenue concentration in a relatively small number of travel buyers makes us particularlydependent on factors affecting those companies. For example, if demand for their services decreases, or if a keysupplier pulls its content from us, travel buyers may stop utilizing our services or move all or some of theirbusiness to competitors or competing channels. Furthermore, one of our major TMC customers, AmericanExpress, recently announced that it has signed an agreement with an investor group to create a joint venturerelating to its global travel division. American Express expects this transaction to close in the second quarter of2014. In 2013, we derived less than 10% of our Travel Network revenue from bookings made by AmericanExpress. Our contracts with American Express remain in effect, and we are evaluating what effects, if any, thistransaction may have on our future relationship with American Express and this new joint venture.
Although our contracts with larger travel agencies often increase the incentive consideration when the travelagency processes a certain volume or percentage of its bookings through our GDS, travel buyers are notcontractually required to book exclusively through our GDS during the contract term. Travel buyers may shiftbookings to other distribution intermediaries for many reasons, including to avoid becoming overly dependent ona single source of travel content or to increase their bargaining power with GDS providers. For example, Expediashifted a significant portion of its business from Travel Network to a competitor GDS in late 2012, resulting in ayear-over-year decline in our transaction volumes and revenue in 2013. Additionally, some regulations allowtravel buyers to terminate their contracts earlier. For example, according to European GDS regulations, smalltravel buyers may terminate a contract with a GDS vendor on three months’ notice after the first year of thecontract.
These risks are exacerbated by increased consolidation among travel agencies and TMCs, which mayultimately reduce the pool of travel agencies that subscribe to GDSs. We must compete with other GDSs andother competitors for their business by offering competitive upfront incentive consideration, which, due to thestrong bargaining power of these large travel buyers, tend to increase in each round of contract renewals. See“Management’s Discussion and Analysis of Financial Condition and Results of Operations—Factors Affectingour Results—Increasing travel agency incentive consideration” for more information about our incentive
24

consideration. However, any reduction in transaction fees from travel suppliers due to supplier consolidation orother market forces could limit our ability to increase incentive consideration to travel agencies in a cost-effective manner or otherwise affect our margins.
Our travel supplier customers may experience financial instability or consolidation, pursue costreductions, change their distribution model or undergo other changes.
We generate the majority of our revenue and accounts receivable from airlines, with approximately 66% and65%, respectively, of our revenue for the years ended December 31, 2013 and 2012, and 58% of our tradeaccounts receivable attributable to these customers as of both December 31, 2013 and December 31, 2012. Wealso derive revenue from hotels, car rental brands, rail carriers, cruise lines, tour operators and other suppliers inthe travel and tourism industries. Adverse changes in any of these relationships or the inability to enter into newrelationships could negatively impact the demand for and competitiveness of our travel products and services.For example, a lack of liquidity in the capital markets or weak economic performance may cause our travelsuppliers to increase the time they take to pay or to default on their payment obligations, which could lead to ahigher level of bad debt expense and negatively affect our results. We regularly monitor the financial conditionof the air transportation industry and have noted the financial difficulties faced by several air carriers. Any large-scale bankruptcy or other insolvency proceeding of an airline or hospitality supplier could subject our agreementswith that customer to rejection or early termination. Because we generally do not require security or collateralfrom our customers as a condition of sale, our revenues may be subject to credit risk more generally.
Furthermore, supplier consolidation, particularly in the airline industry, could harm our business. Our TravelNetwork business depends on a relatively small number of U.S.-based airlines for a substantial portion of itsrevenue, and all of our businesses are highly dependent on airline ticket volumes. Consolidation among airlines,including the recent consolidation of Southwest Airlines with AirTran Airways and American Airlines with USAirways, could result in the loss of an existing customer and the related fee revenue, decreased airline ticketvolumes due to capacity restrictions implemented concurrently with the consolidation, and increased airlineconcentration and bargaining power to negotiate lower transaction fees. For example, the consolidation ofAmerican Airlines with US Airways could adversely affect our business if future contract negotiations with themerged entity result in adverse changes compared to our existing relationships with these two airlines. Theseadverse changes may include, but are not limited to, renegotiated distribution or solutions contracts that containless favorable terms to us or the loss of such contracts entirely. In addition, consolidation among travel suppliersmay result in one or more suppliers refusing to provide certain content to Sabre but rather making it exclusivelyavailable on the suppliers’ proprietary websites, hurting the competitive position of our GDS relative to thosewebsites. See “—Travel suppliers’ use of alternative distribution models, such as direct distribution models,could adversely affect our Travel Network and Travelocity businesses.”
Our business could be harmed by adverse global and regional economic and political conditions.
Travel expenditures are sensitive to personal and business discretionary spending levels and grow moreslowly or decline during economic downturns. We derive the majority of our revenue from the United States andEurope, approximately 58% and 16%, respectively, for the year ended December 31, 2013, and 62% and 16%,respectively, for the year ended December 31, 2012. Our geographic concentration in the United States andEurope makes our business particularly vulnerable to economic and political conditions that adversely affectbusiness and leisure travel originating in or traveling to these countries.
For example, beginning in December 2007, there was a rapid deterioration of the U.S. economy and severalcountries in Europe began experiencing worsening credit and economic conditions. The U.S. and certainEuropean governments are still operating at large financial deficits, which has contributed to the challengingmacroeconomic conditions and the struggling economic recovery. This resulted in a significant decline in travelto the extent that these challenging macroeconomic conditions affect personal and business discretionaryspending on travel. Most recently, the shutdown of the U.S. government and the continued U.S. government
25

sequestration affected, and in the case of the U.S. governmental sequestration continues to affect, governmentand government-related travel throughout the United States. Because a large number of our travel buyersubscribers book travel on behalf of the U.S. government, our Travel Network business has been more negativelyimpacted than that of our competitors. Moreover, the increase in the Transportation Security Agency securitycharge in the recent U.S. federal budget deal will likely increase airline ticket prices, which may result indecreased travel volumes and may negatively affect our business.
Despite signs of gradual recovery, there is still weakness in parts of the global economy, including increasedunemployment, reduced financial capacity of both business and leisure travelers, diminished liquidity and creditavailability, declines in consumer confidence and discretionary income and general uncertainty about economicstability. We cannot predict the magnitude, length or recurrence of recessionary economic patterns, which haveimpacted, and may continue to impact, demand for travel and lead to reduced spending on the services we provide.
We derive the remainder of our revenues primarily from APAC, Latin America and MEA, where politicalinstability and regulatory uncertainty is significantly higher than in Europe and the United States. Anyunfavorable economic, political or regulatory developments in those regions could negatively affect our business,such as delays in payment or non-payment of contracts, delays in contract implementation or signing, carriercontrol issues and increased costs from regulatory changes particularly as parts of our growth strategy involveexpanding our presence in these emerging markets.
For example, Venezuela has imposed currency controls, including volume restrictions on the conversion ofbolivars to U.S. dollars, which impact the ability of certain of our airline customers operating in the country toobtain U.S. dollars to make timely payments to us. Consequently, the collection of accounts receivable due to uscan be, and has been, delayed. Due to the nature of this delay, we have recorded specific reserves against alloutstanding balances due to us and are deferring the recognition of any future revenues effective January 1, 2014until cash is collected in accordance with our policies. Accordingly, our accounts receivable are subject to ageneral collection risk, as there can be no assurance that we will be paid from such customers in a timely manner,if at all. In addition, in January 2014, Venezuela announced a dual-foreign exchange rate system, which haseffectively devalued the local currency and subjected airlines to an exchange rate for U.S. dollars available atauctions that has been significantly higher than the official exchange rate. Certain airlines have scaled backoperations in response to these currency controls, including a decrease in the number of seats being offered by38% compared to 2013 and capacity cuts of between 10% to 70% by some airlines over the same period. Civilunrest has also led one airline to suspend flights to Caracas due to operational safety concerns. During the yearended December 31, 2013, we derived 1% of our total revenue from our airline customers operating inVenezuela. As a result of the issues impacting our airline customers in Venezuela, we expect our revenuesderived from our Venezuelan operations in 2014 to be reduced as compared to our revenues for 2013.
Travel suppliers’ use of alternative distribution models, such as direct distribution models, couldadversely affect our Travel Network and Travelocity businesses.
Some travel suppliers that provide content to Travel Network and Travelocity, including some of TravelNetwork’s largest airline customers, have sought to increase usage of direct distribution channels. For example,these travel suppliers are trying to move more consumer traffic to their proprietary websites, and some travelsuppliers have explored direct connect initiatives linking their internal reservations systems directly with travelagencies or TMCs, thereby bypassing the GDSs. This direct distribution trend enables them to apply pricingpressure on intermediaries and negotiate travel distribution arrangements that are less favorable to intermediaries.With travel suppliers’ adoption of certain technology solutions over the last decade, including those offered byour Airline and Hospitality Solutions business, air travel suppliers have increased the proportion of directbookings relative to indirect bookings. Although we believe the rate at which bookings are shifting from indirectto direct distribution channels in the United States has stabilized at very low levels in 2012 and 2013, we cannotpredict whether this low rate of shift will continue. In the future, airlines may increase their use of directdistribution, which may cause a material decrease in their use of our GDS. Travel suppliers may also offer
26
travelers advantages through their websites such as special fares and bonus miles, which could make theirofferings more attractive than those available through our GDS platform. For example, in 2010 AmericanAirlines announced its “Boarding and Flexibility” package which, according to American Airlines, providedadditional benefits to travelers who book their airline tickets directly through their website.
In addition, with respect to ancillary products, travel suppliers may choose not to comply with the technicalstandards that would allow ancillary products to be immediately distributed via intermediaries, thus resulting in adelay before these products become available through our GDS relative to availability through direct distribution.For example, airlines have been “unbundling” from base airfares various ancillary products such as food andbeverage, checked baggage and pre-reserved seats, and the recent SITA Survey shows that the vast majority ofancillary revenues are earned through direct sales channels, such as the airline website. In addition, if enoughtravel suppliers choose not to develop ancillary products in a standardized way with respect to technicalstandards our investment in adapting our various systems to enable the sale of ancillary products may not besuccessful. Similarly, some airlines have also further limited the type of fare content information that isdistributed through OTAs, including Travelocity.
Companies with close relationships with end consumers, like Facebook, as well as new entrants introducingnew paradigms into the travel industry, such as metasearch engines, may promote alternative distributionchannels to our GDS by diverting consumer traffic away from intermediaries. For example, Google acquired ITASoftware, a flight information software company that provides air shopping capabilities, and launched GoogleFlights and Google Hotel Finder in 2011. If Google Hotel Finder changes its model to bypass GDS and OTAintermediaries by referring consumers to direct hotel distribution channels or if Google Flights, which alreadyrefers customers directly to airline websites, becomes a more popular way to shop and book travel, our GDS andOTA businesses may be adversely affected.
Additionally, technological advancements may allow airlines and hotels to facilitate broader connectivity toand integration with large travel buyers, such that certain airline and hotel offerings could be made availabledirectly to such travel buyers without the involvement of intermediaries such as Travel Network and itscompetitors.
We rely on third-party distributor partners and joint ventures to extend our GDS services to certainregions, which exposes us to risks associated with lack of direct management control and potentialconflicts of interest.
Our Travel Network business utilizes third-party distributor partners and joint ventures to extend our GDSservices in APAC and EMEA. We work with these partners to establish and maintain commercial and customerservice relationships with both travel suppliers and travel buyers. Since we do not exercise management controlover their day-to-day operations, the success of their marketing efforts and the quality of the services theyprovide are beyond our control. If these partners do not meet our standards for distribution, our reputation maysuffer materially, and sales in those regions could decline significantly. Any interruption in these third-partyservices, deterioration in their performance or termination of our contractual arrangements with them couldnegatively impact our ability to extend our GDS services in the relevant markets.
In addition, our business may be harmed due to potential conflicts of interest with our joint venture partners.Large regional airlines collectively control a majority of the outstanding equity interests in our Abacus jointventure, a Singapore-based distribution provider that serves the APAC region. As travel suppliers, these airlines’interests differ from our Travel Network business’ interests as a distribution intermediary. For example, theairline owners may not agree to provide incentive consideration to travel agencies at the same rate as our GDScompetitors. Subject to some exceptions, we are also prohibited from competing with Abacus by directly orindirectly engaging in the GDS business in Asia, Australia, New Zealand and certain Pacific islands.
27
The travel distribution market is highly competitive, and we are subject to competition from other GDSproviders, direct distribution by travel suppliers and new entrants or technologies that may challenge theGDS business model.
The evolution of the global travel and tourism industry, the introduction of new technologies and standardsand the expansion of existing technologies in key markets, among other factors, could contribute to anintensification of competition in the business areas and regions in which we operate. Increased competition couldrequire us to increase spending on marketing activities or product development, to decrease our booking ortransaction fees and other charges (or defer planned increases in such fees and charges), to increase incentiveconsideration or take other actions that could harm our business. A GDS has two broad categories of customers:(i) travel suppliers, such as airlines, hotels, car rental brands, rail carriers, cruise lines and tour operators, and(ii) travel buyers, such as online and offline travel agencies, TMCs and corporate travel departments. Thecompetitive positioning of a GDS depends on the success it achieves with both customer categories. Other factorsthat may affect the competitive success of a GDS include the comprehensiveness, timeliness and accuracy of thetravel content offered, the reliability, ease of use and innovativeness of the technology, the incentiveconsideration provided to travel agencies, the transaction fees charged to travel suppliers and the range ofproducts and services available to travel suppliers and travel buyers. Our GDS competitors could seek to capturemarket share by offering more differentiated content, products or services, increasing the incentive considerationto travel agencies, or decreasing the transaction fees charged to travel suppliers, which would harm our businessto the extent they gain market share from us or force us to respond by lowering our prices or increasing theincentive consideration we provide.
Our Travel Network business principally faces competition from:
• other GDSs, principally Amadeus, which operates the Amadeus GDS, and Travelport, which owns theGalileo, Apollo and Worldspan GDS platforms;
• local distribution systems and travel marketplace providers that are primarily owned by airlines orgovernment entities and operate primarily in their home countries, including TravelSky in China andSirena in Russia and the Commonwealth of Independent States;
• direct distribution and other alternative forms of distribution by travel suppliers (see “—Travelsuppliers’ use of alternative distribution models, such as direct distribution models, could adverselyaffect our Travel Network and Travelocity businesses”);
• third-party providers of corporate travel booking tools; and
• new entrants or technologies such as third-party aggregators or metasearch sites.
We cannot guarantee that we will be able to compete successfully against our current and future competitorsin the travel distribution market, some of which may achieve greater brand recognition than us, have greaterfinancial, marketing, personnel and other resources or be able to secure services and products from travelsuppliers on more favorable terms. If we fail to overcome these competitive pressures, we may lose market shareand our business may otherwise be negatively affected.
Our ability to maintain and grow our Airline and Hospitality Solutions business may be negativelyaffected by competition from other third-party solutions providers and new participants that seek to enterthe solutions market.
Our Airline and Hospitality Solutions business principally faces competition from existing third-partysolutions providers. For our Airline Solutions business, these competitors include (i) Amadeus, our closestcompetitor in terms of size and breadth, (ii) traditional technology companies, such as Hewlett-Packard (“HP”),Unisys and Navitaire (a division of Accenture), and (iii) airline industry participants, such as Jeppesen (a divisionof Boeing), Lufthansa Systems, and SITA. We also compete with various point solutions providers, such asPROS, ITA Software, Datalex and Travelport, on a more limited basis in several discrete functional areas. For
28
our Hospitality Solutions business, we face competition across many aspects of our business but our primarycompetitors are in the hospitality CRS and Property Management Systems (“PMSs”) fields, including MICROS,TravelClick, Pegasus and Trust, among others. Although new entrants specializing in a particular type ofsoftware occasionally enter the solutions market, they typically focus on emerging or evolving businessproblems, niche solutions or small regional customers.
Factors that may affect the competitive success of our Airline and Hospitality Solutions business include ourpricing structure, our ability to keep pace with technological developments, the effectiveness and reliability ofour implementation and system migration processes, our ability to meet a variety of customer specifications, theeffectiveness and reliability of our systems, the cost and efficiency of our system upgrades and our customersupport services. Our failure to compete effectively on these and other factors could decrease our market shareand negatively affect our Airline and Hospitality Solutions business.
The recently signed strategic marketing agreement with Expedia may not be successfully implemented ormay not result in the benefits anticipated by the parties.
In August 2013, Travelocity entered into an exclusive, long-term strategic marketing agreement withExpedia, which was recently amended and restated in March 2014 to reflect changed commercial terms. Underthe Expedia SMA, Expedia will power the technology platforms for Travelocity’s U.S. and Canadian websites aswell as provide Travelocity with access to Expedia’s supply and customer service platforms. Both parties begandevelopment and implementation of this arrangement after signing the Expedia SMA. As of December 31, 2013,the majority of the online hotel and air offering has been migrated to the Expedia platform, and a launch of themajority of the remainder is expected in mid-2014. See “Business—Our Businesses—Travelocity.” If we do notimplement the Expedia SMA on the expected schedule, we are subject to a number of risks:
• our financial performance could be negatively affected;
• we may lose customers and revenue if there are implementation problems that cause website errors,outages or other malfunctions or if the expected improvements in customer conversion rates do notmaterialize; and
• if we fail to successfully implement the Expedia SMA, our ability to negotiate a similar arrangementwith another party in which bookings are processed through the Travel Network will be severelycurtailed.
Moreover, we are still subject to a number of post-implementation risks. Our success is dependent on manyfactors, including:
• improved conversion through better site performance and user experience using the Expedia platformand technology;
• reliability and availability of Expedia’s platform and technology;
• Expedia’s ability to provide attractive content through its platform;
• improved cost structure by reducing operational complexity; and
• profitable results from our marketing efforts.
The Expedia SMA requires us to guarantee Travelocity’s indemnification obligations for liabilities that mayarise out of certain litigation matters, which may materially adversely affect our cash flows. Our financialcondition may also be harmed if Expedia does not pay us in a timely manner for our share of the performance-based marketing fee.
Expedia is required to use our GDS for shopping and booking of the air travel booked throughTravelocity.com and Travelocity.ca until 2019, at which time it may choose to use another intermediary for aportion or all of such air travel, subject to earlier termination under certain circumstances. We do not expect thatExpedia will use Travel Network for shopping and booking of a portion of non-air travel for Travelocity.com andTravelocity.ca after the launch of the Expedia SMA.
29
Although the term of the amended and restated Expedia SMA is nine years and automatically renews undercertain conditions, the agreement may be terminated by Expedia upon the occurrence of certain events, some ofwhich are outside our control, including, among others, (i) failure to meet minimum revenue amounts, (ii) theoccurrence of a material adverse effect, and (iii) force majeure. The early termination of this agreement mayresult in a significant impact on our earnings.
As part of our negotiations to amend and restate the Expedia SMA, we also agreed to a separate put/callagreement with Expedia that supersedes the previous put/call arrangement (the new put/call agreement, the“Expedia Put/Call”), whereby Expedia may acquire, or we may sell to Expedia, certain assets relating to theTravelocity business. Our put right may be exercised during the first 24 months of the Expedia Put/Call onlyupon the occurrence of certain triggering events primarily relating to implementation, which are outside of ourcontrol. The occurrence of such events is not considered probable. During this period, the amount of the put rightis fixed. After the 24 month period, the put right is only exercisable for a limited period of time in 2016 and 2017at a discount to fair market value. The call right held by Expedia is exercisable at any time during the term of theExpedia Put/Call. If the call right is exercised, although we expect the amount paid will be fair value, the callright provides for a floor for a limited time that may be higher than fair value and a ceiling for the duration of theExpedia Put/Call that may be lower than fair value. In any case, we would no longer benefit from the financialperformance of Travelocity in future periods.
Implementation of software solutions often involves a significant commitment of resources, and anyfailure to deliver as promised on a significant implementation could adversely affect our business.
In our Travel Network business and our Airline and Hospitality Solutions business, the implementation ofsoftware solutions often involves a significant commitment of resources and is subject to a number of significantrisks over which we may or may not have control. These risks include:
• the features of the implemented software may not meet the expectations or fit the business model of thecustomer;
• our limited pool of trained experts for implementations cannot quickly and easily be augmented forcomplex implementation projects, such that resources issues, if not planned and managed effectively,could lead to costly project delays;
• customer-specific factors, such as the stability, functionality, interconnection and scalability of thecustomer’s pre-existing information technology infrastructure, as well as financial or othercircumstances could destabilize, delay or prevent the completion of the implementation process, which,for airline reservations systems, typically takes 12 to 18 months; and
• customers and their partners may not fully or timely perform the actions required to be performed bythem to ensure successful implementation, including measures we recommend to safeguard againsttechnical and business risks.
As a result of these and other risks, some of our customers may incur large, unplanned costs in connectionwith the purchase and installation of our software products. Also, implementation projects could take longer thanplanned or fail. We may not be able to reduce or eliminate protracted installation or significant additional costs.Significant delays or unsuccessful customer implementation projects could result in claims from customers, harmour reputation and negatively impact our operating results.
We use open source software in our solutions that may subject our software solutions to general releaseor require us to re-engineer our solutions.
We use open source software in our solutions and may use more open source software in the future. Fromtime to time, there have been claims by companies claiming ownership of software that was previously thoughtto be open source and that was incorporated by other companies into their products. As a result, we could besubject to suits by parties claiming ownership of what we believe to be open source software. Some open sourcelicenses contain requirements that we make available source code for modifications or derivative works we
30
create based upon the open source software and that we license such modifications or derivative works under theterms of a particular open source license or other license granting third parties certain rights of further use. If wecombine or, in some cases, link our proprietary software solutions with or to open source software in a certainmanner, we could, under certain of the open source licenses, be required to release the source code of ourproprietary software solutions or license such proprietary solutions under the terms of a particular open sourcelicense or other license granting third parties certain rights of further use. In addition to risks related to licenserequirements, usage of open source software can lead to greater risks than use of third-party commercialsoftware, as open source licensors generally do not provide warranties or controls on origin of the software. Inaddition, open source license terms may be ambiguous and many of the risks associated with usage of opensource cannot be eliminated, and could, if not properly addressed, negatively affect our business. If we werefound to have inappropriately used open source software, we may be required to seek licenses from third partiesin order to continue offering our software, to re-engineer our solutions, to discontinue the sale of our solutions inthe event re-engineering cannot be accomplished on a timely basis or take other remedial action that may divertresources away from our development efforts, any of which could adversely affect our business, operating resultsand financial condition.
We rely on the availability and performance of information technology services provided by third parties,including HP, which manages a significant portion of our systems.
Our businesses are largely dependent on the computer data centers and network systems operated for us byHP. We also rely on other developers and service providers to maintain and support our globaltelecommunications infrastructure, including to connect our computer data center and call centers to end-users.
Our success is dependent on our ability to maintain effective relationships with these third-party technologyand service providers. Some of our agreements with third-party technology and service providers are terminablefor cause on short notice and often provide limited recourse for service interruptions. For example, our agreementwith HP provides us with limited indemnification rights. We could face significant additional cost or businessdisruption if:
• Any such providers fail to enable us to provide our customers and suppliers with reliable, real-timeaccess to our systems. For example, in August 2013, we experienced a significant outage of the Sabreplatform due to a failure on the part of one of our service providers. This outage, which affected bothour Travel Network business and our Airline Solutions business, lasted several hours and causedsignificant problems for our customers. Any such future outages could cause damage to our reputation,customer loss and require us to pay compensation to affected customers for which we may not beindemnified or compensated.
• Our arrangements with such providers are terminated or impaired and we cannot find alternativesources of technology or systems support on commercially reasonable terms or on a timely basis. Forexample, our substantial dependence on HP for many of our systems makes it difficult for us to switchvendors and makes us more sensitive to changes in HP’s pricing for its services.
Our OTAs are subject to a number of risks specific to their activities.
Our OTAs are subject to certain risks inherent in the consumer-facing OTA industry. Notwithstanding theExpedia SMA, Travelocity will continue to be exposed to these risks because its revenue stream is largelydependent upon Expedia’s performance. These risks include, but are not limited to, the following:
• Competition. The OTA industry is an increasingly competitive global environment with a number ofestablished and emerging online and traditional sellers of travel-related services, including other OTAs,offline travel agents, travel suppliers, large online portal and search companies, travel metasearchengines and increasingly, mobile platform travel apps and social apps. Recently, we have seenincreasing consolidation among our competitors, including Priceline’s acquisition of Kayak inNovember 2012 and Expedia’s acquisition of trivago in March 2013. These players compete on price,
31
travel inventory availability and breadth, technological sophistication, ability to meet rapidly evolvingconsumer trends and demands, brand recognition, search engine rankings, ease of use and accessibility,customer service and reliability. If we cannot adequately address these trends and provide travelerswith the content they seek at acceptable prices, our OTAs may not be able to compete successfullyagainst current and future competitors.
• Content. OTAs use their website content and ability to comparison shop to attract and convert visitorsinto booking customers and repeat users. The success of our OTAs in attracting users depends, in part,upon our continued ability to collect, create and distribute high-quality, commercially valuable contentthat meets customers’ specific needs in a cost-effective manner. For Travelocity.com andTravelocity.ca, we are dependent on Expedia to make relevant travel content available to customers.Failing to meet the specific needs of consumers could make our OTAs less competitive. Changes in thecost structure by which our OTAs currently obtain their content, or changes in travelers’ relativeappreciation of that content, could negatively impact our OTAs’ business and financial performance.
• Relationships with travel suppliers and travel distribution partners. OTAs depend on travel suppliersand distribution partners for access to inventory and derive a substantial portion of their revenue fromthese suppliers and distribution partners in the form of compensation for bookings. Many travelsuppliers have reduced or eliminated and may continue to reduce or eliminate, commissions and feespaid to travel agencies, and our OTA business could be harmed if this trend continues. Also, if travelsuppliers or GDSs attempt to implement multiple costly direct connections or charge travel agenciesfor or otherwise restrict access to content, our OTAs’ ability to offer competitive inventory and pricingmay be adversely affected, leading to decreased revenues and margins.
• Changes in search engine algorithms and other traffic sources. We increasingly utilize internet searchengines to generate traffic to our OTAs, principally through the purchase of travel-related keywords.Search engines, including Google, frequently update and change the algorithm that determines theplacement and display of search results such that our links could be placed lower on the page ordisplayed less prominently. We also depend on pay-per-click and display advertising campaigns onsearch and shopping providers like Google, Kayak, and TripAdvisor to direct a significant amount oftraffic to our OTAs. Our business may be harmed if we cannot keep pace with the rapidly changingpricing and operating dynamics for these traffic sources.
• Media. Our OTAs receive fees from companies and organizations, such as those in the travel industry,for display and referral advertising products. If a significant portion of our advertisers feel that ourOTAs are no longer attracting or referring relevant customers, and accordingly reduce their advertisingwith our OTAs, our revenues could decline.
• License requirements. In some of the jurisdictions where we provide travel services through our OTAs,we are required to obtain certain licenses and approvals from the relevant regulatory authorities. Theseregulatory authorities generally have broad discretion to grant, renew and revoke such licenses andapprovals. Any of these regulatory authorities could permanently or temporarily suspend the necessarylicenses and approvals in respect of some or all of our travel agency and related activities in suchjurisdictions, which would adversely impact the activities of the affected OTA.
We rely on the value of our brands, which may be damaged by a number of factors, some of which areout of our control.
We believe that maintaining and expanding our portfolio of product and service brands are importantaspects of our efforts to attract and expand our customer base, particularly for our OTA business. Our brandsmay be negatively impacted by, among other things, unreliable service levels from third-party providers,customers’ inability to properly interface their applications with our technology, the loss or unauthorizeddisclosure of personal data or other bad publicity due to litigation, regulatory concerns or otherwise relating toour business. Any inability to maintain or enhance awareness of our brands among our existing and targetcustomers could negatively affect our current and future business prospects.
32
For example, awareness, perceived quality and perceived differentiated attributes of our OTA brands,especially Travelocity, are important aspects of our efforts to attract and expand the number of travelers who useour OTA websites and mobile apps. We are responsible for marketing and retailing capabilities for our OTAs,such as building brand awareness and customer relationships and working on customer acquisition and customeranalytics. There is an inherent level of risk associated with our marketing investments such that we could fail toattract new or repeat travelers to our websites or mobile apps in a cost-effective manner and may not be able toconvert a sufficient portion of these visitors into booking customers.
Any inability or failure to adapt to technological developments or the evolving competitive landscapecould harm our business operations and competitiveness.
We depend upon the use of sophisticated information technology and systems. See “Business—Research,Development and Technology.” Our competitiveness and future results depend on our ability to maintain andmake timely and cost-effective enhancements, upgrades and additions to our products, services, technologies andsystems in response to new technological developments, industry standards and trends and customer demands.For example, we currently utilize mainframe infrastructure technology for certain of our enterprise applicationsand platforms due to its ability to provide the reliability and scalability we require for our complex technologicaloperations. Although we believe that IBM, currently the only provider of this technology, is committed toinvesting in mainframes, the number of users and programmers able to service this technology is decreasing. Wemay eventually have to migrate to another business environment, which could cause us to incur substantial costs,result in instability and business interruptions and materially harm our business.
Adapting to new technological and marketplace developments, such as IATA’s proposed new distributioncapability (“NDC”), may require substantial expenditures and lead time and we cannot guarantee that projectedfuture increases in business volume will actually materialize. We may experience difficulties that could delay orprevent the successful development, marketing and implementation of enhancements, upgrades and additions.Moreover, we may fail to maintain, upgrade or introduce new products, services, technologies and systems asquickly as our competitors or in a cost-effective manner. For example, we must constantly update our GDS withnew capabilities to adapt to the changing technological environment and customer needs. However, this process canbe costly and time-consuming, and our efforts may not be successful as compared to our competitors in the traveldistribution market. Those that we do develop may not achieve acceptance in the marketplace sufficient to generatematerial revenue or may be rendered obsolete or non-competitive by our competitors’ offerings. For example,Microsoft is currently developing Travel 2015, a trip-planning tool that uses predictive modeling to anticipatetravelers’ preferred flight options, which may become a significant competitor to our TripCase mobile app. Also,Concur Technologies’ TripLink, which captures travel reservations information regardless of the channel on whichbookings were made, has the potential to evolve and pose a significant risk to our Travel Network business.
In addition, our competitors are constantly increasing their product and service offerings through organicresearch and development or through strategic acquisitions. For example, Amadeus recently acquired HititComputer Services, an airline customer relationship management (“CRM”) and loyalty solutions provider. Thisallows Amadeus to maintain a relationship with Etihad Airways and Virgin Australia, customers that haverecently migrated to our Sabre reservations platform. More recently, Amadeus also acquired NewmarketInternational, a hotel IT solutions provider, which will allow Amadeus to broaden its portfolio of suppliersolutions. As a result, we must continue to invest significant resources in research and development in order tocontinually improve the speed, accuracy and comprehensiveness of our services and we may be required to makechanges to our technology platforms or increase our investment in technology, increase marketing, adjust pricesor business models and take other actions, which could affect our financial performance and liquidity.
Our success depends on maintaining the integrity of our systems and infrastructure, which may sufferfrom failures, capacity constraints, business interruptions and forces outside of our control.
We may be unable to maintain and improve the efficiency, reliability and integrity of our systems.Unexpected increases in the volume of our business could exceed system capacity, resulting in service
33

interruptions, outages and delays. Such constraints can also lead to the deterioration of our services or impair ourability to process transactions. We occasionally experience system interruptions that make certain of our systemsunavailable including, but not limited to, our GDS and the services that our Airline and Hospitality Solutionsbusiness provides to airlines and hotels. For example, in August 2013, we experienced a significant outage of theSabre platform due to a failure on the part of one of our service providers. This outage lasted a number of hoursand caused significant problems for our customers. System interruptions may prevent us from efficientlyproviding services to customers or other third parties, which could cause damage to our reputation and result inour losing customers and revenues or cause us to incur litigation and liabilities. Although we have contractuallylimited our liability for damages caused by outages of our GDS (other than damages caused by our grossnegligence or willful misconduct), we cannot guarantee that we will not be subject to lawsuits or other claims forcompensation from our customers in connection with such outages for which we may not be indemnified orcompensated.
Our systems may also be susceptible to external damage or disruption. Much of the computer andcommunications hardware upon which we depend is located across multiple data center facilities in a singlegeographic region. Our systems could be damaged or disrupted by power, hardware, software ortelecommunication failures, human errors, natural events including floods, hurricanes, fires, winter storms,earthquakes and tornadoes, terrorism, break-ins, hostilities, war or similar events. Computer viruses, denial ofservice attacks, physical or electronic break-ins and similar disruptions affecting the Internet, telecommunicationservices or our systems could cause service interruptions or the loss of critical data, and could prevent us fromproviding timely services. Failure to efficiently provide services to customers or other third parties could causedamage to our reputation and result in the loss of customers and revenues, significant recovery costs or litigationand liabilities. Moreover, such risks are likely to increase as we expand our business and as the tools andtechniques involved become more sophisticated.
Although we have implemented measures intended to protect certain systems and critical data and providecomprehensive disaster recovery and contingency plans for certain customers that purchase this additionalprotection, these protections and plans are not in place for all systems. Furthermore, several of our existingcritical backup systems are located in the same metropolitan area as our primary systems and we may not havesufficient disaster recovery tools or resources available, depending on the type or size of the disruption. Disastersaffecting our facilities, systems or personnel might be expensive to remedy and could significantly diminish ourreputation and our brands, and we may not have adequate insurance to cover such costs.
Customers and other end-users who rely on our software products and services, including our SaaS andhosted offerings, for applications that are integral to their businesses may have a greater sensitivity to producterrors and security vulnerabilities than customers for software products generally. Additionally, security breachesthat affect third parties upon which we rely, such as travel suppliers, may further expose us to negative publicity,possible liability or regulatory penalties. Events outside our control could cause interruptions in our IT systems,which could have a material adverse effect on our business operations and harm our reputation.
Security breaches could expose us to liability and damage our reputation and our business.
We process, store, and transmit large amounts of data, including personal information of our customers, andit is critical to our business strategy that our facilities and infrastructure, including those provided by HP or othervendors, remain secure and are perceived by the marketplace to be secure. Our infrastructure may be vulnerableto physical break-ins, computer viruses, attacks by hackers or nefarious actors or similar disruptive problems.Any physical or electronic break-in or other security breach or compromise of the information handled by us orour service providers may jeopardize the security or integrity of information in our computer systems andnetworks or those of our customers and cause significant interruptions in our and our customers’ operations.Consumer-facing e-commerce websites are frequently subject to cybersecurity attacks due to the public nature ofsuch websites and the personal information they collect and store. From time to time, we have experiencedcertain immaterial security breaches relating to our Travelocity business.
34
Although we have developed systems and processes that are designed to protect customer information andprevent data loss and other security breaches, such measures cannot provide absolute security. In addition, wemay not successfully implement remediation plans to address all potential exposures. It is possible that we mayhave to expend additional financial and other resources to address such problems. Failure to prevent or mitigatedata loss or other security breaches could expose us or our customers to a risk of loss or misuse of suchinformation, cause customers to lose confidence in our data protection measures, damage our reputation,adversely affect our operating results or result in litigation or potential liability for us. While we maintaininsurance coverage that may, subject to policy terms and conditions, cover certain aspects of cyber risks, suchinsurance coverage may be insufficient to cover all our losses.
Our ability to recruit, train and retain technical employees is critical to our results of operations andfuture growth.
Our continued ability to compete effectively depends on our ability to recruit new employees and retain andmotivate existing employees, particularly professionals with experience in our industry, information technologyand systems. The specialized skills we require can be difficult and time-consuming to acquire and are often inshort supply. There is high demand and competition for well-qualified employees, such as software engineers,developers and other technology professionals with specialized knowledge in software development, especiallyexpertise in certain programming languages. This competition affects both our ability to retain key employeesand to hire new ones. Any of our employees may choose to terminate their employment with us at any time, anda lengthy period of time is required to hire and train replacement employees when such skilled individuals leavethe company. If we fail to attract well-qualified employees or to retain or motivate existing employees, ourbusiness could be materially hindered by, for example, a delay in our ability to deliver products and servicesunder contract, bring new products and services to market or respond swiftly to customer demands or newofferings from competitors. Even if we are able to maintain our employee base, the resources needed to recruitand retain such employees may adversely affect our business, financial condition and results of operations.
We operate a global business that exposes us to risks associated with international activities.
Our international operations involve risks that are not generally encountered when doing business in theUnited States. These risks include, but are not limited to:
• changes in foreign currency exchange rates and financial risk arising from transactions in multiplecurrencies;
• difficulty in developing, managing and staffing international operations because of distance, languageand cultural differences;
• disruptions to or delays in the development of communication and transportation services andinfrastructure;
• consumer attitudes, including the preference of customers for local providers;
• increasing labor costs due to high wage inflation in foreign locations, differences in generalemployment conditions and the degree of employee unionization and activism;
• business, political and economic instability in foreign locations, including actual or threatened terroristactivities, and military action;
• adverse laws and regulatory requirements, including more comprehensive regulation in the EuropeanUnion (“EU”);
• export or trade restrictions or currency controls;
• more restrictive data privacy requirements;
• governmental policies or actions, such as consumer, labor and trade protection measures;
• taxes, restrictions on foreign investment and limits on the repatriation of funds;
35
• diminished ability to legally enforce our contractual rights; and
• decreased protection for intellectual property.
Any of the foregoing risks may adversely affect our ability to conduct and grow our business internationally.
We are exposed to risks associated with acquiring or divesting businesses or business operations.
We have acquired, and, as part of our growth strategy, may in the future acquire, businesses or businessoperations. Since 2010, we have acquired FlightLine Data Services, Inc., Calidris ehf, f:wz, PRISM Group Inc.and PRISM Technologies LLC (collectively “PRISM”), SoftHotel and Zenon N.D.C., Limited. We may not beable to identify suitable candidates for additional business combinations and strategic investments, obtainfinancing on acceptable terms for such transactions, obtain necessary regulatory approvals or otherwiseconsummate such transactions on acceptable terms, or at all. Any acquisitions that we are able to identify andcomplete may also involve a number of risks, including our inability to successfully or profitably integrate,operate, maintain and manage our newly acquired operations or employees; the diversion of our management’sattention from our existing business to integrate operations and personnel; possible material adverse effects onour results of operations during the integration process; becoming subject to contingent or other liabilities,including liabilities arising from events or conduct predating the acquisition that were not known to us at the timeof the acquisition; and our possible inability to achieve the intended objectives of the transaction, including theinability to achieve cost savings and synergies. Acquisitions may also have unanticipated tax, regulatory andaccounting ramifications, including recording goodwill and nonamortizable intangible assets that are subject toimpairment testing on a regular basis and potential periodic impairment charges and incurring amortizationexpenses related to certain intangible assets. To consummate any such transactions, we may need to raiseexternal funds through the sale of equity or debt in the capital markets or through private placements, which mayaffect our liquidity and may dilute the value of our common stock.
We have also divested, and may in the future divest, businesses or business operations. Since 2012, we havedivested D.V. Travels Guru Pvt. Ltd. and Desiya Online Distribution Pvt. Ltd. (collectively “TravelGuru”), ZujiProperties A.V.V. and Zuji Pte Ltd along with its operating subsidiaries, Travelocity Business (“TBiz”),Travelocity Nordics, Holiday Autos, Sabre Pacific, TPN and other businesses. Any divestitures may involve anumber of risks, including the diversion of management’s attention, significant costs and expenses, the loss ofcustomer relationships and cash flow, and the disruption of the affected business or business operations. Failureto timely complete or to consummate a divestiture may negatively affect the valuation of the affected business orbusiness operations or result in restructuring charges.
Regulatory and Other Legal Risks
We may not be able to protect our intellectual property effectively, which may allow competitors toduplicate our products and services.
Our success and competitiveness depend, in part, upon our technologies and other intellectual property,including our brands. Among our significant assets are our proprietary and licensed software and otherproprietary information and intellectual property rights. We rely on a combination of copyright, trademark andpatent laws, laws protecting trade secrets, confidentiality procedures and contractual provisions to protect theseassets both in the United States and in foreign countries. The laws of some jurisdictions may provide lessprotection for our technologies and other intellectual property assets than the laws of the United States.
There is no certainty that our intellectual property rights will provide us with substantial protection orcommercial benefit. Despite our efforts to protect our intellectual property, some of our innovations may not beprotectable, and our intellectual property rights may offer insufficient protection from competition orunauthorized use, lapse or expire, be challenged, narrowed, invalidated, or misappropriated by third parties, or bedeemed unenforceable or abandoned, which, could have a material adverse effect on our business, financial
36

condition and results of operations and the legal remedies available to us may not adequately compensate us. Wecannot be certain that others will not independently develop, design around, or otherwise acquire equivalent orsuperior technology or intellectual property rights.
• While we take reasonable steps to protect our brands and trademarks, we may not be successful inmaintaining or defending our brands or preventing third parties from adopting similar brands. If ourcompetitors infringe our principal trademarks, our brands may become diluted or if our competitorsintroduce brands or products that cause confusion with our brands or products in the marketplace, thevalue that our consumers associate with our brands may become diminished, which could negativelyimpact revenue.
• Our patent applications may not be granted, and the patents we own could be challenged, invalidated,narrowed or circumvented by others and may not be of sufficient scope or strength to provide us withany meaningful protection or commercial advantage. Once our patents expire, or if they are invalidated,narrowed or circumvented, our competitors may be able to utilize the technology protected by ourpatents which may adversely affect our business.
• Although we rely on copyright laws to protect the works of authorship created by us, we do notgenerally register the copyrights in our copyrightable works where such registration is permitted.Copyrights of U.S. origin must be registered before the copyright owner may bring an infringement suitin the United States. Accordingly, if one of our unregistered copyrights of U.S. origin is infringed by athird-party, we will need to register the copyright before we can file an infringement suit in the UnitedStates, and our remedies in any such infringement suit may be limited.
• We use reasonable efforts to protect our trade secrets. However, protecting trade secrets can be difficultand our efforts may provide inadequate protection to prevent unauthorized use, misappropriation, ordisclosure of our trade secrets, know how, or other proprietary information.
• We also rely on our domain names to conduct our online businesses. While we use reasonable effortsto protect and maintain our domain names, if we fail to do so the domain names may become availableto others. Further, the regulatory bodies that oversee domain name registration may change theirregulations in a way that adversely affects our ability to register and use certain domain names.
We license software and other intellectual property from third parties. Such licensors may breach orotherwise fail to perform their obligations, or claim that we have breached or otherwise attempt to terminate theirlicense agreements with us. We also rely on license agreements to allow third parties to use our intellectualproperty rights, including our software, but there is no guarantee that our licensees will abide by the terms of ourlicense agreements or that the terms of our agreements will always be enforceable.
In addition, policing unauthorized use of and enforcing intellectual property can be difficult and expensive.The fact that we have intellectual property rights, including registered intellectual property rights, may not guaranteesuccess in our attempts to enforce these rights against third parties. Besides general litigation risks, changes in, orinterpretations of, intellectual property laws may compromise our ability to enforce our rights. We may not beaware of infringement or misappropriation, or elect not to seek to prevent it. Our decisions may be based on avariety of factors, such as costs and benefits of taking action, and contextual business, legal, and other issues. Anyinability to adequately protect our intellectual property on a cost-effective basis could harm our business.
Intellectual property infringement actions against us could be costly and time consuming to defend andmay result in business harm if we are unsuccessful in our defense.
Third parties may assert, including by means of counterclaims against us as a result of the assertion of ourintellectual property rights, that our products, services or technology, or the operation of our business, violate theirintellectual property rights. We are currently subject to such assertions, including patent infringement claims, andmay be subject to such assertions in the future. Such assertions may also be made against our customers who mayseek indemnification from us. In the ordinary course of business, we enter into agreements that contain indemnity
37
obligations whereby we are required to indemnify our customers against such assertions arising from our customers’usage of our products, services or technology. As the competition in our industry increases and the functionality oftechnology offerings further overlaps, such claims and counterclaims could become more common. We cannot becertain that we do not or will not infringe third parties’ intellectual property rights.
Legal proceedings involving intellectual property rights are highly uncertain, and can involve complex legaland scientific questions. Any intellectual property claim against us, regardless of its merit, could result in significantliabilities to our business, and can be expensive and time consuming to defend. Depending on the nature of suchclaims, our businesses may be disrupted, our management’s attention and other company resources may be divertedand we may be required to redesign, reengineer or rebrand our products and services, if feasible, to stop offeringcertain products and services or to enter into royalty or licensing agreements in order to obtain the rights to usenecessary technologies, which may not be available on terms acceptable to us, if at all, and may result in a decreaseof our competitive advantage. Our failure to prevail in such matters could result in loss of intellectual propertyrights, judgments awarding substantial damages, including possible treble damages and attorneys’ fees, andinjunctive or other equitable relief against us. If we are held liable, we may be unable to exploit some or all of ourintellectual property rights or technology. Even if we are not held liable, we may choose to settle claims by makinga monetary payment or by granting a license to intellectual property rights that we otherwise would not license.Further, judgments may result in loss of reputation, may force us to take costly remediation actions, delay sellingour products and offering our services, reduce features or functionality in our services or products, or cease suchactivities altogether. Insurance may not cover or be insufficient for any such claim.
Defects in our products may subject us to significant warranty liabilities or product liability claims andwe may have insufficient product liability insurance to pay material uninsured claims.
Our Airline and Hospitality Solutions business exposes us to the risk of product liability claims that areinherent in software development. We may inadvertently create defective software, or supply our customers withdefective software or software components that we acquire from third parties, which could result in personalinjury or property damage, and may result in warranty or product liability claims brought against us, our travelsupplier customers or third parties.
Under our Airline and Hospitality Solutions business’ agreements, we generally must indemnify ourcustomers for liability arising from intellectual property infringement claims with respect to our software. Theseindemnification obligations could be significant and we may not have adequate insurance coverage to protect usagainst all claims. We currently rely on a combination of self-insurance and third-party insurance to coverpotential product liability exposure. The combination of our insurance coverage, cash flows and reserves may notbe adequate to satisfy product liabilities we may incur in the future. Even meritless claims could subject us toadverse publicity, hinder us from securing insurance coverage in the future, require us to incur significant legalfees, decrease demand for any products that we successfully develop, divert management’s attention, and forceus to limit or forgo further development and commercialization of these products. The cost of any productliability litigation or other proceedings, even if resolved in our favor, could be substantial.
We are involved in various legal proceedings which may cause us to incur significant fees, costs andexpenses and may result in unfavorable outcomes.
We are involved in various legal proceedings that involve claims for substantial amounts of money or whichinvolve how we conduct our business. See “Business—Legal Proceedings.” For example, a number of state andlocal governments have filed lawsuits against us pertaining to sales or occupancy taxes they claim are due onsome or all of our fees relating to hotel content distributed and sold via the merchant revenue model. In themerchant revenue model, the customer pays us an amount at the time of booking that includes (i) service fees,which we collect, and (ii) the price of the hotel room and amounts for occupancy or other local taxes, which wepass along to the hotel supplier. The complaints generally allege, among other things, that we have failed to payto the relevant taxing authority hotel accommodations taxes on the service fees. Pursuant to the Expedia SMA,
38
we will continue to be liable for fees, charges, costs and settlements relating to litigation arising from hotelsbooked on the Travelocity platform prior to the Expedia SMA. However, fees, charges, costs and settlementsrelating to litigation from hotels booked subsequent to the Expedia SMA will be shared with Expedia accordingto the terms of the Expedia SMA. The Expedia SMA also requires us to guarantee Travelocity’s indemnificationobligations for liabilities that may arise out of such litigation matters. Even if we are successful in defendingthese types of lawsuits, state and local governments could adopt new ordinances directly taxing hotel bookingfees and we may not be able to successfully challenge such ordinances.
Additionally, we are involved in antitrust litigation with US Airways. If we cannot resolve this matterfavorably, we could be subject to (i) monetary damages, including treble damages under the antitrust laws and,depending on the amount of any such judgment, if we do not have sufficient cash on hand, we may be required toseek financing through the issuance of additional equity or from private or public financing or (ii) injunctiverelief. Other airlines might likewise seek to benefit from any unfavorable outcome by bringing their own claimsagainst us on the same or similar grounds. We are also subject to a U.S. Department of Justice (“DOJ”) antitrustinvestigation relating to the pricing and conduct of the airline distribution industry. We received a civilinvestigative demand (“CID”) from the DOJ and we are fully cooperating. The DOJ has also sent CIDs to othercompanies in the travel industry. Based on its findings in the investigation, the DOJ may (i) close the file,(ii) seek a consent decree to remedy issues it believes violate the antitrust laws, or (iii) file suit against us forviolating the antitrust laws, seeking injunctive relief. With respect to both the US Airways and DOJ proceedings,if injunctive relief were to be granted, depending on its scope, it could affect the manner in which our airlinedistribution business is operated and potentially force changes to the existing airline distribution business model.
In addition, we are involved in a number of antitrust class action lawsuits alleging a conspiracy amongOTAs and hotels to fix hotel prices. We are also involved from time to time with patent litigation with non-practicing entities or “patent trolls” that seek quick settlement payments that are often far less than the cost ofmounting a defense, regardless of the merits of the patent or whether or not we have actually infringed.
The defense of these actions, as well as any of the other actions described under “Business—LegalProceedings” and any other actions brought against us in the future, is time consuming and diverts management’sattention. Even if we are ultimately successful in defending ourselves in such matters, we are likely to incursignificant fees, costs and expenses as long as they are ongoing. Any of these consequences could have a materialadverse effect on our business, financial condition and results of operations.
We may not have sufficient insurance to cover our liability in pending litigation claims and future claimseither due to coverage limits or as a result of insurance carriers seeking to deny coverage of such claims,which in either case could expose us to significant liabilities.
We maintain third-party insurance coverage against various liability risks, including securities, shareholderderivative, ERISA, and product liability claims, as well as other claims that form the basis of litigation matterspending against us. We believe these insurance programs are an effective way to protect our assets against liabilityrisks. However, the potential liabilities associated with litigation matters pending against us, or that could arise inthe future, could exceed the coverage provided by such programs. In addition, our insurance carriers have sought ormay seek to rescind or deny coverage with respect to pending claims or lawsuits, completed investigations orpending or future investigations and other legal actions against us. See “Business—Legal Proceedings—InsuranceCarriers” for more information on our current litigation with our insurance carriers. If we do not have sufficientcoverage under our policies, or if the insurance companies are successful in rescinding or denying coverage, wemay be required to make material payments in connection with third-party claims.
Any failure to comply with regulations or any changes in such regulations governing our businessescould adversely affect us.
Parts of our business operate in regulated industries and could be adversely affected by unfavorable changes inor the enactment of new laws, rules or regulations applicable to us, which could decrease demand for our products
39
and services, increase costs or subject us to additional liabilities. Moreover, regulatory authorities have relativelybroad discretion to grant, renew and revoke licenses and approvals and to implement or interpret regulations.Accordingly, such regulatory authorities could prevent or temporarily suspend us from carrying on some or all ofour activities or otherwise penalize us if our practices were found not to comply with the applicable regulatory orlicensing requirements or any interpretation of such requirements by the regulatory authority. Our failure to complywith any of these requirements or interpretations could have a material adverse effect on our operations. Inparticular, after a voluntary disclosure, we received a warning letter from the Bureau of Industry and Securityregarding our failure to comply fully with the Export Administration Regulations as to software updates for a fewtravel agency customers located outside the United States. Although the Bureau of Industry and Security declined toprosecute or sanction us, if we were to violate the Export Administration Regulations again, the matter could bereopened or taken into consideration when investigating future matters and we may be subject to criminalprosecution or administrative sanctions.
Further, the United States has imposed economic sanctions that affect transactions with designated foreigncountries, including Cuba, Iran, Sudan and Syria, and nationals and others of those countries, and certainspecifically targeted individuals and entities engaged in conduct detrimental to U.S. national security interests.These sanctions are administered by the U.S. Department of the Treasury’s Office of Foreign Assets Control(“OFAC”) and are typically known as the OFAC regulations. For a description of OFAC regulations andadditional information on economic sanctions, see “Business—Government Regulation—Office of Foreign AssetControl Regulation.” Failure to comply with such regulations could subject us to legal and reputationalconsequences, including civil and criminal penalties.
We have GDS contracts with carriers that fly to Cuba, Iran, Sudan and Syria but are based outside of thosecountries and are not owned by those governments or nationals of those governments. With respect to Iran,Sudan and Syria we believe that our activities comply with certain travel-related exemptions. With respect toCuba, for customers outside the United States we display on the Sabre GDS flight information for, and supportbooking and ticketing of, services of non-Cuban airlines that offer service to Cuba. Based on advice of counsel,we believe these activities to fall under an exemption from OFAC regulations applicable to the transmission ofinformation and informational materials and transactions related thereto.
We believe that our activities with respect to these countries are known to OFAC. We note, however, thatOFAC regulations and related interpretive guidance are complex and subject to varying interpretations. Due tothis complexity, OFAC’s interpretation of its own regulations and guidance vary on a case to case basis. As aresult, we cannot provide any guarantees that OFAC will not challenge any of our activities in the future, whichcould have a material adverse effect on our results of operations.
In Europe, GDS regulations or interpretations thereof may increase our cost of doing business or lower ourrevenues, limit our ability to sell marketing data, impact relationships with travel buyers, airlines, rail carriersor others, impair the enforceability of existing agreements with travel buyers and other users of our system,prohibit or limit us from offering services or products, or limit our ability to establish or change fees. Althoughregulations specifically governing GDSs have been lifted in the United States, they remain subject to generalregulation regarding unfair trade practices by the U.S. Department of Transportation (“DOT”). In addition,continued regulation of GDSs in the EU and elsewhere could also create the operational challenge of supportingdifferent products, services and business practices to conform to the different regulatory regimes. See“Business—Government Regulation—Computer Reservations System Industry Regulation” for additionalinformation. We do not currently maintain a central database of all regulatory requirements affecting ourworldwide operations and, as a result, the risk of non-compliance with the laws and regulations described aboveis heightened. Our failure to comply with these laws and regulations may subject us to fines, penalties andpotential criminal violations. Any changes to these laws or regulations or any new laws or regulations may makeit more difficult for us to operate our business.
40
Our collection, processing, storage, use and transmission of personal data could give rise to liabilities asa result of governmental regulation, conflicting legal requirements, differing views on data privacy orsecurity breaches.
In our processing of travel transactions, we collect, process, store, use and transmit large amounts ofsensitive personal data. This information is increasingly subject to legal restrictions around the world, which mayresult in conflicting legal requirements in the United States and other jurisdictions. For example, the U.S.Congress and federal agencies, including the Federal Trade Commission, have started to take a more aggressivestance in drafting and enforcing privacy and data protection laws. The EU is also in the process of proposingreforms to its existing data protection legal framework. These legal restrictions are generally intended to protectthe privacy and security of personal information, including credit card information that is collected, processedand transmitted in or from the governing jurisdiction. Companies that handle this type of data have also beensubject to investigations, lawsuits and adverse publicity due to allegedly improper disclosure or use of sensitivepersonal information. As privacy and data protection becomes an increasingly politicized issue, we may alsobecome exposed to potential liabilities as a result of conflicting legal requirements, differing views on theprivacy of travel data or failure to comply with applicable requirements. Our business could be materiallyadversely affected if we are unable to comply with legal restrictions on the use of sensitive personal informationor if such restrictions are expanded to require changes in our current business practices or are interpreted in waysthat conflict with or negatively impact our present or future business practices.
We are exposed to risks associated with payment card industry (“PCI”) compliance.
The PCI Data Security Standard (“PCI DSS”) is a set of comprehensive requirements endorsed by creditcard issuers for enhancing payment account data security that includes requirements for security management,policies, procedures, network architecture, software design and other critical protective measures. PCI DSScompliance is required in order to maintain credit card processing facilities. The cost of compliance with the PCIDSS is significant and may increase. Although we are currently in compliance with the PCI DSS, compliancedoes not guarantee a completely secure environment. Moreover, compliance is an ongoing activity, since theformal requirements evolve as new threats and protective measures are identified. In the event that we were tolose PCI DSS compliance (or fail to achieve compliance with a future version of the PCI DSS), we could beexposed to fines and penalties and, in extreme circumstances, may have our credit card processing privilegesrevoked, which would have a material adverse effect on our business.
We may have higher than anticipated tax liabilities.
We are subject to a variety of taxes in many jurisdictions globally, including income taxes in the UnitedStates at the federal, state and local levels, and in many other countries. Significant judgment is required indetermining our worldwide provision for income taxes. In the ordinary course of our business, there are manytransactions and calculations where the ultimate tax determination is uncertain. We operate in numerouscountries where our income tax returns are subject to audit and adjustment by local tax authorities. Because weoperate globally, the nature of the uncertain tax positions is often very complex and subject to change, and theamounts at issue can be substantial. It is inherently difficult and subjective to estimate such amounts, as we haveto determine the probability of various possible outcomes. We re-evaluate uncertain tax positions on a quarterlybasis. This evaluation is based on factors including, but not limited to, changes in facts or circumstances, changesin tax law, effectively settled issues under audit and new audit activity. Although we believe our tax estimates arereasonable, the final determination of tax audits could be materially different from our historical income taxprovisions and accruals. Our effective tax rate may change from year to year based on changes in the mix ofactivities and income allocated or earned among various jurisdictions, tax laws in these jurisdictions, tax treatiesbetween countries, our eligibility for benefits under those tax treaties, and the estimated values of deferred taxassets and liabilities. Such changes could result in an increase in the effective tax rate applicable to all or aportion of our income which would reduce our profitability.
We establish reserves for our potential liability for U.S. and non-U.S. taxes, including sales, occupancy andvalue-added taxes (“VAT”), consistent with applicable accounting principles and in light of all current facts and
41

circumstances. We have also established reserves relating to the collection of refunds related to value-addedtaxes, which are subject to audit and collection risks in various regions of Europe. Recently our right to recovercertain value-added tax receivables associated with our European businesses has been questioned by taxauthorities. These reserves represent our best estimate of our contingent liability for taxes. The interpretation oftax laws and the determination of any potential liability under those laws are complex, and the amount of ourliability may exceed our established reserves.
We consider the undistributed earnings of our foreign subsidiaries as of December 31, 2013 to beindefinitely reinvested and, accordingly, no U.S. income taxes have been provided thereon. As of December 31,2013, the amount of indefinitely reinvested foreign earnings was approximately $157 million. As of December31, 2013, $70.8 million of cash, cash equivalents, and marketable securities were held by our foreignsubsidiaries. If such cash, cash equivalents and marketable securities are needed for our operations in the UnitedStates, we would be required to accrue and pay taxes on up to $44 million of these funds to repatriate all suchcash, cash equivalents and marketable securities. We have not, nor do we anticipate the need to, repatriate fundsto the United States to satisfy domestic liquidity needs arising in the ordinary course of business, includingliquidity needs associated with our domestic debt service requirements.
New tax laws, statutes, rules, regulations or ordinances could be enacted at any time and existing tax laws,statutes, rules, regulations and ordinances could be interpreted, changed, modified or applied adversely to us.These events could require us to pay additional tax amounts on a prospective or retroactive basis, as well asrequire us to pay fees, penalties or interest for past amounts deemed to be due. For example, there have beenproposals to amend U.S. tax laws that would significantly impact how U.S. companies are taxed on foreignearnings. New, changed, modified or newly interpreted or applied laws could also increase our compliance,operating and other costs, as well as the costs of our products and services.
We will be required to pay our Existing Stockholders 85% of certain tax benefits related to Pre-IPO TaxAssets, and could be required to make substantial cash payments in which the stockholders purchasingshares in this offering will not participate.
Immediately prior to the completion of this offering, we will enter into a TRA that provides the right toreceive future payments by us to our Existing Stockholders of 85% of the amount of cash savings, if any, in U.S.federal income tax that we and our subsidiaries realize as a result of the utilization of the Pre-IPO Tax Assets.Consequently, stockholders purchasing shares in this offering will only be entitled to the economic benefit of thePre-IPO Tax Assets to the extent of our continuing 15% interest in those assets. See “Certain Relationships andRelated Party Transactions—Tax Receivable Agreement.”
These payment obligations will be our obligations and not obligations of any of our subsidiaries. The actualutilization of the Pre-IPO Tax Assets, as well as the timing of any payments under the TRA, will vary dependingupon a number of factors, including the amount, character and timing of our and our subsidiaries’ taxable incomein the future.
We expect that the payments we make under this TRA will be material. Based on current tax laws andassuming that we and our subsidiaries earn sufficient taxable income to realize the full tax benefits subject to theTRA, we expect that future payments under the TRA relating to the Pre-IPO Tax Assets could aggregate tobetween $330 million and $380 million over the next six years (assuming no changes to current limitations onour ability to utilize our NOLs under Section 382 of the Code), which we estimate will represent approximately85% to 95% of total payments we will be required to make under the TRA.
Upon the effective date of the TRA, we expect to recognize a liability of between $310 million and $350million (after considering the valuation allowance of approximately $72 million recorded against the Pre-IPOTax Assets) for the payments to be made under the TRA, which will be accounted for as a reduction of additionalpaid-in capital on our consolidated balance sheet.
42
Changes in the utility of the Pre-IPO Tax Assets will impact the amount of the liability that will be paid toour Existing Stockholders. Changes in the utility of these Pre-IPO Tax Assets are recorded in income tax expense(benefit) and any changes in the obligation under the TRA is recorded in other income (expense).
In addition, the TRA provides that upon certain mergers, stock and asset sales, other forms of businesscombinations or other changes of control, the TRA will terminate and we will be required to make a paymentintended to equal to the present value of future payments under the TRA, which payment would be based oncertain assumptions, including those relating to our and our subsidiaries’ future taxable income. In thesesituations, our obligations under the TRA could have a substantial negative impact on our liquidity and couldhave the effect of delaying, deferring or preventing certain mergers, asset sales, other forms of businesscombinations or other changes of control.
Different timing rules will apply to payments under the TRA to be made to holders that, prior to thecompletion of the offering, hold stock options and restricted stock units (collectively, the “Award Holders”).Such payments will generally be deemed invested in a notional account rather than made on the scheduledpayment dates, and the account will be distributed on the fifth anniversary of the initial public offering, togetherwith an amount equal to the net present value of such Award Holder’s future expected payments, if any, underthe TRA. Moreover, payments to holders of stock options that are unvested prior to the completion of thisoffering will be subject to vesting on the same schedule as such holder’s unvested stock options.
The TRA contains a Change of Control definition that includes, among other things, a change of a majorityof the Board of Directors without approval of a majority of the then existing Board members (the “ContinuingDirectors Provision”). Recent Delaware case law has stressed that such Continuing Directors Provisions couldhave a potential adverse impact on shareholders’ right to elect a company’s directors. In this regard, decisions ofthe Delaware Chancery Court (not involving us or our securities) have considered change of control provisionsand noted that a board of directors may “approve” a dissident shareholders’ nominees solely to avoid triggeringthe change of control provisions, without supporting their election, if the board determines in good faith that theelection of the dissident nominees would not be materially adverse to the interests of the corporation or itsstockholders. Further, according to these decisions, the directors’ duty of loyalty to shareholders under Delawarelaw may, in certain circumstances, require them to give such approval.
Our counterparties under the TRA will not reimburse us for any payments previously made under the TRAif such benefits are subsequently disallowed (although future payments would be adjusted to the extent possibleto reflect the result of such disallowance). As a result, in certain circumstances, payments could be made underthe TRA in excess of our cash tax savings.
Certain transactions by the company could cause it to recognize taxable income (possibly material amountsof income) without a current receipt of cash. Payments under the TRA with respect to such taxable income wouldcause a net reduction in our available cash. For example, transactions giving rise to cancellation of debt income,the accrual of income from original issue discount or deferred payments, a “triggering event” requiring therecapture of dual consolidated losses, or “Subpart F” income would each produce income with no correspondingincrease in cash. In these cases, we may use some of the Pre-IPO Tax Assets to offset income from thesetransaction and, under the TRA, would be required to make a payment to our Existing Stockholders even thoughwe receive no cash from such income.
Because we are a holding company with no operations of our own, our ability to make payments under theTRA is dependent on the ability of our subsidiaries to make distributions to us. To the extent that we are unableto make payments under the TRA for specified reasons, such payments will be deferred and will accrue interestat a rate of the London Interbank Offered Rate (“LIBOR”) plus 1.00% per annum until paid.
If we did not enter into the TRA, we would be entitled to realize the full economic benefit of the Pre-IPOTax Assets. The TRA is designed with the objective of causing our annual cash costs attributable to federal
43
income taxes (without regard to our continuing 15% interest in the Pre-IPO Tax Assets) to be the same as wewould have paid had we not had the Pre-IPO Tax Assets available to offset our federal taxable income. As aresult, stockholders purchasing shares in this offering will not be entitled to the economic benefit of the Pre-IPOTax Assets that would have been available if the TRA were not in effect (except to the extent of our continuing15% interest in the Pre-IPO Tax Assets).
Our pension plan obligations are currently unfunded, and we may have to make significant cashcontributions to our plans, which could reduce the cash available for our business.
Our pension plans in the aggregate are underfunded by approximately $55 million as of December 31, 2013.With approximately 5,300 participants in our pension plans, we incur substantial costs relating to pension benefits,which can vary substantially as a result of changes in healthcare laws and costs, volatility in investment returns onpension plan assets and changes in discount rates used to calculate related liabilities. Our estimates of liabilities andexpenses for pensions and other post-retirement healthcare benefits require the use of assumptions, includingassumptions relating to the rate used to discount the future estimated liability, the rate of return on plan assets,inflation and several assumptions relating to the employee workforce (medical costs, retirement age and mortality).Actual results may differ, which may have a material adverse effect on our business, prospects, financial conditionor results of operations. Future volatility and disruption in the stock markets could cause a decline in the assetvalues of our pension plans. In addition, a decrease in the discount rate used to determine minimum fundingrequirements could result in increased future contributions. If either occurs, we may need to make additionalpension contributions above what is currently estimated, which could reduce the cash available for our businesses.
We may recognize impairments on long-lived assets, including goodwill and other intangible assets, orrecognize impairments on our equity method investments.
Our consolidated balance sheet at December 31, 2013 contained intangible assets, net, including goodwill,of approximately $2,773 million. Our investments in joint ventures on the consolidated balance sheet as ofDecember 31, 2013 includes $93 million of excess basis over our underlying equity in joint ventures. Thisdifferential represents goodwill in addition to identifiable intangible assets which are being amortized to jointventure intangible amortization over their estimated lives. Future acquisitions that result in the recognition ofadditional goodwill and intangible assets would cause an increase in these types of assets. We do not amortizegoodwill and intangible assets that are determined to have indefinite useful lives, but we amortize definite-livedintangible assets on a straight-line basis over their useful economic lives, which range from four to thirty years,depending on classification.
We evaluate goodwill for impairment on an annual basis or earlier if impairment indicators exist and weevaluate definite-lived intangible assets for impairment whenever events or changes in circumstances indicatethat the carrying amount of definite-lived intangible assets used in combination to generate cash flows largelyindependent of other assets may not be recoverable. We record an impairment charge whenever the estimated fairvalue of our reporting units or of such intangible assets is less than its carrying value. We have also recognized ashare of impairment charges recorded by one of our equity method investments, Abacus. As of June 30, 2013,our Travelocity reporting unit had no remaining goodwill.
The fair values used in our impairment evaluation are estimated using a combined approach based upondiscounted future cash flow projections and observed market multiples for comparable businesses. Changes inestimates based on changes in risk-adjusted discount rates, future booking and transaction volume levels, futureprice levels, rates of growth in our consumer and corporate direct booking businesses, rates of increase inoperating expenses, cost of revenue and taxes could result in material impairment charges.
44
Risks Related to Our Indebtedness and Liquidity
We may require more cash than we generate in our operating activities, and additional funding onreasonable terms or at all may not be available.
We cannot guarantee that our business will generate sufficient cash flow from operations to fund our capitalinvestment requirements or other liquidity needs. For example, with the migration of our U.S. and CanadianTravelocity businesses to the Expedia platform, our working capital will decrease as we pay travel suppliers fortravel booked on our platform, without being offset by new bookings. Moreover, because we are a holdingcompany with no material direct operations, we depend on loans, dividends and other payments from oursubsidiaries to generate the funds necessary to meet our financial obligations. Our subsidiaries are legally distinctfrom us and may be prohibited or restricted from paying dividends or otherwise making funds available to usunder certain conditions.
As a result, we may be required to finance our cash needs through public or private equity offerings, bankloans, additional debt financing or otherwise. Our ability to arrange financing and the cost of such financing aredependent on numerous factors, including but not limited to:
• general economic and capital market conditions;
• the availability of credit from banks or other lenders;
• investor confidence in us; and
• our results of operations.
There can be no assurance that financing will be available on terms favorable to us or at all, which couldforce us to delay, reduce or abandon our growth strategy, increase our financing costs, or both. Additionalfunding from debt financings may make it more difficult for us to operate our business because a portion of ourcash generated from internal operations would be used to make principal and interest payments on theindebtedness and we may be obligated to abide by restrictive covenants contained in the debt financingagreements, which may, among other things, limit our ability to make business decisions and further limit ourability to pay dividends.
In addition, any downgrade of our debt ratings by Standard & Poor’s, Moody’s Investor Service or similarratings agencies, increases in general interest rate levels and credit spreads or overall weakening in the creditmarkets could increase our cost of capital. Furthermore, raising capital through public or private sales of equityto finance acquisitions or expansion could cause earnings or ownership dilution to your shareholding interests inour company.
We have a significant amount of indebtedness, which could adversely affect our cash flow and our abilityto operate our business and to fulfill our obligations under our indebtedness.
We have a significant amount of indebtedness. As of December 31, 2013, on an as adjusted basis aftergiving effect to this offering and the application of the net proceeds from this offering as described under “Use ofProceeds,” we would have had $3,230 million of indebtedness outstanding in addition to $286 million ofavailability under the revolving portion of our Credit Facility (as defined in “Description of CertainIndebtedness”), after taking into account the availability reduction of $66 million for letters of credit issued underthe revolving portion. Of this indebtedness, none will be due on or before the end of 2014. See “Description ofCertain Indebtedness—Senior Secured Credit Facilities” for a description of the amendments to the CreditFacility after December 31, 2013. Our substantial level of indebtedness will increase the possibility that we maynot generate enough cash flow from operations to pay, when due, the principal of, interest on or other amountsdue in respect of, these obligations. Other risks relating to our long-term indebtedness include:
• increased vulnerability to general adverse economic and industry conditions;
• higher interest expense if interest rates increase on our floating rate borrowings and our hedgingstrategies do not effectively mitigate the effects of these increases;
45
• need to divert a significant portion of our cash flow from operations to payments on our indebtedness,thereby reducing the availability of cash to fund working capital, capital expenditures, acquisitions,investments and other general corporate purposes;
• limited ability to obtain additional financing, on terms we find acceptable, if needed, for workingcapital, capital expenditures, expansion plans and other investments, which may adversely affect ourability to implement our business strategy;
• limited flexibility in planning for, or reacting to, changes in our businesses and the markets in whichwe operate or to take advantage of market opportunities; and
• a competitive disadvantage compared to our competitors that have less debt.
In addition, it is possible that we may need to incur additional indebtedness in the future in the ordinarycourse of business. The terms of our Credit Facility, the indentures governing the 2016 Notes and the 2019 Notes(each as defined in “Description of Certain Indebtedness”) allow us to incur additional debt subject to certainlimitations. If new debt is added to current debt levels, the risks described above could intensify. In addition, ourinability to maintain certain leverage ratios could result in acceleration of a portion of our debt obligations andcould cause us to be in default if we are unable to repay the accelerated obligations.
The terms of our debt covenants could limit our discretion in operating our business and any failure tocomply with such covenants could result in the default of all of our debt.
The agreements governing our indebtedness contain and the agreements governing our future indebtedness willlikely contain various covenants, including those that restrict our or our subsidiaries’ ability to, among other things:
• incur liens on our property, assets and revenue;
• borrow money, and guarantee or provide other support for the indebtedness of third parties;
• pay dividends or make other distributions on, redeem or repurchase our capital stock;
• prepay, redeem or repurchase certain of our indebtedness;
• enter into certain change of control transactions;
• make investments in entities that we do not control, including joint ventures;
• enter into certain asset sale transactions, including divestiture of certain company assets and divestitureof capital stock of wholly-owned subsidiaries;
• enter into certain transactions with affiliates;
• enter into secured financing arrangements;
• enter into sale and leaseback transactions;
• change our fiscal year; and
• enter into substantially different lines of business.
These covenants may limit our ability to effectively operate our businesses or maximize stockholder value.In addition, our Credit Facility requires that we meet certain financial tests, including the maintenance of aleverage ratio and a minimum net worth. Our ability to satisfy these tests may be affected by factors and eventsbeyond our control, and we may be unable to meet such tests in the future.
Any failure to comply with the restrictions of our Credit Facility, the indentures governing the 2016 Notesand the 2019 Notes or any agreement governing our other indebtedness may result in an event of default underthose agreements. Such default may allow the creditors to accelerate the related debt, which may trigger cross-acceleration or cross-default provisions in other debt. In addition, lenders may be able to terminate anycommitments they had made to supply us with further funds.
46
We are exposed to interest rate fluctuations.
Our floating rate indebtedness exposes us to fluctuations in prevailing interest rates. To reduce the impact oflarge fluctuations in interest rates, we typically hedge a portion of our interest rate risk by entering into derivativeagreements with financial institutions. Our exposure to interest rates relates primarily to our borrowings underthe Credit Facility. See “Description of Certain Indebtedness.”
The derivative agreements that we use to manage the risk associated with fluctuations in interest rates maynot be able to eliminate the exposure to these changes. Interest rates are sensitive to numerous factors outside ofour control, such as government and central bank monetary policy in the jurisdictions in which we operate.Depending on the size of the exposures and the relative movements of interest rates, if we choose not to hedge orfail to effectively hedge our exposure, we could experience a material adverse effect on our results of operationsand financial condition. As of December 31, 2013, we have entered into floating-to-fixed interest rate swaps thateffectively convert $750 million of floating interest rate senior secured debt into a fixed rate obligation. See“Management’s Discussion and Analysis of Financial Condition and Results of Operations—Quantitative andQualitative Disclosures about Market Risk—Interest Rate Risk.”
We are exposed to exchange rate fluctuations.
We conduct various operations outside the United States, primarily in Canada, South America, Europe,Australia and Asia. For the years ended December 31, 2013 and 2012, we incurred $682 million and $708million in foreign currency operating expenses, representing approximately 25% and 23% of our total operatingexpenses, respectively. Our most significant foreign currency operating expenses are in the Euro, representingapproximately 9% and 7% of our operating expenses for the years ended December 31, 2013 and December 31,2012, respectively. As a result, we face exposure to movements in currency exchange rates. These exposuresinclude but are not limited to:
• re-measurement gains and losses from changes in the value of foreign denominated assets andliabilities;
• translation gains and losses on foreign subsidiary financial results that are translated into U.S. dollars,our functional currency, upon consolidation;
• planning risk related to changes in exchange rates between the time we prepare our annual andquarterly forecasts and when actual results occur; and
• the impact of relative exchange rate movements on cross-border travel, principally travel betweenEurope and the United States.
Depending on the size of the exposures and the relative movements of exchange rates, if we choose not tohedge or fail to hedge effectively our exposure, we could experience a material adverse effect on our results ofoperations and financial condition. As we have seen in some recent periods, in the event of severe volatility inexchange rates, these exposures can increase, and the impact on our results of operations and financial conditioncan be more pronounced. In addition, the current environment and the increasingly global nature of our businesshave made hedging these exposures more complex and costly.
To reduce the impact of this earnings volatility, we hedge approximately 43% of our foreign currencyexposure by entering into foreign currency forward contracts on several of our largest foreign currencyexposures, including the Euro, the British Pound Sterling, the Polish Zloty and the Indian Rupee. The notionalamounts of these forward contracts, totaling $123 million at December 31, 2013, represent obligations topurchase foreign currencies at a predetermined exchange rate to fund a portion of our expenses that aredenominated in foreign currencies. Such derivative instruments are short-term in nature and not designed tohedge against currency fluctuation that could impact our foreign currency denominated revenue or cost ofrevenue. See “Management’s Discussion and Analysis of Financial Condition and Results of Operations—Quantitative and Qualitative Disclosures about Market Risk—Foreign Currency Risk” and Note 12, Derivatives,
47
to our unaudited consolidated financial statements included elsewhere in this prospectus. Although we haveincreased and may continue to increase the scope, complexity and duration of our foreign exchange riskmanagement strategy, our current or future hedging activities may not sufficiently protect us from the adverseeffects of currency exchange rate movements. Moreover, we make a number of estimates in conducting hedgingactivities, including in some cases the level of future bookings, cancellations, refunds, customer stay patterns andpayments in foreign currencies. In the event those estimates differ significantly from actual results, we couldexperience greater volatility as a result of our hedging activities.
Risks Related to the Offering and Our Common Stock
An active trading market may not develop or be sustained.
Although we have applied to list our common stock on the NASDAQ, it is possible that, after this offering,an active trading market will not develop or continue. As a result, shareholders may have difficulty selling theirshares or selling their shares at a certain price. In addition, the initial public offering price or future price of ourcommon stock may not reflect our actual financial performance.
The initial public offering price per share of our common stock will be determined by negotiation among usand the representatives of the underwriters and may not be indicative of the price at which the shares of ourcommon stock will trade in the public market after this offering.
The market price and trading volume of our common stock may be volatile, which could result in rapidand substantial losses for our stockholders.
Even if an active trading market develops, the market price of our common stock may be highly volatile andcould be subject to wide fluctuations. In addition, the trading volume in our common stock may fluctuate andcause significant price variations to occur. If the market price of our common stock declines significantly, youmay be unable to resell your shares at or above the price at which you purchased them, if at all. The market priceof our common stock may fluctuate or decline significantly in the future. Factors that could negatively affect ourshare price or result in fluctuations in the price or trading volume of our common stock include, but are notlimited to, those listed elsewhere in this “Risk Factors” section and the following, some of which are beyond ourcontrol regardless of our actual operating performance:
• actual or anticipated quarterly variations in operational results and reactions to earning releases or otherpresentations by company executives;
• failure to meet the expectations of securities analysts and investors;
• rating agency credit rating actions;
• the contents of published research reports about us or our industry or the failure of securities analysts tocover our common stock after this offering;
• any increased indebtedness we may incur in the future;
• actions by institutional stockholders;
• speculation or reports by the press or the investment community with respect to us or our industry ingeneral;
• increases in market interest rates that may lead purchasers of our shares to demand a higher yield;
• changes in our capital structure;
• announcements of dividends;
• future sales of our common stock by us, the Principal Stockholders or members of our management;
48
• announcements of technological innovations or new services by us or our competitors or new entrantsinto the industry;
• announcements by us, our competitors or vendors of significant contracts, acquisitions, joint marketingrelationships, joint ventures or capital commitments;
• loss of a major travel supplier or global travel agency subscriber;
• changes in the status of intellectual property rights;
• third-party claims or proceedings against us or adverse developments in pending proceedings;
• additions or departures of key personnel;
• changes in applicable laws and regulations;
• negative publicity for us, our business or our industry;
• changes in expectations or estimates as to our future financial performance or market valuations ofcompetitors, customers or travel suppliers;
• results of operations of our competitors; and
• general market, political and economic conditions, including any such conditions and local conditionsin the markets in which our customers are located.
Volatility in our stock price could also make us less attractive to certain investors, and/or invite speculativetrading in our common stock or debt instruments.
In addition, securities exchanges, and in particular the NASDAQ, have experienced extreme price andvolume fluctuations that have affected and continue to affect the market prices of equity securities of manytechnology companies. In the past, stockholders have instituted securities class action litigation following periodsof market volatility. If we were involved in securities litigation, we could incur substantial costs and ourresources and the attention of management could be diverted from our business.
Maintaining and improving our financial controls and the requirements of being a public company maystrain our resources, divert management’s attention and affect our ability to attract and retain qualifiedboard members.
As a public company, we will be subject to the reporting requirements of the Securities Exchange Act of1934 (the “Exchange Act”), the Sarbanes-Oxley Act of 2002 (the “Sarbanes-Oxley Act”), the Dodd-Frank WallStreet Reform and Consumer Protection Act of 2010 (the “Dodd-Frank Act”) and the NASDAQ rules. Therequirements of these rules and regulations will significantly increase our legal and financial compliance costs,including costs associated with the hiring of additional personnel, making some activities more difficult, time-consuming or costly, and may also place undue strain on our personnel, systems and resources. The ExchangeAct requires, among other things, that we file annual, quarterly and current reports with respect to our businessand financial condition.
The Sarbanes-Oxley Act requires, among other things, that we maintain disclosure controls and proceduresand internal control over financial reporting. Ensuring that we have adequate internal financial and accountingcontrols and procedures in place is a costly and time-consuming effort that needs to be re-evaluated frequently.We are in the initial stage of documenting our internal control procedures and have not begun testing theseprocedures in order to comply with the requirements of Section 404 of the Sarbanes-Oxley Act (“Section 404”).Section 404 will require that we evaluate our internal control over financial reporting to enable management toreport on, and our independent auditors to audit as of the end of our fiscal year ended December 31, 2015, theeffectiveness of those controls. Both we and our independent registered public accounting firm will be testing ourinternal controls in connection with the Section 404 requirements and could, as part of that documentation andtesting, identify material weaknesses, significant deficiencies or other areas for further attention or improvement.
49
Implementing any appropriate changes to our internal controls may require specific compliance training for ourdirectors, officers and employees, require the hiring of additional finance, accounting and other personnel, entailsubstantial costs to modify our existing accounting systems, and take a significant period of time to complete.Such changes may not, however, be effective in maintaining the adequacy of our internal controls, and anyfailure to maintain that adequacy, or consequent inability to produce accurate financial statements on a timelybasis, could increase our operating costs and could materially impair our ability to operate our business.Moreover, adequate internal controls are necessary for us to produce reliable financial reports and are importantto help prevent fraud. As a result, our failure to satisfy the requirements of Section 404 on a timely basis couldresult in the loss of investor confidence in the reliability of our financial statements, which in turn could cause themarket value of our common stock to decline.
Various rules and regulations applicable to public companies make it more difficult and more expensive forus to maintain directors’ and officers’ liability insurance, and we may be required to accept reduced coverage orincur substantially higher costs to maintain coverage. If we are unable to maintain adequate directors’ andofficers’ liability insurance, our ability to recruit and retain qualified officers and directors, especially thosedirectors who may be deemed independent for purposes of the NASDAQ rules, will be significantly curtailed.
If you invest in this offering, you will experience immediate and substantial dilution.
We expect that the initial public offering price of our common stock will be substantially higher than the proforma net tangible book value per share issued and outstanding immediately after this offering. Our pro forma nettangible book value per share as of December 31, 2013 after giving effect to the Redemption was approximately$(15.41) and represents the amount of book value of our total tangible assets minus the book value of our totalliabilities, divided by the number of our shares of common stock then issued and outstanding as of March 31,2014. Investors who purchase common stock in this offering will pay a price per share that substantially exceedsthe net tangible book value per share of common stock. If you purchase shares of our common stock in thisoffering, you will experience immediate and substantial dilution of $30.84 in the pro forma net tangible bookvalue per share, based upon the initial public offering price of $19.00 per share (the midpoint of the estimatedinitial public offering price range set forth on the cover of this prospectus). Investors that purchase common stockin this offering will have purchased 18% of the shares issued and outstanding immediately after the offering, butwill have paid 38% of the total consideration for those shares. See “Dilution.”
Concentration of ownership among our Principal Stockholders may prevent new investors frominfluencing significant corporate decisions and may result in conflicts of interest.
Upon consummation of this offering our Principal Stockholders will own, in the aggregate, approximately79% of our outstanding common stock and will own, in the aggregate, approximately 77% of our outstandingcommon stock if the underwriters’ option to purchase additional shares is fully exercised. Pursuant to theStockholders’ Agreement, at the completion of this offering, the Silver Lake Funds and the TPG Funds will havethe right to designate for nomination two directors and three directors, respectively, which collectively willrepresent a majority of the members of our board of directors. In addition, the Silver Lake Funds and the TPGFunds also jointly have the right to designate for nomination in the future, in connection with the expansion ofour board of directors by one member, one additional director, defined herein as the Joint Designee, who mustqualify as independent under the NASDAQ rules and must meet the independence requirements of Rule 10A-3of the Exchange Act so long as they collectively own at least 10% of their collective Closing Date Shares (asdefined in “Certain Relationships and Related Party Transactions—Stockholders’ Agreement”). As a result, thePrincipal Stockholders will be able to exercise significant influence over all matters requiring stockholderapproval, including: the election of directors; approval of mergers or a sale of all or substantially all of our assetsand other significant corporate transactions; and the amendment of our Certificate of Incorporation and ourBylaws (each as defined in “Description of Capital Stock”). This concentration of influence may delay, deter orprevent acts that would be favored by our other stockholders, who may have interests different from those of ourPrincipal Stockholders. For example, our Principal Stockholders could delay or prevent an acquisition or mergerdeemed beneficial to other stockholders, or seek to cause us to take courses of action that, in their judgment,
50

could enhance their investment in us, but which might involve risks to our other stockholders or adversely affectus or our other stockholders, including investors in this offering. Our Principal Stockholders may be able to causeor prevent a change in control of us or a change in the composition of our board of directors and could precludeany unsolicited acquisition of us. This may have the effect of delaying, preventing or deterring a change incontrol. In addition, this significant concentration of share ownership may adversely affect the trading price ofour common stock because investors often perceive disadvantages in owning common stock in companies withPrincipal Stockholders.
We expect to be a “controlled company” within the meaning of the NASDAQ rules and, as a result, wewill qualify for exemptions from certain corporate governance requirements. You may not have the sameprotections afforded to stockholders of companies that are subject to such requirements.
Because the Principal Stockholders will own a majority of our outstanding common stock following thecompletion of this offering, we will be considered a “controlled company” as that term is set forth in theNASDAQ rules. Under these rules, a company of which more than 50% of the voting power is held by anotherperson or group of persons acting together is a “controlled company” and may elect not to comply with certainNASDAQ rules regarding corporate governance, including:
• the requirement that a majority of our board of directors consist of independent directors;
• the requirement that our governance and nominating committee be composed entirely of independentdirectors; and
• the requirement that our compensation committee be composed entirely of independent directors with awritten charter addressing the committee’s purpose and responsibilities.
Following this offering, we will qualify for these exemptions. As a result, we may not have a majority ofindependent directors and our governance and nominating committee and compensation committee may not consistentirely of independent directors. See “Management and Board of Directors—Board Composition” and Managementand Board of Directors—Committees of the Board of Directors” for a description of the current composition of ourboard of directors and each of our committees. As a result, you may not have the same protections afforded tostockholders of companies that are subject to all of the NASDAQ rules regarding corporate governance. Our status as acontrolled company could make our common stock less attractive to some investors or otherwise harm our stock price.
Future issuances of debt or equity securities by us may adversely affect the market price of our common stock.
After this offering, assuming the underwriters exercise their option to purchase additional shares in full, wewill have an aggregate of 710,446,201 shares of common stock authorized but unissued and not reserved forissuance under our incentive plans. We may issue all of these shares of common stock without any action orapproval by our stockholders, subject to certain exceptions.
In the future, we may attempt to obtain financing or to increase further our capital resources by issuingadditional shares of our common stock or offering debt or other equity securities, including commercial paper,medium-term notes, senior or subordinated notes, debt securities convertible into equity or shares of preferredstock. Future acquisitions could require substantial additional capital in excess of cash from operations. Wewould expect to finance the capital required for acquisitions through a combination of additional issuances ofequity, corporate indebtedness, asset-backed acquisition financing and/or cash from operations. In addition, wealso expect to issue additional shares in connection with exercise of our stock options under our incentive plans.
Issuing additional shares of our common stock or other equity securities or securities convertible into equity forfinancing or in connection with our incentive plans, acquisitions or otherwise may dilute the economic and votingrights of our existing stockholders or reduce the market price of our common stock or both. Upon liquidation, holdersof our debt securities and preferred shares, if issued, and lenders with respect to other borrowings would receive adistribution of our available assets prior to the holders of our common stock. Debt securities convertible into equitycould be subject to adjustments in the conversion ratio pursuant to which certain events may increase the number of
51
equity securities issuable upon conversion. Preferred shares, if issued, could have a preference with respect toliquidating distributions or a preference with respect to dividend payments that could limit our ability to pay dividendsto the holders of our common stock. Our decision to issue securities in any future offering will depend on marketconditions and other factors beyond our control, which may adversely affect the amount, timing or nature of our futureofferings. Thus, holders of our common stock bear the risk that our future offerings may reduce the market price of ourcommon stock and dilute their stockholdings in us. See “Description of Capital Stock.”
Future sales of our common stock, or the perception in the public markets that these sales may occur,may depress our stock price.
Sales of substantial amounts of our common stock in the public market after this offering, or the perceptionthat these sales could occur, could adversely affect the price of our common stock and could impair our ability toraise capital through the sale of additional shares. Upon completion of this offering, we will have 245,338,645shares of common stock outstanding and 252,049,171 shares if the underwriters’ option to purchase additionalshares is fully exercised.
All of the 44,736,842 shares of common stock (or 51,447,368 shares if the underwriters exercise their optionto purchase additional shares in full) sold in this offering will be freely tradable without restrictions or furtherregistration under the Securities Act of 1933 (“Securities Act”), except for any shares of our common stock thatmay be held or acquired by our directors, executive officers and other affiliates, as that term is defined in theSecurities Act, which will be restricted securities under the Securities Act. Restricted securities may not be soldin the public market unless the sale is registered under the Securities Act or an exemption from registration isavailable.
We, each of our executive officers, directors, the Principal Stockholders and certain of our otherstockholders have agreed with the underwriters not to transfer or dispose of, directly or indirectly, any shares ofcommon stock or any securities convertible into or exercisable or exchangeable for shares of common stock, fora period of 180 days after the date of this prospectus, except for certain limited exceptions. See “Underwriting(Conflicts of Interest).” Approximately 81% of outstanding shares of our common stock or 79% of outstandingshares of our common stock if the underwriters’ option to purchase additional shares of common stock is fullyexercised, are subject to these lock-up agreements.
In addition, pursuant to the Management Stockholders’ Agreement (as defined in “Certain Relationships andRelated Party Transactions—Management Stockholders’ Agreement”), certain of our stockholders, which groupof stockholders excludes our Principal Stockholders, have agreed by contract with us not to transfer, sell, assign,pledge, hypothecate or encumber any of the shares of common stock then-currently owned by such stockholder(which can be waived by us at our option at any time), subject to certain limited exceptions, at any time prior tothe termination of such Management Stockholders’ Agreement. The Management Stockholders’ Agreementterminates if our common stock is registered and if at least 20% of our total outstanding common stock tradesregularly in, on or through the facilities of a securities exchange and/or inter-dealer quotation system or anydesignated offshore securities market, which conditions are expected to be met in connection with the completionof this offering, assuming we sell the total number of shares set forth on the cover of this prospectus at an initialpublic offering price equal to the midpoint of the price range set forth on the cover of this prospectus and that theunderwriters exercise their option to purchase additional shares of common stock. However, if there is a changein the total number of shares to be sold in the offering or in the initial public offering price, in each case ascompared to the figures set forth on the cover of this prospectus, or if the underwriters do not exercise theiroption to purchase additional shares, the Management Stockholders’ Agreement may not terminate. If theManagement Stockholders’ Agreement does not terminate, the transfer restrictions contained therein wouldcontinue to be applicable.
After the expiration of the 180-day lock-up period under the lock-up agreement and, if applicable to suchstockholder, the transfer restrictions under the Management Stockholders’ Agreement, these shares may be soldin the public market, subject to prior registration or qualification for an exemption from registration, including, in
52
the case of shares held by affiliates, compliance with the volume restrictions and other securities laws. See“Shares Eligible for Future Sale” for a more detailed description of the restrictions on selling shares of ourcommon stock after this offering. To the extent that any of these stockholders sell, or indicate an intent to sell,substantial amounts of our common stock in the public market after the contractual lock-ups and other legalrestrictions on resale discussed in this prospectus lapse, the trading price of our common stock could declinesignificantly.
Morgan Stanley & Co. LLC and Goldman, Sachs & Co., on behalf of the underwriters, may, in their solediscretion, release all or some portion of the shares subject to the 180-day lock-up agreements prior to expirationof such period. However, any such release by Morgan Stanley & Co. LLC and Goldman, Sachs & Co. would notimpact the transfer restrictions in the Management Stockholders’ Agreement, to the extent applicable to suchstockholders.
Certain provisions of our Stockholders’ Agreement, our Certificate of Incorporation, our Bylaws andDelaware law could hinder, delay or prevent a change in control of us that you might consider favorable,which could also adversely affect the price of our common stock.
Certain provisions under our Stockholders’ Agreement, our Certificate of Incorporation, our Bylaws andDelaware law could discourage, delay or prevent a transaction involving a change in control of our company,even if doing so would benefit our stockholders. These provisions include:
• a classified board of directors with three classes so that not all members of our board of directors areelected at one time;
• the sole ability of the then-current member of the board of directors to fill a vacancy created by theexpansion of the board of directors;
• a provision permitting stockholders to act by written consent only until such time as the PrincipalStockholders cease to beneficially own, collectively, more than 40% of our outstanding shares entitledto vote generally in the election of directors;
• a provision prohibiting stockholders from calling a special meeting, provided, however, at any timewhen the Principal Stockholders beneficially own, collectively, at least 40% of our outstanding sharesentitled to vote generally in the election of directors, special meetings of our stockholders may becalled by the board of directors or the chairman of the board of directors at the request of either theSilver Lake Funds or the TPG Funds;
• a provision requiring approval of 75% of all outstanding shares entitled to vote generally in the electionof directors in order to amend or repeal certain provisions in the Certificate of Incorporation and theBylaws;
• the requirement that our directors may be removed only for cause by the affirmative vote of at least75% of our outstanding shares entitled to vote generally in the election of directors; provided, however,at any time when the Principal Stockholders beneficially own, collectively, at least 40% of ouroutstanding shares entitled to vote generally in the election of directors, directors may be removed withor without cause by a vote of a majority of all outstanding shares entitled to vote generally in theelection of directors;
• advance notice requirements for nominations for elections to our board of directors or for proposingmatters that can be acted upon by stockholders at our stockholder meetings;
• the ability of our board of directors to issue new series of, and designate the terms of, preferred stock,without stockholder approval, which could be used to, among other things, institute a rights plan thatwould have the effect of significantly diluting the stock ownership of a potential hostile acquirer, likelypreventing acquisitions that have not been approved by our board of directors;
• our opting to have the provisions of Section 203 of the DGCL (as defined in “Description of CapitalStock”), which regulates business combinations with “interested stockholders,” apply to us after the
53
first date on which each of the Principal Stockholders and their affiliates no longer meets therequirements to be an “interested stockholder” as defined by Section 203 of the DGCL, but excludingfor purposes thereof, clause (ii) of such definition of “interested stockholder”;
• certain rights of our Principal Stockholders with respect to the designation of directors for nominationand election to our board of directors, including the ability to appoint members to each boardcommittee; and
• provisions prohibiting cumulative voting.
Anti-takeover provisions could substantially impede the ability of public stockholders to benefit from achange in control or change of our management and board of directors and, as a result, may adversely affect themarket price of our common stock and your ability to realize any potential change of control premium. Theseprovisions could also discourage proxy contests and make it more difficult for you and other stockholders to electdirectors of your choosing and to cause us to take other corporate actions you desire. Because our board ofdirectors is responsible for appointing the members of our management team, these provisions could in turnaffect any attempt to replace current members of our management team. As a result, efforts by stockholders tochange the direction or management of the company may be unsuccessful. See “Description of Capital Stock” foradditional information regarding the provisions included in our Certificate of Incorporation and our Bylaws.
Our ability to pay regular dividends to our stockholders is subject to the discretion of our board of directorsand may be limited by our holding company structure and applicable provisions of Delaware law.
Contingent upon the closing of this offering, we intend to pay quarterly cash dividends on our common stock.However, our board of directors may, in its sole discretion, change the amount or frequency of dividends ordiscontinue the payment of dividends entirely. In addition, because we are a holding company with no materialdirect operations, we are dependent on loans, dividends and other payments from our operating subsidiaries togenerate the funds necessary to pay dividends on our common stock. We expect to cause our subsidiaries to makedistributions to us in an amount sufficient for us to pay dividends. However, their ability to make such distributionswill be subject to their operating results, cash requirements and financial condition, the applicable provisions ofDelaware law that may limit the amount of funds available for distribution and our ability to pay cash dividends,compliance with covenants and financial ratios related to existing or future indebtedness, including under our CreditFacility and the 2019 Notes, and other agreements with third parties. Additionally, no dividend or distribution canbe declared or paid with respect to the common stock, and we cannot redeem, purchase, acquire or retire for valuethe common stock, unless and until the full amount of any unpaid dividends accrued on the Series A Preferred Stockhas been paid or contemporaneously declared and paid. See “Dividend Policy.” Prior to the closing of this offering,we will exercise our right to redeem all of our Series A Preferred Stock. See “Description of Capital Stock—SeriesA Preferred Stock.” In addition, each of the companies in our corporate chain must manage its assets, liabilities andworking capital in order to meet all of its cash obligations, including the payment of dividends or distributions. As aconsequence of these various limitations and restrictions, we may not be able to make, or may have to reduce oreliminate, the payment of dividends on our common stock. Any change in the level of our dividends or thesuspension of the payment thereof could adversely affect the market price of our common stock.
Certain of our stockholders have the right to engage or invest in the same or similar businesses as us.
Our Principal Stockholders have other investments and business activities in addition to their ownership of us.Under our Certificate of Incorporation, the Principal Stockholders have the right, and have no duty to abstain fromexercising such right, to engage or invest in the same or similar businesses as us or which we propose to engage,including those lines of business deemed to be competing with us, do business with any of our clients, customers orsuppliers or employ or otherwise engage any of our officers, directors or employees. If the Principal Stockholders orany of their officers, directors or employees acquire knowledge of a potential transaction that could be a corporateopportunity, they have, to the fullest extent permitted by applicable law, no duty to offer or communicate suchcorporate opportunity to us, our stockholders or our affiliates even if it is a corporate opportunity that we mightreasonably have pursued. This may cause the strategic interests of our Principal Stockholders to differ from, andconflict with, the interests of our company and of our other shareholders in material respects.
54

Conflicts of interest may exist with respect to certain underwriters of this offering.
Affiliates of Morgan Stanley & Co. LLC, Goldman, Sachs & Co., Merrill Lynch, Pierce, Fenner & SmithIncorporated and Deutsche Bank Securities Inc., each an underwriter of this offering, are lenders under our $352million Revolving Facility and our $1,775 million Term B Facility (each as defined in “Description of CertainIndebtedness”). In addition, affiliates of Merrill Lynch, Pierce, Fenner & Smith Incorporated and Deutsche BankSecurities Inc. are lenders under our $425 million Term C Facility. In addition, the TPG Funds are affiliates ofTPG Capital BD, LLC, an underwriter in its offering, and, as holders of a portion of our Series A PreferredStock, they will receive more than 5% of the net proceeds of this offering, based upon an assumed initial publicoffering price of $19.00 per share, the midpoint of the range set forth on the cover page of this prospectus.
Therefore, conflicts of interest could exist because underwriters or their affiliates could receive proceeds inthis offering in addition to the underwriting discounts and commissions described in this prospectus. See“Underwriting (Conflicts of Interest).”
55
CAUTIONARY NOTE REGARDING FORWARD-LOOKING STATEMENTS
Some of the statements contained in this prospectus constitute forward-looking statements. Forward-lookingstatements relate to expectations, beliefs, projections, future plans and strategies, anticipated events or trends andsimilar expressions concerning matters that are not historical facts, such as statements regarding our futurefinancial condition or results of operations, our prospects and strategies for future growth, the development andintroduction of new products, and the implementation of our marketing and branding strategies. In many cases,you can identify forward-looking statements by terms such as “may,” “will,” “should,” “expects,” “plans,”“anticipates,” “believes,” “estimates,” “predicts,” “potential” or the negative of these terms or other comparableterminology.
The forward-looking statements contained in this prospectus are based on our current expectations andassumptions regarding our business, the economy and other future conditions and are subject to risks,uncertainties and changes in circumstances that may cause events or our actual activities or results to differsignificantly from those expressed in any forward-looking statement. Although we believe that the expectationsreflected in the forward-looking statements are reasonable, we cannot guarantee future events, results, actions,levels of activity, performance or achievements. Readers are cautioned not to place undue reliance on theseforward-looking statements. A number of important factors could cause actual results to differ materially fromthose indicated by the forward-looking statements, including, but not limited to, those factors described in “RiskFactors” and “Management’s Discussion and Analysis of Financial Condition and Results of Operations.” Thesefactors include, without limitation, economic, business, competitive, market and regulatory conditions and thefollowing:
• factors affecting transaction volumes in the global travel industry, particularly air travel transactionvolumes, including global and regional economic and political conditions, financial instability orfundamental corporate changes to travel suppliers, natural or man-made disasters, safety concerns orchanges to regulations governing the travel industry;
• our ability to renew existing contracts or to enter into new contracts with travel supplier and buyercustomers, third-party distributor partners and joint ventures on economically favorable terms or at all;
• our Travel Network business’ exposure to pricing pressures from travel suppliers and its dependenceon relationships with several large travel buyers;
• the fact that travel supplier customers may experience financial instability, consolidate with oneanother, pursue cost reductions, change their distribution model or experience other changes adverse tous;
• travel suppliers’ use of alternative distribution models, such as direct distribution channels,technological incompatibilities between suppliers’ travel content and our GDS, and the diversion ofconsumer traffic to other channels;
• our reliance on third-party distributors and joint ventures to extend our GDS services to certain regions,which exposes us to risks associated with lack of direct management control and potential conflicts ofinterest;
• competition in the travel distribution market from other GDS providers, direct distribution by travelsuppliers and new entrants or technologies that could challenge the existing GDS business model;
• potential negative impact of competition from other third-party solutions providers and from newparticipants entering the solutions market on our ability to maintain and grow our Airline andHospitality Solutions business;
• risks associated with implementing the Expedia SMA and the fact that the benefits anticipated by theparties to the Expedia SMA may not materialize;
56
• potential failure to successfully implement software solutions, which could result in damage to ourreputation;
• risks associated with our use of open source software, including the possible future need to acquirelicenses from third parties or re-engineer our solutions;
• availability and performance of information technology services provided by third parties, such as HP,which manages a significant portion of our systems;
• our business being harmed by adverse global and regional economic and political conditions,particularly, given our geographic concentration, those that may adversely affect business and leisuretravel originating in, or travel to, the United States and Europe;
• risks specific to the operations of our OTAs, including, but not limited to, competition, content,relationships with travel suppliers and travel distributor partners and changes in search enginealgorithms and other traffic sources;
• risks associated with the value of our brand, which may be damaged by a number of factors, some ofwhich are out of our control;
• our ability to adapt to technological developments or the evolving competitive landscape byintroducing relevant new technologies, products and services;
• systems and infrastructure failures or other unscheduled shutdowns or disruptions, including those dueto natural disasters or cybersecurity attacks;
• security breaches occurring at our facilities or with respect to our infrastructure, resulting from physicalbreak-ins; computer viruses, attacks by hackers or similar distributive problems;
• the potential failure to recruit, train and retain key technical employees and senior management;
• risks associated with operating as a global business in multiple countries and in multiple currencies;
• risks associated with acquisitions, divestitures, investments and strategic alliances;
• our ability to protect and maintain our information technology and intellectual property rights, as wellas defend against potential infringement claims against us, and the associated costs;
• defects in our products resulting in significant warranty liabilities or product liability claims, for whichwe may have insufficient product liability insurance to pay material uninsured claims;
• adverse outcomes in our legal proceedings, including our litigation with US Airways or the antitrustinvestigation by the DOJ, whether in the form of money damages or injunctive relief that could forcechanges to the way we operate our GDS;
• the possibility that we may have insufficient insurance to cover our liability for pending litigationclaims or future claims, which could expose us to significant liabilities;
• our failure to comply with regulations that are applicable to us or any unfavorable changes in, or theenactment of, laws, rules or regulations applicable to us;
• liabilities arising from our collection, processing, storage, use and transmission of personal dataresulting from conflicting legal requirements, governmental regulation or security breaches, includingcompliance with payment card industry regulations;
• the fact that we may have higher than anticipated tax liabilities, our use of NOLs may be subject tolimitations on their use in the future and payments under the TRA to our Existing Stockholders;
• the fact that our pension plan is currently underfunded and we may need to make significant cashcontributions to our pension plan in the future, which could reduce the cash available for our business;
• our significant amount of long-term indebtedness and the related restrictive covenants in theagreements governing our indebtedness;
57

• risks associated with maintaining and improving our financial controls and the requirements of being apublic company may strain our resources, divert management’s attention and affect our ability toattract and retain qualified board members;
• the fact that our Principal Stockholders will, following the completion of the offering, retain significantinfluence over us and key decisions about our business, which may prevent new investors frominfluencing significant corporate decisions and result in conflicts of interest;
• the fact that we qualify as a “controlled company” within the meaning of the NASDAQ rules and,therefore we also qualify to be exempt from certain corporate governance requirements; and
• other risks and uncertainties, including those listed in the “Risk Factors” section.
These statements are based on current plans, estimates and projections, and therefore you should not placeundue reliance on them. Forward-looking statements speak only as of the date they are made, and we undertakeno obligation to update them publicly in light of new information or future events.
You should carefully consider the risks specified in the “Risk Factors” section of this prospectus andsubsequent public statements or reports filed with or furnished to the Securities and Exchange Commission (the“SEC”), before making any investment decision with respect to our common stock. If any of these trends, risks oruncertainties actually occurs or continues, our business, financial condition or results of operations could bematerially adversely affected, the trading prices of our common stock could decline and you could lose all or partof your investment. All forward-looking statements attributable to us or persons acting on our behalf areexpressly qualified in their entirety by this cautionary statement.
58
METHOD OF CALCULATION
The “GDS-processed air bookings” share figures in this prospectus are calculated based on the total numberof air bookings processed through the three GDSs, specifically Sabre, Amadeus, and Travelport (including theWorldspan, Galileo and Apollo systems). Measurements of such GDS-processed air bookings are based primarilyon Marketing Information Data Tapes and are supplemented with other transaction data and estimates that webelieve provide a more accurate measure of GDS-processed air bookings. Because GDSs generally process airbookings for their joint venture partners and/or share in the economics of their joint venture partners’ traveltransactions, we include the GDS-processed air booking volumes of each GDS’s joint venture partners in theGDS-processed air bookings share calculations. For example, GDS-processed air bookings from Abacus andINFINI Travel Information, Inc. (“Infini”) are included in our GDS-processed air bookings volume and ourestimate of GDS-processed air bookings from Topas, Amadeus’ Korean joint venture partner, is included in theAmadeus GDS-processed air bookings volume.
Based on our internal estimates, we believe GDS-processed air bookings comprise approximately 75% oftotal air bookings processed through third-party distribution systems in 2013, with the remaining 25% comprisedof air bookings processed through regional distribution systems that are not joint venture partners of one of thethree GDSs. Due to the lack of available industry information on the number of air bookings processed by suchregional distribution systems and through direct distribution channels we use the number of GDS-processed airbookings as a proxy for the number of overall industry air bookings. Similarly, we believe industry air bookingsshare is a good proxy for overall GDS share in our Travel Network business because air bookings comprise thevast majority of the total bookings of the three GDSs.
The GDS-processed air bookings used for GDS-processed air bookings share calculations do not necessarilycorrespond to the number of bookings billed by each GDS provider because not all processed bookings are billeddue to the fact that each GDS provider has a different policy (often varying by region and supplier) as to whichtransactions processed through its GDS platform are billed.
The regional air bookings share figures in this prospectus are calculated based on the total number of GDS-processed air bookings in each of the following four regions, with key countries or sub-regions identified:
• North America: United States and Canada;
• Latin America: Mexico, South America, Central America and the Caribbean;
• APAC: India, Australia, South Korea, Japan, Taiwan, Hong Kong, Singapore, Thailand, Malaysia,Pakistan, Philippines, and New Zealand; and
• EMEA: Germany, United Kingdom, France, Italy, Spain, Saudi Arabia, Russian Federation, Sweden,Norway, United Arab Emirates, Netherlands, Greece, Switzerland, South Africa, Denmark, Israel,Finland, Ukraine, and Belgium (a subgroup of which is defined as MEA: Saudi Arabia, United ArabEmirates, South Africa and Israel).
The hospitality CRS hotel room share figures in this prospectus are calculated based on data for hotel roomsserviced by third-party CRS providers and processed through our GDS. We estimate that approximately a quarterof global hotel properties are available through our GDS and believe this data to be the best availablerepresentation of the hotel market due to the lack of comprehensive industry data. Using this data, we computeCRS hotel room share based on total hotel room capacity hosted by the various third-party hospitality CRSproviders. We believe this to be the most reliable measure of market share available to us. However, this metricis one we have only recently begun to measure and represents a snapshot in time, which prevents it from beingable to convey a trend in market share over time. Therefore, we also include information in this prospectusregarding third-party hospitality CRS bookings share of our GDS because that data is more consistently availablefor historical periods. Using our GDS data, we compute third-party hospitality CRS bookings share based ontotal bookings by the various third-party hospitality CRS providers over time. Though we believe third-party
59

hospitality CRS room share to be a more accurate representation of market share, we believe third-partyhospitality CRS bookings share is a reasonable proxy to convey changes in third-party hospitality CRS marketshare over time.
The “Customer Retention” rate figures in this prospectus are calculated as the aggregate of prior year revenueassociated with customers that did not terminate their contract in the given year, as a percentage of the prior yearrevenue. Customer Retention for Travel Network is calculated based on travel agency contracts, and is measuredbased on revenue we earn from bookings made by those travel agencies. Customer Retention for Airline Solutionsis calculated based on PBs fee-based revenue for our reservation contracts, our principal Airline Solutions offering.Customer Retention for Hospitality Solutions is based on CRS, digital marketing services and call center revenues,which represent over 90% of revenues of our Hospitality Solutions business in each period from 2011 throughDecember 31, 2013. Customer Retention does not measure whether the revenue from any travel agency orreservations customer has increased in the given year compared to the prior year. For example, if ten travel agenciesterminated their Travel Network contracts in 2013, and those travel agencies represented a combined 5% of TravelNetwork revenue in 2012, the Customer Retention for Travel Network in 2013 would be 95%.
The “Recurring Revenue” figures for our:
(i) Travel Network business is comprised of transaction, subscription and other revenue that is of arecurring nature from travel suppliers and travel buyers, and excludes revenue of a non-recurringnature, such as set-up fees and shortfall payments;
(ii) Airline Solutions business is comprised of volume-based and subscription fees and other revenue thatis of a recurring nature associated with various solutions, and excludes revenue of a non-recurringnature, such as license fees and consulting fees; and
(iii) Hospitality Solutions business is comprised of volume-based and subscription fees and other revenuethat is of a recurring nature associated with various solutions, and excludes revenue of a non-recurringnature, such as set-up fees and website development fees.
Revenues in each of (i), (ii) and (iii) are tied to a travel supplier’s transaction volumes rather than to its unitpricing for an airplane ticket, hotel room or other travel product. However, this revenue is not generallycontractually committed to recur annually under our agreements with our travel suppliers. As a result, ourRecurring Revenue is highly dependent on the global travel industry and directly correlates with global travel,tourism and transportation transaction volumes. See “Risk Factors—Risks Related to Our Business andIndustry—Our revenue is highly dependent on transaction volumes in the global travel industry, particularly airtravel transaction volumes.”
TRADEMARKS AND TRADE NAMES
We own or have rights to various trademarks, service marks and trade names that we use in connection withthe operation of our business. This prospectus may also contain trademarks, service marks and trade names ofthird parties, which are the property of their respective owners. Our use or display of third parties’ trademarks,service marks, trade names or products in this prospectus is not intended to, and does not, imply a relationshipwith, or endorsement or sponsorship by, us. Solely for convenience, the trademarks, service marks and tradenames referred to in this prospectus may appear without the ®, TM or SM symbols, but such references are notintended to indicate, in any way, that we will not assert, to the fullest extent under applicable law, our rights orthe right of the applicable licensor to these trademarks, service marks and trade names.
ClientBase, GetThere, lastminute.com, Sabre, Sabre Holdings, the Sabre logo, Sabre AirCentre, SabreAirline Solutions, Sabre AirVision, Sabre Hospitality Solutions, Sabre Red, Sabre Travel Network, SabreSonic,Travelocity, Travelocity Partner Network, TripCase, TruTrip and our other registered or common lawtrademarks, service marks or trade names appearing in this prospectus are the property of Sabre.
60

NON-GAAP FINANCIAL MEASURES
We have included both financial measures compiled in accordance with GAAP and certain non-GAAPfinancial measures in this registration statement, of which this prospectus forms a part, including Adjusted GrossMargin, Adjusted Net Income, Adjusted EBITDA, Adjusted Capital Expenditures, Adjusted Free Cash Flow andratios based on these financial measures.
We define Adjusted Gross Margin as operating income (loss) adjusted for selling, general andadministrative expenses, impairments, restructuring charges, amortization of upfront incentive consideration anddepreciation and amortization.
We define Adjusted Net Income as income (loss) from continuing operations adjusted for impairment,acquisition related amortization expense, loss (gain) on sale of business and assets, loss on extinguishment ofdebt, other, net, restructuring and other costs, litigation and taxes, including penalties, stock-based compensation,management fees and tax impact of net income adjustments.
We define Adjusted EBITDA as Adjusted Net Income adjusted for depreciation and amortization ofproperty and equipment, amortization of capitalized implementation costs, amortization of upfront incentiveconsideration, interest expense, and remaining (benefit) provision for income taxes. This Adjusted EBITDAmetric differs from (i) the EBITDA metric referenced in the section entitled “Management’s Discussion andAnalysis of Financial Condition and Results of Operations—Liquidity and Capital Resources—Senior SecuredCredit Facilities”, which is calculated for the purposes of compliance with our debt covenants, and (ii) the Pre-VCP EBITDA and EBITDA metrics referenced in the section entitled “Compensation Discussion and Analysis”,which are calculated for the purposes of our annual incentive compensation program and performance-basedawards, respectively.
We define Adjusted Capital Expenditures as additions to property and equipment and capitalizedimplementation costs during the period presented.
We define Adjusted Free Cash Flow as cash provided by operating activities less cash used in additions toproperty and equipment, plus the cash flow effect of restructuring and other costs, litigation settlement and taxpayments for certain items, other litigation costs, management fees and the working capital impact from thesettlement of travel supplier liabilities associated with certain operations of Travelocity impacted by the ExpediaSMA (see “Management’s Discussion and Analysis of Financial Condition and Results of Operations—FactorsAffecting our Results—Travelocity”).
Adjusted Gross Margin and Adjusted EBITDA are key metrics used by management and our board of directorsto monitor our ongoing core operations because historical results have been significantly impacted by events that areunrelated to our core operations as a result of changes to our business and the regulatory environment. We believethat Adjusted Gross Margin, Adjusted Net Income, Adjusted EBITDA, Adjusted Capital Expenditures and AdjustedFree Cash Flow are used by investors, analysts and other interested parties as measures of financial performance andto evaluate our ability to service debt obligations, fund capital expenditures and meet working capital requirements.Adjusted Capital Expenditures includes cash flows used in investing activities, for property and equipment, andcash flows used in operating activities, for capitalized implementation costs. Our management uses this combinedmetric in making product investment decisions and determining development resource requirements. We alsobelieve that Adjusted Gross Margin, Adjusted Net Income, Adjusted EBITDA and Adjusted Capital Expendituresassist investors in company-to-company and period-to-period comparisons by excluding differences caused byvariations in capital structures (affecting interest expense), tax positions and the impact of depreciation andamortization expense. In addition, amounts derived from Adjusted EBITDA are a primary component of certaincovenants under our senior secured credit facilities.
Adjusted Gross Margin, Adjusted Net Income, Adjusted EBITDA, Adjusted Capital Expenditures, AdjustedFree Cash Flow and ratios based on these financial measures are not recognized terms under GAAP. AdjustedGross Margin, Adjusted Net Income, Adjusted EBITDA, Adjusted Capital Expenditures, Adjusted Free Cash
61

Flow and ratios based on these financial measures have important limitations as analytical tools, and should notbe viewed in isolation and do not purport to be alternatives to net income as indicators of operating performanceor cash flows from operating activities as measures of liquidity. Adjusted Gross Margin, Adjusted Net Income,Adjusted EBITDA, Adjusted Free Cash Flow and ratios based on these financial measures exclude some, but notall, items that affect net income or cash flows from operating activities and these measures may vary amongcompanies. Our use of Adjusted Gross Margin, Adjusted Net Income, Adjusted EBITDA, and Adjusted FreeCash Flow has limitations as an analytical tool, and you should not consider them in isolation or as substitutes foranalysis of our results as reported under GAAP. Some of these limitations are:
• although depreciation and amortization are non-cash charges, the assets being depreciated andamortized may have to be replaced in the future, and Adjusted Gross Margin and Adjusted EBITDA donot reflect cash requirements for such replacements;
• Adjusted Net Income and Adjusted EBITDA do not reflect changes in, or cash requirements for, ourworking capital needs;
• Adjusted EBITDA does not reflect the interest expense or the cash requirements necessary to serviceinterest or principal payments on our indebtedness;
• Adjusted EBITDA does not reflect tax payments that may represent a reduction in cash available to us;
• Adjusted Free Cash Flow does not reflect the cash requirements necessary to service the principalpayments on our indebtedness;
• Adjusted Free Cash Flow does not reflect payments related to restructuring, litigation, managementfees and Travelocity working capital which reduced the cash available to us;
• Adjusted Free Cash Flow removes the impact of accrual-basis accounting on asset accounts and non-debt liability accounts; and
• other companies, including companies in our industry, may calculate Adjusted Net Income, AdjustedEBITDA or Adjusted Free Cash Flow differently, which reduces its usefulness as a comparativemeasure.
See “Summary Consolidated Financial Data,” “Selected Historical Consolidated Financial Data” and“Management’s Discussion and Analysis of Financial Condition and Results of Operations” for definitions ofnon-GAAP financial measures used in this prospectus and reconciliations thereof to the most directly comparableGAAP measures.
MARKET AND INDUSTRY DATA AND FORECASTS
This prospectus includes industry data and forecasts that we obtained from industry publications and surveys,public filings and internal company sources. Statements as to our ranking, market position and market estimates arebased on independent industry publications, government publications, third-party forecasts and management’sestimates and assumptions about our markets and our internal research. We have included explanations of certaininternal estimates and related methods provided in this prospectus along with these estimates. See “Business” and“Management’s Discussion and Analysis of Financial Condition and Results of Operations.” While we are notaware of any misstatements regarding our market, industry or similar data presented herein, such data involve risksand uncertainties and are subject to change based on various factors, including those discussed in “Cautionary NoteRegarding Forward-Looking Statements” and “Risk Factors” in this prospectus.
The T2RL information quoted or cited herein is the property of T2RL and is sourced from www.t2rl.net,copyright all rights reserved.
The Gartner material quoted or cited herein, (the “Gartner Material”) represent(s) data, research opinion orviewpoints published, as part of a syndicated subscription service, by Gartner, Inc., and are not representations offact. The Gartner Material speaks as of its original publication date (and not as of the date of this filing) and theopinions expressed in the Gartner Material are subject to change without notice.
62
USE OF PROCEEDS
We estimate that our net proceeds from the sale of 44,736,842 shares of common stock offered by us will beapproximately $797 million or approximately $917 million if the underwriters exercise their option to purchaseadditional shares in full (in each case, at an assumed initial public offering price of $19.00 per share of commonstock, the midpoint of the price range set forth on the cover of this prospectus), after deducting underwritingdiscounts and commissions and estimated offering expenses payable by us.
We intend to use the net proceeds from this offering to repay $180 million of our outstanding indebtednessunder the Term C Facility portion of our senior secured credit facilities. The Term C Facility matures inDecember 2017 and bears interest at a rate of LIBOR (subject to a 1.00% floor) plus 3.00%. We also intend toredeem $320 million aggregate principal amount of our 8.5% senior secured notes due May 2019 at a redemptionprice of 108.5% of the principal amount of the 2019 Notes redeemed, plus accrued and unpaid interest to, butexcluding, the date of redemption. We intend to use $256 million, the remaining portion of the net proceeds fromthis offering, to pay a $21 million fee, in the aggregate, to TPG and Silver Lake pursuant to the MSA, which willthereafter be terminated, and $235 to redeem the Series A Preferred Stock.
If the underwriters exercise their option to acquire additional shares of common stock, we intend to use anynet proceeds we receive to repay additional outstanding indebtedness under the Term C Facility. If the actual netproceeds of the offering increase for reasons other than the exercise of the underwriters’ option or if the actualnet proceeds decrease, the cash component of the Redemption Payment made in respect of our Series A PreferredStock will be adjusted as described below.
By establishing a public market for our common stock, this offering is also intended to facilitate our futureaccess to public markets.
A $1.00 increase (decrease) in the assumed initial public offering price of $19.00 (the midpoint of the pricerange set forth on the cover of this prospectus) would increase (decrease) our estimated net proceeds to us fromthis offering by approximately $42 million, assuming the number of shares of common stock offered by us, as setforth on the cover of this prospectus, remains the same and after deducting the underwriting discounts andcommissions and estimated offering expenses payable by us. Similarly, a change in the number of shares ofcommon stock we sell would increase or decrease our net proceeds.
Prior to the closing of this offering, we will exercise our right to redeem all of our Series A Preferred Stock.The redemption price will be paid with a mix of cash and stock, which we will deliver pro rata to the holdersthereof concurrently with the closing of this offering. Assuming we sell the total number of shares set forth onthe cover of this prospectus at an initial public offering price equal to the midpoint of the price range on the coverof this prospectus, we will deliver an estimated aggregate of $235 million in cash and 21,470,518 shares of ourcommon stock in payment of the related Redemption Payment as of March 31, 2014. Accordingly, such amountsdo not take into account shares of our common stock to be issued in satisfaction of dividends that accrue on orafter April 1, 2014 and to, but excluding, the closing date of this offering. Each share of Series A Preferred Stockaccumulates dividends at a rate of 6% per annum. Such dividends will accrue at a rate of $107,210 per day in theaggregate. See “Description of Capital Stock—Series A Preferred Stock.” In all cases, the common stockdelivered in the Redemption will be valued at the actual initial public offering price and will also reflect shares ofcommon stock to be issued in satisfaction of dividends that accrue on or after April 1, 2014 and to, but excluding,the closing date of this offering.
A $1.00 increase in the estimated net proceeds of this offering would increase the aggregate cash component ofthe Redemption Payment by $1.00 and decrease the common stock component by 0.053 shares, which represents avalue of $1.00 based on the assumed offering price. Conversely, a $1.00 decrease in the estimated net proceeds ofthis offering would cause us to decrease the aggregate cash component of the Redemption Payment by $1.00 and toincrease the common stock component by 0.053 shares, which represents a value of $1.00 based on the assumedoffering price. In all cases, the common stock will be valued at the initial public offering price.
63
If the net proceeds increase due to a higher initial public offering price, we will use the additional proceedsto increase the cash component of the Redemption. By increasing the cash component of the Redemption, thenumber of shares of common stock issued in the share component of the Redemption will be reduced. Inaddition, the number of shares of common stock issued in the Redemption for each share of Series A PreferredStock in the Redemption will be further reduced because the initial public offering price will be higher, whichaffects the redemption ratio between a share of Series A Preferred Stock to a share of common stock.
If the net proceeds decrease due to a lower initial public offering price, we will decrease the cash componentof the Redemption. By reducing the cash component of the Redemption, the number of shares of common stockissued in the share component of the Redemption will be increased. In addition, the number of common sharesissued in the Redemption for each share of Series A Preferred Stock in the Redemption will be further increasedbecause the initial public offering price will be lower, which affects the redemption ratio between a share ofSeries A Preferred Stock to a share of common stock.
If the number of common shares we issue in this offering increases, we will use the additional proceeds toincrease the cash component of the Redemption to the extent that such increase in the number of common sharesalso increases our aggregate net proceeds. In this case, the issuance of additional common shares in the offeringwill increase the number of common shares outstanding following this offering. The additional proceedstherefrom will increase the cash component of the Redemption and thereby reduce the number of shares ofcommon stock issued in the share component of the Redemption.
If the number of common shares we issue in this offering decreases, we will decrease the cash component ofthe Redemption to the extent that such decrease in the number of common shares also decreases our aggregatenet proceeds. In this case, the issuance of fewer common shares in the offering will decrease the number ofcommon shares outstanding following this offering. The lower proceeds therefrom will decrease the cashcomponent of the Redemption, and thereby increase the number of shares of common stock issued in the sharecomponent of the Redemption.
Certain affiliates of TPG Capital BD, LLC, an underwriter in this offering, will own in excess of 10% of ourissued and outstanding common stock following this offering. In addition, the TPG Funds are affiliates of TPGCapital BD, LLC and, as holders of a portion of the Series A Preferred Stock, will receive more than 5% of thenet proceeds of this offering, based upon an assumed initial offering price of $19.00 per share, the midpoint ofthe range set forth on the cover page of this prospectus. See “Underwriting (Conflicts of Interest).”
64

DIVIDEND POLICY
Contingent upon the closing of this offering, we expect to pay quarterly cash dividends on our commonstock, subject to the sole discretion of our board of directors and the considerations discussed below. We expectthat our first dividend will be paid in the third quarter of 2014 (in respect of the second quarter of 2014) and willbe $0.09 per share of our common stock. We intend to fund our initial dividend, as well as any future dividends,from distributions made by our operating subsidiaries from their available cash generated from operations.
Future cash dividends, if any, will be at the discretion of our board of directors and the amount of cashdividends per share will depend upon, among other things, our future operations and earnings, capitalrequirements and surplus, general financial condition, contractual restrictions, number of shares of common stockoutstanding and other factors the board of directors may deem relevant. The timing and amount of futuredividend payments will be at the discretion of our board of directors. See “Risk Factors—Our ability to payregular dividends to our stockholders is subject to the discretion of our board of directors and may be limited byour holding company structure and applicable provisions of Delaware law.”
Because we are a holding company with no material direct operations, we are dependent on loans, dividendsand other payments from our operating subsidiaries to generate the funds necessary to pay dividends on ourcommon stock. Our subsidiaries are currently restricted from paying cash dividends on our common stock incertain circumstances by the covenants in our Credit Facility and in the indenture governing the 2019 Notes andmay be further restricted by the terms of future debt or preferred securities. In addition, no dividend ordistribution can be declared or paid with respect of the common stock, and we cannot redeem, purchase, acquire,or retire for value the common stock, unless and until the full amount of any unpaid dividends accrued on theSeries A Preferred Stock has been paid or contemporaneously declared and paid. Prior to the closing of thisoffering, we will exercise our right to redeem all of our Series A Preferred Stock. See “Description of CapitalStock—Series A Preferred Stock.”
Our dividend policy has certain risks and limitations, particularly with respect to liquidity. Although weexpect to pay dividends according to our dividend policy, we may not pay dividends according to our policy, orat all, if, among other things, we do not have the cash necessary to pay our intended dividends. By paying cashdividends rather than saving or investing that cash, we risk, among other things, slowing the pace of our growthand having insufficient cash to fund our operations or unanticipated capital expenditures.
For a discussion of the application of withholding taxes on dividends, see “Material U.S. Federal Incomeand Estate Tax Considerations to Non-U.S. Holders.”
65

CAPITALIZATION
The following table sets forth our cash and cash equivalents and our capitalization as of December 31, 2013:
1. on an actual basis; and
2. on an as adjusted basis to reflect:
• the Redemption;
• the sale of 44,736,842 shares of our common stock by us offered in this offering at an assumedinitial public offering price of $19.00 per share (the midpoint of the price range on the cover ofthis prospectus), after deducting underwriting discounts and commissions and estimated offeringexpenses;
• the impact of the TRA, which is a reduction to additional paid in capital; and
• the application of the net proceeds from this offering as otherwise described under the heading“Use of Proceeds.”
You should read the following table in conjunction with the sections titled “Summary ConsolidatedFinancial Data,” “Selected Historical Consolidated Financial Data,” “Management’s Discussion and Analysis ofFinancial Condition and Results of Operations,” “Description of Certain Indebtedness” and our financialstatements and related notes included elsewhere in this prospectus.
As of December 31, 2013(in thousands)
ActualAs
Adjusted (4),(5)
(unaudited)Cash and cash equivalents . . . . . . . . . . . . . . . . . . . . . . . . . . . . . . . . . . . . . . . . . . . . . . $ 308,236 $ 308,236
Long-term debt, including current portion:2019 Notes . . . . . . . . . . . . . . . . . . . . . . . . . . . . . . . . . . . . . . . . . . . . . . . . . . . . . . $ 799,823 $ 479,8232016 Notes . . . . . . . . . . . . . . . . . . . . . . . . . . . . . . . . . . . . . . . . . . . . . . . . . . . . . . 389,321 389,321Credit Facility(1) . . . . . . . . . . . . . . . . . . . . . . . . . . . . . . . . . . . . . . . . . . . . . . . . . . 2,456,980 2,276,980Mortgage Facility . . . . . . . . . . . . . . . . . . . . . . . . . . . . . . . . . . . . . . . . . . . . . . . . . 83,541 83,541
Total Long-term debt . . . . . . . . . . . . . . . . . . . . . . . . . . . . . . . . . . . . . . . . . . 3,729,665 3,229,665
Temporary Equity:Series A redeemable preferred stock: $0.01 par value; 225,000,000 sharesauthorized; 87,229,703 shares issued and 87,184,179 shares outstanding onan actual basis and no shares issued and outstanding on an as adjustedbasis . . . . . . . . . . . . . . . . . . . . . . . . . . . . . . . . . . . . . . . . . . . . . . . . . . . . . . . . . 634,843 —
Stockholders’ deficit:Sabre Corporation Common Stock, $0.01 par value; 450,000,000 sharesauthorized; 178,633,409 shares issued and 178,491,568 shares outstandingon an actual basis and 245,720,813 shares issued and 245,338,645 sharesoutstanding on an as adjusted basis(2),(3),(5) . . . . . . . . . . . . . . . . . . . . . . . . . . . . 1,786 2,457
Additional paid in capital . . . . . . . . . . . . . . . . . . . . . . . . . . . . . . . . . . . . . . . . . . . 880,619 1,754,415Retained deficit . . . . . . . . . . . . . . . . . . . . . . . . . . . . . . . . . . . . . . . . . . . . . . . . . . . (1,785,554) (1,840,498)Accumulated other comprehensive loss . . . . . . . . . . . . . . . . . . . . . . . . . . . . . . . . (49,895) (49,895)Non-controlling interest . . . . . . . . . . . . . . . . . . . . . . . . . . . . . . . . . . . . . . . . . . . . 508 508
Total stockholders’ deficit . . . . . . . . . . . . . . . . . . . . . . . . . . . . . . . . . . . . . . (952,536) (133,012)
Total capitalization . . . . . . . . . . . . . . . . . . . . . . . . . . . . . . . . . . . . . . . . . . . . $ 3,411,972 $ 3,096,653
(1) As of December 31, 2013, we had approximately $1,747 million, $360 million and $349 million outstandingunder the Term B Facility, Term C Facility and Incremental Term Facility, respectively. As ofDecember 31, 2013, we had no drawn amounts outstanding under the Revolving Facility and $67 millionoutstanding under the letter of credit sub-facility, $66 million of which directly reduces the amount availableto be drawn under the Revolving Facility.
66
(2) The outstanding share information set forth above assumes no issuance of shares of common stock reservedfor issuance under our equity incentive plans. As of March 31, 2014, an aggregate of 16,099,118 shares ofcommon stock were reserved for future issuance under the 2014 Omnibus Plan, which includes2,599,118 shares of common stock that were available for future issuance under our prior equity plans.Additionally, the outstanding share information set forth above assumes:
• no exercise of performance-based stock options outstanding under our Sovereign MEIP plan. As ofMarch 31, 2014 there were 724,337 performance-based stock options outstanding under this planwith a weighted average exercise price of $5.00;
• no exercise of time-based stock options outstanding under our Sovereign MEIP plan. As of March31, 2014 there were 15,352,970 time-based stock options outstanding under this plan with aweighted average exercise price of $4.80;
• no exercise of time-based stock options outstanding under our Sovereign 2012 MEIP plan. As ofMarch 31, 2014 there were 4,200,683 time-based stock options outstanding under this plan with aweighted average exercise price of $11.31;
• no vesting and settlement of the 960,151 performance-based restricted stock units unvested andoutstanding as of March 31, 2014 under our Sovereign 2012 MEIP plan;
• no vesting and settlement of time-based restricted stock units outstanding as of March 31, 2014under the Sovereign RSU Agreement, with a value equal to $520,000;
• no vesting and settlement of the 140,000 restricted stock unit award, unvested and outstanding as ofMarch 31, 2014; and
• no exercise of time-based stock options or Tandem SARs under our TVL.com SOA or TravelocityEquity 2012 plans, respectively. It is expected that these plans will be terminated in connection andconcurrent with the IPO and all awards under these plans will be cancelled.
(3) The outstanding share information set forth above assumes no exercise by the underwriters of their option topurchase up to an additional 6,710,526 shares of common stock from us.
(4) The number of common shares outstanding assumes the Redemption Payment consists of the amount ofcash and number of common shares described in Use of Proceeds, and is based on the accumulated butunpaid dividends as of March 31, 2014, assuming the initial public offering price is equal to the midpoint ofthe price range on the cover of this prospectus. Accordingly, such amounts do not take into account sharesof our common stock to be issued in satisfaction of dividends that accrue on or after April 1, 2014 and to,but excluding, the closing date of this offering. Each share of Series A Preferred Stock accumulatesdividends at a rate of 6% per annum. See “Description of Capital Stock—Series A Preferred Stock.” Suchdividends will accrue at a rate of $107,210 per day in the aggregate.
Because the number of shares of common stock issued for each share of our Series A Preferred Stock willbe determined by reference to the initial public offering price, a change in the assumed initial public offeringprice would have a corresponding impact on the number of shares of common stock issued for shares of ourSeries A Preferred Stock pursuant to the Redemption upon the closing of this offering and the relativepercentage ownership of the investors in this offering and our existing stockholders.
If the initial public offering price is equal to $19.00 per share, the midpoint of the price range set forth onthe cover of this prospectus, an aggregate of 21,470,518 shares of our common stock would be issued in theshare component of the Redemption in payment of the related redemption price plus accumulated but unpaiddividends as of March 31, 2014. In all cases, the common stock delivered in the Redemption will be valuedat the actual initial public offering price and will reflect shares of our common stock to be issued insatisfaction of dividends that accrue on or after April 1, 2014 and to, but excluding, the closing date of theoffering.
(5) A $1.00 increase (decrease) in the assumed initial public offering price of $19.00 (the midpoint of the pricerange set forth on the cover of this prospectus) would increase (decrease) our estimated net proceeds to usfrom this offering by approximately $42 million, assuming the number of shares of common stock offered
67

by us, as set forth on the cover of this prospectus, remains the same and after deducting the underwritingdiscounts and commissions and estimated offering expenses payable by us. Similarly, a change in thenumber of shares of common stock we sell would increase or decrease our net proceeds. See “Use ofProceeds” for our expectations regarding the change in our expected use of proceeds depending on the sizeof this offering.
68
DILUTION
If you invest in our common stock, your ownership interest will be diluted to the extent of the differencebetween the initial public offering price per share of our common stock in this offering and the pro forma asadjusted net tangible book value per share of our common stock after giving effect to the Redemption and thisoffering. Dilution results from the fact that the per share offering price of our common stock is substantially inexcess of the net tangible book value per share attributable to the existing equity holders. Net tangible book valueper share represents the amount of temporary equity and stockholders’ equity excluding intangible assets, dividedby the number of shares of common stock outstanding at that date.
Our historical net tangible book value as of December 31, 2013 was $(3,725) million, or approximately$(20.80) per share of common stock (assuming 179,131,285 shares of common stock outstanding as of March 31,2014).
After giving effect to the Redemption, our pro forma net tangible book value as of December 31, 2013would have been $(3,090) million, or approximately $(15.41) per share of common stock (assuming200,601,803 shares of common stock outstanding). Pro forma net tangible book value per share represents theamount of temporary equity and stockholders’ equity excluding intangible assets, divided by the number ofshares of common stock outstanding at March 31, 2014 prior to the sale of 44,736,842 shares of our commonstock in this offering but assuming the completion of the Redemption.
After giving effect to (i) the Redemption and (ii) the sale of 44,736,842 shares of common stock in thisoffering at an assumed initial public offering price of $19.00 per share, the midpoint of the price range set forthon the cover of this prospectus, (iii) the application of the net proceeds to us from this offering as described in“Use of Proceeds” (iv) the estimated effect of the TRA and (v) after deducting the underwriting discounts andcommissions estimated offering expenses, our pro forma as adjusted net tangible book value as of December 31,2013 would have been approximately $(2,906) million or approximately $(11.84) per share of common stock(assuming 245,338,645 shares of common stock outstanding as of March 31, 2014). This amount represents animmediate increase in pro forma net tangible book value of $3.56 per share to existing stockholders and animmediate dilution in pro forma net tangible book value of $30.84 per share to purchasers of common stock inthis offering, as illustrated in the following table.
Assumed initial public offering price per share . . . . . . . . . . . . . . . . . . . . . . . . . . . . . . . . . . . . $ 19.00Historical net tangible book value per share as of December 31, 2013 . . . . . . . . . . . . . . $(20.80)Pro forma net tangible book value per share as of December 31, 2013 after givingeffect to the Redemption . . . . . . . . . . . . . . . . . . . . . . . . . . . . . . . . . . . . . . . . . . . . . . . . $ (15.41)
Increase per share attributable to new investors . . . . . . . . . . . . . . . . . . . . . . . . . . . . . . . . $ 3.56
Pro forma as adjusted net tangible book value per share as of December 31, 2013 aftergiving effect to the Redemption and this offering . . . . . . . . . . . . . . . . . . . . . . . . . . . . $(11.84)
Dilution in pro forma as adjusted net tangible book value per share to new investors . . . . . . $ 30.84
A $1.00 increase or decrease in the assumed initial public offering price of $19.00 per share would notincrease or decrease, as applicable, our pro forma as adjusted net tangible book value. A $1.00 increase in theassumed initial public offering price of $19.00 per share would decrease our pro forma as adjusted net tangiblebook value per share by approximately $0.16 per share, and increase the dilution in the pro forma as adjusted nettangible book value per share to investors in this offering by approximately $1.16 per share. A $1.00 decrease inthe assumed initial public offering price of $19.00 per share would increase our pro forma as adjusted nettangible book value per share by approximately $0.16 per share, and decrease the dilution in the pro forma asadjusted net tangible book value per share to investors in this offering by approximately $1.17 per share. In eachcase, we assumed the number of shares offered by us, as set forth on the cover of this prospectus, remains thesame and after deducting underwriting discounts and commissions and estimated offering expenses. This pro
69
forma information is illustrative only, and following the completion of this offering, will be adjusted based on theactual initial public offering price and other terms of this offering determined at pricing.
The following table summarizes, as of December 31, 2013, on the pro forma basis described in the thirdparagraph of this section, the differences between existing stockholders and new investors with respect to thenumber of shares of common stock purchased from us, the total consideration paid, and the average price pershare of our common stock paid by existing stockholders. The calculation with respect to shares purchased bynew investors in this offering reflects the issuance by us of 44,736,842 shares of our common stock in thisoffering at an assumed initial public offering price of $19.00 per share, the midpoint of the range set forth on thecover of this prospectus, before deducting the underwriting discounts and commissions and estimated offeringexpenses.
Shares PurchasedTotal
Consideration AveragePrice Per
ShareNumber Percent Amount Percent
Existing stockholders . . . . . . . . . . . . . . . . . . . . . . . . . . . . . . . 200,601,803 82% $1,386 62% $ 6.91New investors . . . . . . . . . . . . . . . . . . . . . . . . . . . . . . . . . . . . . 44,736,842 18% $ 850 38% $19.00Total . . . . . . . . . . . . . . . . . . . . . . . . . . . . . . . . . . . . . . . . . . . . 245,338,645 100% $2,236 100% $ 9.11
If the underwriters exercise their option to purchase additional shares in full from us, the number of sharesof common stock held by new investors will increase to 51,447,368, or 20.4% of the total number of shares ofour common stock outstanding after this offering and the percentage of shares of common stock held by existingstockholders will decrease to 79.6% of the total number of shares of our common stock outstanding after thisoffering.
If the net proceeds increase due to a higher initial public offering price, we will use the additional proceedsto increase the cash component of the Redemption. By increasing the cash component of the Redemption, thenumber of shares of common stock issued in the share component of the Redemption will be reduced. Inaddition, the number of shares of common stock issued in the Redemption for each share of Series A PreferredStock in the Redemption will be further reduced because the initial public offering price will be higher, whichaffects the redemption ratio between a share of Series A Preferred Stock to a share of common stock.
If the net proceeds decrease due to a lower initial public offering price, we will decrease the cash componentof the Redemption. By reducing the cash component of the Redemption, the number of shares of common stockissued in the share component of the Redemption will be increased. In addition, the number of common sharesissued in the Redemption for each share of Series A Preferred Stock in the Redemption will be further increasedbecause the initial public offering price will be lower, which affects the redemption ratio between a share ofSeries A Preferred Stock to a share of common stock.
If the number of common shares we issue in this offering increases, we will use the additional proceeds toincrease the cash component of the Redemption to the extent that such increase in the number of common sharesalso increases our aggregate net proceeds. In this case, the issuance of additional common shares in the offeringwill increase the number of common shares outstanding following this offering. The additional proceedstherefrom will increase the cash component of the Redemption and thereby reduce the number of shares ofcommon stock issued in the share component of the Redemption.
If the number of common shares we issue in this offering decreases, we will decrease the cash component ofthe Redemption to the extent that such decrease in the number of common shares also decreases our aggregatenet proceeds. In this case, the issuance of fewer common shares in the offering will decrease the number ofcommon shares outstanding following this offering. The lower proceeds therefrom will decrease the cashcomponent of the Redemption, and thereby increase the number of shares of common stock issued in the sharecomponent of the Redemption.
70

The table below sets forth the number of shares of our common stock that would be issued in theRedemption in payment of the related redemption price plus accumulated but unpaid dividends as of March 31,2014, assuming the initial public offering prices for our common stock shown below:
Assumed initial public offering price pershare . . . . . . . . . . . . . . . . . . . . . . . . . . . $ 17.00 $ 18.00 $ 19.00 $ 20.00 $ 21.00
Shares of our common stock issuedin the Redemption . . . . . . . . . . . . 28,970,145 25,012,009 21,470,518 18,283,176 15,399,391
Total shares of common stockoutstanding immediately after theRedemption . . . . . . . . . . . . . . . . . 252,838,273 248,880,136 245,338,645 242,151,303 239,267,518
Percentage of shares owned by:New Investors . . . . . . . . . . . . . . . . . 18% 18% 18% 18% 19%Existing Investors . . . . . . . . . . . . . . . 82% 82% 82% 82% 81%Total . . . . . . . . . . . . . . . . . . . . . . . . . 100% 100% 100% 100% 100%
In all cases, the common stock delivered in the Redemption will be valued at the actual initial publicoffering price and will also reflect shares of our common stock to be issued in satisfaction of dividends thataccrue on or after April 1, 2014 and to, but excluding, the closing date of this offering.
The discussion and table above assume no issuance of shares of common stock reserved for issuance underour equity incentive plans. As of March 31, 2014, an aggregate of 16,099,118 shares of common stock werereserved for future issuance under the 2014 Omnibus Plan, which includes 2,599,118 shares of common stockthat were available for future issuance under our prior equity plans. Additionally, the table above assumes:
• no exercise of performance-based stock options outstanding under our Sovereign MEIP plan. As ofMarch 31, 2014 there were 724,337 performance-based stock options outstanding under this plan witha weighted average exercise price of $5.00;
• no exercise of time-based stock options outstanding under our Sovereign MEIP plan. As of March 31,2014 there were 15,352,970 time-based stock options outstanding under this plan with a weightedaverage exercise price of $4.80;
• no exercise of time-based stock options outstanding under our Sovereign 2012 MEIP plan. As ofMarch 31, 2014 there were 4,200,683 time-based stock options outstanding under this plan with aweighted average exercise price of $11.31;
• no vesting and settlement of the 960,151 performance-based restricted stock units unvested andoutstanding as of March 31, 2014 under our Sovereign 2012 MEIP plan;
• no vesting and settlement of time-based restricted stock units outstanding as of March 31, 2014 underthe Sovereign RSU Agreement, with a value equal to $520,000;
• no vesting and settlement of the 140,000 restricted stock unit award, unvested and outstanding as ofMarch 31, 2014; and
• no exercise of time-based stock options or Tandem SARs under our TVL.com SOA or TravelocityEquity 2012 plans, respectively. It is expected that these plans will be terminated in connection andconcurrent with this offering and all awards under these plans will be cancelled.
71
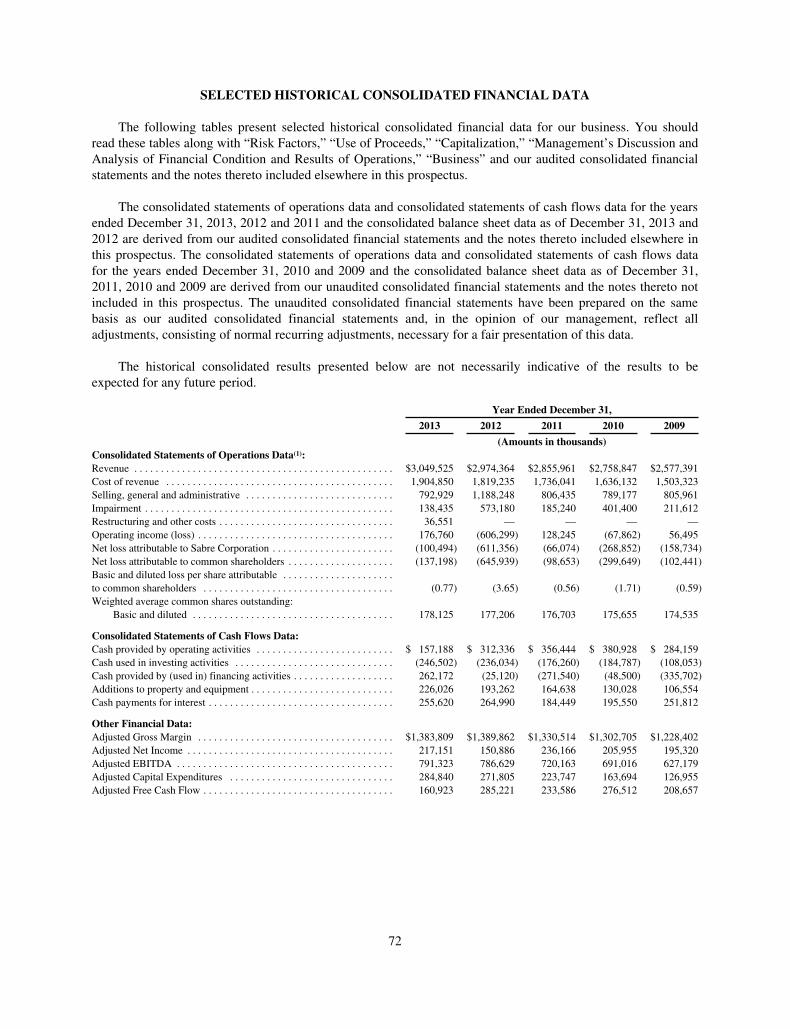
SELECTED HISTORICAL CONSOLIDATED FINANCIAL DATA
The following tables present selected historical consolidated financial data for our business. You shouldread these tables along with “Risk Factors,” “Use of Proceeds,” “Capitalization,” “Management’s Discussion andAnalysis of Financial Condition and Results of Operations,” “Business” and our audited consolidated financialstatements and the notes thereto included elsewhere in this prospectus.
The consolidated statements of operations data and consolidated statements of cash flows data for the yearsended December 31, 2013, 2012 and 2011 and the consolidated balance sheet data as of December 31, 2013 and2012 are derived from our audited consolidated financial statements and the notes thereto included elsewhere inthis prospectus. The consolidated statements of operations data and consolidated statements of cash flows datafor the years ended December 31, 2010 and 2009 and the consolidated balance sheet data as of December 31,2011, 2010 and 2009 are derived from our unaudited consolidated financial statements and the notes thereto notincluded in this prospectus. The unaudited consolidated financial statements have been prepared on the samebasis as our audited consolidated financial statements and, in the opinion of our management, reflect alladjustments, consisting of normal recurring adjustments, necessary for a fair presentation of this data.
The historical consolidated results presented below are not necessarily indicative of the results to beexpected for any future period.
Year Ended December 31,
2013 2012 2011 2010 2009
(Amounts in thousands)Consolidated Statements of Operations Data(1):Revenue . . . . . . . . . . . . . . . . . . . . . . . . . . . . . . . . . . . . . . . . . . . . . . . . . $3,049,525 $2,974,364 $2,855,961 $2,758,847 $2,577,391Cost of revenue . . . . . . . . . . . . . . . . . . . . . . . . . . . . . . . . . . . . . . . . . . . 1,904,850 1,819,235 1,736,041 1,636,132 1,503,323Selling, general and administrative . . . . . . . . . . . . . . . . . . . . . . . . . . . . 792,929 1,188,248 806,435 789,177 805,961Impairment . . . . . . . . . . . . . . . . . . . . . . . . . . . . . . . . . . . . . . . . . . . . . . . 138,435 573,180 185,240 401,400 211,612Restructuring and other costs . . . . . . . . . . . . . . . . . . . . . . . . . . . . . . . . . 36,551 — — — —Operating income (loss) . . . . . . . . . . . . . . . . . . . . . . . . . . . . . . . . . . . . . 176,760 (606,299) 128,245 (67,862) 56,495Net loss attributable to Sabre Corporation . . . . . . . . . . . . . . . . . . . . . . . (100,494) (611,356) (66,074) (268,852) (158,734)Net loss attributable to common shareholders . . . . . . . . . . . . . . . . . . . . (137,198) (645,939) (98,653) (299,649) (102,441)Basic and diluted loss per share attributable . . . . . . . . . . . . . . . . . . . . .to common shareholders . . . . . . . . . . . . . . . . . . . . . . . . . . . . . . . . . . . . (0.77) (3.65) (0.56) (1.71) (0.59)Weighted average common shares outstanding:
Basic and diluted . . . . . . . . . . . . . . . . . . . . . . . . . . . . . . . . . . . . . . 178,125 177,206 176,703 175,655 174,535
Consolidated Statements of Cash Flows Data:Cash provided by operating activities . . . . . . . . . . . . . . . . . . . . . . . . . . $ 157,188 $ 312,336 $ 356,444 $ 380,928 $ 284,159Cash used in investing activities . . . . . . . . . . . . . . . . . . . . . . . . . . . . . . (246,502) (236,034) (176,260) (184,787) (108,053)Cash provided by (used in) financing activities . . . . . . . . . . . . . . . . . . . 262,172 (25,120) (271,540) (48,500) (335,702)Additions to property and equipment . . . . . . . . . . . . . . . . . . . . . . . . . . . 226,026 193,262 164,638 130,028 106,554Cash payments for interest . . . . . . . . . . . . . . . . . . . . . . . . . . . . . . . . . . . 255,620 264,990 184,449 195,550 251,812
Other Financial Data:Adjusted Gross Margin . . . . . . . . . . . . . . . . . . . . . . . . . . . . . . . . . . . . . $1,383,809 $1,389,862 $1,330,514 $1,302,705 $1,228,402Adjusted Net Income . . . . . . . . . . . . . . . . . . . . . . . . . . . . . . . . . . . . . . . 217,151 150,886 236,166 205,955 195,320Adjusted EBITDA . . . . . . . . . . . . . . . . . . . . . . . . . . . . . . . . . . . . . . . . . 791,323 786,629 720,163 691,016 627,179Adjusted Capital Expenditures . . . . . . . . . . . . . . . . . . . . . . . . . . . . . . . 284,840 271,805 223,747 163,694 126,955Adjusted Free Cash Flow . . . . . . . . . . . . . . . . . . . . . . . . . . . . . . . . . . . . 160,923 285,221 233,586 276,512 208,657
72

As of December 31,
2013 2012 2011 2010 2009
(Amounts in thousands)Consolidated Balance Sheet DataCash and cash equivalents . . . . . . . . . . . . . . . . . . . . . . . . . . . . . . . . . . . $ 308,236 $ 126,695 $ 58,350 $ 176,521 $ 61,206Total assets . . . . . . . . . . . . . . . . . . . . . . . . . . . . . . . . . . . . . . . . . . . . . . . 4,755,708 4,711,245 5,252,780 5,524,279 5,878,388Long-term debt . . . . . . . . . . . . . . . . . . . . . . . . . . . . . . . . . . . . . . . . . . . . 3,643,548 3,420,927 3,307,905 3,350,860 3,696,378Working capital deficit . . . . . . . . . . . . . . . . . . . . . . . . . . . . . . . . . . . . . . (273,591) (428,569) (411,482) (491,864) (331,197)Redeemable preferred stock . . . . . . . . . . . . . . . . . . . . . . . . . . . . . . . . . . 634,843 598,139 563,557 530,975 500,178Noncontrolling interest . . . . . . . . . . . . . . . . . . . . . . . . . . . . . . . . . . . . . 508 88 (18,693) 19,831 88,429Total stockholders’ equity (deficit) . . . . . . . . . . . . . . . . . . . . . . . . . . . . (952,536) (876,875) (196,919) (34,738) 298,251
Key MetricsTravel Network . . . . . . . . . . . . . . . . . . . . . . . . . . . . . . . . . . . . . . . . . . .
Direct Billable Bookings - Air . . . . . . . . . . . . . . . . . . . . . . . . . . . . 314,275 326,175 328,200 325,370 301,686Direct Billable Bookings - Non-Air . . . . . . . . . . . . . . . . . . . . . . . . 53,503 53,669 53,683 49,229 43,084Total Direct Billable Bookings . . . . . . . . . . . . . . . . . . . . . . . . . . . 367,778 379,844 381,883 374,599 344,770
Airline Solutions Passengers Boarded . . . . . . . . . . . . . . . . . . . . . . . . . . 478,088 405,420 364,420 313,959 287,591
(1) Certain amounts previously reported in our December 31, 2012, 2011, 2010 and 2009 financial statements have been reclassified toconform to the December 31, 2013 presentation. See Note 2, Summary of Significant Accounting Policies—Reclassifications, to ouraudited consolidated financial statements included elsewhere in this prospectus. In June 2013, we sold certain assets of our HolidayAutos operations to a third party and in November 2013, we completed the closing of the remainder of the Holiday Autos operationssuch that it represented a discontinued operation. See Note 4, Discontinued Operations and Dispositions, to our audited consolidatedfinancial statements included elsewhere in this prospectus. The impact on our revenue was a reduction of $65 million, $76 million, $74million and $78 million for the years ended December 31, 2012, 2011, 2010 and 2009, respectively. The impact on our operating incomewas an increase of $12 million for the year ended December 31, 2012, a reduction of less than $1 million and $5 million for the yearsended December 31, 2011 and 2010, respectively, and an increase of $44 million for the year ended December 31, 2009.
Non-GAAP Measures
The following table sets forth the reconciliation of Adjusted Net Income and Adjusted EBITDA to net lossattributable to Sabre Corporation, the most directly comparable GAAP measure:
Year Ended December 31,
2013 2012 2011 2010 2009
(Amounts in thousands)Reconciliation of net loss to Adjusted Net Income and to Adjusted
EBITDA:Loss attributable to Sabre Corporation . . . . . . . . . . . . . . . . . . . . . . . . . . . . . . $(100,494) $(611,356) $ (66,074) $(268,851) $(158,734)
Loss from discontinued operations, net of tax . . . . . . . . . . . . . . . . . . . . . 7,176 48,947 23,461 16,949 56,021Net income (loss) attributable to noncontrolling interests(1) . . . . . . . . . . 2,863 (59,317) (36,681) (64,382) (7,476)
Loss from continuing operations . . . . . . . . . . . . . . . . . . . . . . . . . . . . . . . . . . . (90,455) (621,726) (79,294) (316,284) (110,189)Adjustments:
Impairment(2) . . . . . . . . . . . . . . . . . . . . . . . . . . . . . . . . . . . . . . . . . . . . . . 138,435 596,980 185,240 401,400 211,612Acquisition related amortization expense(3a) . . . . . . . . . . . . . . . . . . . . . . 143,765 162,517 162,312 163,213 183,850Loss (gain) on sale of business and assets . . . . . . . . . . . . . . . . . . . . . . . . — (25,850) — — —Loss on extinguishment of debt . . . . . . . . . . . . . . . . . . . . . . . . . . . . . . . . 12,181 — — — (31,565)Other expense (income), net(4) . . . . . . . . . . . . . . . . . . . . . . . . . . . . . . . . . 6,724 1,385 (1,156) (5,871) (18,070)Restructuring and other costs(5) . . . . . . . . . . . . . . . . . . . . . . . . . . . . . . . . 59,052 6,776 12,986 17,282 22,387Litigation and taxes, including penalties(6) . . . . . . . . . . . . . . . . . . . . . . . 39,431 418,622 21,601 1,600 1,405Stock–based compensation . . . . . . . . . . . . . . . . . . . . . . . . . . . . . . . . . . . 9,086 9,834 7,334 5,300 4,108Management fees(7) . . . . . . . . . . . . . . . . . . . . . . . . . . . . . . . . . . . . . . . . . 8,761 7,769 7,191 6,730 7,260Tax impact of net income adjustments . . . . . . . . . . . . . . . . . . . . . . . . . . (109,829) (405,421) (80,048) (67,415) (75,478)
Adjusted Net Income from continuing operations . . . . . . . . . . . . . . . . . . . . . . 217,151 150,886 236,166 205,955 195,320Adjustments:
Depreciation and amortization of property and equipment . . . . . . . . . . . 131,483 135,561 122,640 110,748 99,326Amortization of capitalized implementation costs(3c) . . . . . . . . . . . . . . . 35,551 20,855 11,365 8,162 3,035Amortization of upfront incentive consideration( 8) . . . . . . . . . . . . . . . . . 36,649 36,527 37,748 26,572 29,554Interest expense, net . . . . . . . . . . . . . . . . . . . . . . . . . . . . . . . . . . . . . . . . . 274,689 232,450 174,390 200,945 234,758Remaining (benefit) provision for income taxes . . . . . . . . . . . . . . . . . . . 95,800 210,350 137,854 138,634 65,186
Adjusted EBITDA . . . . . . . . . . . . . . . . . . . . . . . . . . . . . . . . . . . . . . . . . . . . . . $ 791,323 $ 786,629 $720,163 $ 691,016 $ 627,179
73
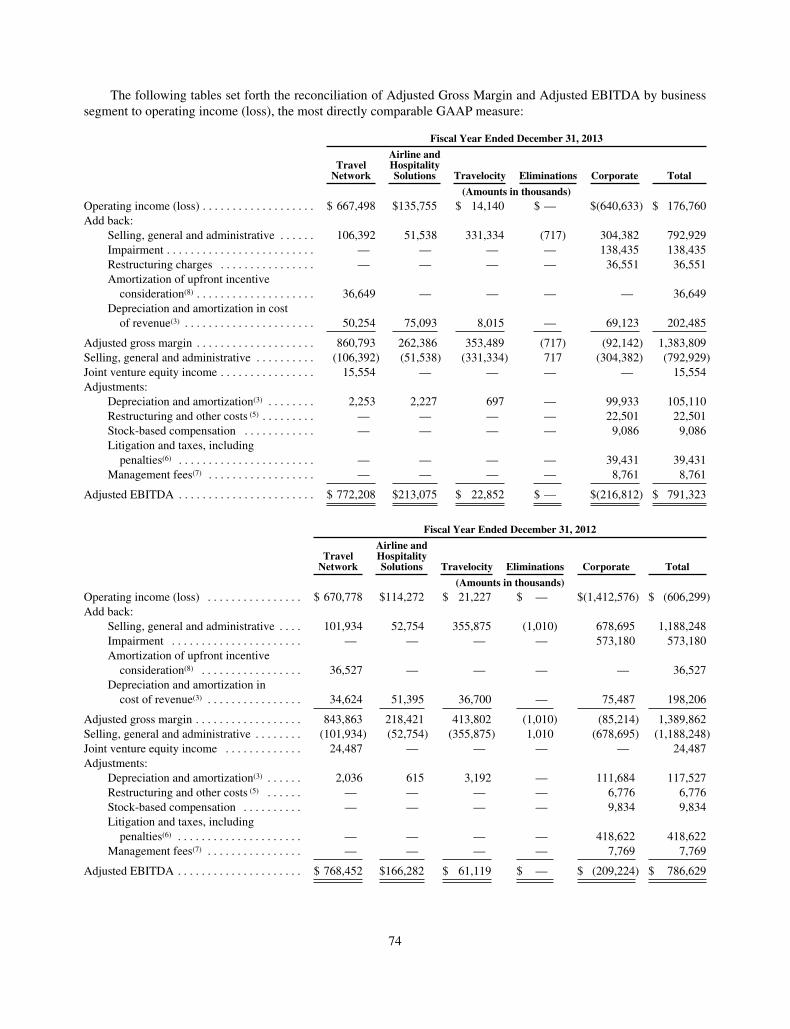
The following tables set forth the reconciliation of Adjusted Gross Margin and Adjusted EBITDA by businesssegment to operating income (loss), the most directly comparable GAAP measure:
Fiscal Year Ended December 31, 2013
TravelNetwork
Airline andHospitalitySolutions Travelocity Eliminations Corporate Total
(Amounts in thousands)Operating income (loss) . . . . . . . . . . . . . . . . . . . $ 667,498 $135,755 $ 14,140 $ — $(640,633) $ 176,760Add back:
Selling, general and administrative . . . . . . 106,392 51,538 331,334 (717) 304,382 792,929Impairment . . . . . . . . . . . . . . . . . . . . . . . . . — — — — 138,435 138,435Restructuring charges . . . . . . . . . . . . . . . . — — — — 36,551 36,551Amortization of upfront incentiveconsideration(8) . . . . . . . . . . . . . . . . . . . . 36,649 — — — — 36,649
Depreciation and amortization in costof revenue(3) . . . . . . . . . . . . . . . . . . . . . . 50,254 75,093 8,015 — 69,123 202,485
Adjusted gross margin . . . . . . . . . . . . . . . . . . . . 860,793 262,386 353,489 (717) (92,142) 1,383,809Selling, general and administrative . . . . . . . . . . (106,392) (51,538) (331,334) 717 (304,382) (792,929)Joint venture equity income . . . . . . . . . . . . . . . . 15,554 — — — — 15,554Adjustments:
Depreciation and amortization(3) . . . . . . . . 2,253 2,227 697 — 99,933 105,110Restructuring and other costs (5) . . . . . . . . . — — — — 22,501 22,501Stock-based compensation . . . . . . . . . . . . — — — — 9,086 9,086Litigation and taxes, includingpenalties(6) . . . . . . . . . . . . . . . . . . . . . . . — — — — 39,431 39,431
Management fees(7) . . . . . . . . . . . . . . . . . . — — — — 8,761 8,761
Adjusted EBITDA . . . . . . . . . . . . . . . . . . . . . . . $ 772,208 $213,075 $ 22,852 $ — $(216,812) $ 791,323
Fiscal Year Ended December 31, 2012
TravelNetwork
Airline andHospitalitySolutions Travelocity Eliminations Corporate Total
(Amounts in thousands)Operating income (loss) . . . . . . . . . . . . . . . . $ 670,778 $114,272 $ 21,227 $ — $(1,412,576) $ (606,299)Add back:
Selling, general and administrative . . . . 101,934 52,754 355,875 (1,010) 678,695 1,188,248Impairment . . . . . . . . . . . . . . . . . . . . . . — — — — 573,180 573,180Amortization of upfront incentiveconsideration(8) . . . . . . . . . . . . . . . . . 36,527 — — — — 36,527
Depreciation and amortization incost of revenue(3) . . . . . . . . . . . . . . . . 34,624 51,395 36,700 — 75,487 198,206
Adjusted gross margin . . . . . . . . . . . . . . . . . . 843,863 218,421 413,802 (1,010) (85,214) 1,389,862Selling, general and administrative . . . . . . . . (101,934) (52,754) (355,875) 1,010 (678,695) (1,188,248)Joint venture equity income . . . . . . . . . . . . . 24,487 — — — — 24,487Adjustments:
Depreciation and amortization(3) . . . . . . 2,036 615 3,192 — 111,684 117,527Restructuring and other costs (5) . . . . . . — — — — 6,776 6,776Stock-based compensation . . . . . . . . . . — — — — 9,834 9,834Litigation and taxes, includingpenalties(6) . . . . . . . . . . . . . . . . . . . . . — — — — 418,622 418,622
Management fees(7) . . . . . . . . . . . . . . . . — — — — 7,769 7,769
Adjusted EBITDA . . . . . . . . . . . . . . . . . . . . . $ 768,452 $166,282 $ 61,119 $ — $ (209,224) $ 786,629
74

Fiscal Year Ended December 31, 2011
TravelNetwork
Airline andHospitalitySolutions Travelocity Eliminations Corporate Total
(Amounts in thousands)Operating income (loss) . . . . . . . . . . . . . . . . $ 594,418 $103,254 $ 32,971 $ — $(602,398) $ 128,245Add back:
Selling, general and administrative . . . 111,003 50,306 374,801 (1,083) 271,408 806,435Impairment . . . . . . . . . . . . . . . . . . . . . . — — — — 185,240 185,240Amortization of upfront incentiveconsideration(8) . . . . . . . . . . . . . . . . . 37,748 — — — — 37,748
Depreciation and amortization in costof revenue(3) . . . . . . . . . . . . . . . . . . . 29,584 31,587 40,018 — 71,657 172,846
Adjusted gross margin . . . . . . . . . . . . . . . . . 772,753 185,147 447,790 (1,083) (74,093) 1,330,514Selling, general and administrative . . . . . . . (111,003) (50,306) (374,801) 1,083 (271,408) (806,435)Joint venture equity income . . . . . . . . . . . . . 26,701 — — — — 26,701Adjustments:
Depreciation and amortization(3) . . . . . 4,120 343 3,480 — 112,328 120,271Restructuring and other costs (5) . . . . . . — — — — 12,986 12,986Stock-based compensation . . . . . . . . . . — — — — 7,334 7,334Litigation and taxes, includingpenalties(6) . . . . . . . . . . . . . . . . . . . . . — — — — 21,601 21,601
Management fees(7) . . . . . . . . . . . . . . . . — — — — 7,191 7,191
Adjusted EBITDA . . . . . . . . . . . . . . . . . . . . $ 692,571 $135,184 $ 76,469 $ — $(184,061) $ 720,163
Fiscal Year Ended December 31, 2010
TravelNetwork
Airline andHospitalitySolutions Travelocity Eliminations Corporate Total
(Amounts in thousands)Operating income (loss) . . . . . . . . . . . . . . . . . $545,762 $127,103 $ 50,157 $ — $(790,884) $ (67,862)Add back:
Selling, general and administrative . . . . 71,495 39,417 406,443 (591) 272,413 789,177Impairment . . . . . . . . . . . . . . . . . . . . . . . — — — — 401,400 401,400Amortization of upfront incentiveconsideration(8) . . . . . . . . . . . . . . . . . . 26,572 — — — — 26,572
Depreciation and amortization in cost ofrevenue(3) . . . . . . . . . . . . . . . . . . . . . . 32,349 19,663 31,995 — 69,411 153,418
Adjusted gross margin . . . . . . . . . . . . . . . . . . 676,178 186,183 488,595 (591) (47,660) 1,302,705Selling, general and administrative . . . . . . . . (71,495) (39,417) (406,443) 591 (272,413) (789,177)Joint venture equity income . . . . . . . . . . . . . . 21,071 — — — — 21,071Adjustments:
Depreciation and amortization(3) . . . . . . 4,172 450 8,207 — 112,676 125,505Restructuring and other costs (5) . . . . . . . — — — — 17,282 17,282Stock-based compensation . . . . . . . . . . — — — — 5,300 5,300Litigation and taxes, includingpenalties(6) . . . . . . . . . . . . . . . . . . . . . — — — — 1,600 1,600
Management fees(7) . . . . . . . . . . . . . . . . — — — — 6,730 6,730
Adjusted EBITDA . . . . . . . . . . . . . . . . . . . . . $629,926 $147,216 $ 90,359 $ — $(176,485) $ 691,016
75

Fiscal Year Ended December 31, 2009
TravelNetwork
Airline andHospitalitySolutions Travelocity Eliminations Corporate Total
(Amounts in thousands)Operating income (loss) . . . . . . . . . . . . . . . . . . . . . . . $484,105 $112,048 $ 81,012 $ — $(620,670) $ 56,495Add back:
Selling, general and administrative . . . . . . . . . . . 85,870 41,970 399,005 (527) 279,643 805,961Impairment . . . . . . . . . . . . . . . . . . . . . . . . . . . . . — — — — 211,612 211,612Amortization of upfront incentiveconsideration(8) . . . . . . . . . . . . . . . . . . . . . . . . . 29,554 — — — — 29,554
Depreciation and amortization in cost ofrevenue(3) . . . . . . . . . . . . . . . . . . . . . . . . . . . . . 29,968 11,038 27,054 — 56,720 124,780
Adjusted gross margin . . . . . . . . . . . . . . . . . . . . . . . . . 629,497 165,056 507,071 (527) (72,695) 1,228,402Selling, general and administrative . . . . . . . . . . . . . . . (85,870) (41,970) (399,005) 527 (279,643) (805,961)Joint venture equity income . . . . . . . . . . . . . . . . . . . . . 11,356 — — — — 11,356Adjustments:
Depreciation and amortization(3) . . . . . . . . . . . . . 1,588 729 11,820 — 144,085 158,222Restructuring and other costs (5) . . . . . . . . . . . . . . — — — — 22,387 22,387Stock-based compensation . . . . . . . . . . . . . . . . . — — — — 4,108 4,108Litigation and taxes, including penalties(6) . . . . . — — — — 1,405 1,405Management fees(7) . . . . . . . . . . . . . . . . . . . . . . . — — — — 7,260 7,260
Adjusted EBITDA . . . . . . . . . . . . . . . . . . . . . . . . . . . . $556,571 $123,815 $ 119,886 $ — $(173,093) $ 627,179
The components of Adjusted Capital Expenditures are presented below:Year Ended December 31,
2013 2012 2011 2010 2009
(Amounts in thousands)Additions to property and equipment . . . . . . . . . . . . . . . . . . . . . . . . . . . . . . . $226,026 $193,262 $164,638 $130,028 $106,554Capitalized implementation costs . . . . . . . . . . . . . . . . . . . . . . . . . . . . . . . . . . 58,814 78,543 59,109 33,666 20,401
Adjusted capital expenditures . . . . . . . . . . . . . . . . . . . . . . . . . . . . . . . . $284,840 $271,805 $223,747 $163,694 $126,955
The following tables present historical information from our statements of cash flows and sets forth thereconciliation of Adjusted Free Cash Flow to cash provided by operating activities, the most directly comparableGAAP measure:
Year Ended December 31,
2013 2012 2011 2010 2009
(Amounts in thousands)Cash provided by operating activities . . . . . . . . . . . . . . . . . . . . . . . . . . . . . . $ 157,188 $ 312,336 $ 356,444 $ 380,928 $ 284,159Cash used in investing activities . . . . . . . . . . . . . . . . . . . . . . . . . . . . . . . . . . (246,502) (236,034) (176,260) (184,787) (108,053)Cash provided by (used in) financing activities . . . . . . . . . . . . . . . . . . . . . . . 262,172 (25,120) (271,540) (48,500) (335,702)
Year Ended December 31,
2013 2012 2011 2010 2009
(Amounts in thousands)Cash provided by operating activities . . . . . . . . . . . . . . . . . . . . . . . . . . . . . . $ 157,188 $ 312,336 $ 356,444 $ 380,928 $ 284,159Adjustments:
Additions to property and equipment . . . . . . . . . . . . . . . . . . . . . . . . . . . (226,026) (193,262) (164,638) (130,028) (106,554)Restructuring and other costs(5) (10) . . . . . . . . . . . . . . . . . . . . . . . . . . . . . 29,069 6,776 12,988 17,282 22,387Litigation settlement and tax payments for certain items(6) (11) . . . . . . . . 150,584 100,000 — — —Other litigation costs(6) (10) . . . . . . . . . . . . . . . . . . . . . . . . . . . . . . . . . . . 17,419 51,602 21,601 1,600 1,405Management fees(7) (10) . . . . . . . . . . . . . . . . . . . . . . . . . . . . . . . . . . . . . . 8,761 7,769 7,191 6,730 7,260Travelocity Travel Supplier Liabilities and Accounts Payable asimpacted by the Expedia SMA(9) . . . . . . . . . . . . . . . . . . . . . . . . . . . . 23,928 — — — —
Adjusted Free Cash Flow . . . . . . . . . . . . . . . . . . . . . . . . . . . . . . . . . . . . . . . . $ 160,923 $ 285,221 $ 233,586 $ 276,512 $ 208,657
(1) Net income (loss) attributable to non-controlling interests represents an adjustment to include earnings allocated tonon-controlling interest held in (i) Sabre Travel Network Middle East of 40% for all periods presented, (ii) Sabre
76
Pacific of 49% through February 24, 2012, the date we sold this business and (iii) Travelocity.com LLC ofapproximately 9.5% through December 31, 2012, the date we merged this minority interest back into our capitalstructure. See Note 2, Summary of Significant Accounting Policies, to our audited consolidated financialstatements included elsewhere in this prospectus.
(2) Represents impairment charges to assets (see Note 7, Goodwill and Intangible Assets, to our audited consolidatedfinancial statements included elsewhere in this prospectus) as well as $24 million in 2012, representing our shareof impairment charges recorded by one of our equity method investments, Abacus.
(3) Depreciation and amortization expenses (see Note 2, Summary of Significant Accounting Policies, to our auditedconsolidated financial statements included elsewhere in this prospectus for associated asset lives):
a. Acquisition related amortization represents amortization of intangible assets from the take-privatetransaction in 2007 as well as intangibles associated with acquisitions since that date and amortization ofthe excess basis in our underlying equity in joint ventures.
b. Depreciation and amortization of property and equipment represents depreciation of property andequipment, including software developed for internal use.
c. Amortization of capitalized implementation costs represents amortization of upfront costs to implementnew customer contracts under our SaaS and hosted revenue model.
(4) Other, net primarily represents foreign exchange gains and losses related to the remeasurement of foreign currencydenominated balances included in our consolidated balance sheets into the relevant functional currency.
(5) Restructuring and other costs represents charges associated with business restructuring and associated changesimplemented which resulted in severance benefits related to employee terminations, integration and facilityopening or closing costs and other business reorganization costs.
(6) Represents charges or settlements associated with airline antitrust litigation as well as payments or reserves takenin relation to certain retroactive hotel occupancy and excise tax disputes (see Note 20, Commitments andContingencies, to our audited consolidated financial statements included elsewhere in this prospectus).
(7) We have been paying an annual management fee to TPG and Silver Lake in an amount between (i) $5 million and(ii) $7 million, the actual amount of which is calculated based upon 1% of Adjusted EBITDA, as defined in theMSA, earned by the company in such fiscal year up to a maximum of $7 million. In addition, the MSA providesfor the reimbursement of certain costs incurred by TPG and Silver Lake, which are included in this line item. Inconnection with the completion of this offering, we will pay to TPG and Silver Lake, in the aggregate, a $21million fee pursuant to the MSA and the MSA will be terminated.
(8) Our Travel Network business at times provides upfront incentive consideration to travel agency subscribers at theinception or modification of a service contract, which are capitalized and amortized to cost of revenue over anaverage expected life of the service contract, generally over three to five years. Such consideration is made withthe objective of increasing the number of clients or to ensure or improve customer loyalty. Such service contractterms are established such that the supplier and other fees generated over the life of the contract will exceed thecost of the incentive consideration provided upfront. Such service contracts with travel agency subscribers requirethat the customer commit to achieving certain economic objectives and generally have terms requiring repaymentof the upfront incentive consideration if those objectives are not met.
(9) Represents the impact by the Expedia SMA on travel supplier liabilities of $19 million and accounts payable of $5million for the period November 1, 2013 through December 31, 2013 compared to the period November 1, 2012through December 31, 2012, which is primarily attributable to the migration of bookings from our technologyplatform to Expedia’s platform during this period in 2013 (see “Management’s Discussion and Analysis ofFinancial Condition and Results of Operations—Factors Affecting our Results—Travelocity”).
(10) The adjustments to reconcile cash provided by operating activities to Adjusted Free Cash Flow reflect the amountsexpensed in our statements of operations in the respective periods adjusted for non-cash portions in instanceswhere material.
(11) Includes payment credits totaling $16 million used by American Airlines to pay for purchases of our technologyservices in 2013. The payment credits were provided by us as part of our litigation settlement with AmericanAirlines (see Note 20, Commitments and Contingencies, to our audited consolidated financial statements includedelsewhere in this prospectus).
77
MANAGEMENT’S DISCUSSION AND ANALYSIS OFFINANCIAL CONDITION AND RESULTS OF OPERATIONS
The following discussion and analysis contains forward-looking statements about trends, uncertainties andour plans and expectations of what may happen in the future. Forward-looking statements are based on anumber of assumptions and estimates that are inherently subject to significant risks and uncertainties and ourresults could differ materially from the results anticipated by our forward-looking statements as a result of manyknown or unknown factors, including, but not limited to, those factors discussed in the sections entitled “RiskFactors” and “Cautionary Note Regarding Forward-Looking Statements” and elsewhere in this prospectus.
The following discussion and analysis should be read in conjunction with our consolidated financialstatements and related notes and the information contained elsewhere in this prospectus under the captions“Risk Factors,” “Selected Historical Consolidated Financial Data” and “Business.”
Overview
We are a leading technology solutions provider to the global travel and tourism industry. We span the breadthof a highly complex $6.6 trillion global travel ecosystem through three business segments: (i) Travel Network, ourglobal B2B travel marketplace for travel suppliers and travel buyers, (ii) Airline and Hospitality Solutions, anextensive suite of leading software solutions primarily for airlines and hotel properties, and (iii) Travelocity, ourportfolio of online consumer travel e-commerce businesses through which we provide travel content and bookingfunctionality primarily for leisure travelers. Collectively, these offerings enable travel suppliers to better serve theircustomers across the entire travel lifecycle, from route planning to post-trip business intelligence and analysis. Itemsthat are not allocated to our business segments are identified as corporate and include primarily certain sharedtechnology costs as well as stock-based compensation expense, litigation costs related to occupancy or other taxesand other items that are not identifiable with one of our segments.
Through our Travel Network business, we process hundreds of millions of transactions annually, connectingthe world’s leading travel suppliers, including airlines, hotels, car rental brands, rail carriers, cruise lines and touroperators, with travel buyers in a comprehensive travel marketplace. We offer efficient, global distribution of travelcontent from approximately 125,000 travel suppliers to approximately 400,000 online and offline travel agents. Tothose agents, we offer a platform to shop, price, book and ticket comprehensive travel content in a transparent andefficient workflow. We also offer value-added solutions that enable our customers to better manage and analyzetheir businesses. Through our Airline and Hospitality Solutions business, we offer travel suppliers an extensive suiteof leading software solutions, ranging from airline and hotel reservations systems to high-value marketing andoperations solutions, such as planning airline crew schedules, re-accommodating passengers during irregular flightoperations and managing day-to-day hotel operations. These solutions allow our customers to market, distribute andsell their products more efficiently, manage their core operations, and deliver an enhanced travel experience.Through our complementary Travel Network and Airline and Hospitality Solutions businesses, we believe we offerthe broadest, end-to-end portfolio of technology solutions to the travel industry.
Our portfolio of technology solutions has enabled us to become the leading end-to-end technology providerin the travel industry. For example, we are one of the largest GDS providers in the world, with a 36% share ofGDS-processed air bookings in 2013. More specifically, we are the #1 GDS provider in North America and alsoin higher growth markets such as Latin America and APAC, in each case based on GDS-processed air bookingsin 2013. In those three markets, our GDS-processed air bookings share was approximately 50% on a combinedbasis in 2013. In Airline and Hospitality Solutions, we believe we have the most comprehensive portfolio ofsolutions. In 2013, we had the largest hospitality CRS room share based on our approximately 27% share ofthird-party hospitality CRS hotel rooms distributed through our GDS, and, according to T2RL PSS data for 2012,we had the second largest airline reservations system globally. We also believe that we have the leading portfolioof airline marketing and operations products across the solutions that we provide. In addition, we operateTravelocity, one of the world’s most recognizable brands in the online consumer travel e-commerce industry,which provides us with business insights into our broader customer base.
78
A significant portion of our revenue is generated through transaction based fees that we charge to ourcustomers. For Travel Network, this fee is in the form of a transaction fee for bookings on our GDS; for Airlineand Hospitality Solutions, this fee is a recurring usage-based fee for the use of our SaaS and hosted systems, aswell as implementation fees and consulting fees. We recorded revenue of $3,050 million and $2,974 million, netloss attributable to Sabre Corporation of $100 million and $611 million and Adjusted EBITDA of $791 millionand $787 million, reflecting a 3% and 21% net loss margin and a 26% and 26% Adjusted EBITDA margin, forthe years ended December 31, 2013 and 2012, respectively. For additional information regarding AdjustedEBITDA, including a reconciliation of Adjusted EBITDA to the most directly comparable GAAP measure, see“Non-GAAP Financial Measures” and “Summary—Summary Consolidated Financial Data—Non-GAAPMeasures.” For the year ended December 31, 2013, Travel Network contributed 58%, Airline and HospitalitySolutions contributed 23%, and Travelocity contributed 19% of our revenue (excluding intersegmenteliminations). During this period, shares of Adjusted EBITDA were approximately 77%, 21% and 2% for TravelNetwork, Airline and Hospitality Solutions and Travelocity, respectively (excluding corporate overheadallocations such as finance, legal, human resources and certain information technology shared services). For theyear ended December 31, 2012, Travel Network contributed 59% and 77%, Airline and Hospitality Solutionscontributed 20% and 17%, and Travelocity contributed 21% and 6% of our revenue (excluding intersegmenteliminations) and Adjusted EBITDA (excluding corporate overhead allocations), respectively.
Factors Affecting our Results
The following is a discussion of trends that we believe are the most significant opportunities and challengescurrently impacting our business and industry. The discussion also includes management’s assessment of theeffects these trends have had and are expected to have on our results of continuing operations. This informationis not an exhaustive list of all of the factors that could affect our results and should be read in conjunction withthe factors referred to in the sections entitled “Risk Factors” and “Cautionary Note Regarding Forward-LookingStatements” included elsewhere in this prospectus.
Travel volumes and the travel industry
Our business and results of operations are dependent upon travel volumes and the overall health of the travelindustry, particularly in North America. The travel industry has shown strong and resilient expansion withgrowth rates typically outperforming general macroeconomic performance. For example, based on 40 years ofIATA Traffic data, air traffic has historically grown at an average rate of approximately 1.5x the rate of globalGDP growth. Although the global economic downturn significantly impacted the travel industry, conditions havegenerally improved in the last several years. For example, although hotel sales are still hampered by an economicenvironment characterized by austerity and consumer caution, other less expensive suppliers, including LCC/hybrids, are benefiting. Tourism flows and travel spending have returned to growth as developed markets,particularly in the United States, Japan and Europe, recover from the global economic downturn. According toEuromonitor Report, business-related travel by U.S. residents has increased since the global economic downturn,reaching 228 million trips in 2012. According to IATA Traffic, global airline passenger volume has grown at a6% CAGR from 2009 to 2012. Looking forward, air travel and hotel spending is expected to grow at a 4%CAGR from 2013 to 2017, as growing consumer confidence and increasing connectivity continue to expand theopportunities for travel and tourism, according to Euromonitor Database. However, in recent years, severalairlines, especially in the United States, have implemented capacity reductions in response to slowing customerdemand following the global economic downturn and in order to improve pricing power. These capacityreductions have resulted in lower inventory and higher ticket prices, amid increased airline industryconsolidation.
Geographic mix
We have a leading share of GDS-processed air bookings in the largest travel market, North America (55%),as well as in two large growth markets, Latin America (57%) and APAC (39%) in 2013. See “Method of
79
Calculation” for an explanation of the methodology underlying our GDS-processed air bookings sharecalculation. For the year ended December 31, 2013, we derived approximately 58% of our revenue from theUnited States, 16% from Europe and 26% from the rest of the world. For the year ended December 31, 2012, wederived approximately 62% of our revenue from the United States, 16% from Europe and 22% from the rest ofthe world.
There are structural differences between the geographies in which we operate. Due to our geographicconcentration, our results of operations are particularly sensitive to factors affecting North America. Forexample, booking fees per transaction in North America have traditionally been lower than those in Europe. Bygrowing internationally with our TMC and OTA customers and expanding the travel content available on ourGDS to target regional traveler preferences, we anticipate that we will maintain share in North America and growshare in Europe, APAC and Latin America.
Continued focus by travel suppliers on cost-cutting and exerting influence over distribution
Travel suppliers continue to look for ways to decrease their costs and to increase their control overdistribution. Airline consolidations, pricing pressure during contract renegotiations and the use of directdistribution may continue to subject our business to challenges.
The shift from indirect distribution channels, such as our GDS and Travelocity, to direct distributionchannels, may result from increased content availability on supplier-operated websites or from increasedparticipation of meta-search engines, such as Kayak and Google, which direct consumers to supplier-operatedwebsites. This trend may adversely affect our Travel Network contract renegotiations with suppliers that usealternative distribution channels. For example, airlines may withhold part of their content for distributionexclusively through their own direct distribution channels or offer more attractive terms for content availablethrough those direct channels. Similarly, some airlines have also limited the fare content information theydistribute through OTAs, including Travelocity.
However, since 2010, we believe the rate at which bookings are shifting from indirect to direct distributionchannels has slowed for a number of reasons, including the increased participation of LCC/hybrids in indirectchannels. Over the last several years, notable carriers that previously only distributed directly, including JetBlueand Norwegian, have adopted our GDS. Other carriers such as EVA Airways and Virgin Australia have furtherincreased their participation in a GDS. In 2012 and 2013, we believe the rate of shift away from GDSs in theUnited States stabilized at very low levels, although we cannot predict whether this low rate of shift willcontinue.
These trends have impacted the revenue of Travel Network, which recognizes revenue for airline ticket salesbased on transaction volumes, the revenue of Airline and Hospitality Solutions, which recognizes a portion of itsrevenue based on the number of PBs, and the results of Travelocity, the profitability of which is based on boththe volume of sales and the amount spent by the traveler, depending upon the applicable revenue model.Simultaneously, this focus on cost-cutting and direct distribution has also presented opportunities for Airline andHospitality Solutions. Many airlines have turned to outside providers for key systems, process and industryexpertise and other products that assist in their cost cutting initiatives in order to focus on their primary revenue-generating activities.
We have 28 planned Travel Network airline contract renewals in 2014, representing 22% of our TravelNetwork revenue for the year ended December 31, 2013 and 24 planned renewals in 2015 (representing 5% ofour Travel Network revenue for the year ended December 31, 2013). Although we renewed 24 out of 24 plannedrenewals in 2013 (representing approximately 25% of Travel Network revenue for the year ended December 31,2013), we cannot guarantee that we will be able to renew our airline contracts in the future on favorableeconomic terms or at all.
80

Shift to SaaS and hosted solutions by airlines and hotels to manage their daily operations
Initially, large travel suppliers built custom in-house software and applications for their business processneeds. In response to a desire for more flexible systems given increasingly complex and constantly changingtechnological requirements, reduced IT budgets and increased focus on cost efficiency, many travel suppliersturned to third-party solutions providers for many of their key technologies and began to license software fromsoftware providers. We believe that significant revenue opportunity remains in this outsourcing trend, as legacyin-house systems continue to migrate and upgrade to third-party systems. By moving away from one-time licensefees to recurring monthly fees associated with our SaaS and hosted solutions, our revenue stream has becomemore predictable and sustainable. The SaaS and hosted models’ centralized deployment also allows us to savetime and money by reducing maintenance and implementation tasks and lowering operating costs.
Increasing importance of LCC/hybrids in Travel Network and Airline and Hospitality Solutions
Hybrid and LCCs have become a significant segment of the air travel market, stimulating demand for airtravel through low fares. LCC/hybrids have traditionally relied on direct distribution for the majority of theirbookings. However, as these LCC/hybrids are evolving, many are increasing their distribution through indirectchannels to expand their offering into higher-yield markets and to higher-yield customers, such as business andinternational travelers. Other LCC/hybrids, especially start-up carriers, may choose not to distribute through theGDS until wider distribution is desired.
Over the last four years, we have added airline customers representing over 110 million PBs, includingmany innovative, fast-growing LCC/hybrids. According to Airbus, LCCs’ share of global air travel volume isexpected to increase from 17% of revenue passenger kilometers in 2012 to 21% of revenue passenger kilometersby 2032. In our airline reservations products, our travel supplier customer base is weighted towards faster-growing LCC/hybrids, which represented approximately 45% of our 2012 PBs, and we expect to continue to takeadvantage of this growth opportunity. Furthermore, because of the breadth of our solution set and our proportionof LCC/hybrid customers, we expect to be able to sell more of our solutions to our existing customers as theygrow. As our growing LCC/hybrid customers demand additional solutions and capabilities, we expect Airlineand Hospitality Solutions revenue to continue benefiting from the higher growth in these types of airlines.
Travel buyers can shift their bookings to or from our Travel Network business
Our Travel Network business relies on relationships with several large travel buyers, including TMCs andOTAs, to drive a large portion of its revenue. Although no individual travel buyer accounts for more than 10% ofour Travel Network revenue, the five largest travel buyers of Travel Network were responsible for bookings thatrepresent approximately 32% and 36% of our Travel Network revenue for the years ended December 31, 2013and 2012, respectively. Although our contracts with larger travel agencies often increase the amount of theincentive consideration when the travel agency processes a certain volume or percentage of its bookings throughour GDS, travel buyers are not contractually required to book exclusively through our GDS during the contractterm. Travel buyers may shift bookings to other distribution intermediaries for many reasons, including to avoidbecoming overly dependent on a single source of travel content and increase their bargaining power with theGDS providers. For example, in late 2012, Expedia adopted a dual GDS provider strategy and shifted a sizeableportion of its business from our GDS to a competitor GDS, resulting in a year-over-year decline in ourtransaction volumes in 2013. Conversely, certain European OTAs including Unister, eTravel and Bravofly thatdid not previously use our GDS shifted a portion of their business to our GDS.
Increasing travel agency incentive consideration
Travel agency incentive consideration is a large portion of Travel Network expenses. The vast majority ofincentive consideration is tied to absolute booking volumes based on transactions such as flight segmentsbooked. Incentive consideration, which often increases once a certain volume or percentage of bookings is met,
81
is provided in two ways, according to the terms of the agreement: (i) on a periodic basis over the term of thecontract and (ii) in some instances, up front at the inception or modification of contracts, which is capitalized andamortized over the expected life of the contract. Although this consideration has been increasing in real terms, ithas been relatively stable as a percentage of Travel Network revenue over the last four years, partially due to ourfocus on managing incentive consideration. We believe we have been effective in mitigating the trend towardsincreasing incentive consideration by offering value-added products and content, such as Sabre Red Workspace,a SaaS product available to our travel buyers that provides an easy to use interface along with many travel agencyworkflow and productivity tools.
Growing demand for continued technology improvements in the fragmented hotel market
Most of the hotel market is highly fragmented. Independent hotels and small- to medium-sized chains(groups of less than 300 properties) comprise a majority of hotel properties and available hotel rooms, withglobal and regional chains comprising the balance. Hotels use a number of different technology systems todistribute and market their products and operate efficiently. We offer technology solutions to all segments of thehospitality market, particularly independent hotels and small- to medium-sized chains. As these markets continueto grow, we believe independent hotel owners and operators will continue to seek increased connectivity andintegrated solutions to ensure access to global travelers. Gartner estimates that technology spending by thehospitality industry is expected to reach $32 billion in 2017 (Gartner Enterprise), and we believe we will be well-positioned to meet this increased demand by continuing to provide affordable, web-based distributiontechnology. For example, we believe our innovative PMS, which is used by more than 4,500 properties globally,is one of the leading third-party web-based PMSs. Our PMS platform complements our industry-leading CRSplatform and we expect to launch an integrated hospitality management suite that will centralize all distribution,operations and marketing aspects to facilitate increased accuracy, elimination of redundancies, and increasedrevenue and cost savings. We anticipate that this will contribute to the continued growth of Airline andHospitality Solutions, which is ultimately dependent upon these hoteliers accepting and utilizing our productsand services.
Travelocity
Travelocity’s results have been adversely impacted by several factors in recent years, including marginpressure from suppliers and reduced bookings on our websites. For the three years ended December 31, 2013,Travelocity experienced an approximately 9% compound annual revenue decline due to intense competitionwithin the travel industry, including from supplier direct websites, online agencies and other suppliers of travelproducts and services. The increased level of competition has led to declines in fees paid to us pursuant to newlong-term supplier agreements with several large North American airlines in 2011 as well as lower transactionvolumes. In 2012, transaction revenues were impacted by the loss of a key TPN customer late in the third quarteras a result of this customer’s contract ending without renewal. This loss was partially offset by the addition of anew TPN customer, which signed a multi-year agreement.
Lower transaction volumes on our websites have also impacted our media revenue. Due to the reduction insite traffic associated with lower hotel transaction volumes and the change in customer demographics associatedwith the loss of a key TPN customer in 2012, Travelocity’s relevance as an advertising platform and the mediarevenues we derive from advertising have been negatively affected. In 2012, these challenges have contributed toa significant decline year over year. For the year ended December 31, 2013, we experienced a $5 million declinein media revenue compared to 2012.
Intense competition in the travel industry has historically led OTAs and travel suppliers to spendaggressively on online marketing. The amount we spent on online marketing declined in 2011 and was lesseffective at driving transaction revenue than it was in 2010. In response, we modified our customer acquisitionstrategy in 2012, refocusing on more efficient marketing channels and refreshing the approach to the brand, whilereducing the amount spent on marketing. If our online marketing strategy is not successful, it could lead tocontinued declines in Travelocity revenue.
82

As a result of these and other factors, we initiated plans in the third quarter of 2013 to shift our Travelocitybusiness in the United States and Canada away from a high fixed-cost model to a lower-cost, performance-basedrevenue structure. On August 22, 2013, Travelocity entered into an exclusive, long-term strategic marketingagreement with Expedia, which was recently amended and restated in March 2014 to reflect changed commercialterms. Under the Expedia SMA, Expedia will power the technology platforms for Travelocity’s existing U.S. andCanadian websites as well as provide Travelocity with access to Expedia’s supply and customer serviceplatforms. The Expedia SMA represents a strategic decision to reduce direct costs associated with Travelocityand to provide our customers with the benefit of Expedia’s long-term investment in its technology platform aswell as its supply and customer service platforms, which we expect to increase conversion and operationalefficiency and allows us to shift our focus to Travelocity’s marketing strengths. Both parties began developmentand implementation of this arrangement after signing the Expedia SMA. As of December 31, 2013, the majorityof the online hotel and air offering has been migrated to the Expedia platform, and a launch of the majority of theremainder is expected in mid-2014. See “Business—Our Businesses—Travelocity.”
Under the terms of the Expedia SMA, Expedia will pay us a performance-based marketing fee that will varybased on the amount of travel booked through Travelocity-branded websites powered by Expedia. The marketingfee we receive will be recorded as marketing fee revenue and the cost we incur to promote the Travelocity brandand for marketing will be recorded as selling, general and administrative expense in our results of operations. Asa result of transactions being processed through Expedia’s platform instead of the Travelocity platform, therevenue we derive from the merchant, agency and media revenue models will decline. In connection with thismigration, we will no longer be considered the merchant of record for merchant transactions, and therefore wewill no longer collect cash from consumers, receive transaction fees and commissions directly from travelsuppliers, receive service fees or insurance related revenue directly from customers or directly market or receivemedia revenue from advertisers on our websites. We will instead collect the marketing fee revenue from Expedia,which is net of costs incurred by Expedia in connection with these activities. Additionally, Travelocity will nolonger receive incentive consideration from Travel Network as intersegment revenue, and we do not expect thatExpedia will use Travel Network for shopping and booking of a portion of non-air travel for Travelocity.com andTravelocity.ca after the launch of the Expedia SMA. In addition, Expedia may choose to use anotherintermediary for shopping and booking of a portion or all of the air travel booked through Travelocity.com andTravelocity.ca beginning in 2019, subject to earlier termination under certain circumstances.
As a result of the factors described above, we expect our revenue to decline in connection with the ExpediaSMA; we expect the revenue contribution from Travelocity-branded websites to be in the range of 50% to 60%of current levels. Due to the elimination of the intersegment revenue between Travelocity and Travel Network,we expect intersegment eliminations to substantially decrease in connection with the Expedia SMA. See“—Components of Revenues and Expenses—Intersegment Transactions.”
Correspondingly, we will wind down certain internal processes, including back office functions, astransactions move from our technology platforms to those of Expedia. We therefore expect our costs tosignificantly decrease and to be in the range of 40% to 50% of current levels once the transition to the ExpediaSMA and restructuring is complete. Ongoing costs will primarily consist of marketing the Travelocity website,marketing staff and support staff. Under the Expedia SMA, we have committed to continue investing in themarketing of the Travelocity-branded websites in a manner that is consistent with past practice.
As a result, we expect our plan to result in improved margins and profitability for our Travelocity segment.
Our success is dependent on many factors, including:
• improved conversion through better site performance and user experience using the Expedia platformand technology;
• improved cost structure by reducing operational complexity; and
• profitable results from our marketing efforts.
83

We cannot be certain that this plan will be successful.
The implementation of the Expedia SMA will result in various restructuring costs, including assetimpairments, exit charges including employee termination benefits and contract termination fees, and otherrelated costs such as consulting and legal fees. As a result of this restructuring plan, we recorded $22 million inrestructuring charges in our results of operations during the year ended December 31, 2013, which included $4million of asset impairments, $12 million of employee termination benefits, and $6 million of other related costs.We estimate that we will incur additional charges of approximately $11 million in 2014 consisting of $6 millionin contract termination costs, $2 million in employee termination benefits, and $3 million of other related costs.Contract termination costs represent an estimate of costs we may incur as we negotiate with our vendors toterminate contracts and costs for contracts we are unable to renegotiate and receive no future benefit. The actualamount incurred may differ significantly from this estimate.
We expect Travelocity’s working capital to be impacted in connection with the Expedia SMA and the saleof TPN. As of December 31, 2013, we had approximately $214 million in total travel supplier liabilities of which$129 million represents the liability to travel suppliers in connection with Travelocity.com and TPN. This$129 million liability will be substantially extinguished as a result of the Expedia SMA and the sale of TPN aswe continue to pay travel suppliers for travel consumed that originated on our technology platforms; however, wewill no longer receive cash directly from consumers and will not incur a payable to travel suppliers for newbookings on our balance sheets. Going forward, our Travelocity-related working capital will primarily consist ofamounts attributable to lastminute.com balances as well as amounts due from Expedia offset by payables formarketing and labor related costs, which we expect to reduce the quarterly volatility that exists today. Asdescribed in “Description of Certain Indebtedness—Senior Secured Credit Facilities,” we have used a portion ofthe proceeds from our Incremental Term Facility for such working capital purposes.
As part of our negotiations to amend and restate the Expedia SMA, we also agreed to a separate ExpediaPut/Call agreement that supersedes the previous put/call arrangement, whereby Expedia may acquire, or we maysell to Expedia, certain assets relating to the Travelocity business. Our put right may be exercised during the first24 months of the Expedia Put/Call only upon the occurrence of certain triggering events primarily relating toimplementation, which are outside of our control. The occurrence of such events is not considered probable.During this period, the amount of the put right is fixed. After the 24 month period, the put right is onlyexercisable for a limited period of time in 2016 and 2017 at a discount to fair market value. The call right held byExpedia is exercisable at any time during the term of the Expedia Put/Call. If the call right is exercised, althoughwe expect the amount paid will be fair value, the call right provides for a floor for a limited time that may behigher than fair value and a ceiling for the duration of the Expedia Put/Call that may be lower than fair value.
The term of the amended and restated Expedia SMA is nine years and automatically renews under certainconditions.
In the fourth quarter of 2013, we continued our restructuring of Travelocity by implementing a plan torestructure lastminute.com, the European portion of the Travelocity business, in order to allow lastminute.com tooperate independently, although from time to time we may evaluate our strategic options regardinglastminute.com. Travelocity will continue to be managed as one reportable segment. During the year endedDecember 31, 2013, we recorded $6 million in restructuring charges associated with employee terminationbenefits related to this restructuring plan. Additionally, Travelocity recently sold its TPN business, a B2B loyaltyand private label website offering, to Orbitz.
See “Business—Our Businesses—Travelocity.”
Litigation and related costs
We are involved in various claims, legal proceedings and governmental inquiries related to contractdisputes, business practices, intellectual property and other commercial, employment and tax matters. We believewe have adequately accrued for such matters, and for the costs of defending against such matters, which have
84
been and may continue to be expensive. However, litigation is inherently unpredictable and although we believethat our accruals are adequate and we have valid defenses in these matters, unfavorable resolutions could occur,which could have a material adverse effect on our results of operations or cash flows in a particular reportingperiod. See “Business—Legal Proceedings.”
Pursuant to the Expedia SMA, we will continue to be liable for fees, charges, costs and settlements relatingto litigation arising from hotels booked on the Travelocity platform prior to the Expedia SMA. However, fees,charges, costs and settlements relating to litigation from hotels booked subsequent to the Expedia SMA will beshared with Expedia according to the terms of the Expedia SMA.
On October 30, 2012, we entered into a settlement agreement to resolve the outstanding state and federallawsuits with American Airlines filed in 2011 and, as a result of the terms of the settlement, among other thingsrenewed our distribution agreement with American Airlines. The settlement and distribution agreement wasapproved by the court presiding over the restructuring proceedings for AMR Corporation, American Airlines’parent company, pursuant to an order made final on December 20, 2012. We expensed $347 million in 2012related to this settlement agreement. On April 21, 2011, US Airways sued us in federal court in the SouthernDistrict of New York alleging federal antitrust claims. We are also involved in an antitrust investigation by theDOJ relating to pricing and the conduct of our GDS business and in antitrust litigation involving hotel roomprices. See Note 20, Commitments and Contingencies—Legal Proceedings—US Airways Antitrust Litigation,Department of Justice Investigation and Hotel Related Antitrust Proceedings, to our audited consolidatedfinancial statements included elsewhere in this prospectus.
Customer Mix
We believe we have a broadly diversified customer mix which supports our stable revenue base. We servetwo principal types of customers: travel suppliers, which we serve in both our Travel Network business andAirline and Hospitality Solutions business; and travel buyers, which we serve in our Travel Network businessand who purchase a wide variety of travel content in our marketplace. Today, our Travel Network marketplaceincludes a diversified group of travel suppliers, including approximately 400 airlines, 125,000 hotel properties,30 car rental brands, 50 rail carriers, 16 cruise lines and 200 tour operators. We connect these travel suppliers viaour GDS platform to approximately 400,000 travel agents, spread globally across 145 countries. Importantly,none of our travel buyers or travel suppliers represented more than 10% of our total Travel Network revenue forthe years ended December 31, 2013 and 2012. Additionally, our Airline and Hospitality Solutions segmentrepresented approximately 225 airlines, 17,500 hotel properties, and more than 700 other customers, includingairports, corporate aviation fleets, governments and tourism boards. Within our Airline and Hospitality Solutionsbusiness, no single customer represented more than 10% of total Airline and Hospitality Solutions revenues forthe years ended December 31, 2013 and 2012.
Due to the quality of our products and services, we have experienced a high level of historical CustomerRetention in both our Travel Network and Airline and Hospitality Solutions businesses. In general, our businessis characterized by non-exclusive multi-year agency and supplier contracts, with durations that typically rangefrom three to five years for our major airline suppliers and five to ten years for our major travel agency customersin our Travel Network business, and in our Airline and Hospitality Solutions business, three to seven yearsamong our airline customers and one to five years among our hospitality customers. Furthermore, our TravelNetwork airline supplier contracts expire at different times, with 28 and 24 planned renewals for fiscal years2014 and 2015, respectively. We renewed 24 out of 24 planned renewals in 2013. A meaningful portion of ourtravel buyer agreements, typically representing approximately 15% to 20% of our bookings, are up for renewal inany given year. With respect to our Airline and Hospitality Solutions business, airline reservations contractsrepresenting less than 5% of our Airline Solutions’ 2013 revenue are scheduled for renewal in each of 2014 and2015, and in each of 2016 and 2017, airline reservations contracts representing approximately 10% of AirlineSolutions’ 2013 revenue are scheduled for renewal in each of 2016 and 2017. Hospitality Solutions contractrenewals are relatively evenly spaced, with approximately one-third of contracts representing approximately one-third of Hospitality Solutions’ 2013 revenue coming up for renewal in any given year. For the year 2013, our
85

Customer Retention rate was approximately 99% for Travel Network, 98% for Airline Solutions and 96% forHospitality Solutions. We cannot guarantee that we will be able to renew our travel supplier or travel buyeragreements in the future on favorable economic terms or at all.
Our revenue base is broadly diversified, with no single customer comprising more than 10% of our totalrevenues for the year ended December 31, 2013 or the year ended December 31, 2012. We are subject to acertain degree of revenue concentration among a portion of our customer base. Our top five Travel Networkcustomers were responsible for 32% and 36% of our Travel Network revenue for the years ended December 31,2013 and 2012, respectively. Over the same period, our top five Airline and Hospitality Solutions customersrepresented 22% and 20% of our Airline and Hospitality Solutions revenues, respectively. Historicalconsolidation in the global airline industry, including the mergers of American Airlines and US Airways, Deltaand Northwest Airlines, United Airlines and Continental Airlines, as well as Southwest Airlines and AirTran,have generally increased our revenue concentration. If additional consolidation in the airline industry were tooccur in the future, our levels of revenue concentration may further increase.
Revenue Models
We employ several revenue models across our businesses with some revenue models employed in multiplebusinesses. Travel Network primarily employs the transaction revenue model. Airline and Hospitality Solutionsprimarily employs the SaaS and hosted and consulting revenue models, as well as the software licensing feemodel to a lesser extent. Travelocity primarily employed two revenue models: (i) the merchant revenue model orour “Net Rate Program” (applicable to a majority of our hotel net rate revenues) and (ii) the agency revenuemodel (applicable to most of our airline, car and cruise commission revenues and a small portion of hotelcommission revenues). In connection with the Expedia SMA, Travelocity has begun to employ the marketing feerevenue model (applicable to revenue generated through Travelocity-branded websites operated by Expedia).Travel Network and, historically, Travelocity also, employ the media revenue model (applicable to advertisingrevenues). We report revenue net of any revenue-based taxes assessed by governmental authorities that areimposed on and concurrent with specific revenue-producing transactions.
Transaction Revenue Model—This model accounts for substantially all of Travel Network’s revenue. Wedefine a “Direct Billable Booking” as any booking that generates a fee directly to Travel Network. These includebookings made through our GDS (e.g., air, car and hotel bookings) and through our joint venture partners incases where we are paid directly by the travel supplier. Under this model, a transaction occurs when a travelagency or corporate travel department books, or reserves, a travel supplier’s product on our GDS, for which wereceive a fee. Transaction fees include, but are not limited to, transaction fees paid by travel suppliers for sellingtheir inventory through our GDS and transaction fees paid by travel agency subscribers related to their use of ourGDS. We receive revenue from the travel supplier and the travel agency according to the commercialarrangement with each.
Transaction revenue for airline travel reservations is recognized at the time of the booking of thereservation, net of transaction fee reserves for estimated future cancellations. Our transaction fee cancellationreserve was $8 million at December 31, 2013 and December 31, 2012. Transaction revenue for car rental, hotelbookings and other travel services is recognized at the time the reservation is used by the customer.
SaaS and Hosted Revenue Model—The SaaS and hosted revenue model is the primary revenue modelemployed by Airline and Hospitality Solutions. This revenue model applies to situations where we host softwaresolutions on our own secure platforms or deploy it through our SaaS solutions, and we maintain the software aswell as the infrastructure it employs. Our customers pay us an implementation fee and a recurring usage-basedfee for the use of such software pursuant to contracts with terms that typically range between three and ten yearsand generally include minimum annual volume requirements. This usage-based fee arrangement allows ourcustomers to pay for software normally on a monthly basis to the extent that it is used. Similar contracts with the
86
same customer which are entered into at or around the same period are analyzed for revenue recognition purposeson a combined basis. Revenue from implementation fees is generally recognized over the term of the agreement.The amount of periodic usage fees is typically based on a metric relevant to the software purchased. Werecognize revenue from recurring usage-based fees in the period earned. Over the last several years, ourcustomers have shifted toward the SaaS and hosted revenue model as license fee contracts expire, and we expectto continue to facilitate the shift from license fee contracts to the SaaS and hosted revenue model going forward.
Consulting Revenue Model—Airline and Hospitality Solutions offerings that utilize the SaaS and hostedrevenue model are sometimes sold as part of multiple-element agreements for which we also provide consultingservices. Our consulting services are primarily focused on helping customers achieve better utilization of and returnon their software investment. Often, we provide consulting services during the implementation phase of our SaaSsolutions. We account for consulting service revenue separately from implementation and recurring usage-basedfees, with value assigned to each element based on its relative selling price to the total selling price. We perform amarket analysis on a periodic basis to determine the range of selling prices for each product and service. Therevenue for consulting services is generally recognized over the period the consulting services are performed.
Software Licensing Fee Revenue Model—The software licensing fee revenue model is also utilized by Airlineand Hospitality Solutions. Under this model, we generate revenue by charging customers for the installation and useof our software products. Some contracts under this model generate additional revenue for the maintenance of thesoftware product. When software is sold without associated customization or implementation services, revenuefrom software licensing fees is recognized when all of the following are met: (i) the software is delivered, (ii) feesare fixed or determinable, (iii) no undelivered elements are essential to the functionality of delivered software, and(iv) collection is probable. When software is sold with customization or implementation services, revenue fromsoftware licensing fees is recognized based on the percentage of completion of the customization andimplementation services. Fees for software maintenance are recognized ratably over the life of the contract. We areunable to determine vendor-specific objective evidence of fair value for software maintenance fees. Therefore,when fees for software maintenance are included in software license agreements, revenue from the software license,customization, implementation and the maintenance are recognized ratably over the related contract term.
Marketing Fee Revenue Model—With the implementation of Expedia’s technology for our U.S. andCanadian websites beginning late in 2013, Expedia is required to pay us a performance-based marketing fee thatwill vary based on the amount of travel booked through Travelocity-branded websites powered by Expedia. Themarketing fee we receive will be recorded as revenue and the costs we incur for marketing and to promote theTravelocity brand will be recorded as selling, general and administrative expense in our results of operations. Therevenue recognized under this model was not material to our results of operations for the year endedDecember 31, 2013. See “—Factors Affecting our Results—Travelocity.”
Merchant Revenue Model—The merchant revenue model or the “Net Rate Program” is utilized by Travelocity,except to the extent the marketing fee revenue model applies. We primarily use this model for revenue from hotelreservations and dynamically packaged combinations of travel components. Pursuant to this model, we are themerchant of record for credit card processing for travel accommodations. Even though we are the merchant ofrecord for these transactions, we do not purchase and resell travel accommodations, and we do not have anyobligations with respect to the travel accommodations we offer online that we do not sell. Instead, we act as anintermediary by entering into agreements with travel suppliers for the right to market their products, services andother offerings at pre-determined net rates. We market net rate offerings to travelers at prices that include an amountsufficient to pay the travel supplier for providing the travel accommodations and any occupancy and other localtaxes, as well as additional amounts representing our service fees, which is how we generate revenue under thismodel. Under this revenue model, we require prepayment by the traveler at the time of booking.
Travelocity recognizes net rate revenue for stand-alone air travel at the time the travel is booked with areserve for estimated future canceled bookings. Revenues from vacation packages and car rentals as well as hotelnet rate revenues are recognized at the time the reservation is used by the consumer.
87
For net rate and dynamically packaged combinations sold through Travelocity, we record net rate revenuesbased on the total amount paid by the customer for products and services, net of our payment to the travelsupplier. At the time a customer makes and prepays a reservation, we accrue a supplier liability based on theamount we expect to be billed by our travel suppliers. In some cases, a portion of Travelocity’s prepaid net rateand travel package transactions goes unused by the traveler. In such circumstances, Travelocity may not be billedthe full amount of the accrued supplier liability. Therefore, we reduce the accrued supplier liability for amountsaged more than six months after the reservation goes unused and record the aged amount as revenue if certainconditions are met. Our process for determining when aged amounts may be recognized as revenue includesconsideration of key factors such as the age of the supplier liability, historical billing and payment information,among others.
See “—Factors Affecting our Results—Travelocity.”
Agency Revenue Model—This model is employed by Travelocity, except to the extent the marketing feerevenue model applies, and applies to revenues generated via commissions from travel suppliers for reservationsmade by travelers through our websites. Under this model, we act as an agent in the transaction by passingreservations booked by travelers to the relevant airline, hotel, car rental company, cruise line or other travelsupplier, while the travel supplier serves as merchant of record and processes the payment from the traveler.
Under the agency revenue model, Travelocity recognizes commission revenue for stand-alone air travel atthe time the travel is booked with a reserve for estimated future canceled bookings. Commissions from car andhotel travel suppliers are recognized upon the scheduled date of travel consumption. We record car and hotelcommission revenue net of an estimated reserve for cancellations, no-shows and uncollectable commissions. Asof December 31, 2013 and 2012, our reserve was approximately $2 million and $3 million, respectively.
See “—Factors Affecting our Results—Travelocity.”
Media Revenue Model—The media revenue model is used to record advertising revenue from entities thatadvertise products on Travelocity’s websites, except to the extent the marketing fee revenue model applies, and,to a lesser extent, on our GDS. Advertisers use two types of advertising metrics: (i) display advertising and(ii) action advertising. In display advertising, advertisers usually pay based on the number of customers whoview the advertisement, and are charged based on cost per thousand impressions. In action advertising,advertisers usually pay based on the number of customers who perform a specific action, such as click on theadvertisement, and are charged based on the cost per action. Advertising revenues are recognized in the periodthat the advertising impressions are delivered or the click-through or other specific action occurs.
See “—Factors Affecting our Results—Travelocity.”
Components of Revenues and Expenses
Revenues
Travel Network
Travel Network primarily generates revenues from the transaction revenue model, as well as revenue fromcertain services we provide our joint ventures and the sale of aggregated bookings data to carriers. See“—Revenue Models.”
Airline and Hospitality Solutions
Airline and Hospitality Solutions primarily generates revenue from the SaaS and hosted revenue model, theconsulting revenue model, as well as the software licensing fee model to a lesser extent. Over the last severalyears, our customers have shifted toward the SaaS and hosted revenue model as license fee contracts expire, andwe expect to continue to facilitate the shift from license fee contracts to the SaaS and hosted revenue modelgoing forward. See “—Revenue Models.”
88
Travelocity
Travelocity generates transaction revenue through the merchant revenue model and the agency revenuemodel, and non-transaction revenue, in each case, except to the extent the marketing fee model applies. See“—Factors Affecting our Results—Travelocity.” Transaction revenue is comprised of (i) stand-alone airtransaction revenue (i.e., revenue from the sale of air travel without any other products) and (ii) other transactionrevenue (i.e., revenue from hotel suppliers, packages which include multiple travel products, lifestyle productssuch as theatre tickets and services). Both are accounted for under either the merchant or agency revenue models.
Except to the extent the marketing fee model applies, Travelocity also generates revenues from fees fromoffline (e.g., call center agent transacted) bookings for air and packages and insurance revenues from third-partyinsurance providers whose air, total trip and cruise insurance we offer on our websites.
Additionally, Travelocity generates intersegment transaction revenue from Travel Network, consisting ofincentive consideration earned for Travelocity transactions processed through our GDS and fees paid by TravelNetwork and Airline and Hospitality Solutions for corporate trips booked through the Travelocity online bookingtechnology. We expect intersegment revenue to substantially decrease in connection with the Expedia SMA.Intersegment transaction revenue is eliminated in consolidation.
Non-transaction revenue consists of advertising revenue from the media revenue model, paper ticket feesand services, and change and reissue fees.
Cost of Revenue
Travel Network
Travel Network cost of revenues consists primarily of:
• Incentive Consideration—payments or other consideration to travel agencies for reservations made onour GDS which have accrued on a monthly basis. Incentive consideration is provided in two ways,according to the terms of the contract: (i) on a periodic basis over the term of the contract and (ii) insome cases, upfront at the inception or modification of contracts, which is capitalized and amortizedover the expected life of the contract. The amortized portion of the upfront incentive consideration isrecorded to cost of revenue. Travel Network provides incentive consideration to Travelocity forTravelocity transactions processed through our GDS, although we expect intersegment revenue tosubstantially decrease in connection with the Expedia SMA. Intersegment expense is eliminated inconsolidation. See “—Components of Revenues and Expenses—Intersegment Transactions.”
• Technology Expenses—data processing, data center management, application hosting, applicationsdevelopment and maintenance and related charges.
• Labor Expenses—salaries and benefits paid to employees supporting the operations of the business.
• Other Expenses—includes services purchased, facilities and corporate overhead.
Airline and Hospitality Solutions
Airline and Hospitality Solutions cost of revenues consists primarily of:
• Labor Expenses—salaries and benefits paid to employees for the development, delivery andimplementation of software.
• Technology Expenses—data processing, data center management, application hosting, applicationsdevelopment and maintenance and related charges resulting from the hosting of our solutions.
• Other Expenses—includes services purchased, facilities and other costs.
89
Travelocity
Except as described below, Travelocity cost of revenue has consisted primarily of:
• Volume Related Expenses—customer service costs; credit card fees and technology fees; chargesrelated to fraudulent bookings and compensation to customers, i.e., for service related issues.
• Technology Expenses—data processing, data center management, applications development,maintenance and related charges.
• Labor Expenses—salaries and benefits paid to employees supporting the operations of the business.
• Other Expenses—includes services purchased, facilities and other costs.
In connection with the Expedia SMA, Travelocity will not incur significant cost of revenues with respect toTravelocity’s existing websites in the United States and Canada.
Corporate
Corporate cost of revenue includes certain shared technology costs as well as stock-based compensationexpense, litigation expenses associated with occupancy or other taxes and other items that are not identifiablewith one of our segments.
Depreciation and amortization
Cost of revenue includes depreciation and amortization associated with property and equipment andsoftware developed for internal use that supports our revenue, businesses and systems. Depreciation andamortization also includes amortization of contract implementation costs and intangible assets for technologypurchased through acquisitions or established with our take-private transaction.
Selling, General and Administrative Expenses
Selling, general and administrative expenses consist of personnel-related expenses for employees that sell ourservices to new customers and administratively support the business, commission payments made to travel agencyand distribution partners of Travelocity, advertising and promotional costs primarily for Travelocity, certainsettlement costs and costs to defend legal disputes, bad debt expense, depreciation and amortization and other costs.In connection with the Expedia SMA, Travelocity will no longer incur non-marketing related expenses; instead, themarketing fee we will receive under the Expedia SMA will be net of costs incurred by Expedia in connection withthese activities. However, the marketing costs we incur to promote the Travelocity brand will be recorded as selling,general and administrative expenses.
Intersegment Transactions
We account for significant intersegment transactions as if the transactions were with third parties, that is, atestimated current market prices. The majority of the intersegment revenues and cost of revenues are betweenTravelocity and Travel Network, consisting mainly of accruals for incentive consideration, net of data processingfees incurred, by Travel Network to Travelocity for transactions processed through our GDS, transaction feespaid by Travelocity to Travel Network for transactions facilitated through our GDS in which the travel supplierpays Travelocity directly, and fees paid by Travel Network to Travelocity for corporate trips booked through theTravelocity online booking technology. In addition, Airline and Hospitality Solutions pays fees to TravelNetwork for airline trips booked through our GDS. Due to the elimination of the intersegment revenue betweenTravelocity.com and Travel Network with the Expedia SMA, we expect intersegment eliminations tosubstantially decrease in 2014 from current levels. See Note 21, Segment Information, to our auditedconsolidated financial statements included elsewhere in this prospectus.
90
Matters Affecting Comparability
Mergers and Acquisitions
Our results of operations have been affected by mergers and acquisitions as summarized below.
Mergers and Acquisitions in 2013
We had no acquisitions in the year ended December 31, 2013.
Mergers and Acquisitions in 2012
In the third quarter of 2012, we acquired all of the outstanding stock and ownership interests of PRISM, aleading provider of end-to-end airline contract business intelligence and decision support software. Theacquisition, which adds to our portfolio of products within the Airline and Hospitality Solutions, allows for newrelationships with airlines and adds to our existing business intelligence capabilities.
Mergers and Acquisitions in 2011
In the first quarter of 2011, we completed the acquisition of Zenon N.D.C., Limited, a provider of GDSservices to travel agents in Cyprus. This acquisition further expands Travel Network within Europe.
In the second quarter of 2011, we completed the acquisition of SoftHotel, Inc., a provider of web-basedproperty management solutions for the hospitality industry. This acquisition brings Airline and HospitalitySolutions closer to a fully integrated web-based solution that combines distribution, marketing and operationsinto a single platform for hotel customers.
Dispositions Impacting Results from Continuing Operations
Dispositions in 2013
Certain Assets of Travelocity—On June 18, 2013, we completed the sale of certain assets of TBiz operationsto a third-party, which resulted in reduced revenue and expenses for Travelocity in 2013 compared to 2012. TBizprovides managed corporate travel services for corporate customers. We recorded a loss on the sale of $3 million,net of tax, including the write-off of $9 million of goodwill attributed to TBiz based on the relative fair value tothe Travelocity North America reporting unit, in our consolidated statement of operations.
Dispositions in 2012
Sabre Pacific—On February 24, 2012, we completed the sale of our 51% stake in Sabre Pacific, an entityjointly owned by a subsidiary of Sabre (51%) and Abacus (49%), to Abacus for $46 million of proceeds, whichresulted in reduced revenue and expense for Travel Network in 2013 compared to 2012, and to a greater extent,in 2012 compared to 2011. Of the proceeds received, $9 million was for the sale of stock, $18 millionrepresented the repayment of an intercompany note receivable from Sabre Pacific, which was entered into whenthe joint venture was originally established, and the remaining $19 million represented the settlement ofoperational intercompany receivable balances with Sabre Pacific and associated amounts we owed to Abacus.We recorded $25 million as gain on sale of business in our consolidated statements of operations. We have alsoentered into a license and distribution agreement with Sabre Pacific, under which it will market, sub-license,distribute, provide access to and support for our GDS in Australia, New Zealand and surrounding territories.Sabre Pacific is required to pay us an ongoing transaction fee based on booking volumes under this agreement.As of December 31, 2011, the assets and liabilities of Sabre Pacific were classified as held for sale on ourconsolidated balance sheet. For the year ended December 31, 2012, joint venture equity income included a $24million impairment of goodwill recorded by Abacus associated with its acquisition of Sabre Pacific.
91

Dispositions in 2011
During 2011, we completed no significant dispositions impacting our results of continuing operations.
For a complete list of dispositions, including dispositions classified as discontinued operations, see Note 4,Discontinued Operations and Dispositions, to our audited consolidated financial statements included elsewhere inthis prospectus.
Seasonality
The travel industry is seasonal in nature. Travel bookings for Travel Network, and the revenue we derivefrom those bookings, decrease significantly each year in the fourth quarter, primarily in December. We recognizeair-related revenue at the date of booking and, because customers generally book their November andDecember holiday leisure-related travel earlier in the year, and business-related travel declines during the holidayseason, revenue resulting from bookings is typically lower in the fourth quarter. Travelocity revenues are alsoimpacted by the seasonality of travel bookings, but to a lesser extent since commissions from car and hotel travelsuppliers and net rate revenue for hotel stays and vacation packages are recognized at the date of travel. There isa slight increase in Travelocity revenues for the second and third quarters compared to the first and fourthquarters due to European travel patterns. Airline and Hospitality Solutions does not experience any significantseasonality patterns in revenue.
Other Items Impacting Comparability
Reduction of insurance sales fees
On January 24, 2012, the U.S. Department of Transportation implemented new regulations that prohibit carriersand ticket agents from including additional optional services in connection with air transportation, a tour or tourcomponent if the optional service is automatically added to the consumer’s purchase if the consumer takes no otheraction (i.e., if the consumer does not “opt-out”). Prior to the effectiveness of this regulation, we pre-checked the “Yes”box on Travelocity’s websites for certain optional services such as travel insurance, while at the same time providingclear and conspicuous disclosure of the inclusion of such services, itemized pricing thereof and the option to removesuch services prior to payment and check-out. The implementation of this regulation resulted in significantly fewercustomers electing to purchase such services. For the year ended December 31, 2012, we experienced an $11 million,or 38%, decrease in revenue from insurance sales compared with the year ended December 31, 2011.
92
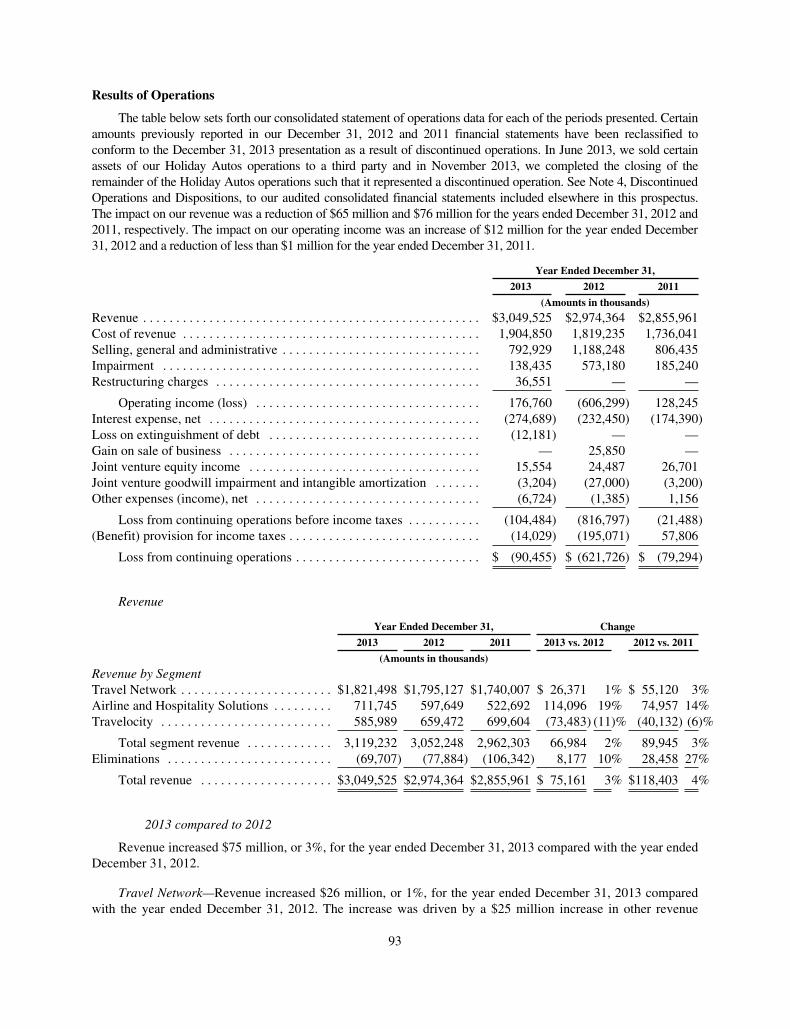
Results of Operations
The table below sets forth our consolidated statement of operations data for each of the periods presented. Certainamounts previously reported in our December 31, 2012 and 2011 financial statements have been reclassified toconform to the December 31, 2013 presentation as a result of discontinued operations. In June 2013, we sold certainassets of our Holiday Autos operations to a third party and in November 2013, we completed the closing of theremainder of the Holiday Autos operations such that it represented a discontinued operation. See Note 4, DiscontinuedOperations and Dispositions, to our audited consolidated financial statements included elsewhere in this prospectus.The impact on our revenue was a reduction of $65 million and $76 million for the years ended December 31, 2012 and2011, respectively. The impact on our operating income was an increase of $12 million for the year ended December31, 2012 and a reduction of less than $1 million for the year ended December 31, 2011.
Year Ended December 31,
2013 2012 2011
(Amounts in thousands)
Revenue . . . . . . . . . . . . . . . . . . . . . . . . . . . . . . . . . . . . . . . . . . . . . . . . . . . $3,049,525 $2,974,364 $2,855,961Cost of revenue . . . . . . . . . . . . . . . . . . . . . . . . . . . . . . . . . . . . . . . . . . . . . 1,904,850 1,819,235 1,736,041Selling, general and administrative . . . . . . . . . . . . . . . . . . . . . . . . . . . . . . 792,929 1,188,248 806,435Impairment . . . . . . . . . . . . . . . . . . . . . . . . . . . . . . . . . . . . . . . . . . . . . . . . 138,435 573,180 185,240Restructuring charges . . . . . . . . . . . . . . . . . . . . . . . . . . . . . . . . . . . . . . . . 36,551 — —
Operating income (loss) . . . . . . . . . . . . . . . . . . . . . . . . . . . . . . . . . . 176,760 (606,299) 128,245Interest expense, net . . . . . . . . . . . . . . . . . . . . . . . . . . . . . . . . . . . . . . . . . (274,689) (232,450) (174,390)Loss on extinguishment of debt . . . . . . . . . . . . . . . . . . . . . . . . . . . . . . . . (12,181) — —Gain on sale of business . . . . . . . . . . . . . . . . . . . . . . . . . . . . . . . . . . . . . . — 25,850 —Joint venture equity income . . . . . . . . . . . . . . . . . . . . . . . . . . . . . . . . . . . 15,554 24,487 26,701Joint venture goodwill impairment and intangible amortization . . . . . . . (3,204) (27,000) (3,200)Other expenses (income), net . . . . . . . . . . . . . . . . . . . . . . . . . . . . . . . . . . (6,724) (1,385) 1,156
Loss from continuing operations before income taxes . . . . . . . . . . . (104,484) (816,797) (21,488)(Benefit) provision for income taxes . . . . . . . . . . . . . . . . . . . . . . . . . . . . . (14,029) (195,071) 57,806
Loss from continuing operations . . . . . . . . . . . . . . . . . . . . . . . . . . . . $ (90,455) $ (621,726) $ (79,294)
Revenue
Year Ended December 31, Change
2013 2012 2011 2013 vs. 2012 2012 vs. 2011
(Amounts in thousands)
Revenue by SegmentTravel Network . . . . . . . . . . . . . . . . . . . . . . . $1,821,498 $1,795,127 $1,740,007 $ 26,371 1% $ 55,120 3%Airline and Hospitality Solutions . . . . . . . . . 711,745 597,649 522,692 114,096 19% 74,957 14%Travelocity . . . . . . . . . . . . . . . . . . . . . . . . . . 585,989 659,472 699,604 (73,483) (11)% (40,132) (6)%
Total segment revenue . . . . . . . . . . . . . 3,119,232 3,052,248 2,962,303 66,984 2% 89,945 3%Eliminations . . . . . . . . . . . . . . . . . . . . . . . . . (69,707) (77,884) (106,342) 8,177 10% 28,458 27%
Total revenue . . . . . . . . . . . . . . . . . . . . $3,049,525 $2,974,364 $2,855,961 $ 75,161 3% $118,403 4%
2013 compared to 2012
Revenue increased $75 million, or 3%, for the year ended December 31, 2013 compared with the year endedDecember 31, 2012.
Travel Network—Revenue increased $26 million, or 1%, for the year ended December 31, 2013 comparedwith the year ended December 31, 2012. The increase was driven by a $25 million increase in other revenue
93
primarily from payments in connection with certain services provided to our joint ventures. Transaction-basedrevenue was flat at $1,590 million for the year ended December 31, 2013 compared to the prior year. Weprocessed 368 million Direct Billable Bookings in 2013, representing a decrease of 12 million Direct BillableBookings, or 3%, compared to 2012. This decrease was offset by a 3% increase in the average booking fee.
Airline and Hospitality Solutions—Revenue increased $114 million, or 19%, for the year endedDecember 31, 2013 compared with the year ended December 31, 2012.
This $114 million increase in revenue primarily resulted from:
• a $48 million increase in Airline Solutions’ SabreSonic Customer Sales and Service (“SabreSonicCSS”) revenue for the year ended December 31, 2013 compared to the prior year. The increase inrevenue was due to an increase of 73 million, or 18%, in processed reservations for PBs to 478 millionin 2013. The increase in PBs was primarily due to new customers;
• a $54 million increase in Airline Solutions’ commercial and operations solutions revenue primarily theresult of $25 million generated from our 2012 acquisition of PRISM and a $29 million increase in otherairline software solutions, consulting and professional services; and
• a $12 million increase in Hospitality Solutions revenue for the year ended December 31, 2013compared to prior year due to an increase in CRS transactions in 2013.
Travelocity—Revenue decreased $73 million, or 11%, for the year ended December 31, 2013 compared withthe year ended December 31, 2012. This decrease in revenue primarily resulted from a $59 million decreaseresulting from a 5% decline in transaction volumes and a 6% decline in average transaction value, primarilydriven by the loss of a large TPN customer in 2012, and a $11 million decrease in revenue related to thedisposition of TBiz during 2013. Media and advertising revenues also declined by $5 million in the year endedDecember 31, 2013 compared to the prior year.
2012 compared to 2011
Revenue increased $118 million, or 4%, for the year ended December 31, 2012 compared with the yearended December 31, 2011.
Travel Network—Revenue increased $55 million, or 3%, for the year ended December 31, 2012 comparedwith the year ended December 31, 2011.
This $55 million increase in revenue primarily resulted from:
• a $41 million increase in revenue for certain services provided to our joint ventures; and
• an increase of $12 million in transaction-based revenue due to a 1% increase in the average booking feepartially offset by a decrease of 2 million, or less than 1%, on Direct Billable Bookings to 380 millionin 2013.
Airline and Hospitality Solutions—Revenue increased $75 million, or 14%, for the year ended December 31,2012 compared with the year ended December 31, 2011.
This $75 million increase in revenue primarily resulted from:
• a $36 million increase in Airline Solutions’ SabreSonic CSS revenue for the year ended December 31,2012 compared to the prior year due primarily to an increase of 41 million, or 11%, in PBs to405 million in 2012. The increase in PB volume was from existing and new customers;
• a $28 million increase in Airline Solutions’ commercial and operations solutions revenue as a result of$12 million of revenue growth generated from our 2012 acquisition of PRISM and a $16 millionincrease in other airline software solutions, consulting and professional services; and
94

• a $11 million increase in Hospitality Solutions revenue for the year ended December 31, 2012compared to the prior year as a result of an increase in CRS transactions in 2012.
Travelocity—Revenue decreased $40 million, or 6%, for the year ended December 31, 2012 compared withthe year ended December 31, 2011.
This $40 million decrease in revenue primarily resulted from:
• a decline of $22 million in transaction revenue driven by a 2% decline in transaction volumes and a13% decline in average transaction value in North America. The decline in transaction volumes wasprimarily driven by the loss of a large TPN customer in 2012 and the decline in average transactionvalue was primarily due to the reduction of air insurance revenue as a result of changing the purchaseof trip insurance on our website from opt-out to opt-in in early 2012 and the loss of a large TPNcustomer in 2012. These declines in North America were partially offset by a 6% increase intransaction volumes and an 8% increase in average transaction value in Europe;
• a decline of $11 million in media revenue in North America and Europe; and
• an $8 million decline in intersegment revenue primarily associated with incentive considerationreceived from Travel Network due to a loss of a large TPN customer during 2012. Intersegmentrevenue is eliminated in consolidation.
Cost of RevenueYear Ended December 31, Change
2013 2012 2011 2013 vs. 2012 2012 vs. 2011
(Amounts in thousands)
Cost of revenueTravel Network . . . . . . . . . . . . . . . . . . $1,047,608 $1,022,415 $1,034,586 $ 25,193 2%$(12,171) (1)%Airline and Hospitality Solutions . . . . 524,452 430,623 369,132 93,829 22% 61,491 17%Travelocity . . . . . . . . . . . . . . . . . . . . . 240,515 282,370 291,832 (41,855) (15)% (9,462) (3)%
Total segment cost of revenue . . . 1,812,575 1,735,408 1,695,550 77,167 4% 39,858 2%
Eliminations . . . . . . . . . . . . . . . . . . . . (68,990) (76,874) (105,259) 7,884 10% 28,385 27%Corporate . . . . . . . . . . . . . . . . . . . . . . . 161,265 160,701 145,750 564 0% 14,951 10%
Total cost of revenue . . . . . . . . . . $1,904,850 $1,819,235 $1,736,041 $ 85,615 5%$ 83,194 5%
2013 compared to 2012
The total cost of revenue increased by $86 million, or 5%, for the year ended December 31, 2013 comparedwith the year ended December 31, 2012.
Travel Network—Cost of revenue increased $25 million, or 2%, for the year ended December 31, 2013compared with the year ended December 31, 2012, which primarily resulted from:
• a $18 million increase in incentive consideration, in line with higher Direct Billable Transactions inregions with favorable booking fee rates;
• a $16 million increase in depreciation and amortization associated with the completion andamortization of software developed for internal use; partially offset by
• a $5 million decrease in other operating expenses primarily related to the disposition of Sabre Pacific inFebruary of 2012; and
• labor costs remaining relatively flat, decreasing $2 million to $173 million for the year endedDecember 31, 2013 compared to $175 million in the prior year.
95

Airline and Hospitality Solutions—Cost of revenue increased $94 million, or 22%, for the year endedDecember 31, 2013 compared with the year ended December 31, 2012, which primarily resulted from:
• a $48 million increase in labor costs to $276 million for the year ended December 31, 2013 comparedto $228 million in the prior year. The increase was attributed to increased headcount to support 2013implementations, increased customer support and maintenance, additional headcount associated withthe acquisition of PRISM in August of 2012 and minor enhancements to our SaaS and hosted systems;
• a $24 million increase in depreciation and amortization primarily associated with the completion andamortization of software developed for internal use as well as capitalized implementation costs; and
• an increase of $12 million in technology-related expenses, driven by higher transaction volumes.
Travelocity—Cost of revenue decreased $42 million, or 15%, for the year ended December 31, 2013compared with the year ended December 31, 2012, which primarily resulted from:
• a $29 million decrease in depreciation and amortization as the result of the impairment of certainproperty and equipment and intangible assets related to Travelocity at the end of 2012;
• a $10 million decline in services purchased due to lower call center costs related to the loss of alarge TPN customer; and
• a decline of $8 million in transaction-related fees as a result of lower transaction volumes; and
• a decline of $8 million in labor costs due to reductions in headcount; partially offset by
• a $12 million increase in other operating expenses primarily related to other fraud-relatedexpenses and credit card chargebacks.
Corporate—Cost of revenue associated with corporate unallocated costs remained flat at $161 million forthe year ended December 31, 2013 compared with the year ended December 31, 2012. Labor costs increasedby $8 million to $20 million in 2013 and amortization of intangible assets increased by $3 million relatedto the PRISM acquisition in August 2012. These increases were largely offset by a $9 million decrease inunallocated amortization due to the impairment of acquisition-related intangibles associated with Travelocity atthe end of 2012.
2012 compared to 2011
The total cost of revenue increased by $83 million, or 5%, for the year ended December 31, 2012 comparedwith the year ended December 31, 2011.
Travel Network—Cost of revenue decreased $12 million, or 1%, for the year ended December 31, 2012compared with the year ended December 31, 2011, which primarily resulted from:
• a $27 million decrease in incentive consideration related to the sale of Sabre Pacific;
• a decrease in labor costs of $2 million to $175 million for the year ended December 31, 2012 comparedto $177 million in the prior year; partially offset by
• an $11 million increase in forward contract expenses; and
• a $5 million increase in depreciation and amortization primarily driven by the completion andamortization of software developed for internal use.
Airline and Hospitality Solutions—Cost of revenue increased $61 million, or 17%, for the year endedDecember 31, 2012 compared with the year ended December 31, 2011, which primarily resulted from:
• an increase in labor costs of $34 million to $228 million for the year ended December 31, 2012compared to $194 million in the prior year, attributable to increased headcount to support 2012customer implementations, pending 2013 implementations, increased customer support, and labor costsfor minor enhancement and maintenance to our SaaS and hosted systems;
96
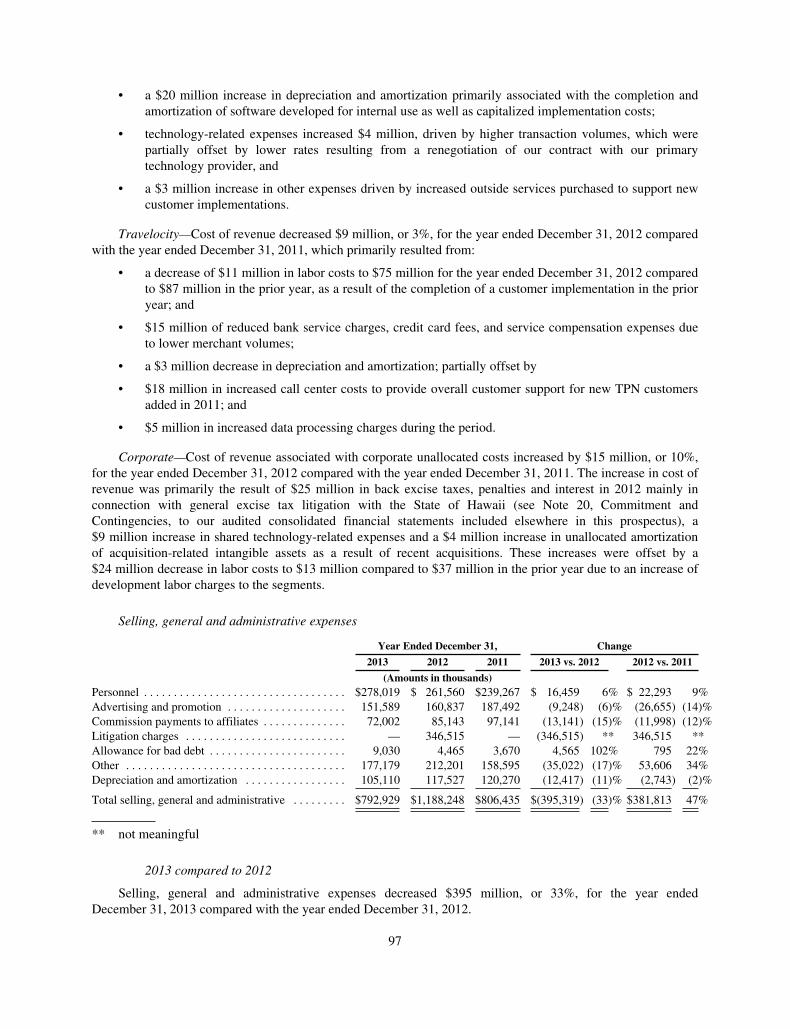
• a $20 million increase in depreciation and amortization primarily associated with the completion andamortization of software developed for internal use as well as capitalized implementation costs;
• technology-related expenses increased $4 million, driven by higher transaction volumes, which werepartially offset by lower rates resulting from a renegotiation of our contract with our primarytechnology provider, and
• a $3 million increase in other expenses driven by increased outside services purchased to support newcustomer implementations.
Travelocity—Cost of revenue decreased $9 million, or 3%, for the year ended December 31, 2012 comparedwith the year ended December 31, 2011, which primarily resulted from:
• a decrease of $11 million in labor costs to $75 million for the year ended December 31, 2012 comparedto $87 million in the prior year, as a result of the completion of a customer implementation in the prioryear; and
• $15 million of reduced bank service charges, credit card fees, and service compensation expenses dueto lower merchant volumes;
• a $3 million decrease in depreciation and amortization; partially offset by
• $18 million in increased call center costs to provide overall customer support for new TPN customersadded in 2011; and
• $5 million in increased data processing charges during the period.
Corporate—Cost of revenue associated with corporate unallocated costs increased by $15 million, or 10%,for the year ended December 31, 2012 compared with the year ended December 31, 2011. The increase in cost ofrevenue was primarily the result of $25 million in back excise taxes, penalties and interest in 2012 mainly inconnection with general excise tax litigation with the State of Hawaii (see Note 20, Commitment andContingencies, to our audited consolidated financial statements included elsewhere in this prospectus), a$9 million increase in shared technology-related expenses and a $4 million increase in unallocated amortizationof acquisition-related intangible assets as a result of recent acquisitions. These increases were offset by a$24 million decrease in labor costs to $13 million compared to $37 million in the prior year due to an increase ofdevelopment labor charges to the segments.
Selling, general and administrative expenses
Year Ended December 31, Change
2013 2012 2011 2013 vs. 2012 2012 vs. 2011
(Amounts in thousands)Personnel . . . . . . . . . . . . . . . . . . . . . . . . . . . . . . . . . . $278,019 $ 261,560 $239,267 $ 16,459 6% $ 22,293 9%Advertising and promotion . . . . . . . . . . . . . . . . . . . . 151,589 160,837 187,492 (9,248) (6)% (26,655) (14)%Commission payments to affiliates . . . . . . . . . . . . . . 72,002 85,143 97,141 (13,141) (15)% (11,998) (12)%Litigation charges . . . . . . . . . . . . . . . . . . . . . . . . . . . — 346,515 — (346,515) ** 346,515 **Allowance for bad debt . . . . . . . . . . . . . . . . . . . . . . . 9,030 4,465 3,670 4,565 102% 795 22%Other . . . . . . . . . . . . . . . . . . . . . . . . . . . . . . . . . . . . . 177,179 212,201 158,595 (35,022) (17)% 53,606 34%Depreciation and amortization . . . . . . . . . . . . . . . . . 105,110 117,527 120,270 (12,417) (11)% (2,743) (2)%
Total selling, general and administrative . . . . . . . . . $792,929 $1,188,248 $806,435 $(395,319) (33)% $381,813 47%
** not meaningful
2013 compared to 2012
Selling, general and administrative expenses decreased $395 million, or 33%, for the year endedDecember 31, 2013 compared with the year ended December 31, 2012.
97
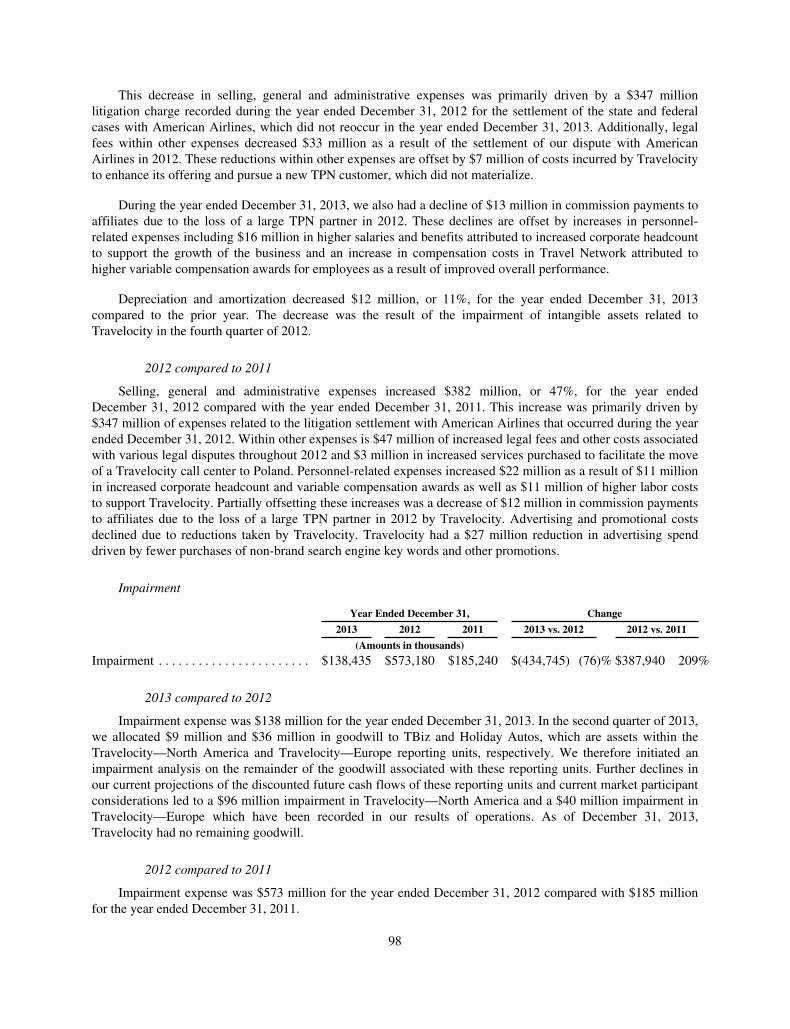
This decrease in selling, general and administrative expenses was primarily driven by a $347 millionlitigation charge recorded during the year ended December 31, 2012 for the settlement of the state and federalcases with American Airlines, which did not reoccur in the year ended December 31, 2013. Additionally, legalfees within other expenses decreased $33 million as a result of the settlement of our dispute with AmericanAirlines in 2012. These reductions within other expenses are offset by $7 million of costs incurred by Travelocityto enhance its offering and pursue a new TPN customer, which did not materialize.
During the year ended December 31, 2013, we also had a decline of $13 million in commission payments toaffiliates due to the loss of a large TPN partner in 2012. These declines are offset by increases in personnel-related expenses including $16 million in higher salaries and benefits attributed to increased corporate headcountto support the growth of the business and an increase in compensation costs in Travel Network attributed tohigher variable compensation awards for employees as a result of improved overall performance.
Depreciation and amortization decreased $12 million, or 11%, for the year ended December 31, 2013compared to the prior year. The decrease was the result of the impairment of intangible assets related toTravelocity in the fourth quarter of 2012.
2012 compared to 2011
Selling, general and administrative expenses increased $382 million, or 47%, for the year endedDecember 31, 2012 compared with the year ended December 31, 2011. This increase was primarily driven by$347 million of expenses related to the litigation settlement with American Airlines that occurred during the yearended December 31, 2012. Within other expenses is $47 million of increased legal fees and other costs associatedwith various legal disputes throughout 2012 and $3 million in increased services purchased to facilitate the moveof a Travelocity call center to Poland. Personnel-related expenses increased $22 million as a result of $11 millionin increased corporate headcount and variable compensation awards as well as $11 million of higher labor coststo support Travelocity. Partially offsetting these increases was a decrease of $12 million in commission paymentsto affiliates due to the loss of a large TPN partner in 2012 by Travelocity. Advertising and promotional costsdeclined due to reductions taken by Travelocity. Travelocity had a $27 million reduction in advertising spenddriven by fewer purchases of non-brand search engine key words and other promotions.
Impairment
Year Ended December 31, Change
2013 2012 2011 2013 vs. 2012 2012 vs. 2011
(Amounts in thousands)
Impairment . . . . . . . . . . . . . . . . . . . . . . . $138,435 $573,180 $185,240 $(434,745) (76)% $387,940 209%
2013 compared to 2012
Impairment expense was $138 million for the year ended December 31, 2013. In the second quarter of 2013,we allocated $9 million and $36 million in goodwill to TBiz and Holiday Autos, which are assets within theTravelocity—North America and Travelocity—Europe reporting units, respectively. We therefore initiated animpairment analysis on the remainder of the goodwill associated with these reporting units. Further declines inour current projections of the discounted future cash flows of these reporting units and current market participantconsiderations led to a $96 million impairment in Travelocity—North America and a $40 million impairment inTravelocity—Europe which have been recorded in our results of operations. As of December 31, 2013,Travelocity had no remaining goodwill.
2012 compared to 2011
Impairment expense was $573 million for the year ended December 31, 2012 compared with $185 millionfor the year ended December 31, 2011.
98
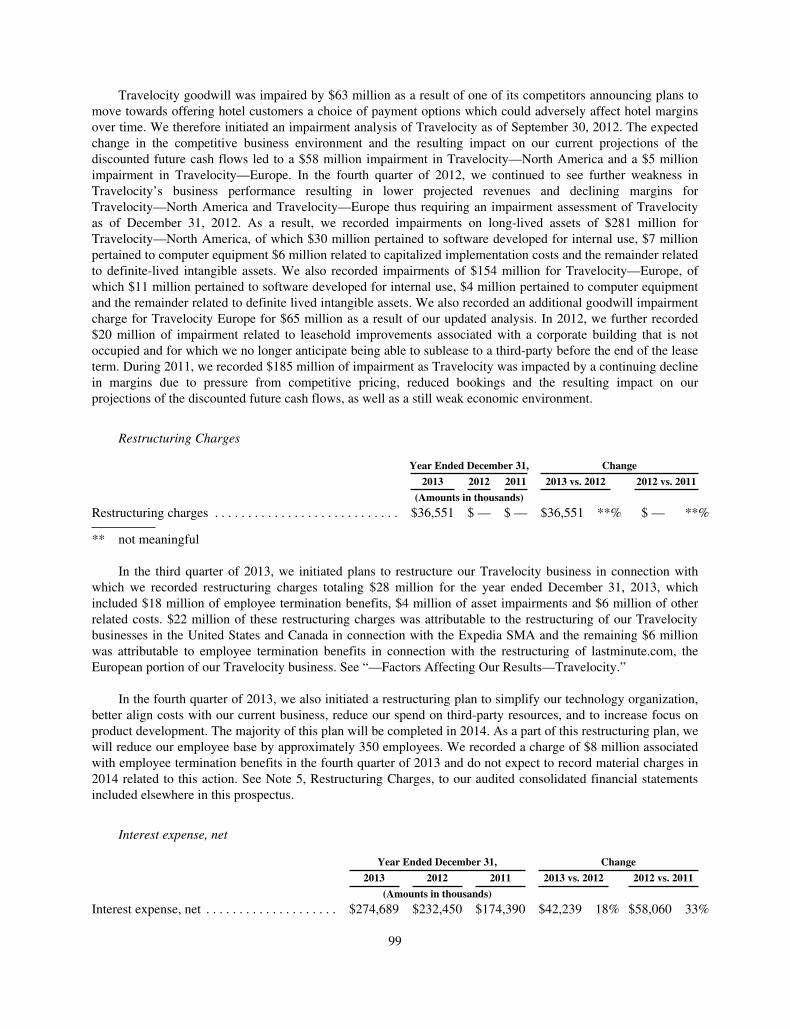
Travelocity goodwill was impaired by $63 million as a result of one of its competitors announcing plans tomove towards offering hotel customers a choice of payment options which could adversely affect hotel marginsover time. We therefore initiated an impairment analysis of Travelocity as of September 30, 2012. The expectedchange in the competitive business environment and the resulting impact on our current projections of thediscounted future cash flows led to a $58 million impairment in Travelocity—North America and a $5 millionimpairment in Travelocity—Europe. In the fourth quarter of 2012, we continued to see further weakness inTravelocity’s business performance resulting in lower projected revenues and declining margins forTravelocity—North America and Travelocity—Europe thus requiring an impairment assessment of Travelocityas of December 31, 2012. As a result, we recorded impairments on long-lived assets of $281 million forTravelocity—North America, of which $30 million pertained to software developed for internal use, $7 millionpertained to computer equipment $6 million related to capitalized implementation costs and the remainder relatedto definite-lived intangible assets. We also recorded impairments of $154 million for Travelocity—Europe, ofwhich $11 million pertained to software developed for internal use, $4 million pertained to computer equipmentand the remainder related to definite lived intangible assets. We also recorded an additional goodwill impairmentcharge for Travelocity Europe for $65 million as a result of our updated analysis. In 2012, we further recorded$20 million of impairment related to leasehold improvements associated with a corporate building that is notoccupied and for which we no longer anticipate being able to sublease to a third-party before the end of the leaseterm. During 2011, we recorded $185 million of impairment as Travelocity was impacted by a continuing declinein margins due to pressure from competitive pricing, reduced bookings and the resulting impact on ourprojections of the discounted future cash flows, as well as a still weak economic environment.
Restructuring Charges
Year Ended December 31, Change
2013 2012 2011 2013 vs. 2012 2012 vs. 2011
(Amounts in thousands)
Restructuring charges . . . . . . . . . . . . . . . . . . . . . . . . . . . . $36,551 $ — $ — $36,551 **% $ — **%
** not meaningful
In the third quarter of 2013, we initiated plans to restructure our Travelocity business in connection withwhich we recorded restructuring charges totaling $28 million for the year ended December 31, 2013, whichincluded $18 million of employee termination benefits, $4 million of asset impairments and $6 million of otherrelated costs. $22 million of these restructuring charges was attributable to the restructuring of our Travelocitybusinesses in the United States and Canada in connection with the Expedia SMA and the remaining $6 millionwas attributable to employee termination benefits in connection with the restructuring of lastminute.com, theEuropean portion of our Travelocity business. See “—Factors Affecting Our Results—Travelocity.”
In the fourth quarter of 2013, we also initiated a restructuring plan to simplify our technology organization,better align costs with our current business, reduce our spend on third-party resources, and to increase focus onproduct development. The majority of this plan will be completed in 2014. As a part of this restructuring plan, wewill reduce our employee base by approximately 350 employees. We recorded a charge of $8 million associatedwith employee termination benefits in the fourth quarter of 2013 and do not expect to record material charges in2014 related to this action. See Note 5, Restructuring Charges, to our audited consolidated financial statementsincluded elsewhere in this prospectus.
Interest expense, net
Year Ended December 31, Change
2013 2012 2011 2013 vs. 2012 2012 vs. 2011
(Amounts in thousands)
Interest expense, net . . . . . . . . . . . . . . . . . . . . $274,689 $232,450 $174,390 $42,239 18% $58,060 33%
99
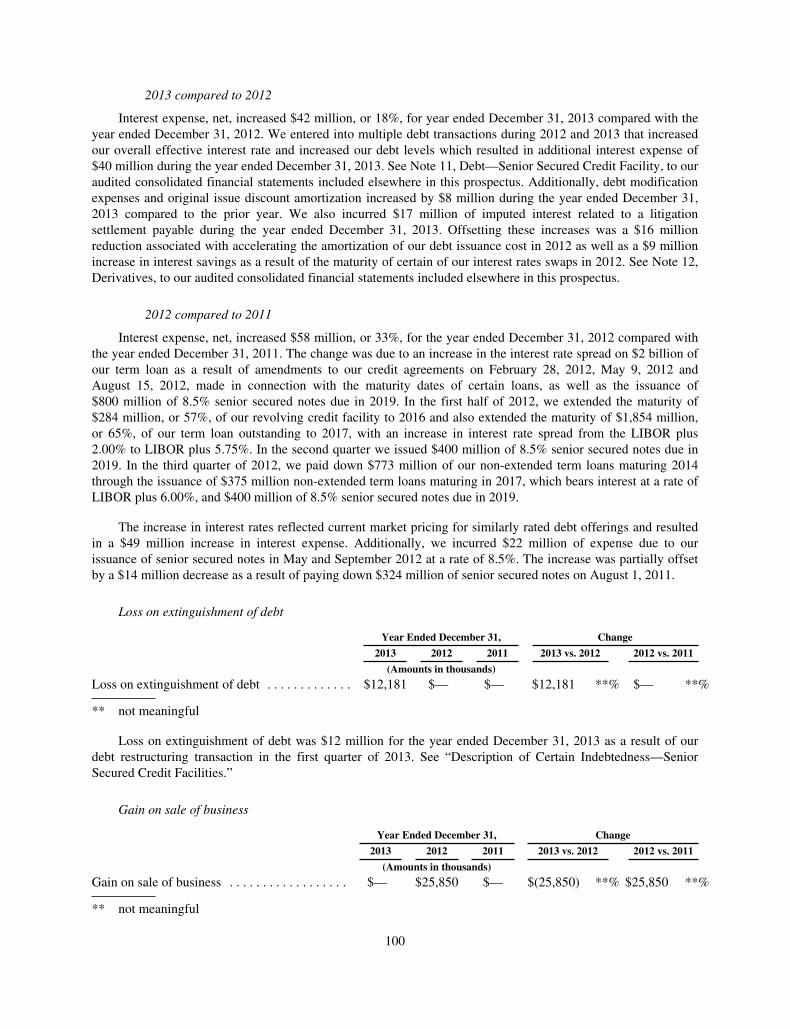
2013 compared to 2012
Interest expense, net, increased $42 million, or 18%, for year ended December 31, 2013 compared with theyear ended December 31, 2012. We entered into multiple debt transactions during 2012 and 2013 that increasedour overall effective interest rate and increased our debt levels which resulted in additional interest expense of$40 million during the year ended December 31, 2013. See Note 11, Debt—Senior Secured Credit Facility, to ouraudited consolidated financial statements included elsewhere in this prospectus. Additionally, debt modificationexpenses and original issue discount amortization increased by $8 million during the year ended December 31,2013 compared to the prior year. We also incurred $17 million of imputed interest related to a litigationsettlement payable during the year ended December 31, 2013. Offsetting these increases was a $16 millionreduction associated with accelerating the amortization of our debt issuance cost in 2012 as well as a $9 millionincrease in interest savings as a result of the maturity of certain of our interest rates swaps in 2012. See Note 12,Derivatives, to our audited consolidated financial statements included elsewhere in this prospectus.
2012 compared to 2011
Interest expense, net, increased $58 million, or 33%, for the year ended December 31, 2012 compared withthe year ended December 31, 2011. The change was due to an increase in the interest rate spread on $2 billion ofour term loan as a result of amendments to our credit agreements on February 28, 2012, May 9, 2012 andAugust 15, 2012, made in connection with the maturity dates of certain loans, as well as the issuance of$800 million of 8.5% senior secured notes due in 2019. In the first half of 2012, we extended the maturity of$284 million, or 57%, of our revolving credit facility to 2016 and also extended the maturity of $1,854 million,or 65%, of our term loan outstanding to 2017, with an increase in interest rate spread from the LIBOR plus2.00% to LIBOR plus 5.75%. In the second quarter we issued $400 million of 8.5% senior secured notes due in2019. In the third quarter of 2012, we paid down $773 million of our non-extended term loans maturing 2014through the issuance of $375 million non-extended term loans maturing in 2017, which bears interest at a rate ofLIBOR plus 6.00%, and $400 million of 8.5% senior secured notes due in 2019.
The increase in interest rates reflected current market pricing for similarly rated debt offerings and resultedin a $49 million increase in interest expense. Additionally, we incurred $22 million of expense due to ourissuance of senior secured notes in May and September 2012 at a rate of 8.5%. The increase was partially offsetby a $14 million decrease as a result of paying down $324 million of senior secured notes on August 1, 2011.
Loss on extinguishment of debt
Year Ended December 31, Change
2013 2012 2011 2013 vs. 2012 2012 vs. 2011
(Amounts in thousands)
Loss on extinguishment of debt . . . . . . . . . . . . . $12,181 $— $— $12,181 **% $— **%
** not meaningful
Loss on extinguishment of debt was $12 million for the year ended December 31, 2013 as a result of ourdebt restructuring transaction in the first quarter of 2013. See “Description of Certain Indebtedness—SeniorSecured Credit Facilities.”
Gain on sale of business
Year Ended December 31, Change
2013 2012 2011 2013 vs. 2012 2012 vs. 2011
(Amounts in thousands)
Gain on sale of business . . . . . . . . . . . . . . . . . . $— $25,850 $— $(25,850) **% $25,850 **%
** not meaningful
100
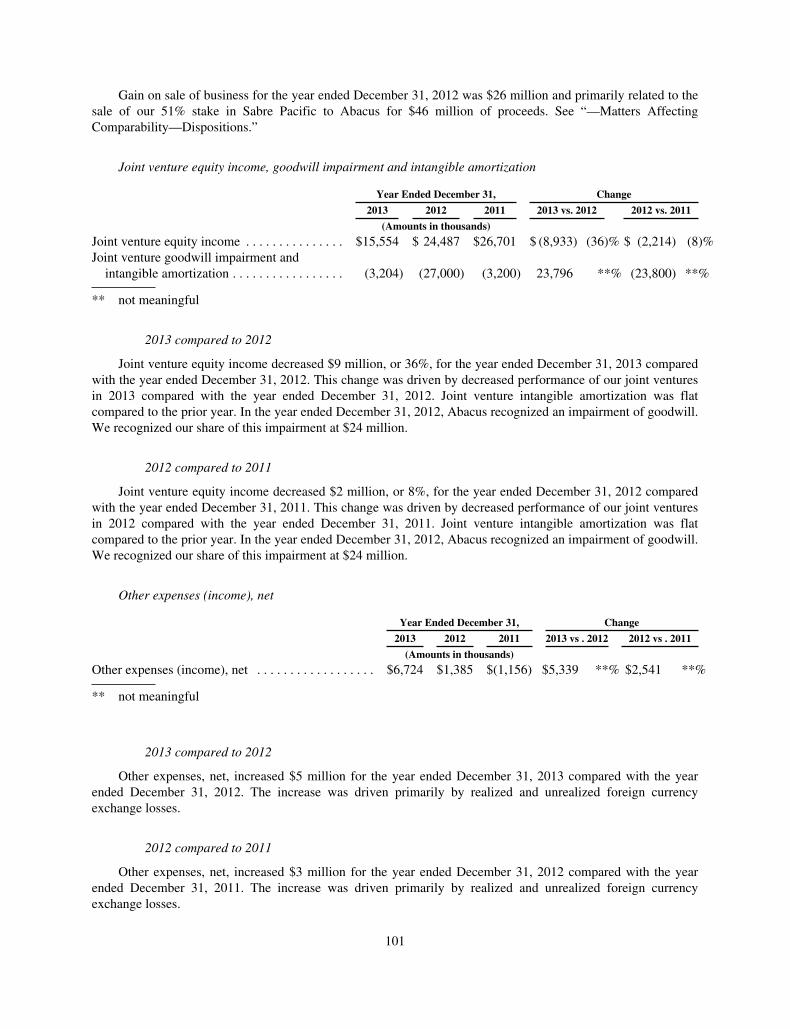
Gain on sale of business for the year ended December 31, 2012 was $26 million and primarily related to thesale of our 51% stake in Sabre Pacific to Abacus for $46 million of proceeds. See “—Matters AffectingComparability—Dispositions.”
Joint venture equity income, goodwill impairment and intangible amortization
Year Ended December 31, Change
2013 2012 2011 2013 vs. 2012 2012 vs. 2011
(Amounts in thousands)
Joint venture equity income . . . . . . . . . . . . . . . $15,554 $ 24,487 $26,701 $ (8,933) (36)% $ (2,214) (8)%Joint venture goodwill impairment andintangible amortization . . . . . . . . . . . . . . . . . (3,204) (27,000) (3,200) 23,796 **% (23,800) **%
** not meaningful
2013 compared to 2012
Joint venture equity income decreased $9 million, or 36%, for the year ended December 31, 2013 comparedwith the year ended December 31, 2012. This change was driven by decreased performance of our joint venturesin 2013 compared with the year ended December 31, 2012. Joint venture intangible amortization was flatcompared to the prior year. In the year ended December 31, 2012, Abacus recognized an impairment of goodwill.We recognized our share of this impairment at $24 million.
2012 compared to 2011
Joint venture equity income decreased $2 million, or 8%, for the year ended December 31, 2012 comparedwith the year ended December 31, 2011. This change was driven by decreased performance of our joint venturesin 2012 compared with the year ended December 31, 2011. Joint venture intangible amortization was flatcompared to the prior year. In the year ended December 31, 2012, Abacus recognized an impairment of goodwill.We recognized our share of this impairment at $24 million.
Other expenses (income), net
Year Ended December 31, Change
2013 2012 2011 2013 vs . 2012 2012 vs . 2011
(Amounts in thousands)
Other expenses (income), net . . . . . . . . . . . . . . . . . . $6,724 $1,385 $(1,156) $5,339 **% $2,541 **%
** not meaningful
2013 compared to 2012
Other expenses, net, increased $5 million for the year ended December 31, 2013 compared with the yearended December 31, 2012. The increase was driven primarily by realized and unrealized foreign currencyexchange losses.
2012 compared to 2011
Other expenses, net, increased $3 million for the year ended December 31, 2012 compared with the yearended December 31, 2011. The increase was driven primarily by realized and unrealized foreign currencyexchange losses.
101
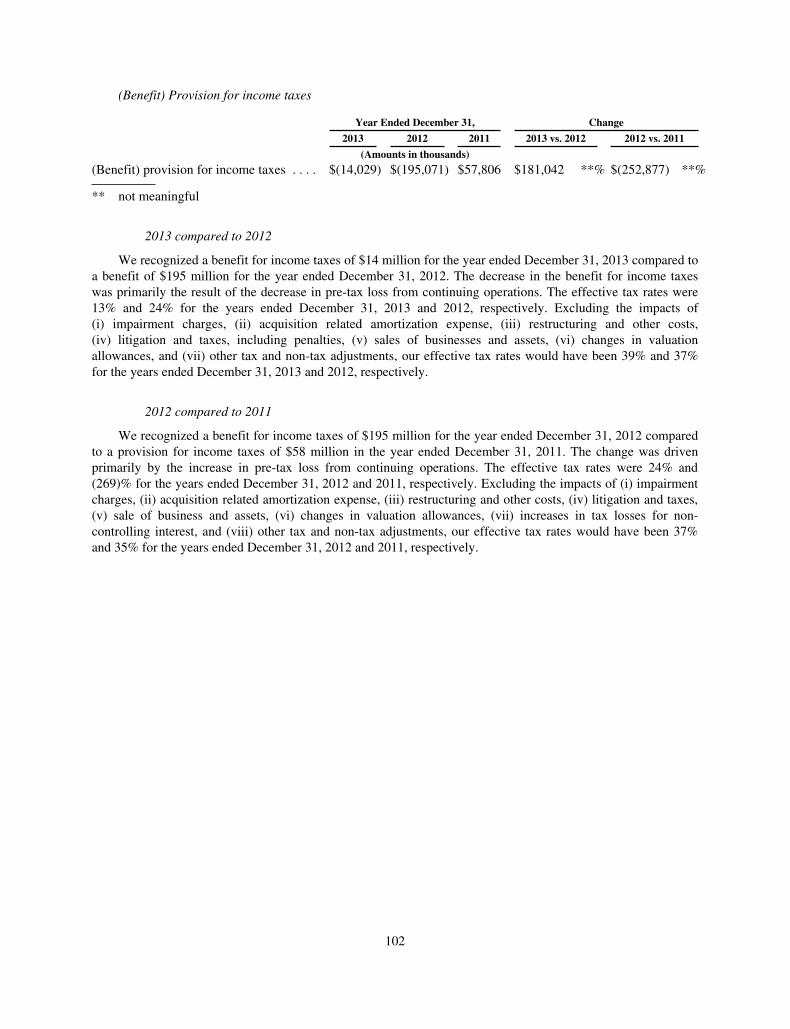
(Benefit) Provision for income taxes
Year Ended December 31, Change
2013 2012 2011 2013 vs. 2012 2012 vs. 2011
(Amounts in thousands)
(Benefit) provision for income taxes . . . . $(14,029) $(195,071) $57,806 $181,042 **% $(252,877) **%
** not meaningful
2013 compared to 2012
We recognized a benefit for income taxes of $14 million for the year ended December 31, 2013 compared toa benefit of $195 million for the year ended December 31, 2012. The decrease in the benefit for income taxeswas primarily the result of the decrease in pre-tax loss from continuing operations. The effective tax rates were13% and 24% for the years ended December 31, 2013 and 2012, respectively. Excluding the impacts of(i) impairment charges, (ii) acquisition related amortization expense, (iii) restructuring and other costs,(iv) litigation and taxes, including penalties, (v) sales of businesses and assets, (vi) changes in valuationallowances, and (vii) other tax and non-tax adjustments, our effective tax rates would have been 39% and 37%for the years ended December 31, 2013 and 2012, respectively.
2012 compared to 2011
We recognized a benefit for income taxes of $195 million for the year ended December 31, 2012 comparedto a provision for income taxes of $58 million in the year ended December 31, 2011. The change was drivenprimarily by the increase in pre-tax loss from continuing operations. The effective tax rates were 24% and(269)% for the years ended December 31, 2012 and 2011, respectively. Excluding the impacts of (i) impairmentcharges, (ii) acquisition related amortization expense, (iii) restructuring and other costs, (iv) litigation and taxes,(v) sale of business and assets, (vi) changes in valuation allowances, (vii) increases in tax losses for non-controlling interest, and (viii) other tax and non-tax adjustments, our effective tax rates would have been 37%and 35% for the years ended December 31, 2012 and 2011, respectively.
102
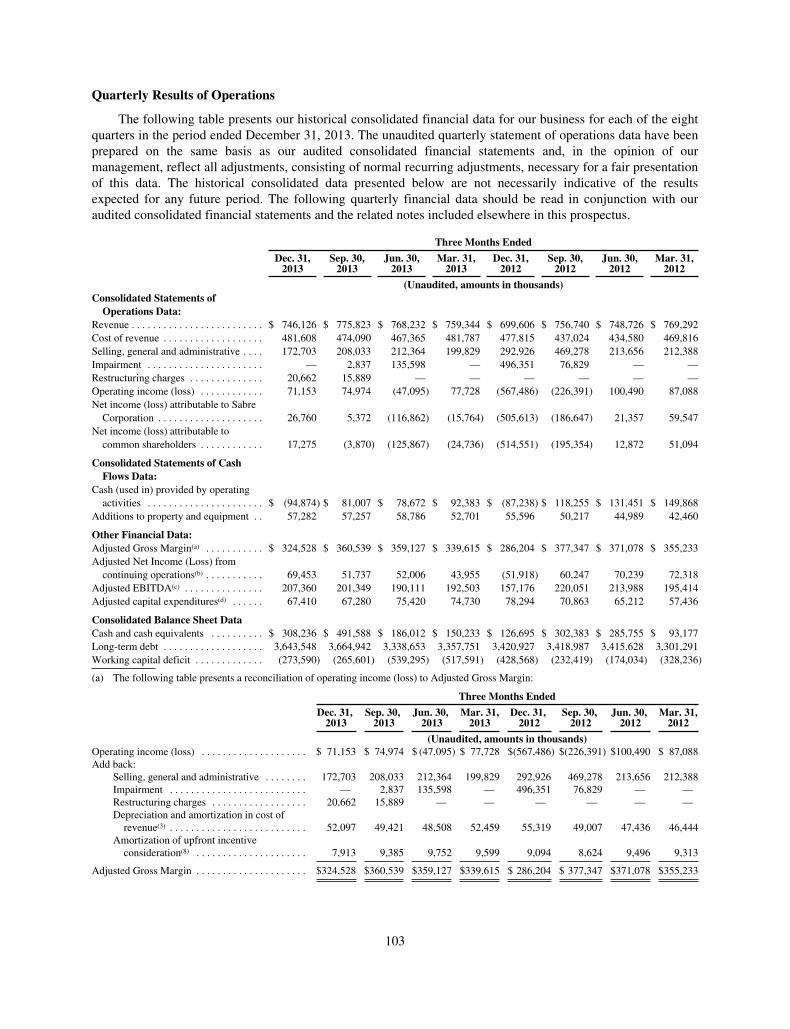
Quarterly Results of Operations
The following table presents our historical consolidated financial data for our business for each of the eightquarters in the period ended December 31, 2013. The unaudited quarterly statement of operations data have beenprepared on the same basis as our audited consolidated financial statements and, in the opinion of ourmanagement, reflect all adjustments, consisting of normal recurring adjustments, necessary for a fair presentationof this data. The historical consolidated data presented below are not necessarily indicative of the resultsexpected for any future period. The following quarterly financial data should be read in conjunction with ouraudited consolidated financial statements and the related notes included elsewhere in this prospectus.
Three Months Ended
Dec. 31,2013
Sep. 30,2013
Jun. 30,2013
Mar. 31,2013
Dec. 31,2012
Sep. 30,2012
Jun. 30,2012
Mar. 31,2012
(Unaudited, amounts in thousands)Consolidated Statements of
Operations Data:Revenue . . . . . . . . . . . . . . . . . . . . . . . . . $ 746,126 $ 775,823 $ 768,232 $ 759,344 $ 699,606 $ 756,740 $ 748,726 $ 769,292Cost of revenue . . . . . . . . . . . . . . . . . . . 481,608 474,090 467,365 481,787 477,815 437,024 434,580 469,816Selling, general and administrative . . . . 172,703 208,033 212,364 199,829 292,926 469,278 213,656 212,388Impairment . . . . . . . . . . . . . . . . . . . . . . — 2,837 135,598 — 496,351 76,829 — —Restructuring charges . . . . . . . . . . . . . . 20,662 15,889 — — — — — —Operating income (loss) . . . . . . . . . . . . 71,153 74,974 (47,095) 77,728 (567,486) (226,391) 100,490 87,088Net income (loss) attributable to SabreCorporation . . . . . . . . . . . . . . . . . . . . 26,760 5,372 (116,862) (15,764) (505,613) (186,647) 21,357 59,547
Net income (loss) attributable tocommon shareholders . . . . . . . . . . . . 17,275 (3,870) (125,867) (24,736) (514,551) (195,354) 12,872 51,094
Consolidated Statements of CashFlows Data:
Cash (used in) provided by operatingactivities . . . . . . . . . . . . . . . . . . . . . . $ (94,874) $ 81,007 $ 78,672 $ 92,383 $ (87,238) $ 118,255 $ 131,451 $ 149,868
Additions to property and equipment . . 57,282 57,257 58,786 52,701 55,596 50,217 44,989 42,460
Other Financial Data:Adjusted Gross Margin(a) . . . . . . . . . . . $ 324,528 $ 360,539 $ 359,127 $ 339,615 $ 286,204 $ 377,347 $ 371,078 $ 355,233Adjusted Net Income (Loss) fromcontinuing operations(b) . . . . . . . . . . . 69,453 51,737 52,006 43,955 (51,918) 60,247 70,239 72,318
Adjusted EBITDA(c) . . . . . . . . . . . . . . . 207,360 201,349 190,111 192,503 157,176 220,051 213,988 195,414Adjusted capital expenditures(d) . . . . . . 67,410 67,280 75,420 74,730 78,294 70,863 65,212 57,436
Consolidated Balance Sheet DataCash and cash equivalents . . . . . . . . . . $ 308,236 $ 491,588 $ 186,012 $ 150,233 $ 126,695 $ 302,383 $ 285,755 $ 93,177Long-term debt . . . . . . . . . . . . . . . . . . . 3,643,548 3,664,942 3,338,653 3,357,751 3,420,927 3,418,987 3,415,628 3,301,291Working capital deficit . . . . . . . . . . . . . (273,590) (265,601) (539,295) (517,591) (428,568) (232,419) (174,034) (328,236)
(a) The following table presents a reconciliation of operating income (loss) to Adjusted Gross Margin:
Three Months Ended
Dec. 31,2013
Sep. 30,2013
Jun. 30,2013
Mar. 31,2013
Dec. 31,2012
Sep. 30,2012
Jun. 30,2012
Mar. 31,2012
(Unaudited, amounts in thousands)Operating income (loss) . . . . . . . . . . . . . . . . . . . . $ 71,153 $ 74,974 $ (47,095) $ 77,728 $(567,486) $(226,391) $100,490 $ 87,088Add back:
Selling, general and administrative . . . . . . . . 172,703 208,033 212,364 199,829 292,926 469,278 213,656 212,388Impairment . . . . . . . . . . . . . . . . . . . . . . . . . . — 2,837 135,598 — 496,351 76,829 — —Restructuring charges . . . . . . . . . . . . . . . . . . 20,662 15,889 — — — — — —Depreciation and amortization in cost ofrevenue(3) . . . . . . . . . . . . . . . . . . . . . . . . . . 52,097 49,421 48,508 52,459 55,319 49,007 47,436 46,444
Amortization of upfront incentiveconsideration(8) . . . . . . . . . . . . . . . . . . . . . 7,913 9,385 9,752 9,599 9,094 8,624 9,496 9,313
Adjusted Gross Margin . . . . . . . . . . . . . . . . . . . . . $324,528 $360,539 $359,127 $339,615 $ 286,204 $ 377,347 $371,078 $355,233
103
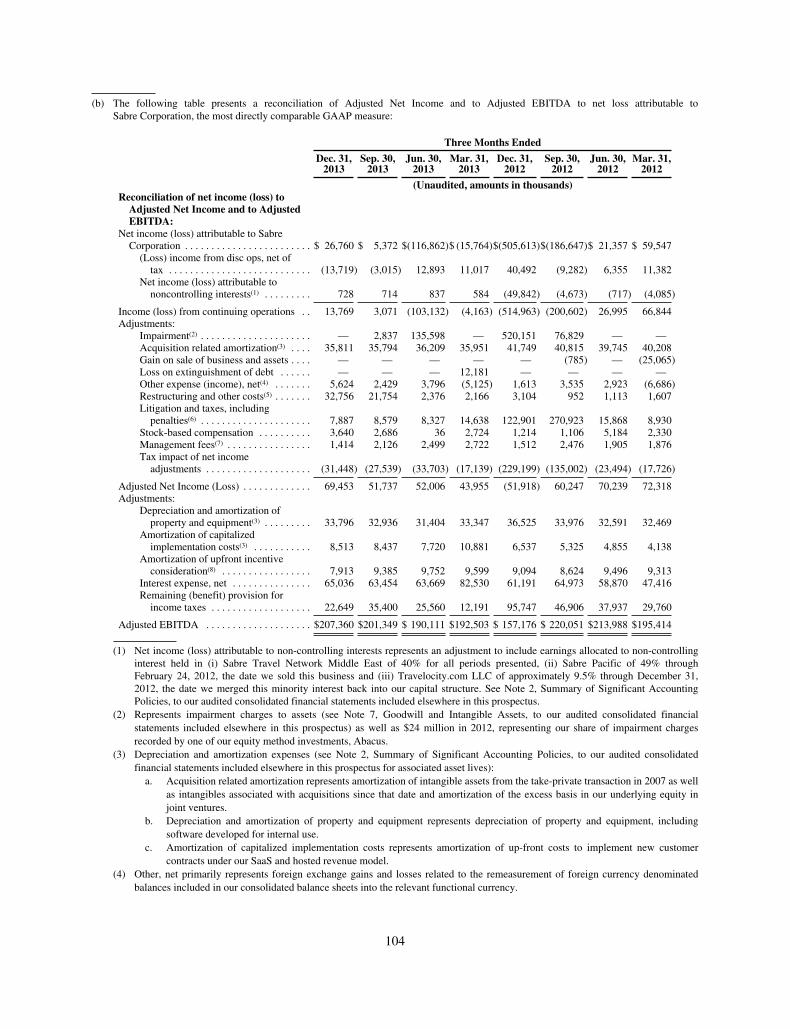
(b) The following table presents a reconciliation of Adjusted Net Income and to Adjusted EBITDA to net loss attributable toSabre Corporation, the most directly comparable GAAP measure:
Three Months Ended
Dec. 31,2013
Sep. 30,2013
Jun. 30,2013
Mar. 31,2013
Dec. 31,2012
Sep. 30,2012
Jun. 30,2012
Mar. 31,2012
(Unaudited, amounts in thousands)Reconciliation of net income (loss) to
Adjusted Net Income and to AdjustedEBITDA:
Net income (loss) attributable to SabreCorporation . . . . . . . . . . . . . . . . . . . . . . . . $ 26,760 $ 5,372 $(116,862)$ (15,764)$(505,613)$(186,647)$ 21,357 $ 59,547
(Loss) income from disc ops, net oftax . . . . . . . . . . . . . . . . . . . . . . . . . . . (13,719) (3,015) 12,893 11,017 40,492 (9,282) 6,355 11,382
Net income (loss) attributable tononcontrolling interests(1) . . . . . . . . . 728 714 837 584 (49,842) (4,673) (717) (4,085)
Income (loss) from continuing operations . . 13,769 3,071 (103,132) (4,163) (514,963) (200,602) 26,995 66,844Adjustments:
Impairment(2) . . . . . . . . . . . . . . . . . . . . . — 2,837 135,598 — 520,151 76,829 — —Acquisition related amortization(3) . . . . 35,811 35,794 36,209 35,951 41,749 40,815 39,745 40,208Gain on sale of business and assets . . . . — — — — — (785) — (25,065)Loss on extinguishment of debt . . . . . . — — — 12,181 — — — —Other expense (income), net(4) . . . . . . . 5,624 2,429 3,796 (5,125) 1,613 3,535 2,923 (6,686)Restructuring and other costs(5) . . . . . . . 32,756 21,754 2,376 2,166 3,104 952 1,113 1,607Litigation and taxes, includingpenalties(6) . . . . . . . . . . . . . . . . . . . . . 7,887 8,579 8,327 14,638 122,901 270,923 15,868 8,930
Stock-based compensation . . . . . . . . . . 3,640 2,686 36 2,724 1,214 1,106 5,184 2,330Management fees(7) . . . . . . . . . . . . . . . . 1,414 2,126 2,499 2,722 1,512 2,476 1,905 1,876Tax impact of net incomeadjustments . . . . . . . . . . . . . . . . . . . . (31,448) (27,539) (33,703) (17,139) (229,199) (135,002) (23,494) (17,726)
Adjusted Net Income (Loss) . . . . . . . . . . . . . 69,453 51,737 52,006 43,955 (51,918) 60,247 70,239 72,318Adjustments:
Depreciation and amortization ofproperty and equipment(3) . . . . . . . . . 33,796 32,936 31,404 33,347 36,525 33,976 32,591 32,469
Amortization of capitalizedimplementation costs(3) . . . . . . . . . . . 8,513 8,437 7,720 10,881 6,537 5,325 4,855 4,138
Amortization of upfront incentiveconsideration(8) . . . . . . . . . . . . . . . . . 7,913 9,385 9,752 9,599 9,094 8,624 9,496 9,313
Interest expense, net . . . . . . . . . . . . . . . 65,036 63,454 63,669 82,530 61,191 64,973 58,870 47,416Remaining (benefit) provision forincome taxes . . . . . . . . . . . . . . . . . . . 22,649 35,400 25,560 12,191 95,747 46,906 37,937 29,760
Adjusted EBITDA . . . . . . . . . . . . . . . . . . . . $207,360 $201,349 $ 190,111 $192,503 $ 157,176 $ 220,051 $213,988 $195,414
(1) Net income (loss) attributable to non-controlling interests represents an adjustment to include earnings allocated to non-controllinginterest held in (i) Sabre Travel Network Middle East of 40% for all periods presented, (ii) Sabre Pacific of 49% throughFebruary 24, 2012, the date we sold this business and (iii) Travelocity.com LLC of approximately 9.5% through December 31,2012, the date we merged this minority interest back into our capital structure. See Note 2, Summary of Significant AccountingPolicies, to our audited consolidated financial statements included elsewhere in this prospectus.
(2) Represents impairment charges to assets (see Note 7, Goodwill and Intangible Assets, to our audited consolidated financialstatements included elsewhere in this prospectus) as well as $24 million in 2012, representing our share of impairment chargesrecorded by one of our equity method investments, Abacus.
(3) Depreciation and amortization expenses (see Note 2, Summary of Significant Accounting Policies, to our audited consolidatedfinancial statements included elsewhere in this prospectus for associated asset lives):a. Acquisition related amortization represents amortization of intangible assets from the take-private transaction in 2007 as well
as intangibles associated with acquisitions since that date and amortization of the excess basis in our underlying equity injoint ventures.
b. Depreciation and amortization of property and equipment represents depreciation of property and equipment, includingsoftware developed for internal use.
c. Amortization of capitalized implementation costs represents amortization of up-front costs to implement new customercontracts under our SaaS and hosted revenue model.
(4) Other, net primarily represents foreign exchange gains and losses related to the remeasurement of foreign currency denominatedbalances included in our consolidated balance sheets into the relevant functional currency.
104

(5) Restructuring and other costs represents charges associated with business restructuring and associated changes implemented whichresulted in severance benefits related to employee terminations, integration and facility opening or closing costs and other businessreorganization costs.
(6) Represents charges or settlements associated with airline antitrust litigation as well as payments or reserves taken in relation tocertain retroactive hotel occupancy and excise tax disputes (see Note 20, Commitments and Contingencies, to our annual auditedconsolidated financial statements included elsewhere in this prospectus).
(7) We have been paying an annual management fee to TPG and Silver Lake in an amount equal to between (i) $5 million and(ii) $7 million, the actual amount of which is calculated based on 1% of Adjusted EBITDA, as defined in the MSA, earned by thecompany in such fiscal year up to a maximum of $7 million. In addition, the MSA provides for the reimbursement of certain costsincurred by TPG and Silver Lake, which are included in this line item. In connection with the completion of the offering, we willpay to TPG and Silver Lake, in the aggregate; an $21.0 million fee pursuant to the MSA and the MSA will be terminated.
(8) Our Travel Network business at times provides upfront incentive consideration to travel agency subscribers at inception ormodification of a service contract, which are capitalized and amortized to cost of revenue over an average expected life of theservice contract, generally over three to five years. Such consideration is made with the objective of increasing the number ofclients, or to ensure or improve customer loyalty. Such service contract terms are established such that the supplier and other feesgenerated over the life of the contract will exceed the cost of the incentive consideration provided upfront. Such service contractswith travel agency subscribers require that the customer commit to achieving certain economic objectives and generally have termsrequiring repayment of the upfront incentive consideration if those objectives are not met.
(c) Includes capital expenditures and capitalized implementation costs as summarized below:
Three Months Ended
Dec. 31,2013
Sep. 30,2013
Jun. 30,2013
Mar. 31,2013
Dec. 31,2012
Sep. 30,2012
Jun. 30,2012
Mar. 31,2012
(Unaudited, amounts in thousands)Additions to property and equipment . . . . . . . . . $57,282 $57,257 $58,786 $52,701 $55,596 $50,217 $44,989 $42,460Capitalized implementation costs . . . . . . . . . . . . 10,128 10,023 16,634 22,029 22,698 20,646 20,223 14,976
Adjusted capital expenditures . . . . . . . . . . . $67,410 $67,280 $75,420 $74,730 $78,294 $70,863 $65,212 $57,436
Liquidity and Capital Resources
Our principal sources of liquidity are: (i) cash flows from operations, (ii) cash and cash equivalents and(iii) borrowings under our $352 million Revolving Facility. Borrowing availability under our Revolving Facilityis reduced by our outstanding letters of credit and restricted cash collateral. At December 31, 2013, 2012 and2011, our cash and cash equivalents, restricted cash, Revolving Facility, outstanding letters of credit andrestricted cash collateral were as follows:
As of December 31,
2013 2012 2011
(Amounts in thousands)Cash and cash equivalents . . . . . . . . . . . . . . . . . . . . . . . . . . . . . . . . . . . . . . . . . $308,236 $126,695 $ 58,350Restricted cash . . . . . . . . . . . . . . . . . . . . . . . . . . . . . . . . . . . . . . . . . . . . . . . . . . 2,359 4,440 8,786Revolving facility outstanding balance . . . . . . . . . . . . . . . . . . . . . . . . . . . . . . . — — 82,000Outstanding letters of credit . . . . . . . . . . . . . . . . . . . . . . . . . . . . . . . . . . . . . . . . 67,139 113,529 120,101Restricted cash collateral . . . . . . . . . . . . . . . . . . . . . . . . . . . . . . . . . . . . . . . . . . 810 2,075 2,038Available balance under the revolving facility . . . . . . . . . . . . . . . . . . . . . . . . . 285,671 388,546 299,937
Utilization
We utilize cash and cash equivalents primarily to pay our operating expenses, make capital expenditures,invest in our products and offerings, and service our debt and other long-term liabilities. For the years endedDecember 31, 2013 and 2012, we also used a portion of our cash and cash equivalents to pay our litigationsettlement with American Airlines including a $100 million payment made in the fourth quarter of 2013. We willalso use a portion of our cash and cash equivalents as of December 31, 2013 to pay travel suppliers as describedabove under “—Factors Affecting Our Results—Travelocity” and $30 million of contingent consideration relatedto the acquisition of PRISM due in August 2014.
105
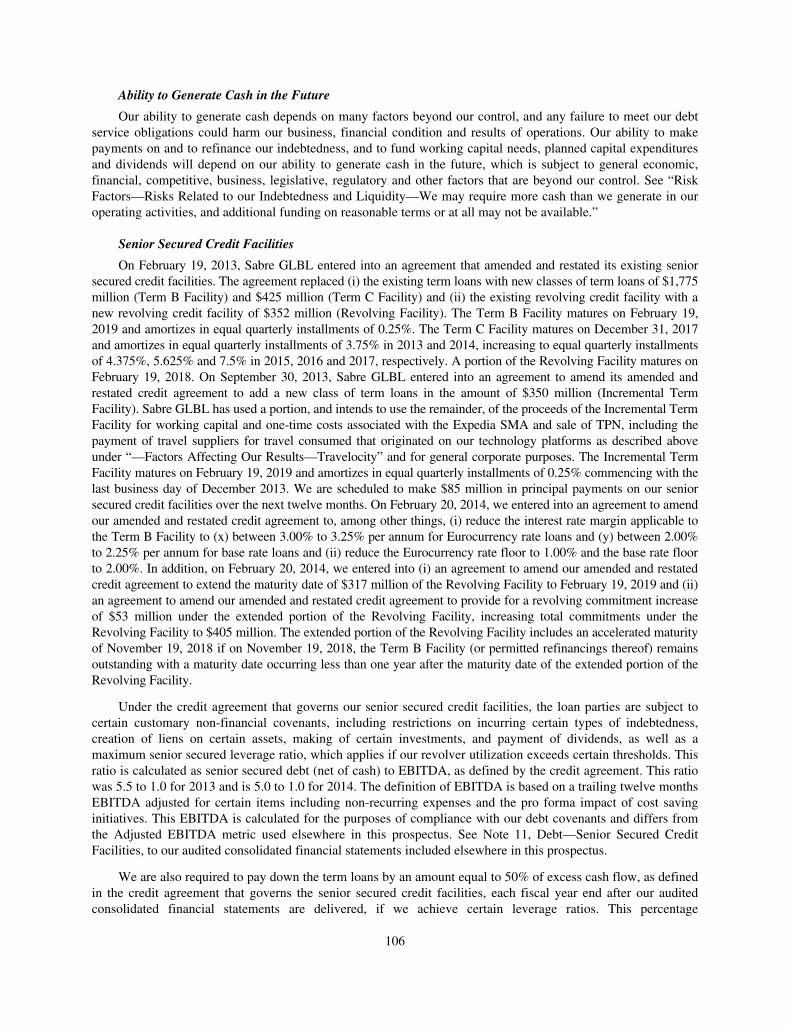
Ability to Generate Cash in the Future
Our ability to generate cash depends on many factors beyond our control, and any failure to meet our debtservice obligations could harm our business, financial condition and results of operations. Our ability to makepayments on and to refinance our indebtedness, and to fund working capital needs, planned capital expendituresand dividends will depend on our ability to generate cash in the future, which is subject to general economic,financial, competitive, business, legislative, regulatory and other factors that are beyond our control. See “RiskFactors—Risks Related to our Indebtedness and Liquidity—We may require more cash than we generate in ouroperating activities, and additional funding on reasonable terms or at all may not be available.”
Senior Secured Credit Facilities
On February 19, 2013, Sabre GLBL entered into an agreement that amended and restated its existing seniorsecured credit facilities. The agreement replaced (i) the existing term loans with new classes of term loans of $1,775million (Term B Facility) and $425 million (Term C Facility) and (ii) the existing revolving credit facility with anew revolving credit facility of $352 million (Revolving Facility). The Term B Facility matures on February 19,2019 and amortizes in equal quarterly installments of 0.25%. The Term C Facility matures on December 31, 2017and amortizes in equal quarterly installments of 3.75% in 2013 and 2014, increasing to equal quarterly installmentsof 4.375%, 5.625% and 7.5% in 2015, 2016 and 2017, respectively. A portion of the Revolving Facility matures onFebruary 19, 2018. On September 30, 2013, Sabre GLBL entered into an agreement to amend its amended andrestated credit agreement to add a new class of term loans in the amount of $350 million (Incremental TermFacility). Sabre GLBL has used a portion, and intends to use the remainder, of the proceeds of the Incremental TermFacility for working capital and one-time costs associated with the Expedia SMA and sale of TPN, including thepayment of travel suppliers for travel consumed that originated on our technology platforms as described aboveunder “—Factors Affecting Our Results—Travelocity” and for general corporate purposes. The Incremental TermFacility matures on February 19, 2019 and amortizes in equal quarterly installments of 0.25% commencing with thelast business day of December 2013. We are scheduled to make $85 million in principal payments on our seniorsecured credit facilities over the next twelve months. On February 20, 2014, we entered into an agreement to amendour amended and restated credit agreement to, among other things, (i) reduce the interest rate margin applicable tothe Term B Facility to (x) between 3.00% to 3.25% per annum for Eurocurrency rate loans and (y) between 2.00%to 2.25% per annum for base rate loans and (ii) reduce the Eurocurrency rate floor to 1.00% and the base rate floorto 2.00%. In addition, on February 20, 2014, we entered into (i) an agreement to amend our amended and restatedcredit agreement to extend the maturity date of $317 million of the Revolving Facility to February 19, 2019 and (ii)an agreement to amend our amended and restated credit agreement to provide for a revolving commitment increaseof $53 million under the extended portion of the Revolving Facility, increasing total commitments under theRevolving Facility to $405 million. The extended portion of the Revolving Facility includes an accelerated maturityof November 19, 2018 if on November 19, 2018, the Term B Facility (or permitted refinancings thereof) remainsoutstanding with a maturity date occurring less than one year after the maturity date of the extended portion of theRevolving Facility.
Under the credit agreement that governs our senior secured credit facilities, the loan parties are subject tocertain customary non-financial covenants, including restrictions on incurring certain types of indebtedness,creation of liens on certain assets, making of certain investments, and payment of dividends, as well as amaximum senior secured leverage ratio, which applies if our revolver utilization exceeds certain thresholds. Thisratio is calculated as senior secured debt (net of cash) to EBITDA, as defined by the credit agreement. This ratiowas 5.5 to 1.0 for 2013 and is 5.0 to 1.0 for 2014. The definition of EBITDA is based on a trailing twelve monthsEBITDA adjusted for certain items including non-recurring expenses and the pro forma impact of cost savinginitiatives. This EBITDA is calculated for the purposes of compliance with our debt covenants and differs fromthe Adjusted EBITDA metric used elsewhere in this prospectus. See Note 11, Debt—Senior Secured CreditFacilities, to our audited consolidated financial statements included elsewhere in this prospectus.
We are also required to pay down the term loans by an amount equal to 50% of excess cash flow, as definedin the credit agreement that governs the senior secured credit facilities, each fiscal year end after our auditedconsolidated financial statements are delivered, if we achieve certain leverage ratios. This percentage
106
requirement may decrease or be eliminated if certain leverage ratios are achieved. We are further required to paydown the term loan with proceeds from certain asset sales or borrowings as defined in the credit agreement thatgoverns the senior secured credit facilities.
We believe that cash flows from operations, cash and cash equivalents on hand and the revolving creditfacility provide adequate liquidity for our operational and capital expenditures and other obligations over the nexttwelve months. From a long-term perspective, we may need to supplement our current liquidity through debt orequity offerings to support future strategic investments or to pay down our unsecured notes due in 2016, if wedecide not to refinance this indebtedness. See Note 11, Debt, to our audited consolidated financial statementsincluded elsewhere in this prospectus. See “Risk Factors—Risks Related to our Indebtedness and Liquidity—Wemay require more cash than we generate in our operating activities, and additional funding on reasonable termsor at all may not be available.”
Litigation Settlement Agreement
As a result of our litigation settlement agreement with American Airlines in 2012, we have accrued asettlement liability which consists of several elements, including cash to be paid directly to American Airlines,payment credits to pay for future technology services that we provide, as defined in the settlement agreements,and the estimated fair value of other service agreements entered into concurrently with the settlementagreement. As of December 31, 2013, our remaining settlement liability under the settlement agreement was$137 million, of which the current portion of $39 million is recorded in litigation settlement liability and relateddeferred revenue and the noncurrent portion of $98 million is recorded in other noncurrent liabilities. Inaccordance with the settlement agreement, we paid $100 million during the fourth quarter of 2013 and$100 million during the fourth quarter of 2012. We expect to realize cash tax benefits over the next one to fouryears and payment credits are expected to be used from 2014 through 2017, depending on the level of serviceswe provide to American Airlines. As of December 31, 2012, we recorded the estimated settlement charge of$347 million, or $222 million, net of tax, into our results of operations. See Note 20, Commitments andContingencies, to our audited consolidated financial statements included elsewhere in this prospectus.
Contingent Consideration on PRISM Acquisition
On August 1, 2012, we acquired PRISM for a purchase price of approximately $116 million. Included in thepurchase price are future payments totaling $60 million, due 12 and 24 months following the acquisition date.The first installment of $30 million was paid in August 2013. The second installment of $30 million, due inAugust 2014, is contingent primarily on contractual performance measures which have been met. See Note 3,Acquisitions, to our audited consolidated financial statements included elsewhere in this prospectus.
Accumulated Dividends on Preferred Stock
Each share of our Series A Preferred Stock accumulates dividends at an annual rate of 6%. Accumulated butunpaid dividends totaled $134 million and $97 million at December 31, 2013 and December 31, 2012,respectively. Prior to the closing of this offering, we will exercise our right to redeem all of our Series APreferred Stock. Following an amendment to our Certificate of Incorporation, the redemption price will be paidwith a mix of cash and stock, which we will deliver pro rata to the holders thereof concurrently with the closingof this offering. See “Summary—Redemption of Preferred Stock.”
Tax Receivable Agreement
Based on current tax laws and assuming that we and our subsidiaries earn sufficient taxable income torealize the full tax benefits subject to the TRA, (i) we expect that future payments under the TRA relating to thePre-IPO Tax Assets could aggregate to between $330 million and $380 million over the next six years (assumingno changes to current limitations on our ability to utilize our NOLs under Section 382 of the Code), which we
107
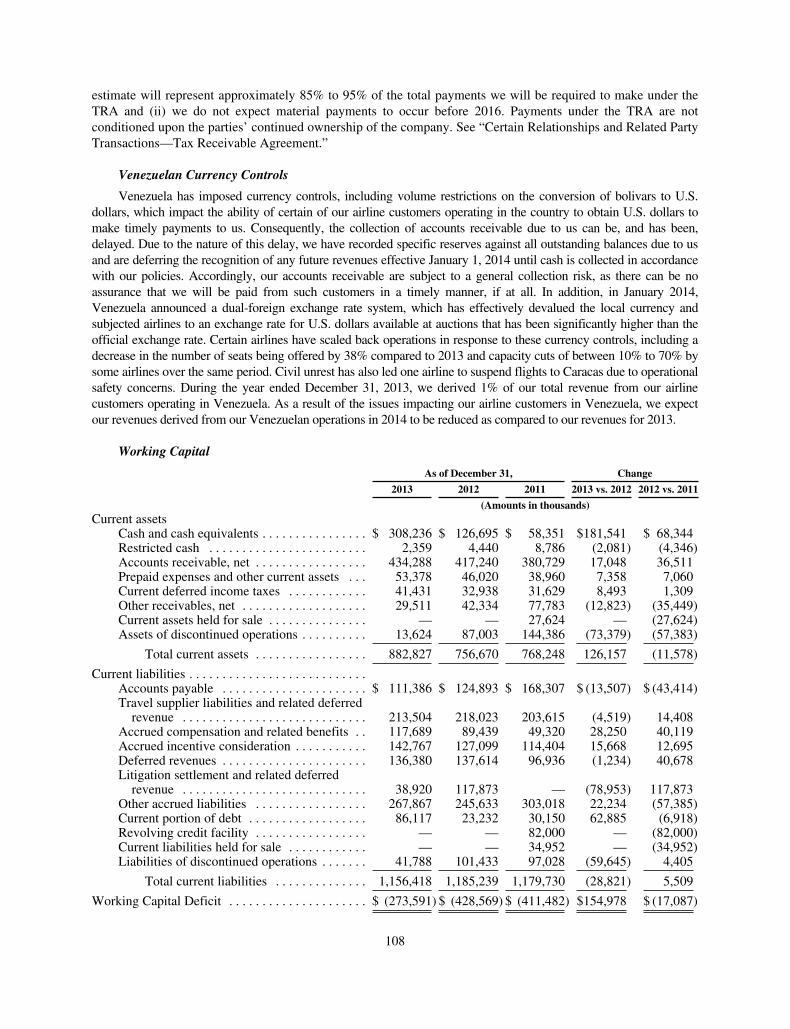
estimate will represent approximately 85% to 95% of the total payments we will be required to make under theTRA and (ii) we do not expect material payments to occur before 2016. Payments under the TRA are notconditioned upon the parties’ continued ownership of the company. See “Certain Relationships and Related PartyTransactions—Tax Receivable Agreement.”
Venezuelan Currency Controls
Venezuela has imposed currency controls, including volume restrictions on the conversion of bolivars to U.S.dollars, which impact the ability of certain of our airline customers operating in the country to obtain U.S. dollars tomake timely payments to us. Consequently, the collection of accounts receivable due to us can be, and has been,delayed. Due to the nature of this delay, we have recorded specific reserves against all outstanding balances due to usand are deferring the recognition of any future revenues effective January 1, 2014 until cash is collected in accordancewith our policies. Accordingly, our accounts receivable are subject to a general collection risk, as there can be noassurance that we will be paid from such customers in a timely manner, if at all. In addition, in January 2014,Venezuela announced a dual-foreign exchange rate system, which has effectively devalued the local currency andsubjected airlines to an exchange rate for U.S. dollars available at auctions that has been significantly higher than theofficial exchange rate. Certain airlines have scaled back operations in response to these currency controls, including adecrease in the number of seats being offered by 38% compared to 2013 and capacity cuts of between 10% to 70% bysome airlines over the same period. Civil unrest has also led one airline to suspend flights to Caracas due to operationalsafety concerns. During the year ended December 31, 2013, we derived 1% of our total revenue from our airlinecustomers operating in Venezuela. As a result of the issues impacting our airline customers in Venezuela, we expectour revenues derived from our Venezuelan operations in 2014 to be reduced as compared to our revenues for 2013.
Working Capital
As of December 31, Change
2013 2012 2011 2013 vs. 2012 2012 vs. 2011
(Amounts in thousands)Current assets
Cash and cash equivalents . . . . . . . . . . . . . . . . $ 308,236 $ 126,695 $ 58,351 $181,541 $ 68,344Restricted cash . . . . . . . . . . . . . . . . . . . . . . . . 2,359 4,440 8,786 (2,081) (4,346)Accounts receivable, net . . . . . . . . . . . . . . . . . 434,288 417,240 380,729 17,048 36,511Prepaid expenses and other current assets . . . 53,378 46,020 38,960 7,358 7,060Current deferred income taxes . . . . . . . . . . . . 41,431 32,938 31,629 8,493 1,309Other receivables, net . . . . . . . . . . . . . . . . . . . 29,511 42,334 77,783 (12,823) (35,449)Current assets held for sale . . . . . . . . . . . . . . . — — 27,624 — (27,624)Assets of discontinued operations . . . . . . . . . . 13,624 87,003 144,386 (73,379) (57,383)
Total current assets . . . . . . . . . . . . . . . . . 882,827 756,670 768,248 126,157 (11,578)
Current liabilities . . . . . . . . . . . . . . . . . . . . . . . . . . .Accounts payable . . . . . . . . . . . . . . . . . . . . . . $ 111,386 $ 124,893 $ 168,307 $ (13,507) $ (43,414)Travel supplier liabilities and related deferredrevenue . . . . . . . . . . . . . . . . . . . . . . . . . . . . 213,504 218,023 203,615 (4,519) 14,408
Accrued compensation and related benefits . . 117,689 89,439 49,320 28,250 40,119Accrued incentive consideration . . . . . . . . . . . 142,767 127,099 114,404 15,668 12,695Deferred revenues . . . . . . . . . . . . . . . . . . . . . . 136,380 137,614 96,936 (1,234) 40,678Litigation settlement and related deferredrevenue . . . . . . . . . . . . . . . . . . . . . . . . . . . . 38,920 117,873 — (78,953) 117,873
Other accrued liabilities . . . . . . . . . . . . . . . . . 267,867 245,633 303,018 22,234 (57,385)Current portion of debt . . . . . . . . . . . . . . . . . . 86,117 23,232 30,150 62,885 (6,918)Revolving credit facility . . . . . . . . . . . . . . . . . — — 82,000 — (82,000)Current liabilities held for sale . . . . . . . . . . . . — — 34,952 — (34,952)Liabilities of discontinued operations . . . . . . . 41,788 101,433 97,028 (59,645) 4,405
Total current liabilities . . . . . . . . . . . . . . 1,156,418 1,185,239 1,179,730 (28,821) 5,509
Working Capital Deficit . . . . . . . . . . . . . . . . . . . . . $ (273,591) $ (428,569) $ (411,482) $154,978 $ (17,087)
108
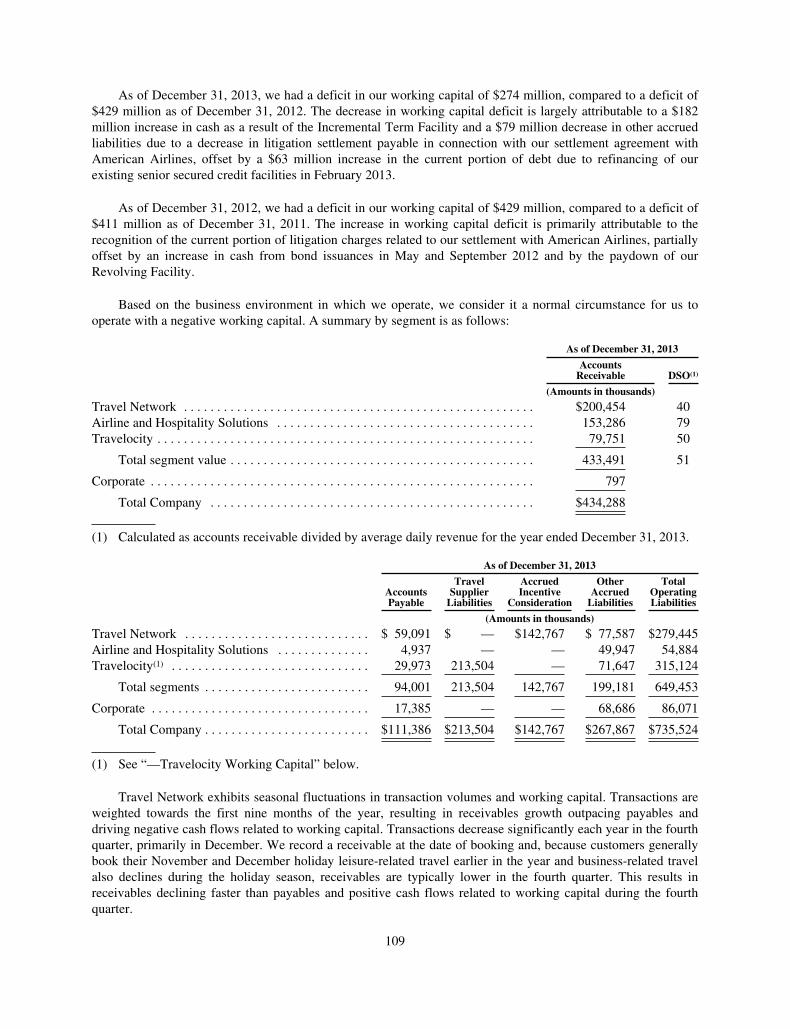
As of December 31, 2013, we had a deficit in our working capital of $274 million, compared to a deficit of$429 million as of December 31, 2012. The decrease in working capital deficit is largely attributable to a $182million increase in cash as a result of the Incremental Term Facility and a $79 million decrease in other accruedliabilities due to a decrease in litigation settlement payable in connection with our settlement agreement withAmerican Airlines, offset by a $63 million increase in the current portion of debt due to refinancing of ourexisting senior secured credit facilities in February 2013.
As of December 31, 2012, we had a deficit in our working capital of $429 million, compared to a deficit of$411 million as of December 31, 2011. The increase in working capital deficit is primarily attributable to therecognition of the current portion of litigation charges related to our settlement with American Airlines, partiallyoffset by an increase in cash from bond issuances in May and September 2012 and by the paydown of ourRevolving Facility.
Based on the business environment in which we operate, we consider it a normal circumstance for us tooperate with a negative working capital. A summary by segment is as follows:
As of December 31, 2013
AccountsReceivable DSO(1)
(Amounts in thousands)
Travel Network . . . . . . . . . . . . . . . . . . . . . . . . . . . . . . . . . . . . . . . . . . . . . . . . . . . . . $200,454 40Airline and Hospitality Solutions . . . . . . . . . . . . . . . . . . . . . . . . . . . . . . . . . . . . . . . 153,286 79Travelocity . . . . . . . . . . . . . . . . . . . . . . . . . . . . . . . . . . . . . . . . . . . . . . . . . . . . . . . . . 79,751 50
Total segment value . . . . . . . . . . . . . . . . . . . . . . . . . . . . . . . . . . . . . . . . . . . . . . 433,491 51
Corporate . . . . . . . . . . . . . . . . . . . . . . . . . . . . . . . . . . . . . . . . . . . . . . . . . . . . . . . . . . 797
Total Company . . . . . . . . . . . . . . . . . . . . . . . . . . . . . . . . . . . . . . . . . . . . . . . . . $434,288
(1) Calculated as accounts receivable divided by average daily revenue for the year ended December 31, 2013.
As of December 31, 2013
AccountsPayable
TravelSupplier
Liabilities
AccruedIncentive
Consideration
OtherAccrued
Liabilities
TotalOperatingLiabilities
(Amounts in thousands)
Travel Network . . . . . . . . . . . . . . . . . . . . . . . . . . . . $ 59,091 $ — $142,767 $ 77,587 $279,445Airline and Hospitality Solutions . . . . . . . . . . . . . . 4,937 — — 49,947 54,884Travelocity(1) . . . . . . . . . . . . . . . . . . . . . . . . . . . . . . 29,973 213,504 — 71,647 315,124
Total segments . . . . . . . . . . . . . . . . . . . . . . . . . 94,001 213,504 142,767 199,181 649,453
Corporate . . . . . . . . . . . . . . . . . . . . . . . . . . . . . . . . . 17,385 — — 68,686 86,071
Total Company . . . . . . . . . . . . . . . . . . . . . . . . . $111,386 $213,504 $142,767 $267,867 $735,524
(1) See “—Travelocity Working Capital” below.
Travel Network exhibits seasonal fluctuations in transaction volumes and working capital. Transactions areweighted towards the first nine months of the year, resulting in receivables growth outpacing payables anddriving negative cash flows related to working capital. Transactions decrease significantly each year in the fourthquarter, primarily in December. We record a receivable at the date of booking and, because customers generallybook their November and December holiday leisure-related travel earlier in the year and business-related travelalso declines during the holiday season, receivables are typically lower in the fourth quarter. This results inreceivables declining faster than payables and positive cash flows related to working capital during the fourthquarter.
109
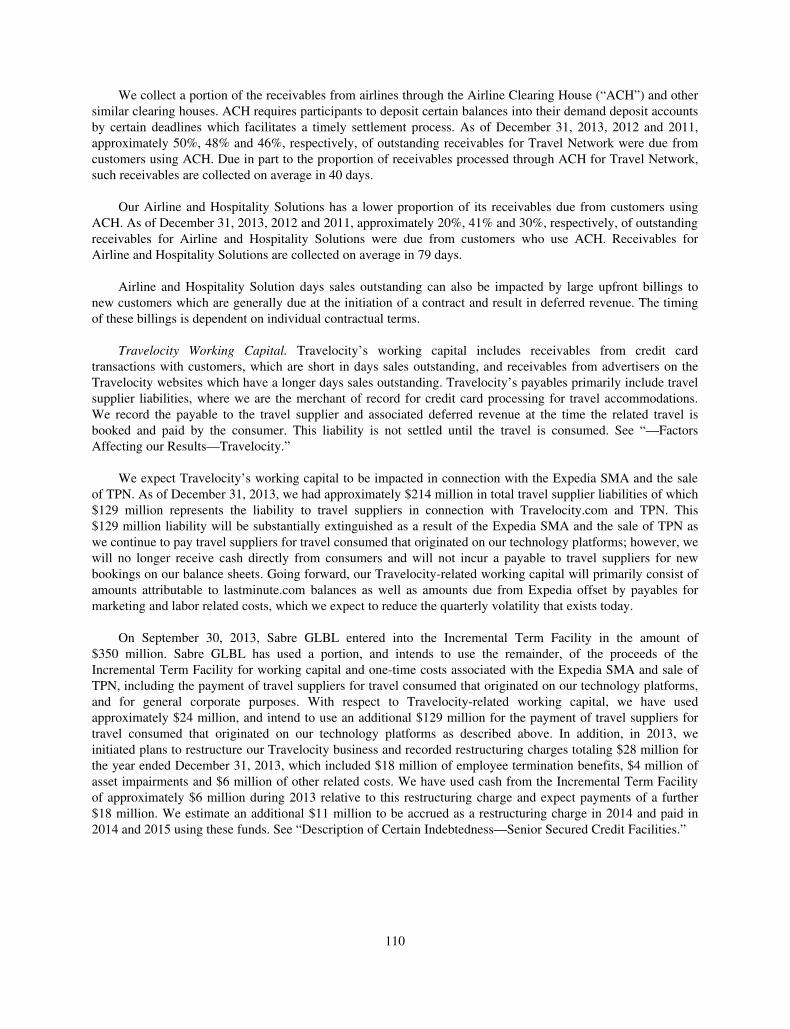
We collect a portion of the receivables from airlines through the Airline Clearing House (“ACH”) and othersimilar clearing houses. ACH requires participants to deposit certain balances into their demand deposit accountsby certain deadlines which facilitates a timely settlement process. As of December 31, 2013, 2012 and 2011,approximately 50%, 48% and 46%, respectively, of outstanding receivables for Travel Network were due fromcustomers using ACH. Due in part to the proportion of receivables processed through ACH for Travel Network,such receivables are collected on average in 40 days.
Our Airline and Hospitality Solutions has a lower proportion of its receivables due from customers usingACH. As of December 31, 2013, 2012 and 2011, approximately 20%, 41% and 30%, respectively, of outstandingreceivables for Airline and Hospitality Solutions were due from customers who use ACH. Receivables forAirline and Hospitality Solutions are collected on average in 79 days.
Airline and Hospitality Solution days sales outstanding can also be impacted by large upfront billings tonew customers which are generally due at the initiation of a contract and result in deferred revenue. The timingof these billings is dependent on individual contractual terms.
Travelocity Working Capital. Travelocity’s working capital includes receivables from credit cardtransactions with customers, which are short in days sales outstanding, and receivables from advertisers on theTravelocity websites which have a longer days sales outstanding. Travelocity’s payables primarily include travelsupplier liabilities, where we are the merchant of record for credit card processing for travel accommodations.We record the payable to the travel supplier and associated deferred revenue at the time the related travel isbooked and paid by the consumer. This liability is not settled until the travel is consumed. See “—FactorsAffecting our Results—Travelocity.”
We expect Travelocity’s working capital to be impacted in connection with the Expedia SMA and the saleof TPN. As of December 31, 2013, we had approximately $214 million in total travel supplier liabilities of which$129 million represents the liability to travel suppliers in connection with Travelocity.com and TPN. This$129 million liability will be substantially extinguished as a result of the Expedia SMA and the sale of TPN aswe continue to pay travel suppliers for travel consumed that originated on our technology platforms; however, wewill no longer receive cash directly from consumers and will not incur a payable to travel suppliers for newbookings on our balance sheets. Going forward, our Travelocity-related working capital will primarily consist ofamounts attributable to lastminute.com balances as well as amounts due from Expedia offset by payables formarketing and labor related costs, which we expect to reduce the quarterly volatility that exists today.
On September 30, 2013, Sabre GLBL entered into the Incremental Term Facility in the amount of$350 million. Sabre GLBL has used a portion, and intends to use the remainder, of the proceeds of theIncremental Term Facility for working capital and one-time costs associated with the Expedia SMA and sale ofTPN, including the payment of travel suppliers for travel consumed that originated on our technology platforms,and for general corporate purposes. With respect to Travelocity-related working capital, we have usedapproximately $24 million, and intend to use an additional $129 million for the payment of travel suppliers fortravel consumed that originated on our technology platforms as described above. In addition, in 2013, weinitiated plans to restructure our Travelocity business and recorded restructuring charges totaling $28 million forthe year ended December 31, 2013, which included $18 million of employee termination benefits, $4 million ofasset impairments and $6 million of other related costs. We have used cash from the Incremental Term Facilityof approximately $6 million during 2013 relative to this restructuring charge and expect payments of a further$18 million. We estimate an additional $11 million to be accrued as a restructuring charge in 2014 and paid in2014 and 2015 using these funds. See “Description of Certain Indebtedness—Senior Secured Credit Facilities.”
110

The table below, which is derived from our consolidated statements of cash flows, shows the changes in ouroperating assets and liabilities during the years ended December 31, 2013, 2012 and 2011. For a detaileddiscussion of these changes, see “—Operating Activities” below.
Year Ended December 31,
2013 2012 2011
(Amounts in thousands)
Accounts and other receivables . . . . . . . . . . . . . . . . . . . . . . . . . . . . . . . . $ (29,150) $ (2,691) $(49,220)Prepaid expenses and other current assets . . . . . . . . . . . . . . . . . . . . . . . . (4,480) (3,374) 8,680Capitalized implementation costs . . . . . . . . . . . . . . . . . . . . . . . . . . . . . . (58,814) (78,543) (59,109)Other assets . . . . . . . . . . . . . . . . . . . . . . . . . . . . . . . . . . . . . . . . . . . . . . . (64,259) (8,704) (52,817)Accounts payable and other accrued liabilities . . . . . . . . . . . . . . . . . . . . (31,064) 13,022 93,735Pensions and other postretirement benefits . . . . . . . . . . . . . . . . . . . . . . . (2,579) (20,236) (9,306)
Changes in operating assets and liabilities . . . . . . . . . . . . . . . . . . . . . . $(190,346) $(100,526) $(68,037)
Capital Expenditures and Development Projects
Our Adjusted Capital Expenditures for the years ended December 31, 2013, 2012 and 2011 were as follows:
Year Ended December 31,
2013 2012 2011
(Amounts in thousands)
Additions to property and equipment . . . . . . . . . . . . . . . . . . . . . . . . . . . . . . . . . $226,026 $193,262 $164,638Capitalized implementation costs . . . . . . . . . . . . . . . . . . . . . . . . . . . . . . . . . . . 58,814 78,543 59,109
Adjusted Capital Expenditures . . . . . . . . . . . . . . . . . . . . . . . . . . . . . . $284,840 $271,805 $223,747
As a percentage of revenue:Additions to property and equipment . . . . . . . . . . . . . . . . . . . . . . . . . . . . . 7.4% 6.5% 5.8%Capitalized implementation costs . . . . . . . . . . . . . . . . . . . . . . . . . . . . . . . 1.9% 2.6% 2.1%
Adjusted Capital Expenditures . . . . . . . . . . . . . . . . . . . . . . . . . . . . . . 9.3% 9.1% 7.8%
Capitalized costs associated with software developed for internal use represent a significant portion ofadditions to property and equipment, as we have focused our development resources on developing andenhancing our GDS and our SaaS and hosted systems. Software developed for internal use includes costsincurred to develop or obtain applications, infrastructure and graphics development for our GDS, our SaaS andhosted systems and our websites. Capitalized implementation costs are upfront costs we incur related to theimplementation of new customer contracts under our SaaS and hosted revenue model. In our financialstatements, additions to property and equipment are included in Cash flows from investing activities whileCapitalized implementation costs are included in Cash flows from operating activities. Development-relatedcosts that were expensed as incurred totaled $284 million, $258 million and $250 million for the years endedDecember 31, 2013, 2012 and 2011, respectively. Research and development costs approximated $6 million, $4million and $3 million for the years ended December 31, 2013, 2012 and 2011, respectively. See Note 2,Summary of Significant Accounting Policies, to our audited consolidated financial statements included elsewherein this prospectus.
Undistributed Earnings from Foreign Subsidiaries
We consider the undistributed earnings of our foreign subsidiaries as of December 31, 2013 to beindefinitely reinvested and, accordingly, no U.S. income taxes have been provided thereon. As of December 31,2013, the amount of indefinitely reinvested foreign earnings was approximately $157 million. As ofDecember 31, 2013, $70.8 million of cash, cash equivalents, and marketable securities were held by our foreign
111
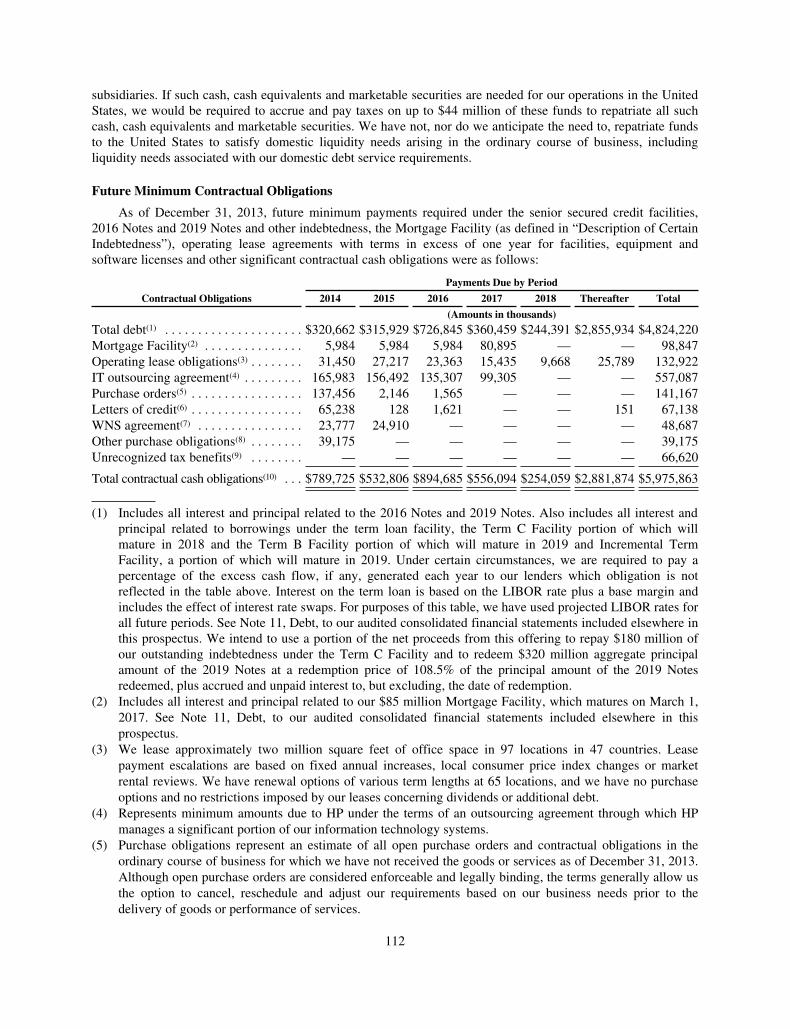
subsidiaries. If such cash, cash equivalents and marketable securities are needed for our operations in the UnitedStates, we would be required to accrue and pay taxes on up to $44 million of these funds to repatriate all suchcash, cash equivalents and marketable securities. We have not, nor do we anticipate the need to, repatriate fundsto the United States to satisfy domestic liquidity needs arising in the ordinary course of business, includingliquidity needs associated with our domestic debt service requirements.
Future Minimum Contractual Obligations
As of December 31, 2013, future minimum payments required under the senior secured credit facilities,2016 Notes and 2019 Notes and other indebtedness, the Mortgage Facility (as defined in “Description of CertainIndebtedness”), operating lease agreements with terms in excess of one year for facilities, equipment andsoftware licenses and other significant contractual cash obligations were as follows:
Payments Due by Period
Contractual Obligations 2014 2015 2016 2017 2018 Thereafter Total
(Amounts in thousands)
Total debt(1) . . . . . . . . . . . . . . . . . . . . . $320,662 $315,929 $726,845 $360,459 $244,391 $2,855,934 $4,824,220Mortgage Facility(2) . . . . . . . . . . . . . . . 5,984 5,984 5,984 80,895 — — 98,847Operating lease obligations(3) . . . . . . . . 31,450 27,217 23,363 15,435 9,668 25,789 132,922IT outsourcing agreement(4) . . . . . . . . . 165,983 156,492 135,307 99,305 — — 557,087Purchase orders(5) . . . . . . . . . . . . . . . . . 137,456 2,146 1,565 — — — 141,167Letters of credit(6) . . . . . . . . . . . . . . . . . 65,238 128 1,621 — — 151 67,138WNS agreement(7) . . . . . . . . . . . . . . . . 23,777 24,910 — — — — 48,687Other purchase obligations(8) . . . . . . . . 39,175 — — — — — 39,175Unrecognized tax benefits(9) . . . . . . . . — — — — — — 66,620
Total contractual cash obligations(10) . . . $789,725 $532,806 $894,685 $556,094 $254,059 $2,881,874 $5,975,863
(1) Includes all interest and principal related to the 2016 Notes and 2019 Notes. Also includes all interest andprincipal related to borrowings under the term loan facility, the Term C Facility portion of which willmature in 2018 and the Term B Facility portion of which will mature in 2019 and Incremental TermFacility, a portion of which will mature in 2019. Under certain circumstances, we are required to pay apercentage of the excess cash flow, if any, generated each year to our lenders which obligation is notreflected in the table above. Interest on the term loan is based on the LIBOR rate plus a base margin andincludes the effect of interest rate swaps. For purposes of this table, we have used projected LIBOR rates forall future periods. See Note 11, Debt, to our audited consolidated financial statements included elsewhere inthis prospectus. We intend to use a portion of the net proceeds from this offering to repay $180 million ofour outstanding indebtedness under the Term C Facility and to redeem $320 million aggregate principalamount of the 2019 Notes at a redemption price of 108.5% of the principal amount of the 2019 Notesredeemed, plus accrued and unpaid interest to, but excluding, the date of redemption.
(2) Includes all interest and principal related to our $85 million Mortgage Facility, which matures on March 1,2017. See Note 11, Debt, to our audited consolidated financial statements included elsewhere in thisprospectus.
(3) We lease approximately two million square feet of office space in 97 locations in 47 countries. Leasepayment escalations are based on fixed annual increases, local consumer price index changes or marketrental reviews. We have renewal options of various term lengths at 65 locations, and we have no purchaseoptions and no restrictions imposed by our leases concerning dividends or additional debt.
(4) Represents minimum amounts due to HP under the terms of an outsourcing agreement through which HPmanages a significant portion of our information technology systems.
(5) Purchase obligations represent an estimate of all open purchase orders and contractual obligations in theordinary course of business for which we have not received the goods or services as of December 31, 2013.Although open purchase orders are considered enforceable and legally binding, the terms generally allow usthe option to cancel, reschedule and adjust our requirements based on our business needs prior to thedelivery of goods or performance of services.
112
(6) Our letters of credit consist of stand-by letters of credit, underwritten by a group of lenders, which weprimarily issue for certain regulatory purposes as well as to certain hotel properties to secure our paymentfor hotel room transactions. The contractual expiration dates of these letters of credit are shown in the tableabove. There were no claims made against any stand-by letters of credit during the years endedDecember 31, 2013, 2012 and 2011.
(7) Represents expected payments to WNS Global Services, an entity to which we outsource a portion of ourTravelocity contact center operations and back-office fulfillment though 2015. The expected payments arebased upon current and historical transactions. We anticipate the 2015 volumes will be reduced as a result ofour agreement with Expedia.
(8) Consists primarily of minimum payments due under various marketing agreements, management servicesmonitoring fees and media strategy, planning and placement agreements.
(9) Unrecognized tax benefits include associated interest and penalties. The timing of related cash payments forsubstantially all of these liabilities is inherently uncertain because the ultimate amount and timing of suchliabilities is affected by factors which are variable and outside our control.
(10) Excludes pension obligations (see Note 9, Pension and Other Postretirement Benefit Plans, to our auditedconsolidated financial statements included elsewhere in this prospectus), the Redemption and payments tothe Existing Stockholders under the TRA.
Cash Investments
We consider cash equivalents to be highly liquid investments that are readily convertible into cash.Securities with contractual maturities of three months or less, when purchased, are considered cash equivalents.We record changes in a book overdraft position, in which our bank account is not overdrawn but recently issuedand outstanding checks result in a negative general ledger balance, as cash flows from financing activities.
We invest in a money market fund which is classified as cash and cash equivalents in our consolidatedbalance sheets and statements of cash flows.
We held no short-term investments as of December 31, 2013, 2012 and 2011.
113
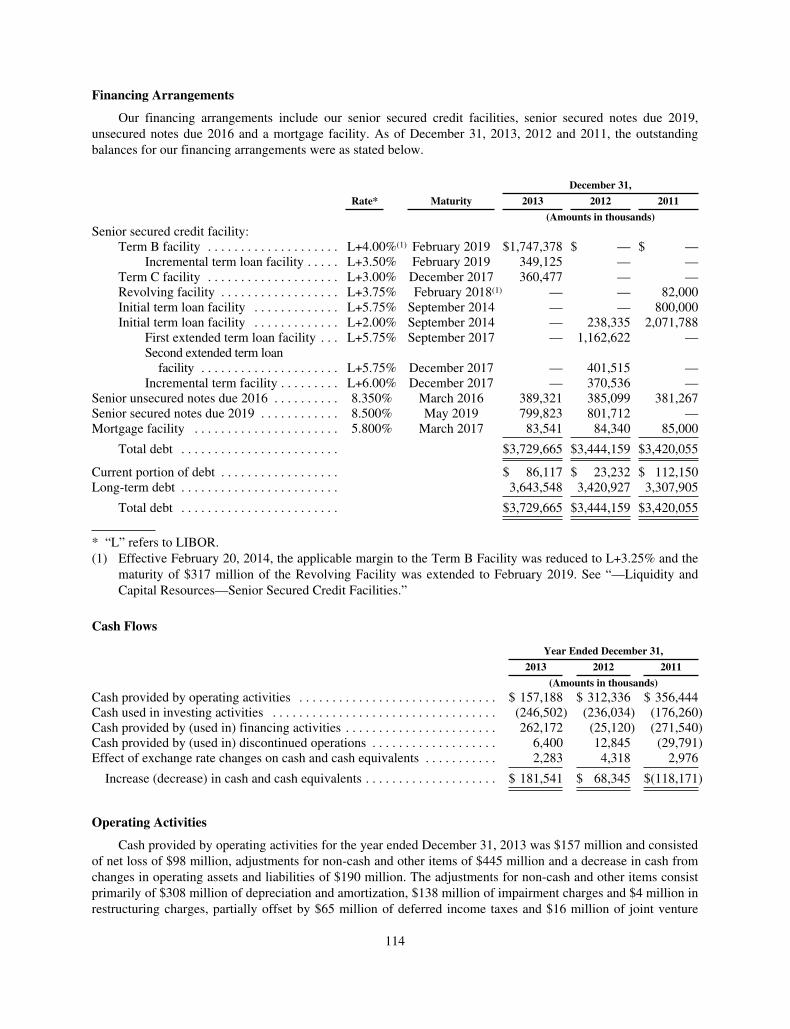
Financing Arrangements
Our financing arrangements include our senior secured credit facilities, senior secured notes due 2019,unsecured notes due 2016 and a mortgage facility. As of December 31, 2013, 2012 and 2011, the outstandingbalances for our financing arrangements were as stated below.
December 31,
Rate* Maturity 2013 2012 2011
(Amounts in thousands)Senior secured credit facility:
Term B facility . . . . . . . . . . . . . . . . . . . . L+4.00%(1) February 2019 $1,747,378 $ — $ —Incremental term loan facility . . . . . L+3.50% February 2019 349,125 — —
Term C facility . . . . . . . . . . . . . . . . . . . . L+3.00% December 2017 360,477 — —Revolving facility . . . . . . . . . . . . . . . . . . L+3.75% February 2018(1) — — 82,000Initial term loan facility . . . . . . . . . . . . . L+5.75% September 2014 — — 800,000Initial term loan facility . . . . . . . . . . . . . L+2.00% September 2014 — 238,335 2,071,788
First extended term loan facility . . . L+5.75% September 2017 — 1,162,622 —Second extended term loanfacility . . . . . . . . . . . . . . . . . . . . . L+5.75% December 2017 — 401,515 —
Incremental term facility . . . . . . . . . L+6.00% December 2017 — 370,536 —Senior unsecured notes due 2016 . . . . . . . . . . 8.350% March 2016 389,321 385,099 381,267Senior secured notes due 2019 . . . . . . . . . . . . 8.500% May 2019 799,823 801,712 —Mortgage facility . . . . . . . . . . . . . . . . . . . . . . 5.800% March 2017 83,541 84,340 85,000
Total debt . . . . . . . . . . . . . . . . . . . . . . . . $3,729,665 $3,444,159 $3,420,055
Current portion of debt . . . . . . . . . . . . . . . . . . $ 86,117 $ 23,232 $ 112,150Long-term debt . . . . . . . . . . . . . . . . . . . . . . . . 3,643,548 3,420,927 3,307,905
Total debt . . . . . . . . . . . . . . . . . . . . . . . . $3,729,665 $3,444,159 $3,420,055
* “L” refers to LIBOR.(1) Effective February 20, 2014, the applicable margin to the Term B Facility was reduced to L+3.25% and the
maturity of $317 million of the Revolving Facility was extended to February 2019. See “—Liquidity andCapital Resources—Senior Secured Credit Facilities.”
Cash Flows
Year Ended December 31,
2013 2012 2011
(Amounts in thousands)Cash provided by operating activities . . . . . . . . . . . . . . . . . . . . . . . . . . . . . . $ 157,188 $ 312,336 $ 356,444Cash used in investing activities . . . . . . . . . . . . . . . . . . . . . . . . . . . . . . . . . . (246,502) (236,034) (176,260)Cash provided by (used in) financing activities . . . . . . . . . . . . . . . . . . . . . . . 262,172 (25,120) (271,540)Cash provided by (used in) discontinued operations . . . . . . . . . . . . . . . . . . . 6,400 12,845 (29,791)Effect of exchange rate changes on cash and cash equivalents . . . . . . . . . . . 2,283 4,318 2,976
Increase (decrease) in cash and cash equivalents . . . . . . . . . . . . . . . . . . . . $ 181,541 $ 68,345 $(118,171)
Operating Activities
Cash provided by operating activities for the year ended December 31, 2013 was $157 million and consistedof net loss of $98 million, adjustments for non-cash and other items of $445 million and a decrease in cash fromchanges in operating assets and liabilities of $190 million. The adjustments for non-cash and other items consistprimarily of $308 million of depreciation and amortization, $138 million of impairment charges and $4 million inrestructuring charges, partially offset by $65 million of deferred income taxes and $16 million of joint venture
114
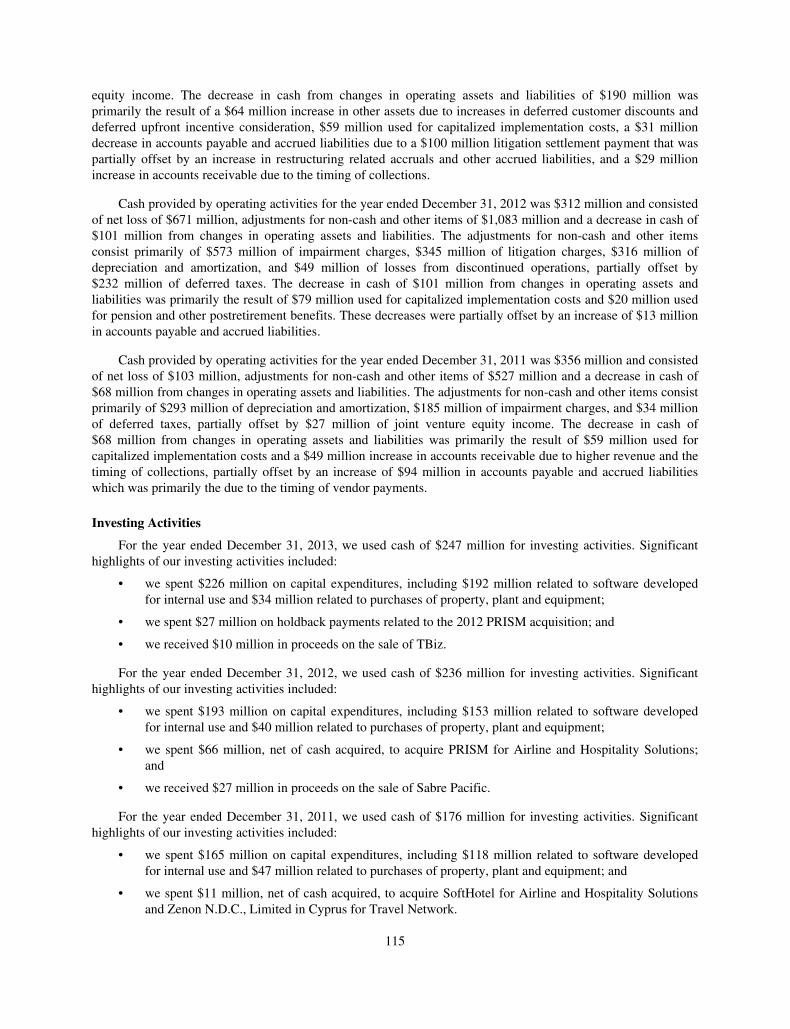
equity income. The decrease in cash from changes in operating assets and liabilities of $190 million wasprimarily the result of a $64 million increase in other assets due to increases in deferred customer discounts anddeferred upfront incentive consideration, $59 million used for capitalized implementation costs, a $31 milliondecrease in accounts payable and accrued liabilities due to a $100 million litigation settlement payment that waspartially offset by an increase in restructuring related accruals and other accrued liabilities, and a $29 millionincrease in accounts receivable due to the timing of collections.
Cash provided by operating activities for the year ended December 31, 2012 was $312 million and consistedof net loss of $671 million, adjustments for non-cash and other items of $1,083 million and a decrease in cash of$101 million from changes in operating assets and liabilities. The adjustments for non-cash and other itemsconsist primarily of $573 million of impairment charges, $345 million of litigation charges, $316 million ofdepreciation and amortization, and $49 million of losses from discontinued operations, partially offset by$232 million of deferred taxes. The decrease in cash of $101 million from changes in operating assets andliabilities was primarily the result of $79 million used for capitalized implementation costs and $20 million usedfor pension and other postretirement benefits. These decreases were partially offset by an increase of $13 millionin accounts payable and accrued liabilities.
Cash provided by operating activities for the year ended December 31, 2011 was $356 million and consistedof net loss of $103 million, adjustments for non-cash and other items of $527 million and a decrease in cash of$68 million from changes in operating assets and liabilities. The adjustments for non-cash and other items consistprimarily of $293 million of depreciation and amortization, $185 million of impairment charges, and $34 millionof deferred taxes, partially offset by $27 million of joint venture equity income. The decrease in cash of$68 million from changes in operating assets and liabilities was primarily the result of $59 million used forcapitalized implementation costs and a $49 million increase in accounts receivable due to higher revenue and thetiming of collections, partially offset by an increase of $94 million in accounts payable and accrued liabilitieswhich was primarily the due to the timing of vendor payments.
Investing Activities
For the year ended December 31, 2013, we used cash of $247 million for investing activities. Significanthighlights of our investing activities included:
• we spent $226 million on capital expenditures, including $192 million related to software developedfor internal use and $34 million related to purchases of property, plant and equipment;
• we spent $27 million on holdback payments related to the 2012 PRISM acquisition; and
• we received $10 million in proceeds on the sale of TBiz.
For the year ended December 31, 2012, we used cash of $236 million for investing activities. Significanthighlights of our investing activities included:
• we spent $193 million on capital expenditures, including $153 million related to software developedfor internal use and $40 million related to purchases of property, plant and equipment;
• we spent $66 million, net of cash acquired, to acquire PRISM for Airline and Hospitality Solutions;and
• we received $27 million in proceeds on the sale of Sabre Pacific.
For the year ended December 31, 2011, we used cash of $176 million for investing activities. Significanthighlights of our investing activities included:
• we spent $165 million on capital expenditures, including $118 million related to software developedfor internal use and $47 million related to purchases of property, plant and equipment; and
• we spent $11 million, net of cash acquired, to acquire SoftHotel for Airline and Hospitality Solutionsand Zenon N.D.C., Limited in Cyprus for Travel Network.
115
Financing Activities
Immediately prior to the completion of this offer, we will enter into the TRA, which provides the right toreceive future payments from us to our Existing Stockholders of 85% of the amount of cash savings, if any, inU.S. federal income tax that we realize (or are deemed to realize in the case of a change of control or certainother transactions) as a result of the utilization of our and our subsidiaries’ Pre-IPO Tax Assets. Based on currenttax law and assuming that we and our subsidiaries earn sufficient taxable income to realize the full tax benefitssubject to the TRA, (i) we expect that future payments under the TRA related to the Pre-IPO Tax Assets couldaggregate to between $330 million and $380 million over the next six years (assuming no changes in currentlimitations on our ability to utilize our NOLs under Section 382 of the Code), which we estimate will representapproximately 85% to 95% of the total payments we will be required to make under the TRA and (ii) we do notexpect material payments to occur before 2016. Upon the effective date of the TRA, we expect to recognize aliability of between $310 million and $350 million (after considering the valuation allowance of approximately$72 million recorded against the Pre-IPO Tax Assets) for the payments to be made under the TRA, which will beaccounted for as a reduction of additional paid-in capital on our consolidated balance sheet.
Different timing rules will apply to payments under the TRA to be made to Award Holders. Such paymentswill generally be deemed invested in a notional account rather than made on the scheduled payment dates, andthe account will be distributed on the fifth anniversary of the initial public offering, together with an amountequal to the net present value of such Award Holder’s future expected payments, if any, under the TRA.Moreover, payments to holders of stock options that are unvested prior to the completion of this offering will besubject to vesting on the same schedule as such holder’s unvested stock options.
For the year ended December 31, 2013, we had a $262 million cash inflow for financing activities.Significant highlights of our financing activities included:
• we raised $2,190 million through the issuance of the Term B Facility and Term C Facility loans;
• we raised $350 million through the issuance of the Incremental Term Facility;
• we utilized $2,178 million of the Term B Facility and Term C Facility proceeds to pay down the initial,extended and incremental term loans;
• we incurred $19 million in debt issuance and third-party debt modification costs; and
• we paid down $82 million of the term loan outstanding as part of quarterly mandatory prepayments.
For the year ended December 31, 2012, we used $25 million for financing activities. Significant highlightsof our financing activities included:
• on a net basis, we repaid $82 million under the Revolving Facility;
• we raised $400 million through the issuance of 8.5% senior secured notes due in 2019 and utilized$272 million of the proceeds to pay down a portion of the extended term loan;
• we paid off $15 million of the term loan outstanding as part of quarterly mandatory prepayments overthe first half of 2012;
• we paid down $773 million of our Initial Term Loan maturing 2014 through the issuance of$375 million Incremental Term Loan maturing 2017 and $400 million of 8.5% senior secured notesdue 2019;
• we paid $43 million for debt modification costs; and
• we made a $6 million payment on outstanding term loans.
For the year ended December 31, 2011, we used $272 million for financing activities. We paid down$324 million of principal on our unsecured notes which matured on August 1, 2011, we repaid $30 million underthe senior secured notes and on a net basis, and we borrowed $82 million under the Revolving Facility.
116

Off Balance Sheet Arrangements
We had no off balance sheet arrangements during the years ended December 31, 2013, 2012 and 2011.
Recent Accounting Pronouncements
In February 2013, the Financial Accounting Standards Board (“FASB”) issued guidance regarding thereporting of amounts reclassified out of accumulated other comprehensive income (“OCI”) to net income. Thestandard requires companies to disclose the individual income statement line items in which the accumulatedother comprehensive income amounts have been reclassified. Additionally, a tabular reconciliation of amountsrecorded to other comprehensive income for the period is required. We have incorporated the new disclosureguidance on the reclassification of accumulated other comprehensive income into the footnotes to ourconsolidated financial statements.
In January 2013, the FASB issued updated guidance on when it is appropriate to reclassify currencytranslation adjustments (“CTA”) into earnings. This guidance is intended to reduce the diversity in practice inaccounting for CTA when an entity ceases to have a controlling interest in a subsidiary group or group of assetsthat is a business within a foreign entity and when there is a loss of a controlling financial interest in a foreignentity or a step acquisition. The standard is effective for annual and interim reporting periods for fiscal yearsbeginning after December 15, 2013. We do not believe that the adoption will have a material impact on ourconsolidated financial statements.
In December 2011, the FASB issued guidance enhancing the disclosure requirements about the nature of anentity’s right to offset and related arrangements associated with its financial and derivative instruments. The newguidance requires the disclosure of the gross amounts subject to rights of set-off, amounts offset in accordancewith the accounting standards followed, and related net exposure. In January 2013, the FASB issued revisedguidance clarifying that the scope of this guidance applies to derivatives, including bifurcated embeddedderivatives, repurchase agreements and reverse repurchase agreements, and securities borrowing and lendingtransactions that are either offset or subject to an enforceable master netting arrangement, or similar arrangement.Our adoption of this guidance did not have a material impact on our consolidated financial statements.
Critical Accounting Policies
This discussion and analysis of our financial condition and results of operations is based on our consolidatedfinancial statements, which have been prepared in accordance with GAAP. The preparation of these financialstatements requires us to make estimates and judgments that affect our reported assets and liabilities, revenuesand expenses and other financial information. Actual results may differ significantly from these estimates, andour reported financial condition and results of operations could vary under different assumptions and conditions.In addition, our reported financial condition and results of operations could vary due to a change in theapplication of a particular accounting standard.
Our accounting policies that include significant estimates and assumptions include: (i) estimation of therevenue recognition for software development, (ii) collectability of accounts receivable, (iii) amounts for futurecancellations of bookings processed through our GDS, (iv) determination of the fair value of assets and liabilitiesacquired in a business combination, (v) determination of the fair value of derivatives, (vi) determination of thefair value of our stock and related stock compensation expense, (vii) the evaluation of the recoverability of thecarrying value of intangible assets and goodwill, (viii) assumptions utilized in the determination of pension andother postretirement benefit liabilities, (ix) assumptions made in the calculation of restructuring liabilities and(x) the evaluation of uncertainties surrounding the calculation of our tax assets and liabilities. We regard anaccounting estimate underlying our financial statements as a “critical accounting estimate” if the accountingestimate requires us to make assumptions about matters that are uncertain at the time of estimation and if changesin the estimate are reasonably likely to occur and could have a material effect on the presentation of financialcondition, changes in financial condition, or results of operations.
117
We have included below a discussion of the accounting policies involving material estimates and assumptionsthat we believe are most critical to the preparation of our financial statements, how we apply such policies and howresults differing from our estimates and assumptions would affect the amounts presented in our financial statements.We have discussed the development, selection and disclosure of these accounting policies with our audit committee.Although we believe these policies to be the most critical, other accounting policies also have a significant effect onour financial statements and certain of these policies also require the use of estimates and assumptions. For furtherinformation about our significant accounting policies, see Note 2, Summary of Significant Accounting Policies, toour audited consolidated financial statements included elsewhere in this prospectus.
SaaS and Hosted Revenue Model
Our revenue recognition for Airline and Hospitality Solutions includes SaaS and hosted transactions whichare sometimes sold as part of agreements which also require us to provide consulting and implementationservices. Due to the multiple element arrangement, revenue recognition sometimes involves judgment, includingestimates of the selling prices of goods and services, assessments of the likelihood of nonpayment and estimatesof total costs and costs to complete a project.
The consulting and implementation services are generally performed in the early stages of the agreements.We evaluate revenue recognition for agreements with customers which generally are represented by individualcontracts but could include groups of contracts if the contracts are executed at or near the same time. Typically,our consulting services are separated from the implementation and software hosting services. We account forseparable elements on an individual basis with value assigned to each element based on its relative selling price.A comprehensive market analysis is performed on an annual basis to determine the range of selling prices foreach product and service. In making these judgments we analyze various factors, including competitivelandscapes, value differentiators, continuous monitoring of market prices, customer segmentation and overallmarket and economic conditions. Based on these results, estimated selling prices are set for each product andservice delivered to customers. Changes in judgments related to these items, or deterioration in industry orgeneral economic conditions, could materially impact the timing and amount of revenue and costs recognized.The revenue for consulting services is generally recognized as the services are performed, and the revenue for theimplementation and the SaaS and hosted services is recognized ratably over the term of the agreement.
Accounts Receivable and Air Booking Cancellation Reserve
We evaluate the collectability of our accounts receivable based on a combination of factors. Incircumstances where we are aware of a specific customer’s inability to meet its financial obligations to us (e.g.,bankruptcy filings, failure to pay amounts due to us or others), we record a specific reserve for bad debts againstamounts due to reduce the net recorded receivable to the amount we reasonably believe will be collected. For allother customers, we record reserves for bad debts based on past write-off history (average percentage ofreceivables written off historically) and the length of time the receivables are past due.
Transaction revenue for airline travel reservations is recognized by Travel Network at the time of thebooking of the reservation, net of estimated future cancellations. Cancellations prior to the day of departure areestimated based on the historical level of cancellations rates, adjusted to take into account any recent factorswhich could cause a change in those rates. In circumstances where expected cancellation rates or bookingbehavior changes, our estimates are revised, and in these circumstances, future cancellation rates could varymaterially, with a corresponding variation in revenue net of estimated future cancellations. Factors that couldhave a significant effect on our estimates include global security issues, epidemics or pandemics, naturaldisasters, general economic conditions, the financial condition of travel suppliers, and travel related accidents.
Business Combinations
Authoritative guidance for business combinations requires us to recognize separately from goodwill theassets acquired and the liabilities assumed at their acquisition date fair values. Goodwill as of the acquisition date
118
is measured as the excess of consideration transferred over the net of the acquisition date fair values of the assetsacquired and the liabilities assumed. While we use our best estimates and assumptions to accurately value assetsacquired and liabilities assumed at the acquisition date as well as contingent consideration, where applicable, ourestimates are inherently uncertain and, as a result, actual results may differ from estimates.
Accounting for business combinations requires our management to make significant estimates andassumptions, especially at the acquisition date including our estimates for intangible assets, contractualobligations assumed, pre-acquisition contingencies and contingent consideration, where applicable. Although webelieve the assumptions and estimates we have made in the past have been reasonable and appropriate, they arebased in part on historical experience and information obtained from the management of the acquired companiesand are inherently uncertain.
Examples of critical estimates in valuing certain of the intangible assets we have acquired include, but arenot limited to: future expected cash flows from software sales through the SaaS model, support agreements,consulting contracts, other customer contracts, acquired developed technologies and patents; the acquiredcompany’s brand and competitive position, as well as assumptions about the period of time the acquired brandwill continue to be used in the combined company’s product portfolio; and discount rates. Unanticipated eventsand circumstances may occur that may affect the accuracy or validity of such assumptions, estimates or actualresults.
For a given acquisition, we may identify certain pre-acquisition contingencies as of the acquisition date andmay extend our review and evaluation of these pre-acquisition contingencies throughout the measurement periodin order to obtain sufficient information to assess whether we include these contingencies as a part of the fairvalue estimates of assets acquired and liabilities assumed and, if so, to determine their estimated amounts. If wecannot reasonably determine the fair value of a pre-acquisition contingency (non-income tax related) by the endof the measurement period, which is generally the case given the nature of such matters, we will recognize anasset or a liability for such pre-acquisition contingency if: (i) it is probable that an asset existed or a liability hadbeen incurred at the acquisition date and (ii) the amount of the asset or liability can be reasonably estimated.Subsequent to the measurement period, changes in our estimates of such contingencies will affect earnings andcould have a material effect on our results of operations and financial position.
Depending on the circumstances, the fair value of contingent consideration is determined based onmanagement’s best estimate of fair value given the specific facts and circumstances of the contractualarrangement, considering the likelihood of payment, payment terms and management’s best estimates of futureperformance results on the acquisition date, if applicable.
In addition, uncertain tax positions and tax related valuation allowances assumed in connection with abusiness combination are initially estimated as of the acquisition date. We reevaluate these items quarterly basedupon facts and circumstances that existed as of the acquisition date with any adjustments to our preliminaryestimates being recorded to goodwill if identified within the measurement period. Subsequent to themeasurement period or our final determination of the tax allowance’s or contingency’s estimated value,whichever comes first, changes to these uncertain tax positions and tax-related valuation allowances will affectour provision for income taxes in our consolidated statement of operations and could have a material impact onour results of operations and financial position.
Goodwill and Long-Lived Assets
We evaluate goodwill for impairment on an annual basis or when impairment indicators exist. We begin ourevaluation with a qualitative assessment of whether it is more likely than not that a reporting unit’s fair value isless than its carrying value before applying the two-step goodwill impairment model described below. If it isdetermined through the qualitative assessment that a reporting unit’s fair value is more likely than not greaterthan its carrying value, the remaining impairment steps are unnecessary. Otherwise, we perform a comparison ofthe estimated fair value of the reporting unit to which the goodwill has been assigned to the sum of the carrying
119

value of the assets and liabilities of that unit. If the sum of the carrying value of the assets and liabilities of areporting unit exceeds the estimated fair value of that reporting unit, the carrying value of the reporting unit’sgoodwill is reduced to its implied fair value through an adjustment to the goodwill balance, resulting in animpairment charge. Goodwill was assigned to each reporting unit based on that reporting unit’s percentage ofenterprise value as of the date of the acquisition of Sabre Corporation (formerly known as Sovereign Holdings,Inc.) by TPG and Silver Lake plus goodwill associated with acquisitions since that time. We have identified sixreporting units which include Travelocity—North America, Travelocity—Europe, Travelocity—Asia Pacific,Travel Network, Airline Solutions and Hospitality Solutions. The Travelocity—Asia Pacific reporting unit wassold in 2012.
The fair values used in our evaluation are estimated using a combined approach based upon discountedfuture cash flow projections and observed market multiples for comparable businesses. The cash flow projectionsare based upon a number of assumptions, including risk-adjusted discount rates, future booking and transactionvolume levels, future price levels, rates of growth in our consumer and corporate direct booking businesses andrates of increase in operating expenses, cost of revenue and taxes. Additionally, in accordance with authoritativeguidance on fair value measurements, we made a number of assumptions, including assumptions related tomarket participants, the principal markets and highest and best use of the reporting units. We have recognizedgoodwill impairment charges of $136 million, $129 million, and $185 million for the years ended December 31,2013, 2012 and 2011, respectively. The goodwill impairment charges were associated with Travelocity which hasno remaining goodwill as of December 31, 2013. Goodwill related to our other reporting units was$2,138 million as of December 31, 2013. Changes in the assumptions used in our impairment testing may resultin future impairment losses which could have a material impact on our results of operations. A change of 10% inthe future cash flow projections, risk-adjusted discount rates, and rates of growth used in our fair valuecalculations would not result in impairment of the remaining goodwill for any of our reporting units.
Definite-lived intangible assets are assigned depreciable lives of four to thirty years, depending on classification,and are evaluated for impairment whenever events or changes in circumstances indicate that the carrying amount ofdefinite-lived intangible assets used in combination to generate cash flows largely independent of other assets may notbe recoverable. If impairment indicators exist for definite-lived intangible assets, the undiscounted future cash flowsassociated with the expected service potential of the assets are compared to the carrying value of the assets. If ourprojection of undiscounted future cash flows is in excess of the carrying value of the intangible assets, no impairmentcharge is recorded. If our projection of undiscounted cash flows is less than the carrying value of the intangible assets,an impairment charge is recorded to reduce the intangible assets to fair value. We also evaluate the need for additionalimpairment disclosures based on our Level 3 inputs. For fair value measurements categorized within Level 3 of the fairvalue hierarchy, we disclose the valuation processes used by the reporting entity.
The most significant assumptions used in the discounted cash flows calculation to determine the fair valueof our reporting units in connection with impairment testing include: (i) the discount rate, (ii) the expected long-term growth rate and (iii) annual cash flow projections. See Note 13, Fair Value Measurements, to our auditedconsolidated financial statements included elsewhere in this prospectus.
Equity-Based Compensation
We account for our stock awards and options by recognizing compensation expense, measured at the grantdate based on the fair value of the award net of estimated forfeitures, on a straight-line basis over the awardvesting period.
Stock Options
We measure the value of stock-option awards at the grant date fair value as calculated by the Black-Scholesoption-pricing model which requires the input of highly subjective assumptions, including the fair value of theunderlying common stock, the expected term of the option, the expected volatility of the price of our commonstock, risk-free interest rates, and the expected dividend yield of our common stock. The assumptions used in our
120
option-pricing model represent management’s best estimates. These estimates involve inherent uncertainties andthe application of management’s judgment. If these assumptions change and different factors are used, our stock-based compensation expense could be materially different in the future. These estimates will not be necessary todetermine the fair value of new awards once the underlying shares begin trading publicly. These assumptions areas follows:
• Fair value of our common stock. As our stock is not publicly traded, we must estimate the fair value ofcommon stock, as discussed in “Common Stock Valuation” below.
• Expected term. The expected term was estimated using the simplified method. The simplified methodcalculates the expected term as the average of the time to vesting and the contractual life of the option.
• Volatility. As we do not have a trading history for our common stock, the expected stock pricevolatility for our common stock was estimated by taking the average of the median historic pricevolatility and the median implied volatility of traded stock options for industry peers based on dailyprice observations over a period equivalent to the expected term of the stock option grants. Industrypeers consist of several public companies in the technology industry similar in size, stage of life cycleand financial leverage. We intend to continue to consistently apply this process using the same orsimilar public companies until a sufficient amount of historical information regarding the volatility ofour own share price becomes available, or unless circumstances change such that the identifiedcompanies are no longer similar to us, in which case, more suitable companies whose share prices arepublicly available would be used in the calculation.
• Risk-free rate. The risk-free interest rate is based on the yields of U.S. Treasury securities withmaturities appropriate for the term of employee options.
• Dividend yield. We do not currently pay cash dividends. Consequently, we used an expected dividendyield of zero.
If any of the assumptions used in the Black-Scholes option-pricing model change significantly, stock-basedcompensation expense may differ materially in the future from that recorded in the current period. The fair valueof the stock options granted during the year ended December 31, 2013 was estimated at the date of grant usingthe Black-Scholes option pricing model with the following weighted-average assumptions:
Implied volatility . . . . . . . . . . . . . . . . . . . . . . . . . . . . . . . . . . . . . 30.75%Expected life (in years) . . . . . . . . . . . . . . . . . . . . . . . . . . . . . . . . 6.11Risk free interest rate . . . . . . . . . . . . . . . . . . . . . . . . . . . . . . . . . . 1.53%Dividend yield . . . . . . . . . . . . . . . . . . . . . . . . . . . . . . . . . . . . . . . 0.00%
Restricted Stock
Restricted stock is measured based on the fair market value of the underlying stock on the date of the grant.Shares of Sabre Corporation common stock are delivered on the vesting dates with the applicable statutory taxwithholding requirements to be satisfied per the terms of the Sovereign Holdings, Inc. Restricted Stock GrantAgreement.
Common Stock Valuation
The fair value of the common stock underlying our stock-based awards was determined by the auditcommittee of our board of directors, with input from management and contemporaneous third-party valuations.We believe that the audit committee of our board of directors has the relevant experience and expertise todetermine the fair value of our common stock. As described below, the exercise price of our share-based awardswas determined by the audit committee of our board of directors based on input from management and the mostrecent contemporaneous third-party valuation as of the grant date.
121

Given the absence of a public trading market of our common stock, and in accordance with the AmericanInstitute of Certified Public Accountants Accounting and Valuation Guide: Valuation of Privately-Held-Company Equity Securities Issued as Compensation, the audit committee of our board of directors exercisedreasonable judgment and considered numerous objective and subjective factors to determine the best estimate ofthe fair value of our common stock including:
• contemporaneous valuations of our common stock performed by an unrelated third-party valuationspecialist;
• our historical and projected operating and financial results, including capital expenditures;
• current business conditions and performance, including dispositions and discontinued operations;
• the market performance and financial results of comparable publicly-traded companies;
• amounts of indebtedness;
• the rights, preferences and privileges of our outstanding preferred stock and accumulated dividends;
• industry or company-specific considerations;
• likelihood of achieving a liquidity event, such as an initial public offering or a sale of the company;
• lack of marketability of our common stock; and
• the U.S. and global capital market conditions.
The nature of the material assumptions and estimates considered, to determine the fair market value of ourcommon stock are highly complex and subjective.
In valuing our common stock through December 31, 2013, the audit committee of our board of directorsdetermined the business enterprise value (“BEV”) of our business generally using the income approach and themarket approach using the market comparable method.
The income approach estimates fair value based on the expectation of future cash flows that a company willgenerate such as cash earnings, cost savings, tax deductions, and the proceeds from disposition of assets. Thesefuture cash flows are discounted to their present values using a discount rate which reflects the risks inherent inour cash flows. This approach requires significant judgment in estimating projected growth rates and cost trendsand in determining a discount rate adjusted for the risks associated with our business.
The market comparable method estimates fair value based on a comparison of the subject company tocomparable public companies in similar lines of business. From the comparable companies, a representativemarket value multiple is determined which is applied to the subject company’s operating results to estimate thevalue of the subject company. In our valuations, the multiple of the comparable companies was determined usinga ratio of the market value of invested capital to projected revenue and/or earnings before interest, taxes anddepreciation and amortization for the current and following year. Our peer group of companies included anumber of market leaders in transaction processing, travel distribution, SaaS and software and internet relatedbusinesses similar to, or adjacent to our own business. The market comparable method requires judgment inselecting the public companies that are most similar to our business and in the application of the relevant marketmultiples to our financial performance metrics. We have from time to time updated the set of comparablecompanies utilized as new or more relevant information became available, including changes in the market andour business models and input from third party market experts.
Once we determine our BEV under each approach, we apply a weighting to the income approach and themarket approach primarily based on the relevance of the peer companies chosen for the market approach analysisas well as other relevant factors. We then reduce the BEV by our total net debt and total redeemable preferredstock value to arrive at the estimated fair value of our common stock. Based on this information, the auditcommittee of our board of directors makes the final determination of the estimated fair value of our equity andcommon stock.
122
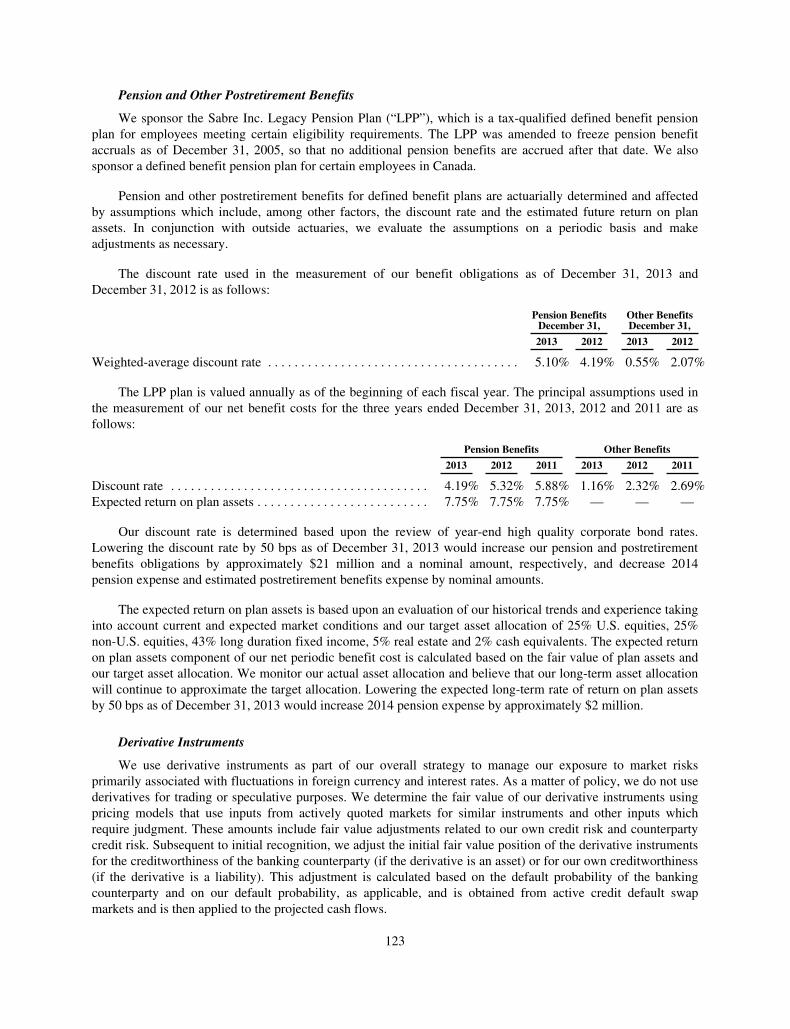
Pension and Other Postretirement Benefits
We sponsor the Sabre Inc. Legacy Pension Plan (“LPP”), which is a tax-qualified defined benefit pensionplan for employees meeting certain eligibility requirements. The LPP was amended to freeze pension benefitaccruals as of December 31, 2005, so that no additional pension benefits are accrued after that date. We alsosponsor a defined benefit pension plan for certain employees in Canada.
Pension and other postretirement benefits for defined benefit plans are actuarially determined and affectedby assumptions which include, among other factors, the discount rate and the estimated future return on planassets. In conjunction with outside actuaries, we evaluate the assumptions on a periodic basis and makeadjustments as necessary.
The discount rate used in the measurement of our benefit obligations as of December 31, 2013 andDecember 31, 2012 is as follows:
Pension BenefitsDecember 31,
Other BenefitsDecember 31,
2013 2012 2013 2012
Weighted-average discount rate . . . . . . . . . . . . . . . . . . . . . . . . . . . . . . . . . . . . . . 5.10% 4.19% 0.55% 2.07%
The LPP plan is valued annually as of the beginning of each fiscal year. The principal assumptions used inthe measurement of our net benefit costs for the three years ended December 31, 2013, 2012 and 2011 are asfollows:
Pension Benefits Other Benefits
2013 2012 2011 2013 2012 2011
Discount rate . . . . . . . . . . . . . . . . . . . . . . . . . . . . . . . . . . . . . . . 4.19% 5.32% 5.88% 1.16% 2.32% 2.69%Expected return on plan assets . . . . . . . . . . . . . . . . . . . . . . . . . . 7.75% 7.75% 7.75% — — —
Our discount rate is determined based upon the review of year-end high quality corporate bond rates.Lowering the discount rate by 50 bps as of December 31, 2013 would increase our pension and postretirementbenefits obligations by approximately $21 million and a nominal amount, respectively, and decrease 2014pension expense and estimated postretirement benefits expense by nominal amounts.
The expected return on plan assets is based upon an evaluation of our historical trends and experience takinginto account current and expected market conditions and our target asset allocation of 25% U.S. equities, 25%non-U.S. equities, 43% long duration fixed income, 5% real estate and 2% cash equivalents. The expected returnon plan assets component of our net periodic benefit cost is calculated based on the fair value of plan assets andour target asset allocation. We monitor our actual asset allocation and believe that our long-term asset allocationwill continue to approximate the target allocation. Lowering the expected long-term rate of return on plan assetsby 50 bps as of December 31, 2013 would increase 2014 pension expense by approximately $2 million.
Derivative Instruments
We use derivative instruments as part of our overall strategy to manage our exposure to market risksprimarily associated with fluctuations in foreign currency and interest rates. As a matter of policy, we do not usederivatives for trading or speculative purposes. We determine the fair value of our derivative instruments usingpricing models that use inputs from actively quoted markets for similar instruments and other inputs whichrequire judgment. These amounts include fair value adjustments related to our own credit risk and counterpartycredit risk. Subsequent to initial recognition, we adjust the initial fair value position of the derivative instrumentsfor the creditworthiness of the banking counterparty (if the derivative is an asset) or for our own creditworthiness(if the derivative is a liability). This adjustment is calculated based on the default probability of the bankingcounterparty and on our default probability, as applicable, and is obtained from active credit default swapmarkets and is then applied to the projected cash flows.
123

Restructuring Activities
Restructuring charges are typically comprised of employee severance costs, costs of consolidating duplicatefacilities and contract termination costs. Restructuring charges are based upon plans that have been committed toby our management, but may be refined in subsequent periods. A liability for costs associated with an exit ordisposal activity is recognized and measured at its fair value in our consolidated statement of operations in theperiod in which the liability is incurred. When estimating the fair value of facility restructuring activities,assumptions are applied regarding estimated sub-lease payments to be received, which can differ materially fromactual results. This may require us to revise our initial estimates which may materially affect our results ofoperations and financial position in the period the revision is made.
Income and Non-Income Taxes
We recognize deferred tax assets and liabilities based on the temporary differences between the financialstatement carrying amounts and the tax bases of assets and liabilities. We regularly review deferred tax assets byjurisdiction to assess their potential realization and establish a valuation allowance for portions of such assets thatwe believe will not be ultimately realized. In performing this review, we make estimates and assumptionsregarding projected future taxable income, the expected timing of the reversals of existing temporary differencesand the implementation of tax planning strategies. A change in these assumptions could cause an increase ordecrease to the valuation allowance resulting in an increase or decrease in the effective tax rate, which couldmaterially impact our results of operations. At year end, we had a valuation allowance on certain losscarryforwards based on our assessment that it is more likely than not that the deferred tax asset will not berealized. We believe that our estimates for the valuation allowances against deferred tax assets are appropriatebased on current facts and circumstances.
As of December 31, 2013, we had approximately $632 million of NOLs for U.S. federal income taxpurposes, approximately $17 million of which are subject to an annual limitation on their ability to be utilizedunder Section 382 of the Code. These NOLs are Pre-IPO Tax Assets under the TRA, which provides for thepayment by us to our Existing Stockholders of 85% of the amount of cash savings, if any, in U.S. federal incometax that we and our subsidiaries are deemed to realize as a result of the utilization of the Pre-IPO Tax Assets. See“Certain Relationships and Related Party Transactions—Tax Receivable Agreement.”
We believe that it is more likely than not that the benefit from certain U.S. and non-U.S. deferred tax assetswill not be realized. As a result, we established a valuation allowance of approximately $86 million against ourU.S. deferred tax assets as of December 31, 2013, which includes our U.S. federal income tax NOL. In addition,we have an allowance on the U.S. deferred tax assets of TVL Common, Inc. that was merged into our capitalstructure on December 31, 2012 of $5 million and on the non-U.S. deferred tax assets of our lastminute.comsubsidiaries of $163 million and $177 million as of December 31, 2013 and 2012, respectively. We reassess theseassumptions regularly, which could cause an increase or decrease to the valuation allowance resulting in anincrease or decrease in the effective tax rate, and could materially impact our results of operations.
We operate in numerous countries where our income tax returns are subject to audit and adjustment by localtax authorities. Because we operate globally, the nature of the uncertain tax positions is often very complex andsubject to change, and the amounts at issue can be substantial. It is inherently difficult and subjective to estimatesuch amounts, as we have to determine the probability of various possible outcomes. We re-evaluate uncertaintax positions on a quarterly basis. This evaluation is based on factors including, but not limited to, changes infacts or circumstances, changes in tax law, effectively settled issues under audit, and new audit activity. AtDecember 31, 2013 and December 31, 2012, we had a liability, including interest and penalty, of $67 million and$58 million, respectively, for unrecognized tax benefits, which would affect our effective tax rate if recognized.Such a change in recognition or measurement would result in the recognition of a tax benefit or an additionalcharge to the tax provision.
With respect to value-added taxes, we have established reserves regarding the collection of refunds whichare subject to audit and collection risks in various regions of Europe. Our reserves are based on factors including,
124
but not limited to, changes in facts or circumstances, changes in law, effectively settled issues under audit, andnew audit activity. Changes in any of these factors could significantly impact our reserves and materially impactour results of operations. At December 31, 2013 and December 31, 2012, we carried reserves of approximately$4 million and $37 million, respectively, associated with these risks.
Occupancy Taxes
Over the past nine years, various state and local governments in the United States have filed approximately70 lawsuits against us pertaining primarily to whether Travelocity (and other OTAs) owes sales or occupancytaxes on some or all of the revenues it earns from facilitating hotel reservations using the merchant revenuemodel. In addition to the lawsuits, there are a number of administrative proceedings pending against us whichcould result in an assessment of sales or occupancy taxes on fees. See “Business—Legal Proceedings—Litigationand Administrative Audit Proceedings Relating to Hotel Occupancy Taxes.”
Quantitative and Qualitative Disclosures about Market Risk
Market Risk Management
Market risk is the potential loss from adverse changes in: (i) prevailing interest rates, (ii) foreign exchangerates, (iii) credit risk and (iv) inflation. Our exposure to market risk relates to interest payments due on our long-term debt, revolving credit facility, derivative instruments, income on cash and cash equivalents, accountsreceivable and payable and travel supplier liabilities and related deferred revenue. We manage our exposure tothese risks through established policies and procedures. We do not engage in trading, market making or otherspeculative activities in the derivatives markets. Our objective is to mitigate potential income statement, cashflow and fair value exposures resulting from possible future adverse fluctuations in interest and foreign exchangerates.
Interest Rate Risk
As of December 31, 2013, our exposure to interest rates relates primarily to our interest rate swaps, oursenior secured debt and our borrowings on the revolving credit agreement. Offsetting some of this exposure isinterest income received from our money market funds. The objectives of our investment in money market fundsare (i) preservation of principal, (ii) liquidity and (iii) yield. If future short-term interest rates averaged 10%lower than they were during the year ended December 31, 2013, our interest income from money market fundswould have decreased by a negligible amount. This amount was determined by applying the hypothetical interestrate change to our average money market funds invested.
125
As of December 31, 2013, 2012 and 2011, the outstanding carrying values of our financing obligations wereas stated below.
December 31,
Rate* Maturity 2013 2012 2011
(Amounts in thousands)Senior secured credit facility:
Term B facility . . . . . . . . . . . . . . . . . . L+4.00%(1) February 2019 $1,747,378 $ — $ —Incremental term facility . . . . . . . L+3.50% February 2019 349,125 — —
Term C facility . . . . . . . . . . . . . . . . . . L+3.00% December 2017 360,477 — —Revolving facility . . . . . . . . . . . . . . . . . L+3.75% February 2018(1) — — 82,000Initial term loan facility . . . . . . . . . . . . L+5.75% September 2014 — — 800,000Initial term loan facility . . . . . . . . . . . . L+2.00% September 2014 — 238,335 2,071,788
First extended term loanfacility . . . . . . . . . . . . . . . . . . . L+5.75% September 2017 — 1,162,622 —
Second extended term loanfacility . . . . . . . . . . . . . . . . . . . L+5.75% December 2017 — 401,515 —
Incremental term facility . . . . . . . L+6.00% December 2017 — 370,536 —Senior unsecured notes due 2016 . . . . . . . . . 8.350% March 2016 389,321 385,099 381,267Senior secured notes due 2019 . . . . . . . . . . . 8.500% May 2019 799,823 801,712 —Mortgage facility . . . . . . . . . . . . . . . . . . . . . 5.800% March 2017 83,541 84,340 85,000
Total debt . . . . . . . . . . . . . . . . . . . . . . . $3,729,665 $3,444,159 $3,420,055
Current portion of debt . . . . . . . . . . . . . . . . . 86,117 23,232 112,150Long-term debt . . . . . . . . . . . . . . . . . . . . . . . 3,643,548 3,420,927 3,307,905
Total debt . . . . . . . . . . . . . . . . . . . . . . . $3,729,665 $3,444,159 $3,420,055
* “L” refers to LIBOR.(1) Effective February 20, 2014, the applicable margin to the Term B Facility was reduced to L+3.25% and the
maturity of $317 million of the Revolving Facility was extended to February 2019. See “—Liquidity andCapital Resources—Senior Secured Credit Facilities.”
We have entered into interest rate swaps that effectively convert $750 million of floating interest rate seniorsecured debt into a fixed rate obligation. The terms of the outstanding and matured interest rate swaps relevant tothe years ended December 31, 2013, 2012 and 2011 were as follows:
National amount Interest Rate ReceivedInterest
Rate Paid Effective Date Maturity Date
Outstanding:$ 400 million 1 month LIBOR 2.03% July 29, 2011 September 30, 2014$ 350 million 1 month LIBOR 2.51% April 30, 2012 September 30, 2014
$ 750 million
Matured:$ 800 million 3 month LIBOR 5.04% April 30, 2007 April 30, 2012$ 350 million 3 month LIBOR 4.99% April 30, 2007 April 30, 2011$ 125 million 3 month LIBOR 5.04% April 30, 2007 April 28, 2011$ 125 million 3 month LIBOR 5.03% April 30, 2007 April 28, 2011
$1,400 million
126

Since outstanding balances under our senior secured credit facilities incur interest at rates based on LIBOR,subject to a 1.00% floor, increases in short-term interest rates would not impact our interest expense until LIBORexceeded 1.00%. If our mix of interest rate-sensitive assets and liabilities changes significantly, we may enterinto additional derivative transactions to manage our net interest rate exposure.
Foreign Currency Risk
We have operations outside of the United States, primarily in Canada, South America, Europe, Australia andAsia. We are exposed to foreign currency fluctuations whenever we enter into purchase or sale transactionsdenominated in a currency other than the functional currency of the operations. The principal foreign currenciesinvolved include the Euro, the British Pound Sterling, the Polish Zloty, the Canadian Dollar, the Indian Rupee,and the Australian Dollar. Our most significant foreign currency denominated operating expenses is in the Euro,which comprised approximately 9%, 7% and 9% of our operating expenses for the years ended December 31,2013, 2012 and 2011, respectively. In recent years, exchange rates between these currencies and the U.S. dollarhave fluctuated significantly and may continue to do so in the future. During times of volatile currencymovements, this risk can materially impact our earnings. To reduce the impact of this earnings volatility, wehedged approximately 43% of our foreign currency exposure by entering into foreign currency forward contractson several of our largest foreign currency exposures. The notional amounts of these forward contracts totaled$123 million, $126 million and $94 million as of December 31, 2013, 2012 and 2011, respectively. The forwardcontracts represent obligations to purchase foreign currencies at a predetermined exchange rate to fund a portionof our expenses that are denominated in foreign currencies. The fair value of these forward contracts recognizedas an asset in our consolidated balance sheets was $5 million and $3 million as of December 31, 2013 andDecember 31, 2012, respectively.
We are also exposed to foreign currency fluctuations through the translation of the financial condition andresults of operations of our foreign operations into U.S. dollars in consolidation. Such gains and losses arerecognized as a component of accumulated other comprehensive income (loss) and is included in stockholders’equity (deficit). Translation gains (losses) recognized as other comprehensive income (loss) were $13 million,$(2) million and $2 million for the years ended December 31, 2013, 2012 and 2011, respectively.
Credit Risk
Our customers are primarily located in the United States, Canada, Europe, Latin America and Asia, and areconcentrated in the travel industry.
We generate a significant portion of our revenues and corresponding accounts receivable from servicesprovided to the commercial air travel industry. As of December 31, 2013, and 2012, approximately $178 millionor 58% and $189 million or 58%, respectively, of our trade accounts receivable were attributable to commercialair travel industry customers. Our other accounts receivable are generally due from other participants in the traveland transportation industry. We generally do not require security or collateral from our customers as a conditionof sale. See “Risk Factors—Risks Related to Our Business and Industry—Our travel supplier customers mayexperience financial instability or consolidation, pursue cost reductions, change their distribution model orundergo other changes.”
We regularly monitor the financial condition of the air transportation industry and have noted the financialdifficulties faced by several air carriers. We believe the credit risk related to the air carriers’ difficulties ismitigated somewhat by the fact that we collect a significant portion of the receivables from these carriers throughthe ACH and other similar clearing houses.
As of December 31, 2013, 2012 and 2011, approximately 57%, 55%, and 57%, respectively, of our aircustomers make payments through the ACH which accounts for approximately 94%, 95% and 94%, respectively,of our air billings. ACH requires participants to deposit certain balances into their demand deposit accounts by
127

certain deadlines, which facilitates a timely settlement process. For these carriers, we believe the use of ACHmitigates our credit risk with respect to airline bankruptcies. For those carriers from whom we do not collectpayments through the ACH or other similar clearing houses, our credit risk is higher. However, we monitor thesecarriers and account for the related credit risk through our normal reserve policies.
Inflation
Competitive market conditions and the general economic environment have minimized inflation’s impact onour results of operations in recent periods. There can be no assurance, however, that our operating results will notbe affected by inflation in the future.
128

INDUSTRY
Travel Industry Overview
The travel and tourism industry is one of the world’s largest industry segments, contributing $6.6 trillion toglobal GDP in 2012, according to the WTTC. The industry encompasses travel suppliers, including airlines,hotels, car rental brands, rail carriers, cruise lines and tour operators around the world, as well as travel buyers,including online and offline travel agencies, TMCs and corporate travel departments.
The travel and tourism industry has been a growing area of the broader economy. For example, based on 40years of IATA Traffic data, air traffic has historically grown at an average rate of approximately 1.5x the rate ofglobal GDP growth. According to Euromonitor Database, travel volumes have benefited and are expected tocontinue to benefit from GDP growth and corresponding rising income levels, particularly in growth markets suchas APAC, Latin America and MEA. According to IATA Traffic, global airline passenger volume has grown at a 6%CAGR from 2009 to 2012. Looking forward, air travel and hotel spending is expected to grow at a 4% CAGR from2013 to 2017, as growing consumer confidence and increasing connectivity continue to expand the opportunities fortravel and tourism, according to Euromonitor Database. Air traffic in developing markets such as APAC, LatinAmerica and the Middle East is expected to grow at even faster rates—6%, 6%, and 7%, respectively, from 2012 to2032, according to Airbus. This emerging market growth is relevant for all our businesses but especially our TravelNetwork business, which had leading GDS-processed air bookings shares in both APAC and Latin America in2013. Certain segments of the travel market are also growing faster than average. For example, LCC/hybrids, whichrepresented approximately 45% of our 2012 PBs served by our Airline Solutions reservations products, havecontinued to grow. According to Airbus, LCCs’ share of global air travel volume is expected to increase from 17%of revenue passenger kilometers in 2012 to 21% of revenue passenger kilometers by 2032. Finally, according toEuromonitor Report, business-related travel by U.S. residents, which is primarily served through GDS channels, hasincreased since the global economic downturn, reaching 228 million trips in 2012. According to IATA’s AirlineIndustry Forecast 2013-2017, overall air travel is expected to sustain a growth rate approaching the historical 5% to6% growth trend at least through 2017, and Boeing’s Current Market Outlook projects a 5% CAGR in globalpassenger traffic growth from 2013 to 2032, measured in revenue passenger kilometers.
Travel Industry Technology
The travel industry is highly fragmented and complex, with approximately 800 airlines serving 3 billionpassengers (T2RL), 470,000 hotel properties (Euromonitor Database), over 35,000 car rental outlets(PhoCusWright December 2013 (“PhoCusWright”)), and numerous rail, cruise, tour and other operators aroundthe world. Each of these types of travel suppliers requires technology to solve their complex and key marketing,sales, service and operational needs. In addition, there are tens of thousands of commercial buyers of travelincluding online and offline travel agencies, TMCs and corporate travel departments that serve both business andleisure travelers. These travel buyers rely on highly sophisticated shopping technology to filter the universe oftravel options to identify desired itineraries that fit travelers’ personal preferences and comply with corporatepolicies. For example, there are billions of itinerary and fare options from New York to London on any givenday, but only a small subset of those with available seats, on the preferred airline, with the optimal routing and atthe desired time. The GDS search technology narrows the options down to the lowest fares that meet thetraveler’s criteria so the informed agency can help the traveler make the best choice quickly. For these flights, aircarriers need to set prices, manage inventory and distribute their seats as well as plan, staff and operate theirroutes and aircraft, all while carefully analyzing their financial and operational results. Hotels face similarchallenges, as millions of customers check in and check out of their properties daily. There is a significantamount of technology required to enable this ecosystem.
To operate successfully, travel suppliers as well as travel buyers must solve this broad range of challengesfrom planning to distribution to operations. Historically, technology solutions were built in-house by travelsuppliers and travel buyers. Over time, third-party providers emerged to offer more cost-effective and advancedsolutions, and the market has increasingly shifted to an outsourced model. We believe that significantoutsourcing will continue as legacy in-house systems continue to migrate and upgrade to third-party systems.
129
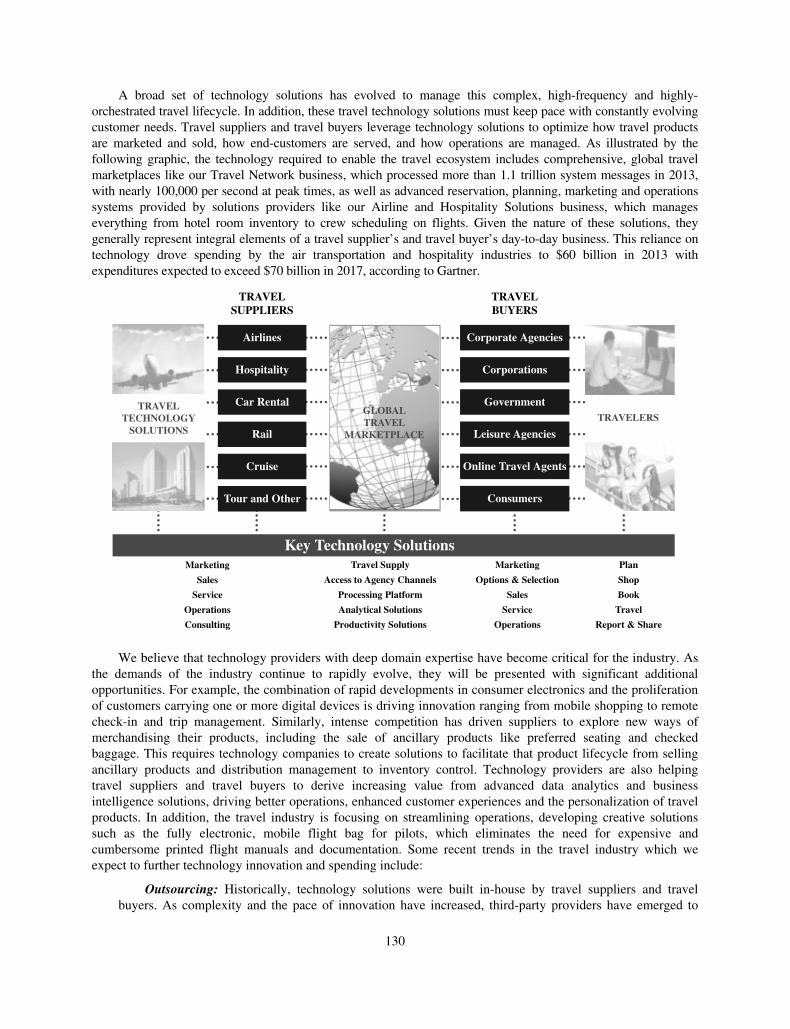
A broad set of technology solutions has evolved to manage this complex, high-frequency and highly-orchestrated travel lifecycle. In addition, these travel technology solutions must keep pace with constantly evolvingcustomer needs. Travel suppliers and travel buyers leverage technology solutions to optimize how travel productsare marketed and sold, how end-customers are served, and how operations are managed. As illustrated by thefollowing graphic, the technology required to enable the travel ecosystem includes comprehensive, global travelmarketplaces like our Travel Network business, which processed more than 1.1 trillion system messages in 2013,with nearly 100,000 per second at peak times, as well as advanced reservation, planning, marketing and operationssystems provided by solutions providers like our Airline and Hospitality Solutions business, which manageseverything from hotel room inventory to crew scheduling on flights. Given the nature of these solutions, theygenerally represent integral elements of a travel supplier’s and travel buyer’s day-to-day business. This reliance ontechnology drove spending by the air transportation and hospitality industries to $60 billion in 2013 withexpenditures expected to exceed $70 billion in 2017, according to Gartner.
TRAVELSUPPLIERS
TRAVELBUYERS
Corporate AgenciesAirlines
Hospitality
Car Rental
Corporations
Government
Rail
Cruise
Leisure Agencies
Online Travel Agents
TRAVELTECHNOLOGY
SOLUTIONSTRAVELERS
Tour and Other Consumers
Marketing
Sales
Service
Marketing
Options & Selection
Travel Supply
Access to Agency Channels
Processing Platform
Plan
Shop
Book
Operations
Consulting
Sales
Service
Operations
Analytical Solutions
Productivity Solutions
Travel
Report & Share
Key Technology Solutions
GLOBALTRAVEL
MARKETPLACE
We believe that technology providers with deep domain expertise have become critical for the industry. Asthe demands of the industry continue to rapidly evolve, they will be presented with significant additionalopportunities. For example, the combination of rapid developments in consumer electronics and the proliferationof customers carrying one or more digital devices is driving innovation ranging from mobile shopping to remotecheck-in and trip management. Similarly, intense competition has driven suppliers to explore new ways ofmerchandising their products, including the sale of ancillary products like preferred seating and checkedbaggage. This requires technology companies to create solutions to facilitate that product lifecycle from sellingancillary products and distribution management to inventory control. Technology providers are also helpingtravel suppliers and travel buyers to derive increasing value from advanced data analytics and businessintelligence solutions, driving better operations, enhanced customer experiences and the personalization of travelproducts. In addition, the travel industry is focusing on streamlining operations, developing creative solutionssuch as the fully electronic, mobile flight bag for pilots, which eliminates the need for expensive andcumbersome printed flight manuals and documentation. Some recent trends in the travel industry which weexpect to further technology innovation and spending include:
Outsourcing: Historically, technology solutions were built in-house by travel suppliers and travelbuyers. As complexity and the pace of innovation have increased, third-party providers have emerged to
130

offer more cost-effective and advanced solutions. Additionally, the travel technology industry has shifted toa more flexible and scalable technology delivery model including SaaS and hosted implementations thatallow for shared development, reduced deployment costs, increased scalability and a “pay-as-you-go” costmodel.
Airline Ancillary Revenue: The sale of ancillary products is now a major source of revenue for manyairlines worldwide, and has grown to comprise as much as 20% of total revenues for some carriers and morethan $36 billion in the aggregate across the travel industry in 2012, according to IdeaWorks. Enabling thesale of ancillary products is technologically complex and requires coordinated changes to multipleinterdependent systems including reservations platforms, inventory systems, point of sale locations, revenueaccounting, merchandising, shopping, analytics and other systems. Technology providers such as Sabrehave already significantly enhanced their systems to provide these capabilities and we expect theseproviders to take further advantage of this significant opportunity going forward.
Mobile: Mobile platforms have created new ways for customers to research, book and experiencetravel, and are expected to account for over 30% of online travel sales by 2017, according to Euromonitor.Accordingly, travel suppliers, including airlines and hospitality providers, are upgrading their systems toallow for delivery of services via mobile platforms from booking to check-in to travel management. Therecent SITA Survey found that 97% of airlines are investing in mobile channels with the intention ofincreasing mobile access across the entire travel experience. This mobile trend also extends to the use oftablets and wireless connectivity by the airline workforce, such as automating cabin crew services andproviding flight crews with electronic flight bags. Travel technology companies like Sabre are enabling andbenefitting from this trend as travel suppliers upgrade their systems and travel buyers look for new sourcesof client connectivity.
Personalization: Concurrently with the rise of ancillary products and mobile devices as a customerservice tool, travel suppliers have an opportunity to provide increased personalization across the customertravel experience, from seat selection and on-board entertainment to loyalty program management andmobile concierge services. Data-driven business intelligence products can help travel companies useavailable customer data to identify the types of products, add-ons and upgrades customers are more likely topurchase and market these products effectively to various customer segments according to their needs andpreferences. In addition to providing the technology platform to facilitate these services, we believetechnology providers like Sabre can leverage their data-rich platforms and travel technology domainexpertise to offer analytics and business intelligence to support travel suppliers in delivering morepersonalized service offerings.
Increasing Use of Data and Analytics: The use of data has always been an asset in the travel industry.Airlines were pioneers in the use of data to optimize seat pricing, crew scheduling and flight routing.Similarly, hotels employed data to manage room inventory and optimize pricing. The travel industry wasalso one of the first to capitalize on the value of customer data by developing products such as customerloyalty programs. Historically, this data has largely been transaction-based, such as booking reservations,recording account balances, and tracking points in loyalty programs. Today, analytics-driven businessintelligence products are evolving to further and better utilize available data to help travel companies makedecisions, serve customers, optimize their operations and analyze their competitive landscape. Technologyproviders like Sabre have developed and continue to develop large-scale, data-rich platforms that includethese business intelligence and data analytics tools that can identify new business opportunities and global,integrated and high-value solutions for travel suppliers.
With the increasing complexity created by the large, fragmented and global nature of the travel industry, webelieve reliance on technology will only increase. Technology spending by the air transportation and hospitalityindustries totaled $60 billion in 2013, with expenditures expected to exceed $70 billion in 2017, according toGartner Enterprise.
We offer a broad portfolio of sophisticated and comprehensive technology solutions and services onscalable platforms to travel suppliers, travel buyers and other industry participants that range from planning to
131

distribution to operations. We organize our business in three segments: (i) Travel Network, our global B2B travelmarketplace for travel suppliers and travel buyers, (ii) Airline and Hospitality Solutions, an extensive suite ofleading software solutions primarily for airlines and hotel properties, and (iii) Travelocity, our portfolio of onlineconsumer travel e-commerce businesses through which we provide travel content and booking functionalityprimarily for leisure travelers. Collectively, our integrated business enables the entire travel lifecycle, from routeplanning to post-trip business intelligence and analysis.
Global Distribution System and Travel Marketplace
Sabre developed the first airline CRS. As the industry and technology evolved and Sabre’s and other CRSproviders’ systems expanded globally to accommodate a large variety of travel suppliers and attract a broad setof travel buyers, these systems became known as GDSs, or global distribution systems. In recent years, certainGDS providers, including Sabre, have significantly broadened their product offering and value proposition toinclude a range of integrated technologies and solutions for travel suppliers and travel buyers. Combinations ofthe GDSs and these solutions offerings have increasingly become known as global travel marketplaces.
GDS providers facilitate the operation of the travel industry in several ways. First, these travel marketplaceshave an extensive network of travel buyers, including online and offline travel agencies, TMCs and corporatetravel departments, as well as travel suppliers, including airlines, hotels, car rental brands, rail carriers, cruiselines and tour operators. GDSs efficiently bring together travel content such as inventory, prices and availabilityfrom travel suppliers and allow travel buyers to purchase that content through a transparent, searchable andconsistently presented marketplace platform. A fundamental value proposition to the travel buyer is access tocomprehensive and competitive travel content, including core content such as inventory and pricing equivalent tothat directly available through a travel supplier’s own website or sales office. For travel suppliers, thesemarketplaces provide efficient and cost-effective distribution of the travel supplier’s services to a diversecustomer base and also provide many OTAs with access to the travel content displayed on their websites. Basedon our internal estimates and Marketing Information Data Tapes data, there were over one billion GDS-processedair bookings in 2013, representing more than $250 billion in global travel sales.
In addition, some GDS providers augment their distribution offering with advanced merchandising andother capabilities. For example, workflow management solutions, like Sabre Red Workspace; automation toolsthat assist travel agencies in serving their customers before, during and after the trip; and web-based products areintegral components of travel agents’ technology systems that help them market their services effectively andoperate more efficiently. The graphic below illustrates the potential value of the GDS and related solutions toboth travel suppliers and travel buyers:
Value to Travel Buyers Value to Travel Sellers
Scope and Reach
Earnings &Operations
Insight
• Comprehensive travel content
• End-to-end travel fulfillment
• Ability to shop/book/change/cancel
• Enforce corporate travel policy compliance
• Efficient distribution
• Access to high-value corporate market
• Highly efficient marketplace
• Increase agent efficiency
• Fully transparent comparison shopping
• Workflow suite w/ graphical, intuitive UI
• Grow revenue / reduce costs
• Higher yield than direct distribution
• Enable merchandising
• Measure performance
• Identify opportunities
• Data reconciliation
• Reporting & analytical tools
• Empower decision support
• Measure performance
• Identify opportunities
132

Buyers can purchase travel inventory (e.g., booking reservations for air or hotel) in two primary ways. Theycan purchase directly from the travel supplier, which we refer to as “direct distribution,” or they can purchasethrough a travel agency or other intermediary that typically uses a GDS. We refer to this as “indirect distribution.”
With travel suppliers’ adoption of certain technology solutions over the last decade, including those offeredby our Airline and Hospitality Solutions business, air travel suppliers have increased the proportion of directbookings relative to indirect bookings. However, we believe that the rate at which bookings are shifting fromindirect to direct distribution channels has slowed for a number of reasons, and that the rate of shift in theUnited States stabilized at very low levels in 2012 and 2013, although we cannot predict whether this low rate ofshift will continue. Reasons for this include the increased participation of LCC/hybrids in indirect distributionchannels as well as other airlines increasing their participation in GDSs in recent years. We believe this is due tothe effectiveness and efficiency of the GDS as a global travel marketplace for travel suppliers to market and selltheir travel content, particularly for TMCs, corporate travel departments and OTAs. In addition, travel suppliersusing the GDS incur a booking fee which is, on average, only approximately 2% of the value of the booking.Therefore, the revenue generated through the GDS leads to a return on investment that is attractive compared tothe incremental cost, in part because many of the tickets sold on the GDS platform are more expensive long-hauland business travel tickets (particularly those originating outside the home country of the airline) as well astickets with additional booking complexity (e.g., multiple airline itineraries). These platforms also offer aparticularly cost-effective means of accessing markets where a travel supplier’s brand is less recognized by usinglocal travel agencies to reach end consumers.
As evidence of the value of the GDS platform, we estimate that Representative Airlines have anapproximately 90% participation rate in a GDS (weighted by PB volume), as of December 31, 2013. We define“Representative Airlines” as all IATA member airlines as of December 2013, as well as Air Asia, Allegiant, LionAir, Ryanair, Tiger Airways and Wizz Air, which, based on T2RL, collectively carried approximatelythree-quarters of PBs globally in 2012. Over the last several years, notable carriers that previously onlydistributed directly, including JetBlue and Norwegian, have adopted our GDS. Other carriers such as EVAAirways and Virgin Australia have further increased their participation in a GDS. On the hotel side, a recentTravelClick study shows that travel agents’ use of GDSs for hotel booking is growing faster than their use of anyother distribution channel for hotel bookings.
There are other technology initiatives that could impact the use of GDSs. For example, over the past ten years,several travel suppliers have proposed direct distribution initiatives. We believe that the direct distribution initiativesoffered to date lack key functionality provided by the GDS, and would require each travel agency to implement adirect connection to each airline or other travel supplier, requiring significant and redundant IT expenditures. Todate, we believe that direct distribution initiatives have not and will not have significant adoption by travel agentssince their cost and lack of features currently make them less competitive than GDS offerings. In 2012, IATAproposed NDC, a new distribution capability, for adoption by airlines and travel distribution companies. Asoriginally proposed, NDC is a combination of technical standards and business model, similar to some directdistribution initiatives, and we believe it suffers from many of the same problems noted above. We are not aware ofany GDS industry participant or major travel agency that has committed the necessary investment for NDC. Thatsaid, we are committed to working with IATA to develop uniform technical standards that would incorporate NDCcapabilities in a manner that integrates with the GDS for the benefit of travel buyers and travel suppliers.
Travel buyers, such as online and offline travel agencies, TMCs and corporate travel departments continueto utilize GDS platforms to provide travel content to their customers. Such customers continue to demand thebroadest possible offerings at the best available prices in a single comparable format that we believe can mosteffectively be offered by GDSs at present. Additionally, travel buyers demand functionalities that provide nearreal-time results and allow flexible search parameters. Such enhanced functionalities have not typically beenavailable via direct distribution channels, which have historically had less sophisticated search engines and havebeen limited to a single travel supplier’s inventory. In addition, we believe that travel agencies value otherattributes of the GDS, including incentive consideration that supplements their income, tools that facilitate
133
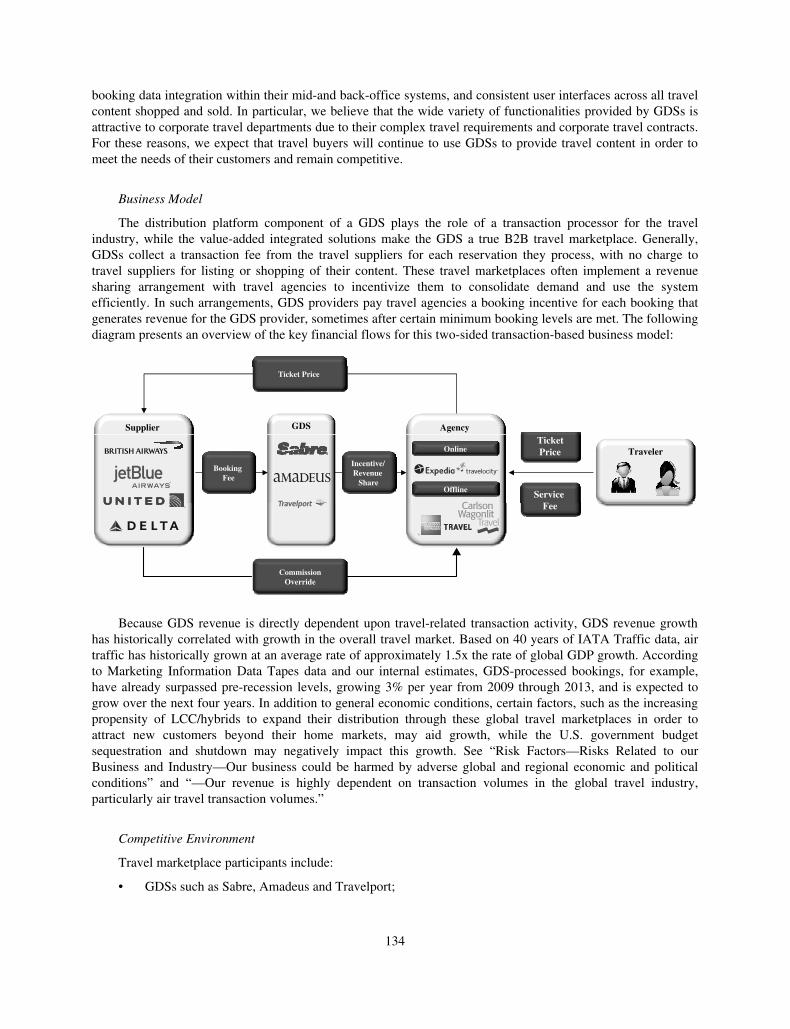
booking data integration within their mid-and back-office systems, and consistent user interfaces across all travelcontent shopped and sold. In particular, we believe that the wide variety of functionalities provided by GDSs isattractive to corporate travel departments due to their complex travel requirements and corporate travel contracts.For these reasons, we expect that travel buyers will continue to use GDSs to provide travel content in order tomeet the needs of their customers and remain competitive.
Business Model
The distribution platform component of a GDS plays the role of a transaction processor for the travelindustry, while the value-added integrated solutions make the GDS a true B2B travel marketplace. Generally,GDSs collect a transaction fee from the travel suppliers for each reservation they process, with no charge totravel suppliers for listing or shopping of their content. These travel marketplaces often implement a revenuesharing arrangement with travel agencies to incentivize them to consolidate demand and use the systemefficiently. In such arrangements, GDS providers pay travel agencies a booking incentive for each booking thatgenerates revenue for the GDS provider, sometimes after certain minimum booking levels are met. The followingdiagram presents an overview of the key financial flows for this two-sided transaction-based business model:
GDSSupplier Agency
Ticket Price
Online
Offline
TravelerTicketPrice
ServiceF
Incentive/Revenue
Share
BookingFee
Fee
CommissionOverride
Because GDS revenue is directly dependent upon travel-related transaction activity, GDS revenue growthhas historically correlated with growth in the overall travel market. Based on 40 years of IATA Traffic data, airtraffic has historically grown at an average rate of approximately 1.5x the rate of global GDP growth. Accordingto Marketing Information Data Tapes data and our internal estimates, GDS-processed bookings, for example,have already surpassed pre-recession levels, growing 3% per year from 2009 through 2013, and is expected togrow over the next four years. In addition to general economic conditions, certain factors, such as the increasingpropensity of LCC/hybrids to expand their distribution through these global travel marketplaces in order toattract new customers beyond their home markets, may aid growth, while the U.S. government budgetsequestration and shutdown may negatively impact this growth. See “Risk Factors—Risks Related to ourBusiness and Industry—Our business could be harmed by adverse global and regional economic and politicalconditions” and “—Our revenue is highly dependent on transaction volumes in the global travel industry,particularly air travel transaction volumes.”
Competitive Environment
Travel marketplace participants include:
• GDSs such as Sabre, Amadeus and Travelport;
134
• local distribution systems and travel marketplace providers that are primarily owned by airlines orgovernment entities and operate primarily in their home countries, including Abacus in APAC (100%of Abacus transactions processed by Sabre), TravelSky in China and Sirena in Russia and theCommonwealth of Independent States;
• travel suppliers that use direct distribution to sell their services directly to travelers;
• corporate travel booking tools, including GetThere, Concur Technologies, Deem, KDS, eTravel LLCand Egencia; and
• other market participants in the travel space, including Kayak, TripAdvisor, Yahoo! and Google, whichhave launched consumer travel search tools that direct shoppers to travel suppliers’ direct distributionchannels and OTAs.
We believe that travel marketplace participants strive to differentiate themselves by providing travel buyerswith some or all of the following services and functionality: reliable, easy to use and innovative technology;comprehensive, accurate and timely travel content or services; global coverage or regional expertise; bookingincentives to travel agencies; and comprehensive solutions for business productivity, revenue maximization orcost savings. In addition, we believe that travel marketplace participants that serve travel suppliers strive tomaintain an extensive network of travel buyer customers to provide a comprehensive global or regional offeringof sales channels while offering low transaction fees. Some of these market participants also offer capabilities fortravel suppliers to advertise, merchandise and personalize their products and services through the GDS.
Compared to other types of participants, global travel marketplaces such as Travel Network tend to offermore of these attributes to both travel buyers and travel suppliers.
In the United States, full deregulation of the GDS industry occurred in 2004. GDSs and airline carriers inEurope are still subject to rules aimed at preventing anti-competitive behavior and ensuring the supply of neutralinformation to consumers. Airlines that have decisive influence over a GDS, such as Air France, Iberia and theparent company of Lufthansa, all of which partially own Amadeus, must abide by specific rules prohibitingdiscrimination by an airline against another GDS that is competing with the airline-owned GDS. The Chinesetravel marketplace is heavily regulated to provide the state-controlled GDS, TravelSky, with monopoly control,which has largely kept other GDS providers out of the Chinese market. However, China has recently agreed to aphased, selective easing of some of these regulations, though progress has been slow, according toPhoCusWright. Canada still has some GDS regulations as well, primarily around the display of air carriers’services.
Travel Technology Solutions
Travel technology companies provide travel suppliers with solutions that address a myriad of businessprocesses, including commercial planning, revenue management, inventory management, customer acquisitionand merchandising, sales and e-commerce, operations planning and management, business intelligence, andmarket intelligence. These solutions are typically comprised of SaaS solutions, hosted solutions and locallydeployed solutions. Some of these solutions are developed by travel suppliers in-house and others are developedby third parties such as travel technology companies.
Historically, large travel suppliers built custom in-house software and applications for their business processneeds. In response to a desire for more flexible systems given increasingly complex technological requirements,reduced IT budgets and increased pricing pressure, many travel suppliers turned to third-party solutions providersfor many of their key technologies and began to license software from software providers.
Business Model
In addition to the continuing technology outsourcing trend, the industry has also seen a shift to more flexibleand scalable technology delivery models. Although traditional software licensing remains an important part of
135

the industry, leading technology providers like Sabre have been at the forefront of a shift to SaaS and hostedimplementations that allow for shared development, reduced deployment costs, increased scalability and a “pay-as-you-go” pricing model. This model also allows customers to benefit from constantly evolving platforms in ahighly dynamic environment. By amortizing the cost of the solution over a customer’s transactions (e.g., PBs orroom reservations made), solutions providers can often help customers reduce upfront technology costs andconvert them to variable costs linked to company growth. Given the capital intensive nature of many travelsuppliers’ businesses, we believe that this pricing flexibility is attractive to travel suppliers.
Competitive Environment
Participants in the travel technology solutions market include both third-party solutions providers and travelsuppliers with in-house systems. As the technology outsourcing trend continues, third-party solutions providerscompete for business based on a number of factors, including: the breadth of solutions offered, scope andcomplexity of business needs addressed, ability to meet a variety of customer specifications, proven effectivenessand reliability, implementation and system migration processes, flexibility, scalability and ease of use, pricing,level of integration with customers’ existing technology, global footprint, industry and technology expertise, costand efficiency of system upgrades and customer support services. We believe that competitors who offersolutions that meet a range of complex needs and supplement those solutions with reliable support and a deepunderstanding of industry processes are more attractive to potential customers because they are able to solvemore complex problems while reducing the total number of solutions providers that the customer needs.
Developing effective solutions requires complex and specific travel industry expertise. Also, most travelsuppliers generally favor solutions providers that already serve other large travel suppliers in a given region.Airlines in particular are focused on the proven reliability of technology that is integral to operational efficiencyand passenger safety, and hotels generally desire the technological sophistication and capabilities used by thelarger and more prestigious hotel brands. Furthermore, due to the large size of many airline and hotel customers,solutions providers that can provide the scale to accommodate large volumes and deliver a broad portfolio ofsolutions have a competitive advantage. We believe that currently only a few SaaS and hosted technologysolutions providers have the breadth, industry knowledge and technology expertise to effectively compete on alarge scale. Although new entrants specializing in a particular type of software occasionally enter the solutionsmarket, they typically focus on emerging or evolving business problems, niche solutions or small regionalcustomers.
Airline Supplier Technology
Gartner estimates that technology spending by the air transportation industry totaled approximately $33billion in 2013 (Gartner Enterprise). According to our internal estimates and T2RL passenger data, more than600 airlines, representing over 95% of global passenger volumes, use a variety of software solutions to manageand integrate complex business processes. SITA estimates that airlines currently spend approximately 1.5% ofglobal airline revenue on operational IT (SITA Survey). These systems include functionalities that support corecapabilities of the air carrier, including reservations booking and related processes, merchandising and points ofsale, CRS, check-in and boarding. According to T2RL PSS, the world market for such passenger sales andservice systems is now worth more than $2 billion per year. Although the number of new reservationsopportunities varies materially by year, in 2013 T2RL estimated that contracts representing over 1.3 billion PBswill come up for renewal between 2014 and 2017.
In addition to passenger sales and service solutions, certain technology providers, such as Sabre, offer othervalue-added software solutions. These solutions range in functionality from commercial planning to airlineenterprise operations management, including software that manages flight operations, crew scheduling, routeplanning, pricing optimization, contract management and compliance and a host of other key airlinefunctionalities. Based on our industry experience and internal data, we believe that a similar amount is spent eachyear on other industry-specific, software-enabled solutions.
136
Hotel Supplier Technology
Hotels use a number of different technology systems to distribute and market their products and improvetheir operational efficiency. According to Gartner Enterprise, technology spending by the hospitality industrytotaled approximately $27 billion in 2013. Most of the hotel market is highly fragmented. Independent hotels andsmall- to medium-sized chains (groups of less than 300 properties) comprise a substantial majority of hotelproperties and available hotel rooms, while global and regional chains comprise the balance. These independenthotels and small-to medium-sized chains rely heavily on external web-based CRSs to distribute their inventoryacross a variety of channels. CRS platforms provide GDS access, connectivity to major OTAs, internet bookingcapabilities, call center booking platforms, channel management and access to other distribution services on ashared platform. CRS providers may also differentiate themselves with value-added services such as digitalmarketing services, call center outsourcing services, and marketing consulting that help hotels compete. Weexpect opportunities for the top CRS providers to expand significantly, as hotels’ migration to external CRSplatforms continues, including larger hotel chains now considering outsourcing this service to a third-partyplatform.
Additionally, hotels are migrating toward web-based PMSs as recent technical advances, availability andlower total cost of ownership are making them increasingly attractive compared to on-site PMSs, which havehistorically been expensive to maintain. Web-based PMSs also make it possible to create an integrated CRS-PMSweb-based solution, which, based on an internal survey that we conducted, is a product that the majority of hotelswith ten or more properties would be interested in purchasing when they next upgrade their PMS.
As the hotel industry shifts from offline advertising to online marketing, CRS providers offering marketingcapabilities such as website optimization, search engine optimization and online advertising will be morecompetitive players. We also believe that similar opportunities exist in the areas of revenue management, CRMand other operational functions that integrate with the CRS and PMS.
Online Travel Agencies
An OTA is an e-commerce business that allows travelers to conveniently and efficiently shop, compare andpurchase a broad array of travel-related products and services, often sourced in part from GDS platforms.According to Euromonitor Report, global online travel sales will grow at 10% over the next five years.
OTAs compete with traditional offline travel agencies as well as many alternative online travel distributionchannels, including travel supplier direct distribution and metasearch companies such as Kayak, trivago andTripAdvisor. These market participants differentiate themselves on the basis of ease of use, price, customersatisfaction, availability of product type or rate, service, amount, accessibility and reliability of information,brand image and breadth of products offered. This requires OTAs to have effective branding and marketing, anefficient website to support shopping and booking capabilities, as well as strong relationships with travelsuppliers or third-party aggregators to offer a broad supply of travel content to attract customers and generatetransaction and advertising revenue. We believe that customers’ need to trust the provider to fulfill and servicetheir travel purchase often results in brand loyalty to a single site.
137
BUSINESS
Overview
We are a leading technology solutions provider to the global travel and tourism industry. We span the breadth of ahighly complex $6.6 trillion global travel ecosystem, providing key software and services to a broad range of travelsuppliers and travel buyers. Through our Travel Network business, we process hundreds of millions of transactionsannually, connecting the world’s leading travel suppliers, including airlines, hotels, car rental brands, rail carriers,cruise lines and tour operators, with travel buyers in a comprehensive travel marketplace. We offer efficient, globaldistribution of travel content from approximately 125,000 travel suppliers to approximately 400,000 online and offlinetravel agents. To those agents, we offer a platform to shop, price, book and ticket comprehensive travel content in atransparent and efficient workflow. We also offer value-added solutions that enable our customers to better manageand analyze their businesses. Through our Airline Hospitality Solutions business, we offer travel suppliers an extensivesuite of leading software solutions, ranging from airline and hotel reservations systems to high-value marketing andoperations solutions, such as planning airline crew schedules, re-accommodating passengers during irregular flightoperations and managing day-to-day hotel operations. These solutions allow our customers to market, distribute andsell their products more efficiently, manage their core operations, and deliver an enhanced travel experience. Throughour complementary Travel Network and Airline and Hospitality Solutions businesses, we believe we offer thebroadest, end-to-end portfolio of technology solutions to the travel industry.
Our portfolio of technology solutions has enabled us to become the leading end-to-end technology providerin the travel industry. For example, we are one of the largest GDS providers in the world, with a 36% share ofGDS-processed air bookings in 2013. More specifically, we are the #1 GDS provider in North America and alsoin higher growth markets such as Latin America and APAC, in each case based on GDS-processed air bookingsin 2013. In those three markets, our GDS-processed air bookings share was approximately 50% on a combinedbasis in 2013. In our Airline and Hospitality Solutions business, we believe we have the most comprehensiveportfolio of solutions. In 2013, we had the largest third-party hospitality CRS room share based on ourapproximately 27% share of third-party hospitality CRS hotel rooms distributed through our GDS, and,according to T2RL PSS data for 2012, we had the second largest airline reservations system globally. We alsobelieve that we have the leading portfolio of airline marketing and operations products across the solutions thatwe provide. In addition, we operate Travelocity, one of the world’s most recognizable brands in the onlineconsumer travel e-commerce industry, which provides us with business insights into our broader customer base.
Through our solutions, which span the breadth of the travel ecosystem, we have developed deep domainexpertise. Our success is built on this expertise, combined with our significant technology investment and focuson innovation. This foundation has enabled us to develop highly scalable and technology-rich solutions thatdirectly address the key opportunities and challenges facing our customers. For example, we have invested toscale our GDS platform to meet massive transaction processing requirements. In 2013, our systems processedover $100 billion of estimated travel spending and more than 1.1 trillion system messages, with nearly 100,000system messages per second at peak times. Our investment in innovation has enabled our Travel Networkbusiness to evolve into a dynamic marketplace providing a broad range of highly scalable solutions fromdistribution to workflow to business intelligence. Our investment in our Airline and Hospitality Solutionsofferings has allowed us to create a broad portfolio of value-added products for our travel supplier customers,ranging from reservations platforms to operations solutions typically delivered via highly scalable and flexibleSaaS and hosted platforms. We have a long history of engineering innovative travel technology solutions. Forexample, we believe we were the first GDS to enable airlines to sell ancillary products like premium seatsthrough the GDS, the first third-party provider to automate passenger reaccommodation during large operationaldisruptions and the first GDS to launch a B2B app marketplace for our travel agency customers that allows themto customize and augment our Travel Network platform. Our innovation has been consistently recognized in themarket, with awards including the Business Traveler Innovation Award from the Global Business TravelAssociation, an unaffiliated entity, in 2011 and 2012, for which we applied and were one of eight award winnerschosen by popular vote. We were also recognized by the InformationWeek 500 in 2013 as one of the Most
138

Innovative Users of Business Technology for the eleventh consecutive year. These 500 companies are invited toapply and are chosen by InformationWeek, an unaffiliated entity, based on their unconventional approaches andnew ways of solving complex business problems with IT.
We continue to improve our existing solutions and expand our offerings to meet the constantly evolvingneeds of our customers. For example, as demonstrated in the following graphic, we have current or in-development solutions that address five of the six major technology investment priorities highlighted in therecent SITA Survey of major airline carriers:
(1) SITA − The Airline IT Trends Survey (2013).
71%
92%
93%
97%
97%
100%
Wireless Crew ServicesIn-Flight
Expansion of AncillaryServices
Passenger Services viaSocial Media
CRM / Personalization
Passenger Services viaMobile Devices
Business IntelligenceSolutions
% of Airlines with an Investment Program in Place
Airline andHospitality SolutionsKey Airline Priorities (1) Travel Network
0 20 40 60 80 100
Our SaaS and hosted technology platforms allow us to serve our customers primarily through a recurring,transaction-based revenue model based primarily on travel events such as air segments booked, PBs or other relevantmetrics. For the year ended December 31, 2013, 91% of our Travel Network and Airline and Hospitality Solutionsrevenue, on a weighted average basis, was Recurring Revenue. See “Method of Calculation” for a description ofRecurring Revenue. This model has benefits for both our customers and for us. For our customers, our delivery modelallows otherwise fixed technology investments to be variable, providing flexibility in their cost base and smoothinginvestment cycles as they grow, while enabling them to benefit from the continuous evolution of our platform. For us,this recurring, transaction-based revenue model allows us to expand with our customers in the travel industry, asegment of the economy which has grown significantly faster than global GDP over the last 40 years. Since ourrevenues are primarily linked to our customers’ transaction volumes, rather than to airline budget cycles or cyclicalend-customer pricing, which we believe are more volatile than transaction volumes, this model facilitates greaterstability in our business, particularly during negative economic cycles. In addition, as a technology solutions andtransaction processing company, we do not take airline, hotel or other inventory risk, nor are we directly exposed tofuel price volatility or labor unions.
Our recurring, transaction-based revenue model, combined with our high-quality products, reinvestment in ourtechnology, multi-year customer contracts and disciplined operational management, has contributed to our stronggrowth profile, as demonstrated by our Adjusted EBITDA having increased each year since 2008 despite the global
139
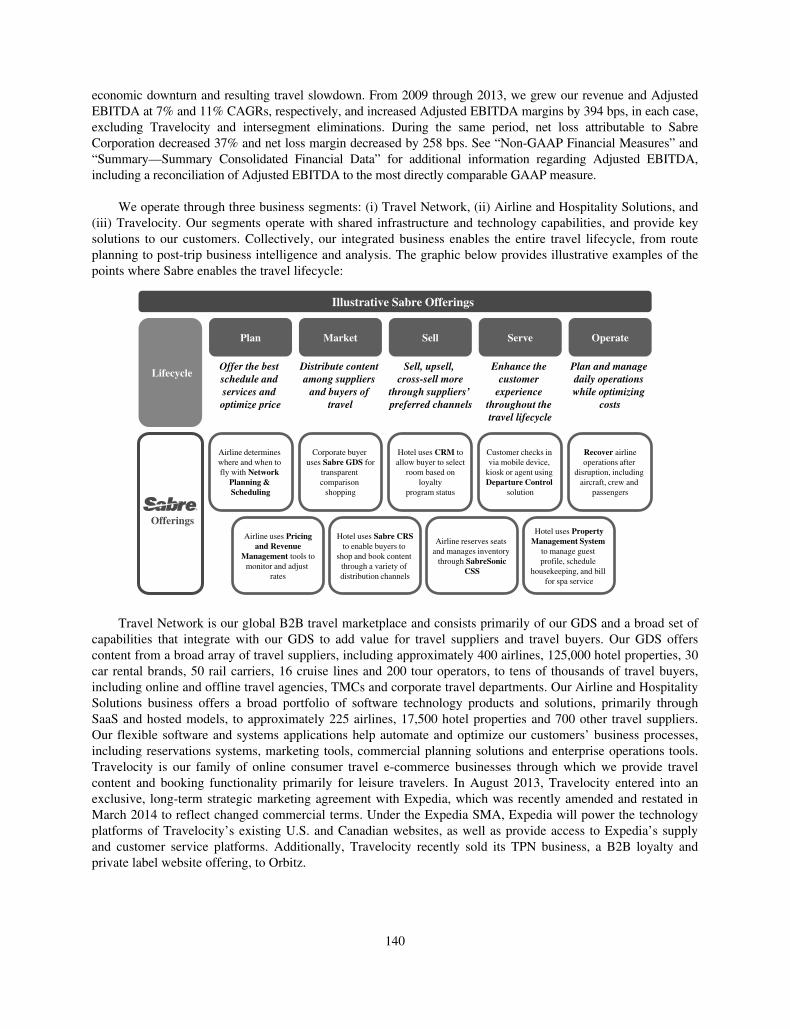
economic downturn and resulting travel slowdown. From 2009 through 2013, we grew our revenue and AdjustedEBITDA at 7% and 11% CAGRs, respectively, and increased Adjusted EBITDA margins by 394 bps, in each case,excluding Travelocity and intersegment eliminations. During the same period, net loss attributable to SabreCorporation decreased 37% and net loss margin decreased by 258 bps. See “Non-GAAP Financial Measures” and“Summary—Summary Consolidated Financial Data” for additional information regarding Adjusted EBITDA,including a reconciliation of Adjusted EBITDA to the most directly comparable GAAP measure.
We operate through three business segments: (i) Travel Network, (ii) Airline and Hospitality Solutions, and(iii) Travelocity. Our segments operate with shared infrastructure and technology capabilities, and provide keysolutions to our customers. Collectively, our integrated business enables the entire travel lifecycle, from routeplanning to post-trip business intelligence and analysis. The graphic below provides illustrative examples of thepoints where Sabre enables the travel lifecycle:
Illustrative Sabre Offerings
Airline uses Pricingand Revenue
Management tools tomonitor and adjust
rates
Airline reserves seats and manages inventory
through SabreSonicCSS
Hotel uses PropertyManagement System
to manage guest profile, schedule
housekeeping, and bill for spa service
Offer the best schedule and services and optimize price
Sell, upsell, cross-sell more
through suppliers’ preferred channels
Enhance the customer
experience throughout the travel lifecycle
Plan and manage daily operations while optimizing
costs
Distribute content among suppliers
and buyers of travel
Airline determines where and when to fly with Network
Planning & Scheduling
Recover airlineoperations after
disruption, including aircraft, crew and
passengers
Corporate buyer uses Sabre GDS for
transparentcomparison
shopping
Hotel uses CRM toallow buyer to select
room based onloyalty
program status
Customer checks in via mobile device,
kiosk or agent using Departure Control
solution
Hotel uses Sabre CRSto enable buyers to
shop and book content through a variety of distribution channels
Lifecycle
Offerings
Plan Market Sell Serve Operate
Travel Network is our global B2B travel marketplace and consists primarily of our GDS and a broad set ofcapabilities that integrate with our GDS to add value for travel suppliers and travel buyers. Our GDS offerscontent from a broad array of travel suppliers, including approximately 400 airlines, 125,000 hotel properties, 30car rental brands, 50 rail carriers, 16 cruise lines and 200 tour operators, to tens of thousands of travel buyers,including online and offline travel agencies, TMCs and corporate travel departments. Our Airline and HospitalitySolutions business offers a broad portfolio of software technology products and solutions, primarily throughSaaS and hosted models, to approximately 225 airlines, 17,500 hotel properties and 700 other travel suppliers.Our flexible software and systems applications help automate and optimize our customers’ business processes,including reservations systems, marketing tools, commercial planning solutions and enterprise operations tools.Travelocity is our family of online consumer travel e-commerce businesses through which we provide travelcontent and booking functionality primarily for leisure travelers. In August 2013, Travelocity entered into anexclusive, long-term strategic marketing agreement with Expedia, which was recently amended and restated inMarch 2014 to reflect changed commercial terms. Under the Expedia SMA, Expedia will power the technologyplatforms of Travelocity’s existing U.S. and Canadian websites, as well as provide access to Expedia’s supplyand customer service platforms. Additionally, Travelocity recently sold its TPN business, a B2B loyalty andprivate label website offering, to Orbitz.
140

For the years ended December 31, 2013 and 2012, we recorded revenue of $3,050 million and $2,974 million,respectively, net loss attributable to Sabre Corporation of $100 million and $611 million, respectively, and AdjustedEBITDA of $791 million and $787 million, respectively, reflecting a 3% and 21% net loss margin and a 26% and 26%Adjusted EBITDA margin, respectively. For additional information regarding Adjusted EBITDA, including areconciliation of Adjusted EBITDA to the most directly comparable GAAP measure, see “Non-GAAP FinancialMeasures” and “Summary—Summary Consolidated Financial Data.” For the year ended December 31, 2013, TravelNetwork contributed 58%, Airline and Hospitality Solutions contributed 23%, and Travelocity contributed 19% ofour revenue (excluding intersegment eliminations). During this period, shares of Adjusted EBITDA forTravel Network, Airline and Hospitality Solutions, and Travelocity were approximately 77%, 21% and 2%,respectively, (excluding corporate overhead allocations such as finance, legal, human resources and certaininformation technology shared services).
We are headquartered in Southlake, Texas, and employ approximately 10,000 people in approximately 60countries around the world. We serve our customers through cutting-edge technology developed in six facilitieslocated across four continents.
Our Competitive Strengths
We believe the following attributes differentiate us from our competitors and have enabled us to become aleading technology solutions provider to the global travel industry.
Broadest Portfolio of Leading Technology Solutions in the Travel Industry
We offer the broadest, most comprehensive technology solutions portfolio available to the travel industryfrom a single provider, and our solutions are key to the operations of many of our travel supplier and travelagency customers. Travel Network, for example, provides a key technology platform that enables efficientshopping, booking and management of travel itineraries for online and offline travel agencies, TMCs andcorporate travel departments. In addition to offering these and other advanced functionalities, it is a valuabledistribution and merchandising channel for travel suppliers to market to a broad array of customers, particularlyoutside their home countries and regions. Additionally, we provide SaaS and hosted solutions that run many ofthe most important operations systems for our travel supplier customers, such as airline and hotel reservationssystems, revenue management, crew scheduling and flight operations. We believe that our Travel Network andAirline and Hospitality Solutions offerings address customer needs across the entire travel lifecycle, and that weare the only company that provides such a broad portfolio of technology solutions to the travel industry. Thisbreadth affords us significant competitive advantages including the ability to leverage shared infrastructure, acommon technology organization and product development. Beyond scale and efficiency, our position spanningthe breadth of the travel ecosystem helps us to develop deep domain expertise and to anticipate the needs of ourcustomers. Taken together, the value, quality, and breadth of our technology, software and related customerservices contribute to our strong competitive position.
Global Leadership Across Growing End Markets
We operate in areas of the global travel industry that have large and growing addressable customer bases.Each of our businesses is a leader in its respective area. Sabre is the leading GDS provider in North America,Latin America, and APAC, with 55%, 57%, and 39% share of GDS-processed air bookings, respectively, in2013. Additionally, Airline Solutions is the second largest provider of reservations systems, with an 18% globalshare of 2012 PBs, according to T2RL PSS. We believe that we have the leading portfolio of airline marketingand operations products across the solutions that we provide. We also believe our Hospitality Solutions businessis the leader in hotel reservations, handling 27% of third-party hospitality CRS hotel rooms through our GDS in2013. See “Method of Calculation” for an explanation of the methodology underlying our GDS-processed airbookings share and third-party hospitality CRS hotel room share calculations.
141
Looking forward, we expect to benefit from attractive growth in our end markets. Euromonitor expects a 4%CAGR in air travel and hotel spending from 2013 to 2017 (Euromonitor Database). According to GartnerEnterprise, technology spending by the air transportation and hospitality sectors is expected to grow significantlyfrom $60 billion in 2013 to over $70 billion in 2017. Within our Travel Network business, we also expect ourpresence in economies with strong GDP growth and regions with faster air traffic growth, such as APAC, LatinAmerica and MEA, will further contribute to the growth of our businesses. Similarly, our Airline Solutionsreservations products, customers are weighted toward faster-growing LCC/hybrids, which representedapproximately 45% of our 2012 PBs.
Innovative and Scalable Technology
Two pillars underpin our technology strategy: innovation and scalability. To drive innovation in our travelmarketplace business, we make significant investments in technology to develop new products and addincremental features and functionality, including advanced algorithms, decision support, data analysis and othervaluable intellectual property. This investment is supported by our global technology teams comprisingapproximately 4,000 employees and contractors. This scale and cross-business technology organization createsefficiency and a flexible environment that allows us to apply knowledge and resources across our broad productportfolio, which in turn fuels innovation. In addition, our investments in technology have created a highlyscalable set of solutions across our businesses. For example, we believe our GDS is one of the most heavilyutilized SOA environments in the world, processing more than 1.1 trillion system messages in 2013, with nearly100,000 system messages per second at peak times. Our Airline and Hospitality Solutions business employshighly reliable software technology products and SaaS and hosted infrastructure. Compared to traditional in-house software installations, SaaS and hosted technology offers our customers advantages in terms of costsavings, more robust functionality, increased flexibility and scale, and faster upgrades. As an example of theSaaS and hosted scalability benefit, our delivery model has facilitated an increase in the number of PBs in ourAirline Solutions business from 288 million to 478 million from 2009 to 2013. Our investments in technologymaintain and extend our technology platform which has supported our industry-leading product innovation. Onthe scale at which we operate, we believe that the combination of an expanding network and technologyinvestments continues to create a significant competitive advantage for us.
Stable, Resilient, and Diversified Business Models
Travel Network and much of Airline and Hospitality Solutions operate with a transaction-based businessmodel that ties our revenue to a travel supplier’s transaction volumes rather than to its unit pricing for an airplaneticket, hotel room or other travel product. Travel-related businesses with volume-based revenue models havegenerally shown strong visibility, predictability and resilience across economic cycles because travel suppliershave historically sought to maintain traveler volumes by reducing prices in an economic downturn.
Our resilience is also partially attributable to our non-exclusive multi-year contracts, in our Travel Networkbusiness. For example, although most of our contracts have terms of one to three years, contracts with our majortravel buyer and travel supplier customers, which represent the majority of Travel Network revenue, have five toten year terms and three to five year terms, respectively. Similarly, our Airline Solutions business has contractsthat typically range from three to seven years in length, and our Hospitality Solutions business has contracts thattypically range from one to five years in length. Our Travel Network and Airline and Hospitality Solutionsbusinesses also deliver solutions that are integral components of our customers’ businesses, and have historicallyremained in place once implemented. In our Travel Network business and our Airline and Hospitality Solutionsbusiness, 94% and 84% of our revenue was Recurring Revenue, respectively, in 2013.
In addition to being stable, our businesses are also diversified. Travel Network and Airline and HospitalitySolutions generate a broad geographic revenue mix, with a combined 43% of revenue generated outside theUnited States in 2013. None of our travel buyers or travel suppliers accounted for more than 10% of our revenuefor the years ended December 31, 2013 or 2012.
142

Strong, Long-Standing Customer Relationships
We have strong, long-standing customer relationships with both travel suppliers and travel buyers. Theserelationships have allowed us to gain a deep understanding of our customers’ needs, which positions us well tocontinue introducing new products and services that add value by helping our customers improve their businessperformance. In our Travel Network business, for example, by providing efficient and quality services, we havedeveloped and maintained strong customer relationships with TMCs, major corporate travel departments and travelsuppliers, with some of these relationships dating back over 20 years. Through our Travelocity business, we havegained important insights into what online travel companies need in order to best serve their customers, and we areable to leverage that knowledge to develop products and services to address those needs.
We believe that our strong value proposition is demonstrated by our ability to retain customers in a highlycompetitive marketplace. For each of the years ended December 31, 2013, 2012 and 2011, our CustomerRetention rate for Travel Network was 99%. For our Airline Solutions business, our Customer Retention rate was98%, 96% and 96% for the years ended December 31, 2013, 2012 and 2011, respectively, and our CustomerRetention rate for our Hospitality Solutions business was 96%, 96% and 98% for the same periods, respectively.See “Method of Calculation” for a description of Customer Retention.
Deep and Experienced Leadership Team with Informed Insight into the Travel Industry
Our management team is highly experienced, with comprehensive expertise in the travel and technologyindustries. Many of our leaders have more than 20 years of experience in multiple segments of the travel industryand have held positions in more than one of our businesses, which provides them with a holistic andinterdisciplinary perspective on our company and the travel industry.
By investing in training, skills development and rotation programs, we seek to develop leaders with broadknowledge of our company, the industry, technology, and specific customer needs. We also hire externally asneeded to bring in new expertise. Our blend of experience and new hires across our team provides a solidfoundation on which we develop new capabilities, new business models and new solutions to complex industryproblems.
Our Growth Strategy
We believe we are well-positioned for future growth. First, we expect the continued macroeconomicrecovery to generate travel growth, compounded by the continuing trend towards the outsourcing of traveltechnology. In addition, we are well-positioned in market segments which are growing faster than the overalltravel industry, with leading market positions in our Travel Network business in Latin America and APAC. Inour Airline Solutions reservations systems, LCC/hybrids, which are growing traffic faster than traditionalairlines, accounted for approximately 45% of our PBs in 2012. Supported by these industry trends, we believeboth our Travel Network and our Airline and Hospitality Solutions businesses have significant opportunities toexpand their customer bases, further penetrate existing customers, extend their geographic footprint and developnew products. By executing on the following strategies and, when appropriate, selective strategically alignedacquisitions, we intend to capitalize on these positive trends:
Leverage our Industry-Leading Technology Platforms
We have made significant investments in our technology platforms and infrastructure to develop robust,scalable software as well as SaaS and hosted solutions. We plan to continue leveraging these investments acrossour organization, particularly in our Travel Network and Airline and Hospitality Solutions businesses, to catalyzeproduct innovation and speed-to-market. We will also continue to shift toward SaaS and hosted infrastructure andsolutions as we further develop our product portfolio.
143

Expand our Global Travel Marketplace Leadership
Travel Network intends to remain the global B2B travel marketplace of choice for travel suppliers and travelbuyers by executing on the following initiatives:
• Targeting Geographic Expansion: From 2009 to 2013, we increased our GDS-processed air bookingsshare in the Middle East, Russia and Brazil by 744 bps, 327 bps and 267 bps, respectively. Wecurrently have initiatives in place across Europe, APAC and Latin America to further expand in thoseregions.
• Attracting and Enabling New Marketplace Content: We are actively adding new travel supplier contentwhich generates revenue directly through incremental booking volumes associated with the newcontent and reinforces the virtuous cycle of our Travel Network business: as we add more suppliercontent to our marketplace, we experience increased participation from travel buyers, which, in turn,encourages travel suppliers to contribute additional content to our marketplace. We have beensuccessful in converting notable carriers that previously only used direct distribution, such as JetBlueand Norwegian, to join our GDS, and we believe there is a similar opportunity to increase theparticipation of less-penetrated content types like hotel properties, where we estimate that onlyapproximately one-third participate in a GDS. In addition to attracting new supplier content, we aim toexpand the content available for sale from existing travel suppliers, including ancillary revenue—acategory of airline revenue worth more than $36 billion in the aggregate across the travel industry in2012, according to IdeaWorks. We seek additional opportunities to capitalize on this trend, such as bysupporting our customers’ branded fare initiatives.
• Continuing to Invest in Innovative Products and Capabilities: The development of cutting-edgeproducts and capabilities has been critical to our success. We plan to continue to invest significantresources in solutions that address key customer needs, including mobility (e.g., TripCase), dataanalytics and business intelligence (e.g., Sabre Dev Studio, Hotel Heatmaps, Contract OptimizationServices), and workflow optimization (e.g., Sabre Red App Centre, TruTrip).
Drive Continued Airline and Hospitality Solutions Growth and Innovation
Our Airline and Hospitality Solutions business has been a key growth engine for us, increasing both revenueand Adjusted EBITDA by 72% from 2009 to 2013. We believe Airline and Hospitality Solutions will continue todrive company growth through a combination of underlying customer and market growth, as well as through thefollowing strategic growth initiatives.
• Invest in Innovative Airline Products and Capabilities: We have a long history of investment ininnovation. For example, we believe we were the first technology solutions provider to provide real-time revenue integrity and the first third-party provider to automate passenger reaccommodation duringlarge operational disruptions. We see a continued opportunity to innovate in areas such as retailingsolutions, mobile capabilities, data analytics and business intelligence offerings.
• Continue to Add New Airline Reservations Customers: Over the last four years, we have added airlinecustomers representing over 110 million annual PBs from many innovative, fast-growing airlines suchas Etihad Airways, Virgin Australia, JetBlue and LAN. Although the number of new reservationsopportunities varies materially by year, in 2013, T2RL estimated that contracts representing over1.3 billion PBs will come up for renewal between 2014 to 2017, of which over 1.1 billion PBs are fromairlines that do not pay us PB fees today. As of this filing, airlines won but not yet implemented bySabre boarded over 220 million PBs in 2012, according to T2RL. This includes a long-term agreementannounced in January 2014 with American Airlines for Sabre to be its reservations system providerfollowing its merger with US Airways.
144

• Further Penetrate Existing Airline Solutions Customers: We believe there is an opportunity to sell moreof our extensive solution set to our existing customers. Of our 2013 customers in T2RL’s top 100passenger airlines, 35% had one or two non-reservations solution sets, 36% had three to five and 29%had more than five. Historically, the average revenue would have approximately tripled if a customermoved from the first category to the second, and nearly tripled again if a customer moved to the thirdcategory. Leveraging our brand, we intend to continue to promote the adoption of our products withinand across our existing customers.
• Invest Behind Rapidly Growing Hospitality Solutions Business: Our Hospitality Solutions business hasgrown rapidly, with 19% revenue CAGR from 2009 to 2013, and we are focused on continuing thatgrowth going forward. We currently have initiatives to grow in our existing footprint and expand ourpresence in APAC and EMEA, which collectively accounted for only 32% of our Hospitality Solutionsbusiness revenue in 2013. We plan to accomplish this through a combination of cross-selling additionalproducts to our existing customers, expanding our global reseller network and enhancing our productoffering.
Continue to Focus on Operational Efficiency Supported by Leading Technology
As an organization, we have a track record of improving operational efficiency and capitalizing on ourscalable technology platform and operating leverage in our business model. We have expanded AdjustedEBITDA margins by over 550 bps since 2009 in our Travel Network business while growing the business andintroducing new products. We intend to continue to increase our operational efficiency by following a sharedcapabilities, technology and insights approach across our businesses. For example, through the Expedia SMA weintend to reduce direct costs associated with Travelocity and expect to improve our Adjusted EBITDA byproviding our customers with the benefit of Expedia’s long-term investment in its technology platform toincrease conversion, improve operational efficiency, and shift our focus to Travelocity’s strengths in marketingand retailing. Additionally, Travelocity recently sold its TPN business, a B2B loyalty and private label websiteoffering, to Orbitz. We will continue to work toward identifying operational and technological efficiencies whilecontinuing to support our investments and strategic priorities to maintain our leadership position in the travelindustry.
Our Businesses
Travel Network
Travel Network is our global B2B travel marketplace and consists primarily of our GDS and a broad set ofsolutions that integrate with our GDS to add value for travel suppliers and travel buyers. The distributionplatform component of a GDS serves the role of a transaction processor for the travel industry, while the value-added integrated solutions make the GDS a true marketplace. Our GDS facilitates travel by efficiently bringingtogether travel content such as inventory, prices, and availability from a broad array of travel suppliers, includingairlines, hotels, car rental brands, rail carriers, cruise lines and tour operators, with a large network of travelbuyers, including online and offline travel agencies, TMCs and corporate travel departments. We deliver value toour travel buyer customers by providing them with comprehensive and competitive travel content. Similarly, webring value to our travel supplier customers by providing efficient and cost-effective distribution andmerchandising services reaching approximately 400,000 travel agents. We are one of the largest GDS providersin the world, with a 36% share of GDS-processed air bookings in 2013. More specifically, we are the #1 GDSprovider in North America and also in higher growth markets such as Latin America and APAC. In those threemarkets, our GDS-processsed air bookings share was approximately 50% on a combined basis in 2013. See
145

“Method of Calculation” for an explanation of the methodology underlying our GDS-processed air bookingsshare calculation. The following chart illustrates our share of GDS-processed air bookings as of December 31,2013:
Sabre57%
Amadeus38%
Travelport5%
#1 GDS in North America #1 GDS in Latin America #3 GDS in EMEA #1 GDS in APAC
GDS SHARE – NORTH AMERICA GDS SHARE – LATIN AMERICA GDS SHARE – EMEA GDS SHARE – APAC
Sabre39%
Amadeus38%
Travelport23%
Sabre13%
Amadeus63%
Travelport24%
Sabre55%
Amadeus14%
Travelport31%
Amadeus39%
Travelport25% Sabre
36%
Source: internal estimates
We expect Travel Network’s market position in economies with robust GDP growth, such as APAC, LatinAmerica and MEA, will drive continued growth for our businesses, while the strength of our GDS in large,developed regions, such as North America and Europe, positions us for stable growth as the recovery from theglobal economic downturn continues. In addition, we serve a large portion of APAC through our regional jointventure partners, including Abacus and Infini. 100% of the GDS transactions of these joint venture partners areprocessed and powered by our GDS.
Travel buyers can shop and book approximately 400 airlines, 125,000 hotel properties, 30 car rental brands,50 rail carriers, 16 cruise lines and 200 tour operators using our GDS. In 2013, our systems processed over $100billion of estimated travel spending, including sales from our joint venture partners. In addition, we believe thatour business benefits from a virtuous cycle. As we add more supplier content to our marketplace, we experienceincreased participation from travel buyers. This, in turn, encourages travel suppliers to contribute additionalcontent to our marketplace, driving a virtuous cycle.
Our travel marketplace also includes advanced capabilities and automated solutions that, among otherthings, enable travel suppliers and travel buyers to operate more efficiently, optimize their performance acrossvarious metrics and provide insight into customer booking patterns. Through our GetThere products, we offer asuite of tools that tailor these services to corporate travel departments, providing capabilities such as facilitatingrate negotiations, simplifying compliance with corporate travel policies and tracking business travel online. Weare continually investing to enhance our solutions offering, such as our data analytics and business intelligencecapabilities, and to enable emerging travel technologies and innovative apps, including mobile. For example, ourproduct offerings include TripCase, our mobile and web traveler services platform that provides passengers withmobile itinerary management and real-time trip details.
146
Relative to our competitors, we believe we are the travel marketplace of choice among many global travelbuyers, with:
• over 50% of the GDS-processed air bookings of the four largest global TMCs (American Express,Carlson Wagonlit Travel, BCD Travel, and Hogg Robinson Group) in 2013;
• customers including over 80% of the Business Travel News Corporate Travel 100, which are thecorporations with the largest travel expenditures as measured by their 2012 U.S. booked air volume;
• 62% GDS-processed air bookings share of Expedia, Priceline and Travelocity in 2013, with bookingsfrom Orbitz anticipated to start in 2015; and
• a Customer Retention rate of 99% in 2013.
Strategy
We are executing on a number of strategies to support our future growth going forward, including:
Targeting Geographic Expansion. We intend to accelerate the growth of our leading technology-enabledsolutions by deepening our presence in high-growth geographies. We believe that our strategies will position oursolutions to better serve travel suppliers and travel buyers in those geographies as travel consumption grows.With our global content, strength in the corporate segment, and industry-leading search technology, we have ademonstrated ability to rapidly expand our geographic footprint. For example, from 2009 to 2013, we increasedour GDS-processed air bookings share in the Middle East, Russia and Brazil by 744 bps, 327 bps and 267 bps,respectively. We are currently pursuing a number of initiatives to continue our geographic expansion, including:
• European growth: Expand our presence in Europe, including high-growth Eastern European markets,by leveraging our global relationships with travel suppliers and travel buyers operating in thosemarkets and by adapting our product capabilities to meet regional needs. For example, we areimplementing dynamic schedule updates to additional European airlines to improve schedulingaccuracy through the GDS, and we are integrating hotel pricing components in certain markets toimprove travel agent workflow.
• APAC growth: Secure our leadership position by optimizing our strategic partnerships, leveraging ourcorporate relationships and continuing to add APAC-focused travel suppliers. For example, we haverecently added Jetstar and PAL Express to our GDS.
• Latin American growth: Add agency customers and enhance travel content in key Latin Americancountries with differentiated and innovative products. For example, Total Trip, a graphical module thatsells prepaid hotels and is integrated with the Sabre Red Workspace, has gained significant popularityamong our Latin American customers.
Attracting and Enabling New Marketplace Content. We are actively adding content to reinforce the virtuouscycle of Travel Network as well as generate revenue directly through incremental bookings volumes associatedwith the new content. We believe there are two broad categories of opportunities to do so:
• Add new supplier segments: Historically, we have grown the number and participation levels of travelsuppliers. For example, we have increased the utilization of our GDS by airlines such as JetBlue andVirgin Australia. Beyond air content, we believe there is a significant opportunity to add other types ofcontent, such as hotel properties. We estimate that, as of December 31, 2013, only approximatelyone-third of hotel properties participate in a GDS, compared to approximately 90% of RepresentativeAirlines, weighted by PB volume. We believe this is an attractive opportunity and we are pursuinginnovative strategic options, such as working with hotel aggregators, to access this and other segments.We have also leveraged our product innovation to add new supplier segments. App developers, forexample, have used the Sabre Red App Centre to add new content types, such as town car service, tothe marketplace.
147
• Add new travel content from existing suppliers: We aim to increase the types of travel contentavailable on our GDS from existing suppliers. Many travel suppliers, especially airlines, are separatelymonetizing ancillary products that were previously bundled with seat inventory or other core content atno additional charge. Ancillary revenue was worth more than $36 billion in the aggregate across thetravel industry in 2012, according to IdeaWorks. Sabre was the first travel solutions provider to enableairlines to sell ancillary products such as seat assignments through the GDS. Suppliers are also seekingto create personalized offers based on individual traveler and shopping information. Sabre’s CustomOffers gives travel suppliers the ability to create personalized offers such as special rates and roomupgrades for hotels and premium seating or check-in for airlines. As airlines and other travel supplierscontinue to expand ancillary products, personalized offers, and travel products, we intend to deliversolutions to sell these offerings and differentiate ourselves as an effective marketplace.
Continuing to Invest in Innovative Products and Capabilities. In addition to extending our marketplace andtechnology leadership with our GDS solution, we strive to develop new products to enhance the value of ourTravel Network offering. We have focused our investment efforts on addressing travel suppliers’ and travelbuyers’ most significant business needs, including:
• Mobile: Mobile platforms have created new ways for customers to research, book and experience traveland are expected to account for over 30% of online travel sales by 2017, according to EuromonitorReport. To address this need, we launched TripCase, a mobile travel app, in 2009. TripCase is a mobiletool that allows travel suppliers, agencies, and corporations to anticipate traveler needs (e.g., the abilityto manage, revise, and check their journey itinerary and preferences) in real-time. As a result of addingenhanced capabilities, we have been able to rapidly accelerate user adoption. Since the beginning of2012 through 2013, we multiplied the TripCase consumer user base six-fold from approximately400,000 to approximately 2.5 million. Over 15,000 agencies and 26 airlines are now using TripCase foritinerary management and document delivery to their customers. Our mobile success has also wonindustry-wide recognition. For example, TripCase was named the “Best Mobile Solution” by Eye forTravel, an unaffiliated entity, chosen by a preliminary online vote and an independent panel of judgesfrom a pool of eight applicants based on a number of factors including design, features, usability,technology, innovation, speed and performance. In 2013, Sabre launched TripCase Corporate, thetravel industry’s first set of integrated corporate features on mobile, which is designed to improvetravel programs for corporations while also simplifying business travel for employees. We intend tocontinue pursuing mobile innovation with TripCase and other solutions, including new mobileofferings for other key point-of-sale and service tools, such as our recently launched and rapidlygrowing Sabre Red Mobile Workspace.
• Data analytics and business intelligence: Travel suppliers and travel buyers are increasingly focused ondata analytics to inform and enable better decision-making. In fact, according to the SITA Survey,100% of surveyed airlines are investing in business intelligence solutions. Our data-rich platformcontains significant travel-related data such as shopping and purchasing behavior. Our customers canbenefit from tools that allow data-driven insights. We are developing products to satisfy this demand.For example, Sabre Dev Studio offers travel and non-travel businesses access to the mostcomprehensive travel data set in the world; over 3,500 companies rely on Sabre’s applicationprogramming interfaces, travel data streams, and notification services to power their applications andwebsites. Hotel Heatmaps allow hotel suppliers to analyze shopping and conversion volume bycustomer segment over time. Contract Optimization Services uses sophisticated analytics aroundbooking trends, origin/destination data and other data to help travel management companies and theircorporate customers optimize their travel policies. We believe these and several other businessintelligence solutions position us well to capitalize on the positive secular trends around data analytics.
• Workflow optimization: We believe that our innovative workflow tools are significant differentiatorsthat encourage TMCs and corporate participants in the travel ecosystem to choose Travel Network. Asa result, the development of new and improved workflow tools has long been a tenet of our innovation
148

strategy. For example, with Sabre Red Workspace, we created a pioneering, fully graphical interfacethat is now used by thousands of travel agents. In 2012, we introduced Sabre Red App Centre,becoming the first GDS to provide an online B2B marketplace to connect travel buyers withapplication providers. With access to over 150 different applications, travel agencies can service a widerange of business needs, from tracking agent productivity to converting currency to building trip plansfor clients. As part of our recognition in the InformationWeek 500 in 2012, InformationWeek alsochose to highlight Sabre Red App Centre as one of the Top 20 Great Ideas to Steal of 2012. In 2013,we announced our plans to develop TruTrip, which is designed to help corporate travel managers andTMCs manage and track bookings regardless of the channel through which they were booked.
Geographic Scope
As of December 31, 2013, approximately 400,000 travel agents in 145 countries on six continents use ourGDS. Additionally, more than half of Travel Network’s employees are located outside North America. We areone of the largest GDS providers in the world, with a 36% share of GDS-processed air bookings in 2013. Morespecifically, we are the #1 GDS provider in North America and also in higher growth markets such as LatinAmerica and APAC. In those three markets, our GDS-processed air bookings share was approximately 50% on acombined basis in 2013. See “Method of Calculation” for an explanation of the methodology underlying ourGDS-processed air bookings share calculation. By growing internationally with our TMC and OTA customersand expanding the travel content available on our GDS to target regional traveler preferences, we anticipate thatwe will maintain share in key developed markets and grow share in Europe, APAC and Latin America.
Internationally, we market our GDS both directly and through joint venture and distribution arrangements.Our marketing partners principally include airlines that have strong relationships with travel agents in APAC andthe Middle East as well as entities that operate regional computer reservations systems or other travel-relatednetwork services. With the combined strength of our technology and content as well as our partners’ localcommercial skills and market knowledge, these partnerships allow us to gain traction in local markets and growour share and distribution reach with lower risk. Through these partnerships, we are able to form strongrelationships with key airlines and other travel suppliers that we can utilize in our other businesses.
Travel Network’s joint venture and distribution partners include:
• Abacus, a B2B travel e-commerce provider that is based in Singapore and operates in APAC. We own35% of the joint venture and Abacus International Holdings, a consortium of eleven Asian airlines,owns the remainder. Travel Network provides Abacus with data, transaction processing and productdevelopment services. See Note 6, Equity Method Investments, to our audited consolidated financialstatements included elsewhere in this prospectus.
• Travel Network Middle East, which provides technology services, bookable travel products anddistribution services for travel agencies, corporations and travel suppliers in the Middle East. We own60% of the joint venture and Gulf Air Company GSC owns 40%.
• Infini, one of the two largest travel e-commerce providers in Japan. Infini is owned 40% by AbacusInternational Holdings and 60% by All Nippon Airways and provides booking capability for air, hoteland car rental. Travel Network provides Infini with data and transaction processing and productdevelopment services.
• Non-equity marketing arrangements with: (i) Glodis Travel Technology Ltd in the Ukraine,(ii) InterguideAir Ltd in Nigeria, and (iii) Emirates in the UAE and in a number of countries in Africa.Sabre has a 40% investment in ESS Electroniczne Systemy Sprzedazy Sp.Zo.o, a product developmentand tour distribution business in Poland. Each of these distributes our products and services in selectedcountries in EMEA.
149

Key Metrics
During the year ended December 31, 2013, Travel Network generated 368 million Direct Billable Bookings.Our Recurring Revenue, as a percentage of total Travel Network revenues, was 94% in each of the years endedDecember 31, 2013, 2012 and 2011. See “Method of Calculation” for an explanation of the methodologyunderlying our GDS-processed air bookings share calculation. For additional segment information, see Note 21,Segment Information, to our audited consolidated financial statements included elsewhere in this prospectus.
Product Offering
In its early years, our B2B travel product offering was comprised of our GDS, which had shopping, bookingand fulfillment capabilities for airline seats, and later, hotel and other travel inventory. As our travel buyers’ andtravel suppliers’ businesses have become increasingly complex, Travel Network adapted its offerings to include abroad set of products and services that bring additional value to our customers and help them use the marketplacemore effectively. Today, Travel Network is a global B2B travel marketplace that offers content from a broadarray of travel suppliers, including approximately 400 airlines, 125,000 hotel properties, 30 car rental brands, 50rail carriers, 16 cruise lines and 200 tour operators, to tens of thousands of travel buyers, including online andoffline travel agencies, TMCs and corporate travel departments.
In addition to our GDS, which provides shopping, booking and fulfillment services, we provide a widerange of products and services to our four customer segments: (i) travel suppliers, (ii) travel agencies,(iii) corporations and travelers, and (iv) other travel industry participants. The following graphic illustrates thevarious components of our Travel Network business, including the original capabilities supported by our GDS inaddition to the enhanced capabilities now available through our global travel marketplace:
Original GDS Enhanced Capabilities
SUPPLIERS AGENCIESCORPORATIONSand TRAVELERS
OTHERPARTICIPANTS
Shopping, Booking, and Fulfillment
Supplier Merchandising and Ancillaries
Data and Business Intelligence
Profile and Customer Centricity
Corporate Travel Support
Supplier Management
Airline Participation
Hotel 2.0
Other SupplierParticipation
Media
Proxy
Agent Point of Sale App Center Payment POS App Center
Productivity Tools
Agent Point of Sale Mobile Assistant Community
Traveler Security Event Notifications
Developer Tools
CertificationPrograms
Web Services
KeyTravelNetworkproductsandservices
150
We continue to develop and offer data-driven business intelligence tools that provide all of our customerswith decision support and reporting capabilities to manage customer, vendor, agency and competitiveperformance. For example, we offer customized low fare shopping tools that automate the ticket shopping andexchange process as well as highly differentiated contract and pricing optimization services that allow agencies,TMCs and corporate travel departments to manage the placement of travel content during the shopping process tooptimize travel savings and improve compensation from preferred suppliers and fare markups.
We offer solutions for travel suppliers that help them display, promote and differentiate their brands andproducts globally; generate, maximize and secure revenue; and obtain, analyze and utilize relevant and accuratedata for strategic decision-making. Our marketplace supports key travel supplier needs, such as airlinecodesharing and marketing and optimization capabilities. Our solutions also provide multi-channelmerchandising capabilities that allow for distribution of ancillary products as well as dynamic pricing, inventoryand revenue management tools. For example, Sabre Custom Offers provides travel suppliers with the ability tocreate personalized offers such as special rates and room upgrades for hotels and premium seating or check-in forairlines based on known customer characteristics and preferences.
We regularly measure our ability to find low fares, consistently finding that our GDS outperformscompetitors in this critical capacity. The most recent third-party evaluation by Fried & Partner found that Sabrefinds the lowest fares more often than leading competitors in all regions around the world.
Travel Network also offers many advanced products and capabilities that add value for travel agencies. OurGDS offers an award-winning user-friendly interface and flexible search parameters, including the option tosearch for hotels that adhere to Global Sustainable Tourism Council standards. It also offers travel agencies post-booking automation providing quality control checks, ticketing and documentation support. More than 200,000offline travel agents in 143 countries access our GDS using Sabre Red Workspace. Sabre Red Workspace is ourprimary travel agency point of sale software and includes features such as customizable screen displays tomaximize preferred supplier agreements, customizable process automation, integration with travel agencyapplications, tools and websites, and new mobile tablet access points. OTAs can access our GDS through SabreWeb Services, our primary point of sale for customers that require access to our global travel marketplacethrough web services.
We also provide travel agencies with integrated solutions that allow them to improve workflow, maximizerevenue, reduce costs and improve customer service. For example, our ClientBase solution includes a CRMsystem that provides complete profile, contact and trip management abilities for developing and maintainingcustomer relationships and increasing productivity as well as a marketing tool that allows travel agents to selectsuppliers, create, track and send targeted marketing programs and obtain tracking reports to measure success.
For corporations and the travel agencies and corporate travel departments that serve them, we offerGetThere, a tool that automates the travel shopping and booking process, facilitates rate negotiations withsuppliers, simplifies compliance with corporate travel policies, tracks information to safeguard business travelersecurity, integrates with the customer’s expense reporting system and includes customer loyalty and businessperformance capabilities.
Our B2B travel business product offerings also reach a variety of other travel customer segments. We servetravelers through TripCase, our mobile and web traveler services platform that keeps travelers informed of theirtrip itineraries and booking information for all reservations made, regardless of booking origin. For new entrantsto the travel industry and Sabre-certified third-party developers, we offer the ability to create and monetize SabreRed Apps, an array of applications designed to meet travel agency needs made available through the Sabre RedApp Centre. Through our Sabre Dev Studio, we provide tools, support and revenue opportunities to these newtravel industry players and non-traditional GDS consumers who want access to our travel information and largeglobal network of travel suppliers and travel buyers. Our developer tools include a portfolio of Sabre applicationprogramming interfaces travel data streams, software development kits, notification services, documentation and
151
sample code. Travel Network also provides data, transaction processing and product development services to ourregional joint venture partners, including Abacus and Infini.
Customers
Customers of Travel Network include:
• travel suppliers, including airlines, hotels, car rental brands, rail carriers, cruise lines, tour operatorsand others;
• corporate travel departments;
• OTAs, offline travel agencies and TMCs;
• travelers; and
• other sellers of travel and consumers of travel information.
As of December 31, 2013, approximately 400,000 travel agents in 145 countries on six continents use ourGDS, making reservations with approximately 125,000 travel suppliers around the world. We intend to increaseour international presence by expanding the travel content available on our GDS to target regional travelerpreferences.
Because of strong products and services, the top ten airline and the top ten travel agency customers of ourTravel Network business have been customers for more than a decade with their diverse technology needssupported by our broad range of products and services. Our Recurring Revenue percentage for our TravelNetwork business was approximately 94% in each of the fiscal years ended December 31, 2013, 2012 and 2011.
Airlines. Approximately 400 airlines, including full service carriers and LCC/hybrids from all regions of theworld, choose to market and sell their inventory through our GDS. Unlike airline direct distribution, our GDSsupports codesharing functionality that allows our airline customers to market their services with partner carriersand creates opportunities for low fare value. Our largest Travel Network suppliers include American Airlines,Delta, US Airways, United, Air Canada, Lufthansa, Air France, British Airways and Emirates, but no customercontributed more than 10% to Travel Network’s revenue for the years ended December 31, 2013, 2012, or 2011.Over the last several years, notable carriers that previously only distributed directly, including JetBlue andNorwegian, have adopted our GDS. Other carriers such as EVA Airways and Virgin Australia have recentlyupgraded their technical connections and increased the level of content they market and sell through our GDS.
Our contracts with major carriers typically last for three to five year terms and are generally subject toautomatic renewal at the end of the term, unless terminated by either party with the required advance notice. Ourcontracts with smaller airlines generally last for one year and are also subject to automatic renewal at the end ofthe term, unless terminated by either party with the required advance notice. We have 28 planned renewals in2014 (representing approximately 22% of our Travel Network revenue for the year ended December 31, 2013)and 24 planned renewals in 2015 (representing approximately 5% of our Travel Network revenue for the yearended December 31, 2013), assuming we reach multi-year agreements for the contracts expected to be renewedin 2014. Although we renewed 24 out of 24 planned renewals in 2013 (representing approximately 25% ofTravel Network revenue for the year ended December 31, 2013), we cannot guarantee that we will be able torenew our airline contracts in the future on favorable economic terms or at all.
Airlines are not contractually required to distribute their content exclusively through our GDS. To provide ourtravel buyer customers with the widest possible range of travel content, we seek to secure (and generally have beenable to secure, with important exceptions) agreements in which the airline agrees to provide most or all of theirpublicly available fares for distribution through our GDS. However, to ensure competitiveness between the travelagents using our GDS, these agreements also typically require that the airline does not discriminate against travelersthat book using our GDS or impose surcharges on such bookings. So long as the airline abides by its content and
152
other commitments, we generally agree to display, load, and process airline data in a non-discriminatory manner onour GDS. We charge transaction-based booking fees for each reservation we process, and pricing depends uponvarious factors, such as the airline’s size, home market, product offering and price, and the length of its relationshipwith us. These airline contracts contain standard representations and warranties, covenants and indemnificationprovisions.
Other travel suppliers. A broad portfolio of other travel suppliers also distribute their inventory through ourGDS, including approximately 125,000 hotel properties, 30 car rental brands, 50 rail lines, 16 cruise lines and200 tour operators. We have enjoyed long-term relationships with our travel suppliers, with some relationshipsexceeding ten years with respect to cruise lines and thirty years with respect to hotels and car rental companies.
Our largest hotel customers include Hilton, Marriott International, Starwood and Intercontinental. Ourcontracts with our hotel customers are non-exclusive and generally last from three to five years and typicallyrenew automatically unless terminated by either party with the required advance notice. Our leading car rentalbrands include Hertz, Avis Budget and Enterprise. Our contracts with car rental companies and cruise lines arenon-exclusive and generally last from two to seven years, and typically renew automatically unless terminated byeither party with the required advance notice. Hotels, car rental companies and cruise lines pay transaction-basedbooking fees based on the number of rooms booked, the number of bookings for vehicle pickup and the numberof sailed cabins, respectively. These hotel, car rental and cruise line contracts contain standard representationsand warranties, covenants and indemnification provisions.
Corporate travel departments. Travel Network serves corporate travel departments through our GDS andother solutions, particularly through our GetThere products. Due to our service and product offerings, we haverelationships with corporate travel departments that have been established for over a decade. Illustrativecustomers include Accenture, Apple, AT&T, BP, GE, Oracle, UBS and UPS. Corporate travelers are more likelyto require flexible scheduling and more complex itineraries, with reservations completed much closer to thedeparture date, and therefore provide significantly higher revenue per trip. As of December 31, 2013, over 80%of the Business Travel News Corporate Travel 100, which are the corporations with the largest travelexpenditures, choose to use our global travel marketplace.
Our contracts with major corporate customers typically last three to five years and generally renewautomatically for successive one to three year periods unless terminated by either party with the required advancenotice. Corporate travel buyers pay a one-time set up fee and monthly fees based on the number of bookingsmade through the system. These contracts with corporate travel departments contain standard representations andwarranties, covenants and indemnification provisions.
Travel agencies. OTAs and TMCs were our two largest global travel agency segments in 2013. Ourprincipal OTA customers are Expedia, Travelocity and Despegar. The four largest global TMCs are AmericanExpress Travel, Carlson Wagonlit Travel, BCD Travel, and Hogg Robinson Group, each of which has had a non-exclusive business relationship with us for more than 10 years. We serve large travel agencies and TMCs thatprocess travel for the U.S. government. We also have thousands of other regional travel agency customers thatserve business, leisure and/or niche travelers.
We typically have non-exclusive, five to ten year contracts with our major travel agency customers. Ourcontracts with TMCs and offline travel agencies typically renew automatically, but the vast majority of ourcontracts with online travel agencies do not automatically renew. Most travel agencies can terminate the contractanytime without cause with the required advance notice. A meaningful portion of our travel agency agreements,typically representing approximately 15% to 20% of our bookings, are up for renewal in any given year.
A travel agency contracts with us for use of our technology, which enables and enhances the agency’sbusiness operations by providing efficient access to broad travel supplier content and the ability to book, reserveand manage such content. We typically provide travel agencies with incentive consideration for each booking
153
that generates revenue for us from a travel supplier, sometimes after certain minimum booking levels are met.This revenue-sharing arrangement incentivizes travel agencies to consolidate demand and use our GDSefficiently. Our contracts with larger travel agencies often increase the incentive consideration when the travelagency processes a certain volume or percentage of its bookings through our GDS. Although we generallyprovide incentive consideration on a periodic basis over the term of the contract, sometimes we provide incentiveconsideration in advance based on an anticipated level of bookings, and the travel agency must repay or rebatesome or all of the incentive consideration if the anticipated level of bookings is not met. Smaller agencies do nottypically have volume or share-based incentive consideration of this kind. Our contracts with travel agenciescontain standard representations and warranties, covenants and indemnification provisions.
Travelers. Travel Network serves travelers directly through TripCase, our mobile and web traveler servicesplatform, and through GetThere, for business travelers. We are also expanding our offerings to business travelersthrough initiatives such as enhanced online and mobile access to itinerary and trip planning information.
Other Sellers of Travel and Consumers of Travel Information. We provide travel data, merchandising,transaction processing and product development services to many other customers, including other travelmarketplaces, metasearch engines, new entrants to the travel industry, developers and industry analysts.
Competitors
Travel Network competes with several other travel marketplace providers, including both regional andglobal players. In addition to Sabre, other key global B2B travel marketplace providers include:
• Amadeus, which is headquartered in Spain and operates the Amadeus distribution system. Amadeus isowned in part by Air France, Iberia and the parent company of Lufthansa. Amadeus owns a minoritystake in Topas, a Korean regional travel marketplace. Based on Marketing Information Data Tapesdata, 33% of its total 2013 GDS-processed air bookings were concentrated in Western Europe,specifically Germany, France, Spain, the United Kingdom, Italy, Norway and Sweden.
• Travelport, which is headquartered in the United Kingdom and owns three separately-operated travelmarketplace systems, Galileo, Apollo and Worldspan.
Sabre is one of the largest GDS providers in the world, with a 36% share of GDS-processed air bookings in2013. More specifically, we are the #1 GDS provider in North America and also in higher growth markets suchas Latin America and APAC. In those three markets, our GDS-processed air bookings share was approximately50% on a combined basis in 2013. We believe GDS-processed air bookings share is a good proxy for overallshare in the business because air bookings comprise the vast majority of the total bookings of the three GDSs.See “Method of Calculation” for an explanation of the methodology underlying our GDS-processed air bookingsshare calculation.
In addition to competing with other GDSs, our GDS competes with local distribution systems and travelmarketplace providers primarily owned by airlines or government entities and operate primarily in their homecountries, including TravelSky in China and Sirena in Russia and the Commonwealth of Independent States.
Our GDS also competes with direct distribution by travel suppliers, in which travel suppliers bypass travelagencies and sell their services directly through their own websites and distribution channels. See “RiskFactors—Travel suppliers’ use of alternative distribution models, such as direct distribution models, couldadversely affect our Travel Network and Travelocity businesses.” Travel suppliers using the GDS incur abooking fee which is, on average, only approximately 2% of the value of the booking. Therefore, the revenuegenerated through the GDS leads to a return on investment that is attractive compared to the incremental cost, inpart because many of the tickets sold on the GDS platform are more expensive long-haul and business traveltickets (particularly those originating outside the home country of the airline) as well as tickets with additionalbooking complexity (e.g., multiple airline itineraries). These platforms also offer a particularly cost-effectivemeans of accessing markets where a travel supplier’s brand is less recognized by using local travel agencies toreach end consumers.
154
The value of the GDS platform is further reinforced by both the new content that continues to enter thesystem and by increasing participation rates—we estimate that Representative Airlines have an approximately90% participation rate in a GDS (weighted by PB volume), as of December 31, 2013. Over the last several years,notable carriers that previously only distributed directly, including JetBlue and Norwegian, have adopted ourGDS. Other carriers such as EVA Airways and Virgin Australia have further increased their participation in ourGDS. Other studies also underscore the value of the global travel marketplace, including a recent TravelClickstudy showing that agents’ use of GDSs for hotel booking is growing faster than their use of any other channel.
In addition to other GDSs and direct distributors, there are a number of other competitors in the traveldistribution marketplace. New entrants in the travel space, including Google (through Google Hotel Finder andFlight Search), TripAdvisor and Kayak offer metasearch capabilities that direct shoppers to supplier websitesand/or OTAs. The impact of these new entrants on the Travel Network business model remains uncertain. See“Risk Factors—Travel suppliers’ use of alternative distribution models, such as direct distribution models, couldadversely affect our Travel Network and Travelocity businesses.” Third-party aggregators, such as FareLogix,TravelFusion and AgentWare, offer solutions to book travel content from a variety of sources, including optionsoutside of our GDS, though we believe their offerings have not yet been widely adopted by travel agents or travelsuppliers due to cost and technology issues. Also, peer-to-peer options for travel services such asaccommodations, tours and car sharing that do not distribute through our GDS are becoming increasingly popularamong consumers worldwide.
Our corporate travel booking tool, GetThere, competes with similar offerings from travel agencies, airlinesand other travel suppliers, including Concur Technologies, Deem, KDS, eTravel and Egencia.
As with other travel marketplace participants, Travel Network strives to provide a variety of attributes to ourtravel buyer and travel supplier customers. See “Industry—Global Distribution System and TravelMarketplace—Competitive Environment” for a discussion of the factors on which such participants compete.
Airline and Hospitality Solutions
Our Airline and Hospitality Solutions business offers a broad portfolio of software technology products andsolutions, through SaaS and hosted delivery model, to approximately 225 airlines, 17,500 hotel properties and 700other travel suppliers. In 2013, our Airline Solutions business represented 84% of Airline and Hospitality Solutionsrevenue and our Hospitality Solutions business represented the remaining 16%. We believe our flexible software andsystems applications, including reservations systems, marketing tools, commercial planning solutions and enterpriseoperations tools, help automate and optimize our customers’ business processes and that our deep domain expertiseand product capabilities enable our customers to address more complex business problems as they grow.
Compared to traditional in-house software installations, our SaaS and hosted models drive value for ourcustomers in a variety of ways: (i) lower total ownership costs (i.e., acquisition costs and operating costs of asolution) as centralized hosting allows our customers to reduce their in-house software and hardware capitaloutlay, management and maintenance expenses; (ii) a “pay-as-you-go” cost structure, which allows ourcustomers to spread their costs over time and link their IT expense with their growth; (iii) more robustfunctionality than would be cost-effective to develop in-house; (iv) scalable delivery that allows us to adapt ourservices to changes in our customers’ technological systems as they grow; and (v) a platform for fasterdeployment of upgrades compared to traditional installations.
The SaaS and hosted approach also benefits our business. On the revenue side, by moving away from one-time license fees to recurring monthly fees, our revenue stream has become more predictable. On the cost side,the SaaS and hosted models’ centralized deployment allows us to save time and money by reducing maintenanceand implementation tasks and lowering operating costs.
155

Strategy
We believe the following strategies will help us continue to grow and realize the potential of Airline andHospitality Solutions:
Invest in Innovative Airline Products and Capabilities. We plan to continue investing in innovativetechnology products that solve the travel industry’s most pressing business problems, as illustrated below:
• Retailing: According to IdeaWorks, ancillary airline revenue, such as the sale of checked bags, wasworth more than $36 billion in the aggregate across the travel industry in 2012. We have invested andcontinue to invest to enable airlines to distribute and sell these ancillary products, and we continue tofocus on delivering additional retailing innovation, including customer-centric merchandising andenhanced ancillary revenue optimization.
• Mobile: Mobile platforms have created new ways for customers to research, book and experiencetravel, and are expected to account for over 30% of online travel sales by 2017, according toEuromonitor Report. Accordingly, travel suppliers, including airlines and hospitality providers, areupgrading their systems to allow for delivery of services via mobile platforms from booking to check-in to travel management. The recent SITA Survey found that 97% of airlines are investing in mobilechannels with the intention of driving mobile across the entire travel experience. This mobile trend alsoextends to the use of tablets and wireless connectivity by the airline workforce, for example automatingcabin crew services and providing flight crews with electronic flight bags, which we are addressingthrough our eFlight Manager product family. As airlines increasingly leverage mobile workforcesolutions, we are investing in mobile capabilities that enable a connected airline, such as electronicflight management solutions that provide real-time connectivity between the cockpit and the airportoperations control center.
• Data analytics and business intelligence: Business intelligence is one of the top two most importantairline IT investment areas, according to the SITA Survey. We recently acquired PRISM, a leadingprovider of innovative business intelligence and decision support software for airlines to maximize thevalue of their corporate contracts. Looking forward, we are investing in products such as a platform forapplications that can support data analytics across multiple systems. Rules can be applied to thisaggregated data to influence decision-making, business processes, and forecasts to create innovativesolutions in areas such as customer centricity, revenue management, and airline operations.
Continue to Add New Airline Reservations Customers. Over the last four years, we have added airlinecustomers representing over 110 million in annual PBs from many fast-growing airlines such as Etihad Airways,Virgin Australia, JetBlue and LAN. Although the number of new reservations opportunities varies materially byyear, in 2013 T2RL estimated that contracts representing over 1.3 billion PBs will come up for renewal between2014 to 2017, of which over 1.1 billion PBs are from airlines that do not pay us PB fees today. As of this filing,airlines won but not yet implemented by Sabre boarded over 220 million PBs in 2012, according to T2RL. Thisincludes a long-term agreement announced in January 2014 with American Airlines for Sabre to be itsreservations system provider following its merger with US Airways.
Further Penetrate Existing Airline Solutions Customers. We believe our solution set is one of the mostextensive in the industry and positions us to address the diverse needs of our customers. We have alreadyestablished commercial relationships with approximately 225 airlines, including 79 of T2RL’s top 100 passengerairlines, which we believe offers the opportunity to sell more of our solutions to our existing customers. Forexample, of our 2013 customers in T2RL’s top 100 passenger airlines, 35% had one or two non-reservationssolution sets, 36% had three to five and 29% had more than five. Historically, the average revenue would haveapproximately tripled if a customer moved from the first category to the second, and nearly tripled again if acustomer moved to the third category. Leveraging our brand, we intend to continue to promote the adoption ofour products within and across our existing customers.
156

Invest Behind Rapidly Growing Hospitality Solutions Business. Our Hospitality Solutions business hasgrown rapidly, with 19% revenue CAGR from 2009 to 2013, and we are focused on continuing to drive thatgrowth going forward. We currently have initiatives to grow in our existing footprint and expand our presence inAPAC and EMEA, which collectively accounted for only 32% of our Hospitality Solutions business revenue in2013. We plan to accomplish this through a combination of strategies, including increasing our share of walletwith customers, expanding our global reseller network and providing more integrated products. For example, weare planning to launch an integrated Hospitality Management Solution which combines previously siloedproducts such as reservations and PMSs. In a recent survey we conducted, a majority of hotels with ten or moreproperties would be interested in purchasing such an integrated solution when they next upgrade their PMS.
Airline Solutions
Our Airline Solutions business provides industry-leading and comprehensive software solutions that helpour airline customers better market, sell, serve and operate. We offer dynamic and customizable reservationssoftware that supports all the essentials of a passenger service system. Our other software solutions help airlinesmake important decisions around marketing and planning, merchandising offerings and managing networkoperations. Over the past 25 years, we have built a broad portfolio of solutions that we believe are distinctive inthe industry in their ability to collectively solve airlines’ most complex problems.
We believe we offer the airline industry the broadest choices available in the marketplace acrossreservations systems, marketing and planning solutions and enterprise operations solutions, due to the followingattributes:
Broadest portfolio of integrated solutions. In a fragmented competitive landscape, we offer the broadestportfolio in the business, which enables airlines to leverage a single relationship to address increasingly complexand interconnected business problems. Our competitors, most of which specialize in either one solution or alimited functionality set, cannot easily replicate the comprehensiveness we provide in a single relationship. Ourwide range of offerings also equips us with multiple strategies to win new customers and further penetrate ourexisting customers. For example, we can serve airlines that have already developed in-house functionalities orthat use other third-party solutions providers by providing solutions that meet needs outside the capabilities oftheir existing solutions and build on these relationships over time to cross-sell additional solutions.
Flexible capabilities. Unlike other solutions providers, whose offerings are often optimized to serve airlinesof a particular scale, our solutions are designed to serve airlines of various sizes and business models, and areable to accommodate change in an airline’s scale and business processes. For example, we believe we are well-positioned to serve LCC/hybrids as they evolve and add new classes of service, aircraft diversity, internationalflying and codesharing, becoming more complex and requiring more advanced technology solutions.Furthermore, the modular nature of our products allows us to integrate with non-Sabre systems.
Industry expertise. Our deep industry expertise allows us to enhance our solutions, as we understand howour solutions integrate with airlines’ technology and business processes. Many of our team members have rootsin the airline industry, having used or developed airline systems and processes as former airline employees.
Scalable SaaS delivery. We offer many of our reservations systems and software applications through SaaSand hosted delivery. Not only do the SaaS and hosted models allow the airline to refocus its resources onrevenue-generating and customer-facing services instead of on maintaining technology, it also closely links anairline’s software expenses with business growth, as software usage is typically related to passenger volumes orother relevant operating metrics. Through our SaaS and hosted delivery, we are able to consistently release newfunctionalities and provide software hosting of higher quality than what a typical airline could afford on its own.
157

Key Metrics
Our reservations system, offered through our SabreSonic CSS product line, is our core offering, comprising55% of overall Airline Solutions revenue for the year ended December 31, 2013. We consider the following keymetrics for our reservations system to be representative of our overall Airline Solutions business:
• Because of our long-standing relationships with customers, the importance and value of our solutionsto an airline’s ability to generate revenue, and the benefits of incumbency, we believe the vast majorityof our revenue is recurring and stable based on transaction volumes. Our Recurring Revenue, as apercentage of total Airline Solutions revenue, was 83% in each of the years ended December 31, 2013,and in 2012 and 2011.
• In 2013, our Airline Solutions business processed reservations for 478 million PBs, representing a 14%CAGR from 2009.
For additional segment information, see Note 21, Segment Information, to our audited consolidatedfinancial statements included elsewhere in this prospectus.
Product Offering
We offer reservations systems and software applications in three functional suites: SabreSonic CSS, SabreAirVision Marketing & Planning and Sabre AirCentre Enterprise Operations. Our broad portfolio provides acomprehensive solutions offering that automates key airline processes, from planning to reservations tooperations. Our solutions are backed by extensive expertise in passenger sales and service, decision support,optimization, business processes, and operations management. Many of our solutions are available through SaaSand hosted delivery and are complementary with one another as well as in-house and other third-party solutions,allowing customers to bundle components that best suit their needs.
Airlines typically buy our solutions from within our functional suites, but we are increasingly engaging withour customers on cross-portfolio opportunities at the executive level. To address this opportunity, we are offeringseveral new products and services which combine competencies from across our functional suites to provideholistic solutions. For example, we are developing our mobile platform to include features that enable airlines toextend capabilities to their customers and staff, like mobile check-in and itinerary management. We are alsoinvesting in a platform for applications that can support data analytics across multiple systems.
As with many software solutions providers, we offer a range of professional services and support servicesthat enable customers to optimize the value of our solutions in the context of their individual business strategies.We also offer business consulting services which draw upon the depth and breadth of our industry expertise tocraft solutions that best fit our customers’ specific needs.
Reservations Systems: SabreSonic Customer Sales & Service
Our SabreSonic CSS reservations offerings provide comprehensive capabilities around managing sales andcustomer service across an airline’s diverse touch points. These capabilities are designed to drive airline revenue,operational efficiency, and customer experience. Our core platform and various add-on solutions are designed toserve airlines of various sizes and business models and are able to accommodate change in an airline’s scale andbusiness processes. For example, we believe we are well-positioned to serve LCC/hybrids as they evolve and addnew services, such as new classes of service, aircraft diversity, international flying and codesharing, becoming
158

more complex and requiring more advanced technology solutions. SabreSonic CSS includes the followingsolution families:
Solution Family Description
Sales & reservations Fully integrated core inventory and reservations platform that supports thevarious steps of an airline’s sales process. Enables airlines to manage and shopinventory, configure offerings, book seats and ancillaries, generate and managetickets and process payments across all points of direct and indirect sales. Thisfully integrated solution powers an airline’s internet booking engine, call center,inventory control, loyalty system, data warehouse, and departure control.Customer profiles ensure customer data availability at all touch points, enablinga consistent customer experience and the ability to provide differentiated serviceto specific passengers. Supports the various sales and service elements ofpartnership agreements such as interline, codeshare, and alliance participation,allowing airlines to provide a seamless customer experience across partnercarriers. Distributes an airline’s merchandising strategy across all channels andenables inventory management through enhanced inventory controls,segmentation, and real-time planning. Ticketing capabilities deliver a robustautomated exchange and refunds processing solution, provide comprehensivereporting and reconciliation for monitoring sales activities, and enable multipleforms of local and international payment options including credit cards, PayPal,Bill Me Later and e-Bank.
Airport solutions Departure control system that manages passenger check-in and aircraft boarding;includes passenger self-service capabilities such as mobile check-in, kioskcheck-in, web check-in and gate reader. Enables automated merchandising ofancillaries and accurate collection of ancillary fees to support an airline’smerchandising strategy, reduces staffing costs with self-service solutions,streamlines agent productivity through an intuitive user interface and ensuresefficient flight loading and safety with an integrated weight and balanceapplication.
Airline retailing E-commerce platform that provides fundamental tools for customer acquisition,merchandising, booking and itinerary management. Accessible to consumers viaweb, mobile, and kiosk. Capabilities include branded fares and ancillary sales,targeted deal management, and self-service exchange and refund management.
B2B distribution Agency management tool that integrates with the airline retailing e-commercesolution to track bookings for agencies that do not participate in electronicbilling and settlement plans, automates the sales reporting process and allowsairlines to assess the credit liability of its agency community.
Platform services Tool that allows airlines to develop their own user-friendly graphical interfacesand automated processes to quickly solve complex business problems acrossmultiple third-party systems; using this tool, airlines can build their ownsolutions that are easy to develop, customize, maintain, and deploy in multipleenvironments. Web services allow airlines to control and differentiate theircustomer touch points by accessing core sales and service capabilities through arobust, efficient programming interface that focuses on the presentation layer,where differentiation is most critical.
Irregular operations (IROPS)reaccommodation
Integrated add-on solution that manages reaccommodation of passengers whenflight schedules change, including automatic inventory search, itineraryadjustment and passenger notification, and coordinates other aspects of irregularoperations recovery, such as crew reassignment and flight schedule adjustment.
Customer centricity Loyalty programs and rules engines for effective CRM, enabling an airline toprovide a differentiated customer experience that reflects the airline’s uniquebrand. Enables an airline to leverage data from multiple systems, combined withrules engines, to create a personalized customer experience across differenttouch points.
159

Marketing & Planning: Sabre AirVision
Our Sabre AirVision Marketing & Planning is a set of strategic airline commercial planning solutions thatfocuses on helping our customers improve profitability and develop their brand. Our Sabre AirVision offeringsinclude:
Solution Family Description
Network planning andscheduling
Solutions that manage and support network planning decisions, such as dataanalysis to design revenue-maximizing city pairs and network layouts. Includestools to manage service dates and times, fleet and airport gate assignments andcodeshare agreements against different demand levels, operating cost scenarios,and spill/recapture rates. Airlines can optimize departure times in an entire hubto maximize connections and revenue, evaluate potential profitability of differentforecasted routes using what-if scenarios, and perform close-in re-fleeting tooptimize capacity against demand right up until boarding time.
Pricing and revenuemanagement
Solutions that manage different aspects of revenue flows for passenger and cargoairlines, including cross-channel fares management, yield management andrevenue integrity to identify and address fraudulent bookings. A pricing decisionsupport solution helps airline analysts examine relevant market data to makeoptimal pricing decisions. A group management solution manages airline grouptraffic and optimizes group pricing and availability decisions based on thebooking’s impact on total network revenue. Revenue management solutionsleverage customer choice modeling to more accurately forecast future demand.A revenue integrity solution performs real-time reviews of bookings as they aremade to identify unintentional and deliberate booking rule violations, and thenreturns them to inventory so they can be purchased by paying customers.
Sales and revenue analysis Solutions that manage corporate contracts and include market intelligence toolsthat leverage our proprietary data set, which provides a complete, aggregatedview of true market demand developed by blending 50 input sources from acrossthe industry. Commercial intelligence tools also incorporate data from across anairline’s own network to provide analysis for decision support. A revenueaccounting solution ensures fast and accurate settlement by automating theaccounting of revenue across multiple airline systems.
Onboard catering andprovisioning
Solutions that manage in-flight services to optimize customer experience andbrand perception, including provision planning, ordering materials, galleymanagement and business intelligence. This solution reduces labor-intensivetasks with automated planning, decreases overall inventory carrying costs, andintegrates with multiple systems to centralize pricing decisions and managementof multiple vendors.
160
Enterprise Operations: Sabre AirCentre
Our Sabre AirCentre Enterprise Operations is a set of strategic solutions that drive operational effectivenessthrough holistic planning and management of airline, airport and customer operations. The Sabre AirCentre suitefocuses on improving efficiency, controlling costs, and managing change through maximizing operationalcontrol. Our Sabre AirCentre offerings include:
Solution Family Description
Flight management Solutions that manage aircraft flight operations, including developing flight plansand schedules, providing maps and weather information, and tracking aircraft. Aflight plan solution determines the optimal route based on airline prioritiesregarding fuel conservation, time, and revenue, and then it automates the costlyroutine processes associated with flight plan distribution. An aircraft-to-groundmessaging system reduces delays by providing vital information prior to gatearrival and automating data transfer for aircraft initialization at takeoff. Asituational display solution provides an integrated display of flight information,weather, and operational data that enables real-time operational decision-making toimprove efficiency, productivity, and customer experience. An electronic flightbag transitions the airline from a paperless to an electronic environment for flightoperations and it also enhances communications and reduces delays by integratingaircraft into the airline network.
Operations management Solutions that forecast and fulfill long-range crew needs, optimize crewplacement while complying with industry and government regulations andschedule requirements, manage crew movements, ensure accurate payroll, assignaircraft to flight schedule during regular and irregular operations and trackaircraft movements on the ground. Enable adjustment of aircraft and crewschedules in response to interference causing irregular operations; earlymonitoring of impending operational disruptions allows for more efficientresolution, reduced costs and improved customer experience.
Airport management Solutions that manage airline usage of airport resources, such as gate operationsand usage as well as airport staff scheduling, rosters and operations. A gatemanagement solution optimizes on-time performance through demand-drivenresourcing, proactively addresses potential issues to reduce operationaldisruptions, and reduces tarmac waiting times and associated fuel burn. Aground support equipment planning solution uses scenario modeling to forecastground equipment needs and optimize resource planning across an airport. A hubmanagement solution provides an integrated view of data needed to efficientlyplan and manage every aircraft turnaround. A staff management solutionenhances airport handling operations through sophisticated planning models,visual alerts, and streamlined information access to help plan and manageoptimal daily staff planning and deployment of the associated handling tasks.
Customers
As of December 31, 2013, we served approximately 225 airlines of all sizes and in every region of the world,including LCC/hybrids, global network carriers and regional network carriers. We also served approximately 700other customers such as airports, corporate aviation fleets, governments and tourism boards. We have a globalcustomer base, serving 79 of T2RL’s top 100 passenger airlines, which represent the majority of PBs worldwide,based on 2012 PBs as reported by T2RL and combined with our own competitive industry insights. We haverecently won reservations system contracts from Etihad Airways, LAN, WestJet, Virgin Australia, Virgin Americaand JetBlue. In January 2014, we reached a long-term agreement with American Airlines to be the provider of thereservations system for the merged American Airlines and US Airways entity.
161
We serve the following types of airlines:
LCC/hybrids. LCC/hybrids are typically carriers that have become more operationally complex as theyevolve away from a model focused on low-cost and simplified operations. LCC/hybrids also tend to be thoughtleaders in the industry and grow faster, adding codesharing capabilities and new cabin classes, distributingthrough more indirect channels and diversifying their fleets. Examples of LCC/hybrids include Virgin America,Lion Air and JetBlue. A number of our recent customer acquisitions have been in this customer segment, withapproximately 45% of our PBs represented by LCC/hybrids in 2012. In our airline reservations products, ourtravel supplier customer base is weighted towards this faster growing customer segment relative to our nearestcompetitor which has less than 10%. This leading presence among LCC/hybrids provides us with strong organicgrowth potential, as these carriers have recently grown faster than network carriers. As our growing LCC/hybridcustomers demand additional solutions and capabilities, we can take advantage of these built-in opportunities tofurther increase our penetration of these customers.
Global network carriers. These carriers are typically large full-service airlines with a global presence thattend to participate in major global alliances. Examples of global network carriers include Delta, British Airwaysand Japan Airlines. We estimate that global network carriers, each of which serves over 25 million PBs per year,together boarded approximately one-third of PBs worldwide, as reported by T2RL in 2012.
Regional network carriers. These network carriers range in size but generally tend to focus primarily on onegeographic region. They tend to be more price sensitive and less operationally complex than the global networkcarriers. Examples of regional network carriers include Virgin Australia and Vietnam Airlines. Mid-size andlarge regional carriers, which have a moderate level of complexity in their reservations requirements, are morelikely than global network carriers to rely on third-party solutions providers for reservations functionality.
Our contracts tend to be non-exclusive multi-year agreements, with our reservations systems contractsgenerally lasting between five to ten years and software solutions contracts generally lasting between three tofive years. We typically price our offerings based on relevant metrics that scale with the customer’s business,such as PBs for reservations or number of aircraft for flight planning. In most cases, airlines commit to annualminimum volumes of such relevant metrics. If actual number of units is less than the annual minimum volumecommitment, the airline will pay for any shortfall up to the annual minimum volume commitment. Our fees aregenerally paid on a monthly basis. Depending on the type of software products purchased, we also charge ourcustomers for consulting fees, software licensing fees and other service fees. These contracts contain standardrepresentations and warranties, covenants and indemnification provisions.
Although airline reservations contracts representing less than 5% of Airline Solutions’ 2013 revenue arescheduled for renewal in each of 2014 and 2015, airline reservations contracts representing approximately 10%of Airline Solutions’ 2013 revenue are scheduled for renewal in each of 2016 and 2017. We cannot guaranteethat we will be able to renew our solutions contracts in the future on favorable economic terms or at all.
Competitors
The airline software industry is very competitive and highly fragmented. We are currently aware of over 100competitors providing many types of reservations systems and software applications solutions.
The closest competitor to us in terms of size and breadth of product offering is Amadeus. We also competewith traditional technology companies such as HP, Unisys and Navitaire (a division of Accenture) and withairline industry participants such as Jeppesen (a division of Boeing), Lufthansa Systems, and SITA. In addition,various point solutions providers such as PROS, ITA Software, Datalex and Travelport compete with us on amore limited basis in several discrete functional areas. We differentiate ourselves by offering the broadestportfolio of software solutions, including reservations, marketing and planning and enterprise operations systemssolutions in more than a dozen different areas of expertise. We have a competitive advantage in offering acomprehensive portfolio through a single relationship as compared to our competitors, most of which specializein either one solution or a limited functionality set.
162
We are the second largest provider of passenger reservations systems, with an 18% share of airline PBs,according to T2RL PSS data for 2012, following closely behind Amadeus, which accounts for 21% share, andleading Navitaire, which accounts for 12% share. Despite facing significant implementation costs involved inswitching passenger sales and service systems providers, a number of airlines have recently migrated fromAmadeus and Navitaire systems to our SabreSonic CSS system, including Etihad Airways and Virgin Australia.Navitaire focuses on serving ultra low-cost carriers, as their passenger sales and service system is a simplifiedversion of the traditional model of selling airline seats, while our system can accommodate the increasedcomplexity of LCC/hybrids and network carriers.
We also believe that we have the leading portfolio of airline marketing and operations products across thesolutions that we provide, based on our internal share estimates calculated based on our market intelligencecombined with 2012 T2RL airline data.
There are also airlines that develop their own software applications and reservations systems in-house, someof which use a third-party mainframe in their data center and outsource the operation to a services vendor such asIBM or HP. Some regional carriers buy the spare capacity in a larger airline’s reservations systems, which isoften based on a common language or an alliance relationship. As airlines continue to move toward relying onthird-party solutions providers for the technology that they currently host in-house, we believe our flexible,scalable and broad portfolio, SaaS and hosted delivery model, strong penetration in the market with a focus onhigh-growth segments, industry expertise and customer support position us well to continue gaining share inairline software applications and reservations systems.
See “Industry—Travel Technology Solutions—Competitive Environment” for a discussion of the factors onwhich third-party solutions providers compete.
Hospitality Solutions
Our Hospitality Solutions business provides industry-leading distribution, operations and marketingsolutions to approximately 17,500 hotel properties around the world. Our offerings include reservations systems,PMSs, marketing services through our customers’ various distribution channels and consulting services thatoptimize distribution and marketing. With our comprehensive portfolio of SaaS solutions and value-addedservices, we believe we are well-positioned to add value in the hotel industry and to address the continued globalgrowth and complexity of operational, distribution and marketing needs.
We are a leading provider of hospitality solutions to hotel suppliers based on the following attributes:
Leader in reservations. Our CRS platform serves approximately 13,000 properties and approximately 80chains globally. Historically, generating GDS hotel bookings has been the primary reason that hotels use CRSservices. Based on our estimates, in 2013, we had the largest hospitality CRS solution based on ourapproximately 27% market share of third-party hospitality CRS hotel rooms distributed through our GDS, withour next closest competitor at 17%. See “Method of Calculation” for an explanation of the methodologyunderlying our third-party hospitality CRS hotel room share calculation.
Leading web-based PMS. Our innovative PMS is used by more than 4,500 properties globally and webelieve our product is one of the leading third-party web-based PMSs. Our PMS platform complements ourindustry-leading CRS platform and we expect to launch an integrated hospitality management suite that willcentralize all distribution, operations and marketing aspects to facilitate increased accuracy, elimination ofredundancies, and increased revenue and cost savings. In a recent internal survey, a majority of hotels with ten ormore properties would be interested in purchasing this type of integrated PMS-CRS web-based solution whenthey next upgrade their PMS. Over time, we expect that this system will change the industry approach todistribution and guest management, as well as drive greater cross-utilization among our customer base.
163
Industry expertise. Our deep industry expertise in hotel distribution enhances the value of our solutions,which help hotels manage content across multiple global, regional, and local distribution channels moreeffectively. Our Hospitality Solutions business leadership team has an average of over 16 years of hospitalityindustry experience, and our industry expertise stems from relationships with hotels, travel agencies anddistribution partners going back over 20 years.
Scalable SaaS delivery. The vast majority of our revenue is generated by solutions delivered as SaaS. Thisdelivery model provides hotels, which previously performed these functions manually, with access to our state-of-the-art technology without prohibitive infrastructure costs. Our SaaS solutions platform is sophisticatedenough to accommodate any hotel’s needs, from an independent hotel to a global chain with multiple brands andthousands of properties. We believe this sets us apart from many of our competitors and provides our customerswith the scale needed to replace in-house technology and focus their resources to serve travelers.
Key Metrics
Our revenue growth is associated primarily with the product functionality and the scalability of our businessdue to the economies of scale realized through our SaaS delivery model. Our Recurring Revenue as a percentage oftotal Hospitality Solutions revenue has remained high for our Hospitality Solutions business at 93%, 95% and 92%for the years ended December 31, 2013, 2012 and 2011, respectively. For the year ended December 31, 2013, weprocessed approximately 14 million room reservations. For additional segment information, see Note 21, SegmentInformation, to our audited consolidated financial statements included elsewhere in this prospectus.
Product Offering
We offer a comprehensive set of SaaS solutions for hoteliers to manage distribution, operations andmarketing across multiple channels and segments globally. Customers can bundle components of our modularand integrated software offerings to create a solution that best suits their specifications. Our solutions can also beintegrated with other hotel systems; as an active member of Open Travel Alliance and Hotel Technology NextGeneration, we work with the most current XML standard interface specifications so that new interfaces caneasily and quickly be added as needed.
Product Category Description
Distribution SynXis CRS: a web-based system that distributes a hotel’s inventory to variouschannels, including the GDS, our proprietary Guest Connect internet bookingengine (which includes mobile booking capabilities), call center (which isoffered as an outsourced service and/or an agent booking application calledVoice Agent) and direct connections to third-party OTAs. Allows hotels tomanage availability, rates and content across these channels and send targetedmarketing messages to customers at the point of sale. Includes revenuemanagement tools that integrate with other important property systems toprovide a holistic view of a hotel’s revenue streams and help optimize revenue.
Operations Sabre PMS: a web-based system that helps a hotel manage all aspects of itsoperations, with functionalities including inventory and reservationsmanagement, guest profile management, staffing, cleaning, back office andpayment system integration, and a night audit/reporting module. Serves over4,500 properties, including Red Roof Hotels and nine Wyndham brands.
Marketing Include a broad portfolio of solutions including website design and hosting,search engine optimization, pay-per-click and online advertising, mobilesolutions, social media marketing, content management systems, behavioraltargeting and custom flash development. Also include the sale of Sabre GDSmedia, integration with CRM and loyalty systems and email marketing campaignmanagement.
164

Product Category Description
Other Consulting services for revenue management, marketing campaign planning andCRM, partnering with our customers to provide education around and maximizethe return on investment in our tools and services, identify new revenueopportunities and stay up to date on the latest industry trends.
A Consortia/Request for Proposal (“RFP”) solution targets certain customersegments to generate higher-revenue bookings than those generated through theinternet. Comprised of (i) Sabre Hotel RFP, which provides hotels with leads forcorporate travel contracts and sends hotel bids to corporations and agencies and (ii)Consortia Management Program, which markets preferred rates to qualified travelagent groups, or consortia, and helps establish strong relationships with majorconsortia agents for the corporate direct, leisure and general travel agency sectors.
Customers
We have a global customer base with approximately 17,500 hotel properties of all sizes, with 35% of hotelrooms distributed through our GDS for the year ended December 31, 2013 in North America, 9% in LatinAmerica, 34% in EMEA and 22% in APAC. The combination of our functionality, system flexibility, and ease ofdeployment has enabled significant global growth across all regions and customer segments. We have grownfrom approximately 10,000 properties in 2008 to approximately 17,500 properties in 2013. The breadth of ourcustomer base provides us with opportunities to cross-sell our many offerings to hotels with which we alreadyhave a relationship. The flexibility of our solutions allows us to serve hospitality customers that range fromindividual hotels to large chains comprised of thousands of properties. For example, we serve strong, stablebrands such as Wyndham, Shangri-La Hotels and Resorts, Mandarin Oriental, Peninsula, Rosewood Hotels andResorts, Preferred Hotel Group, Harrah’s, Kimpton and Red Roof Inns. Our tools help these branded chainsmanage their brand and distribution mix across multiple properties in multiple regions. In total, we representapproximately 80 different hotel chains and over 8,000 independent hotels. A large part of our strength andsuccess in the independent hotel segment is due to our global reseller network of over 30 partners that allows usto extend our sales presence internationally in a cost-effective manner.
Our contracts usually have one to five year terms, and typically renew automatically for one to three yearperiods until notice of termination is given by either party prior to the end of the current term. Customers whosecontracts allow termination at will may have to pay early termination fees or may only terminate after a certainperiod of time has passed. We receive configuration and monthly subscription fees from our customers. Monthlytransaction fees are comprised of reservations fees per room booking, net of cancellations, in that month.Customers have agreed to annual or periodic reservations fee increases in many of our contracts. These contractscontain standard representations and warranties, covenants and indemnification provisions.
Hospitality Solutions contract renewals are relatively evenly spaced, with approximately one-third ofcontracts representing approximately one-third of Hospitality Solutions’ 2013 revenue coming up for renewal inany given year. We cannot guarantee that we will be able to renew our solutions contracts in the future onfavorable economic terms or at all.
Competitors
We face competition across many aspects of our business but our primary competitors are in the hospitalityCRS and PMS fields, including MICROS, TravelClick, Pegasus and Trust, among others. However, in 2013, wehad the largest hospitality CRS solution, based on our approximately 27% market share of third-party hospitalityCRS hotel rooms distributed through our GDS.
165

The chart below reflects the long-term trend of our third-party hospitality CRS market share (comparedagainst certain key competitors) as measured by our GDS bookings. This metric is different from the metric weuse elsewhere in this prospectus which is based on share of hotel rooms, and we use it because we believe itaccurately reflects the direction of the market over time. See “Method of Calculation” for an explanation of themethodology underlying these two different metrics.
There are also hotels that develop their own software applications and CRSs in-house, including global hotelchains. As hotels continue to move toward relying on third-party solutions providers for the technology that theycurrently host in-house, we believe our flexible, scalable and extensive portfolio, SaaS delivery model, focus onhigh-growth segments, industry expertise and customer support position us well to continue gaining share in thehospitality solutions industry.
See “Industry—Travel Technology Solutions—Competitive Environment” for a discussion of the factors onwhich third-party solutions providers compete.
Travelocity
Travelocity is our family of online consumer travel e-commerce businesses that serves primarily leisuretravelers. We connect these travelers with travel products and services from well-known global brands. Throughour websites, travelers can research, shop and book over 400 airlines, over 150,000 hotels, all major car rentalcompanies, most major cruise lines, numerous vacation and last-minute travel packages as well as access travelerreviews and other travel-related services.
Travelocity is comprised primarily of Travelocity.com, an OTA focusing on the United States and Canadaand lastminute.com, an OTA focusing on Europe. Our Travelocity and lastminute.com brands remain well-recognized; for example, in February 2012, Travelocity was named the top travel site by the American ConsumerSatisfaction Index, and, according to our internal brand trackers, as of December 2013, we were among theleaders in the United States in terms of brand awareness, as compared with our principal OTA competitors.
166
Founded in 1996, Travelocity.com was the first OTA and one of the first online retailers. In 2013,Travelocity was the fourth largest global OTA, generating $7 billion in annual gross travel sales. Travelocity’sresults have been adversely impacted by several factors in recent years, including margin pressure and reducedbookings on its websites. For the three years ended December 31, 2013, Travelocity experienced anapproximately 8% compound annual revenue decline due to intense competition within the travel industry. Thisincreased level of competition led to declines in fees on new long-term supplier agreements signed with severallarge North American airlines in 2012 and lower transaction volumes, which also impacted our media revenue. Inorder to help improve Travelocity results, we initiated plans in the third quarter of 2013 to shift our Travelocitybusinesses in the United States and Canada away from a high fixed-cost model to a lower-cost, performance-based revenue structure.
On August 22, 2013, Travelocity entered into an exclusive, long-term strategic marketing agreement withExpedia, which was recently amended and restated in March 2014 to reflect changed commercial terms. Underthe Expedia SMA, Expedia will power the technology platforms for Travelocity’s existing U.S. and Canadianwebsites as well as provide Travelocity with access to Expedia’s supply and customer service platforms. TheExpedia SMA represents a strategic decision to reduce direct costs associated with Travelocity and to provide ourcustomers with the benefit of Expedia’s long-term investment in its technology platform as well as its supply andcustomer service platforms, which we expect to increase conversion and operational efficiency and allows us toshift our focus to Travelocity’s marketing strengths.
We believe Travelocity and lastminute.com have strong brand awareness. According to internal surveys, ourbrand consideration for Travelocity was the second highest among OTAs in North America, and our hotelshopping preference for lastminute.com was the highest among OTAs in the United Kingdom, which islastminute.com’s primary market. We believe we can use this brand awareness and consideration to drivecustomer traffic and create opportunities for improving customer conversion. We are focusing our marketingefforts on promoting our brands, increasing brand recognition and customer loyalty, driving customer traffic andoptimizing our return on marketing investment through a wide range of advertising channels. These advertisingchannels include offline advertising, paid search, search engine optimization, personalized travelercommunications via our websites and through direct e-mail correspondence with our travelers, affiliate marketingand social media. We intend to continue improving upon Travelocity’s brand messaging and marketingefficiency as well as finding new ways to lead by building deeper connections with customers, investing indifferentiated content and engaging customers through social media.
Under the terms of the Expedia SMA, Expedia is required to pay us a performance-based marketing fee thatwill vary based on the amount of travel booked through Travelocity-branded websites that are powered byExpedia. The marketing fee we receive will be recorded as revenue and the cost we incur to promote theTravelocity brand and for marketing will be recorded as selling, general and administrative expense in our resultsof operations.
Pursuant to our Expedia SMA, we will continue to be liable for fees, charges, costs and settlements relatingto litigation arising from hotels booked on the Travelocity platform prior to the Expedia SMA. However, fees,charges, costs and settlements relating to litigation from hotels booked subsequent to the Expedia SMA will beshared with Expedia according to the terms of the Expedia SMA. The Expedia SMA requires us to guaranteeTravelocity’s indemnification obligations for liabilities that may arise out of such litigation matters, which maymaterially adversely affect our cash flows. Additionally, the Expedia SMA contains standard representations andwarranties, covenants and indemnifications.
Expedia will use our GDS for shopping and booking of the air travel booked through Travelocity.com andTravelocity.ca until 2019, at which time it may choose to use another intermediary for a portion or all of such airtravel, subject to earlier termination under certain circumstances. We do not expect that Expedia will use TravelNetwork for shopping and booking of a portion of non-air travel for Travelocity.com and Travelocity.ca after thelaunch of the Expedia SMA. Both parties began development and implementation after signing the Expedia
167

SMA. As of December 31, 2013, the majority of the online hotel and air offering has been migrated to theExpedia platform, and a launch of the majority of the remainder is expected in mid-2014.
As part of our negotiations to amend and restate the Expedia SMA, we also agreed to a separate ExpediaPut/Call agreement that supersedes the previous put/call arrangement, whereby Expedia may acquire, or we maysell to Expedia, certain assets relating to the Travelocity business. Our put right may be exercised during the first24 months of the Expedia Put/Call only upon the occurrence of certain triggering events primarily relating toimplementation, which are outside of our control. The occurrence of such events is not considered probable.During this period, the amount of the put right is fixed. After the 24 month period, the put right is onlyexercisable for a limited period of time in 2016 and 2017 at a discount to fair market value. The call right held byExpedia is exercisable at any time during the term of the Expedia Put/Call. If the call right is exercised, althoughwe expect the amount paid will be fair value, the call right provides for a floor for a limited time that may behigher than fair value and a ceiling for the duration of the Expedia Put/Call that may be lower than fair value.
The term of the amended and restated Expedia SMA is nine years, subject to certain termination provisions,and automatically renews under certain conditions. See “Risk Factors—Risks Related to our Business andIndustry—The recently signed strategic marketing agreement with Expedia may not be successfully implementedor may not result in the benefits anticipated by the parties.”
In the fourth quarter of 2013, we continued our restructuring of Travelocity by implementing a plan torestructure lastminute.com, the European portion of the Travelocity business, in order to allow lastminute.com tooperate independently, although from time to time we may evaluate our strategic options regardinglastminute.com. Travelocity will continue to be managed as one operating segment. Additionally, Travelocityrecently sold its TPN business to Orbitz. TPN is a B2B offering that provides travel content and bookingfunctionality to, and sells products and services through, loyalty and private label websites for suppliers anddistribution partners.
Key Metrics
For the year ended December 31, 2013, Travelocity gross travel booked was $7 billion. For additionalsegment information, see Note 21, Segment Information, to our audited consolidated financial statementsincluded elsewhere in this prospectus.
Product Offering
Our product offering includes:
• Travelocity.com (including Travelocity.ca and Travelocity.mx), which is our consumer-facing full-service OTA offering for the Americas that serves primarily leisure travelers. Travelocity.com allowscustomers to reserve, book, and purchase a variety of airline tickets, hotel rooms, rental cars, cruises,and packaged vacations without the help of a travel agent.
• lastminute.com, which is our European OTA brand that provides online access to over 80,000 hotelproperties and approximately 400 airlines worldwide as well as holiday packages, car hire, theatertickets and spa packages.
Competitors
Travelocity’s main competitors include:
• other OTAs, of which the largest global businesses are Expedia, Orbitz and Priceline. Thesecompetitors continue to evolve by investing in marketing, international expansion, mobile platformsand new comparison models such as metasearch;
• traditional offline travel agencies;
• suppliers, such as airlines, hotels and car rental companies, many of which have their own brandedwebsites;
168
• search engines that have launched travel-focused initiatives, such as Google Flights and Microsoft BingTravel. Although these search engines currently do not have the ability to directly fulfill travelbookings, they can direct customer traffic to other sites such as supplier websites where customers canbook directly; and
• metasearch companies, which aggregate travel search results from suppliers, OTAs and other travelwebsites. For example, Kayak may be able to drive new traffic to Priceline, by which it was recentlyacquired. TripAdvisor, the leading travel research and review website, has recently added metasearchfunctionality to some of its offerings.
See “Risk Factors—Risks Related to our Business and Industry—Travel suppliers’ use of alternativedistribution models, such as direct distribution models, could adversely affect our Travel Network andTravelocity businesses.”
We compete on the basis of ease of use; price; customer satisfaction; availability of product type or rate;service; amount, accessibility and reliability of information; breadth of products offered and customers reached.We expect that the Expedia SMA will help us enhance the quality and breadth of our travel offerings, ourcompetitive pricing and timely promotions, as well as the customer service and quality of our travel planningcontent and insight.
Research, Development and Technology
Introduction
We invest heavily in software development, delivery and operational support capabilities and strive for best-in-class products that we can provide for our customers. We operate standardized infrastructure in our data centerenvironments across hardware, operating systems, databases, and other key enabling technologies to minimizecosts on non-differentiators.
Our architecture has evolved from a mainframe-centric transaction processing environment to a secureprocessing platform that we believe is one of the world’s most heavily used and resilient SOA environments. In2013, our platform processed more than 1.1 trillion system messages, with peak volumes of nearly 100,000system messages per second and an average response time of less than three seconds. This representsapproximately a 25% CAGR from the approximately 700 billion system messages processed in 2011. Our datacenters have more than 14,000 servers/virtual machines and leverage over 10,000 terabytes of storage.
A variety of products and services run on this technology infrastructure: high-volume air shopping systems;desktop-access applications providing continuous, real-time data access to travel agents; airline operations anddecision support systems; an array of customized applications available through the Sabre Red App Centre; andweb-based services that provide an automated interface between us and our travel suppliers and customers. Theflexibility and scale of our standardized SOA-based technology infrastructure allow us to quickly deliver a broadvariety of SaaS and hosted solutions.
Product Development
A technology staff of approximately 4,000 employees and contractors provides varying skill sets to deliverquality and innovation to our customers. This staff is based around the world in six facilities located in Dallas-Fort Worth, Boston, Krakow, Bangalore, Montevideo and Buenos Aires. This global footprint puts us closer toour customers and gives our developers insight into local market needs that benefits our products and services.Additional offices around the world also let us use a “follow the sun” approach, meaning that our developmentteams are active 24-hours-a-day in order to provide rapid time to market. We also have the flexibility to adaptquickly and re-allocate work across regions and businesses as needed.
169
Our core product development is complemented by dedicated analytics and operations research staff. Thisteam, which includes individuals with advanced degrees in operations research, computer science, mathematicsand statistics, applies the latest thinking on advanced algorithms and data analysis to drive continuousimprovement in the innovation, efficiency, and performance of our products and services.
Processing and Storage Capacity
Sabre has significant processing and storage capacity to enable efficient processing of business volumes,leveraging multiple data centers around the world for production, certification, integration, and developmentenvironments.
The majority of our systems operate in a private cloud environment. This, coupled with a standardizedinfrastructure stack, enables rapid deployment of capacity and automation across the operational environment.We expect that increasing levels of automation over time will enable us to continue to make better use of ourprocessing and storage capacity and to increase the efficiency and speed with which we can deploy capacity toareas of need across our business.
Operational Reliability and Performance
Our technology strategy is based on achieving company-wide stability and performance at the most efficientprice point. Significant investment has gone into building a commoditized, centralized and standardizedmiddleware environment with an emphasis on simplicity, security, and scalability. Teams of developers focussolely on the creation and improvement of core services that are leveraged in product development across ourbusinesses, ensuring consistency and a common foundation for operational stability. In addition, our enterprisetechnology operations team leverage industry-standard Information Technology Infrastructure Libraryoperational processes.
Disaster Recovery
Our primary data centers are Tier 3 facilities and have been built to provide a high-availability environment.They are designed to withstand most natural events, were placed geographically above flood lines and are inareas with very low probability of earthquakes. This physical design is coupled with operational and sitemanagement processes designed to eliminate points of failure and provide availability 24-hours-a-day, 7-days-a-week, 365-days-a-year. They have redundant power, advanced cooling systems, network infrastructure, firedetection, and emergency systems. The data centers are also equipped with comprehensive security systems tomitigate potential physical compromise of the facilities or services. See “Risk Factors—Risks Related to OurBusiness and Industry—Our success depends on maintaining the integrity of our systems and infrastructure,which may suffer from failures, capacity constraints, business interruptions and forces outside our control.”
Data Security
We employ data protection measures in an effort to safeguard both corporate and customer data.Additionally, many initiatives are planned or are already underway to further strengthen our information securityposition.
We scan our credit card processing environment regularly, run annual internal and external penetrationtesting to identify vulnerabilities, and conduct annual risk assessments on applications and processes in order tomaintain a high degree of data security awareness. See “Risk Factors—Regulatory and Other Legal Risks—Ourcollection, processing, storage, use and transmission of personal data could give rise to liabilities as a result ofgovernmental regulation, conflicting legal requirements, differing views on data privacy or security breaches”and “Risk Factors—Regulatory and Other Legal Risks—We are exposed to risks associated with payment cardindustry (“PCI”) compliance” for more information about the data security related risks and requirements towhich we are subject.
170
Much of our operational computing environment, including our mainframe systems, is managed by athird-party service provider, which allows us to capitalize on the service provider’s operational and securityexpertise. See “Risk Factors—Risks Related to Our Business and Industry—We rely on the availability andperformance of information technology services provided by third parties, including HP, which manages asignificant portion of our systems” for more information about our relationship with third-party service providers.
Product and Service Quality
We operate several labs that have primary accountability for validating the functional capabilities ofapplication code, confirming code compatibility and integration, and testing code performance for high volumeresiliency. These capabilities support institutionalized application engineering best practices and formalizedprocesses that mandate the implementation and use of specific testing environments for development, integration,and certification before code moves to production. Our software development life-cycle emphasis includes theexecution of documented, traceable standards and measures from initiation of a product through retirement.These include specific architectural reviews, code inspections, and pre-release readiness reviews.
Operational Efficiency
We leverage SOA to build a standard infrastructure across our business, which has allowed us to obtainefficient, streamlined operational support of our services and applications through enhanced and standardizeddeployment, discovery and visibility across business segments. Our operational environment has commonsystems and processes across the business, standardized hardware and software, multi-core and virtualizationtechnologies for efficiency and sustainability, and a data center footprint that allows for expansion and quickintegration of any new data centers resulting from acquisition of other companies.
The focus on standardization during our multi-year move to an agile development approach has allowedteams to increase their throughput and reduce rework. Our product development teams are staying more in synchwith internal and external customer needs through more frequent touch points, early demonstration of featuresand functions, and a continuous focus on quality, ensuring more alignment once products are delivered. Inaddition, the introduction of supporting tool sets that work well with the methodology and technologyarchitecture for component-level testing have further increased productivity at the team level.
Finally, by strategically locating approximately half of our technology staff in various facilities and closelymonitoring and adjusting our technology investment, we are able to introduce increasingly more advanceddevelopment and operational practices while reducing unnecessary resources and costs.
Intellectual Property
Companies in the travel and travel technology industries increasingly rely on patents, copyrights,trademarks, and trade secrets, as well as licenses of the foregoing. Such companies constantly develop newproducts and innovations, and the travel and travel technology industries are subject to constant and rapidtechnological change.
We use software, business processes and proprietary information to carry out our business. These assets andrelated intellectual property rights are significant assets of our business. We rely on a combination of patent,copyright, trade secret and trademark laws, confidentiality procedures, and contractual provisions to protect theseassets and we license software and other intellectual property both to and from third parties. We may seek patentprotection on technology, software and business processes relating to our business, and our software and relateddocumentation may also be protected under trade secret and copyright laws where applicable. We may alsobenefit from both statutory and common-law protection of our trademarks. We do not believe that our business isdependent on any single item of intellectual property, or that any single item of intellectual property is material tothe operation of our business. Rather, we believe that our intellectual property provides a competitive advantage,and from time to time we have taken steps to enforce our intellectual property rights.
171
The scope of such intellectual property protection varies depending on the laws of the local jurisdiction,which, in some jurisdictions, may provide less protection than the laws of the United States. Moreover, theduration of protection varies between different types of intellectual property rights. For instance, in the UnitedStates patents generally remain in force for 20 years from the filing of the patent application. Our issued UnitedStates patents are expected to expire between 2014 and 2033.
Although we rely heavily on our brands, associated trademarks, and domain names, we do not believe thatour business is dependent on any single item of intellectual property, or that any single item of intellectualproperty is material to the operation of our business. However, since we consider trademarks to be a valuableasset of our business, we maintain our trademark portfolio throughout the world by filing trademark applicationswith the relevant trademark offices, renewing appropriate registrations and regularly monitoring potentialinfringement of our trademarks in certain key markets. See “Risk Factors—Regulatory and Other Legal Risks—We may not be able to protect our intellectual property effectively, which may allow competitors to duplicate ourproducts and services” and “Risk Factors—Regulatory and Other Legal Risks—Intellectual propertyinfringement actions against us could be costly and time consuming to defend and may result in business harm ifwe are unsuccessful in our defense” for more information about our intellectual property.
Insurance
We insure against certain corporate risks, including damage to our property and other material assets andbusiness interruption. Our insurance coverage includes:
• general civil liability and business automobile insurance umbrella and excess liability policies;
• property, damages and business interruption policy;
• director and officer liability policy;
• IT services policies, including a policy for errors and omissions and Internet/cyber liability;
• aviation policy covering third party bodily harm and/or property damage resulting from aircraftincidents;
• workers’ compensation policy;
• employee crime, kidnap and ransom policy;
• fiduciary liability policy; and
• supplemental policies for general liability, automobile liability and workers’ compensation for certainforeign locations, where required by local law.
While we consider that our insurance coverage is consistent with industry standards in light of the activitieswe conduct, we can provide no assurance that our insurance coverage will adequately protect us from all the risksthat may arise or in amounts sufficient to prevent material loss. See “Risk Factors—Regulatory and Other LegalRisks—We may not have sufficient insurance to cover our liability in pending litigation claims and future claimseither due to coverage limits or as a result of insurance carriers seeking to deny coverage of such claims, whichin either case could expose us to significant liabilities.”
Legal Proceedings
While certain legal proceedings and related indemnification obligations to which we are a party specify theamounts claimed, such claims may not represent reasonably possible losses. Given the inherent uncertainties oflitigation, the ultimate outcome of these matters cannot be predicted at this time, nor can the amount of possibleloss or range of loss, if any, be reasonably estimated, except in circumstances where an aggregate litigationaccrual has been recorded for probable and reasonably estimable loss contingencies. A determination of theamount of accrual required, if any, for these contingencies is made after careful analysis of each matter. The
172

required accrual may change in the future due to new information or developments in each matter or changes inapproach such as a change in settlement strategy in dealing with these matters. See “Risk Factors—Regulatoryand Other Legal Risks—We are involved in various legal proceedings which may cause us to incur significantfees, costs and expenses and may result in unfavorable outcomes.”
Litigation and Administrative Audit Proceedings Relating to Hotel Occupancy Taxes
Over the past nine years, various state and local governments in the United States have filed approximately70 lawsuits against us and other OTAs pertaining primarily to whether Travelocity and other OTAs owe sales oroccupancy taxes on some or all of the revenues they earn from facilitating hotel reservations using the merchantrevenue model. In the merchant revenue model, the customer pays us an amount at the time of booking thatincludes (i) service fees, which we collect, and (ii) the price of the hotel room and amounts for occupancy orother local taxes, which we pass along to the hotel supplier. The complaints generally allege, among other things,that the defendants failed to pay to the relevant taxing authority hotel accommodations taxes on the service fees.Courts have dismissed approximately 30 of these lawsuits, some for failure to exhaust administrative remediesand some on the basis that we are not subject to the sales or occupancy tax at issue based on the construction ofthe language in the ordinance. The Fourth, Sixth and Eleventh Circuits of the United States Courts of Appealseach have ruled in our favor on the merits, as have state appellate courts in Missouri, Alabama, Texas, California,Kentucky, Florida and Pennsylvania, and a number of state and federal trial courts. The remaining lawsuits are invarious stages of litigation. We have also settled some cases individually for nuisance value and, with respect tosuch settlements, have reserved our rights to challenge any effort by the applicable tax authority to imposeoccupancy taxes in the future.
Among the recent favorable decisions, on January 23, 2013, the California Supreme Court declined to hearthe appeals of the City of Anaheim and the City of Santa Monica from lower court decisions in favor ofTravelocity and other OTAs on the issue of whether local occupancy taxes apply to the merchant revenue model.We and other OTAs have also prevailed on summary judgment motions in San Francisco and Los Angeles. Webelieve these decisions should be helpful in resolving any other California cases, which are either currentlypending or subsequently brought, in our favor.
Similarly, on January 23, 2013, the Missouri Court of Appeals upheld a lower court decision in favor ofTravelocity and other OTAs on the issue of whether local occupancy taxes in the City of Branson apply to themerchant revenue model. On February 28, 2013, the First District Court of Appeals in Florida affirmed asummary judgment ruling in favor of Travelocity and other OTAs on the issue of whether local accommodationtaxes levied by Leon County and 18 other counties in Florida apply to the merchant revenue model. The FloridaSupreme Court is currently reviewing this decision. Likewise, on March 29, 2013, a federal district court in NewMexico granted summary judgment, ruling that OTAs are not vendors subject to hotel occupancy tax in NewMexico. On December 13, 2013, the Eleventh Circuit Court of Appeals affirmed summary judgment in our favorin a case that had been pending in Rome, Georgia, finding there was no evidence that we collected but failed toremit tax, that the counties could not recover on their common law claims, and that there is no basis in Georgialaw (statutory or otherwise) for an award of back taxes. On March 5, 2014, the California Court of Appealsaffirmed the trial court’s grant of summary judgment in our favor in the hotel occupancy tax litigation broughtagainst us by the City of San Diego. On March 7, 2014, the trial court in our lawsuit with the MontanaDepartment of Revenue granted our (and the other OTA defendants’) motion for summary judgment.
Although we have prevailed in the majority of these lawsuits and proceedings, there have been severaladverse judgments or decisions on the merits, some of which are subject to appeal.
Among the recent adverse decisions, on June 21, 2013, a state trial court in Cook County, Illinois grantedsummary judgment in favor of the City of Chicago and against Travelocity and other OTAs, ruling that the City’shotel tax applies to the fees retained by the OTAs because, according to the trial court, OTAs act as hotel“managers” when facilitating hotel reservations. The court did not address damages. After final judgment is entered,Travelocity intends to appeal the court’s decision on the basis that we do not believe that we “manage” hotels.
173
On November 21, 2013, the New York State Court of Appeals ruled against Travelocity and other OTAs,holding that New York City’s hotel occupancy tax, which was amended in 2009 to capture revenue from feescharged to customers by third-party travel companies, is constitutional because such fees constitute rent as theyare a condition of occupancy. We have been collecting and remitting taxes under the statute, so the ruling doesnot have any impact on our financial results in that regard.
On April 4, 2013, the United States District Court for the Western District of Texas entered a final judgmentagainst Travelocity and other OTAs in a class action lawsuit filed by the City of San Antonio. The final judgmentwas based on a jury verdict from October 30, 2009 that the OTAs “control” hotels for purposes of city hoteloccupancy taxes. Following that jury verdict, on July 1, 2011, the Western District of Texas concluded that feescharged by the OTAs are subject to city hotel occupancy taxes and that the OTAs have a duty to assess, collectand remit these taxes. We disagree with the jury’s finding that we “control” hotels, and with the Western Districtof Texas’ conclusions based on the jury finding, and intend to appeal the final judgment to the United StatesCourt of Appeals for the Fifth Circuit.
We believe the Fifth Circuit’s resolution of the San Antonio appeal may be affected by a separate Texasstate appellate court decision in our favor. On October 26, 2011, the Fourteenth Court of Appeals of Texasaffirmed a trial court’s summary judgment ruling in favor of the OTAs in a case brought by the City of Houstonand the Harris County-Houston Sports Authority on a similarly worded tax ordinance as the one at issue in theSan Antonio case. The Texas Supreme Court denied the City of Houston’s petition to review the case. Webelieve this decision should provide persuasive authority to the Fifth Circuit in its review of the San Antoniocase.
On September 24, 2012, a trial court in Washington D.C. granted summary judgment in favor of the Districtof Columbia on its claim that the OTAs are subject to hotel occupancy tax. The court has not yet addressed anyquestions related to damages, but is expected to do so during the first quarter of 2014. After final judgment isentered, Travelocity intends to appeal the court’s decision.
In late 2012, the Tax Appeal Court of the State of Hawaii granted summary judgment in favor ofTravelocity and other OTAs on the issue of whether Hawaii’s hotel occupancy tax applies to the merchantrevenue model. However, in January 2013, the same court granted summary judgment in favor of the State ofHawaii and against Travelocity and other OTAs on the issue of whether the state’s general excise tax, which isassessed on all business activity in the state, applies to the merchant revenue model for the period from 2002 to2011.
We expensed $19 million and $25 million in the years ended December 31, 2013 and 2012, respectively,which represents the amount we would owe to the State of Hawaii, prior to appealing the Tax Appeal Court’sruling, in back excise taxes, penalties and interest based on the court’s interpretation of the statute. In 2013, wemade payments totaling $35 million and maintained an accrued liability of $9 million. Payment of such amountis not an admission that we believe we are subject to the taxes in question.
Travelocity has appealed the Tax Appeal Court’s determination that we are subject to general excise tax, aswe believe the decision is incorrect and inconsistent with the same court’s prior rulings. If any such taxes are infact owed (which we dispute), we believe the correct amount would be under $10 million. The ultimateresolution of these contingencies may differ from the liabilities recorded. To the extent our appeal is successful inreducing or eliminating the assessed amounts, the State of Hawaii would be required to refund such amounts,plus interest.
On May 20, 2013, the State of Hawaii issued an additional general excise tax assessment for the calendaryear 2012. Travelocity has appealed this recent assessment to the Tax Appeal Court, and this assessment hasbeen stayed pending a final appellate decision on the original assessment.
174
On December 9, 2013, the State of Hawaii also issued assessments of general excise tax for merchant rentalcar bookings facilitated by Travelocity and other OTAs for the period 2001 to 2012 for which we recorded a $2million reserve in the fourth quarter of 2013. Travelocity has appealed the assessment to the Tax Appeal Courtand does not believe the excise tax is applicable.
The aggregate impact to our results of operations for all litigation and administrative audit proceedingsrelating to hotel sales, occupancy or excise taxes for the year ended December 31, 2013 was $27 million, whichamount includes all amounts expensed for the State of Hawaii during that period. As of December 31, 2013, wehave a remaining reserve of $18 million, included in liabilities on the consolidated balance sheet, for the potentialresolution of issues identified related to litigation involving hotel sales, occupancy or excise taxes, which amountincludes the $9 million liability for the remaining payments to the State of Hawaii. Our estimated liability isbased on our current best estimate but the ultimate resolution of these issues may be greater or less than theamount recorded and, if greater, could adversely affect our results of operations.
In addition to the actions by the tax authorities, four consumer class action lawsuits have been filed againstus and other OTAs in which the plaintiffs allege that we made misrepresentations concerning the description ofthe fees received in relation to facilitating hotel reservations. Generally, the consumer claims relate to whetherTravelocity and the other OTAs provided adequate notice to consumers regarding the nature of our fees and theamount of taxes charged or collected. One of these lawsuits was dismissed by the Texas Supreme Court and suchdismissal was subsequently affirmed; one was voluntarily dismissed by the plaintiffs; one is pending in Texasstate court, where the court is currently considering the plaintiffs’ motion to certify a class action; and the last ispending in federal court, but has been stayed pending the outcome of the Texas state court action. We believe thenotice we provided was appropriate.
In addition to the lawsuits, a number of state and local governments have initiated inquiries, audits and otheradministrative proceedings that could result in an assessment of sales or occupancy taxes on fees. If we do notprevail at the administrative level, those cases could lead to formal litigation proceedings.
Pursuant to our Expedia SMA, we will continue to be liable for fees, charges, costs and settlements relatingto litigation arising from hotels booked on the Travelocity platform prior to the Expedia SMA. However, fees,charges, costs and settlements relating to litigation from hotels booked subsequent to the Expedia SMA will beshared with Expedia according to the terms of the Expedia SMA. The Expedia SMA requires us to guaranteeTravelocity’s indemnification obligations for liabilities that may arise out of such litigation matters, which couldadversely affect our cash flow.
US Airways Antitrust Litigation
In April 2011, US Airways sued us in federal court in the Southern District of New York, alleging violationsof the Sherman Act Section 1 (anticompetitive agreements) and Section 2 (monopolization). The complaint wasfiled two months after we entered into a new distribution agreement with US Airways. In September 2011, thecourt dismissed all claims relating to Section 2. The claims that were not dismissed are claims brought underSection 1 of the Sherman Act that relate to our contracts with airlines, especially US Airways itself, which USAirways says contain anticompetitive content-related provisions, and an alleged conspiracy with the other GDSs,allegedly to maintain the industry structure and not to implement US Airways’ preferred system of distributingits Choice Seats product. We strongly deny all of the allegations made by US Airways. In September 2013, USAirways issued a report in which it purported to quantify its damages at either $281 million or $425 million,(before trebling) depending on certain assumptions. We believe both estimates are based on faulty assumptionsand analysis and therefore are highly overstated. In the event US Airways were to prevail on the merits of itsclaim, we believe any monetary damages awarded (before trebling) would be significantly less than either of USAirways’ proposed damage amounts.
Document discovery, fact witness discovery and expert witness discovery are complete. Summary judgmentmotions are scheduled to be filed in April 2014, with full briefing of those motions expected to be completed in
175
May 2014. All court settings are subject to change. No trial date has been set and we anticipate the most likelytrial date would be in September or October 2014, assuming no delays with the court’s schedule and that we donot prevail completely with our summary judgment motions.
We have and will incur significant fees, costs and expenses for as long as the litigation is ongoing. Inaddition, litigation by its nature is highly uncertain and fraught with risk, and it is therefore difficult to predict theoutcome of any particular matter. If favorable resolution of the matter is not reached, any monetary damages aresubject to trebling under the antitrust laws and US Airways would be eligible to be reimbursed by us for its costsand attorneys’ fees. Depending on the amount of any such judgment, if we do not have sufficient cash on hand,we may be required to seek financing through the issuance of additional equity or from private or publicfinancing. Additionally, US Airways can and has sought injunctive relief, though we believe injunctive relief forUS Airways is precluded by the settlement agreement we reached with American Airlines in 2012, which coversaffiliates, including through merger, of American Airlines. If injunctive relief were granted, depending on itsscope, it could affect the manner in which our airline distribution business is operated and potentially forcechanges to the existing airline distribution business model. Any of these consequences could have a materialadverse effect on our business, financial condition and results of operations.
Department of Justice Investigation
On May 19, 2011, we received a CID from the DOJ investigating alleged anticompetitive acts related to theairline distribution component of our business. We are fully cooperating with the DOJ investigation and areunable to make any prediction regarding its outcome. The DOJ is also investigating other companies that ownGDSs, and has sent CIDs to other companies in the travel industry. Based on its findings in the investigation, theDOJ may (i) close the file, (ii) seek a consent decree to remedy issues it believes violate the antitrust laws, or(iii) file suit against us for violating the antitrust laws, seeking injunctive relief. If injunctive relief were granted,depending on its scope, it could affect the manner in which our airline distribution business is operated andpotentially force changes to the existing airline distribution business model. Any of these consequences wouldhave a material adverse effect on our business, financial condition and results of operations.
Insurance Carriers
We have disputes against two of our insurance carriers for failing to reimburse defense costs incurred in theAmerican Airlines antitrust litigation, which we settled in October 2012. For a description of the AmericanAirlines antitrust litigation, see Note 20, Commitments and Contingencies—Legal Proceedings—AirlineAntitrust Litigation, US Airways Antitrust Litigation, and DOJ Investigation to our audited consolidatedfinancial statements included elsewhere in this prospectus. Both carriers admitted there is coverage, but reservedtheir rights not to pay should we be found liable for certain of American Airlines’ allegations. Despite theiradmission of coverage, the insurers have only reimbursed us for a small portion of our significant defense costs.We filed suit against the entities in New York state court alleging breach of contract and a statutory cause ofaction for failure to promptly pay claims. If we prevail, we may recover some or all amounts already tendered tothe insurance companies for payment within the limits of the policies and would be entitled to 18% interest onsuch amounts. To date, settlement discussions have been unsuccessful. The court has not scheduled a trial datethough we anticipate trial to begin in the latter part of 2014.
Hotel Related Antitrust Proceedings
On August 20, 2012, two individuals alleging to represent a putative class of bookers of online hotelreservations filed a complaint against Sabre Holdings, Travelocity.com LP, and several other online travelcompanies and hotel chains in the U.S. District Court for the Northern District of California, alleging federal andstate antitrust and related claims. The complaint alleges generally that the defendants conspired to enter into illegalagreements relating to the price of hotel rooms. Over 30 copycat suits were filed in various courts in the UnitedStates. In December 2012, the Judicial Panel on Multi-District Litigation centralized these cases in the U.S. District
176

Court in the Northern District of Texas, which subsequently consolidated them. The proposed class period isJanuary 1, 2003 through May 1, 2013. On June 15, 2013, the court granted Travelocity’s motion to compelarbitration of claims involving Travelocity bookings made on or after February 4, 2010. While all claims fromFebruary 4, 2010 through May 1, 2013 are now excluded from the lawsuit and must be arbitrated if pursued at all,the lawsuit still covers claims from January 1, 2003 through February 3, 2010. Together with the other defendants,Travelocity and Sabre filed a motion to dismiss. On February 18, 2014, the court granted the motion and dismissedthe plaintiff’s claims without prejudice. On March 19, 2014, the plaintiffs filed a motion for leave to file anamended complaint seeking to cure the pleading deficiencies described by the judge. We will oppose the motion.We deny any conspiracy or any anti-competitive actions and we intend to aggressively defend against the claims.
Even if we are ultimately successful in defending ourselves in this matter, we are likely to incur significantfees, costs and expenses for as long as it is ongoing. In addition, litigation by its nature is highly uncertain andfraught with risk, and it is difficult to predict the outcome of any particular matter. If favorable resolution of thematter is not reached, we could be subject to monetary damages, including treble damages under the antitrustlaws, as well as injunctive relief. If injunctive relief were granted, depending on its scope, it could affect themanner in which our Travelocity business is operated and potentially force changes to the existing businessmodel. Any of these consequences could have a material adverse effect on our business, financial condition andresults of operations.
Litigation Relating to Value Added Tax Receivables
In the United Kingdom, Her Majesty’s Revenue & Customs (“HMRC”) asserted that our subsidiary, SecretHotels2 Limited failed to account for United Kingdom VAT on margins earned from hotels located within theEU. HMRC issued assessments of tax totaling approximately $11 million for the period October 1, 2004 toSeptember 30, 2007. We appealed the assessments and in March 2010 the VAT and Duties Tribunal (the “FirstTribunal”) denied the appeal. We then appealed to the Upper Tribunal (Finance and Tax Chamber) and in July2011 were successful overturning HMRC’s original assessment. HMRC appealed this decision to the Court ofAppeal who on December 3, 2012 found against Secret Hotels2 Limited upholding the decision of the FirstTribunal in favor of HMRC. Based upon this Court of Appeal judgment and the limited ability to obtain leave toappeal, we accrued $17 million of expense in discontinued operations during the year ended December 31, 2012,included in liabilities of discontinued operations in the consolidated balance sheet as of December 31, 2012.Secret Hotels2 Limited successfully obtained leave to appeal the Court of Appeal decision to the Supreme Courtin 2013, which is the final court of appeal in the United Kingdom, and on March 5, 2014 judgment was given infavor of Secret Hotels2 Limited. We therefore reversed our reserve in 2013 in discontinued operations. Anyfurther opportunities to appeal this decision through the European courts are considered remote.
Additionally, HMRC has begun a review of other parts of our lastminute.com business in theUnited Kingdom. We believe that we have paid the correct amount of VAT on all relevant transactions as nowreinforced by the outcome of Secret Hotels2 case with the Supreme Court and will vigorously defend ourposition with HMRC or through the courts if necessary.
Litigation Relating to Patent Infringement
In April 2010, CEATS, Inc. (“CEATS”) filed a patent infringement lawsuit against several ticketingcompanies and airlines, including JetBlue, in the Eastern District of Texas. CEATS alleged that the mouse-overseat map that appears on the defendants’ websites infringes certain of its patents. JetBlue’s website is providedby our Airline Solutions business under the SabreSonic Web service. On June 11, 2010, JetBlue requested thatwe indemnify and defend it for and against the CEATS lawsuit based on the indemnification provision in ouragreement with JetBlue, and we agreed to a conditional indemnification. CEATS claimed damages of $0.30 persegment sold on JetBlue’s website during the relevant time period totaling $10 million. A jury trial began onMarch 12, 2012, which resulted in a jury verdict invalidating the plaintiff’s patents. Final judgment was enteredand the plaintiff appealed. The Federal Circuit affirmed the jury’s decision in our favor on April 26, 2013.
177
CEATS did not appeal the Federal Circuit’s decision, and its deadline to do so has passed. On June 28, 2013, theEastern District denied CEATS’ previously filed motion to vacate the judgment based on an alleged conflict ofinterest with a mediator. CEATS has appealed that decision.
Indian Income Tax Litigation
We are currently a defendant in income tax litigation brought by the Indian Director of Income Tax (“DIT”)in the Supreme Court of India. The dispute arose in 1999 when the DIT asserted that we have a permanentestablishment within the meaning of the Income Tax Treaty between the United States and the Republic of Indiaand accordingly issued tax assessments for assessment years ending March 1998 and March 1999, and laterissued further tax assessments for assessment years ending March 2000 through March 2006. We appealed thetax assessments and the Indian Commissioner of Income Tax Appeals returned a mixed verdict. We filed furtherappeals with the Income Tax Appellate Tribunal (the “ITAT”). The ITAT ruled in our favor on June 19, 2009and July 10, 2009, stating that no income would be chargeable to tax for assessment years ending March 1998and March 1999, and from March 2000 through March 2006. The DIT appealed those decisions to the DelhiHigh Court, which found in our favor on July 19, 2010. The DIT has appealed the decision to the Supreme Courtof India and no trial date has been set.
We intend to continue to aggressively defend against these claims. Although we do not believe that theoutcome of the proceedings will result in a material impact on our business or financial condition, litigation is byits nature uncertain. If the DIT were to fully prevail on every claim, we could be subject to taxes, interest andpenalties of approximately $25 million, which could have a material adverse effect on our business, financialcondition and results of operations. We do not believe this outcome is probable and therefore have not made anyprovisions or recorded any liability for the potential resolution of this matter.
US Airways GDS Contract Dispute
Representatives of US Airways have advised us that they believe, as a result of their merger with AmericanAirlines, US Airways is entitled to pricing discounts under their existing GDS contract with us for the period ofmid-December 2013 through April 2014. They have indicated an intention to commence litigation if the billingdispute is not otherwise resolved. We believe US Airways has incorrectly interpreted the terms of the contractand therefore the assertion is without merit. If US Airways’ interpretation of the contract were to be confirmed,our maximum exposure would be approximately $5.5 million (consisting of $0.6 million in 2013 and$4.9 million in the remaining period ending April 2014). Our agreement with US Airways expires on April 30,2014 and from that point forward US Airways will begin operating under our GDS agreement with AmericanAirlines, which is not subject to the interpretational issue described above.
Litigation Relating to Routine Proceedings
We are also engaged from time to time in other routine legal and tax proceedings incidental to our business.We do not believe that any of these routine proceedings will have a material impact on the business or ourfinancial condition.
178

Property
As a company with global operations, we operate in many countries with a variety of sales, administrative,product development, and customer service roles provided in these offices.
Americas: Our corporate and business unit headquarters and domestic operations are located in a propertywhich we own in Southlake, Texas. Travelocity corporate headquarters is located in Westlake, Texas, with alease that expires in 2017. There are 16 additional offices across North America and 14 offices across LatinAmerica that serve in various sales, administration, software development and customer service capacities. All ofthese additional offices are leased.
Europe: Travel Network has its European regional headquarters in London, United Kingdom, with a leasethat expires in 2027. lastminute.com also has its regional headquarters in London, with a lease that expires in2022. There are 27 additional offices across Europe that serve in various sales, administration, softwaredevelopment and customer service capacities. All of these additional offices are leased.
APAC: Travel Network and Airline and Hospitality Solutions have the APAC regional operationsheadquartered in Singapore under a lease that expires in 2017. All of our businesses share a single office. Thereare 10 additional offices across APAC that serve in various sales, administration, software development andcustomer service capacities. All of these additional offices are leased.
The table below provides a summary of our key facilities as of December 31, 2013:
Location Purpose Employees Leased or Owned
HEADQUARTERSSouthlake, Texas, USA . . . . . . . . . . Sabre worldwide corporate and domestic
headquarters 2,736 OwnedWestlake, Texas, USA . . . . . . . . . . Travelocity corporate headquarters 292 LeasedLondon, United Kingdom . . . . . . . . Travel Network regional headquarters 145 LeasedLondon, United Kingdom . . . . . . . . lastminute.com regional headquarters 225 LeasedSingapore . . . . . . . . . . . . . . . . . . . . . Travel Network and Airline and
Hospitality Solutions regional headquarters 62 Leased
DEVELOPMENT CENTERSBuenos Aires, Argentina . . . . . . . . . Development Center for Travelocity, Sabre
Technology and Travel Network 168 LeasedBangalore, India . . . . . . . . . . . . . . . Development Center for Sabre Technology,
Travelocity, Sabre 674 LeasedKrakow, Poland . . . . . . . . . . . . . . . . Development Center for Sabre technology
and Travel Network 1,315 Leased
CUSTOMER CARE CENTERSSan Antonio, Texas, USA . . . . . . . . Travelocity Customer Care Center 133 LeasedWilkes-Barre, Pennsylvania,
USA . . . . . . . . . . . . . . . . . . . . . . . Travelocity Customer Care Center 170 LeasedMontevideo, Uruguay . . . . . . . . . . . Travel Network and Airline Solutions
Customer Care Center 786 Leased
Government Regulation
We are subject to or affected by international, federal, state and local laws, regulations and policies, whichare constantly subject to change. The descriptions of the laws, regulations and policies that follow are summaries
179

and should be read in conjunction with the texts of the laws and regulations. The descriptions set out below donot purport to describe all present and proposed laws, regulations and policies that affect our businesses.
To the best of our knowledge and belief, we are in material compliance with these laws, regulations andpolicies. We cannot, however, predict the effect of changes to the existing laws, regulations and policies or of theproposed laws, regulations and policies that are described below. We are not aware of proposed changes orproposed new laws, regulations and policies that will have a material adverse effect on our businesses. See “RiskFactors—Regulatory and Other Legal Risks—Any failure to comply with regulations or any changes in suchregulations governing our businesses could adversely affect us.”
Computer Reservations System Industry Regulation
GDS Regulation in the EU
GDS operations are regulated in the EU by Council Regulation (EC) No. 80/2009 of the EuropeanParliament and of the Council of January 14, 2009 on a Code of Conduct for computerized reservations systemsand repealing Council Regulation (EEC) No. 2299/89 (“Code of Conduct”). The previous legislative frameworkessentially obliged GDS providers to charge the same booking fee for the same service provided to any airline,where the costs associated with the services was the same, and airlines to provide the same fare content to all theGDS providers in which they participated. The revised Code of Conduct substantially simplifies this regime andgives GDS operators, airlines, and other travel suppliers more flexibility in negotiating their commercialarrangements.
Under the Code of Conduct, particular rules apply to dealings between each GDS, air carriers, and railtransport operators, or participating carriers, and subscribers, which are typically offline or online travel agents.Additional rules apply to air carriers that control or have decisive influence over a GDS (“parent carriers”). Asdescribed in an explanatory note of the European Commission, published alongside the Code of Conduct, aparticipating carrier becomes a parent carrier if it controls a GDS or has sufficient capital or board representationrights to have decisive influence over the GDS. Parent carriers are subject to specific rules, in particularprohibiting discrimination against a GDS competing with the GDS in which they participate, for example, bywithholding booking capability or linking incentives or disincentives to the use of a specific GDS. We do nothave a parent carrier for purposes of the current EU regulation. The Code of Conduct also seeks to ensure thattravel agents’ displays provide a full and neutral selection of the relevant travel information processed by a GDSand that the privacy of end consumers is respected.
Under the Code of Conduct, a GDS may not attach unfair conditions to a contract with a participating carrieror with a subscriber. Additionally, a GDS may not reserve any processing procedure or other distribution facilityfor one or more participating carriers, including parent carriers, and must keep all participating carriers informedof any changes.
The Code of Conduct provides that small subscribers (employing fewer than 50 persons and with an annualturnover of up to €10 million) may terminate a contract with a GDS vendor on three months’ notice after the firstyear of the contract.
GDS providers may commercialize marketing, booking and sales data provided that such data is offeredwith equal timeliness and on a non-discriminatory basis to all participating carriers, including parent carriers.This data is typically provided through Marketing Information Data Tapes.
With regard to the interface with subscribers and end consumers, the GDS must ensure that the principaldisplay of fares corresponding to a particular search is presented to subscribers in a neutral and comprehensivemanner, without discrimination for or against any particular participating carrier and without misleading theviewer. From this principal display, the system may thereafter include biased screens; however, the information
180

provided to a consumer must be unbiased unless the consumer specifically requests another display. Also,personal data collected by a GDS in the course of its activities must be processed in a manner compatible with itsresponsibilities as a data controller under Article 2(d) of Directive 1995/46/EU.
The European Commission monitors the ownership structure and governance model of each GDS, inparticular through independent audited reports prepared by each GDS at least every four years.
If the European Commission finds that a GDS provider has, intentionally or negligently, infringed the Codeof Conduct, it may require the GDS provider to bring the infringement to an end and impose fines not exceeding10% of the GDS provider’s total gross turnover in the preceding business year. The Commission may alsoimpose fines for not responding to information requests. These sanctions are civil, not criminal, and may beappealed to the Court of Justice of the European Communities.
We believe that we comply in all aspects with the Code of Conduct. We have no parent carriers and so arenot subject to the specific rules in that regard.
GDS Regulation in Canada
There are GDS regulations in Canada issued under the regulatory authority of the Canadian Department ofTransportation. On April 27, 2004, a significant number of these regulations were lifted, including theelimination of the “obligated carrier” rule, which required larger airlines in Canada to participate equally in allGDSs, and elimination of the requirement that transaction fees charged by GDSs to airlines be non-discriminatory. Due to the elimination of the obligated carrier rule in Canada, Air Canada, the dominantCanadian airline, could choose distribution channels that it owns and controls or distribution through anotherGDS rather than through our GDS.
GDS Regulation in the United States
As of July 31, 2004, all GDS regulations in the United States (which only covered airline distribution)expired. Nonetheless, the DOT has retained the authority to intervene as it considers necessary under 49 U.S.C. §41712. To date, the DOT has not intervened in relation to our GDS activities in the United States, but hasprovided guidance regarding, among other things, any biasing of air carrier GDS displays. This guidance largelytracks our process with respect to any carrier specific bias we may choose to implement in our primary display.To the best of our knowledge, the DOT has not intervened in relation to the GDS activity of any other provider,with the exception of the display of air carrier codeshares by Amadeus. The DOT is currently consideringenacting rules that would require airlines choosing to distribute via a GDS to provide the GDS with any coreancillary fares (seats, bags, etc.). No rule has yet been proposed.
GDS Regulation Elsewhere
GDS services have been regulated in Peru since 2000. In July 2010, India enacted GDS regulations. Bothsets of regulations are similar to GDS regulation in the EU. The regulations in Peru and India have not causedany material issues for our business.
Data Protection and Privacy Regulation
We are subject to the application of data protection and privacy regulations in many of the countries inwhich we operate and any breach of such regulations could result in economic sanctions, which could be materialand/or harm our reputation.
In our businesses, customers provide us with personally identifiable information (“personal data”) that hasbeen specifically and voluntarily given. Personal data includes information that can identify a customer or a
181

specific individual, such as name, phone number, or e-mail address. We obtain personal data from airlines,hotels, and other travel suppliers and from travel buyers and other travel retailers with which we have acommercial or business relationship. We collect, use, disclose and transfer personal data in conformance withapplicable privacy laws and regulations, and implement technical and organizational measures designed toprotect against unauthorized access, use, disclosure, modification, and destruction of personal data that we collectand maintain.
A primary source of privacy regulations to which our operations are subject is the EU Data ProtectionDirective 1995/46/EC of the European Parliament and Council (October 24, 1995). Pursuant to this directive,individual countries within the EU have specific regulations related to the transborder flow of personal information(i.e., sending personal information from one country to another). The EU Data Protection Directive requirescompanies doing business in EU Member States to comply with its standards. It provides for, among other things,specific regulations requiring all non-EU countries doing business with EU Member States to provide adequate dataprivacy protection when processing personal data from any of the EU Member States. Sabre’s GetThere subsidiaryand PRISM subsidiary have self-certified compliance with the U.S.-E.U. Safe Harbor and the U.S.-Swiss SafeHarbor frameworks. Our GDS business is covered by the EU GDS Code of Conduct.
Many other countries have adopted data protection regimes. An example is Canada’s Personal Informationand Protection of Electronic Documents Act (“PIPEDA”). PIPEDA provides Canadian residents with privacyprotections with regard to transactions with businesses and organizations in the private sector.
We believe we are in compliance with all applicable laws in this area.
Office of Foreign Assets Control Regulation
The United States has imposed economic sanctions that affect transactions with designated foreigncountries, nationals and others. The United States prohibits U.S. persons from engaging with individuals andentities identified as “Specially Designated Nationals,” such as terrorists and narcotics traffickers. Theseprohibitions are administered by the U.S. Department of the Treasury’s Office of Foreign Assets Control and aretypically known as the OFAC rules. The OFAC rules prohibit U.S. persons from engaging in financialtransactions with or relating to the prohibited individual, entity or country, require the blocking of assets in whichthe individual, entity or country has an interest, and prohibit transfers of property subject to U.S. jurisdiction(including property in the possession or control of U.S. persons) to such individual, entity or country. Blockedassets (e.g., property or bank deposits) cannot be paid out, withdrawn, set off or transferred in any mannerwithout a license from OFAC. We maintain a global sanctions program designed to ensure compliance withOFAC requirements. Failure to comply with such requirements could subject us to legal and reputationalconsequences, including criminal penalties. See “Risk Factors—Any failure to comply with regulations or anychanges in such regulations governing our business could adversely affect us.”
Other Regulation
We are actively monitoring the status of certain proposed U.S. federal and state legislation related to privacythat may be enacted in the future. It is unclear what effect, if any, the passage of any such U.S. federal or statelegislation would have on our businesses.
Our businesses may also be subject to regulations affecting issues such as: trade sanctions, exports oftechnology, telecommunications, and e-commerce. Any such regulations may vary among jurisdictions. We donot currently maintain a central database of regulatory requirements affecting our worldwide operations and, as aresult, the risk of non-compliance with the laws and regulations described above is heightened. However, webelieve that we are capable of addressing these regulatory issues as they arise.
182

Employees
As of December 31, 2013, we employed approximately 10,000 people. As a global company withsignificant operations outside the United States, our employee composition reflects the global nature of ourbusiness. Approximately 47% of our employees are based in the United States and 53% in the rest of the world.
Our ability to attract and retain highly qualified employees is important to our success in maintainingleadership in our businesses. Competition for qualified personnel in our industry is intense. We have a policy ofusing equity-based compensation programs to reward and motivate significant contributors among ouremployees. Our employees are not represented by a labor union in the United States.
We have a Works Council covering some of our operations in several European countries, as required bylaw. A Works Council is a representative body of the employees of a company elected by the employees.Management of the subsidiary must seek the non-binding advice of the Works Council before taking certaindecisions, such as a major restructuring, a change of control or the appointment or dismissal of a member of theboard of management. Certain other decisions that directly involve employment matters applicable either to allemployees or certain groups of employees require the Works Council’s approval unless approved by theappropriate judicial body.
We have not experienced any work stoppages and consider our relations with our employees to be good.
183
MANAGEMENT AND BOARD OF DIRECTORS
The following sets forth the name, age, position and description of the business experience as of March 31,2014 of individuals who serve as executive officers and directors of our company and brief statements of thoseaspects of our directors’ backgrounds that led us to conclude that they should serve as directors.
Name Age Position
Thomas Klein . . . . . . . . . . . . . . . . . . . . . . 51 Chief Executive Officer, President and Director, Sabre
Richard A. Simonson . . . . . . . . . . . . . . . . 55 Executive Vice President and Chief Financial Officer, Sabre
Gregory T. Webb . . . . . . . . . . . . . . . . . . . 47 Executive Vice President, Sabre and President, Travel Network
Hugh W. Jones . . . . . . . . . . . . . . . . . . . . . 50 Executive Vice President, Sabre and President, Sabre AirlineSolutions
Carl Sparks . . . . . . . . . . . . . . . . . . . . . . . . 46 Executive Vice President, Sabre and President and CEO,Travelocity
Alexander S. Alt . . . . . . . . . . . . . . . . . . . . 39 President and General Manager, Sabre Hospitality Solutions
Deborah Kerr . . . . . . . . . . . . . . . . . . . . . . 42 Executive Vice President and Chief Product and TechnologyOfficer, Sabre
William G. Robinson . . . . . . . . . . . . . . . . 49 Executive Vice President and Chief Human Resources Officer,Sabre
Sterling Miller . . . . . . . . . . . . . . . . . . . . . 51 Executive Vice President, General Counsel and CorporateSecretary, Sabre
Lawrence W. Kellner . . . . . . . . . . . . . . . . 55 Chairman of the Board of Directors
Timothy Dunn . . . . . . . . . . . . . . . . . . . . . 56 Director
Gary Kusin . . . . . . . . . . . . . . . . . . . . . . . . 62 Director
Greg Mondre . . . . . . . . . . . . . . . . . . . . . . 39 Director
Judy Odom . . . . . . . . . . . . . . . . . . . . . . . . 61 Director
Joseph Osnoss . . . . . . . . . . . . . . . . . . . . . 36 Director
Karl Peterson . . . . . . . . . . . . . . . . . . . . . . 43 Director
Executive Officers
Thomas Klein is CEO and president of Sabre and has more than 17 years of experience managing largescale, international technology businesses. Before being named CEO and president of Sabre in August 2013,Mr. Klein served as company president since January 2010. His role prior to that was executive vice president,Sabre, and group president of our Travel Network and Airline and Hospitality Solutions businesses. Earlier rolesincluded various senior leadership positions within Sabre, both in the United States and in Latin America, and heserved as the first director general of Sabre Sociedad Tecnologica, a Mexico-based joint venture company ownedby Sabre, Aeromexico and Mexicana. Prior to joining Sabre in 1994, Mr. Klein held a variety of sales, marketingand operations positions at American Airlines and Consolidated Freightways, Inc. In 2010, Mr. Klein wasappointed to the Board of Directors for Brand USA by the U.S. Secretary of Commerce and now serves as vicechairman. Mr. Klein serves on the Board of Directors and chairs the compensation committee for Cedar FairEntertainment. Mr. Klein also serves on the executive committee of the World Travel & Tourism Council and theDean’s Board of the Villanova School of Business. Mr. Klein holds a bachelor’s degree in businessadministration from Villanova University. Mr. Klein’s long service at our company, travel technology industryexperience and his leadership experience make him a valuable asset to our management and our board ofdirectors.
184

Richard A. Simonson is executive vice president and chief financial officer. He leads the company’s globalfinance organization and is responsible for all finance and controls, reporting, investor relations and corporatedevelopment activities. He brings a combination of experiences with global finance, operations and capitalmarkets focused on technology sectors. Before joining Sabre in March 2013, Mr. Simonson most recently servedas CFO and president for business operations at Rearden Commerce, an e-commerce company from March 2011to May 2012 and as an independent advisor to companies in the telecom, media and technology industry fromMay 2012 to March 2013 and from July 2010 to May 2011. From September 2001 to July 2010 he worked atNokia Corporation in several global roles based in locations around the world—in Helsinki, Zurich and NewYork—including executive vice president and general manager of Nokia’s mobile phones unit and more than fiveyears as executive vice president and CFO. Mr. Simonson’s career includes time with Barclays Capital asmanaging director in the telecom and media investment banking group. He also spent 16 years with Bank ofAmerica Securities, where he held various finance and investment banking positions in San Francisco andChicago. Mr. Simonson currently serves on the board of directors of Electronic Arts, where he chairs thenominating and governance committee, and Silver Spring Networks, where he chairs the audit committee. Hegraduated from the Colorado School of Mines and holds an M.B.A. from Wharton School of Business at theUniversity of Pennsylvania.
Gregory T. Webb is executive vice president and president of Travel Network, and before being named tohis current role, gained experience with all aspects of the business, from leading the marketing organization tomanaging our supplier relationships, Travel Network business in Asia and Hospitality Solutions business. Sincejoining Sabre in 1995, Mr. Webb has held several senior leadership positions including chief marketing officerfor both our Travel Network and Airline and Hospitality Solutions businesses and senior vice president of globalproduct marketing for Sabre. Early in his career, he served as director of project consulting and risk assessmentfor American Airlines and Sabre. Prior to joining the company, Mr. Webb was vice president and chiefinformation officer for BellSouth Telecommunications and also served as a senior consultant at AndersenConsulting. Mr. Webb earned a master’s degree in business administration with an emphasis in marketing fromLouisiana Tech University and a bachelor’s degree in advertising from Southern Methodist University. He serveson the board of directors for Abacus.
Hugh W. Jones is executive vice president and president of Sabre Airline Solutions and is a 25-year veteranof the travel industry. Immediately prior to being named to his current role in April 2011, Mr. Jones served asTravelocity’s president and CEO beginning in January 2008 and before that, he held a number of executive rolesat Sabre including senior vice president and chief operating officer for our Travel Network and Airline andHospitality Solutions businesses, where he oversaw airline supplier initiatives and global customer support. Healso led Travel Network in North America and served as senior vice president and controller for Sabre. Mr. Jonesbegan his career with American Airlines in 1988 and held a variety of finance positions including financialcontroller for the airline’s European and Pacific airport, sales and reservations operations. He earned a master’sdegree in business administration from Southern Methodist University and a bachelor’s degree in geology andgeophysics from the University of Wisconsin.
Carl Sparks is executive vice president and president and chief executive officer of Travelocity, andoversees a portfolio of travel brands including Travelocity.com, Travelocity.ca and Travelocity.mx in NorthAmerica and lastminute.com in Europe. Mr. Sparks brings an extensive background in e-commerce, consumerbrands and retailing to his role. Before joining Travelocity in April 2011, he served as president of Gilt Groupefrom 2010 to 2011 and as chief marketing officer from 2009 to 2010, a leading online fashion and travel retailerin the United States and a pioneer in social and mobile commerce. Prior to that, Mr. Sparks held several seniorleadership positions at Expedia Inc. between June 2004 and October 2009 including general manager forHotels.com North America and chief marketing officer for Expedia.com. Earlier in his career, he served as vicepresident of direct business and brand at Capital One, and held senior marketing and strategy roles at Guinness,PepsiCo and Boston Consulting Group. Mr. Sparks serves on the board of directors of the Dunkin’ Brands GroupInc. and Vonage Holdings Corporation. Mr. Sparks graduated from Princeton University and received his M.B.A.from Harvard University.
185
Alexander S. Alt is president and general manager of Sabre Hospitality Solutions, and oversees one ofSabre’s two SaaS businesses. Prior to being named president, Mr. Alt served in an expanded chief operatingofficer role at Sabre Hospitality Solutions, where he oversaw customer care, data services, implementations, callcenter and similar services. As part of the Sabre Hospitality Solutions management team, he also helped driveoverall business strategy. Before joining Sabre in 2012, Mr. Alt served as senior vice president of globaldevelopment and strategy at Rosewood Hotels & Resorts, where he played a key role in the global growth andexpansion of the business. Prior to joining Rosewood Hotels in 2006, he was a senior engagement manager atMcKinsey & Company. Earlier in his career, he worked in the finance department of Sabre as a manager andsenior analyst in the financial planning and analysis group. Mr. Alt is a member of the Dallas DevelopmentBoard of The Nature Conservancy. He graduated from the University of Texas in Austin and received his M.B.A.from Harvard University.
Deborah Kerr is executive vice president and chief product and technology officer at Sabre, and isresponsible for leading the global product and technology organization. Prior to her appointment at Sabre in March2013, she served as executive vice president, chief product and technology officer at FICO from 2009 to April 2012,a leader in predictive analytics and decision management technology. Prior experience includes senior leadershiproles with HP, Peregrine Systems and NASA’s Jet Propulsion Laboratory. Ms. Kerr is a director of the Davis andHenderson Corporation. She was previously a director of Mitchell International from January 2010 until October2013. Ms. Kerr holds a master’s degree in Computer Science and a bachelor’s degree in Psychology.
William G. Robinson is executive vice president and chief human resources officer. He is responsible forleading Sabre’s global human resources organization, including talent management, organizational leadershipand culture. Prior to joining Sabre in December 2013, Mr. Robinson served as the senior vice president and chiefhuman resources officer at Coventry Health Care, a diversified managed health care company with 14,000employees, from 2012 to 2013. From 2010 to 2011, Mr. Robinson served as senior vice president for humanresources at Outcomes Health Information Solutions, a healthcare analytics and information companyspecializing in the optimization and acquisition of medical records. Prior to that, from 1990 to 2010, he workedfor General Electric, where he held several human resources leadership roles in diverse industries includinginformation technology, healthcare, energy and industrial. Most recently, he was the human resources leaderwithin the GE Enterprise Solutions division where he led a global team in an organization of 20,000 employeesin 200 locations worldwide. Mr. Robinson also previously worked with Outcomes Health Information SolutionsLLC. He holds a M.A. in Human Resources Development from Bowie State University and a B.S. inCommunications from Wake Forest University.
Sterling Miller is executive vice president, general counsel and corporate secretary of Sabre, a position heassumed in 2008. He manages the global legal department and government affairs group that provides legalcounsel to all of our lines of business and represents the company before federal and local courts and governmentagencies. He also serves as the chief compliance officer. Prior to his current role, Mr. Miller served as senior vicepresident and general counsel for Travelocity. Earlier roles include deputy general counsel for litigation andregulatory affairs for Sabre and an attorney for American Airlines. Before joining American Airlines, he was anattorney with the firm of Gallop, Johnson & Neuman in St. Louis, Missouri. Mr. Miller earned his J.D. degreefrom Washington University in St. Louis and his bachelor’s degree in political science from Nebraska WesleyanUniversity. He is a member of the Texas and Missouri Bar Associations.
Our executive officers will serve until their successors have been duly elected and qualified.
Our Board of Directors
Our business and affairs are managed under the direction of our board of directors. Our Certificate ofIncorporation will provide that our board of directors shall consist of at least five directors but no more thaneleven directors; provided, however, prior to the time when the Principal Stockholders beneficially own,collectively, less than 40% of the outstanding shares of our common stock, the board of directors shall not
186
consist of more than nine directors. Our board of directors is currently comprised of eight directors. The directorsare elected at the annual meeting of the stockholders and each director serves until the election and qualificationof his or her successor.
Thomas Klein. See executive officer bio above. Mr. Klein’s long service at our company, travel technologyindustry experience and leadership experience make him a valuable asset to our management and our board ofdirectors.
Lawrence W. Kellner joined the company as non-executive Chairman of our Board of Directors in August2013. He has served as President of Emerald Creek Group, LLC, a private equity firm, since 2010. He served asChairman and Chief Executive Officer of Continental Airlines, Inc., an international airline company, fromDecember 2004 through December 2009. He served as President and Chief Operating Officer of ContinentalAirlines from March 2003 to December 2004, as President from May 2001 to March 2003 and was a member ofContinental Airlines’ board of directors from May 2001 to December 2009. Mr. Kellner serves on the board ofdirectors of The Boeing Company, The Chubb Corporation and Marriott International, Inc. He is active innumerous community and civic organizations and currently serves on the Rice University Board of Trustees andthe Board of the Greater Houston Partnership. We believe that Mr. Kellner is a valuable asset and well qualifiedto sit on our board of directors as a result of his significant travel industry experience, significant corporategovernance experience and financial expertise.
Timothy Dunn is a TPG Operating Partner and has served on our board of directors since October 2010.Mr. Dunn joined TPG as director of operations in 2005, after serving as CFO for Hotwire Inc. and before that assenior vice president and CFO at Gap, Inc., where he was responsible for domestic and international finance andreal estate for the Gap Brand. From 1986 to 1998, Mr. Dunn served in various domestic and international financeroles, most recently as vice president and controller, for PepsiCo Restaurants Intl. Mr. Dunn currently serves as adirector of Nordstrom FSB. Mr. Dunn graduated magna cum laude from the University of Southern California,where he earned a bachelor’s degree in finance with an emphasis in accounting. He is a certified publicaccountant in California (inactive status). Because of Mr. Dunn’s financial expertise and his experience as anexecutive officer of major corporations, including of a travel technology company, we believe Mr. Dunn isqualified to serve on our board of directors.
Gary Kusin is an independent consultant focused on assisting companies on strategic and operationalmatters. He has served on our board of directors since March 2007. Among other engagements, Mr. Kusin acts asa TPG senior advisor, pursuant to which he provides his expertise to selected TPG portfolio companies as well asto selected TPG potential investment opportunities. Mr. Kusin previously served as president and CEO of FedExKinko’s, today operating as FedEx Office from 2001 to 2006. Prior to joining Kinko’s in 2001, Mr. Kusin servedas CEO of HQ Global Workplaces (now part of Regus), which provides offices, meeting rooms and networkaccess at locations around the world. In 1995 he co-founded Laura Mercier Cosmetics, which sold to NeimanMarcus in 1998. He also co-founded Babbage’s Inc. (now GameStop), a leading consumer software specialtychain, in 1983 and served as its president. Earlier in his career, he was vice president and general merchandisemanager for the Sanger-Harris division of the Federated Department Store (now Macy’s). An Inc. magazine“Entrepreneur of the Year,” Mr. Kusin serves on the board of directors of Petco, Fleetpride, American TireDistributor, and Savers. Mr. Kusin earned his Bachelor of Arts degree from The University of Texas at Austinand his M.B.A. from the Harvard Business School. We believe that Mr. Kusin should serve on our board ofdirectors because of his substantial expertise in executive management and corporate governance as a result ofhis extensive experience both as an investor and an executive officer of major corporations.
Greg Mondre is a Managing Partner and Managing Director with Silver Lake and has served on our board ofdirectors since March 2007. Mr. Mondre joined the firm in 1999 and has significant experience in private equityinvesting and expertise in sectors of the technology and technology-enabled industries. Prior to joining Silver Lake,Mr. Mondre was a principal at TPG, where he focused on private equity investments across a wide range ofindustries, with a particular focus on technology. Earlier in his career, Mr. Mondre worked as an investment banker
187
in the Communications, Media and Entertainment Group of Goldman, Sachs & Co. He currently serves as a directorof Avaya, Inc., Go Daddy Operating Company, LLC, IPC Systems, Inc. and Vantage Data Centers, and is on theoperating committee of SunGard Capital Corp. Mr. Mondre graduated from The Wharton School at the Universityof Pennsylvania with a bachelor’s degree in economics. Because Mr. Mondre has over seventeen years of privateequity investing and banking experience focused on technology companies and tech-enabled businesses, we believethat he would bring to our board of directors specialized knowledge and experience in portfolio management,analyzing potential acquisitions, raising equity, and setting corporate strategy.
Judy Odom joined the company as a director in March 2014. From 1985 until her retirement in 2002,Ms. Odom held numerous positions, most recently chief executive officer and chairman of the board, at SoftwareSpectrum, Inc., a global business to business software services company, which she co-founded in 1983. Prior tofounding Software Spectrum, Ms. Odom was a partner with the international accounting firm, Grant Thornton.Ms. Odom currently serves on the board of directors of Harte-Hanks, Inc. and Leggett & Platt, Inc., a diversifiedmanufacturing company. She previously served on the board of Storage Technology Corporation, a provider ofdata storage hardware and software products and services, from November 2003 to August 2005. Ms. Odomgraduated from Texas Tech University, where she earned a B.B.A. in accounting. We believe that Ms. Odom’squalifications to serve on our board include her board service with several companies allowing her to offer abroad leadership perspective on strategic and operating issues facing companies today. Ms. Odom’s experienceco-founding Software Spectrum, growing it to a large public company before selling it to another publiccompany and serving as board chair provides the insight and perspective of a successful entrepreneur and long-serving chief executive officer with international operating experience.
Joseph Osnoss is a Managing Director of Silver Lake, which he joined in 2002. He has served on our boardof directors since March 2007. He is currently based in London, where he helps to oversee the firm’s activities inEurope, the Middle East and Africa. Mr. Osnoss is a director of Global Blue, Interactive Data Corporation,Mercury Payment Systems, and Virtu Financial, and previously served on the board of directors of InstinetIncorporated. Prior to joining Silver Lake, Mr. Osnoss worked in investment banking at Goldman, Sachs & Co.,where he focused on mergers and financings in technology and related industries. Mr. Osnoss graduated summacum laude from Harvard College with an A.B. in Applied Mathematics-Economics and a citation in Frenchlanguage. He is a Visiting Professor at the London School of Economics, where he participates in teaching andresearch activities within the Department of Finance. Mr. Osnoss’ extensive experience investing in privateequity and serving on the board of directors of other companies, both domestically and internationally, positionshim to contribute meaningfully to our board of directors.
Karl Peterson is a Senior Partner of TPG and Managing Partner of TPG Capital LLP, the firm’s Europeanoperations. He has served on our board of directors since March 2007. Since joining TPG in 2004, Mr. Peterson has ledinvestments for the firm in technology, media, financial services and travel sectors. Prior to 2004, he was a co-founderand the president and CEO of Hotwire.com, the internet travel portal. He led the business from its launch in 2000through its sale to InterActiveCorp in 2003. Before Hotwire, Mr. Peterson was a principal at TPG in San Francisco,and from 1992 to 1995 he was a financial analyst at Goldman, Sachs & Co. Mr. Peterson is currently a director of TESGlobal, Saxo Bank and Norwegian Cruise Lines, as well as Caesars Acquisition Company. Mr. Peterson graduatedwith high honors from the University of Notre Dame, where he earned a B.B.A. in finance and business administration.We believe that as a result of his experience as a director of several travel and technology companies, as a formerexecutive of an online travel company, and as a private equity investor, Mr. Peterson will bring a keen strategicunderstanding of our industry and of the competitive landscape for our company.
Controlled Company
After the completion of this offering, the Principal Stockholders will control a majority of our outstandingcommon stock. The TPG Funds, the Silver Lake Funds and the Sovereign Co-Invest will ownapproximately 37%, 23% and 19%, respectively, of our common stock (or approximately 36%, 22% and 19%,respectively, if the underwriters exercise in full their option to purchase additional shares) after the completion of
188
this offering. As a result, we are a “controlled company” within the meaning of the NASDAQ rules. Under theNASDAQ rules, a company of which more than 50% of the voting power is held by an individual, group oranother company is a “controlled company” and may elect not to comply with certain NASDAQ corporategovernance standards, including: the requirement that a majority of the board of directors consist of independentdirectors; the requirement that our governance and nominating committee is composed entirely of independentdirectors; and the requirement that we have a compensation committee that is composed entirely of independentdirectors with a written charter addressing the committee’s responsibilities. Following this offering, we willqualify for these exemptions. As a result, we may not have a majority of independent directors and ourgovernance and nominating committee and compensation committee may not consist entirely of independentdirectors. Accordingly, you may not have the same protections afforded to stockholders of companies that aresubject to all of the NASDAQ rules regarding corporate governance.
The “controlled company” exception does not modify the independence requirements for the auditcommittee, and we intend to comply with the audit committee requirements of Rule 10A-3 under the ExchangeAct and the NASDAQ rules. Pursuant to such rules, we are required to have at least one independent director onour audit committee during the 90-day period beginning on the date of effectiveness of the registration statementfiled with the SEC in connection with this offering. After such 90-day period and until one year from the date ofeffectiveness of the registration statement, we are required to have a majority of independent directors on ouraudit committee. Thereafter, our audit committee is required to be comprised entirely of independent directors.
Board Composition
Our board of directors is currently comprised of eight directors. After the completion of this offering, ourCertificate of Incorporation will provide that the number of directors on our board of directors shall be not less thanfive directors nor more than eleven directors, as determined by the affirmative vote of the majority of the board ofdirectors then in office. However, prior to the time when the Principal Stockholders beneficially own, collectively,less than 40% of the outstanding shares of our common stock, the board of directors shall not consist of more thannine directors. At any meeting of the board of directors, the attendance of a majority of the total number ofauthorized directors and, if the Silver Lake Funds or the TPG Funds, as applicable, then-currently has designated,solely and not jointly, for nomination pursuant to the Stockholders’ Agreement at least one director who is servingon the board of directors, one director designated by the Silver Lake Funds or the TPG Funds, as applicable, willconstitute a quorum; provided that the Silver Lake Funds or the TPG Funds, as applicable, may, in its solediscretion, agree to waive the requirement that at least one director designated for nomination by such entity mustbe present to constitute a quorum. Our board of directors has determined that Timothy Dunn, Lawrence Kellner,Gary Kusin, Greg Mondre, Joseph Osnoss, Judy Odom and Karl Peterson are independent as defined under thecorporate governance rules of the NASDAQ.
After the completion of this offering, our board of directors will be divided into three classes, with eachdirector serving a 3-year term and one class being elected at each year’s annual meeting of stockholders. KarlPeterson, Judy Odom and Lawrence Kellner will initially serve as Class I directors with an initial term expiring in2015. Joseph Osnoss, Thomas Klein and Timothy Dunn will initially serve as Class II directors with an initial termexpiring in 2016. Greg Mondre and Gary Kusin will initially serve as Class III directors with an initial term expiringin 2017. Upon the expiration of the initial term of office for each class of directors, each director in such class shallbe elected for a term of three years and serve until a successor is duly elected and qualified or until his or her earlierdeath, resignation or removal. Any additional directorships resulting from an increase in the number of directors ora vacancy may be filled by the directors then in office.
Committees of the Board of Directors
The board of directors has established four standing committees to assist it in carrying out itsresponsibilities: the audit committee, the governance and nominating committee, the compensation committeeand the technology committee. Each of the committees operates under its own written charter adopted by the
189

board of directors, each of which will be available on our corporate website at www.sabre.com upon the closingof this offering. In addition, ad hoc committees may be designated under the direction of our board of directorswhen necessary to address specific issues.
Audit Committee
The audit committee is responsible for, among other things:
• reviewing the audit plans and findings of our independent auditor and our internal audit staff, as well asthe results of regulatory examinations and compliance with accounting rules, and trackingmanagement’s corrective action plans where necessary;
• reviewing with our management and our independent auditor our overall system of internal controlover financial reporting;
• reviewing with our management and independent auditor our financial statements, including anysignificant financial reporting issues and changes in accounting policies;
• reviewing with our management and independent auditor our major risk exposures, and the stepsmanagement has taken to monitor and control such exposures;
• overseeing the implementation and effectiveness of our compliance and ethics program, including our“whistleblowing” procedures;
• reviewing related party transactions; and
• appointing annually our independent auditor, evaluating its independence and performance, andpre-approving all audit and non-audit services provided by any independent auditor to the company.
The members of the audit committee are Judy Odom (Chairman), Timothy Dunn and Joseph Osnoss. Uponeffectiveness of the registration statement, Judy Odom will be “independent,” as defined under the NASDAQrules and Rule 10A-3 of the Exchange Act. Our board of directors has determined that each director appointed tothe audit committee is financially literate, and the board of directors has determined that each director appointedto the audit committee meets the criteria of the rules and regulations set forth by the SEC for an “audit committeefinancial expert.”
Governance and Nominating Committee
The governance and nominating committee is responsible for, among other things:
• reviewing the performance of our board of directors and making recommendations to the board ofdirectors regarding the selection of candidates, qualification and competency requirements for serviceon the board of directors and the suitability of proposed nominees as directors;
• advising the board of directors with respect to the corporate governance principles applicable to us; and
• reviewing management’s short- and long-term leadership development and succession plans andprocesses.
The members of the governance and nominating committee are Lawrence Kellner (Chairman), Gary Kusin,Greg Mondre and Karl Peterson. Upon effectiveness of the registration statement, each of Lawrence Kellner,Gary Kusin, Greg Mondre and Karl Peterson will be “independent,” as defined under the NASDAQ rules.Because we will be a “controlled company” under the NASDAQ rules, our governance and nominatingcommittee is not required to be fully independent, although if such rules change in the future or we no longermeet the definition of a controlled company under the current rules, we will adjust the composition of thegovernance and nominating committee accordingly in order to comply with such rules.
190

Compensation Committee
The compensation committee is responsible for, among other things:
• reviewing the operation of our compensation program;
• reviewing and approving corporate goals and objectives relevant to the compensation of our CEO,evaluating his or her performance in light of those goals and objectives, and determining and approvinghis or her compensation based on that evaluation;
• establishing and reviewing annually any stock ownership guidelines applicable to our directors andmanagement;
• determining and approving the compensation level (including base and incentive compensation) anddirect and indirect benefits of executive officers; and
• recommending to the board of directors the establishment and terms of incentive-compensation andequity-based plans, and administering such plans.
The members of the compensation committee are Gary Kusin (Chairman), Lawrence Kellner, Greg Mondreand Karl Peterson. Upon effectiveness of the registration statement, each of Gary Kusin, Lawrence Kellner, GregMondre and Karl Peterson will be “independent,” as defined under the NASDAQ rules. Because we will be a“controlled company” under the NASDAQ rules, our compensation committee is not required to be fullyindependent, although if such rules change in the future or we no longer meet the definition of a controlledcompany under the current rules, we will adjust the composition of the nominating and corporate committeesaccordingly in order to comply with such rules.
Technology Committee
The technology committee is responsible for, among other things:
• appraising major technology-related projects and making recommendations to our board regarding thecompany’s technology strategies;
• monitoring and discussing with management the quality and effectiveness of the company’s datasecurity, data privacy and disaster recovery capabilities; and
• advising our senior technology management team with respect to existing trends in informationtechnology and new technologies, applications and systems.
The members of the technology committee are Joseph Osnoss (Chairman), Thomas Klein and Greg Mondre.
Compensation Committee Interlocks and Insider Participation
None of our executive officers currently serves, or in the past year has served, as a member of the board ofdirectors or compensation committee of any entity that has one or more executive officers serving on our boardof directors or compensation committee.
In connection with this offering, we have revised our Business Ethics Policy, which is the code of conductapplicable to all of our directors, officers and employees. We have also adopted a Code of Ethics applicable toour CEO and senior financial officers (the “Senior Officers’ Code”), which will set forth the principles andresponsibilities specifically applicable to those officers. The Senior Officers’ Code is designed to be read andapplied in conjunction with our Business Ethics Policy. Both the Senior Officers’ Code and the Business EthicsPolicy will be available on our website at www.sabre.com. Any change or amendment to the Senior Officers’Code, and any waivers of the Senior Officers’ Code or the Business Ethics Policy for our directors, CEO orsenior financial officers, will be posted to our website at the above location.
191

COMPENSATION DISCUSSION AND ANALYSIS
This Compensation Discussion and Analysis addresses the principles underlying our executivecompensation program and the policies and practices that contributed to our executive compensation actions anddecisions for the year ended December 31, 2013 (“Fiscal 2013”) for the following individuals (i) who served asour principal executive officer at any time during Fiscal 2013, (ii) who served as our principal financial officer atany time during Fiscal 2013, and (iii) who were the three other most highly-compensated executive officers whowere serving as our executive officers as of December 31, 2013. During Fiscal 2013, these individuals were:
• Thomas Klein, our CEO and President;
• Richard Simonson, our Executive Vice President and CFO;
• Carl Sparks, our Executive Vice President and the President and CEO of Travelocity;
• Deborah Kerr, our Executive Vice President and Chief Product and Technology Officer;
• William G. Robinson, Jr., our Executive Vice President and Chief Human Resources Officer;
• Michael S. Gilliland, our former CEO; and
• Mark Miller, our former Executive Vice President and CFO.
We refer to these executive officers collectively in this Compensation Discussion and Analysis and therelated compensation tables as the “Named Executive Officers.”
Our overall corporate rewards strategy, which is embodied in our executive compensation program, isdesigned to advance four principal objectives:
• Pay for performance: Link a significant portion of the target total direct compensation opportunities ofour executive officers to our annual and long-term business performance and each individual’scontribution to that performance;
• Attract, motivate, and retain: Set compensation at market competitive levels that enable us to hire,incentivize, and retain high-caliber employees throughout the organization and which reinforce ourrobust succession planning process;
• Long-term equity participation: Provide opportunities, consistent with the interests of ourstockholders, for the realization of long-term stock appreciation through the ownership of an equitystake in the organization if we achieve our strategic and growth objectives; and
• Transparency: Ensure an efficient, simple, and transparent process for designing our compensationarrangements, setting performance objectives for annual and long-term incentive compensationopportunities, and making compensation decisions.
Fiscal 2013 Management Changes
Mr. Gilliland stepped down from his position as our CEO on August 15, 2013 and retired effectiveSeptember 21, 2013. Mr. Klein was promoted to serve as our CEO and President on August 15, 2013. As part ofthis leadership transition, Mr. Gilliland continued to serve as a member of our board of directors until March 24,2014.
On March 11, 2013, Mr. Simonson joined us and was appointed as our Executive Vice President and CFO.Mr. Miller terminated his employment effective July 1, 2013.
On March 11, 2013, Ms. Kerr joined us and was appointed as our Executive Vice President and ChiefProduct and Technology Officer, and on December 16, 2013, Mr. Robinson joined us and was appointed ourExecutive Vice President and Chief Human Resources Officer.
192
Fiscal 2014 Management Changes
In connection with the Expedia SMA becoming operationally complete, Mr. Sparks’ employment with uswill terminate on April 28, 2014. At such time, day-to-day operation of the Travelocity business in NorthAmerica will be managed by Roshan Mendis, currently the President of Travelocity North America. The day-to-day operation of lastminute.com will be managed by Matthew Crummack, currently the CEO of lastminute.com.Mr. Sparks may act in an advisory role to Sabre for some period of time after his departure.
In connection with Mr. Sparks’ resignation, Mr. Sparks will receive a customary separation package,including certain payments and benefits required pursuant to the terms and conditions of his employmentagreement.
Specifically, this Compensation Discussion and Analysis provides an overview of our executivecompensation philosophy, the overall objectives of our executive compensation program, and each materialelement of compensation that we provided to our executive officers, including the Named Executive Officers, inFiscal 2013. In addition, we explain how and why the Compensation Committee of our board of directors (the“Compensation Committee”) arrived at the specific compensation actions and decisions involving the NamedExecutive Officers during Fiscal 2013.
Executive Summary
Business Overview
We are a leading technology solutions provider to the global travel and tourism industry. We operatethrough three business segments:
• Travel Network, our global B2B travel marketplace for travel suppliers and travel buyers;
• Airline and Hospitality Solutions, an extensive suite of leading software solutions primarily forairlines and hotel properties; and
• Travelocity, our portfolio of online consumer travel e-commerce businesses through which we providetravel content and booking functionality primarily for leisure travelers.
In March 2007, we were acquired by investment funds affiliated with or managed by the PrincipalStockholders. Prior to that time, we were an independent, publicly-traded company with our common stock listedon the New York Stock Exchange.
In connection with the acquisition, the Principal Stockholders appointed Mr. Gilliland to serve as our CEOand entered into employment agreements and other arrangements with the members of our-then seniormanagement. Of the Named Executive Officers, only Messrs. Gilliland, Miller, and Klein were employed with usat that time. In negotiating these initial employment agreements and arrangements with our current NamedExecutive Officers, our board of directors, whose members then consisted of representatives of the PrincipalStockholders, placed significant emphasis on aligning management’s interests with those of the PrincipalStockholders. In particular, Messrs. Gilliland and Klein each made a significant equity investment in ourcommon stock in connection with the acquisition and received equity awards that included performance vestingoptions that would vest upon the Principal Stockholders receiving reasonable rates of return on their investedcapital.
The Principal Stockholders directed our senior management to lead an aggressive plan to eliminateorganizational inefficiencies, expand the scope of our various businesses and to secure our position as the leadingtechnology provider for the travel and tourism industries. To date, we have been successful in strengthening ourbusiness, developing into a global brand, and increasing revenue growth and sustained profitability, in part,through the design of our executive compensation program.
193
As we have prepared for this initial public offering, we have focused on attracting and retaining a talentedmanagement team with the necessary experience to manage our business as a newly-public company. TheNamed Executive Officers have strong transformational experience and, collectively, more than 160 years oftechnology sector experience among them.
While we have begun to review and revise our executive compensation program and related policies andpractices in anticipation of this offering, we are still in the process of determining specific details of certainaspects of our executive compensation program that will take effect following the offering. Overall, we anticipatethat our executive compensation program following the offering will be based on the same principles anddesigned to achieve the same objectives as our prior executive compensation program.
Given our recent history, our executive compensation program has been designed by the CompensationCommittee consistent with the Principal Stockholders’ objective of incentivizing our executive officers tostabilize and strengthen us as a company, including in the areas of technology consolidation, product quality, andgeographic expansion, in an effort to drive sustained financial performance and further our business objectives.Accordingly, our current program has been designed to advance three principal objectives:
• To reward our executive officers for achieving short-term operational objectives, realizing long-termstrategic goals, and enhancing stockholder value.
• To reflect our focus on high standards of ethics, quality, and integrity, which we apply to all aspects ofour business.
• To enhance the quality and continuity of our executive management team.
Fiscal 2013 Compensation Highlights
We compete with many other companies in seeking to attract and retain a skilled executive team. To meetthis challenge, we have embraced a compensation philosophy of offering our executive officers competitivecompensation and benefits packages that are focused on long-term value creation and rewarding them forachieving our financial and strategic objectives. In Fiscal 2013, we employed this philosophy to enhance andbroaden the strength of our executive team as we began to prepare for this offering and commence the transitionto becoming a public reporting company.
Consistent with this philosophy, we took the following actions with respect to the Fiscal 2013 compensationof the Named Executive Officers:
• Entered into a new employment agreement with Mr. Klein at the time that he was promoted to serve asour CEO, with a base salary, target annual incentive award opportunity, and long-term incentive awardcommensurate with an individual serving in this position for a company of our size, business, andgrowth potential.
• Entered into employment agreements with Mr. Simonson, our new Executive Vice President and CFO,Ms. Kerr, our new Executive Vice President and Chief Product and Technology Officer, andMr. Robinson, our new Executive Vice President and Chief Human Resources Officer.
• Paid annual cash bonuses under our Executive Incentive Plan consistent with our Fiscal 2013 financialresults in amounts ranging from 31% to 87% of their target bonus opportunities, as described in moredetail under “—Compensation Elements—Annual Incentive Compensation” below; and
• Began developing the 2014 Omnibus Plan, our new omnibus equity incentive compensation plan,which is consistent with the equity incentive compensation plans used by other newly-publiccompanies.
194

Pay-for-Performance
Our executive compensation philosophy, which is embodied in the design and operation of our short-termand long-term incentive compensation plans, ensures that a substantial portion of the compensation for ourexecutive officers, including the Named Executive Officers, is contingent on our ability to meet and exceed ourannual and long-term financial plan objectives. Consequently, we believe that our executive compensationprogram creates commonality of interest between our executive officers and stockholders for long-term valuecreation. Our commitment to a “pay-for-performance” compensation philosophy includes:
• A substantial portion of our executive officers’ target cash compensation opportunity is performance-based. For Fiscal 2013, approximately 52% of the target cash compensation opportunity of our CEO,and approximately 44%, on average, of the target cash compensation opportunities of the other NamedExecutive Officers was contingent on our executive team meeting and exceeding the financialobjectives set forth in our annual operating plan. For Fiscal 2013, the annual cash bonuses paid to theNamed Executive Officers was approximately 73%, on average, of their target cash bonusopportunities.
• While we strive to offer fully-competitive target total direct compensation opportunities to each of ourexecutive officers to recognize the experience, industry expertise, and leadership that he or she bringsto us, the actual amounts received or “realized” by each executive officer from his or her incentivecompensation opportunities is highly dependent on the ability of our executive team to achieve strongfinancial results and meet key operational milestones over an extended period of time.
The Compensation Committee monitors our executive compensation program on a continuous basis, andupdates and refines our executive compensation policies and practices as appropriate to enhance ourcompensation philosophy.
Executive Compensation Policies and Practices
We endeavor to maintain sound governance standards consistent with our executive compensation policiesand practices. The Compensation Committee evaluates our executive compensation program on an ongoing basisto ensure that it is consistent with our short-term and long-term business objectives given the dynamic nature ofthe global economy and the market in which we compete for executive talent. The following policies andpractices were implemented during Fiscal 2013 and/or were in effect at the time of filing of the registrationstatement of which this prospectus forms a part:
• Independent Compensation Committee Advisors. The Compensation Committee engaged its owncompensation consultant to assist with the review and enhancement of our executive compensationprogram in anticipation of our transition to a public reporting company. This consultant has performedno consulting or other services for us.
• Annual Executive Compensation Review. The Compensation Committee conducts an annual review ofour executive compensation program, including a review of the competitive market for executivetalent. In Fiscal 2013, the Compensation Committee developed a compensation peer group for useduring its deliberations when evaluating the competitive market.
• Executive Compensation Policies and Practices. Our compensation philosophy and related corporategovernance policies and practices are complemented by several specific compensation practices thatare designed to align our executive compensation with long-term stockholder interests, including thefollowing:
• Compensation At-Risk. Our executive compensation program is designed so that a significantportion of compensation is “at risk” based on corporate performance, as well as equity-based toalign the interests of our executive officers and stockholders;
195
• No Retirement Plans. Except for the Sabre, Inc. Legacy Pension Plan (which was frozen tofurther benefit accruals as of December 31, 2005), we do not currently offer, nor do we have plansto provide, pension arrangements, defined benefit retirement plans, or nonqualified deferredcompensation plans or arrangements to our executive officers;
• Nominal Perquisites. We provide only limited perquisites and other personal benefits, whichconsist of financial planning, executive physical examinations, and payment of country clubmembership dues, to certain of our executive officers;
• No Special Health or Welfare Benefits. Our executive officers participate in broad-basedcompany-sponsored health and welfare benefits programs on the same basis as our other full-time,salaried employees;
• No Tax Reimbursements. We do not provide any tax reimbursement payments (including “gross-ups”) on any perquisites or other personal benefits, other than standard relocation benefits, or onany severance or change-in-control payments or benefits;
• “Double-Trigger” Change-in-Control Arrangements. All change-in-control payments andbenefits are based on a “double-trigger” arrangement (that is, they require both a change-in-control plus a qualifying termination of employment before payments and benefits are paid);
• Performance-Based Incentives. We use performance-based short-term and long-term incentives;
• Multi-Year Vesting Requirements. The equity awards granted to our executive officers vest or areearned over multi-year periods, consistent with current market practice and our retentionobjectives;
• No Stock Option Repricings. We prohibit the repricing of outstanding options to purchase ourcommon stock without prior stockholder approval; and
• Succession Planning. We review the risks associated with key executive officer positions toensure adequate succession plans are in place.
This Compensation Discussion and Analysis describes the material elements of compensation for theNamed Executive Officers as determined by the Compensation Committee for the year prior to the completion ofthis offering. It also includes some of the key expectations about changes to our executive compensation programgoing forward.
Compensation Philosophy and Objectives
The philosophy underlying our executive compensation program is to provide an attractive, flexible, andeffective total compensation opportunity to our executive officers, including the Named Executive Officers, tiedto our corporate performance and aligned with the interests of our stockholders. Our objective is to recruit,motivate, and retain the caliber of executive officers necessary to deliver sustained high performance to ourstockholders, customers, and other stakeholders.
Equally important, we view our compensation policies and practices as a means for communicating ourgoals and standards of conduct and performance and for motivating and rewarding employees in relation to theirachievements. Overall, the same principles that govern the compensation of our executive officers also apply tothe compensation of all our salaried employees. Within this framework, we observe the following principles:
• Retain and hire top-caliber executive officers: Executive officers should have base salaries andemployee benefits that are market competitive and that permit us to hire and retain high-caliberindividuals at all levels;
196

• Pay for performance: A significant portion of the target total direct compensation opportunities of ourexecutive officers should vary with annual and long-term business performance and each individual’scontribution to that performance, while the level of “at-risk” compensation should increase as the scopeof the executive officer’s responsibility increases;
• Reward long-term growth and profitability: Executive officers should be rewarded for achieving long-term results, and such rewards should be aligned with the interests of our stockholders;
• Tie compensation to performance of our core businesses: A significant portion of each executiveofficer’s compensation should be tied to measures of performance of the business or businesses overwhich he or she has the greatest influence;
• Align compensation with stockholder interests: The interests of our executive officers should belinked with those of our stockholders through the risks and rewards of the ownership of shares of ourcommon stock;
• Provide limited personal benefits: Perquisites and other personal benefits for our executive officersshould be minimal and limited to items that serve a reasonable business purpose; and
• Reinforce succession planning process: The overall compensation program for our executive officersshould reinforce our robust succession planning process.
We believe that our compensation philosophy, as reinforced by these principles, has been very effective inaligning our executive compensation with the creation of sustainable long-term stockholder value.
Compensation Mix
Our executive compensation program has been designed to reward strong performance by focusing asignificant portion of each executive officer’s total direct compensation opportunity on annual and long-termincentives that depend upon our performance as a whole, as well as the performance of our individual businesses.Each executive officer, at either the time of the acquisition by the Principal Stockholders, his or her initialemployment, or his promotion to a more senior position, has been granted a significant stake in us in the form ofan equity award to closely link his or her interests to those of the Principal Stockholders and to focus his or herefforts on the successful execution of our long-term strategic and financial objectives. Consequently, whetherviewed on an annual basis or over their entire tenure with us, fixed compensation (in the form of base salary andbenefits) has represented substantially less than half of the target total direct compensation opportunity of eachexecutive officer, including each Named Executive Officer, with the remainder delivered in the form of annualand long-term incentive compensation and performance bonuses.
Compensation-Setting Process
Role of the Compensation Committee
The Compensation Committee is responsible for overseeing our executive compensation program (includingour executive compensation policies and practices), approving the compensation of our executive officers,including the Named Executive Officers, and administering our various employee stock plans.
Pursuant to its charter, the Compensation Committee has sole responsibility for reviewing and determiningthe compensation of our CEO at least annually, as well as for evaluating our CEO’s performance in light of thecorporate goals and objectives applicable to him. In reviewing our CEO’s compensation each year andconsidering any potential adjustments, the Compensation Committee exercises its business judgment after takinginto consideration several factors, including our financial results, his individual performance and strategicleadership, its understanding of competitive market data and practices, and his current total compensation andpay history.
197
In addition, each year the Compensation Committee reviews and determines the compensation of our otherexecutive officers, including the other Named Executive Officers, as well as any employment agreements withour executive officers. In doing so, the Compensation Committee is responsible for ensuring that thecompensation of our executive officers, including the Named Executive Officers, is consistent with our executivecompensation philosophy and objectives.
Role of Executive Officers
The Compensation Committee receives support from our Human Resources Department in designing ourexecutive compensation program and analyzing competitive market practices. Our General Counsel attendsregular meetings of the Compensation Committee to provide support and assistance with respect to the legalimplications of our compensation decisions. In addition, our Senior Vice President, Corporate Human Resourcesattends meetings of the Compensation Committee as requested. Our CEO and CFO also regularly participate inCompensation Committee meetings, providing management input on organizational structure, executivedevelopment, and financial analysis.
Our CEO evaluates the performance of each of our executive officers, including the other Named ExecutiveOfficers, against the annual objectives established by the Compensation Committee for the business or functionalarea for which such executive officer is responsible. Our CEO then reviews each executive officer’s target totaldirect compensation opportunity, and based upon his or her target total direct compensation opportunity and hisor her performance, proposes compensation adjustments for him or her, subject to review and approval by theCompensation Committee. Our CEO presents the details of each executive officer’s target total directcompensation opportunity and performance to the Compensation Committee for its consideration and approval ofthe recommendations. Our CEO does not participate in the evaluation of his own performance.
In making executive compensation decisions, the Compensation Committee reviews a variety ofinformation for each executive officer, including his or her current total compensation and pay history, his or herequity holdings, individual performance, and its understanding of competitive market data and practices forcomparable positions. Our executive officers are not present when their specific compensation arrangements arediscussed.
Role of Compensation Consultant
In fulfilling its duties and responsibilities, the Compensation Committee has the authority to engage theservices of outside advisers, including compensation consultants. In Fiscal 2013, the Compensation Committeeengaged Compensia, Inc., a national compensation consulting firm, to assist it with compensation matters. Arepresentative of Compensia attends meetings of the Compensation Committee as requested, responds toinquiries from members of the Compensation Committee, and provides his or her analysis with respect to theseinquiries.
The nature and scope of services provided to the Compensation Committee by Compensia in Fiscal 2013were as follows:
• Assisted in the review and updating of our compensation peer group;
• Analyzed the executive compensation levels and practices of the companies in our compensation peergroup;
• Provided advice with respect to compensation best practices and market trends for our executiveofficers and the members of our board of directors;
• Assessed our compensation risk profile and reported on this assessment;
198
• Analyzed the director compensation levels and practices of the companies in our compensation peergroup; and
• Provided ad hoc advice and support following its engagement.
Compensia does not provide any services to us, other than the services provided to the CompensationCommittee. The Compensation Committee has assessed the independence of Compensia taking into account,among other things, the factors set forth in Exchange Act Rule 10C-1 and the listing standards of the NASDAQ,and has concluded that no conflict of interest exists with respect to the work that Compensia performs for theCompensation Committee.
Competitive Positioning
Periodically, the Compensation Committee reviews competitive market data for comparable executivepositions in the market as one factor for determining the structure of our executive compensation program andestablishing target compensation levels for our executive officers, including the Named Executive Officers.
For purposes of its review of the competitive market prior to November 2013, the Compensation Committeereceived a market analysis prepared by our Human Resources Department which was developed using relevantcompensation data drawn from a select group of peer companies, as well as survey data of comparably sizedcompanies in the national market. This compensation peer group consisted of the following companies:
Automatic Data Processing, Inc.Expedia, Inc.Fidelity National Information Services, Inc.Fiserv, Inc.Global Payments, Inc.Mastercard Incorporated
Orbitz Worldwide, Inc.priceline.com IncorporatedSalesforce.com, Inc.The Western Union CompanyTotal System Services, Inc.Visa, Inc.
This compensation data was size-adjusted to reflect our approximate annual revenues of $3 billion. Thespecific compensation surveys used in this market analysis were the Culpepper High Technology Survey, theIPAS Global Technology Survey, the Mercer Benchmark Database, and the Radford Global Technology Survey.This market analysis provided the Compensation Committee with a broad perspective on the national labormarket for executive talent.
In November 2013, the Compensation Committee, with the assistance of Compensia, developed a newcompensation peer group based on an evaluation of companies that it believed were comparable to us with respectto operations, industry segment, revenue level, and enterprise value as a reference source in its executivecompensation deliberations. This compensation peer group, which will be used by the Compensation Committee asa reference in the course of its future executive compensation deliberations, consists of the following companies:
Akamai Technologies, Inc.Alliance Data Systems Corp.Broadridge Financial Solutions, Inc.Citrix Systems, Inc.Equinix, Inc.Fiserv, Inc.Gartner, Inc.
Global Payments, Inc.Nuance Communications, Inc.Synopsys, Inc.Total System Services, Inc.Vantiv, Inc.Verisk Analytics, Inc.
The companies in the compensation peer group are U.S.-based global companies in the technology sector,and, therefore, are representative of the companies with which we compete for executive talent. In addition, thesecompanies have similar revenue levels (generally, 0.5x to 2.0x our revenue level), enterprise values (generally,0.5x to 3.0x our enterprise value), and revenue and operating profitability growth rates. Compensation peer group
199
comparison data will be collected from publicly-available information contained in the SEC filings of thecompensation peer group companies, as well as from the Radford Global Technology Survey. The Radfordsurvey provides market data and other information related to trends and competitive practices in executivecompensation.
The competitive market data described above has not been and will not be used by the CompensationCommittee in isolation but rather serves as one point of reference in its deliberations on executive compensation.The Compensation Committee uses the competitive market data as a guide when making decisions about totaldirect compensation, as well as individual elements of compensation; however, the Compensation Committeedoes not formally benchmark our executive officers’ compensation against this data. While marketcompetitiveness is important, it is not the only factor we consider when establishing compensation opportunitiesof our executive officers. Actual compensation decisions also depend upon the consideration of other factors thatthe Compensation Committee considers relevant, such as the financial and operational performance of ourbusinesses, individual performance, specific retention concerns, and internal equity.
Compensation-Related Risk Assessment
The Compensation Committee considers potential risks when reviewing and approving the various elementsof our executive compensation program. In evaluating each element of our executive compensation program, theCompensation Committee assesses the element to ensure that it does not encourage our executive officers to takeexcessive or unnecessary risks or to engage in decision-making that promotes short-term results at the expense ofour long-term interests. In addition, we have designed our executive compensation program, including ourincentive compensation plans, with specific features to address potential risks while rewarding our executiveofficers for achieving financial and strategic objectives through prudent business judgment and appropriate risktaking. Further, the following policies and practices have been incorporated into our executive compensationprogram:
• Balanced Mix of Compensation Components—The target compensation mix for our executiveofficers is composed of base salary, annual cash incentive compensation, and long-term incentivecompensation in the form of equity awards, which provides a compensation mix that is not overlyweighted toward short-term cash incentives.
• Minimum Performance Measure Threshold—Our annual cash incentive compensation plan, whichencourages focus on the achievement of corporate and individual performance objectives for ouroverall benefit, does not pay out unless pre-established target levels for one or more financial measuresare met.
• Long-Term Incentive Compensation Vesting—Our long-term incentives are equity-based, with four-year or five-year vesting to complement our annual cash incentive compensation plan.
• Capped Incentive Awards—Awards under the annual cash incentive compensation plan are capped at200% of the target award level.
Compensation Elements
Our executive compensation program is designed around the concept of total direct compensation, andconsists of the following principal elements:
• Base salary;
• Annual incentive compensation in the form of cash bonuses;
• Long-term incentive compensation in the form of equity awards;
• Health, welfare, and other employee benefits; and
• Post-employment compensation.
200

In setting the appropriate level of total direct compensation, the Compensation Committee seeks to establisheach compensation element at a level that is both competitive and attractive for motivating top executive talent,while also keeping the overall compensation levels aligned with stockholder interests and job responsibilities.These compensation elements are structured to motivate our executive officers and to align their financialinterests with those of our stockholders.
Base Salary
We believe that a competitive base salary is essential in attracting and retaining key executive talent.Historically, the Compensation Committee has reviewed the base salaries of our executive officers, including theNamed Executive Officers, on an annual basis or as needed to address changes in job title, a promotion,assumption of additional job responsibilities, or other unique circumstances.
In evaluating the base salaries of our executive officers, the Compensation Committee considers severalfactors, including our financial performance, his or her contribution towards meeting our financial objectives, hisor her qualifications, knowledge, experience, tenure, and scope of responsibilities, his or her past performance asagainst individual goals, his or her future potential, competitive market practices, our desired compensationposition with respect to the competitive market, and internal equity.
Fiscal 2013 Base Salary Decisions
In May 2013, the Compensation Committee reviewed the base salaries of our executive officers and madeno adjustments to the base salaries of any of the Named Executive Officers whose positions and duties wereconsistent with their prior positions and duties.
Mr. Klein’s annual base salary was increased from $600,000 to $900,000 in connection with hisappointment as our CEO in August 2013. In addition, Messrs. Simonson and Robinson and Ms. Kerr’s basesalaries were established through arms-length negotiation when they joined us in March 2013, December 2013,and March 2013, respectively.
The base salaries paid to the Named Executive Officers during Fiscal 2013 are set forth in the “Fiscal 2013Summary Compensation Table” below.
Annual Incentive Compensation
We use annual incentive compensation to support and encourage the achievement of our specific annualcorporate and business segment goals as reflected in our annual operating plan. Each year, our executive officersat the level of senior vice president or above are eligible to receive annual cash bonuses under our ExecutiveIncentive Program (the “EIP”).
Typically, at the beginning of the fiscal year the Compensation Committee approves the terms andconditions of the EIP for the year, including the selection of one or more performance measures as the basis fordetermining the funding of annual cash bonuses for the year. Subject to available funding, the EIP provides cashbonuses based upon our achievement as measured against the pre-established target levels for these performancemeasures.
Target Annual Cash Bonus Opportunities
For purposes of the Fiscal 2013 EIP, the target annual cash bonus opportunity for each of our eligibleexecutive officers, including the Named Executive Officers, was expressed as a percentage of his or her basesalary, subject to a maximum annual cash bonus opportunity as specified for each executive officer (which was
201

200% of his or her target annual cash bonus opportunity). The target annual cash bonus opportunities of thecurrent Named Executive Officers for Fiscal 2013 were as follows:
Named Executive Officer
Fiscal 2013Target Cash
BonusOpportunity
(as a percentageof base salary)
Mr. Klein . . . . . . . . . . . . . . . . . . . . . . . . . . . . . . . . . . . . . . . . . . . . . . . . . . . . . . . . . . . . . . . . . . . . . 100%/125%(1)
Mr. Simonson . . . . . . . . . . . . . . . . . . . . . . . . . . . . . . . . . . . . . . . . . . . . . . . . . . . . . . . . . . . . . . . . . . 80%(2)
Mr. Sparks . . . . . . . . . . . . . . . . . . . . . . . . . . . . . . . . . . . . . . . . . . . . . . . . . . . . . . . . . . . . . . . . . . . . 80%Ms. Kerr . . . . . . . . . . . . . . . . . . . . . . . . . . . . . . . . . . . . . . . . . . . . . . . . . . . . . . . . . . . . . . . . . . . . . . 80%(2)
Mr. Robinson . . . . . . . . . . . . . . . . . . . . . . . . . . . . . . . . . . . . . . . . . . . . . . . . . . . . . . . . . . . . . . . . . . (3)
(1) Until his promotion in August 2013, Mr. Klein’s target annual cash bonus opportunity was equal to 100% ofhis then-current base salary. Effective as of August 15, 2013, his target annual cash bonus opportunity wasincreased to 125% of his adjusted annual base salary for the remainder of Fiscal 2013. As a result, on a blendedbasis, his target annual cash bonus opportunity for Fiscal 2013 was 110% of his actual base salary for the year.
(2) Mr. Simonson’s and Ms. Kerr’s target annual cash bonus opportunities were established through arms-length negotiation when they joined us in March 2013.
(3) Since Mr. Robinson did not join us until December 2013, he was not eligible to participate in the EIP inFiscal 2013.
The target annual cash bonus opportunities were established by the Compensation Committee based on itsconsideration of several factors, including each eligible executive officer’s qualifications, knowledge,experience, tenure, and scope of responsibilities, his or her past performance his or her future potential,competitive market practices, our desired compensation position with respect to the competitive market, andinternal equity.
Corporate Performance Measure
For purposes of the Fiscal 2013 EIP, the Compensation Committee selected EBITDA as the soleperformance measure. The Compensation Committee believed that EBITDA continued to be the best measure ofboth corporate and business segment profitability and that, as we began to prepare for our initial public offering,overall profitability would best position us for a successful re-entry into the public marketplace.
For purposes of the Fiscal 2013 EIP, EBITDA was adjusted to exclude the following items: goodwillimpairments, prior period non-cash adjustments, and one-time costs associated with specific businessenhancement initiatives. Our board of directors approved these adjustments to better reflect the efforts andperformance of our executive officers in relation to the current year’s business performance, as well as toencourage them to make decisions that improve the potential for future growth without being penalized for theshort-term investment required to achieve that growth. In addition to these adjustments, for purposes of the Fiscal2013 EIP, EBITDA was to be calculated before making allowance for the amounts payable pursuant to ourannual incentive compensation plan for employees at the level below senior vice president, the Sabre CorporationVariable Compensation Plan (“Pre-VCP EBITDA”).
Bonus Formula
For our executive officers with company-wide responsibility, the Pre-VCP EBITDA performance measurewas based entirely on corporate EBITDA. For our executive officers with business segment responsibilities, thePre-VCP EBITDA performance measure was based in part on business segment EBITDA (weighted 50%) and inpart on corporate EBITDA (weighted 50%). The Compensation Committee determined that these weightingsprovided an appropriate balance to foster company teamwork while at the same time providing “line-of-sight”accountability for business segment results.
202
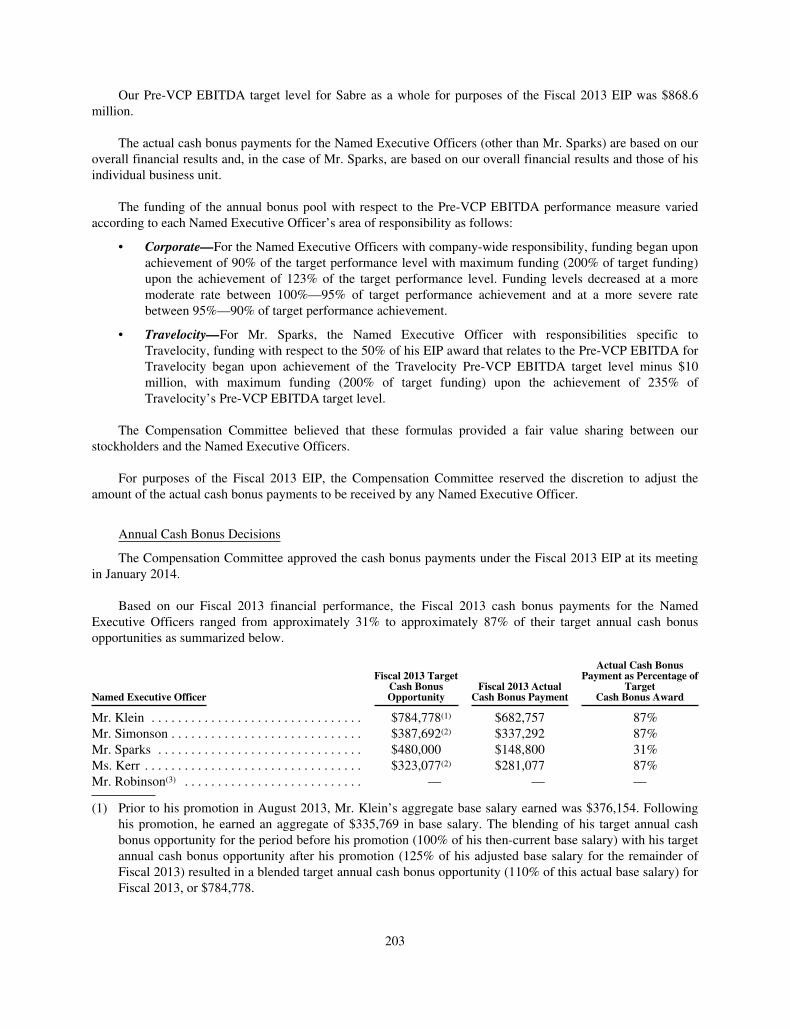
Our Pre-VCP EBITDA target level for Sabre as a whole for purposes of the Fiscal 2013 EIP was $868.6million.
The actual cash bonus payments for the Named Executive Officers (other than Mr. Sparks) are based on ouroverall financial results and, in the case of Mr. Sparks, are based on our overall financial results and those of hisindividual business unit.
The funding of the annual bonus pool with respect to the Pre-VCP EBITDA performance measure variedaccording to each Named Executive Officer’s area of responsibility as follows:
• Corporate—For the Named Executive Officers with company-wide responsibility, funding began uponachievement of 90% of the target performance level with maximum funding (200% of target funding)upon the achievement of 123% of the target performance level. Funding levels decreased at a moremoderate rate between 100%—95% of target performance achievement and at a more severe ratebetween 95%—90% of target performance achievement.
• Travelocity—For Mr. Sparks, the Named Executive Officer with responsibilities specific toTravelocity, funding with respect to the 50% of his EIP award that relates to the Pre-VCP EBITDA forTravelocity began upon achievement of the Travelocity Pre-VCP EBITDA target level minus $10million, with maximum funding (200% of target funding) upon the achievement of 235% ofTravelocity’s Pre-VCP EBITDA target level.
The Compensation Committee believed that these formulas provided a fair value sharing between ourstockholders and the Named Executive Officers.
For purposes of the Fiscal 2013 EIP, the Compensation Committee reserved the discretion to adjust theamount of the actual cash bonus payments to be received by any Named Executive Officer.
Annual Cash Bonus Decisions
The Compensation Committee approved the cash bonus payments under the Fiscal 2013 EIP at its meetingin January 2014.
Based on our Fiscal 2013 financial performance, the Fiscal 2013 cash bonus payments for the NamedExecutive Officers ranged from approximately 31% to approximately 87% of their target annual cash bonusopportunities as summarized below.
Named Executive Officer
Fiscal 2013 TargetCash BonusOpportunity
Fiscal 2013 ActualCash Bonus Payment
Actual Cash BonusPayment as Percentage of
TargetCash Bonus Award
Mr. Klein . . . . . . . . . . . . . . . . . . . . . . . . . . . . . . . . $784,778(1) $682,757 87%Mr. Simonson . . . . . . . . . . . . . . . . . . . . . . . . . . . . . $387,692(2) $337,292 87%Mr. Sparks . . . . . . . . . . . . . . . . . . . . . . . . . . . . . . . $480,000 $148,800 31%Ms. Kerr . . . . . . . . . . . . . . . . . . . . . . . . . . . . . . . . . $323,077(2) $281,077 87%Mr. Robinson(3) . . . . . . . . . . . . . . . . . . . . . . . . . . . — — —
(1) Prior to his promotion in August 2013, Mr. Klein’s aggregate base salary earned was $376,154. Followinghis promotion, he earned an aggregate of $335,769 in base salary. The blending of his target annual cashbonus opportunity for the period before his promotion (100% of his then-current base salary) with his targetannual cash bonus opportunity after his promotion (125% of his adjusted base salary for the remainder ofFiscal 2013) resulted in a blended target annual cash bonus opportunity (110% of this actual base salary) forFiscal 2013, or $784,778.
203
(2) The target cash bonus opportunity of each of these Named Executive Officers reflects the fact that he or sheworked less than a full year in Fiscal 2013.
(3) Since Mr. Robinson did not join us until December 2013, he was not eligible to participate in the Fiscal2013 EIP.
The cash bonuses actually paid to the Named Executive Officers for Fiscal 2013 are set forth in the “Fiscal2013 Summary Compensation Table” below.
Additional Discretionary Bonuses
In connection with its determination of the Fiscal 2013 cash bonus payments, the Compensation Committeeconsidered Mr. Klein’s recommendation that Mr. Simonson and Ms. Kerr each receive an additional bonuspayment in recognition of their strong individual contributions to the company during Fiscal 2013. Based on hisefforts in preparing the company for this initial public offering, as well as his overall performance, theCompensation Committee approved a discretionary bonus payment for Mr. Simonson in the amount of $62,708.Based on her efforts in advancing our product development and successfully completing several of ourtechnology initiatives during Fiscal 2013, as well as her overall performance, the Compensation Committeeapproved a discretionary bonus payment for Ms. Kerr in the amount of $18,923.
Long-Term Incentive Compensation
We use long-term incentive compensation in the form of equity awards as the principal element of ourexecutive compensation program in order to align the financial interests of our executive officers, including theNamed Executive Officers, with those of our stockholders. Upon the Principal Stockholders’ acquisition of us inMarch 2007, we sought to retain top executive talent and drive long-term stockholder value creation through theuse of equity-based long-term incentive compensation.
Except in the case of Mr. Sparks, from March 2007 through November 2012, we generally provided long-term incentive compensation to our executive officers, including the Named Executive Officers who were thenour employees, in the form of options to purchase shares of our common stock. We believed that optionsprovided an effective performance incentive because our executive officers would derive value from their optionsonly if our stock price increased (which would benefit all stockholders) and they remained employed with usbeyond the date that their options vested.
With respect to the awards of options granted during 2007, typically, half of the options were subject to atime-based vesting requirement, which vested 25% on the first anniversary of the date of grant and thereafterratably on a quarterly basis over the subsequent four years. The other half of these options were subject to aperformance-based vesting condition based on a threshold multiple of money (“MoM”) being realized by thePrincipal Stockholders for their initial shares acquired in our business upon a specified liquidity event, such as aqualified initial public offering or a change in control of us.
Starting in 2008 and continuing through November 2012, the options granted to our executive officers weresubject solely to time-based vesting requirements. Pursuant to these requirements, the shares of our commonstock subject to such options vest and become exercisable as to 25% of such shares on the first anniversary of thedate of grant and ratably as to 4.6875% of such shares on a successive three-month basis over the subsequentfour years, subject to each executive officer’s continued employment through each vesting date.
In the case of Mr. Sparks, we granted him a restricted stock award covering shares of our common stockrather than options to purchase shares of our common stock, when he joined us in 2011 and a restricted stock unitaward covering shares of our common stock in 2012. In addition to equity awards for shares of our commonstock, Mr. Sparks, as the President and CEO of Travelocity, was also granted a tandem stock appreciation rightcovering the common units of Travelocity.com LLC and the shares of Travelocity Holdings, Inc., but which can
204
be settled in cash or shares of our common stock, in the good faith discretion of our board of directors. Further, in2010 Messrs. Klein and Miller were granted equity awards in the form of options to purchase 350,000 commonunits of Travelocity.com LLC.
Beginning in December 2012, we began delivering long-term incentive compensation to our executive officers,including the Named Executive Officers who were then our employees, using a mix of options to purchase shares ofour common stock and restricted stock unit awards covering shares of our common stock. At that time, we determinedthat this equity award mix would effectively align the interests of our executive officers with those of our stockholdersand provide each individual executive officer with a significant incentive to manage us from the perspective of anowner with an equity stake in the business. We also determined that these equity awards would serve as an effectiveretention tool for our executive officers, as unvested awards would generally be forfeited if he or she voluntarily leftour employ. Half of the value of these equity awards granted to our executive officers is delivered in the form of atime-based option and half in the form of a performance-based restricted stock unit award. For a detailed description ofthese awards, see the “Fiscal 2013 Grants of Plan-Based Awards Table” below.
In determining the value of the long-term incentive compensation opportunities for our executive officers,the Compensation Committee considers several factors, including our financial performance, the executiveofficer’s contribution towards meeting our financial objectives, his or her qualifications, knowledge, experience,tenure, and scope of responsibilities, his or her past performance as against individual goals, his or her futurepotential, his or her current equity position (including the value of any unvested equity awards), competitivemarket practices, our desired compensation position with respect to the competitive market, and internal equity.
Change in Award Practices Related to our Initial Public Offering
As noted above, since our 2007 acquisition by the Principal Stockholders we have sought to retain topexecutive talent and motivate long-term stockholder value creation primarily through the one-time grant of equityawards upon hire and subsequent periodic awards. Following this initial public offering, the CompensationCommittee intends to modify our approach to the use of long-term incentive compensation by making annuallong-term incentive compensation awards to our executive officers, including the Named Executive Officersusing a “portfolio” mix of time-based and performance-based equity awards. We believe these changes to ourexecutive compensation program will better align the interests of our executive officers and stockholders, aid inattracting and retaining talent by conforming more closely to the practices among members of our peer group,and further mitigate excessive risk incentives by ensuring that we provide incentive compensation withdiversified performance measures.
Fiscal 2013 Equity Awards
During Fiscal 2013, the Compensation Committee granted equity awards to Mr. Klein in connection withhis promotion to serve as our CEO and to Messrs. Simonson and Robinson and Ms. Kerr in connection with theirinitial employment with us. The value of these equity awards was determined in arms-length negotiation betweenthe individual executive officer and the Compensation Committee. For purposes of these negotiations, theCompensation Committee referenced, in part, competitive market data.
For a detailed description of these equity awards, see “—Employment Agreements” and the “Fiscal 2013Summary Compensation Table” and the “Fiscal 2013 Grants of Plan-Based Awards Table” below.
New Omnibus Equity Compensation Plan
In connection with this offering, our board of directors adopted the 2014 Omnibus Plan. All equity-basedawards granted on or after this offering will be granted under the 2014 Omnibus Plan. For a detailed descriptionof the 2014 Omnibus Plan, see “Employee Stock Plans” below.
205
Health, Welfare, and Other Employee Benefits
We have established a tax-qualified Section 401(k) retirement plan for all employees who satisfy certaineligibility requirements, including requirements relating to age and length of service. We currently match contributionsmade to the plan by our employees, including executive officers, up to 6% of their eligible compensation. We intendfor the plan to qualify under Section 401(a) of the Code so that contributions by employees to the plan, and incomeearned on plan contributions, are not taxable to employees until withdrawn from the plan.
In addition, we provide other benefits to our executive officers, including the Named Executive Officers, onthe same basis as all of our full-time employees. These benefits include medical, dental, and vision benefits,medical and dependent care flexible spending accounts, short-term and long-term disability insurance, accidentaldeath and dismemberment insurance, and basic life insurance coverage.
We design our employee benefits programs to be affordable and competitive in relation to the market, aswell as compliant with applicable laws and practices. We adjust our employee benefits programs as needed basedupon regular monitoring of applicable laws and practices and the competitive market.
Perquisites and Other Personal Benefits
Currently, we do not view perquisites or other personal benefits as a significant component of our executivecompensation program. Accordingly, we provide perquisites and other personal benefits to our executive officersin limited situations where we believe it is appropriate to assist an individual in the performance of his or herduties, to make our executive officers more efficient and effective, and for recruitment and retention purposes.For example, each of our executive officers is eligible to receive financial planning benefits, subject to an annualallowance of up to $5,000 per year. In addition, our executive officers are eligible to participate in our annualphysical program. This program provides for an annual executive physical up to an amount of $3,700. TheCompensation Committee believes that these personal benefits are a reasonable component of our overallexecutive compensation program and are consistent with market practices.
In addition, historically we paid the dues for a country club membership for certain executive officers,including Messrs. Klein and Gilliland. While they received some incidental benefits from these memberships, webelieve that the primary purpose has been to facilitate opportunities for conducting business with existing andprospective customers and business partners. Accordingly, although we disclose the cost to us of these membershipsin the Fiscal 2013 Summary Compensation Table, we believe that they served a legitimate and important businesspurpose for us. In connection with his promotion to serve as our CEO and President, Mr. Klein relinquished hismembership in September 2013. In connection with his retirement in September 2013, we converted Mr. Gilliland’smembership to a personal membership (at no cost to us) and ceased to pay any further dues on such membership.
In the future, we may provide perquisites or other personal benefits in limited circumstances, such as wherewe believe it is appropriate to assist an individual executive officer in the performance of his or her duties, tomake our executive officers more efficient and effective, and for recruitment, motivation, or retention purposes.All future practices with respect to perquisites or other personal benefits will be approved and subject to periodicreview by the Compensation Committee.
Employment Agreements
We have entered into a written employment agreement with each of the Named Executive Officers; mostrecently, with Mr. Klein, our President and CEO and Mr. Robinson, our Executive Vice President and ChiefHuman Resources Officer. Mr. Klein’s employment agreement was negotiated on our behalf by the Chairman ofthe Compensation Committee and approved by our board of directors; all of the other employment agreementswere negotiated on our behalf by our CEO and approved by the Compensation Committee. We believe that theseemployment agreements were necessary to induce these individuals to forego other employment opportunities orleave their current employer for the uncertainty of a demanding position in a new and unfamiliar organization.
206
In filling these executive positions, our board of directors or the Compensation Committee, as applicable,was aware that it would be necessary to recruit candidates with the requisite experience and skills to manage agrowing business in a dynamic and ever-changing industry. Accordingly, it recognized that it would need todevelop competitive compensation packages to attract qualified candidates in a highly-competitive labor market.At the same time, our board of directors or the Compensation Committee, as applicable, was sensitive to the needto integrate new executive officers into the executive compensation structure that it was seeking to develop,balancing both competitive and internal equity considerations.
For a detailed description of the employment arrangements of the Named Executive Officers, see“—Employment Arrangements” below.
Post-Employment Compensation
Each of the written employment arrangements with the Named Executive Officers, as described in“—Employment Arrangements” below, provides them with the opportunity to receive various payments andbenefits in the event of an involuntary termination of employment under certain specified circumstances,including an involuntary termination of employment in connection with a change in control of us.
We provide these arrangements to encourage the Named Executive Officers to work at a dynamic and rapidlygrowing business where their long-term compensation largely depends on future stock price appreciation.Specifically, the arrangements are intended to mitigate a potential disincentive for the Named Executive Officerswhen they are evaluating a potential acquisition of us, particularly when their services may not be required by theacquiring entity. In such a situation, we believe that these arrangements are necessary to encourage retention of theNamed Executive Officers through the conclusion of the transaction, and to ensure a smooth management transition.These arrangements have been drafted to provide each of the Named Executive Officers with consistent treatmentthat is competitive with current market practices. We believe that the level of benefits provided under these variousagreements is in line with market practice and help us to attract and retain key talent.
For a detailed description of the post-employment compensation arrangements of the Named ExecutiveOfficers, see “—Potential Payments upon Termination or Change in Control” below.
Other Compensation Policies
In anticipation of becoming a public reporting company, we are in the process of adopting several policiesthat we believe are important components of a public-company executive compensation program.
Stock Ownership Policy
Currently, we do not have equity security ownership guidelines or requirements for our executive officers.Nonetheless, most of our executive officers, including the Named Executive Officers, have significant stockownership in us. Some of this stock was purchased by these executive officers in March 2007 in conjunction withour becoming a privately-held entity. Other executive officers have received significant equity awards inconnection with joining us. The Compensation Committee believes that this stock ownership aligns the financialinterests of our executive officers with those of our stockholders. To further this ownership objective, we intendto adopt stock ownership policies for our executive officers and the non-employee members of our board ofdirectors in connection with this offering.
Compensation Recovery Policy
Currently, we have not implemented a policy regarding retroactive adjustments to any cash or equity-basedincentive compensation paid to our executive officers and other employees where the payments were predicatedupon the achievement of financial results that were subsequently the subject of a financial restatement. We intend
207
to adopt a general compensation recovery (“clawback”) policy covering our annual and long-term incentiveaward plans and arrangements once the SEC adopts final rules implementing the requirement of Section 954 ofthe Dodd-Frank Act.
Derivatives Trading and Hedging Policies
In connection with this offering, we have adopted a general insider trading policy that provides that noemployee, officer, or member of our board of directors may acquire, sell, or trade in any interest or positionrelating to the future price of our securities, such as a put option, a call option or a short sale (including a shortsale “against the box”), or, without our prior consent, engage in hedging transactions (including “cashlesscollars”). Similarly, our policy generally prohibits our executive officers and members of our board of directorsfrom pledging any of their shares of our common stock as collateral for a loan or other financial arrangement.
Equity Award Grant Policy
We have not adopted a formal policy for the timing of equity awards. The Compensation Committee,however, follows an informal practice of granting annual equity awards in the first quarter of the calendar year.We have also granted awards in the case of new hires, promotions or special retention awards. We intend toadopt a formal policy for the timing of equity awards in connection with this offering. It is anticipated that,pursuant to this policy, the Compensation Committee will grant equity awards at approximately the same timeeach year, generally during the first quarter of the calendar year.
Tax and Accounting Considerations
Deductibility of Compensation
Section 162(m) of the Code generally disallows public companies a tax deduction for federal income taxpurposes of remuneration in excess of $1 million paid to the CEO and each of the three other most highly-compensated executive officers (other than the chief financial officer) in any taxable year. Generally, remunerationin excess of $1 million may only be deducted if it is “performance-based compensation” within the meaning of theCode. In this regard, the compensation income realized upon the exercise of stock options granted under astockholder-approved stock option plan generally will be deductible so long as the options are granted by acommittee whose members are non-employee directors and certain other conditions are satisfied.
As we are not currently publicly-traded, the Compensation Committee has not in recent years taken thedeductibility limit imposed by Section 162(m) into consideration in setting compensation for our executiveofficers. In approving the amount and form of compensation for our executive officers in the future, however, theCompensation Committee will consider all elements of the cost to us of providing such compensation, includingthe potential impact of Section 162(m). Further, as a newly public company, we intend to rely upon certaintransition relief under Section 162(m).
Nonetheless, the Compensation Committee believes that, in establishing the cash and equity incentivecompensation plans and arrangements for our executive officers, the potential deductibility of the compensationpayable under those plans and arrangements should be only one of a number of relevant factors taken intoconsideration, and not the sole governing factor. For that reason, the Compensation Committee may deem itappropriate to provide one or more executive officers with the opportunity to earn incentive compensation, whetherthrough cash incentive awards tied to our financial performance or equity incentive awards tied to the executiveofficer’s continued service, which may be in excess of the amount deductible by reason of Section 162(m) or otherprovisions of the Code. Further, the Compensation Committee reserves the discretion, in its judgment, to approve,from time to time, compensation arrangements that may not be tax deductible for us, such as base salary and equityawards with time-based vesting requirements, or which do not comply with an exemption from the deductibilitylimit when it believes that such arrangements are appropriate to attract and retain executive talent.
208
The Compensation Committee believes it is important to maintain cash and equity incentive compensationat the requisite level to attract and retain the individuals essential to our financial success, even if all or part ofthat compensation may not be deductible by reason of the Section 162(m) limitation.
“Golden Parachute” Payments
Sections 280G and 4999 of the Code provide that executive officers and directors who hold significantequity interests and certain other service providers may be subject to an excise tax if they receive payments orbenefits in connection with a change in control of us that exceeds certain prescribed limits, and that we, or asuccessor, may forfeit a deduction on the amounts subject to this additional tax. We did not provide anyexecutive officer, including any Named Executive Officer, with a “gross-up” or other reimbursement paymentfor any tax liability that he or she might owe as a result of the application of Sections 280G or 4999 during Fiscal2013 and we have not agreed and are not otherwise obligated to provide any Named Executive Officer with sucha “gross-up” or other reimbursement.
Accounting for Stock-Based Compensation
We follow Financial Accounting Standard Board Accounting Standards Codification Topic 718, (“ASCTopic 718”), for our stock-based compensation awards. ASC Topic 718 requires companies to measure thecompensation expense for all share-based payment awards made to employees and directors, including stockoptions, based on the grant date “fair value” of these awards. This calculation is performed for accountingpurposes and reported in the compensation tables below, even though our executive officers may never realizeany value from their awards. ASC Topic 718 also requires companies to recognize the compensation cost of theirstock-based compensation awards in their income statements over the period that an executive officer is requiredto render service in exchange for the option or other award.
209
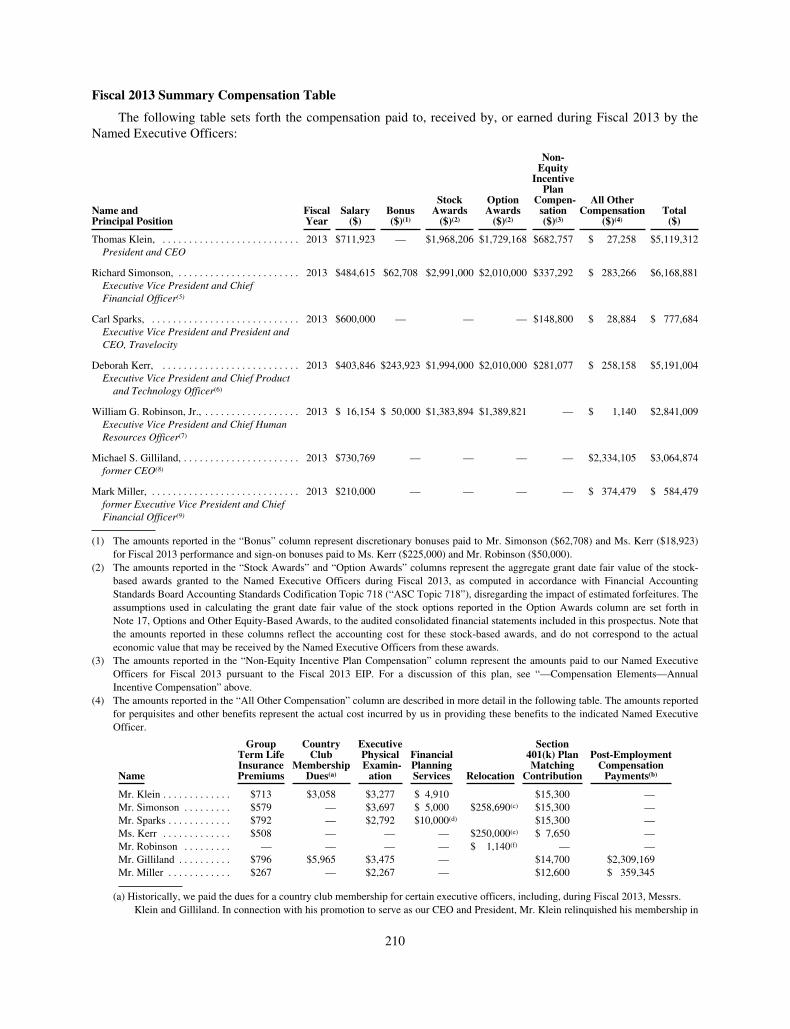
Fiscal 2013 Summary Compensation Table
The following table sets forth the compensation paid to, received by, or earned during Fiscal 2013 by theNamed Executive Officers:
Name andPrincipal Position
FiscalYear
Salary($)
Bonus($)(1)
StockAwards
($)(2)
OptionAwards
($)(2)
Non-Equity
IncentivePlan
Compen-sation($)(3)
All OtherCompensation
($)(4)Total
($)
Thomas Klein, . . . . . . . . . . . . . . . . . . . . . . . . . . 2013 $711,923 — $1,968,206 $1,729,168 $682,757 $ 27,258 $5,119,312President and CEO
Richard Simonson, . . . . . . . . . . . . . . . . . . . . . . . 2013 $484,615 $62,708 $2,991,000 $2,010,000 $337,292 $ 283,266 $6,168,881Executive Vice President and ChiefFinancial Officer(5)
Carl Sparks, . . . . . . . . . . . . . . . . . . . . . . . . . . . . 2013 $600,000 — — — $148,800 $ 28,884 $ 777,684Executive Vice President and President andCEO, Travelocity
Deborah Kerr, . . . . . . . . . . . . . . . . . . . . . . . . . . 2013 $403,846 $243,923 $1,994,000 $2,010,000 $281,077 $ 258,158 $5,191,004Executive Vice President and Chief Productand Technology Officer(6)
William G. Robinson, Jr., . . . . . . . . . . . . . . . . . . 2013 $ 16,154 $ 50,000 $1,383,894 $1,389,821 — $ 1,140 $2,841,009Executive Vice President and Chief HumanResources Officer(7)
Michael S. Gilliland, . . . . . . . . . . . . . . . . . . . . . . 2013 $730,769 — — — — $2,334,105 $3,064,874former CEO(8)
Mark Miller, . . . . . . . . . . . . . . . . . . . . . . . . . . . . 2013 $210,000 — — — — $ 374,479 $ 584,479former Executive Vice President and ChiefFinancial Officer(9)
(1) The amounts reported in the “Bonus” column represent discretionary bonuses paid to Mr. Simonson ($62,708) and Ms. Kerr ($18,923)for Fiscal 2013 performance and sign-on bonuses paid to Ms. Kerr ($225,000) and Mr. Robinson ($50,000).
(2) The amounts reported in the “Stock Awards” and “Option Awards” columns represent the aggregate grant date fair value of the stock-based awards granted to the Named Executive Officers during Fiscal 2013, as computed in accordance with Financial AccountingStandards Board Accounting Standards Codification Topic 718 (“ASC Topic 718”), disregarding the impact of estimated forfeitures. Theassumptions used in calculating the grant date fair value of the stock options reported in the Option Awards column are set forth inNote 17, Options and Other Equity-Based Awards, to the audited consolidated financial statements included in this prospectus. Note thatthe amounts reported in these columns reflect the accounting cost for these stock-based awards, and do not correspond to the actualeconomic value that may be received by the Named Executive Officers from these awards.
(3) The amounts reported in the “Non-Equity Incentive Plan Compensation” column represent the amounts paid to our Named ExecutiveOfficers for Fiscal 2013 pursuant to the Fiscal 2013 EIP. For a discussion of this plan, see “—Compensation Elements—AnnualIncentive Compensation” above.
(4) The amounts reported in the “All Other Compensation” column are described in more detail in the following table. The amounts reportedfor perquisites and other benefits represent the actual cost incurred by us in providing these benefits to the indicated Named ExecutiveOfficer.
Name
GroupTerm LifeInsurancePremiums
CountryClub
MembershipDues(a)
ExecutivePhysicalExamin-
ation
FinancialPlanningServices Relocation
Section401(k) PlanMatching
Contribution
Post-EmploymentCompensation
Payments(b)
Mr. Klein . . . . . . . . . . . . . $713 $3,058 $3,277 $ 4,910 $15,300 —Mr. Simonson . . . . . . . . . $579 — $3,697 $ 5,000 $258,690(c) $15,300 —Mr. Sparks . . . . . . . . . . . . $792 — $2,792 $10,000(d) $15,300 —Ms. Kerr . . . . . . . . . . . . . $508 — — — $250,000(e) $ 7,650 —Mr. Robinson . . . . . . . . . — — — — $ 1,140(f) — —Mr. Gilliland . . . . . . . . . . $796 $5,965 $3,475 — $14,700 $2,309,169Mr. Miller . . . . . . . . . . . . $267 — $2,267 — $12,600 $ 359,345
(a) Historically, we paid the dues for a country club membership for certain executive officers, including, during Fiscal 2013, Messrs.Klein and Gilliland. In connection with his promotion to serve as our CEO and President, Mr. Klein relinquished his membership in
210
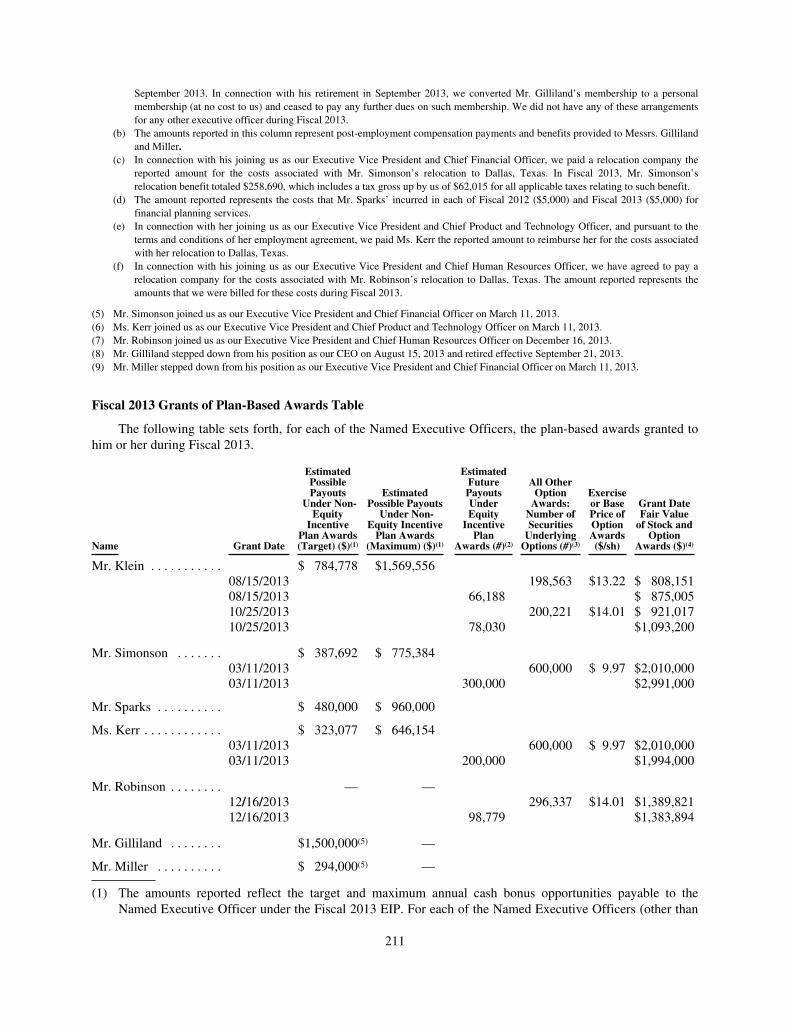
September 2013. In connection with his retirement in September 2013, we converted Mr. Gilliland’s membership to a personalmembership (at no cost to us) and ceased to pay any further dues on such membership. We did not have any of these arrangementsfor any other executive officer during Fiscal 2013.
(b) The amounts reported in this column represent post-employment compensation payments and benefits provided to Messrs. Gillilandand Miller.
(c) In connection with his joining us as our Executive Vice President and Chief Financial Officer, we paid a relocation company thereported amount for the costs associated with Mr. Simonson’s relocation to Dallas, Texas. In Fiscal 2013, Mr. Simonson’srelocation benefit totaled $258,690, which includes a tax gross up by us of $62,015 for all applicable taxes relating to such benefit.
(d) The amount reported represents the costs that Mr. Sparks’ incurred in each of Fiscal 2012 ($5,000) and Fiscal 2013 ($5,000) forfinancial planning services.
(e) In connection with her joining us as our Executive Vice President and Chief Product and Technology Officer, and pursuant to theterms and conditions of her employment agreement, we paid Ms. Kerr the reported amount to reimburse her for the costs associatedwith her relocation to Dallas, Texas.
(f) In connection with his joining us as our Executive Vice President and Chief Human Resources Officer, we have agreed to pay arelocation company for the costs associated with Mr. Robinson’s relocation to Dallas, Texas. The amount reported represents theamounts that we were billed for these costs during Fiscal 2013.
(5) Mr. Simonson joined us as our Executive Vice President and Chief Financial Officer on March 11, 2013.(6) Ms. Kerr joined us as our Executive Vice President and Chief Product and Technology Officer on March 11, 2013.(7) Mr. Robinson joined us as our Executive Vice President and Chief Human Resources Officer on December 16, 2013.(8) Mr. Gilliland stepped down from his position as our CEO on August 15, 2013 and retired effective September 21, 2013.(9) Mr. Miller stepped down from his position as our Executive Vice President and Chief Financial Officer on March 11, 2013.
Fiscal 2013 Grants of Plan-Based Awards Table
The following table sets forth, for each of the Named Executive Officers, the plan-based awards granted tohim or her during Fiscal 2013.
Name Grant Date
EstimatedPossiblePayouts
Under Non-Equity
IncentivePlan Awards(Target) ($)(1)
EstimatedPossible Payouts
Under Non-Equity Incentive
Plan Awards(Maximum) ($)(1)
EstimatedFuturePayoutsUnderEquity
IncentivePlan
Awards (#)(2)
All OtherOption
Awards:Number ofSecurities
UnderlyingOptions (#)(3)
Exerciseor BasePrice ofOptionAwards($/sh)
Grant DateFair Value
of Stock andOption
Awards ($)(4)
Mr. Klein . . . . . . . . . . . $ 784,778 $1,569,55608/15/2013 198,563 $13.22 $ 808,15108/15/2013 66,188 $ 875,00510/25/2013 200,221 $14.01 $ 921,01710/25/2013 78,030 $1,093,200
Mr. Simonson . . . . . . . $ 387,692 $ 775,38403/11/2013 600,000 $ 9.97 $2,010,00003/11/2013 300,000 $2,991,000
Mr. Sparks . . . . . . . . . . $ 480,000 $ 960,000
Ms. Kerr . . . . . . . . . . . . $ 323,077 $ 646,15403/11/2013 600,000 $ 9.97 $2,010,00003/11/2013 200,000 $1,994,000
Mr. Robinson . . . . . . . . — —12/16/2013 296,337 $14.01 $1,389,82112/16/2013 98,779 $1,383,894
Mr. Gilliland . . . . . . . . $1,500,000(5) —
Mr. Miller . . . . . . . . . . $ 294,000(5) —
(1) The amounts reported reflect the target and maximum annual cash bonus opportunities payable to theNamed Executive Officer under the Fiscal 2013 EIP. For each of the Named Executive Officers (other than
211
Mr. Sparks), funding of these non-equity incentive plan awards began upon achievement of 90% of the targetperformance level with maximum funding (200% of target funding) upon the achievement of 123% of the targetperformance level. For Mr. Sparks, funding with respect to the 50% of his EIP award that relates to the Pre-VCPEBITDA for Travelocity began upon achievement of the Travelocity Pre-VCP EBITDA target level minus $10million, with maximum funding (200% of target funding) upon the achievement of 235% of Travelocity’s Pre-VCP EBITDA target level.
(2) The restricted stock unit awards granted under our 2012 Management Equity Incentive Plan vest as to 25% of theshares of our common stock subject to each such award on March 15 in each of calendar years 2014, 2015, 2016,and 2017 if, as of the end of our most recent fiscal year ending prior to each such vesting date, we have achievedat least 95% of the EBITDA target level established for such fiscal year as determined by our board of directors,consistent with the annual business plan for such fiscal year, subject to each Named Executive Officer’s continuedemployment through each such vesting date. For purposes of these restricted stock unit awards, the EBITDAperformance measure for Fiscal 2013 was adjusted to exclude the following items: goodwill impairments, priorperiod non-cash adjustments, and one-time costs associated with specific business enhancement initiatives.
(3) All options to purchase shares of our common stock granted to the Named Executive Officers in Fiscal 2013 weregranted under our 2012 Management Equity Incentive Plan and are subject to time-based vesting conditions. Eachof these options has an exercise price equal to the fair market value of the shares of our common stock on the dateof grant and a term of 10 years.
With the exception of the option granted to Mr. Klein, 25% of the shares of our common stock subject to eachsuch option vests on the first anniversary of the date of grant and as to 6.25% of such shares at the end of eachsuccessive three-month period thereafter, subject to the Named Executive Officer’s continued employmentthrough each vesting date. Mr. Klein’s option vested as to 25% of the shares of our common stock subject to suchoption on the date of grant and as to 6.25% of such shares at the end of each successive three-month periodthereafter, subject to his continued employment through each vesting date.
(4) These amounts reflect the aggregate grant date fair value of option and stock awards computed in accordance withASC Topic 718. The fair value of each option award was estimated on the date of grant using the Black-Scholesoption-pricing model, which generated a Black-Scholes-computed value of $3.35 per share on March 11, 2013,$4.07 per share on August 15, 2013, $4.37 per share on October 1, 2013, $4.60 per share on October 25, 2013, and$4.69 per share on December 16, 2013.
(5) These amounts represent the target annual cash bonus opportunities of Messrs. Gilliland and Miller as determinedby the Compensation Committee at the beginning of Fiscal 2013. As neither individual was our employee at theend of Fiscal 2013, neither Named Executive Officer received an annual cash bonus for Fiscal 2013. This targetannual cash bonus opportunity, however, was used in determining their post-employment compensation paymentsand benefits as provided pursuant to their respective employment agreements.
212

Fiscal 2013 Outstanding Equity Awards at Year-End Table
The following table sets forth, for each of the Named Executive Officers, the equity awards outstanding asof December 31, 2013.
Name
Date ofGrant ofEquityAward
Option/SARAwards—Number ofSecurities
UnderlyingUnexercised
Options/SARs (#)Exercisable(1)
Option/SARAwards—Number ofSecurities
UnderlyingUnexercised
Options/SARs (#)Unexercisable(1)
Option/SARAwards—
EquityIncentive
PlanAwards:
Number ofSecurities
UnderlyingUnexercisedUnearned
Options (#)(3)
Option/SARAwards—
Option/SARExercisePrice ($)
Option/SARAwards—
Option/SARExpiration
Date
EquityIncentive
PlanAwards—Number ofUnearned
Shares,Units, or
OtherRights
That HaveNot
Vested (#)(2)
EquityIncentive
PlanAwards—Market or
PayoutValue of
UnearnedShares,Units,
Other RightsThat Have
NotVested ($)
Mr. Klein . . . . . 06/11/2007 317,250 $ 5.00 06/11/201706/11/2007 634,500 — $ 5.00 06/11/201701/31/2008 11,250 $ 5.00 01/31/201801/31/2008 22,500 — $ 5.00 01/31/201803/31/2009 381,250 18,750(4) $ 3.00 03/31/201903/31/2009 156,550 7,700(4) $ 3.00 03/31/201903/23/2010 267,968 82,032(4) $ 5.23 03/23/202003/23/2010 — 350,000(5) $0.6251(6) 03/23/202012/03/2012 10,000 30,000(7) $ 9.97 12/03/202203/15/2013 62,050 136,513(8) $ 13.22 08/15/202310/25/2013 62,569 137,652(8) $ 14.01 10/25/202312/03/2012 20,000 $ 280,20008/15/2013 66,188 $ 927,29410/25/2013 78,030 $1,093,200
Mr. Simonson . . 03/11/2013 — 600,000(7) $ 9.97 03/11/202303/11/2013 300,000 $4,203,000
Mr. Sparks . . . . 04/25/2011 118,064(10) $1,654,07705/15/2012 1,831,896 219,828(9) $ 2.77 05/15/202205/15/2012 1,831,896 219,828(9) $ 0.13 05/15/202211/1/2012 (11) $1,680,000
Ms. Kerr . . . . . . 03/11/2013 — 600,000(7) $ 9.97 03/11/202303/11/2013 200,000 $2,802,000
Mr. Robinson . . 12/16/2013 — 296,337(7) $ 14.01 12/16/202312/16/2013 98,779(12) $1,383,894
Mr. Gilliland . . . 06/11/2007 1,587,500 — $ 5.00 09/21/2015(15)
04/01/2008 62,500 — $ 5.00 09/21/2015(15)
04/01/2009 825,000 — $ 3.00 09/21/2015(15)
04/01/2009 750,000 — $ 3.00 09/21/2015(15)
12/03/2012 108,668 326,007(13) $ 9.97 09/21/2015Mr. Miller . . . . . 06/11/2007 — — 112,575(14) $ 5.00 06/30/2015
06/11/2007 337,725 — $ 5.00 06/30/201501/31/2008 — — 5,100(14) $ 5.00 06/30/201501/31/2008 15,300 — $ 5.00 06/30/201503/31/2009 304,476 — $ 3.00 06/30/201503/23/2010 235,156 — $ 5.23 06/30/2015
(1) Each option to purchase shares of our common stock granted prior to 2012 was granted pursuant to our 2007Management Equity Incentive Plan (amended in 2010) or, if granted in 2012 or later, our 2012 Management EquityIncentive Plan, and each option to purchase common units of Travelocity.com LLC was granted pursuant to theTravelocity.com Amended and Restated Limited Liability Company Agreement. Each stock appreciation right to acquireshares of the common stock of Travelocity Holdings, Inc. and common units of Travelocity.com LLC was granted toMr. Sparks pursuant to our Amended and Restated Stock Incentive Plan for Travelocity’s CEO Stock-Settled SARs withRespect to Travelocity Equity (amended and restated May 3, 2012). Each of these options and stock appreciation rightsexpires ten years from the date of grant.
213
(2) Each restricted stock unit award covering shares of our common stock was granted pursuant to our 2012 Management EquityIncentive Plan. These restricted stock unit awards vest as to 25% of the shares of our common stock subject to each suchaward on March 15 in each of calendar years 2014, 2015, 2016, and 2017 if, as of the end of our most recent fiscal yearending prior to each such vesting date, we have achieved at least 95% of the EBITDA target level established for such fiscalyear as determined by our board of directors, consistent with the annual business plan for such fiscal year, subject to theNamed Executive Officer’s continued employment through each vesting date. For purposes of these restricted stock unitawards, the EBITDA performance measure for Fiscal 2013 was adjusted to exclude the following items: goodwillimpairments, prior period non-cash adjustments, and one-time costs associated with specific business enhancement initiatives.
(3) These options to purchase shares of our common stock vest and become exercisable upon a liquidity event where thePrincipal Stockholders realize a threshold MoM for their interest in us, as determined by our board of directors, or,following the third anniversary of an initial public offering of our common stock, upon a determination by our board ofdirectors that such MoM could be realized by our Principal Stockholders if they sold their remaining interest in us, andexcept for Mr. Miller, subject to the Named Executive Officer’s continued employment through such date.
(4) These options to purchase shares of our common stock vest and become exercisable as to 25% of the shares of commonstock subject to each such option on the first anniversary of the date of grant and as to 4.6875% of such shares at the endof each successive three-month period thereafter, subject to the Named Executive Officer’s continued employmentthrough each vesting date.
(5) This option to purchase common units of Travelocity.com LLC vests and become exercisable as to 25% of the shares ofcommon stock subject to such option on the first anniversary of the date of grant and as to 4.6875% of such shares at theend of each successive three month period thereafter, subject to the Named Executive Officer’s continued employmentthrough each vesting date. This Travelocity.com option was granted with a companion option in respect of our commonstock. The Travelocity.com option may only be exercised if the aggregate fair market value of both options is greaterthan the aggregate exercise price of both options, in which case the exercisable percentage (not to exceed 100%) iscalculated as follows: 100 multiplied by the quotient of (A) the aggregate fair market value minus the aggregate exerciseprice divided by (B) the fair market value minus the exercise price, in each case at the time of determination of theexercisable percentage.
(6) The exercise price of the option to purchase common units of Travelocity.com LLC increases quarterly at 6.00% perannum until the option has been exercised in full. The initial exercise price of the option was $0.50 per share.
(7) These options to purchase shares of our common stock vest and become exercisable as to 25% of the shares of commonstock subject to each such option on the first anniversary of the date of grant and as to 6.25% of such shares at the end ofeach successive three-month period thereafter, subject to the Named Executive Officer’s continued employment througheach vesting date.
(8) These options to purchase shares of our common stock vest and become exercisable as to 25% of the shares of commonstock subject to each such option on the date of grant and as to 6.25% of such shares at the end of each successive three-month period thereafter, subject to the Named Executive Officer’s continued employment through each vesting date.
(9) The stock appreciation right to acquire shares of the common stock of Travelocity Holdings, Inc. and common units ofTravelocity.com LLC vests and becomes exercisable as to 25% of the shares of common stock and common units subjectto such stock appreciation right on the date of grant and as to 6.25% of such shares or common units at the end of eachsuccessive three month period thereafter commencing on May 15, 2012, until 100% of the stock appreciation right is fullyvested and exercisable, subject to the Named Executive Officer’s continued employment through each vesting date. Thisaward may also be exercised for cash or shares of our common stock, in the good faith discretion of our board of directors.
(10) The restricted stock award vests as to one-third of the total number of shares of our common stock subject to such awardon each of the first, second, and third anniversaries of the date of grant, subject to the Named Executive Officer’scontinued employment through each vesting date.
(11) This restricted stock unit award remains unvested as to $1,680,000 of its aggregate grant date value, and will vest as to thisprescribed value as follows: $520,000 on June 15, 2014, $560,000 on December 15, 2014, and $600,000 on June 15, 2015,in each case subject to the Named Executive Officer’s continued employment through each vesting date. If settled inshares, the number of shares of our common stock to be delivered at each vesting date will be determined by dividing theseprescribed amounts by the current fair market value of the shares of our common stock on each respective vesting date,with any residual value to be delivered in cash. Since the number of shares of our common stock to be settled upon thevesting of the remaining installments of this award is not currently determinable, the amount disclosed in the “EquityIncentive Plan Awards—Market or Payout Value of Unearned Shares, Units, or Other Rights That Have Not Vested”column represents the remaining unvested portion of the original aggregate grant date value of the award.
(12) Pursuant to the terms of Mr. Robinson’s employment agreement, in the event that the 25% of the shares of our commonstock subject to his restricted stock unit award which are scheduled to vest on March 15, 2014, subject to theachievement of 95% of the Fiscal 2013 EBITDA target level, do not vest, he will be granted a new restricted stock unitaward for the number of shares of our common stock that do not vest under the terms and conditions of our equitycompensation plan in effect at the time.
214
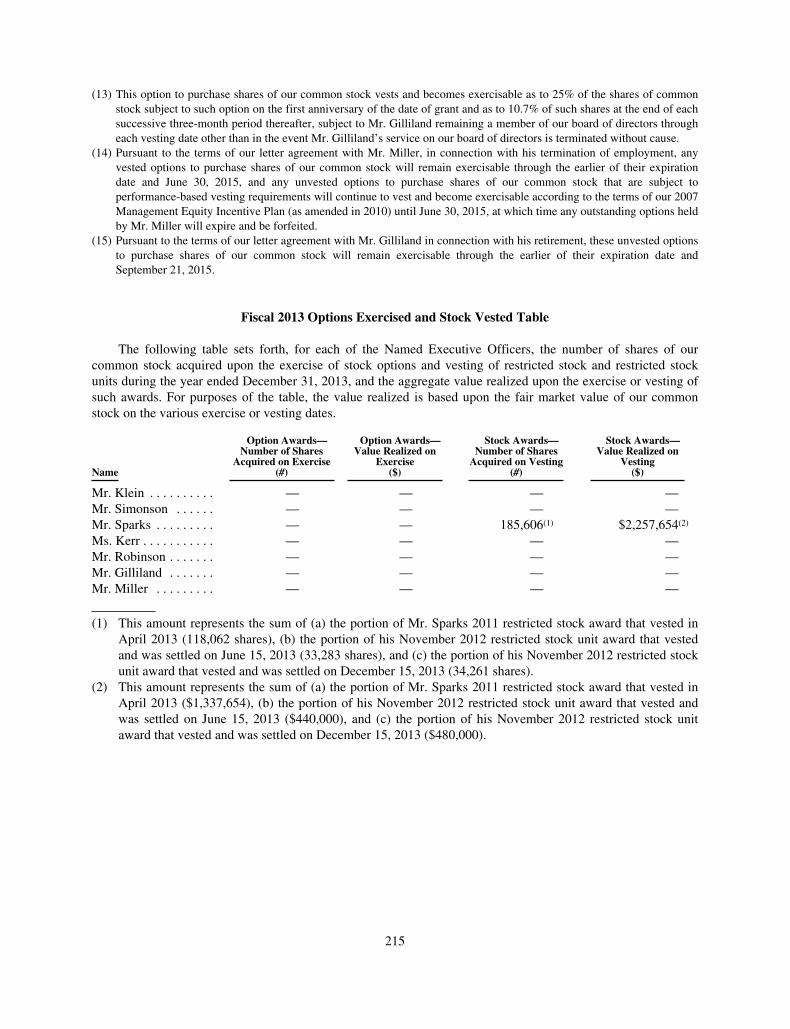
(13) This option to purchase shares of our common stock vests and becomes exercisable as to 25% of the shares of commonstock subject to such option on the first anniversary of the date of grant and as to 10.7% of such shares at the end of eachsuccessive three-month period thereafter, subject to Mr. Gilliland remaining a member of our board of directors througheach vesting date other than in the event Mr. Gilliland’s service on our board of directors is terminated without cause.
(14) Pursuant to the terms of our letter agreement with Mr. Miller, in connection with his termination of employment, anyvested options to purchase shares of our common stock will remain exercisable through the earlier of their expirationdate and June 30, 2015, and any unvested options to purchase shares of our common stock that are subject toperformance-based vesting requirements will continue to vest and become exercisable according to the terms of our 2007Management Equity Incentive Plan (as amended in 2010) until June 30, 2015, at which time any outstanding options heldby Mr. Miller will expire and be forfeited.
(15) Pursuant to the terms of our letter agreement with Mr. Gilliland in connection with his retirement, these unvested optionsto purchase shares of our common stock will remain exercisable through the earlier of their expiration date andSeptember 21, 2015.
Fiscal 2013 Options Exercised and Stock Vested Table
The following table sets forth, for each of the Named Executive Officers, the number of shares of ourcommon stock acquired upon the exercise of stock options and vesting of restricted stock and restricted stockunits during the year ended December 31, 2013, and the aggregate value realized upon the exercise or vesting ofsuch awards. For purposes of the table, the value realized is based upon the fair market value of our commonstock on the various exercise or vesting dates.
Name
Option Awards—Number of Shares
Acquired on Exercise(#)
Option Awards—Value Realized on
Exercise($)
Stock Awards—Number of Shares
Acquired on Vesting(#)
Stock Awards—Value Realized on
Vesting($)
Mr. Klein . . . . . . . . . . — — — —Mr. Simonson . . . . . . — — — —Mr. Sparks . . . . . . . . . — — 185,606(1) $2,257,654(2)
Ms. Kerr . . . . . . . . . . . — — — —Mr. Robinson . . . . . . . — — — —Mr. Gilliland . . . . . . . — — — —Mr. Miller . . . . . . . . . — — — —
(1) This amount represents the sum of (a) the portion of Mr. Sparks 2011 restricted stock award that vested inApril 2013 (118,062 shares), (b) the portion of his November 2012 restricted stock unit award that vestedand was settled on June 15, 2013 (33,283 shares), and (c) the portion of his November 2012 restricted stockunit award that vested and was settled on December 15, 2013 (34,261 shares).
(2) This amount represents the sum of (a) the portion of Mr. Sparks 2011 restricted stock award that vested inApril 2013 ($1,337,654), (b) the portion of his November 2012 restricted stock unit award that vested andwas settled on June 15, 2013 ($440,000), and (c) the portion of his November 2012 restricted stock unitaward that vested and was settled on December 15, 2013 ($480,000).
215
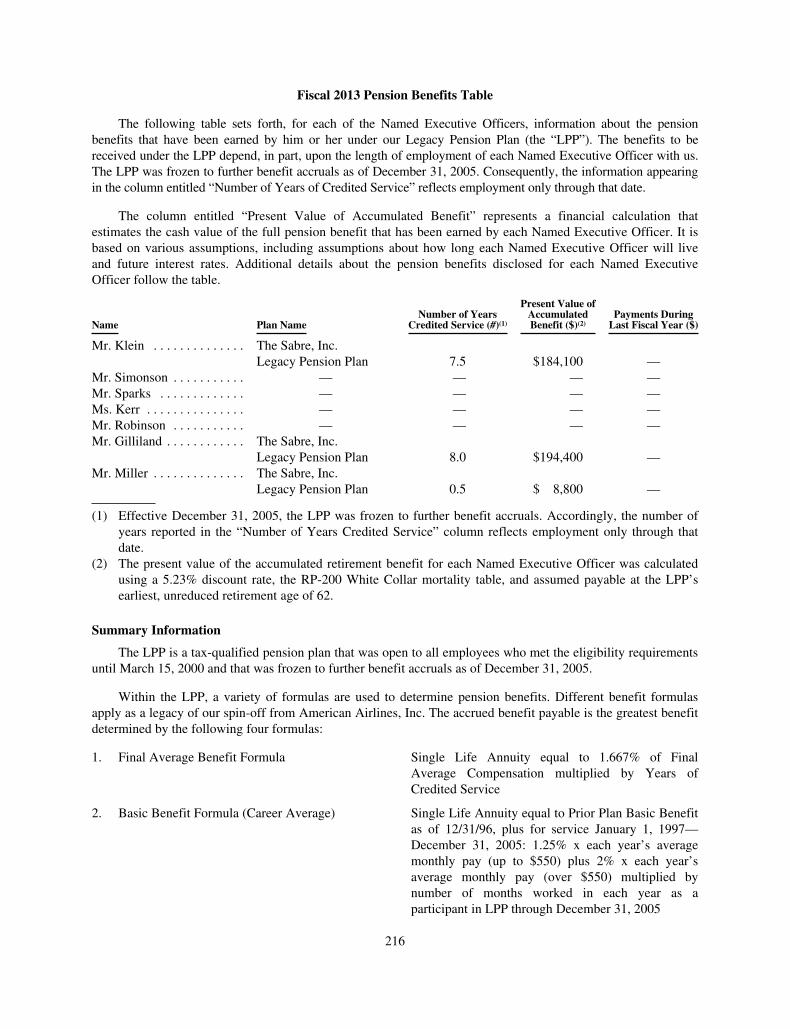
Fiscal 2013 Pension Benefits Table
The following table sets forth, for each of the Named Executive Officers, information about the pensionbenefits that have been earned by him or her under our Legacy Pension Plan (the “LPP”). The benefits to bereceived under the LPP depend, in part, upon the length of employment of each Named Executive Officer with us.The LPP was frozen to further benefit accruals as of December 31, 2005. Consequently, the information appearingin the column entitled “Number of Years of Credited Service” reflects employment only through that date.
The column entitled “Present Value of Accumulated Benefit” represents a financial calculation thatestimates the cash value of the full pension benefit that has been earned by each Named Executive Officer. It isbased on various assumptions, including assumptions about how long each Named Executive Officer will liveand future interest rates. Additional details about the pension benefits disclosed for each Named ExecutiveOfficer follow the table.
Name Plan NameNumber of Years
Credited Service (#)(1)
Present Value ofAccumulatedBenefit ($)(2)
Payments DuringLast Fiscal Year ($)
Mr. Klein . . . . . . . . . . . . . . The Sabre, Inc.Legacy Pension Plan 7.5 $184,100 —
Mr. Simonson . . . . . . . . . . . — — — —Mr. Sparks . . . . . . . . . . . . . — — — —Ms. Kerr . . . . . . . . . . . . . . . — — — —Mr. Robinson . . . . . . . . . . . — — — —Mr. Gilliland . . . . . . . . . . . . The Sabre, Inc.
Legacy Pension Plan 8.0 $194,400 —Mr. Miller . . . . . . . . . . . . . . The Sabre, Inc.
Legacy Pension Plan 0.5 $ 8,800 —
(1) Effective December 31, 2005, the LPP was frozen to further benefit accruals. Accordingly, the number ofyears reported in the “Number of Years Credited Service” column reflects employment only through thatdate.
(2) The present value of the accumulated retirement benefit for each Named Executive Officer was calculatedusing a 5.23% discount rate, the RP-200 White Collar mortality table, and assumed payable at the LPP’searliest, unreduced retirement age of 62.
Summary Information
The LPP is a tax-qualified pension plan that was open to all employees who met the eligibility requirementsuntil March 15, 2000 and that was frozen to further benefit accruals as of December 31, 2005.
Within the LPP, a variety of formulas are used to determine pension benefits. Different benefit formulasapply as a legacy of our spin-off from American Airlines, Inc. The accrued benefit payable is the greatest benefitdetermined by the following four formulas:
1. Final Average Benefit Formula Single Life Annuity equal to 1.667% of FinalAverage Compensation multiplied by Years ofCredited Service
2. Basic Benefit Formula (Career Average) Single Life Annuity equal to Prior Plan Basic Benefitas of 12/31/96, plus for service January 1, 1997—December 31, 2005: 1.25% x each year’s averagemonthly pay (up to $550) plus 2% x each year’saverage monthly pay (over $550) multiplied bynumber of months worked in each year as aparticipant in LPP through December 31, 2005
216
3. Social Security Offset Formula: Single Life Annuity equal to 2% of Final AverageAnnualized Compensation x Years of CreditedService minus 1.5% of Annual Social Securitybenefit x Years of Credited Service (up to amaximum of 50% of the Social Security benefit)
4. Minimum Benefit Formula Single Life Annuity equal to Minimum Benefit Rate(Minimum Benefit Rate is equal to $282 if FinalAverage Annualized Compensation is less than$15,000; otherwise it is $288) multiplied by Years ofCredited Service
For each formula listed in the chart above, compensation taken into account in calculating pension benefitsincludes base salary and commission, but excludes bonuses, overtime pay, premium pay, shift differentials,variable compensation, profit sharing awards, expense reimbursements, and expense allowances.
The benefit formulas set forth above describe the pension benefits in terms of a single life annuity.Participants are eligible to receive their benefits in other payment forms, however, including lump sums, jointand survivor annuities, period certain annuities, and level income payments. No matter which form of payment aparticipant may select, each has the same actuarially equivalent value.
In addition, the LPP provides an option for early retirement. At age 62 or greater with at least 10 years ofservice, a participant may commence an unreduced benefit. A participant who is between the ages of 55 and 62with at least 15 years of service may begin a benefit reduced by 3% for each year the benefit commences prior toage 62. Finally, in the case of a participant less than age 62 with at least 10 years of service but not more than 15years of service, he or she may begin a benefit reduced 3% for each year prior to age 65.
Nonqualified Deferred Compensation
We did not maintain any nonqualified defined contribution or other deferred compensation plans orarrangements for the Named Executive Officers during Fiscal 2013.
Employment Arrangements
We have entered into employment agreements with each of the Named Executive Officers as describedbelow.
Typically, these agreements provide for employment for a specified period of time (typically, two or threeyears; five years in the case of Mr. Sparks), subject to automatic renewal for additional one-year terms unlesseither party provided written notice of non-renewal in accordance with the terms and conditions of theagreement.
In addition, these agreements included the Named Executive Officer’s initial base salary or base salary atthe time the agreement was executed, an annual bonus opportunity under our Executive Incentive Plan, andstandard employee benefit plan and program participation. Occasionally, these agreements also provided for arecommended equity award grant to be submitted to our board of directors for approval, with an exercise price, inthe case of an option to purchase shares of our common stock, equal to the fair market value of the shares of ourcommon stock on the date of grant and subject to our specified vesting requirements. These offers ofemployment were each subject to covenants during the period of employment and for a specified periodthereafter involving non-solicitation of customers, suppliers, and employees, non-competition, and non-disclosure of confidential information and trade secrets.
217
Mr. Klein
On August 14, 2013, we entered into a new employment agreement with Mr. Klein in connection with hisappointment as our CEO that provides for his general employment terms, including certain compensationarrangements. Mr. Klein’s employment agreement also provides for specified payments and benefits in the eventof his termination of employment under certain specified circumstances, including in connection with a change incontrol, which are described in greater detail under “Potential Payments upon Termination or Change in Control”below.
Under the terms of his employment agreement, Mr. Klein’s initial annual base salary in connection with hisappointment as CEO was set at $900,000, less applicable withholding taxes, and is subject to annual review for apossible increase (but not decrease). Mr. Klein is also eligible to receive an annual target bonus based on hisattainment of one or more pre-established performance criteria established by our board of directors or acommittee of our board of directors, with his initial target bonus opportunity equal to 125% of his then-currentannual base salary and a maximum bonus opportunity equal to 200% of his then-current annual base salary.
Further, Mr. Klein was granted an option to purchase 198,563 shares of our common stock with an exerciseprice equal to the fair market value of such shares of common stock on the date of grant and a restricted stockunit award covering 66,188 shares of our common stock. The option was to vest as to 25% of the shares of ourcommon stock subject to the option on the date of grant and thereafter as to 6.25% of such shares at the end ofeach successive three-month period thereafter, subject to his continued employment through each vesting date.The restricted stock unit award was to vest as to 25% of the shares of our common stock subject to such award onMarch 15 in each of calendar years 2014, 2015, 2016, and 2017 if, as of the end of our most recent fiscal yearending prior to each such vesting date, we have achieved at least 95% of the EBITDA target level established forsuch fiscal year as determined by our board of directors, consistent with the annual business plan for such fiscalyear. The vesting of the shares of common stock subject to these equity awards is also subject to acceleration asdescribed in greater detail under “Potential Payments upon Termination or Change in Control” below.
Subsequently, on October 25, 2013, to give effect to its original objective of providing Mr. Klein with along-term incentive compensation opportunity with a grant date fair value of approximately $3,500,000 whichwas not accomplished with the awards described above, our board of directors granted Mr. Klein an additionaloption to purchase 200,221 shares of our common stock with an exercise price equal to the fair market value ofsuch shares of common stock on the date of grant and a restricted stock unit award covering 78,030 shares of ourcommon stock. These equity awards were subject to vesting requirements similar to the vesting requirementsapplicable to the equity awards granted to Mr. Klein at the time that we entered into the new employmentagreement with him.
Mr. Simonson
Effective March 11, 2013, we entered into an employment agreement with Mr. Simonson in connection withhis appointment as our Executive Vice President and Chief Financial Officer that provided for his generalemployment terms, including certain compensation arrangements. Mr. Simonson’s employment agreement alsoprovides for specified payments and benefits in the event of his termination of employment under certainspecified circumstances, including in connection with a change in control of us, which are described in greaterdetail under “Potential Payments upon Termination or Change in Control” below.
Under the terms of his employment agreement, Mr. Simonson received an initial annual base salary of$600,000, less applicable withholding taxes, which is subject to annual review for a possible increase (but notdecrease). Mr. Simonson also received a one-time “sign on” bonus in the amount of $120,000, subject torepayment under certain conditions.
Mr. Simonson is also eligible to receive an annual target bonus based on his attainment of one or morepre-established performance criteria established by our board of directors or a committee of our board ofdirectors, with his initial target bonus opportunity equal to 80% of his then-current annual base salary.
218
Further, Mr. Simonson was granted an option to purchase 600,000 shares of our common stock with anexercise price equal to the fair market value of such shares of common stock on the date of grant and a restrictedstock unit award covering 300,000 shares of our common stock. The option to purchase shares of our commonstock vests as to 25% of the shares of common stock subject to such option on the first anniversary of the date ofgrant and thereafter as to 6.25% of such shares at the end of each successive three-month period thereafter,subject to his continued employment through each vesting date. The restricted stock unit award vests as to 25%of the shares of our common stock subject to such award on March 15 in each of calendar years 2014, 2015,2016, and 2017 if, as of the end of our most recent fiscal year ending prior to each such vesting date, we haveachieved at least 95% of the EBITDA target level established for such fiscal year as determined by our board ofdirectors, consistent with the annual business plan for such fiscal year, subject to his continued employmentthrough each vesting date. The vesting of the shares of common stock subject to such awards is also subject toacceleration as described in greater detail under “Potential Payments upon Termination or Change in Control”below.
Mr. Sparks
Effective March 22, 2011, Mr. Sparks entered into an employment agreement with our wholly-ownedsubsidiary, Travelocity.com LP, in connection with his appointment as Executive Vice President and Presidentand CEO of Travelocity that provides for his general employment terms, including certain compensationarrangements. Mr. Sparks’ employment agreement also provides for specified payments and benefits in the eventof his termination of employment under certain specified circumstances, including in connection with a change incontrol of us, which are described in greater detail under “Potential Payments upon Termination or Change inControl” below.
Mr. Sparks’ employment agreement provides for an initial annual base salary of $600,000, less applicablewithholding taxes, which is subject to annual review for a possible increase (but not decrease). Mr. Sparks is alsoeligible to receive an annual target bonus based on his attainment of one or more pre-established performancecriteria established by our board of directors or a committee of our board of directors, with his initial target bonusopportunity equal to 80% of his then-current annual base salary.
Further, Mr. Sparks was granted equity awards in the form of a restricted stock award covering354,191 shares of our common stock and a tandem stock appreciation right covering 2,931,035 shares of thestock or units of each of Travelocity Holdings, Inc. and Travelocity.com LLC, respectively, with a strike priceequal to the fair market value of such shares and common units on the date of grant. The restricted stock awardwas to vest as to one-third of the total number of shares of our common stock subject to such award on each ofthe first, second, and third anniversaries of the date of grant, subject to his continued employment through eachvesting date. The tandem stock appreciation right was to vest as to 25% of the shares of the common stock ofTravelocity Holdings, Inc. and common units of Travelocity.com LLC subject to such awards on the firstanniversary of the date of grant and as to 4.6875% of such shares and common units at the end of each successivethree-month period thereafter, subject to his continued employment through each vesting date. The stockappreciation right could also be exercised for cash or shares of our common stock, in the good faith discretion ofour board of directors.
In May 2012, we cancelled the tandem stock appreciation right and granted Mr. Sparks a new stockappreciation right covering 2,931,035 shares of the stock or common units of each of Travelocity Holdings, Inc.and Travelocity.com LLC with a strike price equal to the fair market value of such shares and common units onthe date of grant. Generally, this award was subject to the terms and conditions of the prior stock appreciationright award agreement. The vesting of the shares of common stock or common units subject to such awards isalso subject to acceleration as described in greater detail under “Potential Payments upon Termination or Changein Control” below.
219
In November 2012, we granted Mr. Sparks a restricted stock unit award with an aggregate value of$3,000,000 which vests as to certain prescribed values in six installments on December 15, 2012, June 15 andDecember 15 of 2013 and 2014, and on June 15, 2015, in each case, subject to his continued employmentthrough each such vesting date. In connection with this grant of restricted stock units, Mr. Sparks agreed that, asa condition of his right to settlement of the award, he would forfeit up to 30% of the number of unvested sharesand common units subject to his stock appreciation right, with the forfeiture of such shares and common unitsoccurring in three equal installments on December 15, 2012, June 15, 2013, and December 15, 2013,respectively.
Ms. Kerr
Effective March 11, 2013, we entered into an employment agreement with Ms. Kerr in connection with herappointment as our Executive Vice President and Chief Product and Technology Officer that provides for hergeneral employment terms, including certain compensation arrangements. Ms. Kerr’s employment agreementalso provides for specified payments and benefits in the event of her termination of employment under certainspecified circumstances, including in connection with a change in control of us, which are described in greaterdetail under “Potential Payments upon Termination or Change in Control” below.
Under the terms of her employment agreement, Ms. Kerr received an initial annual base salary of $500,000,less applicable withholding taxes, which is subject to annual review for a possible increase (but not decrease).Ms. Kerr also received a one-time “sign on” bonus in the amount of $225,000, subject to repayment under certainconditions.
Ms. Kerr is also eligible to receive an annual target bonus based on her attainment of one or more pre-established performance criteria established by our board of directors or a committee of our board of directors,with her initial target bonus opportunity equal to 80% of her then-current annual base salary.
Under the terms of her employment agreement, Ms. Kerr was eligible to receive a lump-sum payment in theamount of $250,000 to assist her in defraying the costs of relocating her residence to Dallas, Texas, subject to herexecution of an appropriate repayment agreement with us.
Further, Ms. Kerr was granted an option to purchase 600,000 shares of our common stock with an exerciseprice equal to the fair market value of such shares of common stock on the date of grant and a restricted stockunit award covering 200,000 shares of our common stock. The option to purchase shares of our common stockvests as to 25% of the shares of common stock subject to such option on the first anniversary of the date of grantand thereafter as to 6.25% of such shares at the end of each successive three-month period thereafter, subject toher continued employment through each vesting date. The restricted stock unit award vests as to 25% of theshares of our common stock subject to such award on March 15 in each of calendar years 2014, 2015, 2016, and2017 if, as of the end of our most recent fiscal year ending prior to each such vesting date, we have achieved atleast 95% of the EBITDA target level established for such fiscal year as determined by our board of directors,consistent with the annual business plan for such fiscal year, subject to her continued employment through eachvesting date. The vesting of the shares of common stock subject to such awards is also subject to acceleration asdescribed in greater detail under “Potential Payments upon Termination or Change in Control” below.
Mr. Robinson
Effective December 16, 2013, we entered into an employment agreement with Mr. Robinson in connectionwith his appointment as our Executive Vice President and Chief Human Resources Officer that provides for hisgeneral employment terms, including certain compensation arrangements.
Under the terms of his employment agreement, Mr. Robinson received an initial annual base salary of$420,000, less applicable withholding taxes. Mr. Robinson also received a one-time “sign-on” bonus in theamount of $50,000, subject to repayment under certain conditions.
220
Mr. Robinson is also eligible to receive an annual bonus based on his attainment of one or morepre-established performance criteria established by our board of directors or a committee of our board ofdirectors, with his initial target bonus opportunity equal to 70% of his then-current annual base salary.
Further, Mr. Robinson was granted an option to purchase 296,337 shares of our common stock with anexercise price equal to the fair market value of such shares of common stock on the date of grant and a restrictedstock unit award covering 98,779 shares of our common stock. The option to purchase shares of our commonstock vests as to 25% of the shares of common stock subject to such option on the first anniversary of the date ofgrant and thereafter as to 6.25% of such shares at the end of each successive three-month period thereafter,subject to his continued employment through each vesting date. The restricted stock unit award vests as to 25%of the shares of our common stock subject to such award on March 15 in each of calendar years 2014, 2015,2016, and 2017 if, as of the end of our most recent fiscal year ending prior to each such vesting date, we haveachieved at least 95% of the EBITDA target level established for such fiscal year as determined by our board ofdirectors, consistent with the annual business plan for such fiscal year, subject to his continued employmentthrough each vesting date. The vesting of the shares of common stock subject to such awards is also subject toacceleration as described in greater detail under “Potential Payments upon Termination or Change in Control”below.
Mr. Gilliland
On June 11, 2007, we entered into an employment agreement with Mr. Gilliland that provided for hisgeneral employment terms, including certain compensation arrangements, and specified payments and benefits inthe event of his termination of employment under certain specified circumstances, including in connection with achange in control of us.
Under the terms of his employment agreement, Mr. Gilliland received an initial annual base salary of$800,000, less applicable withholding taxes, which was subject to annual review for a possible increase (but notdecrease). Mr. Gilliland was also eligible to receive an annual target bonus based on his attainment of one ormore pre-established performance criteria established by our board of directors or a committee of our board ofdirectors, with his initial target bonus opportunity equal to 150% of his then-current annual base salary.
Further, Mr. Gilliland was granted an option to purchase 3,175,000 shares of our common stock with anexercise price equal to the fair market value of such shares of common stock on the date of grant. Half of theshares of our common stock subject to the option were subject to a time-based vesting schedule, with 25% ofsuch shares to vest on the first anniversary of the effective date of the merger transaction and as to 4.6875% ofsuch shares at the end of each complete fiscal quarter thereafter, subject to his continued employment througheach vesting date. The remaining shares of our common stock subject to the option were subject to aperformance-based vesting requirement with respect to a liquidity event involving us. The vesting of the sharesof the common stock subject to such option was also subject to acceleration as described in greater detail under“Potential Payments upon Termination or Change in Control” below.
The employment agreement with Mr. Gilliland was subsequently amended on December 31, 2008 tocomply with the requirements of Section 409A of the Code, again on June 26, 2009 to extend its term untilApril 1, 2012 and make certain conforming changes, again on June 30, 2012 to further extend its term forsuccessive one-year terms and make certain conforming changes, and on January 9, 2013 to adjust the number ofshares of our common stock subject to the stock option granted to him in December 2012.
Mr. Miller
On July 31, 2009, we entered into an employment agreement with Mr. Miller that provided for his generalemployment terms, including certain compensation arrangements, and specified payments and benefits in theevent of his termination of employment under certain specified circumstances, including in connection with achange in control of us.
221
Under the terms of his employment agreement, Mr. Miller received an initial annual base salary of$325,000, less applicable withholding taxes, which was subject to annual review for a possible increase (but notdecrease). Mr. Miller was also eligible to receive an annual target bonus based on his attainment of one or morepre-established performance criteria established by our board of directors or a committee of our board ofdirectors, with his initial target bonus opportunity equal to 60% of his then-current annual base salary.
Potential Payments upon Termination or Change in Control
Each of the current Named Executive Officers is eligible to receive certain severance payments and benefitsunder his or her employment agreement in connection with his or her termination of employment under variouscircumstances, including following a change in control of us.
The estimated potential severance payments and benefits payable to each Named Executive Officer in theevent of termination of employment as of December 31, 2013 are described below.
The actual amounts that would be paid or distributed to the Named Executive Officers as a result of one ofthe termination events occurring in the future may be different than those presented below as many factors willaffect the amount of any payments and benefits upon a termination of employment. For example, some of thefactors that could affect the amounts payable include the Named Executive Officer’s base salary and the marketprice of the shares of our common stock. Although we have entered into written arrangements to provide thesepayments and benefits to the Named Executive Officers in connection with a termination of employment underparticular circumstances, we, or an acquirer, may mutually agree with the Named Executive Officers on post-employment compensation terms that vary from those provided in these pre-existing arrangements. Finally, inaddition to the amounts presented below, each Named Executive Officer would also be able to exercise anypreviously-vested options to purchase shares of our common stock that he or she held. For more informationabout the Named Executive Officers outstanding equity awards as of December 31, 2013, see “Fiscal 2013Outstanding Equity Awards at Year-End Table.”
Along with the payments and benefits described in a Named Executive Officer’s individualpost-employment compensation arrangement, these executive officers are eligible to receive any benefits accruedunder our broad-based benefit plans, such as accrued vacation pay, in accordance with the terms of those plansand policies.
Mr. Klein
Under his employment agreement with us, Mr. Klein is eligible to receive certain payments and benefits inthe event of a termination of his employment by us without cause or a termination of employment by him forgood reason (as each of these terms is defined in his employment agreement). For these purposes, a terminationof employment by us as a result of notice of non-renewal at the end of any then-current term will be deemed forall purposes as a termination of employment without cause.
In the event of a termination of employment by us without cause or by him for “good reason”, Mr. Klein,upon execution of a binding agreement and general release of claims in our favor, will be eligible to receive:
• An amount equal to 200% of his then-current annual base salary (such amount to be paid ininstallments over a period of 24 months following the date of termination);
• An amount equal to any accrued but unpaid annual bonus for the fiscal year immediately preceding theyear of termination of employment;
• If the termination of employment occurs more than six months following the beginning of a fiscal yearand prior to the date that any bonus earned with respect to such fiscal year is paid, a pro rata bonus forthe year of termination of employment based on actual performance for the relevant fiscal year; and
222
• Continued medical, dental, and vision insurance coverage for him and his eligible dependents for the12-month period following the date of termination; provided, however, that if he becomes re-employedand eligible to receive health insurance benefits under another employer-provided plan, such continuedinsurance coverage will terminate.
In the case of Mr. Klein’s death or if his employment is terminated as a result of his disability (as well as inthe event of a termination of employment by us without cause or by him for good reason), he will be eligible toreceive (i) his base salary through the date of termination, (ii) reimbursement of any unreimbursed businessexpenses properly incurred prior to the date of termination that are subject to reimbursement, and (iii) paymentfor any accrued but unused vacation time (the “Accrued Obligations”). In addition to the foregoing amounts, ifhis employment is terminated in the case of his death, Mr. Klein’s estate or beneficiaries are eligible to receive anamount equal to a pro rata portion of his annual bonus for the year of termination, based on actual performancefor the relevant fiscal year. The Accrued Obligations also are payable to him in the event of (A) a termination ofemployment by us for cause or (B) a voluntary termination of employment by him.
In addition, in the event that Mr. Klein terminates his employment with us, he agrees to resign his positionas a member of our board of directors (and any other positions he holds by virtue of his employment with us), atour request.
Definitions for Mr. Klein’s Post-Employment Compensation Arrangements
Under Mr. Klein’s employment agreement, “Cause” means (i) willful misconduct or gross negligence that ismaterially injurious to us, any affiliated entity, or the Principal Stockholders at the time of execution of theemployment agreement; (ii) any knowing or deliberate violation of any of the covenants set forth in theemployment agreement; (iii) any material breach or violation of any material policy of our board of directorswhich is not promptly remedied following notification of such breach or violation; (iv) any deliberate andpersistent failure to perform or honor an express written directive of our board of directors; or (v) the indictmentfor, or a plea of nolo contendere to, a felony or other serious crime that could reasonably be expected to result inmaterial harm to us.
Under Mr. Klein’s employment agreement, “Good Reason” means any of the following events which occurwithout his written consent: (i) any materially adverse change to his responsibilities, duties, authority, or statusfrom those set forth in the employment agreement or any materially adverse change in his positions, titles, orreporting responsibility (provided, however, that becoming publicly-traded is expressly deemed not a materialadverse change); (ii) a relocation of his principal business location to an area outside a 50 mile radius of itscurrent location or a moving of him from our headquarters; (iii) a failure of any of our successors to assume inwriting any obligations arising out of his employment agreement; (iv) a reduction of his annual base salary ortarget bonus or payments due under his employment agreement in connection with his employment (provided,however, that a reduction in base salary or target bonus of less than 5% that is proportionately applied to ouremployees generally will not constitute Good Reason); or (v) a material breach by us of his employmentagreement or any other material agreement with him relating to his compensation.
Other Named Executive Officers
Under their employment agreements with us, Messrs. Simonson, Sparks, and Robinson and Ms. Kerr areeligible to receive certain payments and benefits in the event of a termination of their employment by us withoutcause or a termination of employment by the Named Executive Officer for good reason (as each of these terms isdefined in the employment agreements). For these purposes, a termination of employment by us as a result ofnotice of non-renewal at the end of any then-current term will be deemed for all purposes as a termination ofemployment without cause.
223
In the event of a termination of employment by us without cause or by a Named Executive Officer for goodreason, the Named Executive Officer, upon execution of a binding agreement and general release of claims in ourfavor, will be eligible to receive:
• An amount equal to 150% of the sum of his or her then-current annual base salary and target bonusopportunity (such amount to be prorated and paid in installments over a period of 18 months followingthe date of termination); and
• Continued medical, dental, and vision insurance coverage for him or her and his or her eligibledependents for the 18-month period following the date of termination; provided, however, that if he orshe becomes re-employed and eligible to receive health insurance benefits under another employer-provided plan, such continued insurance coverage will terminate.
In the case of a Named Executive Officer’s death or disability (as well as in the event of a termination ofemployment by us without cause or by a Named Executive Officer for good reason), he or she will be eligible toreceive (i) his or her base salary through the date of termination, (ii) reimbursement of any unreimbursedbusiness expenses properly incurred prior to the date of termination that are subject to reimbursement,(iii) payment for any accrued but unused vacation time, and (iv) an amount equal to any accrued but unpaidannual bonus for the immediately preceding year. The same amounts, except for the amount of any accrued butunpaid annual bonus for the immediately preceding year, are payable to a Named Executive Officer in the eventof (A) a termination of employment by us for cause or (B) a voluntary termination of employment by a NamedExecutive Officer.
Definitions for Other Named Executive Officer Post-Employment Compensation Arrangements
Under the employment agreements of Messrs. Simonson, Sparks, and Robinson and Ms. Kerr, “Cause”means any of the following events: (i) a majority of our board of directors determines that the Named ExecutiveOfficer (A) was guilty of gross negligence or willful misconduct in the performance of his or her duties for us;(B) materially breached or violated any agreement between him or her and us or any material policy in our codeof conduct or similar employee conduct policy; or (C) committed an act of dishonesty or breach of trust withregard to us, any of its subsidiaries or affiliates, or (ii) the Named Executive Officer is indicted for, or pleadsguilty or nolo contendere to, a felony or other crime of moral turpitude.
Under the employment agreements of Messrs. Simonson, Sparks, and Robinson and Ms. Kerr, “GoodReason” means any of the following events which occur without the Named Executive Officer’s consent: (i) anymaterially adverse change to his or her responsibilities, duties, authority, or status or materially adverse change inhis or her positions, titles, or reporting responsibility (provided, however, that us becoming or ceasing to bepublicly-traded is expressly deemed not to be a material adverse change); (ii) a relocation of his or her principalbusiness location to an area outside a 50 mile radius of its current location or a moving of him or her from ourheadquarters; (iii) a failure of any of our successors to assume in writing any obligations arising out of his or heremployment agreement; (iv) a reduction of his or her annual base salary or target bonus or payments due underhis or her employment agreement in connection with his or her employment (provided, however, that a reductionin base salary or target bonus of less than 5% that is proportionately applied to our employees generally will notconstitute Good Reason); or (v) a material breach by us of his or her employment agreement or any othermaterial agreement with him or her relating to his or her compensation.
Equity Awards
Generally, under our 2007 Management Equity Incentive Plan (as amended in 2010) and our 2012Management Equity Incentive Plan in the event of a termination of employment:
• all outstanding unvested time-based options to purchase shares of our common stock and otherunvested time-based equity awards (and awards where all restrictions have not lapsed) expire; and
224
• all outstanding vested and unexercised options to purchase shares of our common stock may continueto be exercised within 90 days following the termination of employment, other than a termination forcause (extended to a one-year period if the termination of employment is due to disability or death).
Further, under our 2007 Management Equity Incentive Plan (as amended in 2010) and our 2012Management Equity Incentive Plan if following a change in control of us, an executive officer’s employment isterminated by us for any reason other than “cause” or he or she terminates his or her employment for “goodreason”:
• any outstanding and unvested time-based options to purchase shares of our common stock shall vestimmediately and become exercisable or transferable in accordance with the terms of the applicableequity incentive plan, and
• any shares of our common stock subject to restricted stock unit awards under our 2012 ManagementEquity Incentive Plan that would have vested on the first vesting date following the executive officer’stermination of employment will vest if a percentage of our EBITDA target for the fiscal yearimmediately preceding the vesting date is met, as determined by our board of directors.
In addition, performance-based options to purchase shares of our common stock may vest and becomeexercisable upon a change in control of us, to the extent the transaction results in the achievement by ourPrincipal Stockholder of certain specified MoM milestones on their initial investment in us.
The table below provides an estimate of the value of such accelerated vesting of outstanding and unvestedequity awards assuming that a change in control of us and a qualifying termination of employment occurred onDecember 31, 2013 and assuming a stock price of $14.01 per share, the fair market value of a share of ourcommon stock on such date, as determined by an independent third-party valuation. The table below also reflectsthe assumption that, as of December 31, 2013, based on this valuation, the first requisite MoM milestone wouldhave been met and, consequently, one-third of the shares of our common stock subject to the performance-basedoptions would have vested, while the remaining two-thirds of such shares would have been forfeited. The tablefurther reflects the assumption that, as of December 31, 2013, the EBITDA target level for Fiscal 2013 in respectof the restricted stock unit awards granted under our 2012 Management Equity Incentive Plan would have beenmet, and therefore, one-fourth of the shares of our common stock subject to such restricted stock unit awardswould have vested, while the remaining three-fourths of such shares would have been forfeited.
We have entered into certain non-competition agreements with the Named Executive Officers that restricttheir ability to compete with us during a specified post-employment period.
Summary of Estimated Payments and Benefits
The following table summarizes the estimated post-employment payments and benefits that would havebeen payable to the current Named Executive Officers in the event that their employment had been terminated ora change in control of us had occurred as of December 31, 2013. No post-employment compensation is payableto any Named Executive Officer who voluntarily terminates his or her employment with us (other than avoluntary resignation for good reason). The information set forth in the table is based on the assumption, in eachcase, that termination of employment or the change in control of us occurred on December 31, 2013. Pensionbenefits, which are described elsewhere in this registration statement of which this prospectus forms a part, arenot included in the table, even though they may become payable at the times specified in the table.
225

Potential Payments and Benefitsupon Termination of Employment
or Change in Control Table
Triggering Event(1) Mr. Klein(2) Mr. Simonson(3) Mr. Sparks(4) Ms. Kerr(5) Mr. Robinson(6)
Involuntary Termination ofEmployment Not in Connection WithChange in Control
Base Salary . . . . . . . . . . . . . . . . . . . . . . . . . $1,800,000 $ 900,000 $ 900,000 $ 750,000 $ 630,000Annual Bonus . . . . . . . . . . . . . . . . . . . . . . . $ 784,778 $ 720,000 $ 720,000 $ 600,000 $ 441,000Accelerated Vesting of Stock Options . . . . — — — — —Accelerated Vesting of Restricted Stock
Unit Awards . . . . . . . . . . . . . . . . . . . . . . — — — — —Health and Welfare Benefits . . . . . . . . . . . $ 14,767 $ 23,267 $ 23,267 $ 16,428 $ 23,267Outplacement Services(10) . . . . . . . . . . . . . $ 25,000 $ 25,000 $ 25,000 $ 25,000 $ 25,000
TOTAL . . . . . . . . . . . . . . . . . . . . . . . $2,624,545 $1,668,267 $1,668,267 $1,391,428 $1,119,267
Involuntary Termination ofEmployment in Connection WithChange in Control(7)(11)
Base Salary . . . . . . . . . . . . . . . . . . . . . . . . . $1,800,000 $ 900,000 $ 900,000 $ 750,000 $ 630,000Annual Bonus . . . . . . . . . . . . . . . . . . . . . . . $ 784,778 $ 720,000 $ 720,000 $ 600,000 $ 441,000Accelerated Vesting of Stock Option(8) . . . $2,227,096 $2,424,000 — $2,424,000 —Accelerated Vesting of Restricted Stock/
Restricted Stock Unit Awards(9) . . . . . . . $ 575,174 $1,050,750 $1,654,077 $ 700,500 $ 345,973Health and Welfare Benefits . . . . . . . . . . . $ 14,767 $ 23,267 $ 23,267 $ 16,428 $ 23,267Outplacement Services(10) . . . . . . . . . . . . . $ 25,000 $ 25,000 $ 25,000 $ 25,000 $ 25,000
TOTAL . . . . . . . . . . . . . . . . . . . . . . . $5,426,815 $5,143,017 $3,322,344 $4,515,928 $1,465,240
(1) The calculations presented in this table illustrate the estimated payments and benefits that would have beenpaid to each of the Named Executive Officers had their employment been terminated on December 31, 2013for each of the following reasons: a termination of employment without cause or a termination ofemployment by a Named Executive Officer for good reason (including following a change in control of us).The calculations are based on the fair market value of our common stock on December 31, 2013 of $14.01per share.
(2) For purposes of this analysis, Mr. Klein’s compensation is assumed to be as follows: base salary equal to$900,000, a target annual bonus opportunity of $1,125,000, outstanding unvested options subject to time-based vesting requirements to purchase 412,647 shares of our common stock, the vesting of which all suchshares would accelerate, outstanding unvested options subject to performance-based vesting requirements topurchase 328,500 shares of our common stock, the vesting of which one-third of such shares wouldaccelerate, and outstanding unvested restricted stock unit awards subject to time-based vesting requirementscovering 164,218 shares of our common stock, the vesting of which one-fourth of such shares wouldaccelerate. In the event of his death, Mr. Klein’s heirs or estate are eligible to receive a pro rata portion ofhis target annual cash bonus opportunity for the year of his death, based on our actual performance for theyear, which is estimated to be $784,778 as of December 31, 2013.
(3) For purposes of this analysis, Mr. Simonson’s compensation is assumed to be as follows: base salary equalto $600,000, a target annual bonus opportunity of $480,000, outstanding unvested options to purchase600,000 shares of our common stock, the vesting of which all such shares would accelerate, and outstandingunvested restricted stock unit awards covering 300,000 shares of our common stock, the vesting of whichone-fourth of such shares would accelerate.
(4) For purposes of this analysis, Mr. Sparks’ compensation is assumed to be as follows: base salary equal to$600,000, a target annual bonus opportunity of $480,000, and an outstanding unvested restricted stockaward covering 118,064 shares of our common stock, the vesting of which all such shares would accelerate.
226

(5) For purposes of this analysis, Ms. Kerr’s compensation is assumed to be as follows: base salary equal to$500,000, a target annual bonus opportunity of $400,000, outstanding unvested options to purchase 600,000shares of our common stock, the vesting of which all of such shares would accelerate, and outstandingunvested restricted stock unit awards covering 200,000 shares of our common stock, the vesting of whichone-fourth of such shares would accelerate.
(6) For purposes of this analysis, Mr. Robinson’s compensation is assumed to be as follows: base salary equalto $420,000, a target annual bonus opportunity of $294,000, outstanding unvested options to purchase296,337 shares of our common stock, the vesting of which all such shares would accelerate, and outstandingunvested restricted stock unit awards covering 98,779 shares of our common stock, the vesting of whichone-fourth of such shares would accelerate.
(7) The change in control calculations assume that on December 31, 2013 (i) a change-in-control of us occurredand (ii) the employment of each of the Named Executive Officer’s was terminated without cause. Nopayments or benefits would have been payable solely as a result of a change in control of us other than thevesting of some of the options subject to performance-based vesting granted under our 2007 ManagementEquity Incentive Plan (as amended in 2010), subject to achievement of the pre-determined MoM targets inconnection with such change in control.
(8) This amount represents the “intrinsic” value of outstanding and unvested options subject to time-based andperformance-based vesting requirements to purchase shares of our common stock based on a stock price of$14.01 per share.
(9) Other than for Mr. Sparks, this amount represents the fair market value of one-fourth of the shares of ourcommon stock subject to such restricted stock units based on a stock price of $14.01 per share. For Mr.Sparks, this amount represents the fair market value of 118,064 shares of our common stock subject to anunvested restricted stock award based on a stock price of $14.01 per share.
(10) Pursuant to our policy, we also provide the Named Executive Officers with a one-time payment foroutplacement services.
(11) The potential payments and benefits reflect the maximum amounts that may be paid. Should the actualpayments and benefits trigger an excise tax under Section 4999 of the Internal Revenue Code, pursuant toMr. Klein and Ms. Kerr’s employment agreements, he and she will each either (x) have his or her paymentsreduced to the extent necessary to avoid the excise tax or (y) receive the full payment and be subject to theexcise tax, whichever results in a better net after-tax benefit to Mr. Klein or Ms. Kerr, respectively.
Post-Employment Compensation
Mr. Gilliland’s Post-Employment Compensation
In connection with his retirement in September 2013 and pursuant to the terms and conditions of hisemployment agreement, upon his termination of employment Mr. Gilliland received the following payments andbenefits:
• A lump sum cash payment in the amount equal to the sum of his then-current annual base salarythrough June 2014 ($769,223) and his target annual cash bonus for Fiscal 2013 ($1,500,000), for a totalof $2,269,223;
• Continued medical, dental, and vision insurance coverage for him and his eligible dependents for the24-month period commencing on September 21, 2013 (estimated to be $32,996); and
• Continued participation in our annual physical examination program for a period of two years(estimated to be $6,950).
In addition, pursuant to the third amendment to Mr. Gilliland’s employment agreement and the terms of aletter agreement dated September 18, 2013, we agreed to extend the period for the vesting and exercise of hisoutstanding options to purchase shares of our common stock until September 21, 2015.
227
Mr. Miller’s Post-Employment Compensation
In connection with his resignation of his position as our Executive Vice President and Chief FinancialOfficer in March 2013 and pursuant to the terms and conditions of his employment agreement, upon histermination of employment Mr. Miller became entitled to receive the following payments and benefits:
• An amount equal to 150% of the sum of his then-current annual base salary and target bonusopportunity, with such amount being paid in installments over a period of 18 months following the dateof his termination of employment ($1,071,000, of which $357,000 was paid during Fiscal 2013); and
• Continued medical, dental, and vision insurance coverage for him and his eligible dependents for the18-month period following the date of his termination of employment (which, in view of hissubsequent re-employment, resulted in a cost to us of $2,345).
In addition, pursuant to a letter agreement dated April 12, 2013, we agreed to extend the period for theexercise of his outstanding and vested options for the purchase of shares of our common stock that were subjectto time-based vesting requirements until June 30, 2015 and for the vesting and exercise of his outstanding andunvested performance-based options for the purchase of shares of our common stock until June 30, 2015 as well.
Employee Stock Plans
Sabre Corporation 2014 Omnibus Incentive Plan
On March 20, 2014, our board of directors adopted our 2014 Omnibus Incentive Plan (the “2014 OmnibusPlan”), which permits the grant of cash and equity and equity-based incentive awards, including stock options,stock appreciation rights, restricted stock awards, restricted stock unit awards and other stock-based awards. Ouremployees and the non-employee members of our board of directors and those of our subsidiaries are eligible toreceive awards under the 2014 Omnibus Plan.
The purpose of the 2014 Omnibus Plan is to provide incentives and rewards that will encourage ouremployees, including our executive officers, and the non-employee members of our board of directors tocontinue in our service by providing them with an interest in pursuing our long-term growth, profitability andfinancial success. The following is a summary of the material terms of the 2014 Omnibus Plan, but does notinclude all of the provisions of such plan. For further information about the 2014 Omnibus Plan, we refer you tothe complete text of the 2014 Omnibus Plan, which is filed as an exhibit to the registration statement of whichthis prospectus is a part.
On the effective date of this offering, we may issue a mix of time-based options, performance-basedrestricted stock units and time-based restricted stock units pursuant to the 2014 Omnibus Plan up to an aggregatefair value of $46,600,000, of which we expect approximately $8,550,000 will be awarded to our NamedExecutive Officers in the aggregate (excluding Messrs. Gilliland, Miller and Sparks, who are not expected toreceive awards). It is expected that 25% of each Named Executive Officer’s award value will consist of time-based options to purchase shares of common stock and 75% of the award value will be in the form ofperformance-based restricted stock units. The number of shares subject to awards granted in connection with thisoffering will be determined based on the volume weighted average price of a share of common stock on the dateof grant, and any options that are part of the grant will have an exercise price equal to the volume weightedaverage price of a share of common stock on the date of grant. Assuming that the grant date volume weightedaverage trading price is within the initial public offering price range set forth on the cover of this prospectus, thenumber of shares of common stock subject to options granted would range from approximately 1,150,000 to1,350,000 shares in the aggregate and the number of shares of common stock subject to time-based andperformance-based restricted stock units granted would range from approximately 1,950,000 to 2,150,000 sharesin the aggregate.
Administration
The 2014 Omnibus Plan is administered by our board of directors or the Compensation Committee of ourboard of directors or such other committee as designated by our board of directors (the “Committee”). Among
228

the Committee’s powers under the 2014 Omnibus Plan is the power to determine those employees who will begranted awards and the amount, type and other terms and conditions of awards. Our board of directors may grantawards to the non-employee members of our board of directors. The Committee may also prescribe agreementsevidencing or settling the terms of any awards, and any amendments thereto; grant awards alone or in addition to,in tandem with, or in substitution or exchange for, any other award, any award granted under another of ourequity compensation plans (the “Prior Plans”) or that of any business entity we are acquiring, or any other rightof the plan participant to receive payment from the Company.
The Committee may delegate its powers and responsibilities under the 2014 Omnibus Plan, in writing, to asub-committee of our board of directors, or delegate certain administration powers (not including the grant ofawards) over the plan to one or more of our officers or employees.
The Committee has discretionary authority to interpret and construe any and all provisions of the 2014Omnibus Plan and the terms of any award (or award agreement) granted thereunder and to adopt and amend suchrules and regulations for the administration of the 2014 Omnibus Plan as it deems appropriate. Decisions of theCommittee will be final, binding and conclusive on all parties.
On or after the date of grant of any award, the Committee may accelerate the date on which any awardbecomes vested, exercisable, or transferable. The Committee may also extend the term of any such award(including the period following a termination of a participant’s employment during which any such award mayremain outstanding); waive any conditions to the vesting, exercisability or transferability of any such award;grant other awards in addition to, in tandem with or in substitution or exchange for any award granted under the2014 Omnibus Plan, any Prior Plan or any equity compensation plan of any business entity we are acquiring; orprovide for the payment of dividends or dividend equivalents with respect to any such award.
The Committee does not have the authority and may not take any such action described in this section to theextent that the grant of such authority or the taking of such action would cause any tax to become due underSection 409A of the Code.
The Company will not reprice any stock option without the approval of the stockholders of the Company.
Available Cash Incentive Awards
The amount payable to any executive officer (within the meaning of Exchange Act Rule 3b-7) with respectto any calendar year for all cash incentive awards that are intended to qualify as “qualified performance-basedcompensation” under Section 162(m) of the Code and for which the performance period is no longer than oneyear may not exceed five million dollars. The amount payable to any executive officer (within the meaning ofExchange Act Rule 3b-7) with respect to any calendar year for all cash incentive awards that are intended toqualify as “qualified performance-based compensation” under Section 162(m) of the Code and for which theperformance period is longer than one year may not exceed five million dollars.
Available Shares
The aggregate number of shares of our common stock which may be issued pursuant to awards grantedunder the 2014 Omnibus Plan may not exceed 13,500,000 shares of our common stock, which may be authorizedand unissued shares of our common stock or shares of common stock held in or acquired for our treasury, orboth. In addition, 2,599,118 shares that remain available for issuance under the Prior Plans that are not thesubject of outstanding awards as of March 31, 2014 will also be available for issuance under the 2014 OmnibusPlan. In general, if awards under the 2014 Omnibus Plan or any of the Prior Plans expire or are forfeited,cancelled or terminated without the issuance of shares of common stock, or are settled for cash in lieu ofshares of common stock, or are exchanged for an award not involving shares of common stock, the shares ofcommon stock covered by such awards will again become available for the grant of awards under the 2014Omnibus Plan. In addition, if the exercise price or tax withholding requirements related to any award underthe 2014 Omnibus Plan or any Prior Plan are satisfied through our withholding of shares of common stock
229

otherwise then deliverable in respect of an award or through actual or constructive transfer to us of shares ofcommon stock already owned, a number of shares of common stock equal to such withheld or transferred shareswill again become available for issuance under the 2014 Omnibus Plan.
Shares of common stock covered by awards granted pursuant to the 2014 Omnibus Plan in connection withthe assumption, replacement, conversion or adjustment of outstanding equity-based awards in the context of acorporate acquisition or merger will not count as issued under the 2014 Omnibus Plan.
Additionally, the number of shares of common stock that may be covered by incentive stock options maynot exceed 10,000,000 shares of common stock in the aggregate. The number of shares of common stock thatmay be covered by awards (other than stock options or stock appreciation rights) granted under the 2014Omnibus Plan to any one participant in a single fiscal year may not exceed 750,000 shares in the aggregate, andthe number of shares of common stock that may be covered by stock options or stock appreciation rights grantedunder the 2014 Omnibus Plan to any one participant in a single fiscal year may not exceed 1,500,000 shares inthe aggregate.
Eligibility for Participation
The persons eligible to receive awards under the 2014 Omnibus Plan are our employees (includingprospective employees who have been offered employment) and those of our subsidiaries as selected by theCommittee and the non-employee members of our board of directors as selected by our board of directors.
Cash Incentive Awards
The Committee may grant cash incentive awards. Cash Incentive Awards may be settled in cash or in otherproperty, including shares of our common stock. Cash incentive awards may be designed to qualify as “qualifiedperformance-based compensation,” where such compensation satisfies the requirements of Section 162(m) of theCode for deductibility of remuneration paid.
Stock Options and Stock Appreciation Rights
The Committee may grant non-qualified stock options and incentive stock options to purchase shares of ourcommon stock. The Committee will determine the number of shares of our common stock subject to each option,the vesting schedule (provided that no option may be exercisable after the expiration of ten years after the date ofgrant), the method and procedure to exercise vested options, restrictions on transfer of options and any shares ofcommon stock acquired pursuant to the exercise of an option, and the other terms of each option. The exerciseprice per share of common stock covered by any option may not be less than 100% of the fair market value of ashare of common stock on the date of grant.
Additionally, with respect to “incentive stock options” (within the meaning of Section 422 of the Code), theaggregate fair market value of shares of common stock with respect to incentive stock options that areexercisable for the first time by a participant during any calendar year under the 2014 Omnibus Plan or any ofour other stock option plans may not exceed $100,000. To the extent the fair market value of such shares exceeds$100,000, the incentive stock options granted to such participant, to the extent and in the order required byregulations, automatically will be deemed to be non-qualified stock options, but all other terms and provisions ofsuch option will remain unchanged. No incentive stock option may be granted to a 10% stockholder unless theexercise price of the option is at least 110% of the fair market value of a share of common stock at the time suchincentive stock option is granted and such incentive stock option is not exercisable after the expiration of fiveyears from the date such incentive stock option is granted.
Other Stock-Based Awards
The Committee may grant other stock, stock-based or stock-related awards in such amounts and subject tosuch terms and conditions as determined by the Committee. Each such other stock-based award may (i) involve
230
the transfer of actual shares of common stock to the participant, either at the time of grant or thereafter, orpayment in cash or otherwise of amounts based on the value of shares of common stock, (ii) be subject toperformance-based and/or service-based conditions, (iii) be in the form of stock appreciation rights, phantomstock, restricted stock, restricted stock units, performance shares, deferred share units, or share-denominatedperformance units, (iv) be designed to comply with applicable laws of jurisdictions other than the United States,and (v) be designed to qualify as “qualified performance-based compensation” under Section 162(m) of theCode; provided, that each award must be denominated in, or must have a value determined by reference to, anumber of shares of our common stock that is specified at the time of the grant of such award.
Performance-Based Compensation, Performance Goals and Measures
The Committee may grant performance-based compensation to a participant payable upon the attainment ofspecific performance goals in an amount permitted by Section 162(m) of the Code. For awards intended toqualify as “qualified performance-based compensation” under Section 162(m) of the Code, the Committee willdetermine the performance measures, the level of actual achievement of performance goals and the amountpayable with respect to such award in a manner that is consistent with Section 162(m) of the Code. The paymentor vesting of any award intended to qualify as “qualified performance-based compensation” is based uponperformance goals which are objective business criteria and otherwise meet the requirements of Section 162(m)of the Code, including the requirement that the level or levels of performance targeted by the Committee result inthe achievement of performance goals being “substantially uncertain.”
The performance goals will relate to one or more of the following performance measures (whether or not incomparison to other peer companies) as determined by the Committee in its sole discretion, which may bedetermined pursuant to GAAP or on a non-GAAP basis, as determined by the Committee: adjusted net earnings,appreciation in and/or maintenance of the price of common stock (including, without limitation, comparisonswith various stock market indices), attainment of strategic and operational initiatives, budget, cash flow(including, without limitation, free cash flow), cost of capital, cost reduction, earnings and earnings growth(including, without limitation, earnings per share, earnings before taxes, earnings before interest and taxes, andearnings before interest, taxes, depreciation and amortization), market share, market value added, net income, netsales, net revenue, operating profit and operating income, pretax income before allocation of corporate overheadand bonus, reductions in costs, return on assets and return on net assets, return on equity, return on investedcapital, revenues, sales and sales growth, successful acquisition/divestiture, total stockholder return andimprovement of stockholder return, gross margin, measures of liquidity or credit metrics, cash flow per share,improvements or attainments of expense levels, or improvements or attainment of working capital levels or debtreduction.
If the Committee determines that a change in the business, operations, corporate structure or capitalstructure of the company, or the manner in which it conducts its business, or other events or circumstances,render previously established performance measures unsuitable, the Committee may in its discretion modify suchperformance measures or the related levels of achievement, in whole or in part, as the Committee deemsappropriate and equitable, except where such action would result in the loss of qualification of the award as“qualified performance-based compensation” under Section 162(m) of the Code.
In connection with the setting of the performance goals, the Committee may provide in a manner that meetsthe requirements of Section 162(m) of the Code for deducibility that any evaluation of performance may includeor exclude certain items that may occur during any fiscal year, including, without limitation (i) asset writedowns; (ii) litigation or claim judgments or settlements; (iii) the effect of changes in tax laws, accountingprinciples and practices or other laws or provisions affecting reported results; (iv) any reorganization andrestructuring programs; (v) extraordinary nonrecurring items as described in FASB ASC 225-20 “Extraordinaryand Unusual Items” and/or in management’s discussion and analysis of financial condition and results ofoperations appearing in our Annual Report on Form 10-K for the applicable year; (vi) acquisitions ordivestitures; and (vii) foreign exchange gains and losses.
231

Performance goals may relate to individual performance, company performance or business unitperformance.
In addition, any performance measure may be used to measure the performance of the company or asubsidiary as a whole or any business unit of the company or a subsidiary or any combination thereof, as theCommittee may deem appropriate, or any of the above performance measures as compared to the performance ofa group of comparator companies, or a published or special index that the Committee, in its sole discretion,deems appropriate.
The Committee may, in its discretion, reduce or eliminate the amount payable (in a non-uniform manner) toany participant with respect to an award that is intended to qualify as “qualified performance-basedcompensation” under Section 162(m) of the Code, based on such factors as the Committee may deem relevant,but the Committee may not increase any such amount above the amount established in accordance with therelevant performance schedule.
Notwithstanding the foregoing, for a limited period following this Offering, we may be able to rely ontransitional relief under regulations issued under Section 162(m) of the Code in connection with the grant,vesting and settlement of awards issued under the 2014 Omnibus Plan.
In addition, although the 2014 Omnibus Plan permits the issuance of awards that may be structured toqualify as qualified performance-based compensation under Section 162(m) of the Code, nothing in the 2014Omnibus Plan or this Registration Statement is intended to guarantee that we will always seek to ensure thatawards granted under the 2014 Omnibus Plan do so qualify, and no guarantee can be given that the terms of the2014 Omnibus Plan do, in fact, comply with the requirements for qualified performance-based compensation asthey exist today or as they may change from time to time.
Stockholder Rights
No person will have any rights as a stockholder with respect to any shares of common stock covered by orrelating to any award granted pursuant to the 2014 Omnibus Plan until the date of the issuance of a stockcertificate with respect to such shares.
Amendment and Termination
Notwithstanding any other provision of the 2014 Omnibus Plan, our board of directors may at any timesuspend or discontinue the plan or revise or amend it in any respect whatsoever; provided, however, that to theextent that any applicable law, regulation, or rule of a stock exchange requires stockholder approval for any suchrevision or amendment to be effective, such revision or amendment will not be effective without such approval.
Transferability
Awards granted under the 2014 Omnibus Plan are generally nontransferable (other than by will or the lawsof descent and distribution), except that the Committee may provide for the transferability of nonqualified stockoptions subject to conditions and limitations as determined by the Committee.
Change in Control
Except as otherwise set forth in a participant’s award agreement, in the event a participant has a qualifyingtermination of employment following a change in control of the company or a change in control of the companyin which outstanding awards are not assumed, continued, or substituted by the surviving corporation:
• All deferral of settlement, forfeiture conditions and other restrictions applicable to awards grantedunder the 2014 Omnibus Plan will lapse and such awards will be deemed fully vested as of the time ofthe change in control transaction without regard to deferral and vesting conditions; and
232
• Any award carrying a right to exercise that was not previously exercisable and vested shall becomefully exercisable and vested as of the time of the change in control of the company.
For purposes of this provision, a “qualifying termination of employment” means with respect to aparticipant, (i) a termination of such participant’s employment by the company (and all then-affiliated entities)without cause or by the participant for good reason, (ii) a termination of such participant’s employment, prior tothe expiration of the awards in accordance with the terms of the 2014 Omnibus Plan and applicable awardagreement, by all entities that were, immediately prior to the change in control, affiliated entities and cease, uponthe change in control, to be affiliated entities, without cause or by the participant for good reason, or (iii) atermination of such participant’s employment in the event of a participant’s death or disability, in each casefollowing a change in control of the company.
Sovereign Holdings, Inc. 2007 Management Incentive Plan (as amended April 22, 2010)
On June 11, 2007, our board of directors adopted our 2007 Management Equity Incentive Plan (the “2007Management Equity Incentive Plan”), which permitted the grant of options to purchase shares of our commonstock. Our employees, directors, and, in certain instances, other service providers and consultants to us and ouraffiliates were eligible to receive awards under the 2007 Management Equity Incentive Plan. The exercise priceof such stock options must be at least equal to the fair market value of our common stock on the date of grant.Stock options could be granted subject to either time-based or performance-based vesting requirements and weresubject to a maximum term of 10 years. Subsequently, our board of directors amended the 2007 ManagementEquity Incentive Plan on April 22, 2010.
The purpose of the 2007 Management Equity Incentive Plan was to promote our interests and those of ourstockholders by providing our key employees and, in certain circumstances, directors, service providers, andconsultants, and those of our affiliates with an appropriate incentive to encourage them to continue in our employor the employ of our affiliates and to improve our growth and profitability. We discontinued use of the 2007Management Equity Incentive Plan upon the adoption of a new management equity incentive plan in September2012. All of the shares of our common stock subject to issuance under the 2007 Management Equity IncentivePlan that had not been granted subject to an outstanding equity award were transferred to the new managementequity incentive plan.
Sovereign Holdings, Inc. 2012 Management Equity Incentive Plan
On September 14, 2012, our board of directors adopted our 2012 Management Equity Incentive Plan (the“2012 Management Equity Incentive Plan”), which permits the grant of equity and equity-based incentiveawards, including stock options, restricted stock, restricted stock units and other stock-based awards. Ouremployees, directors, and independent contractors and those of our subsidiaries and affiliates are eligible toreceive awards under the 2012 Management Equity Incentive Plan.
The purpose of the 2012 Management Equity Incentive Plan is to promote our interests and those of ourstockholders by providing key employees, directors, and independent contractors with an appropriate incentive tocontinue in our service and that of our subsidiaries and affiliates and to improve our growth and profitability. Thefollowing is a summary of the material terms of the 2012 Management Equity Incentive Plan, but does notinclude all of the provisions of such plan. For further information about the 2012 Management Equity IncentivePlan, we refer you to the complete text of the 2012 Management Equity Incentive Plan, which is filed as anexhibit to the registration statement of which this prospectus is a part.
Administration
The 2012 Management Equity Incentive Plan is administered by our board of directors or such committee asdesignated by our board of directors (the “Committee”). Among the Committee’s powers under the 2012Management Equity Incentive Plan are the power to determine those of our employees and independent
233

contractors who will be granted awards and the amount, type and other terms and conditions of awards. TheCommittee may grant awards to the members of our board of directors. The Committee may also prescribe theform of and terms and conditions of any grant agreement evidencing any award; adopt, amend and rescind suchrules and regulations as, in its opinion, may be advisable for the administration of the plan; construe and interpretthe plan, such rules and regulations and the grant agreements; and make all other determinations necessary oradvisable for the administration of the 2012 Management Equity Incentive Plan. Any award, determination,prescription or other act of the Committee is final and conclusively binding upon all persons.
Available Shares
The aggregate number of shares of our common stock which may be issued or transferred pursuant toawards granted under the 2012 Management Equity Incentive Plan may not exceed 1,800,000 shares and anyadditional shares of our common stock authorized for issuance by our board of directors, which may be eitherauthorized and unissued shares of our common stock or previously-issued shares of our common stock acquiredby us, or both. In addition, shares of our common stock that remained available for issuance under the 2007Management Equity Incentive Plan were also available for issuance under the 2012 Management EquityIncentive Plan.
In general, if awards granted under the 2012 Management Equity Incentive Plan or the 2007 ManagementEquity Incentive Plan expire or are forfeited, cancelled or terminated without the issuance of shares of ourcommon stock, or are settled for cash in lieu of shares of common stock, or are exchanged for an award notinvolving shares of common stock, the shares covered by such awards will remain or become available forissuance under the 2012 Management Equity Incentive Plan.
Eligibility for Participation
The persons eligible to receive awards under the 2012 Management Equity Incentive Plan are ouremployees, directors, and independent contractors of those of our subsidiaries and affiliates as selected by theCommittee and our board of directors.
Stock Options
The Committee may grant nonqualified stock options, that is, options that are not intended to qualify as“incentive stock options” within the meaning of Section 422 of the Code, to purchase shares of our commonstock. The Committee determines the number of shares of common stock subject to each option, the vestingschedule (provided that no option may be exercisable after the expiration of ten years after the date of grant), themethod and procedure to exercise vested options, restrictions on transfer of options and any shares acquiredpursuant to the exercise of an option, and the other terms of each option. The exercise price per share of commonstock covered by any option must be at least equal to the fair market value of a share of our common stock on thedate of grant.
The Committee will specify in the grant agreement for an option the time or times at which, or theconditions upon which, the option or any portion thereof will become vested and exercisable, provided, however,that no option may be exercisable after the expiration of ten years from the date of grant. Such vesting conditionsmay relate to service through a specified date, or may be based on the achievement of one or more performancemeasures, a combination of the foregoing, or such other criteria as the Committee may establish from time totime. Each option will be subject to earlier vesting, expiration, cancellation or termination as provided in the2012 Management Equity Incentive Plan or in the relevant grant agreement.
In addition, in the event of a qualifying termination of employment following a change in control (asdefined in the 2012 Management Equity Incentive Plan) of us, all outstanding options that vest solely based oncontinued service through a specified date or dates held by a participant will immediately vest and becomeexercisable as of such qualifying termination of employment following a change in control.
234

Restricted Stock and Restricted Stock Unit Awards
The Committee may grant restricted stock or restricted stock unit awards for shares of our common stock. TheCommittee, in its sole discretion, will specify in the grant agreement the time or times at which, or the conditionsupon which, an award of restricted stock or a portion thereof will become vested and no longer be forfeitable andthe time or times at which, or the conditions upon which, an award of restricted stock units or portion thereof willbecome vested and settled. As of the applicable vesting date, each restricted stock award, or portion thereof, grantedunder the 2012 Management Equity Incentive Plan will cease to be subject to forfeiture and all restrictions willlapse and each restricted stock unit award, or portion thereof, will become subject to settlement at the time or timesset forth in the relevant grant agreement. Notwithstanding the foregoing, each restricted stock or restricted stock unitaward may be subject to earlier vesting, expiration, settlement, cancellation or termination as provided in the 2012Management Equity Incentive Plan or in the relevant grant agreement.
Subject to the terms of the grant agreement, a participant will be entitled, at all times on and after the date ofgrant, to exercise all rights of a stockholder with respect to the shares of our common stock subject to a restrictedstock award; provided, however, that unless otherwise determined by our board of directors at or after the time ofgrant, the participant will grant to our board of directors a proxy to vote the shares of restricted stock ownedbeneficially and of record by the participant in such manner as may be determined by our board of directors in itssole discretion. Subject to the terms of the 2012 Management Equity Incentive Plan, prior to the vesting date ofeach restricted stock award, or portion thereof, all cash, securities and other property paid or otherwisedistributed with respect to the restricted stock award may, at the discretion of our board of directors (i) be paidout to the holders of the restricted stock awards, (ii) be held in custody by us and subject to the same vesting andforfeiture conditions to which the award is subject, as specified in the grant agreement or such other conditions asour board of directors may determine or (iii) be forfeited. For purposes of clarification, participants will not haveany voting or dividend rights with respect to shares of our common stock to be issued on vesting and settlementof outstanding restricted stock unit awards unless otherwise determined by the Committee.
Performance-Based Awards
The Committee may from time to time grant awards, including, without limitation, options, restricted stockawards or restricted stock unit awards, where the award or portion thereof will become vested based on theattainment of one or more specified performance measures as established by the Committee and set forth in theparticipant’s grant agreement. At the time a performance award is granted, the Committee, in its sole discretion, willdetermine and set forth in the relevant grant agreement, (i) the length of the performance period, (ii) theperformance measure or measures and (iii) the performance target levels to be achieved during the performanceperiod. If the Committee determines that certain performance measures or performance target levels are unsuitablegiven a change in our operation or structure, or other events or circumstances, the Committee may, in its discretion,modify such performance measures or performance target levels, in whole or in part, as it deems appropriate.
Other Stock-Based Awards
The Committee may grant other equity-based or equity-related awards in such amounts and subject to suchterms and conditions as the Committee may determine. Each such other stock award may (i) involve the transferof actual shares of our common to the participant, either at the time of grant or thereafter, or payment in cash orotherwise of amounts based on the value of the shares of common stock, (ii) be subject to performance-basedand/or service-based conditions or (iii) be in the form of stock appreciation rights, phantom stock, performanceshares or share-denominated performance units, provided that each other stock-based award will be denominatedin, or will have a value determined by reference to, a number of shares of our common stock that is specified atthe time of the grant of such award.
Stockholder Rights
Except as otherwise expressly specified in the 2012 Management Equity Incentive Plan or in a grantagreement, no participant will have any rights as a stockholder with respect to any shares of our common stock
235
covered by or relating to any award granted pursuant to the 2012 Management Equity Incentive Plan until thedate a participant becomes the registered owner of such shares of common stock.
Amendment and Termination
Notwithstanding any other provision of the 2012 Management Equity Incentive Plan, our board of directorsmay, in its sole discretion, terminate the plan or amend the plan or the terms of any award; provided, however,that any such amendment may not materially impair or adversely affect the participants’ existing rights under theplan or such award without such participant’s written consent.
Transferability
Awards granted under the 2012 Management Equity Incentive Plan are generally nontransferable (other thanby will or the laws of descent and distribution); provided, however, that a participant may assign or transfer hisor her rights to exercise with respect to any or all of the options held by such participant to: (i) such participant’sbeneficiaries or estate upon the death of the participant (by will, by the laws of descent and distribution orotherwise) and (ii) subject to the prior written approval by our board of directors and compliance with allapplicable tax, securities and other laws, any trust or custodianship created by the participant, the beneficiaries ofwhich may include only the participant, the participant’s spouse or the participant’s lineal descendants (by bloodor adoption).
Travelocity.com LLC Stock Option Grant Agreement with Mr. Klein
On March 23, 2010, our board of directors granted Mr. Klein an option to purchase 350,000 common unitsof Travelocity.com LLC with an exercise price equal to the fair market value of such units on the date of grant.The exercise price of the stock option increases quarterly at 6.00% per annum until the option has been exercisedin full. The initial exercise price of the option was $0.50 per common unit. This stock option expires 10 yearsfrom the date of grant.
This stock option vested and became exercisable as to 25% of the common units subject to such option onthe first anniversary of the date of grant. Subsequently, this stock option vests and becomes exercisable as to4.6875% of such units at the end of each successive three-month period, subject to Mr. Klein’s continuedemployment through each vesting date. This stock option was granted with a companion option in respect ofshares of our common stock and may only be exercised if the aggregate fair market value of both options isgreater than the aggregate exercise price of both options. In this circumstance, the exercisable percentage of thestock option (not to exceed 100%) is calculated as follows: 100 multiplied by the quotient of (A) the aggregatefair market value minus the aggregate exercise price divided by (B) the fair market value minus the exerciseprice, in each case at the time of determination of the exercisable percentage.
Director Compensation
We have not had a formal compensation program for the non-employee members of our board of directors.Except as set forth in the following table, during Fiscal 2013 we did not pay any compensation to the non-employee members of our board of directors for service on our board of directors.
Fiscal 2013 Director Compensation Table
The following table presents the total compensation for each person who served as a non-employee memberof our board of directors during Fiscal 2013. Other than as set forth in the table and described more fully below,in Fiscal 2013 we did not pay any compensation to any person who served as a non-employee member of ourboard of directors who is affiliated with our Principal Stockholders or any fees to, reimburse any expense of,
236
make any equity awards or non-equity awards to, or pay any other compensation to any of the other non-employee members of our board of directors. Mr. Klein, who is our CEO and President, receives nocompensation for his service as a director, and is not included in this table. Similarly, Mr. Gilliland received nocompensation for his service as a director while he was our CEO. The compensation received by Messrs. Kleinand Gilliland as employees is presented in the “Fiscal 2013 Summary Compensation Table” above.
Director
Fees Earned orPaid in Cash
($)
StockAwards($)(1)(2)
OptionAwards($)(1)(2) Total ($)
Lawrence W. Kellner . . . . . . . . . . . . . . . . . . . . . . . . . . . . . . $83,333 $2,115,200 $758,000 $2,956,533Michael S. Gilliland(3) . . . . . . . . . . . . . . . . . . . . . . . . . . . . . $68,644 — $ 68,644Karl Peterson . . . . . . . . . . . . . . . . . . . . . . . . . . . . . . . . . . . . — — —Gary Kusin . . . . . . . . . . . . . . . . . . . . . . . . . . . . . . . . . . . . . . — — —Timothy Dunn . . . . . . . . . . . . . . . . . . . . . . . . . . . . . . . . . . . — — —Greg Mondre . . . . . . . . . . . . . . . . . . . . . . . . . . . . . . . . . . . . — — —Joe Osnoss . . . . . . . . . . . . . . . . . . . . . . . . . . . . . . . . . . . . . . — — —
(1) The amounts reported in the Stock Awards and Option Awards columns represent the grant date fair value ofthe restricted stock unit award for shares of our common stock and the option to purchase shares of ourcommon stock granted to Mr. Kellner during Fiscal 2013, computed in accordance with ASC 718, disregardingthe impact of estimated forfeitures. The assumptions used in calculating the grant date fair value of the stockoption reported in the Option Awards column are set forth in Note 17, Options and Other Equity-BasedAwards, to the audited consolidated financial statements included elsewhere in this prospectus. The amountreported in this column reflects the accounting cost for this stock-based award, and does not correspond to theactual economic value that may be received by him from this award. None of the other non-employee membersof our board of directors were granted stock or option awards during Fiscal 2013.
(2) The following table sets forth information on the restricted stock unit award for shares of our common stockand the option to purchase shares of our common stock granted to Mr. Kellner in Fiscal 2013 and theaggregate number of shares of the common stock of Sabre Corporation subject to outstanding stock andoption awards held at December 31, 2013 by the non-employee members of our board of directors. Exceptfor Messrs. Kellner and Gilliland, none of the non-employee members of our board of directors heldrestricted stock unit award for shares of our common stock or options to purchase shares of our commonstock as of December 31, 2013.
Director Name Grant Date
Number of SharesSubject to Stockor Option Award
Grant Date FairValue of Stock or
Option Award
Number of SharesUnderlying Stock
and Option AwardsHeld as of
December 31, 2013
Lawrence W. Kellner . . . . . . 08/30/201308/30/2013
160,000200,000
$2,115,200$ 758,000
150,000(a)
200,000(b)
Michael S. Gilliland . . . . . . . — — — (c)
Karl Peterson . . . . . . . . . . . . . — — — —Gary Kusin . . . . . . . . . . . . . . — — — —Timothy Dunn . . . . . . . . . . . . — — — —Greg Mondre . . . . . . . . . . . . . — — — —Joe Osnoss . . . . . . . . . . . . . . . — — — —
(a) As of December 31, 2013, this restricted stock unit award for shares of our common stock wasunvested as to 150,000 shares of common stock
(b) As of December 31, 2013, this option to purchase shares of our common stock was exercisable as to12,500 shares of common stock.
(c) Mr. Gilliland’s outstanding equity awards as of December 31, 2013 are described in detail under“Fiscal 2013 Outstanding Equity Awards at Year-End Table” above.
237
(3) Upon his retirement as our CEO, Mr. Gilliland agreed to continue to serve as a member of our board ofdirectors. For this service, he is eligible to receive an annual cash retainer in the amount of $250,000 peryear, with such payment commencing on September 21, 2013.
The non-employee members of our board of directors are reimbursed for their reasonable travel and otherout-of-pocket expenses in attending board of directors’ and board committee meetings.
New Director Compensation Program
In connection with this offering, our board of directors adopted a formal compensation program for the non-employee members of our board of directors (other than our chairman) who are also not employees of TPG orSilver Lake. This compensation program consists of the following elements:
Type of Compensation Dollar Value of Board Compensation
Annual Retainer . . . . . . . . . . . . . . . . . . . . . . . . . . . . . . . . $75,000, paid quarterlyAudit Committee chairman . . . . . . . . . . . . . . . . . . . . . . . additional $20,000 annuallyCompensation Committee chairman . . . . . . . . . . . . . . . . additional $10,000 annuallyGovernance & Nominating Committee chairman . . . . . . additional $10,000 annuallyAudit Committee member . . . . . . . . . . . . . . . . . . . . . . . . additional $10,000 annually
In addition, the non-employee members of our board of directors are also eligible to receive a one-timerestricted stock unit award with a grant date value of $400,000 in connection with their appointment to the board,which vests ratably over four years from the date of grant and, starting on the first anniversary of their service asa non-employee director, an annual restricted stock unit award with a grant date value of $150,000, which willvest in full on the first anniversary of the date of grant. Our current chairman is compensated under a separateprogram. He receives an annual retainer of $250,000, payable quarterly in arrears and receives no additional feesfor being a committee chairman or member. Additionally, he received a restricted stock unit award and optiongrant when he joined our board of directors in August 2013, which is described in detail under the “Fiscal 2013Director Compensation Table” above. Our current chairman will not receive the one-time restricted stock unitaward being given to new directors but, in the future, will be eligible for the annual restricted stock unit awardwith a grant date value of $150,000.
238
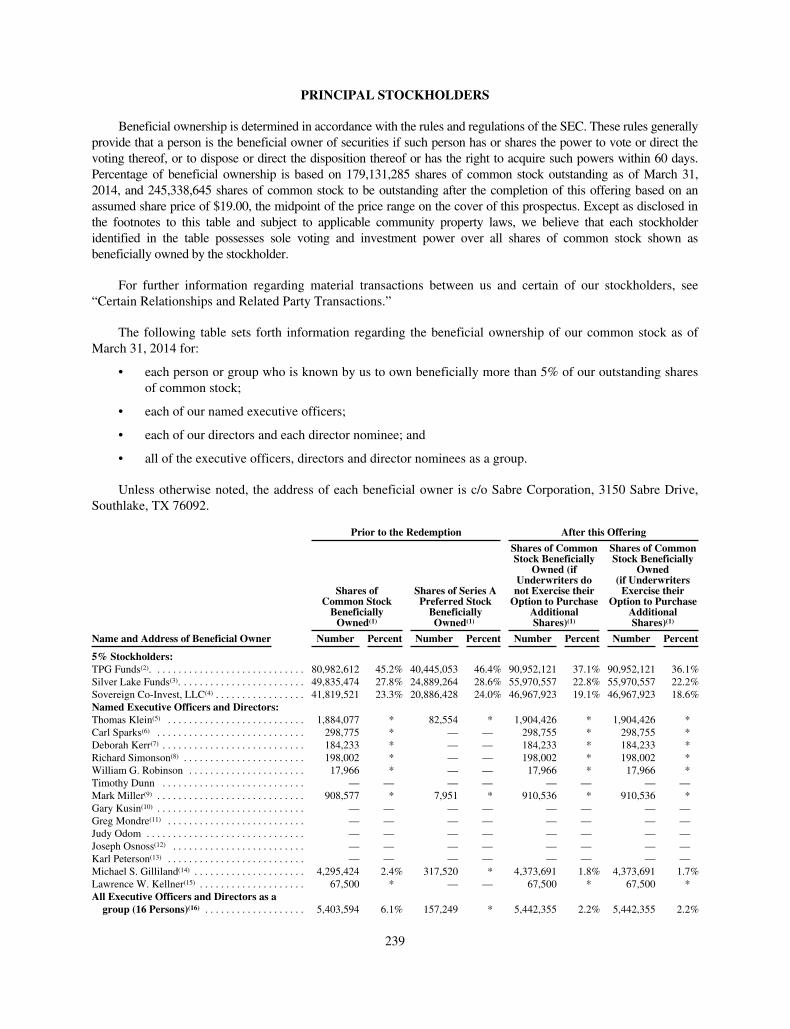
PRINCIPAL STOCKHOLDERS
Beneficial ownership is determined in accordance with the rules and regulations of the SEC. These rules generallyprovide that a person is the beneficial owner of securities if such person has or shares the power to vote or direct thevoting thereof, or to dispose or direct the disposition thereof or has the right to acquire such powers within 60 days.Percentage of beneficial ownership is based on 179,131,285 shares of common stock outstanding as of March 31,2014, and 245,338,645 shares of common stock to be outstanding after the completion of this offering based on anassumed share price of $19.00, the midpoint of the price range on the cover of this prospectus. Except as disclosed inthe footnotes to this table and subject to applicable community property laws, we believe that each stockholderidentified in the table possesses sole voting and investment power over all shares of common stock shown asbeneficially owned by the stockholder.
For further information regarding material transactions between us and certain of our stockholders, see“Certain Relationships and Related Party Transactions.”
The following table sets forth information regarding the beneficial ownership of our common stock as ofMarch 31, 2014 for:
• each person or group who is known by us to own beneficially more than 5% of our outstanding sharesof common stock;
• each of our named executive officers;
• each of our directors and each director nominee; and
• all of the executive officers, directors and director nominees as a group.
Unless otherwise noted, the address of each beneficial owner is c/o Sabre Corporation, 3150 Sabre Drive,Southlake, TX 76092.
Name and Address of Beneficial Owner
Prior to the Redemption After this Offering
Shares ofCommon Stock
BeneficiallyOwned(1)
Shares of Series APreferred Stock
BeneficiallyOwned(1)
Shares of CommonStock Beneficially
Owned (ifUnderwriters donot Exercise their
Option to PurchaseAdditionalShares)(1)
Shares of CommonStock Beneficially
Owned(if Underwriters
Exercise theirOption to Purchase
AdditionalShares)(1)
Number Percent Number Percent Number Percent Number Percent
5% Stockholders:TPG Funds(2). . . . . . . . . . . . . . . . . . . . . . . . . . . . . 80,982,612 45.2% 40,445,053 46.4% 90,952,121 37.1% 90,952,121 36.1%Silver Lake Funds(3). . . . . . . . . . . . . . . . . . . . . . . . 49,835,474 27.8% 24,889,264 28.6% 55,970,557 22.8% 55,970,557 22.2%Sovereign Co-Invest, LLC(4) . . . . . . . . . . . . . . . . . 41,819,521 23.3% 20,886,428 24.0% 46,967,923 19.1% 46,967,923 18.6%Named Executive Officers and Directors:Thomas Klein(5) . . . . . . . . . . . . . . . . . . . . . . . . . . 1,884,077 * 82,554 * 1,904,426 * 1,904,426 *Carl Sparks(6) . . . . . . . . . . . . . . . . . . . . . . . . . . . . 298,775 * — — 298,755 * 298,755 *Deborah Kerr(7) . . . . . . . . . . . . . . . . . . . . . . . . . . . 184,233 * — — 184,233 * 184,233 *Richard Simonson(8) . . . . . . . . . . . . . . . . . . . . . . . 198,002 * — — 198,002 * 198,002 *William G. Robinson . . . . . . . . . . . . . . . . . . . . . . 17,966 * — — 17,966 * 17,966 *Timothy Dunn . . . . . . . . . . . . . . . . . . . . . . . . . . . — — — — — — — —Mark Miller(9) . . . . . . . . . . . . . . . . . . . . . . . . . . . . 908,577 * 7,951 * 910,536 * 910,536 *Gary Kusin(10) . . . . . . . . . . . . . . . . . . . . . . . . . . . . — — — — — — — —Greg Mondre(11) . . . . . . . . . . . . . . . . . . . . . . . . . . — — — — — — — —Judy Odom . . . . . . . . . . . . . . . . . . . . . . . . . . . . . . — — — — — — — —Joseph Osnoss(12) . . . . . . . . . . . . . . . . . . . . . . . . . — — — — — — — —Karl Peterson(13) . . . . . . . . . . . . . . . . . . . . . . . . . . — — — — — — — —Michael S. Gilliland(14) . . . . . . . . . . . . . . . . . . . . . 4,295,424 2.4% 317,520 * 4,373,691 1.8% 4,373,691 1.7%Lawrence W. Kellner(15) . . . . . . . . . . . . . . . . . . . . 67,500 * — — 67,500 * 67,500 *All Executive Officers and Directors as a
group (16 Persons)(16) . . . . . . . . . . . . . . . . . . . 5,403,594 6.1% 157,249 * 5,442,355 2.2% 5,442,355 2.2%
239
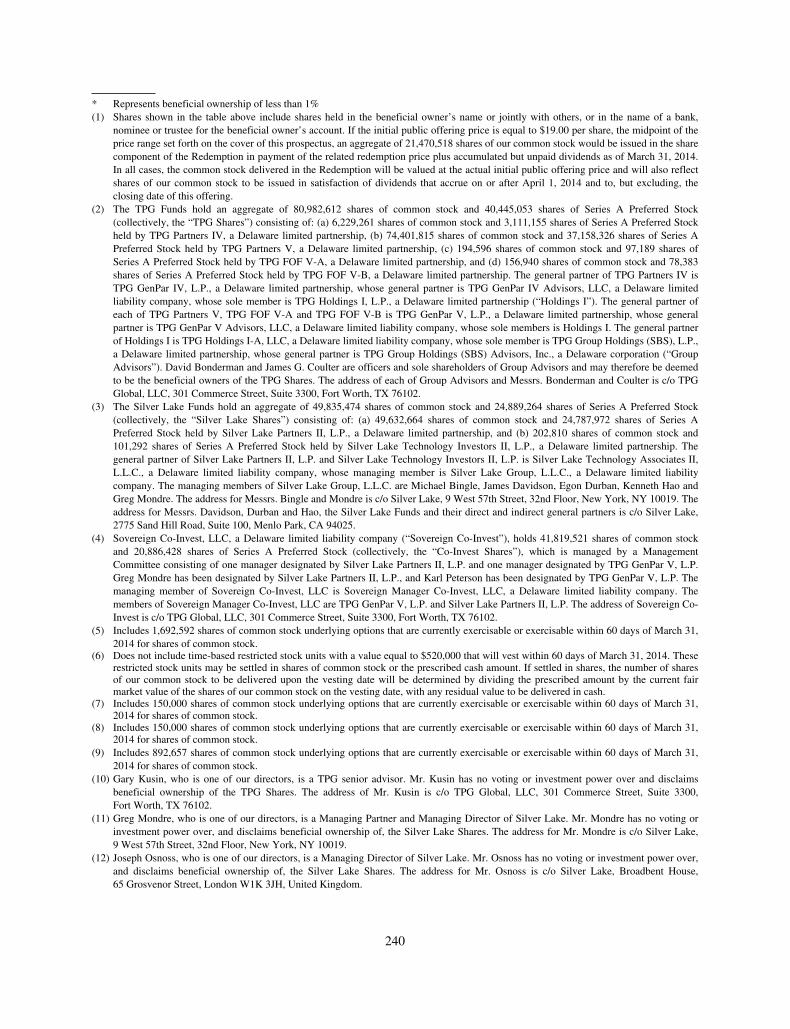
* Represents beneficial ownership of less than 1%(1) Shares shown in the table above include shares held in the beneficial owner’s name or jointly with others, or in the name of a bank,
nominee or trustee for the beneficial owner’s account. If the initial public offering price is equal to $19.00 per share, the midpoint of theprice range set forth on the cover of this prospectus, an aggregate of 21,470,518 shares of our common stock would be issued in the sharecomponent of the Redemption in payment of the related redemption price plus accumulated but unpaid dividends as of March 31, 2014.In all cases, the common stock delivered in the Redemption will be valued at the actual initial public offering price and will also reflectshares of our common stock to be issued in satisfaction of dividends that accrue on or after April 1, 2014 and to, but excluding, theclosing date of this offering.
(2) The TPG Funds hold an aggregate of 80,982,612 shares of common stock and 40,445,053 shares of Series A Preferred Stock(collectively, the “TPG Shares”) consisting of: (a) 6,229,261 shares of common stock and 3,111,155 shares of Series A Preferred Stockheld by TPG Partners IV, a Delaware limited partnership, (b) 74,401,815 shares of common stock and 37,158,326 shares of Series APreferred Stock held by TPG Partners V, a Delaware limited partnership, (c) 194,596 shares of common stock and 97,189 shares ofSeries A Preferred Stock held by TPG FOF V-A, a Delaware limited partnership, and (d) 156,940 shares of common stock and 78,383shares of Series A Preferred Stock held by TPG FOF V-B, a Delaware limited partnership. The general partner of TPG Partners IV isTPG GenPar IV, L.P., a Delaware limited partnership, whose general partner is TPG GenPar IV Advisors, LLC, a Delaware limitedliability company, whose sole member is TPG Holdings I, L.P., a Delaware limited partnership (“Holdings I”). The general partner ofeach of TPG Partners V, TPG FOF V-A and TPG FOF V-B is TPG GenPar V, L.P., a Delaware limited partnership, whose generalpartner is TPG GenPar V Advisors, LLC, a Delaware limited liability company, whose sole members is Holdings I. The general partnerof Holdings I is TPG Holdings I-A, LLC, a Delaware limited liability company, whose sole member is TPG Group Holdings (SBS), L.P.,a Delaware limited partnership, whose general partner is TPG Group Holdings (SBS) Advisors, Inc., a Delaware corporation (“GroupAdvisors”). David Bonderman and James G. Coulter are officers and sole shareholders of Group Advisors and may therefore be deemedto be the beneficial owners of the TPG Shares. The address of each of Group Advisors and Messrs. Bonderman and Coulter is c/o TPGGlobal, LLC, 301 Commerce Street, Suite 3300, Fort Worth, TX 76102.
(3) The Silver Lake Funds hold an aggregate of 49,835,474 shares of common stock and 24,889,264 shares of Series A Preferred Stock(collectively, the “Silver Lake Shares”) consisting of: (a) 49,632,664 shares of common stock and 24,787,972 shares of Series APreferred Stock held by Silver Lake Partners II, L.P., a Delaware limited partnership, and (b) 202,810 shares of common stock and101,292 shares of Series A Preferred Stock held by Silver Lake Technology Investors II, L.P., a Delaware limited partnership. Thegeneral partner of Silver Lake Partners II, L.P. and Silver Lake Technology Investors II, L.P. is Silver Lake Technology Associates II,L.L.C., a Delaware limited liability company, whose managing member is Silver Lake Group, L.L.C., a Delaware limited liabilitycompany. The managing members of Silver Lake Group, L.L.C. are Michael Bingle, James Davidson, Egon Durban, Kenneth Hao andGreg Mondre. The address for Messrs. Bingle and Mondre is c/o Silver Lake, 9 West 57th Street, 32nd Floor, New York, NY 10019. Theaddress for Messrs. Davidson, Durban and Hao, the Silver Lake Funds and their direct and indirect general partners is c/o Silver Lake,2775 Sand Hill Road, Suite 100, Menlo Park, CA 94025.
(4) Sovereign Co-Invest, LLC, a Delaware limited liability company (“Sovereign Co-Invest”), holds 41,819,521 shares of common stockand 20,886,428 shares of Series A Preferred Stock (collectively, the “Co-Invest Shares”), which is managed by a ManagementCommittee consisting of one manager designated by Silver Lake Partners II, L.P. and one manager designated by TPG GenPar V, L.P.Greg Mondre has been designated by Silver Lake Partners II, L.P., and Karl Peterson has been designated by TPG GenPar V, L.P. Themanaging member of Sovereign Co-Invest, LLC is Sovereign Manager Co-Invest, LLC, a Delaware limited liability company. Themembers of Sovereign Manager Co-Invest, LLC are TPG GenPar V, L.P. and Silver Lake Partners II, L.P. The address of Sovereign Co-Invest is c/o TPG Global, LLC, 301 Commerce Street, Suite 3300, Fort Worth, TX 76102.
(5) Includes 1,692,592 shares of common stock underlying options that are currently exercisable or exercisable within 60 days of March 31,2014 for shares of common stock.
(6) Does not include time-based restricted stock units with a value equal to $520,000 that will vest within 60 days of March 31, 2014. Theserestricted stock units may be settled in shares of common stock or the prescribed cash amount. If settled in shares, the number of sharesof our common stock to be delivered upon the vesting date will be determined by dividing the prescribed amount by the current fairmarket value of the shares of our common stock on the vesting date, with any residual value to be delivered in cash.
(7) Includes 150,000 shares of common stock underlying options that are currently exercisable or exercisable within 60 days of March 31,2014 for shares of common stock.
(8) Includes 150,000 shares of common stock underlying options that are currently exercisable or exercisable within 60 days of March 31,2014 for shares of common stock.
(9) Includes 892,657 shares of common stock underlying options that are currently exercisable or exercisable within 60 days of March 31,2014 for shares of common stock.
(10) Gary Kusin, who is one of our directors, is a TPG senior advisor. Mr. Kusin has no voting or investment power over and disclaimsbeneficial ownership of the TPG Shares. The address of Mr. Kusin is c/o TPG Global, LLC, 301 Commerce Street, Suite 3300,Fort Worth, TX 76102.
(11) Greg Mondre, who is one of our directors, is a Managing Partner and Managing Director of Silver Lake. Mr. Mondre has no voting orinvestment power over, and disclaims beneficial ownership of, the Silver Lake Shares. The address for Mr. Mondre is c/o Silver Lake,9 West 57th Street, 32nd Floor, New York, NY 10019.
(12) Joseph Osnoss, who is one of our directors, is a Managing Director of Silver Lake. Mr. Osnoss has no voting or investment power over,and disclaims beneficial ownership of, the Silver Lake Shares. The address for Mr. Osnoss is c/o Silver Lake, Broadbent House,65 Grosvenor Street, London W1K 3JH, United Kingdom.
240

(13) Karl Peterson, who is one of our directors, is a TPG Partner. Mr. Peterson has no voting or investment power over and disclaimsbeneficial ownership of the TPG Shares. The address of Mr. Peterson is c/o TPG Global, LLC, 301 Commerce Street, Suite 3300, FortWorth, TX 76102.
(14) Includes 3,659,675 shares of common stock underlying options that are currently exercisable or exercisable within 60 days of March 31,2014 for shares of common stock.
(15) Includes 37,500 shares of common stock underlying options that are currently exercisable or exercisable within 60 days of March 31,2014 for shares of common stock.
(16) Includes 4,618,422 shares of common stock underlying options that are currently exercisable or exercisable within 60 days of March 31,2014 for shares of common stock.
241
CERTAIN RELATIONSHIPS AND RELATED PARTY TRANSACTIONS
The following is a summary of material provisions of various transactions we have entered into with ourexecutive officers, board members or 5% or greater stockholders and their affiliates since January 1, 2011. Webelieve the terms and conditions in these agreements are reasonable and customary for transactions of these types.
In connection with this offering, we have adopted a written related party transaction policy. Pursuant to thispolicy, the audit committee of the board of directors will be responsible for evaluating each related partytransaction and determining whether the transaction is fair, reasonable and within our policy, and whether itshould be ratified or approved. The audit committee, in evaluating a transaction, will consider various factors,including the benefit of the transaction to us, the terms of the transaction and whether they are at arm’s-lengthand in the ordinary course of our business, the direct or indirect nature of the related party’s interest in thetransaction, the size and expected term of the transaction and other facts and circumstances that bear on themateriality of the related party transaction under applicable law and listing standards. If less than a majority ofthe members of the audit committee is qualified to ratify or approve a transaction, the audit committee willsubmit the transaction to the disinterested directors of the board of directors, who will apply the same factors toevaluate, ratify or approve the transaction. The audit committee will review, at least annually, a summary of ourtransactions with our directors and officers and with firms that employ our directors, as well as any other relatedparty transactions.
We did not have a written policy regarding the review and approval of related person transactionsimmediately prior to this offering. Nevertheless, with respect to such transactions, it was our policy for our boardof directors to consider the nature of and business reason for such transactions, how the terms of suchtransactions compared to those which might be obtained from unaffiliated third parties and whether suchtransactions were otherwise fair to and in the best interests of, or not contrary to, our best interests.
Stockholders’ Agreement
On March 30, 2007, we entered into a Stockholders’ Agreement with the Silver Lake Funds, the TPG Funds andthe Sovereign Co-Invest, which will be amended and restated in connection with the completion of this offering.
The Stockholders’ Agreement will provide that the Silver Lake Funds and the TPG Funds will have certainnomination rights to designate candidates for nomination to our board of directors and, subject to any restrictionsunder applicable law or the NASDAQ rules, the ability to appoint members to each board committee.
As set forth in the Stockholders’ Agreement, for so long as the Silver Lake Funds collectively own at least22 million shares of our common stock, they will be entitled to designate for nomination two of the seats on ourboard of directors. Thereafter, the Silver Lake Funds will be entitled to designate for nomination one director solong as they own at least 7 million shares of our common stock. Further, for so long as the TPG Fundscollectively own at least 44 million shares of our common stock, they will be entitled to designate for nominationthree of the seats on our board of directors. When the TPG Funds collectively own less than 22 million shares ofour common stock, but at least 7 million shares of our common stock, the TPG Funds will be entitled todesignate for nomination two directors. Thereafter, the TPG Funds will be entitled to designate for nominationone director so long as they own at least 7 million shares of our common stock.
In addition, the Silver Lake Funds and the TPG Funds also jointly have the right to designate for nominationone additional director (the “Joint Designee”), who must qualify as independent under the NASDAQ rules andmust meet the independence requirements of Rule 10A-3 of the Exchange Act, so long as they collectively ownat least 10% of their collective share of our common stock held by them at the closing of this offering (the“Closing Date Shares”). However, if the Silver Lake Funds and the TPG Funds collectively own at least 10% oftheir collective Closing Date Shares and either individually owns less than 5% of its individual Closing DateShares, then the Joint Designee shall be designated for nomination solely by the entity that owns more than 5%of its individual Closing Date Shares.
242
We are required, to the extent permitted by applicable law, to take all necessary action (as defined in theStockholders’ Agreement) to cause the board of directors and the governance and nominating committee toinclude such persons designated by the Silver Lake Funds or the TPG Funds, as applicable, in the slate of directornominees recommended by the board of directors for election by the stockholders and solicit proxies andconsents in favor of such director nominees. Subject to the terms of the Stockholders’ Agreement, each PrincipalStockholder agrees to vote its shares in favor of the election of the director nominees designated by the SilverLake Funds and the TPG Funds.
In accordance with the Stockholders’ Agreement, the TPG Funds have appointed Mr. Dunn, Mr. Kusin andMr. Peterson to our board of directors and the Silver Lake Funds has appointed Mr. Mondre and Mr. Osnoss toour board of directors.
In addition, the Stockholders’ Agreement will contain agreements among the parties, including with respectto transfer restrictions, tag-along rights, drag-along rights and rights of first refusal. The Stockholders’Agreement also will provide that, so long as the Silver Lake Funds and the TPG Funds collectively own at least40% of their collective Closing Date Shares, approval of at least a majority of the board of directors, including atleast one director nominated for designation by the Silver Lake Funds and one director nominated by the TPGFunds must be obtained before we are permitted to take any of the following actions:
• any merger, consolidation or sale of all or substantially all of the assets of the company or any of itssubsidiaries;
• any voluntary liquidation, winding up or dissolution of the company or any of its subsidiaries or theinitiation of any actions related to a voluntary bankruptcy, reorganization or recapitalization of thecompany or any of its subsidiaries;
• acquisitions or dispositions, or a related series of acquisitions or dispositions, of assets with a value inexcess of $50 million or the entering into of a joint venture requiring a capital contribution in excess of$50 million by either the company or any of its subsidiaries;
• any fundamental change in the company’s or its subsidiaries’ existing lines of business or the entry bythe company or any of its subsidiaries into a new significant line of business;
• any amendment to the Certificate of Incorporation or Bylaws of the company or Sabre Holdings;
• incurrence by the company or any of its subsidiaries of any indebtedness or derivatives liability, or anyseries of indebtedness or derivative liabilities in an aggregate amount in excess of $150 million oramending in any material respect the terms of existing or future indebtedness or derivatives liability inexcess of $150 million; and
• hiring and termination of our CEO.
In the case of a vacancy on our board of directors created by the removal or resignation of a directordesignated by the Silver Lake Funds or the TPG Funds, as applicable, the Stockholders’ Agreement will requireus to nominate an individual designated by such entity for election to fill the vacancy.
Registration Rights Agreement
On March 30, 2007, we entered into a registration rights agreement with the TPG Funds, the Silver LakeFunds and the Sovereign Co-Invest, which will be amended and restated in connection with the completion ofthis offering. This registration rights agreement will provide the Silver Lake Funds and the TPG Funds withdemand and shelf registration rights following the expiration of the 180-day lock-up period and the SovereignCo-Invest with the right to participate in such demand and shelf registrations. In addition, the registration rightsagreement also will provide the Principal Stockholders with piggyback registration rights on any registrationstatement, other than on Forms S-4, S-8 or any other successor form, to be filed by the company. Theseregistration rights are subject to certain conditions and limitations, including the right of the underwriters to limitthe number of shares to be included in a registration statement and our right to delay a registration statementunder certain circumstances.
243

Under the registration rights agreement, we will agree to pay certain expenses related to any such registrationto indemnify the Principal Stockholders against certain liabilities that may arise under the Securities Act.
Directors
Prior to our initial public offering, our directors (other than Messrs. Kellner and Kusin and Ms. Odom) werenot compensated for their services as directors. For additional information on the compensation provided to ourboard of directors, see “Compensation Discussion and Analysis—Director Compensation.”
Management Services Agreement
On March 30, 2007, we entered into an MSA with affiliates of TPG and Silver Lake (the “Managers”) toprovide us with management, advisory and consulting services. Pursuant to the MSA, we have been required topay to the Managers management fees, payable quarterly in arrears, totaling to between $5 million to $7 millionper year, the actual amount of which is calculated based upon 1% of Adjusted EBITDA, as defined in the MSA,earned by the company in such fiscal year up to a maximum of $7 million. During the years ended December 31,2013, 2012 and 2011, the annual management fee paid to the Managers was $7 million, $7 million and $7million, respectively. Additionally, we reimburse the Managers for all out-of-pocket expenses incurred by themor their affiliates in connection with services provided to us pursuant to the MSA. For the years endedDecember 31, 2013 and 2012 the amount reimbursed in expenses was $2 million and $1 million, respectively.For the year ended December 31, 2011, the amount reimbursed in expenses was not material. In connection withthe completion of this offering, the Managers are entitled to a fee payable pursuant to the MSA in an amountequal to, in the aggregate, $21 million plus other unpaid fees and expenses and, thereafter, the MSA will beterminated. The MSA includes customary exculpation and indemnification provisions in favor of the affiliates ofTPG and Silver Lake.
Management Stockholders’ Agreement
We and certain stockholders, including certain executive officers and directors, have entered into amanagement stockholders agreement (the “Management Stockholders’ Agreement”). The ManagementStockholders’ Agreement contains certain agreements among the parties including with respect to call rights incertain specified situations for shares of common stock then-currently owned, drag along rights and tag alongrights. Pursuant to the Management Stockholders’ Agreement, certain stockholders, which group of stockholdersexcludes our Principal Stockholders, have also agreed not to transfer, sell, assign, pledge, hypothecate orencumber any of the shares of common stock then-currently owned by such stockholder (which can be waived byus at our option at any time), subject to certain limited exceptions, at any time prior to the termination of suchManagement Stockholders’ Agreement. In addition, the Management Stockholders’ Agreement provides theseinvestors with piggyback registration rights to participate on a pro rata basis in any registered offering in whichthe TPG Funds or the Silver Lake Funds are registering shares of common stock. Except with respect to thepiggyback registration rights described immediately prior, the Management Stockholders’ Agreement terminatesif our common stock is registered and if at least 20% of our total outstanding common stock trades regularly in,on or through the facilities of a securities exchange and/or inter-dealer quotation system or any designatedoffshore securities market, which conditions are expected to be met in connection with the completion of thisoffering, assuming we sell the total number of shares set forth on the cover of this prospectus at an initial publicoffering price equal to the midpoint of the price range set forth on the cover of this prospectus and that theunderwriters exercise their option to purchase additional shares of common stock. However, if there is a changein the total number of shares to be sold in the offering or in the initial public offering price, in each case ascompared to the figures set forth on the cover of this prospectus, or if the underwriters do not exercise theiroption to purchase additional shares, the Management Stockholders’ Agreement may not terminate. If theManagement Stockholders’ Agreement does not terminate, the transfer restrictions contained therein wouldcontinue to be applicable.
244
Tax Receivable Agreement
Following our initial public offering, we expect to be able to utilize the Pre-IPO Tax Assets, which aroseprior to the initial public offering and are therefore attributable to our Existing Stockholders. These Pre-IPO TaxAssets will reduce the amount of tax that we and our subsidiaries would otherwise be required to pay in thefuture. See “Risk Factors—We will be required to pay our Existing Stockholders 85% of certain tax benefitsrelated to Pre-IPO Tax Assets, and could be required to make substantial cash payments in which thestockholders purchasing shares in this offering will not participate.”
Immediately prior to the completion of this offer, we will enter into the TRA, and thereby distribute to ourExisting Stockholders the right to receive payment by us of 85% of the amount of cash savings, if any, in U.S.federal income tax that we and our subsidiaries realize (or are deemed to realize in the case of a change of controlor certain other transactions, as discussed below) as a result of the utilization of our and our subsidiaries’ Pre-IPOTax Assets. In addition, we will pay interest on the payments we will make to the Existing Shareholders withrespect to the amount of this cash savings from the due date (without extensions) of our tax return where werealize this savings to the payment date at a rate equal to LIBOR plus 1.00% per annum. Different timing ruleswill apply to payments under the TRA to be made to Award Holders. Such payments will generally be deemedinvested in a notional account rather than made on the scheduled payment dates, and the account will bedistributed on the fifth anniversary of the initial public offering, together with an amount equal to the net presentvalue of such Award Holder’s future expected payments, if any, under the TRA. Moreover, payments to holdersof stock options that are unvested prior to the completion of this offering will be subject to vesting on the sameschedule as such holder’s unvested stock options.
For purposes of the TRA, cash savings in income tax are computed by reference to the reduction in theliability for income taxes resulting from the utilization of the tax benefits subject to the TRA. The term of theTRA will commence upon consummation of our initial public offering and will continue until there is nopotential for any future tax benefit payments.
Our counterparties under the TRA will not reimburse us for any payments previously made if such taxbenefits are subsequently disallowed (although future payments would be adjusted to the extent possible toreflect the result of such disallowance). As a result, in such circumstances we could make payments under theTRA that are greater than our actual cash tax savings.
While the actual amount and timing of any payments under the TRA will vary depending upon a number offactors, including the amount and timing of the taxable income we and our subsidiaries generate in the future,and our and our subsidiaries’ use of Pre-IPO Tax Assets, we expect that, during the term of the TRA, thepayments that we may make could be material. Based on current tax laws and assuming that we and oursubsidiaries earn sufficient taxable income to realize the full tax benefits subject to the TRA, (i) we expect thatpayments under the TRA relating to the Pre-IPO Tax Assets could aggregate to approximately $330 million to$380 million over the next six years (assuming no changes in current limitations on our ability to utilize ourNOLs under Section 382 of the Code), which we estimate will represent approximately 85% to 95% of the totalpayments we will be required to make under the TRA and (ii) we do not expect material payments to occurbefore 2016.
Upon the effective date of the TRA, we expect to recognize a liability of between $310 million and $350million (after considering the valuation allowance of approximately $72 million recorded against the Pre-IPOTax Assets) for the payments to be made under the TRA, which will be accounted for as a reduction of additionalpaid-in capital on our consolidated balance sheet. Any future changes in the utility of the Pre-IPO Tax Assets willimpact the amount of the liability that will be paid to our Existing Stockholders. Changes in the utility of thesePre-IPO Tax Assets will be recorded in income tax expense (benefit) and any changes in the obligation under theTRA will be recorded in other income (expense). We plan to use cash flow from operations and availabilityunder our credit facilities to fund this obligation.
245
If we undergo a Change of Control, the TRA will terminate and we will be required to make a paymentequal to the present value of future payments under the TRA, which payment would be based on certainassumptions, including those relating to our and our subsidiaries’ future taxable income. Additionally, if we sellor otherwise dispose of any of our subsidiaries in a transaction that is not a Change of Control, we will berequired to make a payment equal to the present value of future payments under the TRA attributable to the Pre-IPO Tax Assets of such subsidiary that is sold or disposed of, applying the assumptions described above.
The TRA provides that in the event that we breach any of our material obligations under it, whether as aresult of our failure to make any payment when due (subject to a specified cure period), failure to honor anyother material obligation under it or by operation of law as a result of the rejection of it in a case commencedunder the United States Bankruptcy Code or otherwise, then all our payment and other obligations under theTRA will be accelerated and will become due and payable applying the same assumptions described above. Suchpayments could be substantial and could exceed our actual cash tax savings under the TRA.
Certain transactions by the company could cause it to recognize taxable income (possibly material amountsof income) without a current receipt of cash. Payments under the TRA with respect to such taxable income wouldcause a net reduction in our available cash. For example, transactions giving rise to cancellation of debt income,the accrual of income from original issue discount or deferred payments, a “triggering event” requiring therecapture of dual consolidated losses, or “Subpart F” income would each produce income with no correspondingincrease in cash. In these cases, we may use some of the Pre-IPO Tax Assets to offset income from thesetransaction and, under the TRA, would be required to make a payment to our Existing Stockholders even thoughwe receive no cash from such income.
Because we are a holding company with no operations of our own, our ability to make payments under theTRA is dependent on the ability of our subsidiaries to make distributions to us. To the extent that we are unableto make payments under the TRA for specified reasons, such payments will be deferred and will accrue interestat a rate of LIBOR plus 1.00% per annum until paid.
In the event that any determinations must be made under or any dispute arises involving the TRA, theExisting Stockholders will be represented by a shareholder representative that is an entity controlled by the TPGFunds and the Silver Lake Funds. In any such instance, should any representatives of the TPG Funds and theSilver Lake Funds then be serving on our board of directors, such directors will be excluded from decisions ofthe board related to the relevant determination or dispute.
The TRA is filed as an exhibit to the registration statement of which this prospectus forms a part, and theforegoing description of the TRA is qualified by a reference thereto.
Abacus
In February 1998, we acquired a 35% interest in Abacus, which is a joint venture between Sabre and AbacusInternational Holdings, a consortium of eleven Asian airlines. Abacus distributes a GDS in Asia, using GDStechnology that we license to Abacus for its exclusive use in Asia. We also operate that GDS technology, andperform associated applications maintenance and development services, on behalf of Abacus. Our related partytransactions with Abacus are summarized and presented in the table below.
Year Ended December 31,
2013 2012 2011
(Amounts in thousands)
Revenue earned from Abacus . . . . . . . . . . . . . . . . . . . . . . . . . . . . $91,998 $71,957 $52,073
246

December 31,
2013 2012
(Amounts in thousands)
Receivable from Abacus . . . . . . . . . . . . . . . . . . . . . . . . . . . $ 29,377 $ 13,939Payable to Abacus for Economic Benefit Transfer . . . . . . (8,648) (8,452)Current deferred revenue related to Abacus data
processing . . . . . . . . . . . . . . . . . . . . . . . . . . . . . . . . . . . . (2,571) (2,571)Long-term deferred revenue related to Abacus data
processing . . . . . . . . . . . . . . . . . . . . . . . . . . . . . . . . . . . . (12,857) (15,428)
Related party receivable (liability), net . . . . . . . . . . . . . . . $ 5,301 $(12,512)
For additional information on our related party transactions with Abacus, see Note 6, Equity MethodInvestment’s, to our audited consolidated financial statements.
Certain Relationships
From time to time, we do business with other companies affiliated with the Principal Stockholders. Webelieve that all such arrangements have been entered into in the ordinary course of business and have beenconducted on an arms-length basis.
247
DESCRIPTION OF CAPITAL STOCK
The following is a description of the material terms of our third amended and restated certificate ofincorporation (the “Certificate of Incorporation”) and second amended and restated bylaws (the “Bylaws”) asthey are in effect upon completion of this offering. This description may not contain all of the information that isimportant to you. To understand them fully, you should read our Certificate of Incorporation and Bylaws, copiesof which are filed with the SEC as exhibits to the registration statement of which this prospectus is a part, as wellas the relevant portions of the Delaware General Corporation Law, as amended (“DGCL”).
For purposes of calculating the Principal Stockholders’ share ownership thresholds described under“—Anti-Takeover Effects of Provisions of Our Certificate of Incorporation and Our Bylaws”, the shares ofcommon stock owned by the Sovereign Co-Invest will be deemed to be owned by the Principal Stockholders forpurposes of such calculations so long as these shares are owned directly by the Sovereign Co-Invest or themanaging member of the Sovereign Co-Invest has been granted a proxy for purposes of voting such shares.
Common Stock
General. Our Certificate of Incorporation will authorize the issuance of up to 1 billion shares of commonstock, par value $0.01. On March 31, 2014, there were 179,131,285 shares of common stock outstanding. Afterthis offering, there will be 245,338,645 shares of our common stock outstanding, or 252,049,171 shares if theunderwriters exercise their option to purchase additional shares in full. None of our outstanding common stockhas been designated as non-voting.
Voting Rights. Holders of common stock are entitled to one vote for each share held on all matters submittedto a vote of stockholders and do not have cumulative voting rights. Accordingly, holders of a majority of theshares of common stock entitled to vote in any election of directors may elect all of the directors standing forelection. Except for the election of directors, if a quorum is present, an action on a matter is approved if the votescast favoring the action or matter exceed the votes cast against the action or matter, unless the vote of a greaternumber is required by applicable law, the DGCL, our Certificate of Incorporation or our Bylaws. The election ofdirectors will be determined by a plurality of the votes cast in respect of the shares present in person orrepresented by proxy at the meeting and entitled to vote, meaning that the nominees with the greatest number ofvotes cast, even if less than a majority, will be elected. The rights, preferences and privileges of holders ofcommon stock are subject to, and may be impacted by, the rights of the holders of shares of any series ofpreferred stock that we may designate and issue in the future.
Dividends. Subject to preferences of our outstanding Series A Preferred Stock, which will be redeemed inthe Redemption prior to the closing of this offering, and which may be applicable to any other then outstandingpreferred stock, holders of our common stock are entitled to receive ratably those dividends, if any, as may bedeclared by the board of directors out of legally available funds.
Liquidation, Dissolution, and Winding Up. Upon our liquidation, dissolution or winding up, the holders ofour common stock will be entitled to share ratably in the net assets legally available for distribution tostockholders after the payment of all of our debts and other liabilities, subject to the prior rights of any preferredstock then outstanding, including, currently, the Series A Preferred Stock, which will be redeemed in theRedemption prior to the closing of this offering.
Preemptive Rights. Holders of our common stock have no preemptive or conversion rights or othersubscription rights, and there are no redemption or sinking funds provisions applicable to our common stock.
Assessment. All outstanding shares of our common stock are, and the shares of our common stock to beoutstanding upon completion of this offering will be, fully paid and nonassessable.
248
Preferred Stock
Our Certificate of Incorporation will authorize the issuance of up to 225 million shares of preferred stock.Prior to the consummation of this offering, there were 87,184,179 shares of Series A Preferred Stock outstandingas of December 31, 2013, which will be redeemed in the Redemption prior to the closing of this offering.
Under our Certificate of Incorporation, our board of directors may issue additional shares of preferred stock,without stockholder approval, in such series and with such designations, preferences, conversion or other rights,powers, including voting powers, and qualifications, limitations or restrictions thereof, as the board of directorsdeems appropriate. While the board of directors has no current intention of doing so, it could, withoutstockholder approval, issue shares of preferred stock with voting, conversion and other rights that couldadversely affect the voting power and impact other rights of the holders of the common stock. Our board ofdirectors may issue shares of preferred stock as an anti-takeover measure without any further action by theholders of common stock. This may have the effect of delaying, deferring or preventing a change of control ofour company by increasing the number of shares necessary to gain control of the company. Except as describedbelow with respect to the Series A Preferred Stock, our board of directors has not authorized the issuance of anyshares of preferred stock, and we have no agreements or current plans for the issuance of any shares of preferredstock.
Series A Preferred Stock
As of December 31, 2013, there were 87,184,179 shares of our Series A Preferred Stock, par value $0.01 pershare outstanding. Holders of the Series A Preferred Stock have no voting rights except with respect to thecreation of any class or series of capital stock having any preference or priority over the Series A Preferred Stockor the amendment or repeal of any provision of the constituent documents of the company that adversely changesthe powers, preferences or special rights of the Series A Preferred Stock.
Each share of Series A Preferred Stock accumulates dividends at a rate of 6% per annum. Accumulated butunpaid dividends on the Series A Preferred Stock amounted to $134 million and $97 million at December 31,2013 and December 31, 2012, respectively. No dividend or distribution can be declared or paid with respect ofthe common stock or any other series of preferred stock that does not expressly provide that it ranks senior orpari passu with the Series A Preferred Stock, and we cannot redeem, purchase, acquire, or retire for value thecommon stock or any other series of preferred stock that does not expressly provide that it ranks senior or paripassu with the Series A Preferred Stock, and we cannot redeem, unless and until the full amount of any unpaiddividends accrued on the Series A Preferred Stock has been paid or contemporaneously declared and paid.
Holders of the Series A Preferred Stock have the right to require us to repurchase each of their shares ofSeries A Preferred Stock for cash in an amount equal to the stated value per share plus accrued and unpaiddividends upon the occurrence of certain specified liquidation events, including the first underwritten publicoffering and sale of equity securities of the company for cash. For a further description of the liquidity events,see Note 15, Redeemable Preferred Stock, to our audited consolidated financial statements included elsewhere inthis prospectus.
In addition, following an amendment to our Certificate of Incorporation, we will have the right, at ouroption, at any time, to redeem all or part of the Series A Preferred Stock in cash or common stock, or anycombination thereof. As of March 31, 2014, the stated value was $501 million in the aggregate or $5.75 per shareof Series A Preferred Stock, and accrued and unpaid dividends were $143 million in the aggregate or $1.64 pershare of Series A Preferred Stock (the stated value together with accrued and unpaid dividends, the “RedemptionValue”). The actual number of shares issued in the Redemption will be based on the accumulated dividendsthrough the redemption date. Any common stock delivered in connection with a redemption shall be valued atfair market value, as determined by our Board of Directors, except that any shares issued at the time of theclosing of an initial public offering shall be presumed to be valued at the initial offering price to the public.
249

Prior to the closing of this offering, we will exercise our right to redeem all of our Series A Preferred Stock.The redemption price will be paid with a mix of cash and stock, which we will deliver pro rata to the holdersthereof concurrently with the closing of this offering. Assuming we sell the total number of shares set forth onthe cover of this prospectus at an initial public offering price equal to the midpoint of the price range on the coverof this prospectus, we will deliver an estimated aggregate of $235 million in cash and 21,470,518 shares of ourcommon stock in payment of the related redemption price plus accumulated but unpaid dividends as ofMarch 31, 2014. The actual number of shares of common stock and amount of cash that will be used in theRedemption are subject to change based on the initial public offering price and the closing date of this offering.
The Redemption of the Series A Preferred Stock will simplify our capital structure by leaving only one classof capital stock—our common stock—outstanding following the closing of this offering.
Anti-Takeover Effects of Provisions of Our Certificate of Incorporation and Our Bylaws
After the completion of this offering, our Certificate of Incorporation and our Bylaws will containprovisions that may delay, defer or discourage another party from acquiring control of us. We expect that theseprovisions will discourage coercive takeover practices or inadequate takeover bids. These provisions are alsodesigned to encourage persons seeking to acquire control of us to first negotiate with the board of directors,which we believe may result in an improvement of the terms of any such acquisition in favor of our stockholders.However, they may also discourage acquisitions that some stockholders may favor. These provisions include:
Classified Board. Our Certificate of Incorporation will provide that our board of directors will be dividedinto three classes of directors, with the classes as nearly equal in number as possible. As a result, approximatelyone-third of our board of directors will be elected each year. The classification of directors has the effect ofmaking it more difficult for stockholders to change the composition of our board. Our Certificate ofIncorporation will also provide that, subject to any rights of holders of preferred stock to elect additionaldirectors under specified circumstances, the number of directors will be fixed exclusively pursuant to a resolutionadopted by the board of directors, provided that, the board of directors shall consist of not fewer than fivedirectors, nor more than eleven directors; provided, however, prior to the time when the Principal Stockholdersbeneficially own, collectively, less than 40% of the outstanding shares of our common stock, the board ofdirectors shall not consist of more than nine directors. Our board of directors will initially have eight directors.
Authorized but Unissued or Undesignated Capital Stock. Our authorized capital stock will consist of1 billion shares of common stock and, following the Redemption of our Series A Preferred Stock, 225 millionshares of preferred stock. A large quantity of authorized but unissued shares may deter potential takeoverattempts because of the ability of our board of directors to authorize the issuance of some or all of these shares toa friendly party, or to the public, which would make it more difficult for a potential acquirer to obtain control ofus. This possibility may encourage persons seeking to acquire control of us to negotiate first with our board ofdirectors. The authorized but unissued stock may be issued by the board of directors in one or more transactions.In this regard, our Certificate of Incorporation will grant the board of directors broad power to establish the rightsand preferences of authorized and unissued preferred stock. The issuance of shares of preferred stock pursuant tothe board of directors’ authority described above could decrease the amount of earnings and assets available fordistribution to holders of common stock and adversely affect the rights and powers, including voting rights, ofsuch holders and may have the effect of delaying, deferring or preventing a change of control. The preferredstock could also be used in connection with the issuance of a shareholder rights plan, sometimes referred to as a“poison pill.” Our board of directors is able to implement a shareholder rights plan without further action by ourstockholders. The board of directors does not currently intend to seek stockholder approval prior to any issuanceof preferred stock, unless otherwise required by law.
Action by Written Consent. Our Certificate of Incorporation will provide that stockholder action can betaken only at an annual meeting or special meeting of stockholders and cannot be taken by written consent in lieuof a meeting once the Principal Stockholders cease to beneficially own, collectively, more than 40% of theoutstanding shares of our common stock.
250

Special Meetings of Stockholders. Our Certificate of Incorporation will provide that special meetings of ourstockholders may be called only by our board of directors or the chairman of the board of directors; provided,however, at any time when the Principal Stockholders beneficially owns, collectively, at least 40% of theoutstanding shares of our common stock, special meetings of our stockholders may also be called by the board ofdirectors, the chairman of the board of directors or the board of directors or the chairman of the board at therequest of either the Silver Lake Funds or the TPG Funds. Our Bylaws will prohibit the conduct of any businessat a special meeting other than as specified in the notice for such meeting.
Advance Notice Procedures. Our Bylaws will establish advance notice procedures with respect tostockholder proposals and the nomination of candidates for election as directors, other than nominations made byor at the direction of the board of directors. In order for any matter to be “properly brought” before a meeting, astockholder will have to comply with advance notice requirements and provide us with certain information.Generally, to be timely, a stockholder’s notice must be received at our principal executive offices not earlier thanthe opening of business 120 days prior, and not later than the close of business 90 days before, the firstanniversary date of the immediately preceding annual meeting of stockholders. Our Bylaws will also specifyrequirements as to the form and content of a stockholder’s notice. Under our Bylaws, the board of directors mayadopt by resolution the rules and regulations for the conduct of meetings. These advance notice provisions willnot apply to the Silver Lake Funds or the TPG Funds so long as the Stockholders’ Agreement remains in effect.Except to the extent inconsistent with such rules and regulations adopted by the board of directors, the chairmanof the meeting of stockholders shall have the right to adopt rules and regulations for the conduct of meetings,which may have the effect of precluding the conduct of certain business at a meeting if the rules and regulationsare not followed. These provisions may also defer, delay or discourage a potential acquirer from conducting asolicitation of proxies to elect the acquirer’s own slate of directors or otherwise attempting to influence or obtaincontrol of us.
Super Majority Approval Requirements. Our Certificate of Incorporation and Bylaws will provide that theboard of directors is expressly authorized to adopt, make, alter, amend or repeal our Bylaws without astockholder vote in any matter not inconsistent with the laws of the state of Delaware. For as long as thePrincipal Stockholders beneficially own, collectively, at least 40% of the outstanding shares of our commonstock, any adoption, alteration, amendment or repeal of our Bylaws by our stockholders requires the affirmativevote of the holders of a majority of the voting power of our outstanding common stock. At any time when thePrincipal Stockholders beneficially own, collectively, less than 40% of the outstanding shares of our commonstock, any adoption, alteration, amendment, or repeal of our Bylaws by our stockholders requires the affirmativevote of holders of at least 75% of the voting power of our outstanding common stock.
The DGCL provides generally that the affirmative vote of a majority of the outstanding shares then entitledto vote is required to amend a corporation’s certificate of incorporation, unless the certificate of incorporationrequires a greater percentage. Our Certificate of Incorporation will provide that at any time when the PrincipalStockholders beneficially own, collectively, less than 40% of the outstanding shares of our common stock,certain specified provisions in our Certificate of Incorporation, including those relating to actions by writtenconsent of stockholders, calling of special meetings by stockholders, a classified board, the requirements for thenumber and removal of directors and amendment of the Certificate of Incorporation and Bylaws, may beamended only by a vote of at least 75% of the voting power of our outstanding common stock.
The combination of the classification of our board of directors, the lack of cumulative voting and thesupermajority voting requirements will make it more difficult for our existing stockholders to replace our boardof directors as well as for another party to obtain control of us by replacing our board of directors. Because ourboard of directors has the power to retain and discharge our officers, these provisions could also make it moredifficult for existing stockholders or another party to effect a change in management.
These provisions may have the effect of deterring hostile takeovers or delaying or preventing changes incontrol of our management or of us, such as a merger, reorganization or tender offer. These provisions are
251
intended to enhance the likelihood of continued stability in the composition of our board of directors and itspolicies and to discourage certain types of transactions that may involve an actual or threatened acquisition of us.These provisions are designed to reduce our vulnerability to an unsolicited acquisition proposal. The provisionsare also intended to discourage certain tactics that may be used in proxy fights. However, such provisions couldhave the effect of discouraging others from making tender offers for our shares and, as a consequence, they mayalso inhibit fluctuations in the market price of our shares of common stock that could result from actual orrumored takeover attempts.
Removal of Directors. Until the point in time at which the Principal Stockholders no longer beneficially ownshares representing, collectively, at least 40% of the outstanding shares of our common stock, any director may beremoved from office at any time, with or without cause, by holders of a majority of the voting power of ouroutstanding common stock. Our Certificate of Incorporation will provide that, after the point in time at which thePrincipal Stockholders no longer beneficially own shares representing, collectively, at least 40% of the outstandingshares of our common stock, our directors may be removed only for cause by the affirmative vote of at least 75% ofthe voting power of our outstanding common stock. This requirement of a supermajority vote to remove directorscould enable a minority of our stockholders to prevent a change in the composition of our board.
Business Combinations with Interested Stockholders
Pursuant to our Certificate of Incorporation, we will opt out of the provisions of Section 203 of the DGCL,which regulates business combinations with “interested stockholders,” but only until the first date on which eachof the Principal Stockholders and their affiliates no longer meets the requirements to be an “interestedstockholder” as defined by Section 203 of the DGCL, but excluding for purposes thereof, clause (ii) of suchdefinition of “interested stockholder.”
Corporate Opportunities
Our Certificate of Incorporation provides that we renounce, to the fullest extent permitted by applicable law,any interest or expectancy in the business opportunities of our Principal Stockholders and their affiliates. Inaddition our Certificate of Incorporation provides that the Principal Stockholders have no obligation to offer us oreven communicate to us an opportunity to participate in business opportunities presented to such PrincipalStockholder or its respective affiliates even if the opportunity is one that we might reasonably have pursued (andtherefore may be free to compete with us in the same business or similar businesses of which we or our affiliatesnow engage or propose to engage) and that, to the fullest extent permitted by applicable law, neither the PrincipalStockholders nor their respective affiliates will be liable to us or our stockholders for breach of any duty byreason of any such activities described immediately above. Stockholders will be deemed to have notice of andconsented to this provision of our Certificate of Incorporation.
Limitation of Liability and Indemnification of Officers and Directors
Our Certificate of Incorporation will provide that no director shall be personally liable to us or any of ourstockholders for monetary damages for breach of fiduciary duty as a director, except to the extent suchexemption from liability or limitation thereof is not permitted under the DGCL. Our Bylaws will provide that wewill indemnify, to the fullest extent permitted by the DGCL, any person made or threatened to be made a party toany action or is involved in a proceeding by reason of the fact that the person is or was our director or officer, orour director or officer who, while a director or officer, is or was serving at the request of the company as adirector, officer, employee, agent or manager of another corporation, partnership, limited liability company, jointventure, trust or other enterprise or non-profit entity, including service with respect to an employee benefit plan.Our Bylaws will also provide that, subject to applicable law, the company may, by action of its board ofdirectors, grant rights to indemnification and advancement of expenses to persons other than its directors andofficers with such scope and effect as the board of directors may then determine. We intend to enter intocustomary indemnification agreements with each of our executive officers and directors that provide them, ingeneral, with customary indemnification in connection with their service to us or on our behalf.
252

Choice of Forum
Our Certificate of Incorporation will provide that unless we consent to the selection of an alternate forum,the Court of Chancery of the State of Delaware is the sole and exclusive forum for any derivative action orproceeding brought on our behalf; any action asserting a breach of fiduciary duty; any action asserting a claimagainst us arising pursuant to the DGCL, our Certificate of Incorporation or Bylaws; or any action asserting aclaim against us that is governed by the internal affairs doctrine. Any person or entity purchasing or otherwiseacquiring any interest in our shares of common stock shall be deemed to have notice of and consented to theforum provisions in our Certificate of Incorporation.
Transfer Agent and Registrar
We have entered into an agreement with American Stock Transfer & Trust Company, LLC to act as transferagent and registrar for our common stock.
Registration Rights
For a description of registration rights with respect to our common stock, see the information under theheading “Certain Relationships and Related Party Transactions—Registration Rights Agreement.”
Exchange
We have applied to have our common stock listed on the NASDAQ under the symbol “SABR.”
253

DESCRIPTION OF CERTAIN INDEBTEDNESS
The following descriptions of our indebtedness are qualified in their entirety by reference to their respectivegoverning documents which are filed as exhibits to the registration statement of which this prospectus is a part.
Senior Secured Credit Facilities
On February 19, 2013, Sabre GLBL completed a refinancing of its former senior secured credit facilitiespursuant to an amended and restated credit agreement (the “Amended and Restated Credit Agreement”). As partof this refinancing, it repaid or converted all outstanding term loans totaling $2,177 million and obtained newsenior secured credit facilities consisting of (i) a term loan facility (the “Term B Facility”) in an aggregateprincipal amount of $1,775 million; (ii) a term loan facility (the “Term C Facility”) in an aggregate principalamount of $425 million; and (iii) a multi-currency revolving facility (the “Revolving Facility”) in an aggregateprincipal amount of $352 million. The Revolving Facility includes a letter of credit sub-facility in an aggregateprincipal amount equal to $350 million and a swingline loan sub-facility in an aggregate principal amount of$75 million.
The Amended and Restated Credit Agreement also allows for the incurrence of incremental term loans andincreases in the revolving commitments, subject to certain conditions and an aggregate cap of $500 million plusan additional amount to the extent that the Senior Secured First-Lien Net Leverage Ratio (as defined in theAmended and Restated Credit Agreement) would not exceed 4.0:1.0. This ratio is calculated as senior securedfirst-lien debt (net of cash) to LTM Debt Covenant EBITDA (as defined in the Amended and Restated CreditAgreement).
On September 30, 2013, Sabre GLBL entered into an incremental amendment to provide for incrementalterm loans in an aggregate principal amount of $350 million (the “Incremental Term Facility” and together withthe Term B Facility, the Term C Facility and the Revolving Facility, the “Credit Facility”) under the Amendedand Restated Credit Agreement. Sabre GLBL has used a portion, and intends to use the remainder of, theproceeds of the Incremental Term Facility working capital and one-time costs associated with the Expedia SMAand sale of TPN, including the payment of travel suppliers for travel consumed that originated on our technologyplatforms, and for general corporate purposes.
On February 20, 2014, Sabre GLBL entered into (i) an amendment to the Amended and Restated CreditAgreement to, among other things, reduce the interest rate margins applicable to the Term B Facility and to reducethe Eurocurrency rate floor and base rate floor, (ii) a revolver extension amendment to extend the maturity date of$317 million of the Revolving Facility and (iii) an incremental revolving credit facility amendment to provide for anrevolving commitment increase of $53 million under the extended portion of the revolving facility.
As of December 31, 2013, on an as adjusted basis after giving effect to this offering and the application ofthe net proceeds from this offering as described under “Use of Proceeds,” Sabre GLBL would have had$2,277 million of indebtedness outstanding under the Credit Facility in addition to $286 million of availabilityunder the Revolving Facility, after taking into account the availability reduction of $66 million for letters ofcredit issued under the Revolving Facility. Of this indebtedness, none will be due on or before the end of 2014.
The following is a summary of the material terms of the Amended and Restated Credit Agreement, asamended by the Incremental Term Facility described above (the “Credit Agreement”). The description does notpurport to be complete and is qualified in its entirety by reference to the provisions of the Credit Agreement.
Maturity. The Term B Facility and the Incremental Term Facility both mature on February 19, 2019. TheTerm C Facility matures on February 19, 2018, but is expected to be fully repaid through quarterly repaymentsending on the last business day of December 2017. A portion of the commitments under the Revolving Facilityterminate on February 19, 2018 with the remainder terminating on February 19, 2019 (subject to an acceleratedmaturity of November 19, 2018 if on November 19, 2018, the Term B Facility (or permitted refinancings there
254
of) remains outstanding with a maturity date occurring less than one year after the maturity date of the extendedportion of the Revolving Facility).
Sabre GLBL must make quarterly repayments in an amount equal to 0.25% of the original aggregateprincipal amount outstanding under the Term B Facility as of February 19, 2013 and 0.25% of the originalaggregate principal amount outstanding under the Incremental Term Facility as of September 30, 2013. Thescheduled quarterly repayments are approximately $21 million annually and are due on the last business day ofeach March, June, September and December.
Sabre GLBL must also make quarterly repayments in an amount equal to a percentage of the aggregateprincipal amount outstanding under the Term C Facility as of February 19, 2013. The applicable percentage iscurrently 3.75% and will increase to 4.375%, 5.625% and 7.5% on the last business day of March 2015, March2016 and March 2017, respectively. The scheduled quarterly repayments are due on the last business day of eachMarch, June, September and December, with the final such payment on the last business day of December 2017.
Guarantee. Sabre GLBL’s obligations under the Credit Agreement are guaranteed on a senior secured basisby Sabre Holdings and each of Sabre GLBL’s existing and future wholly owned material domestic subsidiaries,other than certain excluded subsidiaries as set forth in the Credit Agreement (such guarantors, together withSabre GLBL, the “Loan Parties”).
Security and Ranking. Sabre GLBL’s obligations under the Credit Agreement are secured by a perfectedfirst priority security interest in substantially all of each Loan Party’s tangible and intangible assets, includingcapital stock of Sabre GLBL and capital stock of domestic subsidiaries directly held by any Loan Party and 65%of the voting capital stock of material foreign subsidiaries directly held by a Loan Party. The first-prioritysecurity interest in these assets are shared on a pari passu basis with the first priority security interest securing the2019 Notes. For so long as the 2016 Notes (as defined below) remain outstanding, certain properties and capitalstock and debt of subsidiaries that own such properties are excluded from the collateral securing Sabre GLBL’sobligations under the Credit Agreement.
Interest. The term loans made under the Term B Facility bear interest at a rate equal to the adjustedEurocurrency rate (subject to a 1.00% floor) plus 3.00% to 3.25% per annum or, at Sabre GLBL’s option, thebase rate (subject to a 2.00% floor) plus 2.00% to 2.25% per annum, in each case based on the Senior SecuredFirst-Lien Net Leverage Ratio. The Credit Agreement also provides for an increase in such rates to maintain adifference of not more than 50 bps relative to future incremental term loans.
The term loans made under the Term C Facility bear interest at a rate equal to the adjusted Eurocurrencyrate (subject to a 1.00% floor) plus 2.50% to 3.00% per annum or, at Sabre GLBL’s option, the base rate (subjectto a 2.00% floor) plus 1.50% to 2.00% per annum, in each case based on the Senior Secured First-Lien NetLeverage Ratio.
The term loans made under the Incremental Term Facility bear interest at a rate equal to the adjustedEurocurrency rate (subject to a 1.00% floor) plus 3.00% to 3.50% per annum or, at Sabre GLBL’s option, thebase rate (subject to a 2.00% floor) plus 2.00% to 2.50% per annum, in each case based on the Senior SecuredFirst-Lien Net Leverage Ratio. The Credit Agreement also provides for an increase in such rates to maintain adifference of not more than 50 bps relative to future incremental term loans.
The average effective interest rates on the term loans excluding the impact of our interest rate swaps for thefiscal years ended December 31, 2013, 2012 and 2011 were 6.21%, 5.65% and 2.72%, respectively. The averageeffective interest rate on the term loans including the impact of our interest rate swaps for the fiscal years endedDecember 31, 2013, 2012 and 2011 were 6.86%, 6.53% and 4.31%, respectively.
255
The revolving loans made under the Revolving Facility bear interest at a rate equal to the adjustedEurocurrency rate plus (x) 3.25% to 3.75% per annum for the portion allocable to the non-extended portion of theRevolving Facility and (y) 3.00% to 2.75% per annum for the portion allocable to the extended portion of theRevolving Facility or, at Sabre GLBL’s option (in the case of U.S. dollar-denominated revolving loans only), thebase rate plus (x) 2.25% to 2.75% per annum for the portion allocable to the non-extended portion of theRevolving Facility and (y) 1.75% to 2.00% per annum for the portion allocable to the extended portion of theRevolving Facility, in each case based on the Senior Secured First-Lien Net Leverage Ratio. In addition, theRevolving Facility is subject to a commitment fee payable quarterly in arrears ranging from 0.375% to0.500% per annum, based on the Senior Secured First-Lien Net Leverage Ratio, on the daily amount of theundrawn portion of the revolving commitments.
Prepayments. Sabre GLBL may, at its option, voluntarily prepay any amounts outstanding under the CreditAgreement in whole or in part without premium or penalty. However, if Sabre GLBL prepays or refinances theterm loans under the Term B Facility prior to August 20, 2014 with long-term bank debt financing that ismarketed or syndicated to banks and other institutional investors and is incurred for the primary purpose ofreducing the effective yield, it will be required to pay a repricing premium of 1.0% of the principal amount that isrefinanced.
In addition, Sabre GLBL is required to make mandatory prepayments under the Credit Agreement in certainsituations, depending on the Senior Secured First-Lien Net Leverage Ratio, including but not limited to: apercentage of excess cash flow; a percentage of proceeds from certain asset dispositions; the amount ofindebtedness incurred other than permitted indebtedness; and the amount of borrowings under the RevolvingFacility exceeding the commitments under such facility.
Extensions, Refinancings and Incremental Credit Extension. Sabre GLBL may, without further approvalfrom a majority of lenders, (a) extend the revolving commitments and term loans in one or more tranches,(b) refinance the revolving commitments and term loans with one or more new facilities with secured,subordinated or unsecured notes or loans, and (c) issue incremental credit in the form of incremental term loans,revolving commitment increases or additional secured, subordinated or unsecured notes or loans; in each caseupon the satisfaction of certain conditions.
Covenants. The Credit Agreement contains certain affirmative covenants, including, among others,covenants to furnish the lenders with financial statements and other financial information, to provide the lendersnotice of material events and information regarding collateral, to cause certain newly formed restrictedsubsidiaries to guarantee and pledge their assets as security for the Credit Agreement, to correct documentationwith respect to the collateral, to provide the agent with mortgages to secure real property, as necessary, and tomaintain title insurance policies with respect to any such mortgaged property, and to only redesignate restrictedsubsidiaries as unrestricted subsidiaries and vice versa in certain situations specified in the Credit Agreement.
The Credit Agreement contains negative covenants that restrict the ability of Sabre GLBL and its restrictedsubsidiaries, subject to certain exceptions, to incur additional indebtedness, grant liens on assets, undergofundamental changes, make investments, sell assets, make acquisitions, make restricted payments, engage intransactions with its affiliates, amend or modify certain agreements and charter documents and change its fiscalyear. The Credit Agreement also contains negative covenants that restrict the ability of Sabre Holdings to engagein any business or operations other than those incidental to ownership of Sabre and other activities specificallypermitted under the Credit Agreement, including the performance of its obligations with respect to its existingindebtedness, any public offering of equity interests and certain financing activities. Sabre Holdings is alsorestricted from creating or acquiring any material direct subsidiaries other than Sabre GLBL or any holdingcompany for Sabre GLBL.
In addition, Sabre GLBL is required to maintain a Senior Secured First-Lien Net Leverage Ratio as of anyfiscal quarter end if on such date the sum of (x) outstanding loans under the Revolving Facility, (y) letters of
256
credit issued under the Revolving Facility that guarantee debt for borrowed money, capital leases or obligationsevidenced by notes or other instruments and (z) other letters of credit issued under the Revolving Facility inexcess of $50 million (but only to the extent of such excess), exceeds 20% of the principal amount of theRevolving Facility. The applicable Senior Secured First-Lien Net Leverage Ratio is 5.5:1.0, declining to 5.0:1.0,4.5:1.0 and 4.0:1.0 on March 31, 2014, March 31, 2015 and March 31, 2016, respectively.
If certain material travel event disruptions set forth in the Credit Agreement occur, the foregoingrequirement is suspended from the last date of the quarter in which such disruption occurs until the last date ofthe second succeeding quarter; however, during such suspension period, Sabre may be subject to additionalrestrictions on its ability to make restricted payments, acquisitions or investments.
As of December 31, 2013, Sabre GLBL and Sabre Holdings were in compliance with all covenants underthe Credit Agreement.
8.5% Senior Secured Notes due 2019
On May 9, 2012, Sabre GLBL issued $400 million aggregate principal amount of senior secured notes due2019 (“Initial 2019 Notes”), bearing interest at a rate of 8.5% per annum. On September 27, 2012, Sabre GLBLissued an additional $400 million aggregate principal amount of senior secured notes due 2019, under the sameindenture and bearing interest at a rate of 8.5% per annum, to be treated as a single series with the Initial 2019Notes and with substantially the same terms as the Initial 2019 Notes (together with the Initial 2019 Notes, the“2019 Notes”).
The following is a summary of the material terms of the 2019 Notes. This description does not purport to becomplete and is qualified, in its entirety, by reference to the provisions of the indenture governing the 2019 Notes.
Maturity. The 2019 Notes mature on May 15, 2019.
Guarantee. Sabre GLBL’s obligations under the 2019 Notes are guaranteed on a senior secured basis bySabre Holdings and each of Sabre GLBL’s existing and future wholly owned material domestic subsidiaries,other than certain excluded subsidiaries as set forth in the Credit Agreement.
Security. The 2019 Notes and related guarantees are secured, subject to permitted liens, by a first-prioritysecurity interest in substantially all the assets of Sabre GLBL and each of the guarantors.
Interest. Interest on the 2019 Notes is payable semi-annually on May 15 and November 15 of each year,commencing November 15, 2012.
Ranking. The 2019 Notes are general senior secured obligations of Sabre GLBL and each guarantor. Theyrank equally in right of payment to all existing and future unsubordinated indebtedness of Sabre GLBL andsenior in right of payment to all existing and future subordinated indebtedness of Sabre GLBL They areeffectively senior to all unsecured indebtedness of Sabre GLBL (including Sabre GLBL’s guarantee of the 2016Notes), to the extent of the value of the collateral securing the 2019 Notes, which it shares pari passu with theCredit Facility. They are structurally subordinated to all existing and future indebtedness, claims of holders ofpreferred stock and other liabilities of subsidiaries of the Sabre GLBL that do not guarantee the 2019 Notes.
Optional Redemption. The 2019 Notes are redeemable, in whole or in part, at any time and at SabreGLBL’s option. Before May 15, 2015, the applicable redemption price is equal to 100% of the principal amountof the 2019 Notes redeemed plus accrued and unpaid interest, if any, to the redemption date and a “make-whole”premium. On or after May 15, 2015, the 2019 Notes may be redeemed at the redemption prices set forth in theindenture plus accrued and unpaid interest, if any, to the redemption date. In addition, until May 15, 2015, SabreGLBL may, at its option, redeem up to 40% of the aggregate principal amount of the 2019 Notes at a redemption
257
price equal to 108.5% of the principal amount of the 2019 Notes redeemed, plus accrued and unpaid interest tothe redemption date to be paid from the net proceeds received from one or more Equity Offerings (as defined inthe indenture governing the 2019 Notes), provided that (i) at least 50% of the aggregate principal amount of the2019 Notes remains outstanding immediately after each such redemption and (ii) each such redemption occurswithin 120 days of the date of closing of each such Equity Offering.
Covenants. The 2019 Notes include certain non-financial covenants, including restrictions on incurringcertain types of indebtedness, creation of liens on certain assets, making of certain investments, and payment ofdividends. These covenants are similar in nature to those existing on the Credit Facility.
As of December 31, 2013, Sabre GLBL was in compliance with all covenants under the indenture for the2019 Notes.
8.35% Senior Notes due 2016
On March 13, 2006, Sabre Holdings issued $400 million aggregate principal amount of senior unsecurednotes due 2016 (“2016 Notes”), that initially bore interest at a rate of 6.35% per annum. On March 16, 2007, theinterest rate on the 2016 Notes increased to 8.35% per annum, due to a credit rating decline resulting from theincreased indebtedness associated with the sale of Sabre Holdings to private investors.
The following is a summary of the material terms of the 2016 Notes. This description does not purport to becomplete and is qualified, in its entirety, by reference to the provisions of the indenture by and between SabreHoldings and SunTrust Bank dated as of August 7, 2001, as supplemented by a second supplemental indenturedated as of March 13, 2006, governing the 2016 Notes.
Maturity. The 2016 Notes mature on March 15, 2016.
Guarantee. Sabre Holdings’ obligations under the 2016 Notes are guaranteed on a senior, unsecured basisby Sabre GLBL
Interest. Interest on the 2016 Notes is payable semi-annually on March 15 and September 15 of each year,commencing September 15, 2006. Interest on the 2016 Notes may increase by up to two percentage points perannum to a maximum rate of 8.35% per annum in the event credit ratings of the 2016 Notes decline below certainthresholds after the occurrence of a change of control (as occurred in March 2007); however, upon subsequentimprovements to the credit ratings, the interest rate on the 2016 Notes could decrease to a lower rate, with a floorof 6.35% per annum.
Ranking. The 2016 Notes are general unsecured obligations of Sabre Holdings. They rank equally in rightof payment with all other existing and future unsecured indebtedness of Sabre Holdings. They are effectivelysubordinated to all existing and future secured indebtedness, including the Credit Agreement and the 2019 Notes,to the extent of the value of the assets securing such indebtedness. They are structurally subordinated to allexisting and future indebtedness and other liabilities of Sabre Holdings’ subsidiaries, including Sabre GLBL’sobligations under the Credit Agreement and the 2019 Notes and its subsidiaries’ guarantees of obligations underthe Credit Agreement, the Mortgage Facility (as defined below) and trade payables.
Optional Redemption. The 2016 Notes are redeemable, in whole or in part, at any time and at SabreHoldings’ option. The applicable redemption price is the sum of (i) the greater of (x) 100% of the principalamount outstanding and (y) the sum of the remaining principal and interest payments, reduced to present valuebased on the adjusted treasury rate plus 30 bps, and (ii) accrued and unpaid interest as of the redemption date.
Covenants. The 2016 Notes include certain non-financial covenants, including restrictions on incurringcertain secured indebtedness without ratably securing obligations under the 2016 Notes, subject to certainexceptions; entering into certain sale and leaseback transactions; and entering into mergers, consolidations or atransfer of substantially all its assets.
258
As of December 31, 2013, Sabre Holdings was in compliance with all covenants under the indenturesgoverning the 2016 Notes.
Mortgage Facility
On March 29, 2007, we purchased through Sabre Headquarters, LLC, our special purpose subsidiary, thebuildings, land and furniture and fixtures located at our headquarters facilities in Southlake, Texas, which werepreviously financed under a capital lease facility. The total purchase price of the assets was $104 million. Thepurchase was financed through $85 million borrowed under the mortgage facility (“Mortgage Facility”) and$19 million from cash on hand. The Mortgage Facility carries an interest rate of 5.7985% per annum. Thefollowing is a summary of the material terms of the Mortgage Facility. This description does not purport to becomplete and is qualified, in its entirety, by reference to the provisions of the Mortgage Facility.
Maturity. The Mortgage Facility matures on March 1, 2017 and all unpaid principal will be due at that time.As of December 31, 2013, $84 million remained outstanding under the Mortgage Facility.
Interest. Payments on the Mortgage Facility are payable monthly on the first business day of each month.Payments made through April 1, 2012 were applied to accrued interest only. Subsequent to that date, a portion ofpayments is also applied to the principal balance of the note.
Security. The Mortgage Facility is secured by a perfected first priority security interest in the land andimprovements located at our headquarters facilities in Southlake, Texas.
Covenants. Sabre Headquarters, LLC is subject to various customary affirmative covenants under theMortgage Facility, including, but not limited to: payment of property taxes, granting of lender access to inspectthe properties, cooperating in legal proceedings, obtaining insurance awards, providing financial statements,providing estoppel certificates, paying foreclosure costs, lender consent to any leases and lender consent tocertain alterations and improvements. The Mortgage Facility also contains various customary negative covenants,including restrictions on incurring liens other than permitted liens, dissolving the borrower or changing itsbusiness, forgiving debt, changing its principal place of business and transferring the property.
As of December 31, 2013, Sabre Headquarters, LLC was in compliance with all covenants under theMortgage Facility.
259

SHARES ELIGIBLE FOR FUTURE SALE
Prior to this offering, there has been no public market for our common stock, and we cannot assure you thata liquid trading market for our common stock will develop or be sustained after this offering. Future sales ofsubstantial amounts of common stock, including shares issued upon exercise of options, in the public marketafter this offering, or the anticipation of such sales or the perception that such sales may occur, could adverselyaffect the market price of our common stock prevailing from time to time and could impair our ability to raisecapital through sales of our equity securities. No prediction can be made as to the effect, if any, future sales ofshares, or the availability of shares for future sales, will have on the market price of our common stock prevailingfrom time to time.
Sales of Restricted Shares
Upon the closing of this offering, we will have outstanding an aggregate of 245,338,645 shares of commonstock, assuming 44,736,842 shares are sold in the offering based on an assumed share price of $19.00 (the midpointof the price range on the cover of this prospectus). Of these shares, we expect all of the shares of common stockbeing sold in this offering will be freely tradable without restriction or further registration under the Securities Act,except for any such shares which may be held or acquired by an “affiliate” of ours, as that term is defined inRule 144 of the Securities Act (“Rule 144”), which shares will be subject to the volume limitations and otherrestrictions of Rule 144 described below. The remaining 200,601,803 shares of common stock held by our existingstockholders upon completion of this offering will be “restricted securities,” as that phrase is defined in Rule 144,and may be resold only after registration under the Securities Act or pursuant to an exemption from such registrationunder Rule 144 or any other applicable exemption under the Securities Act. Subject to the lock-up agreementsdescribed below, the transfer restrictions in the Management Stockholders’ Agreement, applicable to certainstockholders, described below and the provisions of Rules 144 and 701, additional shares will be available for saleas set forth below.
Lock-up Agreements
We, each of our executive officers, directors, the Principal Stockholders and certain of our otherstockholders have agreed with the underwriters that, subject to certain exceptions described immediately below,for a period of 180 days after the date of this prospectus, we and they will not offer, sell, contract to sell, pledge,grant any option to purchase, make any short sale, or otherwise dispose of any of the shares of common stock, orany options or warrants to purchase any shares of common stock or securities convertible into or exchangeablefor shares of common stock, or that represent the right to receive shares of common stock, whether now owned orhereinafter acquired, or, in our case, cause a registration statement covering any common stock to be filed,without the prior written consent of Morgan Stanley Co. LLC and Goldman, Sachs & Co.
With respect to the company, these restrictions do not apply to (i) any share of common stock to be sold inthis offering; (ii) any shares of common stock or securities convertible or exercisable into, exchangeable for orthat represent the right to receive shares of common stock, issued by the company, in each case pursuant to thecompany’s equity plans as described therein; (iii) the issuance of shares of common stock prior to, or inconnection with, the closing of this offering in respect of the conversion, exchange or redemption of shares ofSeries A Preferred Stock pursuant to the Redemption; (iv) the filing of a registration statement on Form S-8 (orequivalent form) with the SEC in connection with an employee stock compensation plan or agreement of thecompany, which plan or agreement is described herein; (v) the issuance of shares of common stock or othersecurities (including securities convertible into shares of common stock) in connection with the acquisition bythe company or any of its subsidiaries of the securities, businesses, properties or other assets of another person orentity or pursuant to any employee benefit plan assumed by the company in connection with any suchacquisition; or (vi) the issuance of shares of common stock or other securities (including securities convertibleinto shares of common stock) in connection with joint ventures, commercial relationships or other strategictransactions; provided that, in the case of clauses (v) and (vi), the aggregate number of shares of common stockissued in all such acquisitions and transactions does not exceed 10% of the issued and outstanding common stock
260
of the company issued and outstanding immediately following the completion of this offering and any recipientsof such shares of commons stock shall deliver a lock-up agreement to Morgan Stanley Co. LLC and Goldman,Sachs & Co. consistent in scope as described above.
With respect to each of our executive officers, directors, Principal Stockholders and certain of our otherstockholders the restrictions described above do not apply to transfers (i) as a bona fide gift or gifts; (ii) to anytrust for the direct or indirect benefit of such person or the immediate family of such person; (iii) by way oftestate or intestate succession or by operation of law; (iv) to any members of the immediate family of suchperson; (v) to a corporation, partnership, or limited liability company or other entity that controls or is controlledby, or is under common control with, such person and/or by members of the immediate family of such person, orto any investment fund or other entity controlled or managed by the undersigned; (vi) if the shares of commonstock are held by a corporation, partnership, limited liability company or other entity, to any of its stockholders,partners, members or affiliates or any of its affiliates’ directors, officers and employees; (vii) to the company inconnection with the “net” or “cashless” exercise of any options outstanding as of the date of the lock-upagreement and having an expiration date during the 180-day lock-up period to acquire shares pursuant to theemployee benefit plans described herein; (viii) to the company for the primary purposes of satisfying any tax orother governmental withholding obligation with respect to shares issued upon the exercise of an option orwarrant (or upon the exchange of another security or securities) pursuant to a plan described in the prospectus, orissued under an employee equity or benefit plan described herein; (ix) in connection with the conversion,exchange or redemption of the outstanding preferred stock of the company into shares of common stock, cash ora combination thereof; (x) pursuant to the underwriting agreement.
Morgan Stanley Co. LLC and Goldman, Sachs & Co. may, in their sole discretion, waive these restrictionsor release any of these shares from these restrictions at any time. See “Underwriting (Conflicts of Interest).”Approximately 81% of our outstanding common stock, or 79% of outstanding shares of our common stock if theunderwriters’ option to purchase additional shares if fully exercised, are subject to these lock-up agreements.
The 180-day restricted period described above will be automatically extended if (i) during the last 17 daysof the 180-day restricted period we issue an earnings release or announce material news or a material eventrelating to us occurs or (ii) prior to the expiration of the 180-day restricted period, we announce that we willrelease earnings results during the 15-day period beginning on the day following the 180-day restricted period, inwhich case the restrictions described in the preceding paragraph will continue to apply until the expiration of the18-day period beginning on the issuance of the earnings release or the announcement of the material news ormaterial event, unless Morgan Stanley Co. LLC and Goldman, Sachs & Co. provide a written waiver of suchextension. Morgan Stanley Co. LLC and Goldman, Sachs & Co. have no present intent or arrangement to releaseany of the securities subject to these lock-up agreements. The release of any lock-up is considered on a case bycase basis. Factors in deciding whether to release shares may include the length of time before the lock-upexpires, the number of shares involved, the reason for the requested release, market conditions, the trading priceof our common stock, historical trading volumes of our common stock and whether the person seeking therelease is an officer, director or affiliate of the company.
Management Stockholders’ Agreement Transfer Restrictions
Pursuant to the Management Stockholders’ Agreement, certain of our stockholders, which group ofstockholders excludes our Principal Stockholders, have agreed by contract with us not to transfer, sell, assign,pledge, hypothecate or encumber any of the shares of common stock then-currently owned by such stockholder(which can be waived by us at our option at any time), subject to certain limited exceptions, at any time prior tothe termination of such Management Stockholders’ Agreement. The Management Stockholders’ Agreementterminates if our common stock is registered and if at least 20% of our total outstanding common stock tradesregularly in, on or through the facilities of a securities exchange and/or inter-dealer quotation system or anydesignated offshore securities market, which conditions are expected to be met in connection with the completionof this offering, assuming we sell the total number of shares set forth on the cover of this prospectus at an initial
261

public offering price equal to the midpoint of the price range set forth on the cover of this prospectus and that theunderwriters exercise their option to purchase additional shares of common stock. However, if there is a changein the total number of shares to be sold in the offering or in the initial public offering price, in each case ascompared to the figures set forth on the cover of this prospectus, or if the underwriters do not exercise theiroption to purchase additional shares, the Management Stockholders’ Agreement may not terminate. If theManagement Stockholders’ Agreement does not terminate, the transfer restrictions contained therein wouldcontinue to be applicable.
Rule 144
In general, under Rule 144, persons who became the beneficial owner of shares of our common stock priorto the completion of this offering may not sell their shares until the earlier of (i) the expiration of a six-monthholding period, if we have been subject to the reporting requirements of the Exchange Act and have filed allrequired reports for at least 90 days prior to the date of the sale, or (ii) a one-year holding period.
At the expiration of the six-month holding period, a person who was not one of our affiliates at any timeduring the three months preceding a sale is entitled to sell an unlimited number of shares of our common stockprovided current public information about us is available, and a person who was one of our affiliates at any timeduring the 90 days preceding a sale is entitled to sell within any three-month period only a number of shares ofcommon stock that does not exceed the greater of either of the following:
• one percent of the number of shares of common stock then outstanding, which will equalapproximately 2,453,386 shares immediately after this offering; and
• the average weekly trading volume of the common stock on the NASDAQ during the four calendarweeks preceding the filing of a notice on Form 144 with respect to the sale.
At the expiration of the one-year holding period, a person who was not one of our affiliates at any timeduring the 90 days preceding a sale would be entitled to sell an unlimited number of shares of our common stockwithout restriction. A person who was one of our affiliates at any time during the 90 days preceding a sale wouldremain subject to the volume restrictions described above.
All sales under Rule 144 are subject to the availability of current public information about us. In addition,sales under Rule 144 by affiliates or persons who have been affiliates within the previous 90 days are also subjectto manner of sale provisions and notice requirements. Upon completion of the 180-day lock-up period, subject toany extension of the lock-up period under circumstances described above, and the termination of theManagement Stockholders’ Agreement, which is expected to occur assuming we sell the total number of sharesset forth on the cover of this prospectus at an initial public offering price equal to the midpoint of the price rangeset forth on the cover of this prospectus, approximately 200,601,803 shares of our outstanding restrictedsecurities will be eligible for sale under Rule 144 subject to limitations on sales by affiliates.
Upon the completion of the 180-day lock-up period, subject to any extension of the lock-up period undercircumstances described above, and assuming that the Management Stockholders’ Agreement has not beenterminated, approximately 193,890,601 shares of our outstanding restricted securities will be eligible for saleunder Rule 144 subject to limitations on sales by affiliates.
Rule 701
In general, under Rule 701, any of our employees, directors, officers, consultants or advisors who purchasedshares from us in connection with a compensatory stock or option plan or other written agreement before theeffective date of our initial public offering, or who purchased shares from us after that date upon the exercise ofoptions granted before that date, are eligible to resell such shares in reliance upon Rule 144 beginning 90 daysafter the date of this prospectus. If such person is not an affiliate, the sale may be made without compliance with
262
the holding period or current public information requirements contained in Rule 144. If such a person is anaffiliate, the sale may be made under Rule 144 without compliance with its one-year minimum holding period,but subject to the other Rule 144 restrictions.
Registration Rights
Pursuant to the amendment and restatement to our registration rights agreement, the Principal Stockholdersand any other parties thereto from time to time will have certain customary demand, piggyback and shelfregistration rights at any time following the expiration of the 180-day lock-up period described above. Upon theeffectiveness of a registration statement, all shares covered by such registration statement will be freelytransferable. If these registration rights are exercised and the Principal Stockholders sell a large number of sharesof common stock, the market price of our common stock could decline. See “Certain Relationships and RelatedParty Transactions—Registration Rights Agreement” for a more detailed description of these registration rights.
263

MATERIAL U.S. FEDERAL INCOME AND ESTATE TAX CONSIDERATIONSTO NON-U.S. HOLDERS
The following discussion is a summary of material U.S. federal income and estate tax considerationsgenerally applicable to the purchase, ownership and disposition of our common stock by Non-U.S. Holders. A“Non-U.S. Holder” means:
• a nonresident alien individual,
• a foreign corporation, or
• a person that is otherwise not subject to U.S. federal income tax on a net income basis in respect ofsuch common stock.
This discussion deals only with common stock held as capital assets by Non-U.S. Holders who purchasedcommon stock in this offering. This discussion does not cover all aspects of U.S. federal income taxation thatmay be relevant to the purchase, ownership or disposition of our common stock by prospective investors in lightof their specific facts and circumstances. In particular, this discussion does not address all of the taxconsiderations that may be relevant to persons in special tax situations, including persons that will hold shares ofour common stock in connection with a U.S. trade or business or a U.S. permanent establishment, hold more than5% of our common stock, certain former citizens or residents of the United States, are a “controlled foreigncorporation,” a “passive foreign investment company” or a partnership or other pass-through entity for U.S.federal income tax purposes, or are otherwise subject to special treatment under the Code, as amended. Thissection does not address any other U.S. federal tax considerations (such as gift tax) or any state, local or non-U.S.tax considerations. You should consult your own tax advisors about the tax consequences of the purchase,ownership and disposition of our common stock in light of your own particular circumstances, including the taxconsequences under state, local, foreign and other tax laws and the possible effects of any changes in applicabletax laws.
Furthermore, this summary is based on the tax laws of the United States, including the Code, existing andproposed regulations, administrative and judicial interpretations, all as currently in effect. Such authorities maybe repealed, revoked, modified or subject to differing interpretations, possibly on a retroactive basis, so as toresult in U.S. federal income tax or estate tax consequences different from those discussed below.
Dividends
As discussed in “Dividend Policy,” we expect to pay quarterly cash dividends on our common stockcontingent upon the closing of this offering. When we make a distribution of cash or property with respect to ourcommon stock, such distributions generally will constitute dividends for U.S. federal income tax purposes to theextent of our current or accumulated earnings and profits, as determined under U.S. federal income taxprinciples. If a distribution exceeds our current and accumulated earnings and profits, the excess will be treatedas a tax-free return of your investment, up to your tax basis in the common stock. Any remaining excess will betreated as capital gain, subject to the tax treatment described below in “—Sale, Exchange or Other TaxableDisposition of Common Stock.”
Dividends paid to you generally will be subject to U.S. federal withholding tax at a 30% rate, or such lowerrate as may be specified by an applicable tax treaty. Even if you are eligible for a lower treaty rate, we and otherpayers will generally be required to withhold at a 30% rate (rather than the lower treaty rate) on dividendpayments to you, unless:
• you have furnished to us or such other payer a valid Internal Revenue Service (“IRS”) Form W-8BENor other documentary evidence establishing your entitlement to the lower treaty rate with respect tosuch payments and neither we nor our paying agent (or other payer) have actual knowledge or reason toknow to the contrary, and
264
• in the case of actual or constructive dividends paid on or after July 1, 2014, if required by the ForeignAccount Tax Compliance Act or any intergovernmental agreement enacted pursuant to that law, you orany entity through which you receive such dividends, if required, have provided the withholding agentwith certain information with respect to your or the entity’s direct and indirect U.S. owners, and if youhold the common stock through a foreign financial institution, such institution has entered into anagreement with the U.S. government to collect and provide to the U.S. tax authorities informationabout its accountholders (including certain investors in such institution or entity) and you haveprovided any required information to such institution.
If you are eligible for a reduced rate of U.S. federal withholding tax pursuant to an applicable income taxtreaty or otherwise, you may obtain a refund of any excess amounts withheld by timely filing an appropriateclaim for refund with the IRS. Investors are encouraged to consult with their own tax advisors regarding thepossible implications of these withholding requirements on their investment in the common stock.
Dividends that are “effectively connected” with your conduct of a trade or business within the United Stateswill be exempt from the withholding tax described above and instead will be subject to U.S. federal income taxon a net income basis. We and other payers generally are not required to withhold tax from “effectivelyconnected” dividends, provided that you have furnished to us or another payer a valid IRS Form W-8ECI (or anacceptable substitute form) upon which you represent, under penalties of perjury, that you are a non-U.S. personand that the dividends are effectively connected with your conduct of a trade or business within the United Statesand are includible in your gross income. If you are a corporate non-U.S. holder, “effectively connected”dividends that you receive may, under certain circumstances, be subject to an additional branch profits tax at a30% rate, or at a lower rate if you are eligible for the benefits of an income tax treaty that provides for a lowerrate.
Sale, Exchange or Other Taxable Disposition of Common Stock
You generally will not be subject to U.S. federal income tax with respect to gain recognized on a sale,exchange or other taxable disposition of shares of our common stock unless:
• the gain is effectively connected with your trade or business in the United States (as discussed under“—Dividends” above),
• in the case of an individual who holds the common stock as a capital asset, such holder is present in theUnited States for 183 days or more in the taxable year of the sale, exchange or other taxabledisposition, and certain other conditions are met, or
• we are or have been a United States real property holding corporation for federal income tax purposesand you held, directly or indirectly, at any time during the five-year period ending on the date of thedisposition, more than 5% of our common stock.
In the case of the sale or disposition of common stock on or after January 1, 2017, you may be subject to a30% withholding tax on the gross proceeds of the sale or disposition unless the requirements described in the lastbullet point under “—Dividends” above are satisfied. Investors are encouraged to consult with their own taxadvisors regarding the possible implications of these withholding requirements on their investment in thecommon stock and the potential for a refund or credit in the case of any withholding tax.
We have not been, are not and do not anticipate becoming a United States real property holding corporationfor U.S. federal income tax purposes.
Information Reporting and Backup Withholding
We must report annually to the IRS and to each Non-U.S. holder the amount of dividends paid to suchholder and the tax withheld with respect to such dividends, regardless of whether withholding was required.
265
Copies of the information returns reporting such dividends and withholding may also be made available to thetax authorities in the country in which you reside under the provisions of an applicable income tax treaty.
You may be subject to backup withholding for dividends paid to you unless you certify under penalty ofperjury that you are a Non-U.S. holder or otherwise establish an exemption. Any amounts withheld under thebackup withholding rules may be allowed as a refund or a credit against your U.S. federal income tax liabilityprovided the required information is timely furnished to the IRS.
U.S. Federal Estate Tax
Shares of our common stock held (or deemed held) by an individual Non-U.S. Holder at the time of his orher death will be included in such Non-U.S. Holder’s gross estate for U.S. federal estate tax purposes, unless anapplicable estate tax treaty provides otherwise.
266

UNDERWRITING (CONFLICTS OF INTEREST)
Under the terms and subject to the conditions contained in an underwriting agreement dated the date of thisprospectus, Morgan Stanley & Co. LLC, Goldman, Sachs & Co., Merrill Lynch, Pierce, Fenner & SmithIncorporated and Deutsche Bank Securities Inc. are acting as the representatives of the underwriters and as jointbook-running managers. The underwriters have severally agreed to purchase, and we have agreed to sell to them,severally the number of shares indicated below:
NameNumber of
Shares
Morgan Stanley & Co. LLC . . . . . . . . . . . . . . . . . . . . . . . . . . . . . . . . . . . . . .Goldman, Sachs & Co. . . . . . . . . . . . . . . . . . . . . . . . . . . . . . . . . . . . . . . . . . .Merrill Lynch, Pierce, Fenner & Smith
Incorporated . . . . . . . . . . . . . . . . . . . . . . . . . . . . . . . . . . . . . . . .Deutsche Bank Securities Inc. . . . . . . . . . . . . . . . . . . . . . . . . . . . . . . . . . . . .Evercore Group L.L.C. . . . . . . . . . . . . . . . . . . . . . . . . . . . . . . . . . . . . . . . . . .Jefferies LLC . . . . . . . . . . . . . . . . . . . . . . . . . . . . . . . . . . . . . . . . . . . . . . . . .TPG Capital BD, LLC . . . . . . . . . . . . . . . . . . . . . . . . . . . . . . . . . . . . . . . . . .Cowen and Company, LP . . . . . . . . . . . . . . . . . . . . . . . . . . . . . . . . . . . . . . . .Sanford C. Bernstein & Co., LLC . . . . . . . . . . . . . . . . . . . . . . . . . . . . . . . . .William Blair & Company, L.L.C. . . . . . . . . . . . . . . . . . . . . . . . . . . . . . . . . .Mizuho Securities USA Inc. . . . . . . . . . . . . . . . . . . . . . . . . . . . . . . . . . . . . . .Natixis Securities Americas LLC . . . . . . . . . . . . . . . . . . . . . . . . . . . . . . . . . .The Williams Capital Group, L.P. . . . . . . . . . . . . . . . . . . . . . . . . . . . . . . . . .
Total . . . . . . . . . . . . . . . . . . . . . . . . . . . . . . . . . . . . . . . . . . . . . . . . 44,736,842
The underwriters and the representatives are collectively referred to as the “underwriters” and the“representatives,” respectively. The underwriters are offering the shares of common stock subject to their acceptance ofthe shares from us and subject to prior sale. The underwriting agreement provides that the obligations of the severalunderwriters to pay for and accept delivery of the shares of common stock offered by this prospectus are subject to theapproval of certain legal matters by their counsel and to certain other conditions. The underwriters are obligated to takeand pay for all of the shares of common stock offered by this prospectus if any such shares are taken. However, theunderwriters are not required to take or pay for the shares covered by the underwriters’ option to purchase additionalshares described below. The offering of the shares by the underwriters is subject to receipt and acceptance and subjectto the underwriters’ right to reject any order in whole or in part.
The underwriters initially propose to offer part of the shares of common stock directly to the public at thepublic offering price listed on the cover page of this prospectus and part to certain dealers at a price thatrepresents a concession not in excess of $ a share under the public offering price. After the initial offering ofthe shares of common stock, the offering price and other selling terms may from time to time be varied by therepresentatives, including in connection with sales of unsold allotments of common stock or subsequent sales ofcommon stock purchased by the representatives in stabilizing and related transactions.
The underwriters have an option to buy up to an additional 6,710,526 shares from us to cover sales by theunderwriters of a greater number of shares than the total number set forth in the table above. They may exercisethat option for 30 days from the date of this prospectus. To the extent the option is exercised, each underwriterwill become obligated, subject to certain conditions, to purchase about the same percentage of the additionalshares of common stock as the number listed next to the underwriter’s name in the preceding table bears to thetotal number of shares of common stock listed next to the names of all underwriters in the preceding table.
267
The following tables show the per share and total underwriting discounts and commissions to be paid to theunderwriters by us at the public offering price listed on the cover page of this prospectus, less underwritingdiscounts and commissions. Such amounts are shown assuming both no exercise and full exercise of theunderwriters’ option to purchase additional shares.
Paid by us
NoExercise
FullExercise
Per Share . . . . . . . . . . . . . . . . . . . . . . . . . . . . . . . . . . . . . . . . . . . . . . . . . . . . . . . . . . . . . . . . . $ $Total . . . . . . . . . . . . . . . . . . . . . . . . . . . . . . . . . . . . . . . . . . . . . . . . . . . . . . . . . . . . . . . . . . . . $ $
The estimated offering expenses of this offering are approximately $6.7 million, which includes legal,accounting and printing costs and various other fees associated with the registration of the common stock to besold pursuant to this prospectus. In addition, we have agreed to reimburse the underwriters for certain expensesof approximately $60,000.
The underwriters have informed us that they do not intend sales to discretionary accounts to exceed 5% ofthe total number of shares of common stock offered by them.
We have applied to list our common stock on the NASDAQ under the symbol “SABR.”
Prior to the offering, there has been no public market for the shares. The initial public offering price hasbeen negotiated among the company and the representatives. Among the factors to be considered in determiningthe initial public offering price of the shares, in addition to prevailing market conditions, will be the company’shistorical performance, estimates of the business potential and earnings prospects of the company, an assessmentof the company’s management and the consideration of the above factors in relation to market valuation ofcompanies in related businesses.
We, each of our executive officers, directors, the Principal Stockholders and certain of our otherstockholders have agreed that, without the prior written consent of Morgan Stanley & Co. LLC and Goldman,Sachs & Co. on behalf of the underwriters, we and they will not, during the period ending 180 days after the dateof this prospectus:
• offer, sell, contract to sell, pledge, grant any option to purchase, make any short sale or otherwisetransfer or dispose of, directly or indirectly, any shares of common stock, or any options or warrants topurchase any shares of common stock, or any securities convertible into, exchangeable for or thatrepresent the right to receive shares of common stock; or
• in our case, file any registration statement with the SEC relating to the offering of any shares ofcommon stock or any securities convertible into or exercisable or exchangeable for common stock;
whether any such transaction described in the first two bullet points above is to be settled by delivery of commonstock or such other securities, in cash or otherwise.
With respect to the company, the restrictions described in the preceding paragraphs do not apply to:
• any share of common stock to be sold in this offering;
• any shares of common stock or securities convertible or exercisable into, exchangeable for or thatrepresent the right to receive shares of common stock, issued by the company, in each case pursuant tothe company’s equity plans as described therein;
268
• the issuance of shares of common stock prior to, or in connection with, the closing of this offering inrespect of the conversion, exchange or redemption of shares of Series A Preferred Stock pursuant to theRedemption;
• the filing of a registration statement on Form S-8 (or equivalent form) with the SEC in connection withan employee stock compensation plan or agreement of the company, which plan or agreement isdescribed herein;
• the issuance of shares of common stock or other securities (including securities convertible into sharesof common stock) in connection with the acquisition by the company or any of its subsidiaries of thesecurities, businesses, properties or other assets of another person or entity or pursuant to any employeebenefit plan assumed by the company in connection with any such acquisition; or
• the issuance of shares of common stock or other securities (including securities convertible into sharesof common stock) in connection with joint ventures, commercial relationships or other strategictransactions;
provided that, in the case of the last two bullet points above, the aggregate number of shares of common stockissued in all such acquisitions and transactions does not exceed 10% of the issued and outstanding common stockof the company issued and outstanding immediately following the completion of this offering and any recipientsof such shares of commons stock shall deliver a lock-up agreement to Morgan Stanley Co. LLC and Goldman,Sachs & Co. consistent in scope and length as described in the preceding paragraphs above.
With respect to each of our executive officers, directors, the Principal Stockholders and certain of our otherstockholders, the restrictions described in the preceding paragraphs do not apply to transfers:
• as a bona fide gift or gifts;
• to any trust for the direct or indirect benefit of such person or the immediate family of such person;
• by way of testate or intestate succession or by operation of law;
• to any members of the immediate family of such person;
• to a corporation, partnership, or limited liability company or other entity that controls or is controlledby, or is under common control with, such person and/or by members of the immediate family of suchperson, or to any investment fund or other entity controlled or managed by the undersigned;
• if the shares of common stock are held by a corporation, partnership, limited liability company or otherentity, to any of its stockholders, partners, members or affiliates or any of its affiliates’ directors,officers and employees;
• to the company in connection with the “net” or “cashless” exercise of any options outstanding as of thedate of the lock-up agreement and having an expiration date during the 180-day lock-up period toacquire shares pursuant to the employee benefit plans described herein;
• to the company for the primary purposes of satisfying any tax or other governmental withholdingobligation with respect to shares issued upon the exercise of an option or warrant (or upon theexchange of another security or securities) pursuant to a plan described in the prospectus, or issuedunder an employee equity or benefit plan described herein;
• in connection with the conversion, exchange or redemption of the outstanding preferred stock of thecompany into shares of common stock, cash or a combination thereof; or
• pursuant to the underwriting agreement.
The 180-day restricted period described in the preceding paragraphs will be extended if:
• during the last 17 days of the 180-day restricted period, we issue an earnings release or material newsor a material event relating to us occurs; or
269

• prior to the expiration of the 180-day restricted period, we announce that we will release earningsresults during the 15-day period beginning on the day following the 180-day period;
in which case the restrictions described in the preceding paragraphs will continue to apply until the expiration ofthe 18-day period beginning on the issuance of the earnings release or the occurrence of the material news ormaterial event.
Morgan Stanley & Co. LLC and Goldman, Sachs & Co., in their sole discretion, may release the commonstock and other securities subject to the lock-up agreements described above in whole or in part at any time withor without notice.
In order to facilitate this offering of the common stock, the underwriters may engage in transactions that stabilize,maintain or otherwise affect the price of the common stock. Specifically, the underwriters may sell more shares thanthey are obligated to purchase under the underwriting agreement, creating a short position. A short sale is covered if theshort position is no greater than the number of shares available for purchase by the underwriters under their option topurchase additional shares. The underwriters can close out a covered short sale by exercising their option to purchaseadditional shares or purchasing shares in the open market. In determining the source of shares to close out a coveredshort sale, the underwriters will consider, among other things, the open market price of shares compared to the priceavailable under their option to purchase additional shares. The underwriters may also sell shares in excess of theiroption to purchase additional shares, creating a naked short position. The underwriters must close out any naked shortposition by purchasing shares in the open market. A naked short position is more likely to be created if the underwritersare concerned that there may be downward pressure on the price of the common stock in the open market after pricingthat could adversely affect investors who purchase in this offering. In addition, to stabilize the price of common stock,the underwriters may bid for, and purchase, shares of common stock in the open market. Finally, the underwritingsyndicate may reclaim selling concessions allowed to an underwriter or a dealer for distributing the common stock inthis offering, if the syndicate repurchases previously distributed common stock to cover syndicate short positions or tostabilize the price of the common stock. These activities may raise or maintain the market price of the common stockabove independent market levels or prevent or retard a decline in the market price of the common stock. Theunderwriters are not required to engage in these activities and may end any of these activities at any time.
The underwriters may also impose a penalty bid. This occurs when a particular underwriter repays to theunderwriters a portion of the underwriting discount received by it because the representatives have repurchasedshares sold by or for the account of such underwriter in stabilizing or short covering transactions.
The underwriters and their respective affiliates are full-service financial institutions engaged in variousactivities, which may include securities trading, commercial and investment banking, financial advisory,investment management, investment research, principal investment, hedging, financing and brokerage activities.
From time to time, certain of the underwriters and/or their respective affiliates may provide investmentbanking services to us. In the ordinary course of their various business activities, the underwriters and theirrespective affiliates may make or hold a broad array of investments and actively trade debt and equity securities(or related derivative securities) and financial instruments (including bank loans) for their own account and forthe accounts of their customers, and such investment and securities activities may involve securities and/orinstruments of Sabre, including the 2016 Notes and the 2019 Notes. The underwriters and their respectiveaffiliates may also make investment recommendations and/or publish or express independent research views inrespect of such securities or instruments and may at any time hold, or recommend to clients that they acquire,long and/or short positions in such securities and instruments. Certain of the underwriters and their affiliates havein the past engaged, currently engage and may in the future engage, in transactions with and perform services for,including commercial banking, financial advisory and investment banking services, us and our affiliates in theordinary course of business for which they have received or will receive customary fees and expenses. We alsohave, and expect to continue to have, economic hedges, cash management relationships and/or other swaps andhedges in place with certain of the underwriters or their affiliates on customary economic terms.
270

Morgan Stanley & Co. LLC, Goldman, Sachs & Co., Merrill Lynch, Pierce, Fenner & Smith Incorporated,Deutsche Bank Securities Inc., Natixis Securities Americas LLC and Mizuho Securities USA Inc. were initialpurchasers in connection with our May 2012 and September 2012 offerings of the 2019 Notes.
Affiliates of Morgan Stanley & Co. LLC, Goldman, Sachs & Co., Merrill Lynch, Pierce, Fenner & SmithIncorporated, Deutsche Bank Securities Inc., Natixis Securities Americas LLC and Mizuho Securities USA Inc.are lenders and/or agents under our senior secured credit facilities.
We and the several underwriters have agreed to indemnify each other against certain liabilities, includingliabilities under the Securities Act.
A prospectus in electronic format may be made available on websites maintained by one or moreunderwriters, or selling group members, if any, participating in this offering. The representatives may agree toallocate a number of shares of common stock to underwriters for sale to their online brokerage account holders.Internet distributions will be allocated by the representatives to underwriters that may make Internet distributionson the same basis as other allocations.
Conflicts of Interest
Certain affiliates of TPG Capital BD, LLC, an underwriter of this offering, will own in excess of 10% of ourissued and outstanding common stock following this offering. In addition, the TPG Funds are affiliates of TPGCapital BD, LLC and, as holders of a portion of our Series A Preferred Stock, they will receive more than 5% ofthe net proceeds of this offering, based upon an assumed initial public offering price of $19.00 per share, themidpoint of the range set forth on the cover page of this prospectus.
As a result of the foregoing relationships, TPG Capital BD, LLC is deemed to have a “conflict of interest”within the meaning of FINRA Rule 5121. Accordingly, this offering will be made in compliance with theapplicable provisions of FINRA Rule 5121. Pursuant to that rule, the appointment of a qualified independentunderwriter is not necessary in connection with this offering. In accordance with FINRA Rule 5121(c), no salesof the shares will be made to any discretionary account over which TPG Capital BD, LLC exercises discretionwithout the prior specific written approval of the account holder.
Selling Restrictions
European Economic Area
In relation to each Member State of the European Economic Area which has implemented the ProspectusDirective (each referred to as a “Relevant Member State”), each underwriter has represented and agreed that witheffect from and including the date on which the Prospectus Directive is implemented in that Relevant MemberState (the “Relevant Implementation Date”), it has not made and will not make an offer of shares to the publicwhich are the subject of the offering contemplated by this prospectus in that Relevant Member State, except thatan offer to the public in that Relevant Member State of any shares may be made at any time with effect from andincluding the Relevant Implementation Date under the following exemptions under the Prospectus Directive, ifthey have been implemented in that Relevant Member State:
(a) to any legal entity which is a qualified investor as defined in the Prospectus Directive.
(b) to fewer than 100 or, if the Relevant Member State has implemented the relevant provision of the2010 PD Amending Directive, 150, natural or legal persons (other than qualified investors as defined in theProspectus Directive), as permitted under the Prospectus Directive subject to obtaining the prior consent ofthe relevant Dealer or Dealers nominated by the Issuer for any such offer; or
271
(c) in any other circumstances falling within Article 3(2) of the Prospectus Directive,
provided that no such offer of shares shall require the company or any underwriter to publish a prospectuspursuant to Article 3 of the Prospectus Directive.
For the purposes of this provision, the expression an “offer of shares to the public” in relation to any sharesin any Relevant Member State means the communication in any form and by any means of sufficient informationon the terms of the offer and the shares to be offered so as to enable an investor to decide to purchase orsubscribe for the shares, as the same may be varied in that Member State by any measure implementing theProspectus Directive in that Member State, the expression “Prospectus Directive” means Directive 2003/71/EC(and amendments thereto, including the 2010 PD Amending Directive, to the extent implemented in the RelevantMember State), and includes any relevant implementing measure in the Relevant Member State and theexpression “2010 PD Amending Directive” means Directive 2010/73/EU.
This EEA selling restriction is in addition to any other selling restrictions set out in this prospectus.
United Kingdom
Each underwriter has represented, warranted and agreed that:
(a) it has only communicated or caused to be communicated and will only communicate or cause to becommunicated an invitation or inducement to engage in investment activity (within the meaning ofSection 21 of the FSMA) received by it in connection with the issue or sale of the shares in circumstances inwhich Section 21(1) of the FSMA does not apply to the Issuer or the Guarantors; and
(b) it has complied and will comply with all applicable provisions of the FSMA with respect toanything done by it in relation to the shares in, from or otherwise involving the United Kingdom.
France
Neither this prospectus nor any other offering material relating to the shares described in this prospectus hasbeen submitted to the clearance procedures of the Autorité des Marchés Financiers or of the competent authority ofanother member state of the European Economic Area and notified to the Autorité des Marchés Financiers and tothe company. The shares have not been offered or sold and will not be offered or sold, directly or indirectly, to thepublic in France. Neither this prospectus nor any other offering material relating to the shares has been or will be:
• released, issued, distributed or caused to be released, issued or distributed to the public in France; or
• used in connection with any offer for subscription or sale of the shares to the public in France.
Such offers, sales and distributions have been and will only be made in France:
• to qualified investors (investisseurs qualifiés), other than individuals, and/or to a restricted circle ofinvestors (cercle restreint d’investisseurs), other than individuals, in each case investing for their ownaccount, all as defined in, and in accordance with articles L.411-2, D.411-1, D. 411-4, D.734-1,D.744-1, D.754-1 and D.764-1 of the French Code monétaire et financier;
• to investment services providers authorized to engage in portfolio management on behalf of thirdparties; or
• in a transaction that, in accordance with article L.411-2-I-1°-or-2°-or 3° of the French Code monétaireet financier and article 211-2 of the General Regulations (Règlement Général) of the Autorité desMarchés Financiers, does not constitute a public offer.
The shares may be resold directly or indirectly, only in compliance with articles L.411-1, L.411-2, L.412-1and L.621-8 through L.621-8-3 of the French Code monétaire et financier and applicable regulations thereunder.
272
Hong Kong
The shares may not be offered or sold in Hong Kong by means of any document other than (i) incircumstances which do not constitute an offer to the public within the meaning of the Companies Ordinance(Cap.32, Laws of Hong Kong), or (ii) to “professional investors” within the meaning of the Securities andFutures Ordinance (Cap.571, Laws of Hong Kong) and any rules made thereunder, or (iii) in other circumstanceswhich do not result in the document being a “prospectus” within the meaning of the Companies Ordinance(Cap.32, Laws of Hong Kong), and no advertisement, invitation or document relating to the shares may be issuedor may be in the possession of any person for the purpose of issue (in each case whether in Hong Kong orelsewhere), which is directed at, or the contents of which are likely to be accessed or read by, the public in HongKong (except if permitted to do so under the laws of Hong Kong) other than with respect to shares which are orare intended to be disposed of only to persons outside Hong Kong or only to “professional investors” within themeaning of the Securities and Futures Ordinance (Cap. 571, Laws of Hong Kong) and any rules made thereunder.
Singapore
This prospectus has not been registered as a prospectus with the Monetary Authority of Singapore.Accordingly, this prospectus and any other document or material in connection with the offer or sale, or invitationfor subscription or purchase, of the shares may not be circulated or distributed, nor may the shares be offered orsold, or be made the subject of an invitation for subscription or purchase, whether directly or indirectly, to personsin Singapore other than (i) to an institutional investor under Section 274 of the Securities and Futures Act, Chapter289 of Singapore (the “SFA”), (ii) to a relevant person pursuant to Section 275(1), or any person pursuant toSection 275(1A), and in accordance with the conditions, specified in Section 275 of the SFA or (iii) otherwisepursuant to, and in accordance with the conditions of, any other applicable provision of the SFA.
Where the shares are subscribed or purchased under Section 275 by a relevant person which is: (a) acorporation (which is not an accredited investor (as defined in Section 4A of the SFA)) the sole business ofwhich is to hold investments and the entire share capital of which is owned by one or more individuals, each ofwhom is an accredited investor; or (b) a trust (where the trustee is not an accredited investor) whose sole purposeis to hold investments and each beneficiary is an accredited investor, shares, debentures and units of shares anddebentures of that corporation or the beneficiaries’ rights and interest in that trust shall not be transferable for6 months after that corporation or that trust has acquired the shares under Section 275 except: (1) to aninstitutional investor under Section 274 of the SFA or to a relevant person, or any person pursuant toSection 275(1A), and in accordance with the conditions, specified in Section 275 of the SFA; (2) where noconsideration is given for the transfer; or (3) by operation of law.
Japan
The shares offered in this prospectus have not been and will not be registered under the FinancialInstruments and Exchange Act of Japan (the “Financial Instruments and Exchange Act”). Each underwriter hasagreed that the shares have not been offered or sold and will not be offered or sold, directly or indirectly, in Japanor to or for the account of any resident of Japan, (which term as used herein means any person resident in Japan,including any corporation or other entity organized under the laws of Japan) or to others for re-offering or resale,directly or indirectly, in Japan or to a resident of Japan, except (i) pursuant to an exemption from the registrationrequirements of the Financial Instruments and Exchange Act and (ii) in compliance with any other applicablerequirements of the Financial Instruments and Exchange Act and any other applicable laws, regulations andministerial guidelines of Japan.
Switzerland
This document as well as any other offering or marketing material relating to the shares which are thesubject of the offering contemplated by this prospectus has been prepared without regard to the disclosurestandards for issuance prospectuses under art. 652a or art. 1156 of the Swiss Code of Obligations. The shares will
273
not be listed on the SIX Swiss Exchange and, therefore, the documents relating to the shares, including, but notlimited to, this document, do not claim to comply with the disclosure standards of the listing rules of SIX SwissExchange and corresponding prospectus schemes annexed to the listing rules of the SIX Swiss Exchange.
Neither this document nor any other offering or marketing material relating to the shares which are the subjectof the offering contemplated by this prospectus will be filed with or approved by any Swiss regulatory authority. Inparticular, this document will not be filed with, and the offer of shares will not be supervised by, the Swiss FinancialMarket Supervisory Authority FINMA, and the offer of shares has not been and will not be authorized under theSwiss Federal Act on Collective Investment Schemes (“CISA”). The investor protection afforded to acquirers ofinterests in collective investment schemes under the CISA does not extend to acquirers of shares.
The shares are being offered in Switzerland by way of a private placement, i.e., to a small number ofselected investors only, without any public offer and only to investors who do not purchase the shares with theintention to distribute them to the public. The investors will be individually approached by the company fromtime to time.
This document as well as any other material relating to the shares is personal and confidential and do notconstitute an offer to any other person. This document may only be used by those investors to whom it has beenhanded out in connection with the offering described herein and may neither directly nor indirectly be distributedor made available to other persons without express consent of the company. It may not be used in connectionwith any other offer and shall in particular not be copied and/or distributed to the public in (or from) Switzerland.
Dubai International Financial Centre
This document relates to an Exempt Offer in accordance with the Offered Securities Rules of the DubaiFinancial Services Authority. This document is intended for distribution only to persons of a type specified inthose rules. It must not be delivered to, or relied on by, any other person. The Dubai Financial Services Authorityhas no responsibility for reviewing or verifying any documents in connection with Exempt Offers. The DubaiFinancial Services Authority has not approved this document nor taken steps to verify the information set out init, and has no responsibility for it. The shares which are the subject of the offering contemplated by thisprospectus may be illiquid and/or subject to restrictions on their resale.
Prospective purchasers of the shares offered should conduct their own due diligence on the shares. If you donot understand the contents of this document you should consult an authorised financial adviser.
Australia
No placement document, prospectus, product disclosure statement or other disclosure document has beenlodged with the Australian Securities and Investments Commission (“ASIC”), in relation to the offering. Thisprospectus does not constitute a prospectus, product disclosure statement or other disclosure document under theCorporations Act 2001 (the “Corporations Act”), and does not purport to include the information required for aprospectus, product disclosure statement or other disclosure document under the Corporations Act.
Any offer in Australia of the shares may only be made to persons (the “Exempt Investors”) who are“sophisticated investors” (within the meaning of section 708(8) of the Corporations Act), “professionalinvestors” (within the meaning of section 708(11) of the Corporations Act) or otherwise pursuant to one or moreexemptions contained in section 708 of the Corporations Act so that it is lawful to offer the shares withoutdisclosure to investors under Chapter 6D of the Corporations Act.
The shares applied for by Exempt Investors in Australia must not be offered for sale in Australia in theperiod of 12 months after the date of allotment under the offering, except in circumstances where disclosure toinvestors under Chapter 6D of the Corporations Act would not be required pursuant to an exemption under
274

section 708 of the Corporations Act or otherwise or where the offer is pursuant to a disclosure document whichcomplies with Chapter 6D of the Corporations Act. Any person acquiring shares must observe such Australianon-sale restrictions.
This prospectus contains general information only and does not take account of the investment objectives,financial situation or particular needs of any particular person. It does not contain any securitiesrecommendations or financial product advice. Before making an investment decision, investors need to considerwhether the information in this prospectus is appropriate to their needs, objectives and circumstances, and, ifnecessary, seek expert advice on those matters.
People’s Republic of China
The shares may not be offered or sold directly or indirectly in the People’s Republic of China (the “PRC”)(which, for such purposes, does not include the Hong Kong or Macau Special Administrative Regions orTaiwan), except pursuant to applicable laws and regulations of the PRC. Neither this prospectus nor any materialor information contained herein relating to the shares, which have not been and will not be submitted to orapproved/verified by or registered with the China Securities Regulatory Commission (the “CSRC”), or otherrelevant governmental authorities in the PRC pursuant to relevant laws and regulations, may be supplied to thepublic in the PRC or used in connection with any offer for the subscription or sale of the shares in the PRC. Thematerial or information contained herein relating to the shares does not constitute an offer to sell or thesolicitation of an offer to buy any securities in the PRC. The shares may only be offered or sold to the PRCinvestors that are authorized to engage in the purchase of securities of the type being offered or sold. PRCinvestors are responsible for obtaining all relevant government regulatory approvals/licenses, verification and/orregistrations themselves, including, but not limited to, any which may be required from the CSRC, the StateAdministration of Foreign Exchange and/or the China Banking Regulatory Commission, and complying with allrelevant PRC regulations, including, but not limited to, all relevant foreign exchange regulations and/or foreigninvestment regulations.
275

LEGAL MATTERS
Cleary Gottlieb Steen & Hamilton LLP will pass on the legality of the shares of common stock to be issuedin this offering. Certain legal matters in connection with this offering will be passed upon for the underwriters byRopes & Gray LLP.
276
EXPERTS
The consolidated financial statements and schedule of Sabre Corporation at December 31, 2013 and 2012,and for each of the three years in the period ended December 31, 2013, appearing in this prospectus andregistration statement have been audited by Ernst & Young LLP, independent registered public accounting firm,as set forth in their report thereon appearing elsewhere herein, and are included in reliance upon such reportgiven on the authority of such firm as experts in accounting and auditing.
The combined balance sheets of PRISM Group, Inc. and Affiliate as of December 31, 2011 and 2010, andthe related combined statements of income, changes in stockholder’s/member’s equity, and cash flows for theyears then ended included in this prospectus, have been so included in reliance on the report of REDW LLC,independent auditors, given on the authority of that firm as experts in auditing and accounting.
277

WHERE YOU CAN FIND MORE INFORMATION
We have filed with the SEC a registration statement on Form S-1 under the Securities Act, with respect toour common stock offered by this prospectus. This prospectus, which forms part of the registration statement,does not contain all of the information set forth in the registration statement and the exhibits to the registrationstatement. Some items are omitted in accordance with the rules and regulations of the SEC. For furtherinformation about us and our common stock, we refer you to the registration statement and the exhibits to theregistration statement filed as part of the registration statement. You may read and copy the registrationstatement, including the exhibits to the registration statement, at the SEC’s Public Reference Room at 100 FStreet, N.E., Washington, D.C. 20549. You can also request copies of those documents, upon payment of aduplicating fee, by writing to the SEC. For further information on the operation of the Public Reference Room,please call the SEC at 1-800-SEC-0330. In addition, the SEC maintains an Internet site at www.sec.gov, fromwhich you can electronically access the registration statement, including the exhibits to the registration statement.
As a result of this offering, we will become subject to the full informational requirements of the ExchangeAct. We will fulfill our obligations with respect to such requirements by filing periodic reports and otherinformation with the SEC. We intend to furnish our stockholders with annual reports containing financialstatements that have been examined and reported on, with an opinion expressed by an independent registeredpublic accounting firm. We also maintain an Internet site at www.sabre.com. The information contained on ourwebsite or that can be accessed through our website will not be deemed to be incorporated into this prospectus orthe registration statement of which this prospectus forms a part, and investors should not rely on any suchinformation in deciding whether to purchase our common stock.
278

INDEX TO FINANCIAL STATEMENTS
SABRE CORPORATION
Audited Consolidated Financial StatementsReport of Independent Registered Public Accounting Firm F-2Consolidated Statements of Operations for the years ended December 31, 2013, 2012 and 2011 F-3Consolidated Statements of Comprehensive Loss for the years ended December 31, 2013, 2012 and 2011 F-4Consolidated Balance Sheets as of December 31, 2013 and 2012 F-5Consolidated Statements of Cash Flows for the years ended December 31, 2013, 2012 and 2011 F-6Consolidated Statements of Temporary Equity and Stockholders’ Equity (Deficit) for the years ended
December 31, 2013, 2012 and 2011 F-7Notes to Consolidated Financial Statements F-8Schedule II — Valuation and Qualifying Accounts F-73
PRISM GROUP, INC. AND AFFILIATE
Audited Combined Financial StatementsIndependent Auditors’ Report F-74Combined Balance Sheets as of December 31, 2011 and 2010 F-75Combined Statements of Income for the years ended December 31, 2011 and 2010 F-76Combined Statements of Changes in Stockholder’s/Member’s Equity for the years ended December 31,
2011 and 2010 F-77Combined Statements of Cash Flows for the years ended December 31, 2011 and 2010 F-78Notes to Combined Financial Statements F-79
F-1

Report of Independent Registered Public Accounting Firm
The Board of Directors and Stockholders of Sabre Corporation
We have audited the accompanying consolidated balance sheets of Sabre Corporation as of December 31, 2013and 2012, and the related consolidated statements of operations, comprehensive loss, temporary equity andstockholders’ equity (deficit), and cash flows for each of the three years in the period ended December 31, 2013.Our audits also included the financial statement schedule listed in the Index at Item 16(b). These financialstatements and schedule are the responsibility of the Company’s management. Our responsibility is to express anopinion on these financial statements and the schedule based on our audits.
We conducted our audits in accordance with the standards of the Public Company Accounting Oversight Board(United States). Those standards require that we plan and perform the audit to obtain reasonable assurance aboutwhether the financial statements are free of material misstatement. We were not engaged to perform an audit ofthe Company’s internal control over financial reporting. Our audits included consideration of internal controlover financial reporting as a basis for designing audit procedures that are appropriate in the circumstances, butnot for the purpose of expressing an opinion on the effectiveness of the Company’s internal control over financialreporting. Accordingly, we express no such opinion. An audit also includes examining, on a test basis, evidencesupporting the amounts and disclosures in the financial statements, assessing the accounting principles used andsignificant estimates made by management, and evaluating the overall financial statement presentation. Webelieve that our audits provide a reasonable basis for our opinion.
In our opinion, the financial statements referred to above present fairly, in all material respects, the consolidatedfinancial position of Sabre Corporation at December 31, 2013 and 2012, and the consolidated results of itsoperations and its cash flows for each of the three years in the period ended December 31, 2013, in conformitywith U.S. generally accepted accounting principles. Also, in our opinion, the related financial statement schedule,when considered in relation to the basic financial statements taken as a whole, presents fairly in all materialrespects the information set forth therein.
/s/ ERNST & YOUNG LLP
Dallas, TexasMarch 10, 2014
F-2

SABRE CORPORATIONCONSOLIDATED STATEMENTS OF OPERATIONS
Year Ended December 31,
2013 2012 2011
(Amounts in thousands, except per share data)
Revenue $3,049,525 $2,974,364 $2,855,961Cost of revenue (1) (2) 1,904,850 1,819,235 1,736,041Selling, general and administrative (2) 792,929 1,188,248 806,435Impairment 138,435 573,180 185,240Restructuring charges 36,551 — —
Operating income (loss) 176,760 (606,299) 128,245Other income (expense):
Interest expense, net (274,689) (232,450) (174,390)Loss on extinguishment of debt (12,181) — —Gain on sale of business — 25,850 —Joint venture equity income 15,554 24,487 26,701Joint venture goodwill impairment and intangible amortization (3,204) (27,000) (3,200)Other, net (6,724) (1,385) 1,156
Total other expense, net (281,244) (210,498) (149,733)
Loss from continuing operations before income taxes (104,484) (816,797) (21,488)(Benefit) provision for income taxes (14,029) (195,071) 57,806
Loss from continuing operations (90,455) (621,726) (79,294)Loss from discontinued operations, net of tax (7,176) (48,947) (23,461)
Net loss (97,631) (670,673) (102,755)Net income (loss) attributable to noncontrolling interests 2,863 (59,317) (36,681)
Net loss attributable to Sabre Corporation (100,494) (611,356) (66,074)Preferred stock dividends 36,704 34,583 32,579
Net loss attributable to common shareholders $ (137,198) $ (645,939) $ (98,653)
Basic and diluted loss per share:Continuing operations $ (0.73) $ (3.37) $ (0.43)Discontinued operations (0.04) (0.28) (0.13)Basic and diluted loss per share attributable to common
shareholders (0.77) (3.65) (0.56)
Basic and diluted weighted average common shares outstanding 178,125 177,206 176,703
Pro Forma basic and diluted loss per share from continuing operationsavailable to common shareholders (unaudited) (Note 23) $ (0.30)
(1) Includes amortization of upfront incentive consideration $ 36,649 $ 36,527 $ 37,748(2) Includes stock-based compensation as follows:
Cost of revenue $ 1,702 $ 1,715 $ 1,454Selling, general and administrative 7,384 8,119 5,880
See Notes to Consolidated Financial Statements.
F-3
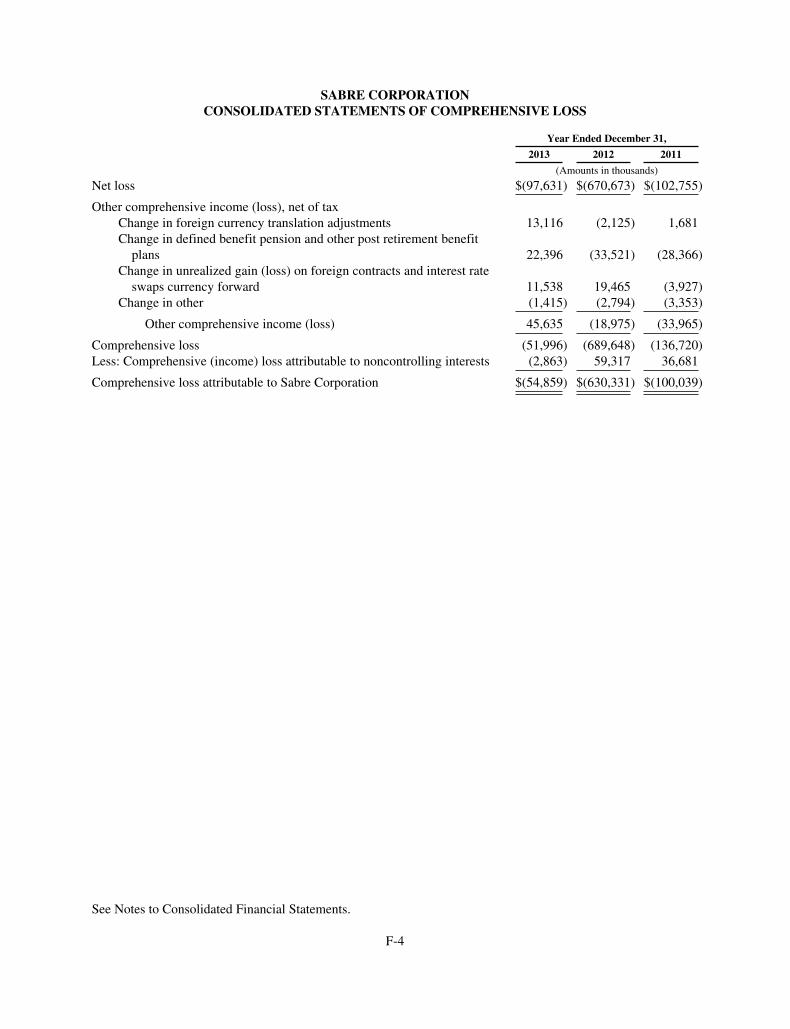
SABRE CORPORATIONCONSOLIDATED STATEMENTS OF COMPREHENSIVE LOSS
Year Ended December 31,
2013 2012 2011
(Amounts in thousands)
Net loss $(97,631) $(670,673) $(102,755)
Other comprehensive income (loss), net of taxChange in foreign currency translation adjustments 13,116 (2,125) 1,681Change in defined benefit pension and other post retirement benefit
plans 22,396 (33,521) (28,366)Change in unrealized gain (loss) on foreign contracts and interest rate
swaps currency forward 11,538 19,465 (3,927)Change in other (1,415) (2,794) (3,353)
Other comprehensive income (loss) 45,635 (18,975) (33,965)
Comprehensive loss (51,996) (689,648) (136,720)Less: Comprehensive (income) loss attributable to noncontrolling interests (2,863) 59,317 36,681
Comprehensive loss attributable to Sabre Corporation $(54,859) $(630,331) $(100,039)
See Notes to Consolidated Financial Statements.
F-4
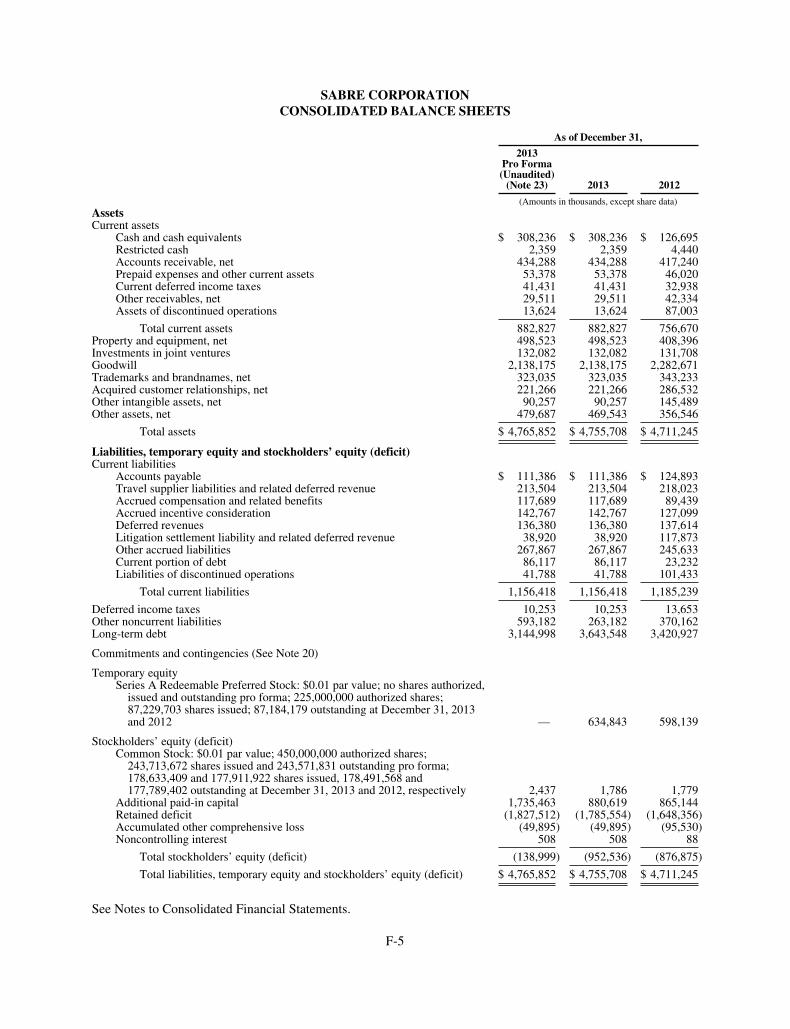
SABRE CORPORATIONCONSOLIDATED BALANCE SHEETS
As of December 31,
2013Pro Forma(Unaudited)
(Note 23) 2013 2012
(Amounts in thousands, except share data)AssetsCurrent assets
Cash and cash equivalents $ 308,236 $ 308,236 $ 126,695Restricted cash 2,359 2,359 4,440Accounts receivable, net 434,288 434,288 417,240Prepaid expenses and other current assets 53,378 53,378 46,020Current deferred income taxes 41,431 41,431 32,938Other receivables, net 29,511 29,511 42,334Assets of discontinued operations 13,624 13,624 87,003
Total current assets 882,827 882,827 756,670Property and equipment, net 498,523 498,523 408,396Investments in joint ventures 132,082 132,082 131,708Goodwill 2,138,175 2,138,175 2,282,671Trademarks and brandnames, net 323,035 323,035 343,233Acquired customer relationships, net 221,266 221,266 286,532Other intangible assets, net 90,257 90,257 145,489Other assets, net 479,687 469,543 356,546
Total assets $ 4,765,852 $ 4,755,708 $ 4,711,245
Liabilities, temporary equity and stockholders’ equity (deficit)Current liabilities
Accounts payable $ 111,386 $ 111,386 $ 124,893Travel supplier liabilities and related deferred revenue 213,504 213,504 218,023Accrued compensation and related benefits 117,689 117,689 89,439Accrued incentive consideration 142,767 142,767 127,099Deferred revenues 136,380 136,380 137,614Litigation settlement liability and related deferred revenue 38,920 38,920 117,873Other accrued liabilities 267,867 267,867 245,633Current portion of debt 86,117 86,117 23,232Liabilities of discontinued operations 41,788 41,788 101,433
Total current liabilities 1,156,418 1,156,418 1,185,239
Deferred income taxes 10,253 10,253 13,653Other noncurrent liabilities 593,182 263,182 370,162Long-term debt 3,144,998 3,643,548 3,420,927
Commitments and contingencies (See Note 20)
Temporary equitySeries A Redeemable Preferred Stock: $0.01 par value; no shares authorized,
issued and outstanding pro forma; 225,000,000 authorized shares;87,229,703 shares issued; 87,184,179 outstanding at December 31, 2013and 2012 — 634,843 598,139
Stockholders’ equity (deficit)Common Stock: $0.01 par value; 450,000,000 authorized shares;
243,713,672 shares issued and 243,571,831 outstanding pro forma;178,633,409 and 177,911,922 shares issued, 178,491,568 and177,789,402 outstanding at December 31, 2013 and 2012, respectively 2,437 1,786 1,779
Additional paid-in capital 1,735,463 880,619 865,144Retained deficit (1,827,512) (1,785,554) (1,648,356)Accumulated other comprehensive loss (49,895) (49,895) (95,530)Noncontrolling interest 508 508 88
Total stockholders’ equity (deficit) (138,999) (952,536) (876,875)
Total liabilities, temporary equity and stockholders’ equity (deficit) $ 4,765,852 $ 4,755,708 $ 4,711,245
See Notes to Consolidated Financial Statements.
F-5

SABRE CORPORATIONCONSOLIDATED STATEMENTS OF CASH FLOWS
Year Ended December 31,
2013 2012 2011
(Amounts in thousands)Operating ActivitiesNet loss $ (97,631) $ (670,673) $ (102,755)Adjustments to reconcile net loss to cash provided by operating activities:
Depreciation and amortization 307,595 315,733 293,117Litigation related charges, net 8,156 345,048 —Impairment 138,435 573,180 185,240Restructuring charges 4,089 — —Gain on sale of business — (25,850) —Stock-based compensation for employees 9,086 9,834 7,334Allowance for doubtful accounts 9,439 4,328 3,467Deferred income taxes (64,690) (232,273) 34,409Joint venture equity income (15,554) (24,487) (26,701)Joint venture goodwill impairment and intangible amortization 3,204 27,000 3,200Distributions of income from joint venture investments 10,560 21,076 13,343Amortization of debt issuance costs 7,104 23,265 12,539Third-party fees expensed in connection with the debt modification 14,003 7,600 —Loss on extinguishment of debt 12,181 — —Other (5,619) (9,866) (22,173)Loss from discontinued operations 7,176 48,947 23,461Changes in operating assets and liabilities:
Accounts and other receivables (29,150) (2,691) (49,220)Prepaid expenses and other current assets (4,480) (3,374) 8,680Capitalized implementation costs (58,814) (78,543) (59,109)Other assets (64,259) (8,704) (52,817)Accounts payable and other accrued liabilities (31,064) 13,022 93,735Pensions and other postretirement benefits (2,579) (20,236) (9,306)
Cash provided by operating activities 157,188 312,336 356,444
Investing ActivitiesAdditions to property and equipment (226,026) (193,262) (164,638)Acquisitions, net of cash acquired (30,200) (72,441) (11,338)Proceeds from sale of assets and businesses 10,000 27,915 —Proceeds from sale of equity securities — 6,355 —Other investing activities (276) (4,601) (284)
Cash used in investing activities (246,502) (236,034) (176,260)
Financing ActivitiesProceeds of borrowings from lenders 2,540,063 2,225,082 —Payments on borrowings from lenders (2,261,061) (2,924,745) (30,150)Proceeds from borrowings on revolving credit facility — 518,200 1,007,100Payments on borrowings under revolving credit facility — (600,200) (925,100)Proceeds of borrowings under secured notes — 801,500 —Payments on borrowings under unsecured notes — — (324,188)Debt issuance costs (19,116) (43,275) —Proceeds from exercise of stock options 3,073 2,696 1,202Dividends paid (2,443) (2,214) (1,843)Decrease (increase) in restricted cash 2,081 4,346 (5,342)Other financing activities (425) (6,510) 6,781
Cash provided by (used in) financing activities 262,172 (25,120) (271,540)
Cash Flows from Discontinued OperationsNet cash provided by (used in) operating activities (14,096) (6,582) (25,241)Net cash provided by (used in) investing activities (6) 270 (4,550)Proceeds from sale, net of cash sold 20,502 19,157 —
Net cash provided by (used in) discontinued operations 6,400 12,845 (29,791)Effect of exchange rate changes on cash and cash equivalents 2,283 4,318 2,976
Increase (decrease) in cash and cash equivalents 181,541 68,345 (118,171)Cash and cash equivalents at beginning of period 126,695 58,350 176,521
Cash and cash equivalents at end of period $ 308,236 $ 126,695 $ 58,350
Cash payments for income taxes $ 4,224 $ 20,177 $ 32,491Cash payments for interest $ 255,620 $ 264,990 $ 184,449Capitalized interest $ 10,966 $ 8,705 $ 6,899Preferred shares dividend $ 36,704 $ 34,583 $ 32,579
See Notes to Consolidated Financial Statements.
F-6
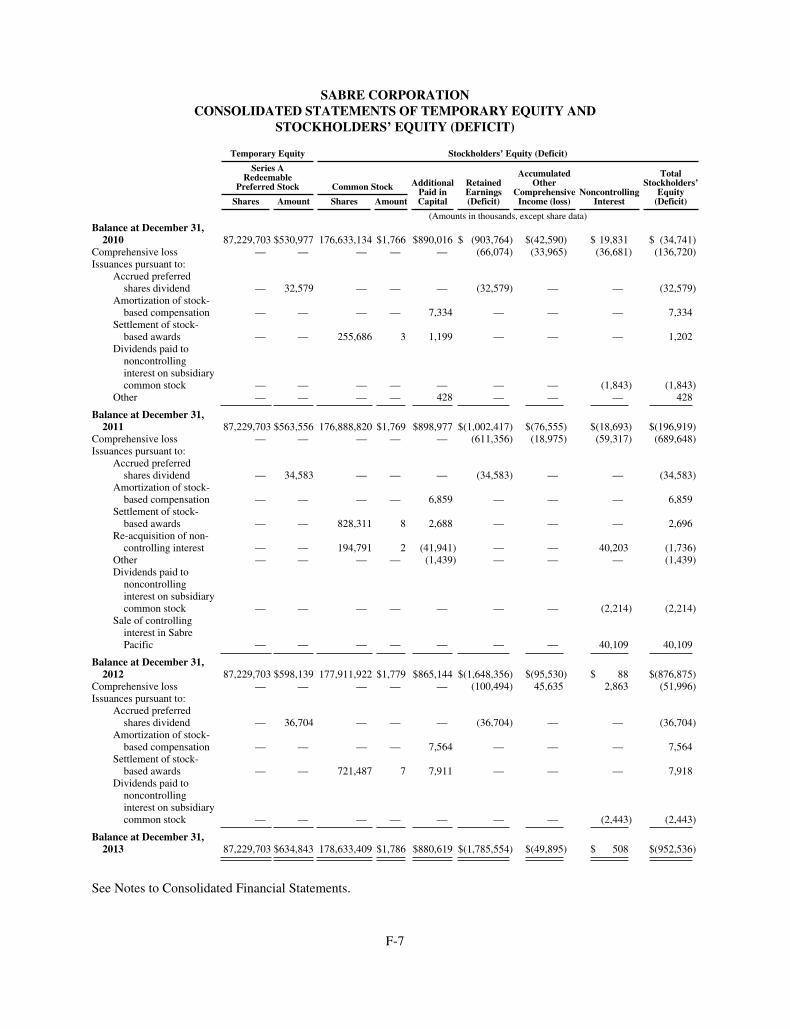
SABRE CORPORATIONCONSOLIDATED STATEMENTS OF TEMPORARY EQUITY AND
STOCKHOLDERS’ EQUITY (DEFICIT)
Temporary Equity Stockholders’ Equity (Deficit)
Series ARedeemable
Preferred Stock Common Stock AdditionalPaid inCapital
RetainedEarnings(Deficit)
AccumulatedOther
ComprehensiveIncome (loss)
NoncontrollingInterest
TotalStockholders’
Equity(Deficit)Shares Amount Shares Amount
(Amounts in thousands, except share data)Balance at December 31,
2010 87,229,703 $530,977 176,633,134 $1,766 $890,016 $ (903,764) $(42,590) $ 19,831 $ (34,741)Comprehensive loss — — — — — (66,074) (33,965) (36,681) (136,720)Issuances pursuant to:
Accrued preferredshares dividend — 32,579 — — — (32,579) — — (32,579)
Amortization of stock-based compensation — — — — 7,334 — — — 7,334
Settlement of stock-based awards — — 255,686 3 1,199 — — — 1,202
Dividends paid tononcontrollinginterest on subsidiarycommon stock — — — — — — — (1,843) (1,843)
Other — — — — 428 — — — 428
Balance at December 31,2011 87,229,703 $563,556 176,888,820 $1,769 $898,977 $(1,002,417) $(76,555) $(18,693) $(196,919)
Comprehensive loss — — — — — (611,356) (18,975) (59,317) (689,648)Issuances pursuant to:
Accrued preferredshares dividend — 34,583 — — — (34,583) — — (34,583)
Amortization of stock-based compensation — — — — 6,859 — — — 6,859
Settlement of stock-based awards — — 828,311 8 2,688 — — — 2,696
Re-acquisition of non-controlling interest — — 194,791 2 (41,941) — — 40,203 (1,736)
Other — — — — (1,439) — — — (1,439)Dividends paid to
noncontrollinginterest on subsidiarycommon stock — — — — — — — (2,214) (2,214)
Sale of controllinginterest in SabrePacific — — — — — — — 40,109 40,109
Balance at December 31,2012 87,229,703 $598,139 177,911,922 $1,779 $865,144 $(1,648,356) $(95,530) $ 88 $(876,875)
Comprehensive loss — — — — — (100,494) 45,635 2,863 (51,996)Issuances pursuant to:
Accrued preferredshares dividend — 36,704 — — — (36,704) — — (36,704)
Amortization of stock-based compensation — — — — 7,564 — — — 7,564
Settlement of stock-based awards — — 721,487 7 7,911 — — — 7,918
Dividends paid tononcontrollinginterest on subsidiarycommon stock — — — — — — — (2,443) (2,443)
Balance at December 31,2013 87,229,703 $634,843 178,633,409 $1,786 $880,619 $(1,785,554) $(49,895) $ 508 $(952,536)
See Notes to Consolidated Financial Statements.
F-7
SABRE CORPORATION
NOTES TO CONSOLIDATED FINANCIAL STATEMENTS
1. General Information
Sabre Corporation is a Delaware corporation formed in December 2006. On March 30, 2007, SabreCorporation acquired Sabre Holdings Corporation (“Sabre Holdings”). Sabre Holdings is the sole subsidiary ofSabre Corporation. Sabre GLBL Inc. is the principal operating subsidiary and sole direct subsidiary of SabreHoldings. Sabre GLBL Inc. or its direct or indirect subsidiaries conduct all of our businesses. In theseconsolidated financial statements, references to the “Company”, “we”, “our”, “ours” and “us” refer to SabreCorporation and its consolidated subsidiaries unless otherwise stated or the context otherwise requires.
We are a leading technology solutions provider to the global travel and tourism industry. We operatethrough three business segments: (i) Travel Network, our global travel marketplace for travel suppliers and travelbuyers, (ii) Airline and Hospitality Solutions, an extensive suite of travel industry leading software solutionsprimarily for airlines and hotel properties, and (iii) Travelocity, our portfolio of online consumer travel e-commerce businesses through which we provide travel content and booking functionality primarily for leisuretravelers.
Travel Network
Travel Network is our global business-to-business travel marketplace and consists primarily of our globaldistribution system (“GDS”), which serves the role of a transaction processor for the travel industry, and a broadset of solutions that integrate with our GDS to add value for travel supplies and travel buyers. Our GDSfacilitates travel by efficiently bringing together travel content such as inventory, prices, and availability from abroad array of travel suppliers, including airlines, hotels, car rental brands, rail carriers, cruise lines and touroperators, with a large network of travel buyers, including online and offline travel agencies, travel managementcompanies, and corporate travel departments. Travel Network primarily generates revenue through transaction-based fees.
Airline and Hospitality Solutions
Our Airline and Hospitality Solutions business offers a broad portfolio of software technology products andsolutions, through the software-as-a-service (“SaaS”) and hosted delivery model. Our Airline Solutions businessprovides comprehensive software solutions that help our airline customers better market, sell, serve and operate.We offer customizable reservations software that supports the essentials of a passenger service system. Our otherairline software solutions help airline customers make decisions around marketing and planning, merchandisingoffering and managing network operations. Our Hospitality Solutions business provides distribution, operationsand marketing solutions to hotel suppliers. Our offerings include reservations systems, property managementsystems, marketing services through our customers’ various distribution channels and consulting services. OurAirline and Hospitality Solutions primarily generates transaction-based fees for the usage of our softwarepursuant to contracts with terms that typically range between three and ten years and generally include minimumannual volume requirements.
Travelocity
Travelocity is our family of online consumer travel e-commerce businesses that serves primarily leisuretravelers. We connect these travelers with travel products and services across well-known and trusted globalbrands. Through our websites, travelers can research, shop and book airlines, hotels, car rental companies, cruiselines, vacation and last-minute travel packages Travelocity is comprised primarily of (i) Travelocity.com, anonline travel agency focusing on the United States and Canada, (ii) lastminute.com, an OTA focusing on Europe,
F-8

and (iii) Travel Partner Network (“TPN”), our business-to-business offering that provides travel content andbooking functionality to, as well as market and sell products and services through, private label websites forsuppliers and distribution partners. In the third quarter of 2013, we initiated plans to shift our Travelocitybusinesses in the United States and Canada away from a high fixed-cost model to a lower-cost, performance-based revenue structure. See Note 5, Restructuring Charges. In February 2014, we sold the assets associated withTPN. See Note 22, Subsequent Events.
2. Summary of Significant Accounting Policies
Basis of Presentation—The consolidated financial statements have been prepared in accordance withaccounting principles generally accepted in the United States (“GAAP”). We consolidate all of our majority-owned subsidiaries and companies over which we exercise control through majority voting rights. Other than asdiscussed in the following paragraphs, no other entities are currently consolidated due to control throughoperating agreements, financing agreements, or as the primary beneficiary of a variable interest entity. Theconsolidated financial statements include our accounts after elimination of all significant intercompany balancesand transactions. All dollar amounts in the financial statements and the tables in the notes, except per-shareamounts, are stated in thousands of U.S. dollars unless otherwise indicated. All amounts in the notes referenceresults from continuing operations unless otherwise indicated.
In December 2009, our wholly-owned subsidiary Travelocity.com Inc. was converted into Travelocity.comLLC, a Delaware limited liability company, pursuant to Delaware law, and the capital structure ofTravelocity.com LLC was split into common and preferred units. On December 31, 2009, 95% of the commonunits of Travelocity.com LLC were distributed as a dividend to a newly-formed Delaware corporation, TVLCommon, Inc., which is owned by the holders of record of Sabre Corporation’s preferred stock. We retained theremaining 5% of the common units and 100% of the preferred units. On December 31, 2012, we implemented aseries of transactions which resulted in the merger of TVL Common, Inc. back into our capital structure. Theowners of 95% of the common units of TVL Common, Inc. received shares of Sabre Corporation in exchange.For so long as any preferred units remained outstanding, the holder(s) of the preferred units had full voting rightsand control of Travelocity.com LLC and the holder(s) of common units had no voting rights or control. As such,we, as the holder of all of the preferred units, consolidated the results of Travelocity.com LLC and presented anoncontrolling interest for the portion of the common units distributed through the dividend. Profits and losseswere allocated in accordance with the limited liability company agreement and securities held by each party. Thismerger was a reacquisition of a noncontrolling interest from an entity under common control and has beenrecorded as an equity transaction.
Equity Method Investments—We utilize the equity method to account for our interests in joint ventures andinvestments in stock of other companies that we do not control but over which we exert significant influence.Investments in the common stock of other companies over which we do not exert significant influence areaccounted for at cost. We periodically evaluate equity and debt investments in entities accounted for at cost orunder the equity method for impairment by reviewing updated financial information provided by the investee,including valuation information from new financing transactions by the investee and information relating tocompetitors of investees when available. If we determine that a cost method investment is other than temporarilyimpaired, the carrying value of the investment is reduced to its estimated fair value through earnings. For the yearended December 31, 2012, joint venture equity income included a $24 million impairment of goodwill recordedby one of our investees. For the years ended December 31, 2013, 2012 and 2011, impairments of investmentscarried at cost were not material to our results of operations.
F-9
The following table displays the name of each of those investees that we do not control but over which weexert significant influence, and our voting interest in their stock held at December 31, 2013:
Joint VentureVotingInterest
Auto Holidays (Pty) Limited (South Africa) 50%ESS Elektroniczne Systemy Spzedazy Sp. zo.o 40%ABACUS International PTE Ltd 35%Sabre Bulgaria AD 20%
Our investments in joint ventures on the consolidated balance sheets includes $93 million and $97 million,as of December 31, 2013 and 2012, respectively, of excess basis over our underlying equity in joint ventures.This differential represents goodwill in addition to identifiable intangible assets which are being amortized tojoint venture intangible amortization over their estimated lives.
Reclassifications—Certain reclassifications have been made to the prior years’ consolidated financialstatements to conform to the 2013 presentation. Other than as described below, these reclassifications are notmaterial, either individually or in the aggregate, to our consolidated financial statements.
In 2013, we have removed the presentation of gross margin from our consolidated statement of operations.Additionally, we have reclassified depreciation and amortization from a single line in our consolidated statementof operations to be reflected as a part of cost of revenues or selling, general and administrative expenses based onthe nature of the expense. The impact to cost of revenue and selling, general and administrative, considering theimpact of discontinued operations, for the year ended December 31, 2012 was an increase to cost of revenue of$198 million and an increase to selling, general and administrative of $118 million. The impact for the yearended December 31, 2011 was an increase to cost of revenue of $173 million and an increase to selling, generaland administrative of $120 million. The amount of depreciation and amortization reclassified to discontinuedoperations was $2 million for each of the years ended December 31, 2012 and 2011.
In addition, certain amounts previously reported in our December 31, 2012 and 2011 financial statements havebeen reclassified to conform to December 31, 2013 presentation, as a result of discontinued operations. See Note 4,Discontinued Operations and Dispositions.
Use of Estimates—The preparation of these financial statements in conformity with GAAP requires thatcertain amounts be recorded based on estimates and assumptions made by management. Actual results coulddiffer from these estimates and assumptions. Our accounting policies, which include significant estimates andassumptions, include, among other things, estimation of the collectability of accounts receivable, amounts forfuture cancellations of bookings processed through the Sabre global distribution system (“GDS”), revenuerecognition for software development, determination of the fair value of assets and liabilities acquired in abusiness combination, determination of the fair value of derivatives, the evaluation of the recoverability of thecarrying value of intangible assets and goodwill, assumptions utilized in the determination of pension and otherpostretirement benefit liabilities, determination of the fair value of our litigation settlement payable, assumptionsmade in the calculation of restructuring liabilities and the evaluation of uncertainties surrounding the calculationof our tax assets and liabilities. These policies are discussed in greater detail below.
Revenue Recognition—We employ a number of revenue models across our businesses, depending on thedynamics of the industry segment and the technology on which the revenue is based. Some revenue models areused in multiple businesses. Travel Network primarily employs the transaction revenue model. Airline andHospitality Solutions primarily employs the SaaS and hosted and consulting revenue models, as well as thesoftware licensing fee model to a lesser extent. Travelocity has primarily employed two revenue models: themerchant model, which we refer to as our “Net Rate Program,” under which we recognize a majority of our hotelrevenues, and the agency model, under which we recognize most of our airline, car and cruise revenues and a
F-10

small portion of hotel revenues. Beginning in the fourth quarter of 2013, Travelocity in the U.S. and Canadabegan shifting to the marketing fee revenue model while Travelocity—Europe continues to primarily employ themerchant model and agency model. Both Travel Network and Travelocity derive some of their revenues from themedia model, earning advertising revenues from travel suppliers and other entities that advertise their products totravelers and travel agencies using our networks. We report revenue net of any revenue-based taxes assessed bygovernmental authorities that are imposed on and concurrent with specific revenue-producing transactions.
Transaction Revenue Model—This model accounts for substantially all of Travel Network’s revenues. Wedefine a direct billable booking as any booking that generates a fee directly to Travel Network. Transaction feesinclude, but are not limited to, transaction fees paid by travel suppliers for selling their inventory through the SabreGDS and transaction fees paid by travel agency subscribers related to their use of the Sabre GDS.
Pursuant to this model, a transaction occurs when a travel agency or corporate travel department books, orreserves, a travel supplier’s product on the Sabre GDS. We receive revenue from a travel supplier, travel agency,or corporate travel department depending upon the commercial arrangement represented in each of theircontracts.
Transaction revenue for airline travel reservations is recognized at the time of the booking of thereservation, net of estimated future cancellations. Our transaction fee cancellation reserve was $8 million atDecember 31, 2013 and 2012. Transaction revenue for car rental, hotel bookings and other travel providers isrecognized at the time the reservation is used by the customer.
Software-as-a-Service and Hosted Revenue Model—SaaS and hosted is the primary revenue modelemployed by Airline and Hospitality Solutions. In this revenue model, we host software solutions on our ownsecure platforms, or deploy it through our SaaS solutions and we maintain the software as well as theinfrastructure it employs. Our customers, which include airlines, airports and hotel companies, pay us animplementation fee and a recurring usage-based fee for the use of the software pursuant to contracts with termsthat typically range between three and ten years and generally include minimum annual volume requirements.This usage-based fee arrangement allows our customers to pay for software normally on a monthly basis, to theextent that it is used. Similar contracts with the same customer which are entered into at or around the sameperiod are analyzed for revenue recognition purposes on a combined basis. Revenue from implementation fees isgenerally recognized over the term of the agreement. The amount of periodic usage fees is typically based on ametric relevant to the software’s purpose. We recognize revenue from recurring usage-based fees in the periodearned, which typically fluctuates based on a real-time metric, such as the actual number of passengers boardedor the actual number of hotel bookings made in a given month.
Consulting Revenue Model—Our SaaS and hosted offerings can be sold as part of multiple-elementagreements for which we also provide consulting services. Our consulting services are primarily focused onhelping customers achieve better utilization of and return on their software investment. Often we provideconsulting services during the implementation phase of our SaaS solutions. In such cases, we account forconsulting service revenue separately from implementation and recurring usage-based fees, with value assignedto each element based on its relative selling price to the total selling price. We perform a market analysis on aperiodic basis to determine the range of selling prices for each product and service. Estimated selling prices areset for each product and service delivered to customers. The revenue for consulting services is generallyrecognized over the period the services are performed.
Software Licensing Fee Revenue Model—The software licensing fee revenue model is utilized by Airlineand Hospitality Solutions. Under this model, we generate revenue by charging customers for the installation anduse of our software products. Some contracts under this model generate additional revenue for the maintenanceof the software product. When software is sold without associated customization or implementation services,revenue from software licensing fees is recognized when all of the following are met: (i) the software isdelivered, (ii) fees are fixed or determinable, (iii) no undelivered elements are essential to the functionality of
F-11
delivered software, and (iv) collection is probable. When software is sold with customization or implementationservices, revenue from software licensing fees is recognized based on the percentage of completion of thecustomization and implementation services. Fees for software maintenance are recognized ratably over the life ofthe contract. We are unable to determine vendor-specific objective evidence of fair value for softwaremaintenance fees. Therefore, when fees for software maintenance are included in software license agreements,revenue from the software license, customization, implementation and the maintenance are recognized ratablyover the related contract term.
Marketing Fee Revenue Model—In the third quarter of 2013, we initiated plans to shift Travelocity in theU.S. and Canada away from a fixed-cost model to a lower-cost, performance based shared revenue structure. Weentered into an exclusive, long-term strategic marketing agreement with Expedia Inc., in which Expedia willpower the technology for Travelocity’s existing U.S. and Canadian websites, as well as provide Travelocity withaccess to Expedia’s supply and customer service platforms. As part of the agreement, Expedia is required to payus a performance-based marketing fee that will vary based on the amount of travel booked through Travelocity-branded websites powered by Expedia. The marketing fee we receive is recorded as revenue and the costs weincur for marketing and that are to promote the Travelocity brand are recorded as selling, general andadministrative expense in our results of operations. The revenue recognized under this model was not material toour results of operations for the year ended December 31, 2013. See Note 5, Restructuring Charges.
Merchant Revenue Model—Pursuant to this Travelocity model, which we refer to as our “Net RateProgram,” we are the merchant of record for credit card processing for travel accommodations. We primarily usethis model for revenue from hotel reservations and dynamically packaged combinations. We are the merchant ofrecord for these transactions, but we do not purchase and resell travel accommodations and do not have anyobligations with respect to travel accommodations offered online that we do not sell. Instead, we act as anintermediary by entering into agreements with travel suppliers for the right to market their products, services andother content offerings at pre-determined net rates. We market net rate offerings to travelers at prices that includean amount sufficient to pay the travel supplier for providing the travel accommodations and any occupancy andother local taxes, as well as additional amounts representing our service fees. Under this revenue model, werequire pre-payment by the traveler at the time of booking.
Travelocity recognizes net rate revenue for stand-alone air travel at the time the travel is booked with areserve for estimated future canceled bookings. Vacation packages, car rentals and hotel net rate revenues arerecognized at the date of consumption.
For Travelocity’s net rate and dynamically packaged combinations, we record net rate revenues based on thetotal amount paid by the customer for products and services, minus our payment to the travel supplier. At thetime a customer makes and prepays a reservation, we accrue a supplier liability based on the amount we expect tobe billed by our travel suppliers. In some cases, a portion of Travelocity’s prepaid net rate and travel packagetransactions goes unused by the traveler. In those circumstances, Travelocity may not be billed the full amount ofthe accrued supplier liability. We reduce the accrued supplier liability for amounts aged more than six monthsand record it as revenue if certain conditions are met. Our process for determining when aged amounts may berecognized as revenue includes consideration of key factors such as the age of the supplier liability, historicalbilling and payment information, among others.
Agency Revenue Model—This model is employed by Travelocity only and generates revenues viatransaction fees and commissions from travel suppliers for reservations made by travelers through our websites.Under this model, we act as an agent in the transaction by passing reservations booked by travelers to therelevant airline, hotel, car rental company, cruise line or other travel supplier, while the travel supplier serves asmerchant of record and processes the payment from the traveler.
Under the agency revenue model, Travelocity recognizes commission revenue for stand-alone air travel atthe time the travel is booked with a reserve for estimated future canceled bookings. Commissions from car and
F-12

hotel travel suppliers are recognized upon the scheduled date of travel consumption. We record car and hotelcommission revenue net of an estimated reserve for cancellations, no-shows, and uncollectable commissions. Asof December 31, 2013 and 2012, our reserve was approximately $2 million and $3 million, respectively.
Travelocity also generates revenues from fees for offline bookings for air and packages, which are generallybooked through call center agents. These fees, net of tax recovery charges collected, are recognized as revenue atthe time the related travel is booked or when the travel is canceled or changed. Travelocity also charges servicefees to its customers for certain types of transactions booked through its consumer-facing websites, includingprocessing service fees on Travelocity.com hotel bookings, as well as miscellaneous service fees includingcancellation fees, credit card fees, change fees and delivery fees. These fees, net of tax recovery chargescollected, are recognized as revenue at the time the related travel is booked or when the travel is canceled orchanged.
Travelocity also generates insurance-related revenue from third party insurance providers whose air, totaltrip and cruise insurance is made available on our websites. Insurance revenue is recognized at the time the travelis booked.
Media Revenue Model—The media revenue model is used to record advertising revenue from travelsuppliers and other entities that advertise their products to travelers on Travelocity’s sites and to a lesser extent,on our GDS. Advertisers use two types of advertising metrics: display advertising and action advertising. Indisplay advertising, advertisers usually pay based on the number of customers who view the advertisement, andare charged based on cost per thousand impressions. In action advertising, advertisers usually pay based on thenumber of customers who perform a specific action, such as click on the advertisement, or other meaningfulvariable, and are charged based on the cost per action. Advertising revenues are recognized in the period that theadvertising impressions are delivered or the click-through or other specific action occurs.
Advertising Costs—Advertising costs are expensed as incurred. Advertising costs expensed in the yearsended December 31, 2013, 2012 and 2011 totaled approximately $153 million, $163 million and $191 million,respectively. From time to time, we enter into advertising barter transactions which are recorded based on the fairvalue of the advertising surrendered. For the years ended December 31, 2013, 2012 and 2011, we recognizedrevenue associated with advertising barter transactions of $2 million, $9 million and $16 million, respectively,and expense of $2 million, $9 million and $16 million, respectively.
Research and Development—We define research and development costs as costs incurred up to the point oftechnological feasibility for software developed to be sold, leased, or marketed to others. Research anddevelopment costs are expensed as incurred. We expensed approximated $6 million, $4 million and $3 million ofresearch and development costs for the years ended December 31, 2013, 2012 and 2011, respectively.
Foreign Currency Risk—We are exposed to foreign exchange rate fluctuations as we remeasure foreigncurrency transactions in the financial statements into the relevant functional currency. If there is a change inforeign currency exchange rates, the conversion of the foreign currency transactions into its functional currencywill lead to transaction gains or losses, which are recorded in our consolidated statements of operations as acomponent of other, net.
We are also exposed to foreign exchange rate fluctuations as we translate the financial statements of ournon-U.S. dollar functional currency foreign subsidiaries into U.S. dollars in consolidation. If there is a change inforeign currency exchange rates, the conversion of the foreign subsidiaries’ financial statements into U.S. dollarswill lead to translation gains or losses, which are recorded net as a component of other comprehensive income(loss).
Statements of Cash Flows—We use the “cumulative earnings” approach for determining the cash flowpresentation of distributions from our joint ventures. Distributions received on the investments are included in
F-13
our consolidated statements of cash flows in operating activities, unless the cumulative distributions exceed ourportion of cumulative equity in earnings of the joint venture, in which case the excess distributions are deemed tobe returns of the investment and are included in our consolidated statements of cash flows in investing activities.During the periods presented, there were no distributions from joint ventures classified as investing cash flows.
Cash and Cash Equivalents—We classify all highly liquid instruments, including money market funds andmoney market securities with original maturities of three months or less, as cash equivalents.
Restricted Cash—Restricted cash balances relate to security provided for certain bank guarantees andbanking services for specific subsidiaries in Europe within the Travelocity segment.
Financial Instruments—The carrying value of our financial instruments including cash and cashequivalents, and accounts receivable approximate their fair values. Our derivative financial instruments arecarried at their estimated fair values. Our debt instruments are recorded at carrying value; the fair value of oursenior unsecured notes issued in March 2006 (“2016 Notes”), our senior unsecured notes issued in May 2012(“2019 Notes”), and term loan were determined based on quoted market prices for the identical liability whentraded as an asset in an active market.
Derivatives—We recognize all derivatives, including embedded derivatives, on the consolidated balancesheets at fair value. If the derivative is designated as a hedge, depending on the nature of the hedge, changes inthe fair value of derivatives are offset against the change in fair value of the hedged item through earnings (a“fair value hedge”) or recognized in other comprehensive income until the hedged item is recognized in earnings(a “cash flow hedge”). The ineffective portion of the change in fair value of a derivative designated as a hedge isimmediately recognized in earnings. For derivative instruments not designated as hedging instruments, the gainor loss resulting from the change in fair value is recognized in current earnings during the period of change. Nohedging ineffectiveness was recorded in earnings during the periods presented.
Income Taxes—Deferred income tax assets and liabilities are determined based on differences betweenfinancial reporting and income tax basis of assets and liabilities and are measured using the tax rates and laws ineffect at the time of such determination. We regularly review our deferred tax assets for recoverability and avaluation allowance is provided when it is more likely than not that some portion or all of a deferred tax assetwill not be realized. In assessing the need for a valuation allowance, we make estimates and assumptionsregarding projected future taxable income, our ability to carry back operating losses to prior periods, the reversalof deferred tax liabilities and implementation of tax planning strategies. We reassess these assumptions regularlywhich could cause an increase or decrease to the valuation allowance resulting in an increase or decrease in theeffective tax rate, and could materially impact our results of operations.
We recognize liabilities when we believe that an uncertain tax position may not be fully sustained uponexamination by the tax authorities. Liabilities are recognized for uncertain tax positions that do not pass a two-step approach for recognition and measurement. First, we evaluate the tax position for recognition bydetermining if based solely on its technical merits, it is more likely than not to be sustained upon examination.Secondly, for positions that pass the first step, we measure the tax benefit as the largest amount which is morethan 50% likely of being realized upon ultimate settlement. It is our policy to recognize penalties and interestaccrued related to income taxes as a component of the provision (benefit) for income taxes. See Note 10, IncomeTaxes.
Operating Leases—We lease certain facilities under long-term, non-cancelable operating leases. Certain ofour lease agreements contain renewal options and/or payment escalations based on fixed annual increases, localconsumer price index changes or market rental reviews. We recognize rent expense on a straight-line basis overthe term of the lease.
F-14

Property and Equipment—Property and equipment are stated at cost less accumulated depreciation, which iscalculated on the straight-line basis. Our depreciation and amortization policies are as follows:
Buildings Lesser of lease term or 35 yearsLeasehold improvements Lesser of lease term or useful lifeFurniture and fixtures 5 to 15 yearsEquipment, general office and computer 3 to 5 yearsSoftware developed for internal use 3 to 7 years
We also capitalize certain costs related to applications, infrastructure and graphics development for theSabre System and our websites under authoritative guidance on internal-use software intangibles. Capitalizablecosts consist of (a) certain external direct costs of materials and services incurred in developing or obtaininginternal-use computer software and (b) payroll and payroll-related costs for employees who are directlyassociated with and who devote time to the Sabre System and web-related development projects. Costs incurredduring the preliminary project stage or costs incurred for data conversion activities and training, maintenance andgeneral and administrative or overhead costs are expensed as incurred. Costs that cannot be separated betweenmaintenance of, and relatively minor upgrades and enhancements to, internal-use software are also expensed asincurred. Depreciation and amortization for property and equipment totaled $131 million, $136 million and$123 million for the years ended December 31, 2013, 2012 and 2011, respectively.
Property and equipment is evaluated for impairment whenever events or changes in circumstances indicatethat the carrying amount of the assets used in combination to generate cash flows largely independent of otherassets may not be recoverable.
Goodwill and Intangible Assets—Upon the acquisition of a business, we record goodwill and intangibleassets at fair value. Additionally, we capitalize the costs incurred to renew or extend the term of our patents.Goodwill and intangible assets determined to have indefinite useful lives are not amortized. Definite-livedintangible assets are amortized on a straight-line basis and assigned useful economic lives of four to thirty years,depending on classification. The useful economic lives are evaluated on an annual basis.
We evaluate goodwill for impairment on an annual basis or if impairment indicators exist. We begin withthe qualitative assessment of whether it is more likely than not that a reporting unit’s fair value is less than itscarrying value before applying the two-step goodwill impairment model described below. If it is determinedthrough the qualitative assessment that a reporting unit’s fair value is more likely than not greater than itscarrying value, the remaining impairment steps are unnecessary. Otherwise, we perform a comparison of theestimated fair value of the reporting unit to which the goodwill has been assigned to the sum of the carryingvalue of the assets and liabilities of that unit. If the sum of the carrying value of the assets and liabilities of areporting unit exceeds the estimated fair value of that reporting unit, the carrying value of the reporting unit’sgoodwill is reduced to its implied fair value through an adjustment to the goodwill balance, resulting in animpairment charge. We have identified six reporting units, including Travelocity—North America, Travelocity—Europe, Travelocity—Asia Pacific, Sabre Travel Network, Sabre Airline Solutions and Sabre HospitalitySolutions. The Travelocity—Asia Pacific reporting unit was held for sale as of December 31, 2012 and was soldin March 2013 (see Note 4, Discontinued Operations and Dispositions).
The fair values used in our evaluation are estimated using a combined approach based upon discountedfuture cash flow projections and observed market multiples for comparable businesses. The cash flow projectionsare based upon a number of assumptions, including risk-adjusted discount rates, future booking and transactionvolume levels, future price levels, rates of growth in our consumer and corporate direct booking businesses, ratesof increase in operating expenses, cost of revenue and taxes. Additionally, in accordance with authoritativeguidance on fair value measurements, we made a number of assumptions including market participants, theprincipal markets and highest and best use of the reporting units.
F-15
Definite-lived intangible assets are evaluated for impairment whenever events or changes in circumstancesindicate that the carrying amount of definite-lived intangible assets used in combination to generate cash flowslargely independent of other assets may not be recoverable. If impairment indicators exist for definite-livedintangible assets, the undiscounted future cash flows associated with the expected service potential of the assetsare compared to the carrying value of the assets. If our projection of undiscounted future cash flows is in excessof the carrying value of the intangible assets, no impairment charge is recorded. If our projection of undiscountedcash flows is less than the carrying value of the intangible assets, an impairment charge is recorded to reduce theintangible assets to fair value. We also evaluate the need for additional impairment disclosures based on ourLevel 3 inputs. For fair value measurements categorized within Level 3 of the fair value hierarchy, we disclosethe valuation processes used.
Capitalized Implementation Costs—We incur up-front costs to implement new customer contracts under oursoftware-as-a-service revenue model. We capitalize these costs, including (a) certain external direct costs ofmaterials and services incurred to implement a customer contract and (b) payroll and payroll related costs foremployees who are directly associated with and devote time to implementation activities.
Capitalized costs are amortized on a straight-line basis over the related contract term, ranging from three toten years, as they are recoverable through deferred or future revenues associated with the relevant contract.
Deferred Customer Discounts—Deferred advances to customers and customer discounts are amortized infuture periods as the related revenue is earned. The assets are reviewed for recoverability based on futurecontracted revenues. Contracts are priced to generate total revenues over the life of the contract that exceed anydiscounts or advances provided and any upfront costs incurred to implement the customer contract.
Travel Supplier Liabilities and Related Deferred Revenue—Our travel suppliers provide content, includingair travel, hotel stays, car rentals and dynamically packaged combinations of these components, on either a fee-based or a net-rate basis. Under our fee-based arrangements, we collect the full price of the travel from theconsumer and remit the payment to the travel supplier, after withholding our service fee. Under our net-rateagreements, suppliers provide content to us at pre-determined net rates. We market net-rate offerings to travelersat a price that includes an amount sufficient to pay the travel supplier for providing the travel accommodationsand any occupancy and other local taxes, as well as additional amounts representing our service fees. We recordamounts due to travel suppliers and our service fees in Travel supplier liabilities and related deferred revenue onthe consolidated balance sheets until these amounts are paid to the suppliers or recognized as revenue uponconsumption of the travel.
Incentive Consideration—Certain service contracts with significant travel agency customers containbooking productivity clauses and other provisions that allow travel agency customers to receive cash payments orother consideration. We establish liabilities for these commitments and recognize the related expense as thesetravel agencies earn incentive consideration based on the applicable contractual terms. Periodically, we makecash payments to these travel agencies at inception or modification of a service contract which are capitalizedand amortized to cost of revenue over the expected life of the service contract, which is generally three to fiveyears. Deferred charges related to such contracts are recorded in Other assets, net on the consolidated balancesheets. The service contracts are priced so that the additional airline and other booking fees generated over thelife of the contract will exceed the cost of the incentive consideration provided. Incentive consideration paid tothe travel agency represents a commission paid to the travel agency for booking travel on our GDS and theamounts paid to travel agencies represent fair value for the services provided.
Equity-Based Compensation—We account for our stock awards and options by recognizing compensationexpense, measured at the grant date based on the fair value of the award, on a straight-line basis over the awardvesting period, giving consideration as to whether the amount of compensation cost recognized at any date isequal to the portion of grant-date value that is vested at that date. We account for our liability awards byremeasuring the fair value of our awards at each reporting date. Changes in fair value of our liability awards are
F-16
recognized in earnings. Stock-based compensation expense, including liability awards, totaled $9 million,$10 million and $7 million for the years ended December 31, 2013, 2012 and 2011, respectively.
Concentration of Credit Risk—Our customers are primarily located in the United States, Canada, Europe,Latin America and Asia, and are concentrated in the travel industry. We generate a significant portion of ourrevenues and corresponding accounts receivable from services provided to the commercial air travel industry. Asof December 31, 2013 and 2012, approximately $178 million or 58% and $189 million or 58%, respectively, ofour trade accounts receivable was attributable to these customers. Our other accounts receivable are generallydue from other participants in the travel and transportation industry. Substantially all of our accounts receivable,net represents trade balances. We generally do not require security or collateral from our customers as acondition of sale.
We regularly monitor the financial condition of the air transportation industry and have noted the financialdifficulties faced by several air carriers. We believe the credit risk related to the air carriers’ difficulties ismitigated by the fact that we collect a significant portion of the receivables from these carriers through theAirline Clearing House (“ACH”) and other similar clearing houses. As of December 31, 2013, approximately57% of our air customers make payments through the ACH which accounts for approximately 94% of our airrevenue. For these carriers, we believe the use of ACH mitigates our credit risk with respect to airlinebankruptcies. For those carriers from which we do not collect payments through the ACH or other similarclearing houses, our credit risk is higher. However, we monitor these carriers and account for the related creditrisk through our normal reserve policies.
We evaluate the collectability of our accounts receivable based on a combination of factors. Incircumstances where we are aware of a specific customer’s inability to meet its financial obligations to us (e.g.,bankruptcy filings, failure to pay amounts due to us or others), we record a specific reserve for bad debts againstamounts due to reduce the recorded receivable to the amount we reasonably believe will be collected. For allother customers, we record reserves for bad debts based on past write-off history (average percentage ofreceivables written off historically) and the length of time the receivables are past due. We maintained anallowance for losses of approximately $22 million and $28 million at December 31, 2013 and 2012, respectively,based upon the amount of accounts receivable expected to prove uncollectible.
3. Acquisitions
Pro forma information related to acquisitions occurring during 2013, 2012 and 2011 has not been included,as the effect would not be material to our consolidated financial statements.
2012
Acquisition of PRISM—On August 1, 2012, we acquired all of the outstanding stock and ownership interestsof PRISM Group Inc. and PRISM Technologies LLC (collectively “PRISM”), a leading provider of end-to-endairline contract business intelligence and decision support software. The acquisition added to our portfolio ofproducts within Airline and Hospitality Solutions, allows for new relationships with airlines and added to ourexisting business intelligence capabilities. The purchase price was $116 million, $66 million of which was paidon August 1, 2012. Contingent consideration totaled $54 million on an undiscounted basis and is to be paid intwo installments of $27 million each, due 12 and 24 months following the acquisition date. The first $27 millioninstallment represented a holdback payment primarily for indemnification purposes and the second $27 millionpayment represents contingent consideration which is based on contractually determined performance measures,which have been met. Additionally, $6 million is also due in two installments of $3 million each at 12 and24 months, which is contingent upon employment of key employees and is being expensed over the relevantperiods of employment and therefore is not considered a part of the purchase price consideration. We made thefirst holdback and contingent employment payments totaling $30 million in August 2013.
F-17

The results of operations of PRISM are included in our consolidated statements of operations and the resultsof operations of Airline and Hospitality Solutions from the date of acquisition. The impact to our revenue and netloss from the acquisition of PRISM is not material for all periods presented. Assets acquired and liabilitiesassumed were recorded at their estimated fair values using management’s best estimates, based in part on anindependent valuation of the net assets acquired. The following table summarizes the allocation of the purchaseprice and the amounts allocated to goodwill (in thousands):
Patents (10 year useful life) $ 59,400Customer and contractual relationships (10 year useful life) 10,700Trademarks (5 year useful life) 800Goodwill 35,737Accounts receivable, net 8,059Other net assets acquired 1,458
Total purchase price $116,154
Other Acquisitions—During 2012, we completed one additional acquisition which was not individuallymaterial to our financial statements for a total purchase price of $6 million.
During 2011, we completed two acquisitions which individually were not material to our consolidatedfinancial statements. In the first quarter of 2011, we completed the acquisition of Zenon N.D.C., Limited, aprovider of GDS services to travel agents in Cyprus. In the second quarter of 2011, we completed the acquisitionof SoftHotel, Inc., a provider of web-based property management solutions for the hospitality industry. Theresults of operations of these 2011 acquisitions have been included in our consolidated statements of operationsfrom the dates of the acquisitions. The total purchase price for these acquisitions was $11 million.
4. Discontinued Operations and Dispositions
During the periods presented, we disposed of or discontinued certain businesses or operations in order tofurther align Travelocity with its core strategies of focusing on product and customer experiences in profitablelocations, and displaying and promoting highly relevant content. We believe these decisions will allow us toreduce our technological complexity by reducing the number of supported business platforms and operations.
Discontinued Operations
The results for the following Travelocity operations are presented in income (loss) from discontinuedoperations in our consolidated statements of operations:
Holiday Autos—On June 25, 2013, we sold certain assets of our Holiday Autos operations to a third partyand, in November 2013, completed the closing of the remainder of the Holiday Autos operations such that itrepresented a discontinued operation. Holiday Autos was a leisure car hire broker that offered pre-paid, low-costcar rental in various markets, largely in Europe. We recognized an $11 million loss, net of tax, on the sale ofHoliday Autos. The loss includes the write-off of $39 million of goodwill and intangible assets attributed toHoliday Autos, with the goodwill portion determined based on Holiday Autos’ relative fair value to theTravelocity Europe reporting unit. The sale provides for us to receive two earn-out payments measured 12 and24 months following the date of the sale, totaling up to $12 million, based upon the purchaser exceeding certainbooking thresholds as defined in the sale agreement. We recognized $6 million relative to these earn-outprovisions and the resulting receivable is reviewed for recovery on a periodic basis. Any earn-out paymentsreceived in excess of the $6 million recognized will be recorded as a gain in the period received.
Travelocity—Asia Pacific—In July 2012, we completed the sale of two of our subsidiaries in India(collectively “TravelGuru”). These businesses offered a wide array of travel related services and operated a hotelreservations system. We recorded a gain on the sale of approximately $11 million, net of taxes, in the thirdquarter of 2012.
F-18
Further, in December 2012, we entered into an agreement to sell our shares of Zuji Properties A.V.V. andZuji Pte Ltd along with its operating subsidiaries (collectively “Zuji”), a Travelocity Asia Pacific-based OnlineTravel Agency (“OTA”). At that time, the assets were recorded at the lower of the carrying amount or fair valueless cost to sell. We recorded an estimated loss on the sale of approximately $14 million, net of tax during 2012.We sold Zuji on March 21, 2013 and recorded an additional $11 million loss on sale, net of tax during the yearended December 31, 2013. We have continuing cash flows from Zuji due to reciprocal agreements between usand Zuji to provide hotel reservations services over a three year period. The agreements include commissions tobe paid to the respective party based on qualifying bookings. The continuing cash flows associated with Zujiwere not material to our results of operations for the year ended December 31, 2013.
The operations of Zuji and TravelGuru represented our Travelocity—Asia Pacific reporting unit;Travelocity no longer has operations in the Asia Pacific region.
Travelocity Nordics—In December 2012, we sold certain assets of Travelocity’s Nordics business to a thirdparty. The Nordics business is comprised of an online travel agency and event and ticket sales in Sweden,Norway and Denmark. Travelocity no longer has operations in this region.
Results of Discontinued Operations—The results of discontinued operations for the year endedDecember 31, 2013 include $33 million of gains associated with the reversals of allowances for uncollectablevalue-added tax (“VAT”) receivables related to Holiday Autos (see Note 20, Commitments and Contingencies)and $4 million of other income related to the resolution of a legal contingency that existed at the close of the saleof TravelGuru. The reversals of the VAT receivable allowances were a result of payments received in 2013 andare reflected as a reduction to selling, general and administrative expenses in the table below. The results ofdiscontinued operations for the year ended December 31, 2012 includes $17 million of accrued expenses in costof revenue for VAT assessments and related penalties and interest associated with our Secret Hotels 2 Limited(formerly Med Hotels Limited) entity which was discontinued in 2008. The $17 million accrued liability wasreversed during the year ended December 31, 2013 and is reflected as a reduction to cost of revenue in the belowtable (see Note 20, Commitments and Contingencies).
The following table summarizes the results of our discontinued operations:
Year Ended December 31,
2013 2012 2011
(Amounts in thousands)Revenue $ 49,124 $107,189 $124,763Cost of revenue (2,176) 26,694 36,502Selling, general and administrative 23,542 107,808 101,873Impairment expense 516 11,250 —Depreciation and amortization 2,599 4,412 5,440
Operating income (loss) 24,643 (42,975) (19,052)
Other income (expense):Interest expense, net (1,217) (8,898) (6,368)Loss on sale of businesses, net (27,709) (8,266) —Other, net 1,988 (2,607) (2,161)
Total other expense, net (26,938) (19,771) (8,529)
Loss from discontinuing operations before incometaxes (2,295) (62,746) (27,581)
Provision (benefit) for income taxes 4,881 (13,799) (4,120)
Net loss from discontinued operations $ (7,176) $ (48,947) $ (23,461)
F-19
Dispositions
Certain Assets of Travelocity—On June 18, 2013, we completed the sale of certain assets of Travelocity(“TBiz”) operations to a third party. TBiz provides managed corporate travel services for corporate customers.We recorded proceeds of $10 million and a loss on the sale of $3 million, net of tax, including the write-off of $9million of goodwill attributed to TBiz based on the relative fair value to the Travelocity North America reportingunit, in our consolidated statement of operations.
Sabre Pacific—On February 24, 2012, we completed the sale of our 51% stake in Sabre AustraliaTechnologies I Pty Ltd (“Sabre Pacific”), an entity jointly owned by a subsidiary of Sabre (51%) and ABACUSInternational PTE Ltd (“Abacus”) (49%), to Abacus for $46 million of proceeds. Of the proceeds received,$9 million was for the sale of stock, $18 million represented the repayment of an intercompany note receivablefrom Sabre Pacific, which was entered into when the joint venture was originally established, and the remaining$19 million represented the settlement of operational intercompany receivable balances with Sabre Pacific andassociated amounts we owed to Abacus. We recorded $25 million as gain on sale of business in our consolidatedstatements of operations. We have also entered into a license and distribution agreement with Sabre Pacific underwhich it will market, sub-license, distribute, provide access to and support for the Sabre GDS in Australia,New Zealand and surrounding territories. Sabre Pacific will pay us an ongoing transaction fee based on bookingvolumes under this agreement.
5. Restructuring Charges
Travelocity Restructuring—In the third quarter of 2013, we initiated plans to restructure Travelocity,shifting Travelocity in the United States and Canada away from a fixed-cost model to a lower-cost, performance-based shared revenue structure. On August 22, 2013 we entered into an exclusive, long-term strategic marketingagreement with Expedia (“Expedia SMA”), in which Expedia will power the technology platforms forTravelocity’s existing U.S. and Canadian websites, as well as provide Travelocity with access to Expedia’ssupply and customer service platforms. The Expedia SMA represents a strategic decision to reduce direct costsassociated with Travelocity and provide our customers with the benefit of Expedia’s long term investment in itstechnology platform as well as its supply and customer service platforms, which we expect to increaseconversion and operational efficiency and allows us to shift our focus to Travelocity’s marketing strengths. Bothparties began development and implementation after signing the Expedia SMA. As of December 31, 2013, themajority of the online hotel and air offering has been migrated to the Expedia platform, and a launch of themajority of the remainder is expected in early 2014. Based on the terms of the agreement, Expedia has earned anincentive payment of $8 million in January 2014, which could increase to $11 million depending on the timing ofthe full launch in 2014. We plan to amortize this payment over the non-cancellable term of the marketingagreement as a reduction to revenue.
Under the terms of the agreement, Expedia will pay us a performance-based marketing fee that will varybased on the amount of travel booked through Travelocity-branded websites powered by Expedia under thiscollaborative arrangement. The marketing fee we receive is recorded as marketing fee revenue and the cost weincur to promote the Travelocity brand and for marketing is recorded as selling, general and administrativeexpense in our results of operations. Correspondingly, we are winding down certain internal processes, includingback office functions, as transactions move from our technology platforms to those of Expedia.
We also agreed to a put/call arrangement (“Expedia Put/Call”) whereby Expedia may acquire, or we maysell to Expedia, certain assets relating to the Travelocity business. Our put right may be exercised during the first24 months of the Expedia SMA only upon the occurrence of certain triggering events primarily relating toimplementation, which are outside of our control. The occurrence of such events is not considered probable.During this period, the exercise price of the put right is fixed. After the 24 month period, the put right is onlyexercisable for a limited period of time in 2016 at a discount to fair market value. The call right held by Expediais exercisable at any time during the term of the Expedia SMA. If the call right is exercised, it provides for a floorfor a limited time that may be higher than fair value and a ceiling for the duration of the agreement that may belower than fair value.
F-20

In the fourth quarter of 2013, we initiated a plan to restructure the European portion of the Travelocitybusiness. This plan involves establishing Travelocity Europe as a stand-alone operational entity, separatingprocesses from the North America operations, while adding efficiencies to streamline the European operations.Travelocity will continue to be managed as one reportable segment.
As a result of the Travelocity restructuring actions, we recorded charges totaling $28 million which included$4 million of asset impairments, $18 million of employee termination benefits, and $6 million of other relatedcosts. We estimate that we will incur additional charges of approximately $11 million in 2014 consisting of$6 million in contract termination costs, $2 million in employee termination benefits, and $3 million of otherrelated costs.
Technology Restructuring—Our corporate expenses include a technology organization that providesdevelopment and support activities to our business segments. Costs associated with our technology organizationare charged to the business segments primarily based on its usage of development resources. For the year endedDecember 31, 2013, the majority of costs associated with the technology organization were incurred by TravelNetwork and Airline and Hospitality Solutions. In the fourth quarter of 2013, we initiated a restructuring plan tosimplify our technology organization, better align costs with our current business, reduce our spend on third-party resources, and to increase focus on product development. The majority of this plan will be completed in2014. As a part of this restructuring plan, we will reduce our employee base by approximately 350 employees.We recorded a charge of $8 million associated with employee termination benefits in the fourth quarter of 2013and do not expect to record material charges in 2014 related to this action.
The roll forward of our restructuring accruals, included in other current liabilities, is as follows:
Employee Termination Benefits
TravelocityTechnology
Organization Total
(Amounts in thousands)
Charges $17,956 $8,163 $26,119Payments 225 — 225
Restructuring liability at December 31, 2013 $17,731 $8,163 $25,894
The charges recognized in the roll forward of our reserve for restructuring charges do not include itemscharged directly to expense (e.g. asset impairments) and other periodic costs recognized as incurred, as thoseitems are not reflected in our restructuring reserve in our consolidated balance sheet. Restructuring charges arenot allocated to the segments for segment reporting purposes (see Note 21, Segment Information).
6. Equity Method Investments
We have an investment in Abacus and have entered into a service agreement with them relative to dataprocessing services, development labor and other services as requested. The primary revenue generated fromAbacus is data processing fees associated with bookings on the Sabre GDS. In accordance with a data processingagreement signed in late 2012, Abacus prepaid for data processing fees which will be amortized over the term ofthe agreement. Development labor and ancillary services are provided upon request. Additionally, in accordancewith an agreement with Abacus, we collect booking fees on behalf of Abacus and record a payable, or economicbenefit transfer, to them for amounts collected but unremitted at any period end, net of any associated costs weincur.
For the year ended December 31, 2012, Abacus recorded an impairment of goodwill associated with itsacquisition of Sabre Pacific, of which our share was $24 million.
Prior to 2012, we held an equity interest in Axess jointly with Abacus. We recorded an amount due toAbacus for its economic share of the equity interest. Our interest in Axess was sold in 2012.
F-21
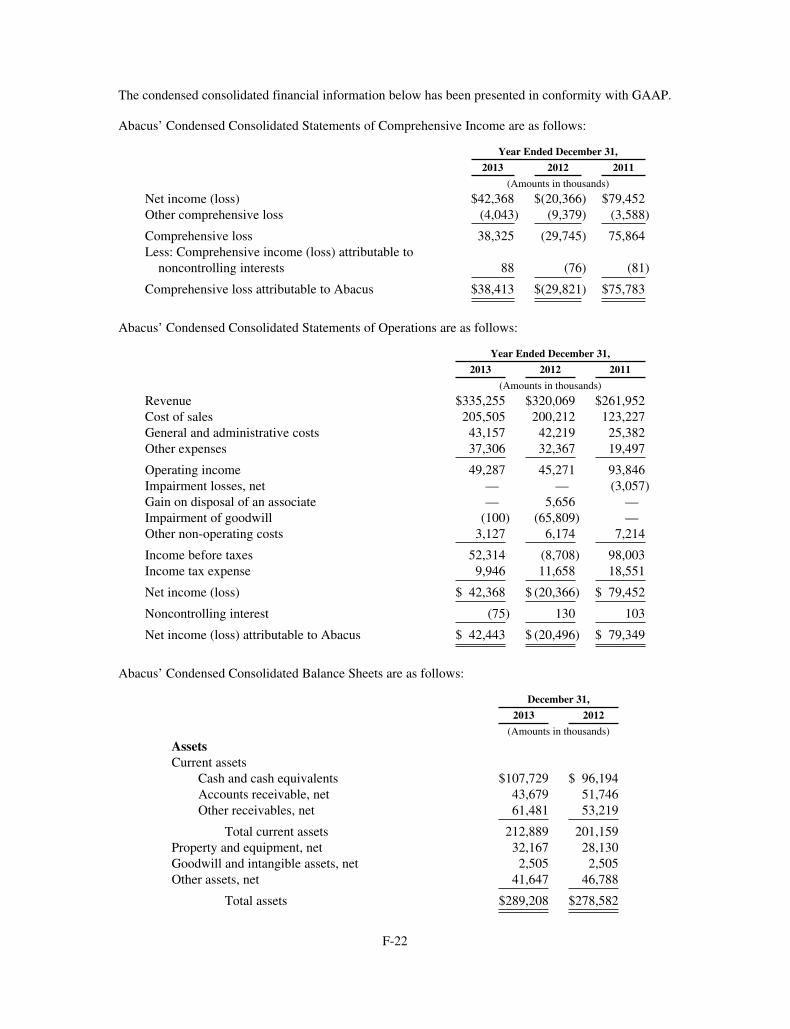
The condensed consolidated financial information below has been presented in conformity with GAAP.
Abacus’ Condensed Consolidated Statements of Comprehensive Income are as follows:
Year Ended December 31,
2013 2012 2011
(Amounts in thousands)
Net income (loss) $42,368 $(20,366) $79,452Other comprehensive loss (4,043) (9,379) (3,588)
Comprehensive loss 38,325 (29,745) 75,864Less: Comprehensive income (loss) attributable to
noncontrolling interests 88 (76) (81)
Comprehensive loss attributable to Abacus $38,413 $(29,821) $75,783
Abacus’ Condensed Consolidated Statements of Operations are as follows:
Year Ended December 31,
2013 2012 2011
(Amounts in thousands)
Revenue $335,255 $320,069 $261,952Cost of sales 205,505 200,212 123,227General and administrative costs 43,157 42,219 25,382Other expenses 37,306 32,367 19,497
Operating income 49,287 45,271 93,846Impairment losses, net — — (3,057)Gain on disposal of an associate — 5,656 —Impairment of goodwill (100) (65,809) —Other non-operating costs 3,127 6,174 7,214
Income before taxes 52,314 (8,708) 98,003Income tax expense 9,946 11,658 18,551
Net income (loss) $ 42,368 $ (20,366) $ 79,452
Noncontrolling interest (75) 130 103
Net income (loss) attributable to Abacus $ 42,443 $ (20,496) $ 79,349
Abacus’ Condensed Consolidated Balance Sheets are as follows:
December 31,
2013 2012
(Amounts in thousands)
AssetsCurrent assets
Cash and cash equivalents $107,729 $ 96,194Accounts receivable, net 43,679 51,746Other receivables, net 61,481 53,219
Total current assets 212,889 201,159Property and equipment, net 32,167 28,130Goodwill and intangible assets, net 2,505 2,505Other assets, net 41,647 46,788
Total assets $289,208 $278,582
F-22

December 31,
2013 2012
(Amounts in thousands)
Liabilities and stockholders’ equityCurrent liabilities
Accounts payable $ 19,820 $ 30,463Other accrued liabilities 103,887 91,270Provision for taxation 47,073 48,277
Total current liabilities 170,780 170,010Deferred income taxes 7,474 5,733Stockholders’ equity
Share capital 56,580 56,580Retained earnings 54,159 45,746Noncontrolling interest 215 513
Total stockholders’ equity 110,954 102,839
Total liabilities and stockholders’ equity $289,208 $278,582
Abacus’ Condensed Consolidated Statements of Cash Flows are as follows:
Year Ended December 31,
2013 2012 2011
(Amounts in thousands)
Operating ActivitiesCash provided by operating activities $ 57,899 $ 9,214 $ 48,833
Investing ActivitiesCash used in investing activities (16,154) (29,183) (8,560)
Financing ActivitiesDividends paid (30,000) (60,486) (35,000)Other financing activities (210) (156) (109)
Cash used in financing activities (30,210) (60,642) (35,109)Increase (decrease) in cash and cash equivalents 11,535 (80,611) 5,164Cash and cash equivalents at beginning of period 96,194 176,805 171,641
Cash and cash equivalents at end of period $107,729 $ 96,194 $176,805
Our related party transactions with Abacus are summarized and presented in the table below.
Year Ended December 31,
2013 2012 2011
(Amounts in thousands)
Revenue earned from Abacus $91,998 $71,957 $52,073
December 31,
2013 2012
(Amounts in thousands)
Receivable from Abacus $ 29,377 $ 13,939Payable to Abacus for Economic Benefit Transfer (8,648) (8,452)Current deferred revenue related to Abacus data
processing (2,571) (2,571)Long-term deferred revenue related to Abacus data
processing (12,857) (15,428)
Related party receivable (liability), net $ 5,301 $(12,512)
F-23
7. Goodwill and Intangible Assets
Impairment Assessments—We perform our annual assessment of possible impairment of goodwill andindefinite-lived intangible assets as of October 1, or more frequently if events and circumstances indicate thatimpairment may have occurred.
2013—In conjunction with the disposal of TBiz (part of our Travelocity North America reporting unit) andHolidays Autos (part of our Travelocity Europe reporting unit) in the second quarter of 2013, we were required toallocate goodwill to these businesses. We allocated $9 million and $36 million in goodwill to TBiz and HolidayAutos, respectively. In connection with the dispositions, we initiated an impairment analysis as of June 30, 2013on the remainder of the goodwill and long-lived assets associated with these reporting units. Further declines inour projections of the discounted future cash flows of these reporting units and current market participantconsiderations led to a $96 million impairment in Travelocity—North America and a $40 million impairment inTravelocity—Europe goodwill, which has been recorded in our results of operations. As a result of theseimpairments, the Travelocity segment had no remaining goodwill as of June 30, 2013.
We also recorded a $2 million impairment of Travelocity—Europe software developed for internal use and$1 million impairment of other definite lived intangible assets related to Holiday Autos which is included in ournet loss on the sale of that business in discontinued operations.
Based on our annual assessment of possible impairment of goodwill and indefinite-lived intangible assets asof October 1, 2013, we concluded that no additional impairment was necessary.
2012—In the third quarter of 2012, certain competitors of Travelocity announced plans to move towardsoffering hotel customers a choice of payment options which could adversely affect hotel margins over time.Travelocity’s move to this new revenue model could have additionally impacted its working capital as it wouldcollect less cash up front, reducing the existing supplier liability over time. We therefore initiated an impairmentanalysis as of September 30, 2012. The expected change in the competitive business environment and theresulting impact on our projections of the discounted future cash flows led to a $58 million goodwill impairmentin Travelocity—North America and a $5 million goodwill impairment in Travelocity—Europe.
In the fourth quarter of 2012, we continued to see further weakness in Travelocity’s business performanceresulting in lower projected revenues and declining margins for Travelocity—North America and Europe thusrequiring further impairment assessment as of December 31, 2012 of goodwill and long-lived intangible assets.We recorded an additional goodwill impairment charge for Travelocity Europe for $65 million and identifiedlong-lived intangible assets were not deemed recoverable in both North America and Europe. As a result, werecorded impairments on long lived assets of $281 million for Travelocity—North America, of which$30 million pertained to software developed for internal use, $7 million pertained to computer equipment,$6 million related to capitalized implementation costs (see Note 2, Summary of Significant Accounting Policies)and the remainder related to definite-lived intangible assets. We also recorded impairments of $154 million forTravelocity—Europe, of which $11 million pertained to software developed for internal use, $4 million pertainedto computer equipment and the remainder related to definite lived intangible assets. The total impairment forTravelocity in 2012 was $564 million.
2011—During 2011, Travelocity was impacted by weakness in the macroeconomic environment andexperienced a decline in margins due to pressure in the industry driven by competitive pricing and reducedbookings which negatively impacted our projections of the discounted future cash flows. These factors led toimpairment charges of $173 million for Travelocity North America and $12 million for Travelocity Europe,respectively.
For the purposes of performing the impairment assessment in all periods, we determined that the lowestlevel of identifiable cash flows is at the reporting unit level for the primary asset in the asset group being thetrade name Travelocity.com and lastminute.com related to Travelocity North America and Travelocity Europe,
F-24
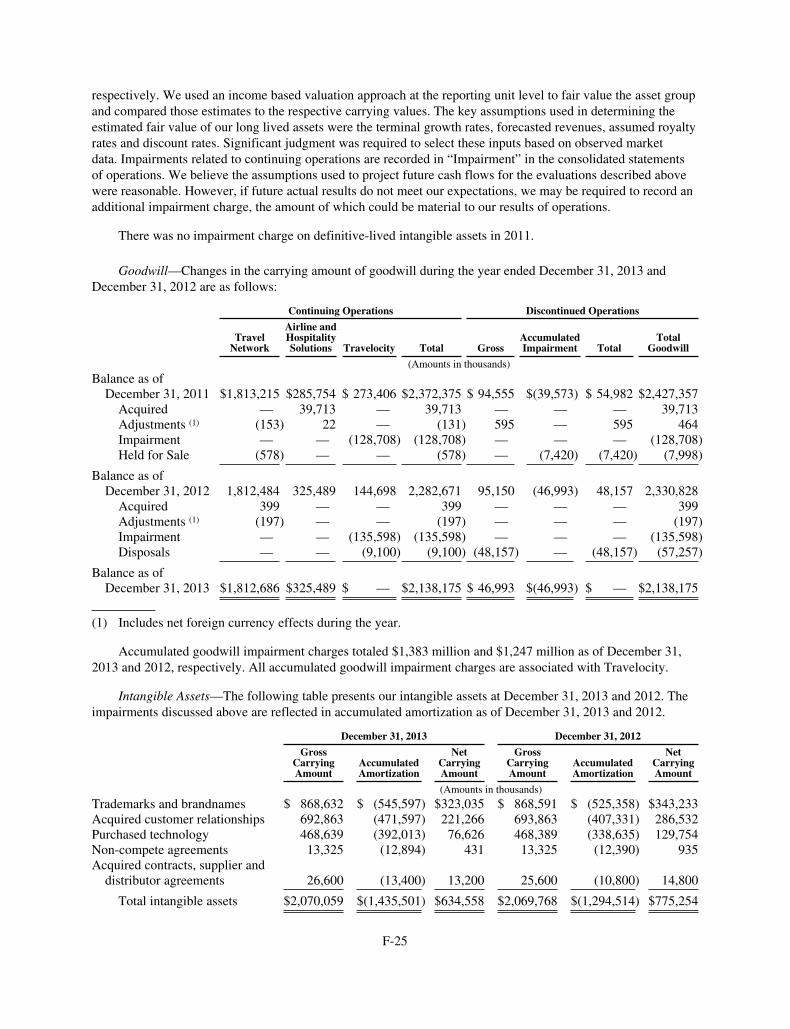
respectively. We used an income based valuation approach at the reporting unit level to fair value the asset groupand compared those estimates to the respective carrying values. The key assumptions used in determining theestimated fair value of our long lived assets were the terminal growth rates, forecasted revenues, assumed royaltyrates and discount rates. Significant judgment was required to select these inputs based on observed marketdata. Impairments related to continuing operations are recorded in “Impairment” in the consolidated statementsof operations. We believe the assumptions used to project future cash flows for the evaluations described abovewere reasonable. However, if future actual results do not meet our expectations, we may be required to record anadditional impairment charge, the amount of which could be material to our results of operations.
There was no impairment charge on definitive-lived intangible assets in 2011.
Goodwill—Changes in the carrying amount of goodwill during the year ended December 31, 2013 andDecember 31, 2012 are as follows:
Continuing Operations Discontinued Operations
TravelNetwork
Airline andHospitalitySolutions Travelocity Total Gross
AccumulatedImpairment Total
TotalGoodwill
(Amounts in thousands)
Balance as ofDecember 31, 2011 $1,813,215 $285,754 $ 273,406 $2,372,375 $ 94,555 $(39,573) $ 54,982 $2,427,357
Acquired — 39,713 — 39,713 — — — 39,713Adjustments (1) (153) 22 — (131) 595 — 595 464Impairment — — (128,708) (128,708) — — — (128,708)Held for Sale (578) — — (578) — (7,420) (7,420) (7,998)
Balance as ofDecember 31, 2012 1,812,484 325,489 144,698 2,282,671 95,150 (46,993) 48,157 2,330,828
Acquired 399 — — 399 — — — 399Adjustments (1) (197) — — (197) — — — (197)Impairment — — (135,598) (135,598) — — — (135,598)Disposals — — (9,100) (9,100) (48,157) — (48,157) (57,257)
Balance as ofDecember 31, 2013 $1,812,686 $325,489 $ — $2,138,175 $ 46,993 $(46,993) $ — $2,138,175
(1) Includes net foreign currency effects during the year.
Accumulated goodwill impairment charges totaled $1,383 million and $1,247 million as of December 31,2013 and 2012, respectively. All accumulated goodwill impairment charges are associated with Travelocity.
Intangible Assets—The following table presents our intangible assets at December 31, 2013 and 2012. Theimpairments discussed above are reflected in accumulated amortization as of December 31, 2013 and 2012.
December 31, 2013 December 31, 2012
GrossCarryingAmount
AccumulatedAmortization
NetCarryingAmount
GrossCarryingAmount
AccumulatedAmortization
NetCarryingAmount
(Amounts in thousands)
Trademarks and brandnames $ 868,632 $ (545,597) $323,035 $ 868,591 $ (525,358) $343,233Acquired customer relationships 692,863 (471,597) 221,266 693,863 (407,331) 286,532Purchased technology 468,639 (392,013) 76,626 468,389 (338,635) 129,754Non-compete agreements 13,325 (12,894) 431 13,325 (12,390) 935Acquired contracts, supplier and
distributor agreements 26,600 (13,400) 13,200 25,600 (10,800) 14,800
Total intangible assets $2,070,059 $(1,435,501) $634,558 $2,069,768 $(1,294,514) $775,254
F-25
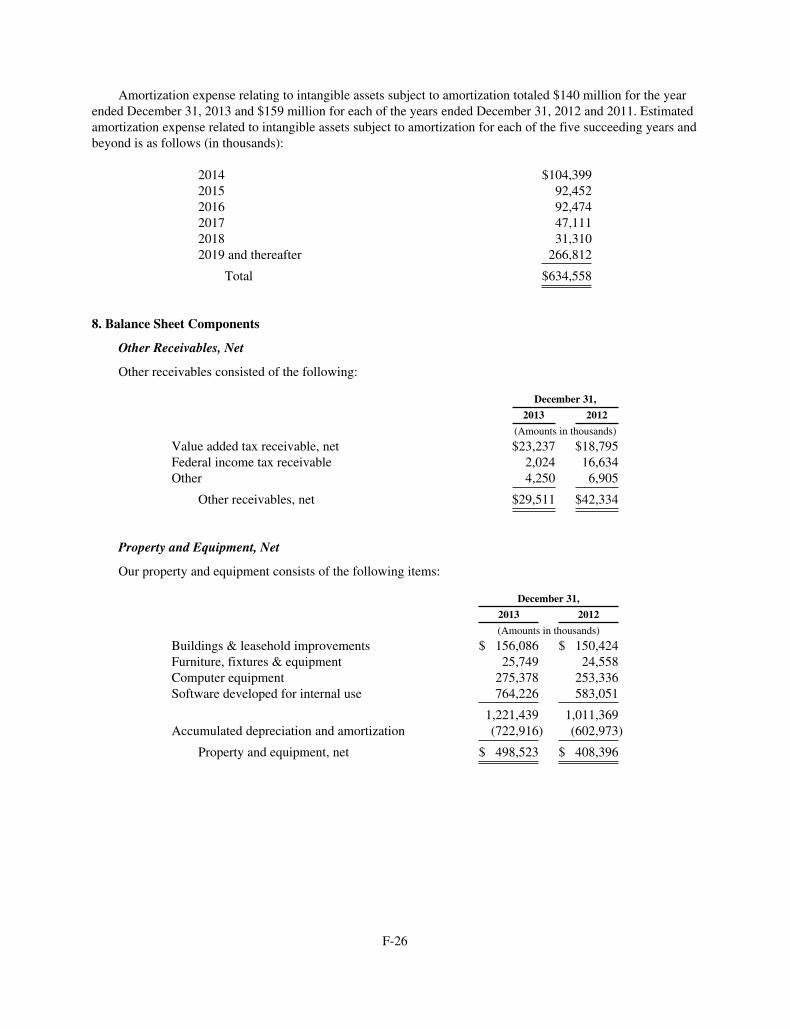
Amortization expense relating to intangible assets subject to amortization totaled $140 million for the yearended December 31, 2013 and $159 million for each of the years ended December 31, 2012 and 2011. Estimatedamortization expense related to intangible assets subject to amortization for each of the five succeeding years andbeyond is as follows (in thousands):
2014 $104,3992015 92,4522016 92,4742017 47,1112018 31,3102019 and thereafter 266,812
Total $634,558
8. Balance Sheet Components
Other Receivables, Net
Other receivables consisted of the following:
December 31,
2013 2012
(Amounts in thousands)
Value added tax receivable, net $23,237 $18,795Federal income tax receivable 2,024 16,634Other 4,250 6,905
Other receivables, net $29,511 $42,334
Property and Equipment, Net
Our property and equipment consists of the following items:
December 31,
2013 2012
(Amounts in thousands)
Buildings & leasehold improvements $ 156,086 $ 150,424Furniture, fixtures & equipment 25,749 24,558Computer equipment 275,378 253,336Software developed for internal use 764,226 583,051
1,221,439 1,011,369Accumulated depreciation and amortization (722,916) (602,973)
Property and equipment, net $ 498,523 $ 408,396
F-26
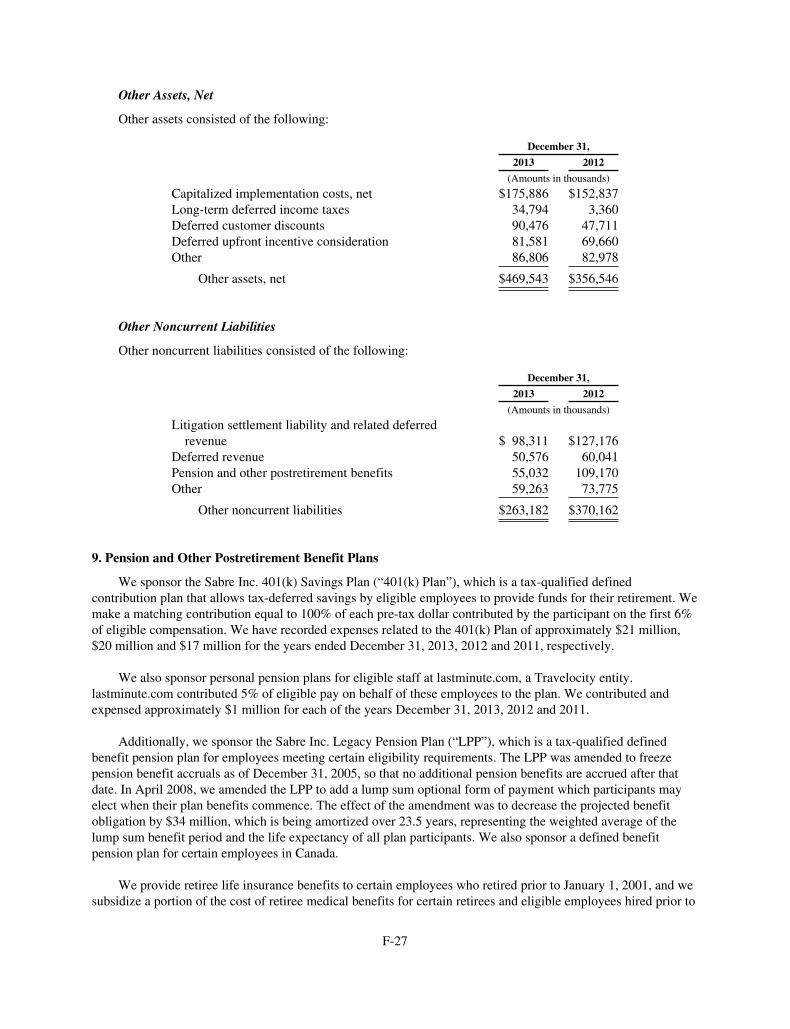
Other Assets, Net
Other assets consisted of the following:
December 31,
2013 2012
(Amounts in thousands)
Capitalized implementation costs, net $175,886 $152,837Long-term deferred income taxes 34,794 3,360Deferred customer discounts 90,476 47,711Deferred upfront incentive consideration 81,581 69,660Other 86,806 82,978
Other assets, net $469,543 $356,546
Other Noncurrent Liabilities
Other noncurrent liabilities consisted of the following:
December 31,
2013 2012
(Amounts in thousands)
Litigation settlement liability and related deferredrevenue $ 98,311 $127,176
Deferred revenue 50,576 60,041Pension and other postretirement benefits 55,032 109,170Other 59,263 73,775
Other noncurrent liabilities $263,182 $370,162
9. Pension and Other Postretirement Benefit Plans
We sponsor the Sabre Inc. 401(k) Savings Plan (“401(k) Plan”), which is a tax-qualified definedcontribution plan that allows tax-deferred savings by eligible employees to provide funds for their retirement. Wemake a matching contribution equal to 100% of each pre-tax dollar contributed by the participant on the first 6%of eligible compensation. We have recorded expenses related to the 401(k) Plan of approximately $21 million,$20 million and $17 million for the years ended December 31, 2013, 2012 and 2011, respectively.
We also sponsor personal pension plans for eligible staff at lastminute.com, a Travelocity entity.lastminute.com contributed 5% of eligible pay on behalf of these employees to the plan. We contributed andexpensed approximately $1 million for each of the years December 31, 2013, 2012 and 2011.
Additionally, we sponsor the Sabre Inc. Legacy Pension Plan (“LPP”), which is a tax-qualified definedbenefit pension plan for employees meeting certain eligibility requirements. The LPP was amended to freezepension benefit accruals as of December 31, 2005, so that no additional pension benefits are accrued after thatdate. In April 2008, we amended the LPP to add a lump sum optional form of payment which participants mayelect when their plan benefits commence. The effect of the amendment was to decrease the projected benefitobligation by $34 million, which is being amortized over 23.5 years, representing the weighted average of thelump sum benefit period and the life expectancy of all plan participants. We also sponsor a defined benefitpension plan for certain employees in Canada.
We provide retiree life insurance benefits to certain employees who retired prior to January 1, 2001, and wesubsidize a portion of the cost of retiree medical benefits for certain retirees and eligible employees hired prior to
F-27

October 1, 2000. In February 2009, we amended our retiree medical plan to reduce the subsidies received byparticipants by 20% per year over the next 5 years, with no further subsidies beginning January 1, 2014. Thisamendment resulted in $57 million of negative prior service cost recorded in other comprehensive income thatwas amortized to operating expense over the remaining term which concluded in December 2013.
Pursuant to a Travel Privileges Agreement with American Airlines Group (“AAG”), formerly AMRCorporation, we are entitled to purchase personal travel for certain retirees. Eligible employees were required toretire from the Company on or before June 30, 2008 to receive this benefit, unless they met the requirements todual-retire from AAG and Sabre Holdings. These dual-retirees will receive these benefits upon retiring fromSabre Holdings. To pay for the provision of flight privileges for eligible retired employees, we make a lump-sumpayment to AAG in the year the employees retire.
The following tables provide a reconciliation of the changes in the plans’ benefit obligations, fair value ofassets and the funded status as of December 31, 2013 and December 31, 2012:
Pension Benefits Other Benefits
2013 2012 2013 2012
(Amounts in thousands)
Change in benefit obligation:Benefit obligation at January 1 $(440,752) $(381,506) $(3,045) $(5,723)Service cost — — — —Interest cost (17,930) (19,744) (41) (91)Actuarial gains (losses), net 37,416 (59,434) 607 (100)Benefits paid 24,805 19,932 1,665 2,869
Benefit obligation at December 31 $(396,461) $(440,752) $ (814) $(3,045)
Change in plan assets:Fair value of assets at January 1 $ 334,701 $ 293,255 $ — $ —Actual return on plan assets 30,007 41,143 — —Employer contributions 2,579 20,235 1,665 2,869Benefits paid (24,805) (19,932) (1,665) (2,869)
Fair value of assets at December 31 $ 342,482 $ 334,701 $ — $ —
Funded status at December 31 $ (53,979) $(106,051) $ (814) $(3,045)
The cumulative amounts recognized in the consolidated balance sheets as of December 31, 2013 andDecember 31, 2012, consist of:
Pension Benefits Other Benefits Total
December 31, December 31, December 31,
2013 2012 2013 2012 2013 2012
(Amounts in thousands)
Current liabilities $ — $ — $(743) $(1,913) $ (743) $ (1,913)Noncurrent liabilities (53,979) (106,051) (71) (1,132) (54,050) (107,183)
Total $(53,979) $(106,051) $(814) $(3,045) $(54,793) $(109,096)
The current and noncurrent liabilities are presented in other accrued liabilities and other noncurrentliabilities, respectively, in the consolidated balance sheets.
F-28

The amounts recognized in accumulated other comprehensive income (loss), net of deferred taxes, as ofDecember 31, 2013 and December 31, 2012 consists of:
Pension Benefits Other Benefits Total
December 31, December 31, December 31,
2013 2012 2013 2012 2013 2012
(Amounts in thousands)
Net actuarial gain (loss) $(79,959) $(113,697) $ 50 $ 2,589 $(79,909) $(111,108)Prior service credit 16,092 17,009 55 7,941 16,147 24,950
Accumulated other comprehensive income(loss) $(63,867) $ (96,688) $105 $10,530 $(63,762) $ (86,158)
The discount rate used in the measurement of our benefit obligations as of December 31, 2013 andDecember 31, 2012 is as follows:
Pension BenefitsDecember 31,
Other BenefitsDecember 31,
2013 2012 2013 2012
Weighted-average discount rate 5.10% 4.19% 0.55% 2.07%
Due to the freeze of pension benefit accruals under the LPP as of December 31, 2005, no assumption forfuture rate of compensation increase is necessary.
The following table provides the components of net periodic benefit costs associated with our pension andother postretirement benefit plans for the years ended December 31, 2013, 2012 and 2011:
Year Ended December 31,
Pension Benefits 2013 2012 2011
(Amounts in thousands)
Interest cost $ 17,930 $ 19,744 $ 20,447Expected return on plan assets (23,635) (24,323) (23,820)Amortization of prior service credit (1,432) (1,432) (1,432)Amortization of actuarial loss 7,383 4,269 2,195
Net benefit $ 246 $ (1,742) $ (2,610)
Year Ended December 31,
Other Benefits 2013 2012 2011
(Amounts in thousands)
Service cost $ — $ — $ 1Interest cost 42 91 176Amortization of prior service credit (12,348) (11,397) (11,397)Amortization of actuarial gain (3,932) (1,929) (745)
Net benefit $(16,238) $(13,235) $(11,965)
F-29

Obligations Recognized in Pension Benefits Other Benefits
Other Comprehensive Income Year Ended December 31, Year Ended December 31,
2013 2012 2013 2012
(Amounts in thousands)
Net actuarial (gain) loss $(43,787) $42,614 $ (42) $ 187Amortization of actuarial gain (loss) (7,383) (4,269) 3,932 1,929Amortization of prior service credit 1,432 1,432 12,348 11,397
Total recognized in other comprehensiveincome $(49,738) $39,777 $16,238 $13,513
Total recognized in net periodic benefitcost and other comprehensive income $(49,492) $38,035 $ — $ 278
We estimate that $3 million of prior service credit and actuarial loss for the defined benefit pension planswill be amortized from accumulated other comprehensive income (loss) into net periodic benefit cost in 2014.
Income related to pensions and other postretirement benefits totaled approximately $16 million for the yearended December 31, 2013, and $15 million for each of the years ended December 31, 2012 and 2011.
The principal assumptions used in the measurement of our net benefit costs for the three years endedDecember 31, 2013, 2012 and 2011 are as follows:
Pension Benefits Other Benefits
2013 2012 2011 2013 2012 2011
Discount rate 4.19% 5.32% 5.88% 1.16% 2.32% 2.69%Expected return on plan assets 7.75% 7.75% 7.75% — — —
Due to a cap on our retiree medical plan cost, a one-percentage point change in the assumed health care costtrend rates would not have a significant impact on service and interest cost or on our postretirement benefitobligation as of December 31, 2013 and 2012.
Our overall investment strategy for the LPP is to provide and maintain sufficient assets to meet pensionobligations both as an ongoing business, as well as in the event of termination, at the lowest cost consistent withprudent investment management, actuarial circumstances, and economic risk, while minimizing the earningsimpact. Diversification is provided by using an asset allocation primarily between equity and debt securities inproportions expected to provide opportunities for reasonable long-term returns with acceptable levels ofinvestment risk. Fair values of the applicable assets are determined as follows:
Mutual Fund—The fair value of our mutual funds are estimated by using market quotes as of the last day ofthe period.
Common Collective Trusts—The fair value of our common collective trusts are estimated by using marketquotes as of the last day of the period, quoted prices for similar securities and quoted prices in non-activemarkets.
Real Estate—The fair value of our real estate funds are derived from the fair value of the underlying realestate assets held by the funds. These assets are initially valued at cost and are reviewed periodically utilizingavailable market data to determine if the assets held should be adjusted.
The basis for the selected target asset allocation included consideration of the demographic profile of planparticipants, expected future benefit obligations and payments, projected funded status of the plan and otherfactors. The target allocations for LPP assets are 25% U.S. equities, 25% non-U.S. equities, 43% long duration
F-30

fixed income, 5% real estate and 2% cash equivalents. It is recognized that the investment management of theLPP assets has a direct effect on the achievement of its goal. As defined in Note 13, Fair Value Measurements,the following tables present the fair value of the LPP assets as of December 31, 2013 and 2012:
Fair Value Measurements at December 31, 2013
Quoted Prices inActive Markets for
Identical Assets(Level 1)
SignificantObservable
Inputs(Level 2)
SignificantUnobservable
Inputs(Level 3) Total
(Amounts in thousands)
Mutual funds:Foreign large value $ 42,635 $ — $ — $ 42,635Large blend 43,222 — — 43,222Large growth 21,433 — — 21,433Money market 6,437 — — 6,437
Common collective trusts:Fixed income securities — 142,289 — 142,289Foreign equity securities — 43,107 — 43,107U.S. equity securities — 21,645 — 21,645
Real estate — — 21,714 21,714
Total assets at fair value $113,727 $207,041 $21,714 $342,482
Fair Value Measurements at December 31, 2012
Quoted Prices inActive Markets for
Identical Assets(Level 1)
SignificantObservable
Inputs(Level 2)
SignificantUnobservable
Inputs(Level 3) Total
(Amounts in thousands)
Mutual funds:Foreign large value $ 43,183 $ — $ — $ 43,183Large blend 40,944 — — 40,944Large growth 20,790 — — 20,790Money market 4,474 — — 4,474
Common collective trusts:Fixed income securities — 142,186 — 142,186Foreign equity securities — 43,429 — 43,429U.S. equity securities — 20,207 — 20,207
Real estate — — 19,488 19,488
Total assets at fair value $109,391 $205,822 $19,488 $334,701
F-31
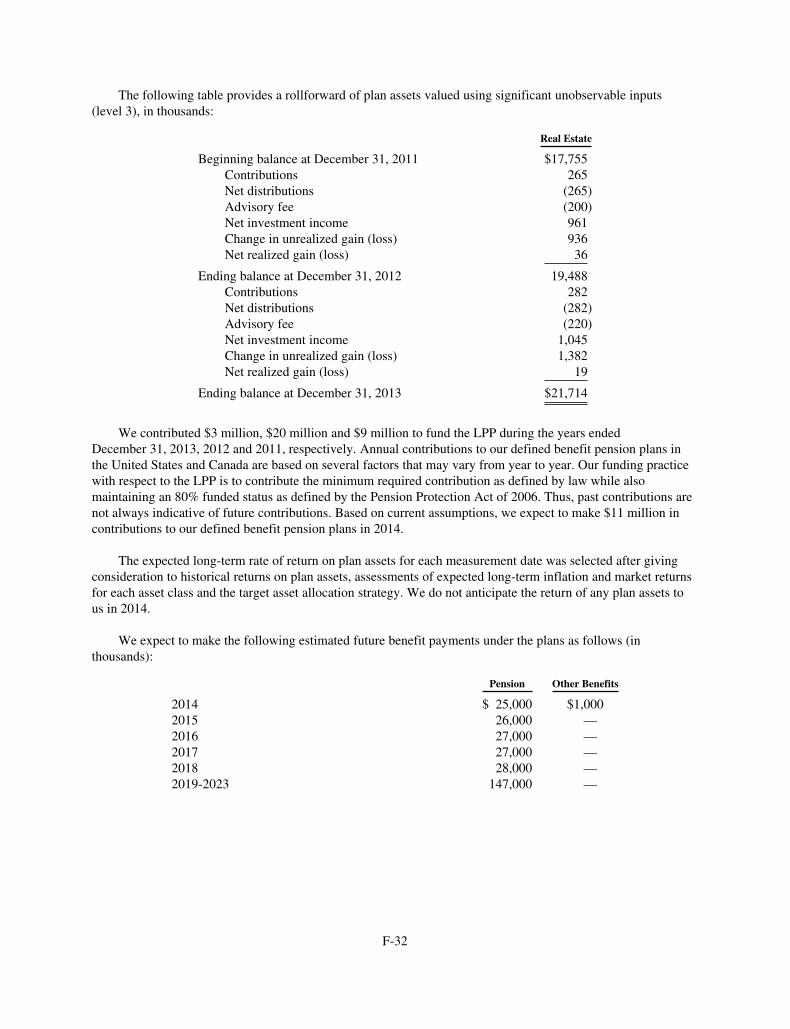
The following table provides a rollforward of plan assets valued using significant unobservable inputs(level 3), in thousands:
Real Estate
Beginning balance at December 31, 2011 $17,755Contributions 265Net distributions (265)Advisory fee (200)Net investment income 961Change in unrealized gain (loss) 936Net realized gain (loss) 36
Ending balance at December 31, 2012 19,488Contributions 282Net distributions (282)Advisory fee (220)Net investment income 1,045Change in unrealized gain (loss) 1,382Net realized gain (loss) 19
Ending balance at December 31, 2013 $21,714
We contributed $3 million, $20 million and $9 million to fund the LPP during the years endedDecember 31, 2013, 2012 and 2011, respectively. Annual contributions to our defined benefit pension plans inthe United States and Canada are based on several factors that may vary from year to year. Our funding practicewith respect to the LPP is to contribute the minimum required contribution as defined by law while alsomaintaining an 80% funded status as defined by the Pension Protection Act of 2006. Thus, past contributions arenot always indicative of future contributions. Based on current assumptions, we expect to make $11 million incontributions to our defined benefit pension plans in 2014.
The expected long-term rate of return on plan assets for each measurement date was selected after givingconsideration to historical returns on plan assets, assessments of expected long-term inflation and market returnsfor each asset class and the target asset allocation strategy. We do not anticipate the return of any plan assets tous in 2014.
We expect to make the following estimated future benefit payments under the plans as follows (inthousands):
Pension Other Benefits
2014 $ 25,000 $1,0002015 26,000 —2016 27,000 —2017 27,000 —2018 28,000 —2019-2023 147,000 —
F-32

10. Income Taxes
The components of pre-tax income, generally based on the jurisdiction of the legal entity, were as follows:
Year Ended December 31,
2013 2012 2011
(Amounts in thousands)
Components of pre-tax incomeDomestic $(185,391) $(1,077,917) $(42,530)Foreign 80,907 261,120 21,042
$(104,484) $ (816,797) $(21,488)
The Company’s domestic pre-tax loss of $1,078 million in 2012 was due to the pre-tax impact of thelitigation settlement with AMR (see Note 20, Commitments and Contingencies), impairment charges (see Note 7,Goodwill and Intangible Assets) and the write-off of intercompany debt. The Company’s foreign pre-tax incomeof $261 million in 2012 was driven by the pre-tax impact of cancellation of intercompany debt income, partiallyoffset by impairment charges.
The provision for income taxes relating to continuing operations consists of the following:
Year Ended December 31,
2013 2012 2011
(Amounts in thousands)
Current portion:Federal $ 19,822 $ 7,383 $ 1,812State and Local 10,902 6,757 2,772Non U.S. 19,937 23,062 18,813
Total current 50,661 37,202 23,397
Deferred portion:Federal (62,557) (224,424) 30,780State and Local (2,772) (10,364) 889Non U.S. 639 2,515 2,740
Total deferred (64,690) (232,273) 34,409
Total (benefit) provision for income taxes $(14,029) $(195,071) $57,806
The provision for income taxes relating to continuing operations differs from amounts computed at thestatutory federal income tax rate as follows:
Year Ended December 31,
2013 2012 2011
(Amounts in thousands)
Income tax provision at statutory federal income taxrate $(36,569) $(285,879) $ (7,521)
State income taxes, net of federal benefit 5,340 (246) 2,445Impact of non U.S. taxing jurisdictions, net 5,565 (119) (2,690)Goodwill impairment 33,454 28,630 64,203Impact of sale of business (11,798) (15,209) —Write off of Intercompany Debt — (16,315) —Tax loss attributable to non controlling interest — 19,694 2,570Excise tax penalties 4,333 — —Valuation allowance (16,010) 72,261 —Other, net 1,656 2,112 (1,201)
Total (benefit) provision for income taxes $(14,029) $(195,071) $57,806
F-33
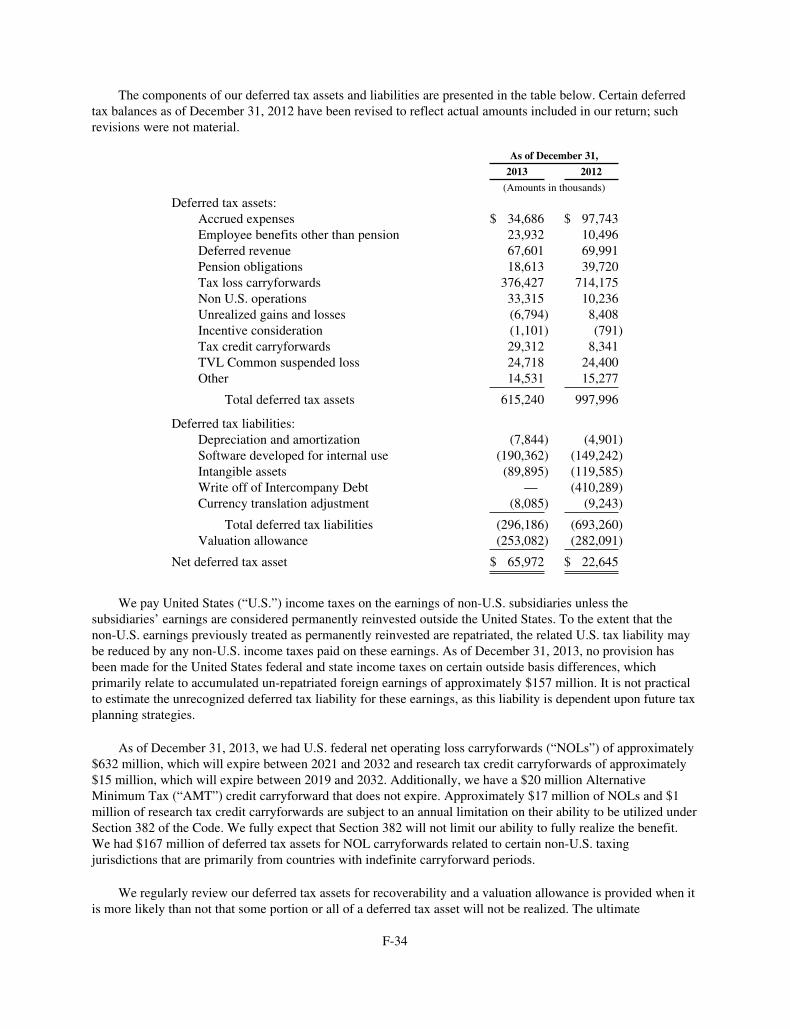
The components of our deferred tax assets and liabilities are presented in the table below. Certain deferredtax balances as of December 31, 2012 have been revised to reflect actual amounts included in our return; suchrevisions were not material.
As of December 31,
2013 2012
(Amounts in thousands)
Deferred tax assets:Accrued expenses $ 34,686 $ 97,743Employee benefits other than pension 23,932 10,496Deferred revenue 67,601 69,991Pension obligations 18,613 39,720Tax loss carryforwards 376,427 714,175Non U.S. operations 33,315 10,236Unrealized gains and losses (6,794) 8,408Incentive consideration (1,101) (791)Tax credit carryforwards 29,312 8,341TVL Common suspended loss 24,718 24,400Other 14,531 15,277
Total deferred tax assets 615,240 997,996
Deferred tax liabilities:Depreciation and amortization (7,844) (4,901)Software developed for internal use (190,362) (149,242)Intangible assets (89,895) (119,585)Write off of Intercompany Debt — (410,289)Currency translation adjustment (8,085) (9,243)
Total deferred tax liabilities (296,186) (693,260)Valuation allowance (253,082) (282,091)
Net deferred tax asset $ 65,972 $ 22,645
We pay United States (“U.S.”) income taxes on the earnings of non-U.S. subsidiaries unless thesubsidiaries’ earnings are considered permanently reinvested outside the United States. To the extent that thenon-U.S. earnings previously treated as permanently reinvested are repatriated, the related U.S. tax liability maybe reduced by any non-U.S. income taxes paid on these earnings. As of December 31, 2013, no provision hasbeen made for the United States federal and state income taxes on certain outside basis differences, whichprimarily relate to accumulated un-repatriated foreign earnings of approximately $157 million. It is not practicalto estimate the unrecognized deferred tax liability for these earnings, as this liability is dependent upon future taxplanning strategies.
As of December 31, 2013, we had U.S. federal net operating loss carryforwards (“NOLs”) of approximately$632 million, which will expire between 2021 and 2032 and research tax credit carryforwards of approximately$15 million, which will expire between 2019 and 2032. Additionally, we have a $20 million AlternativeMinimum Tax (“AMT”) credit carryforward that does not expire. Approximately $17 million of NOLs and $1million of research tax credit carryforwards are subject to an annual limitation on their ability to be utilized underSection 382 of the Code. We fully expect that Section 382 will not limit our ability to fully realize the benefit.We had $167 million of deferred tax assets for NOL carryforwards related to certain non-U.S. taxingjurisdictions that are primarily from countries with indefinite carryforward periods.
We regularly review our deferred tax assets for recoverability and a valuation allowance is provided when itis more likely than not that some portion or all of a deferred tax asset will not be realized. The ultimate
F-34

realization of deferred tax assets is dependent upon future taxable income during the periods in which thosetemporary differences become deductible. In assessing the need for a valuation allowance for our deferred taxassets, we considered all available positive and negative evidence, including our ability to carry back operatinglosses to prior periods, the reversal of deferred tax liabilities, tax planning strategies and projected future taxableincome. In assessing the need for a valuation allowance against our U.S. deferred tax assets, we also gavespecific consideration to goodwill and intangible impairment charges recorded in the last three years (see Note 7,Goodwill and Intangible Assets) and the charges for the settlement of the litigation with AMR (see Note 20,Commitments and Contingencies). Considering these factors, we established a valuation allowance ofapproximately $86 million against our U.S. deferred tax assets as of December 31, 2013. In addition, we have anallowance on the U.S. deferred tax assets of TVL Common, Inc. that was merged into our capital structure onDecember 31, 2012 of $5 million at December 31, 2013 on the non-U.S. deferred tax assets of ourlastminute.com subsidiaries of $163 million and $177 million as of December 31, 2013 and 2012, respectively.We reassess these assumptions regularly which could cause an increase or decrease to the valuation allowanceresulting in an increase or decrease in the effective tax rate, and could materially impact our results of operations.
It is our policy to recognize penalties and interest accrued related to income taxes as a component of theprovision (benefit) for income taxes. During the years ended December 31, 2013 and 2011, we recognized anexpense of $1 million and a benefit of $1 million, respectively. During the year ended December 31, 2012,amounts recognized for penalties and interest were not material to our results of operations. As of December 31,2013 and 2012, we had cumulative accrued interest and penalties of approximately $5 million and $1 million,respectively.
A reconciliation of the beginning and ending amount of unrecognized tax benefits, excluding interest andpenalties, is as follows:
Year Ended December 31,
2013 2012 2011
(Amounts in thousands)
Balance at beginning of year $54,016 $39,080 $38,072Additions for tax positions taken in the current year 10,874 16,367 3,016Additons for tax positions of prior years 5,572 3,584 1,050Reductions for tax positions of prior years (196) (3,113) (1,691)Reductions for tax positions of expired statute of
limitations (3,573) (1,902) (1,367)Settlements (5,452) — —
Balance at end of year $61,241 $54,016 $39,080
As of December 31, 2013, 2012 and 2011, the amount of unrecognized tax benefits that, if recognized,would impact the effective tax rate was $58 million, $54 million and $39 million, respectively.
We are subject to U.S. federal income tax as well as income tax of multiple state, local, and non-U.S.jurisdictions. In the normal course of business, we are subject to examination by taxing authorities throughout theworld. In February of 2014, the Internal Revenue Service notified us that they would soon begin examination ofour federal income tax returns for the 2011 and 2012 tax years. We do not expect that the results of thisexamination will have a material effect on our financial condition or results of operations. The U.S. federalstatute of limitations is closed for years prior to 2007. With few exceptions, we are no longer subject to state,local, or non-U.S. tax examinations by tax authorities for years prior to 2008.
The Company believes that it is reasonably possible that $9 million in unrecognized tax benefits may beresolved in the next twelve months.
F-35

11. Debt
The following table sets forth our outstanding debt:
December 31,
Rate Maturity 2013 2012
(Amounts in thousands)
Senior secured credit facilities:Term Loan B L+4.00% February 2019 $1,747,378 $ —
Incremental term loan facility L+3.50% February 2019 349,125 —Term Loan C L+3.00% December 2017 360,477 —Revolving credit facility L+3.75% February 2018 — —Initial term loan facility L+2.00% September 2014 — 238,335
First extended term loan facility L+5.75% September 2017 — 1,162,622Second extended term loan facility L+5.75% December 2017 — 401,515Incremental term loan facility L+6.00% December 2017 — 370,536
Senior unsecured notes due 2016 8.350% March 2016 389,321 385,099Senior secured notes due 2019 8.500% May 2019 799,823 801,712Mortgage facility 5.800% March 2017 83,541 84,340
Total debt $3,729,665 $3,444,159
Current portion of debt 86,117 23,232Long-term debt 3,643,548 3,420,927
Total debt $3,729,665 $3,444,159
Amended and Restated Senior Secured Credit Facilities
On February 19, 2013, Sabre GLBL Inc. amended and restated the previous credit agreement with a newagreement (the “Amended and Restated Credit Agreement”). The new agreement replaced (i) the existing initialterm loans with new classes of term loans of $1,775 million (the “Term Loan B”) and $425 million (the “TermLoan C”) and (ii) the existing revolver with a new revolver of $352 million (the “Revolver”). We used $14million of term loan proceeds and $2 million of cash on hand to pay debt issuance and third-party debtmodification costs resulting from this transaction.
The Amended and Restated Credit Agreement includes provisions that require us to pay a 1% fee (the“Repricing Premium”) to the respective lenders if we pay off or refinance all or a portion of the Term Loan Bwithin one year –and the Term Loan C within six months– of February 19, 2013. This Repricing Premium isapplicable only to the portion paid off or refinanced and does not apply to the scheduled quarterly amortizationpayments.
On September 30, 2013, we entered into an agreement for an incremental term loan facility to Term Loan B(the “Incremental Term Loan Facility”), having a face value of $350 million and providing total net proceeds of$350 million. We have used a portion, and intend to use the remainder, of the proceeds of the Incremental TermLoan Facility for working capital and one-time costs associated with the Expedia SMA and sale of TPN,including the payment of travel suppliers for travel consumed that originated on our technology platforms, andfor general corporate purposes. The Incremental Term Loan Facility matures on February 19, 2019 and includesa 1% Repricing Premium if we pay off or refinance all or a portion of the loan with incurrence of long term bankdebt before February 19, 2014. This loan currently bears interest at a rate equal to the LIBOR rate, subject to a1.00% floor, plus 3.50% per annum. It includes a provision for increases in interest rates to maintain a differenceof not more than 50 basis points relative to future term loan extensions or refinancing of amounts under theAmended and Restated Credit Agreement.
F-36
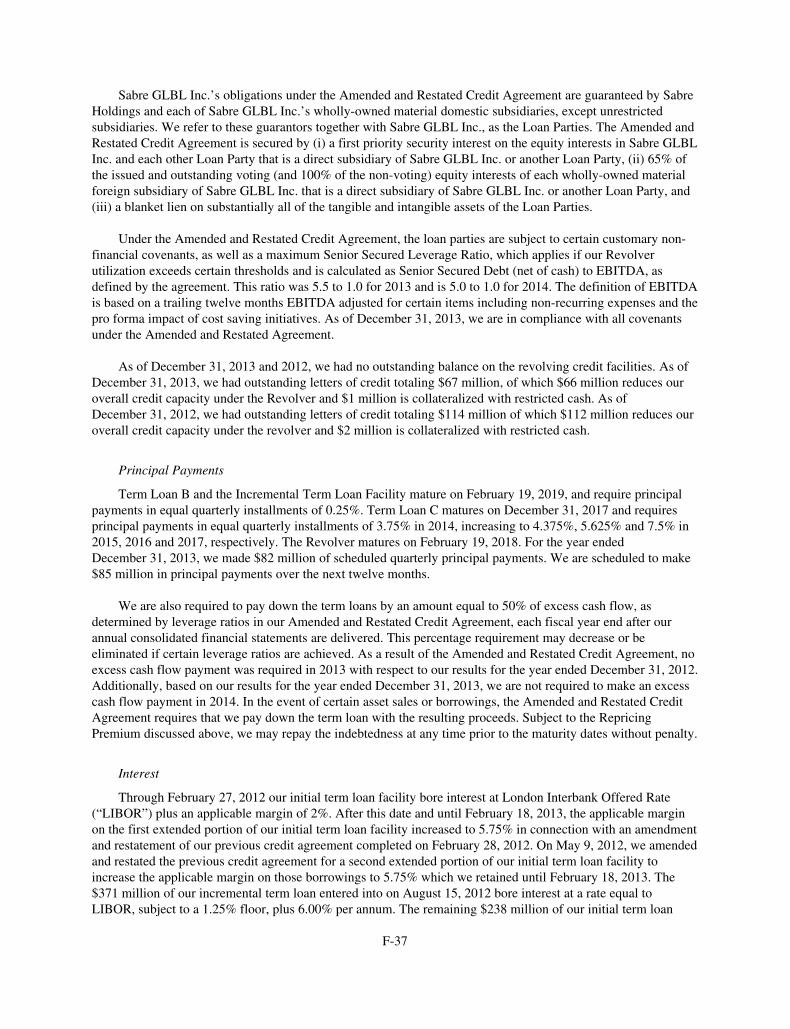
Sabre GLBL Inc.’s obligations under the Amended and Restated Credit Agreement are guaranteed by SabreHoldings and each of Sabre GLBL Inc.’s wholly-owned material domestic subsidiaries, except unrestrictedsubsidiaries. We refer to these guarantors together with Sabre GLBL Inc., as the Loan Parties. The Amended andRestated Credit Agreement is secured by (i) a first priority security interest on the equity interests in Sabre GLBLInc. and each other Loan Party that is a direct subsidiary of Sabre GLBL Inc. or another Loan Party, (ii) 65% ofthe issued and outstanding voting (and 100% of the non-voting) equity interests of each wholly-owned materialforeign subsidiary of Sabre GLBL Inc. that is a direct subsidiary of Sabre GLBL Inc. or another Loan Party, and(iii) a blanket lien on substantially all of the tangible and intangible assets of the Loan Parties.
Under the Amended and Restated Credit Agreement, the loan parties are subject to certain customary non-financial covenants, as well as a maximum Senior Secured Leverage Ratio, which applies if our Revolverutilization exceeds certain thresholds and is calculated as Senior Secured Debt (net of cash) to EBITDA, asdefined by the agreement. This ratio was 5.5 to 1.0 for 2013 and is 5.0 to 1.0 for 2014. The definition of EBITDAis based on a trailing twelve months EBITDA adjusted for certain items including non-recurring expenses and thepro forma impact of cost saving initiatives. As of December 31, 2013, we are in compliance with all covenantsunder the Amended and Restated Agreement.
As of December 31, 2013 and 2012, we had no outstanding balance on the revolving credit facilities. As ofDecember 31, 2013, we had outstanding letters of credit totaling $67 million, of which $66 million reduces ouroverall credit capacity under the Revolver and $1 million is collateralized with restricted cash. As ofDecember 31, 2012, we had outstanding letters of credit totaling $114 million of which $112 million reduces ouroverall credit capacity under the revolver and $2 million is collateralized with restricted cash.
Principal Payments
Term Loan B and the Incremental Term Loan Facility mature on February 19, 2019, and require principalpayments in equal quarterly installments of 0.25%. Term Loan C matures on December 31, 2017 and requiresprincipal payments in equal quarterly installments of 3.75% in 2014, increasing to 4.375%, 5.625% and 7.5% in2015, 2016 and 2017, respectively. The Revolver matures on February 19, 2018. For the year endedDecember 31, 2013, we made $82 million of scheduled quarterly principal payments. We are scheduled to make$85 million in principal payments over the next twelve months.
We are also required to pay down the term loans by an amount equal to 50% of excess cash flow, asdetermined by leverage ratios in our Amended and Restated Credit Agreement, each fiscal year end after ourannual consolidated financial statements are delivered. This percentage requirement may decrease or beeliminated if certain leverage ratios are achieved. As a result of the Amended and Restated Credit Agreement, noexcess cash flow payment was required in 2013 with respect to our results for the year ended December 31, 2012.Additionally, based on our results for the year ended December 31, 2013, we are not required to make an excesscash flow payment in 2014. In the event of certain asset sales or borrowings, the Amended and Restated CreditAgreement requires that we pay down the term loan with the resulting proceeds. Subject to the RepricingPremium discussed above, we may repay the indebtedness at any time prior to the maturity dates without penalty.
Interest
Through February 27, 2012 our initial term loan facility bore interest at London Interbank Offered Rate(“LIBOR”) plus an applicable margin of 2%. After this date and until February 18, 2013, the applicable marginon the first extended portion of our initial term loan facility increased to 5.75% in connection with an amendmentand restatement of our previous credit agreement completed on February 28, 2012. On May 9, 2012, we amendedand restated the previous credit agreement for a second extended portion of our initial term loan facility toincrease the applicable margin on those borrowings to 5.75% which we retained until February 18, 2013. The$371 million of our incremental term loan entered into on August 15, 2012 bore interest at a rate equal toLIBOR, subject to a 1.25% floor, plus 6.00% per annum. The remaining $238 million of our initial term loan
F-37

facility outstanding at December 31, 2012 continued with a 2.00% applicable margin until February 18, 2013.We elected the one-month LIBOR as the floating interest rate on all $2,173 million of our initial term loanfacility outstanding at December 31, 2012, and interest payments were due on the last day of each month. Intereston the outstanding loan was subject to interest rate swaps in a cash flow hedging relationship (see Note 12,Derivatives).
Beginning February 19, 2013, borrowings under the term loan agreement bear interest at a rate equal toeither, at our option: (i) the Eurocurrency rate plus an applicable margin for Eurocurrency borrowings as set forthbelow, or (ii) a base rate determined by the highest of (1) the prime rate of Bank of America, (2) the federal fundseffective rate plus 1/2% or (3) a LIBOR rate plus 1.00%, plus an applicable margin for base rate borrowings asset forth below. The Eurocurrency rate is based on LIBOR for all U.S. dollar borrowings and has a floor.
Eurocurrency borrowings Base rate borrowings
Applicable Margin Floor Applicable Margin Floor
Term Loan B 4.00% 1.25% 3.00% 2.25%Incremental term loan facility 3.50% 1.00% 2.50% 2.00%
Term Loan C 3.00% 1.00% 2.00% 2.00%Revolving credit facility 3.75% N/A 2.75% N/A
Applicable margins step down by 50 basis points for any quarter if the Senior Secured Leverage Ratio isless than or equal to 3.0 to 1.0. Applicable margins increase to maintain a difference of not more than 50 basispoints relative to future term loan extensions or refinancings. In addition, we are required to pay a quarterlycommitment fee of 0.375% per annum for unused revolving commitments. The commitment fee may increase to0.500% per annum if the Senior Secured Leverage Ratio is greater than 4.0 to 1.0.
We have elected the three-month LIBOR as the floating interest rate on all $2,457 million of ouroutstanding term loans. As of December 31, 2013, the interest rate on these borrowings is 5.25% including anapplicable margin of 4.00% for $1,747 million; 4.50% including an applicable margin of 3.50% for $349 million;and 4.00% including an applicable margin of 3.00% for $360 million of our outstanding term loans. Interestpayments are due on the last day of each quarter. Interest on a portion of the outstanding loan is hedged withinterest rate swaps (see Note 12, Derivatives).
In 2013, we incurred costs totaling $19 million associated with the Amended and Restated CreditAgreement and the Incremental Term Loan Facility of which $14 million was charged to interest expense duringthe year ended December 31, 2013 and $5 million was capitalized as debt issuance costs. We also recognized aloss on extinguishment of debt of $12 million as a result of the Amended and Restated Credit Agreement. In2012, we incurred costs totaling $38 million associated with the amendment and extension of certain facilitiesunder our previous credit agreement of which $8 million was charged to interest expense during the year endedDecember 31, 2012 and $30 million was capitalized as debt issuance costs. In addition, as a result ofprepayments under our previous credit agreement, we recognized a charge of $10 million to interest expenserelated to accelerated amortization of debt issuance costs during the year ended December 31, 2012. As ofDecember 31, 2013, we had $31 million of unamortized debt issuance costs included in other assets in ourconsolidated balance sheet associated with all debt transactions under the Amended and Restated CreditAgreement and the previous credit agreement. These costs are being amortized to interest expense over thematurity period of the Amended and Restated Credit Agreement
Our effective interest rates for the years ended December 31, 2013, 2012 and 2011, inclusive of theaccelerated amortization described above, are as follows:
Year Ended December 31,
2013 2012 2011
Including the impact of interest rate swaps 6.86% 6.53% 4.31%Excluding the impact of interest rate swaps 6.21% 5.65% 2.72%
F-38
On February 20, 2014, we modified our Amended and Restated Credit Agreement to reduce Term Loan B’sapplicable margin for both Eurocurrency and Base rate borrowings, including the related floors. The modificationalso provides for an incremental revolving commitment of $53 million due February 19, 2019 and extends thematurity date of $317 million of the Revolver to the same date with a provision for earlier maturity onNovember 19, 2018 if certain conditions are met. See Note 22, Subsequent Events.
Publicly Issued Senior Unsecured Notes
In March 2006, Sabre Holdings issued $400 million in 2016 Notes, bearing interest at a rate of 6.35% andmaturing March 15, 2016, in an underwritten public offering resulting in net cash proceeds after expenses ofapproximately $397 million. The 2016 Notes include certain non-financial covenants, including restrictions onincurring certain types of debt or entering into certain sale and leaseback transactions. We used all of the netproceeds plus available cash and cash equivalents and marketable securities to prepay $400 million of a bridgefacility used to finance the acquisition of our subsidiary lastminute.com. Under the terms of the 2016 Notes, wepaid $29 million in interest charges in 2007 and are obligated to pay $34 million per year afterwards until 2016.Interest payments are due in March and September each year. The interest rate payable on the 2016 Notesincreased to 8.35% effective March 16, 2007 due to a credit rating decline resulting from the acquisition of SabreHoldings. As of December 31, 2013, we are in compliance with all covenants under the indenture for the 2016Notes.
In August 2001, Sabre Holdings issued $400 million in 2011 Notes, bearing interest at a rate of 7.35% andmaturing August 1, 2011, in an underwritten public offering resulting in net cash proceeds to us of approximately$397 million. The interest payments were due in February and August each year. The 2011 Notes includedcertain non-financial covenants, including restrictions on incurring certain types of debt or entering into certainsale and leaseback transactions. In April 2009, we reduced our debt obligations by $76 million for the 2011Notes. During the quarter ended September 30, 2011, we paid down the remaining $324 million of principal and$12 million of accrued interest on our unsecured notes which matured on August 1, 2011.
On March 30, 2007, in connection with the acquisition of Sabre Holdings by Sabre Corporation, SabreHoldings filed Form 15 with the Securities and Exchange Commission and terminated its reporting obligationswith respect to its common stock, the 2011 Notes and the 2016 Notes under the Securities Exchange Act of 1934,as amended. In connection with the acquisition of Sabre Holdings, we also amended and restated the guaranteeby Sabre GLBL of the 2011 Notes and the 2016 Notes in response to a request from the rating agencies so thatthe 2011 Notes and the 2016 Notes would not be structurally subordinated to Sabre GLBL’s obligations under itssenior secured credit facilities. Sabre Corporation has not assumed this guarantee and is not otherwiseguaranteeing the 2011 Notes, which have since been repaid, or the 2016 Notes.
Senior Secured Notes
On May 9 and September 20, 2012, Sabre GLBL Inc. issued a total of $800 million in senior secured notes($400 million each) bearing interest at a rate of 8.50% and maturing on May 15, 2019, pursuant to Rule 144Aunder the Securities Act of 1933, as amended, (“Securities Act”), resulting in net proceeds of approximately $796million after capitalized expenses of $5 million. The May 9 and September 20, 2012 offerings (collectively“2019 Notes”) include certain non-financial covenants, including restrictions on incurring certain types ofindebtedness, creation of liens on certain assets, making of certain investments, and payment of dividends. Thesecovenants are similar in nature to those existing on the senior secured credit facilities. The 2019 Notes have notand will not be registered under the Securities Act. We used $679 million of the net proceeds to pay off certainlenders under our previous senior secured credit facilities, and retained the remainder for general corporatepurposes. A portion of the retained funds was subsequently used for funding the acquisition of PRISM (SeeNote 3, Acquisitions).
F-39

Interest is calculated from the date of the original issuance, or May 9, 2012, on the 2019 Notes. We areobligated to pay $68 million in interest per year until 2019. Payments are due in May and November each year.Additionally, capitalized costs related to these transactions are being amortized to interest expense over the 2019Notes maturity period.
The indenture to the senior secured notes allows the Company, at its option, to redeem up to 40% of theprincipal amount of the notes outstanding in the event of an equity offering, such as an initial public offering,until May 15, 2015. The contingent call option is at a price of 108.50%, plus accrued and unpaid interest, if any,to the date of redemption. In order to exercise the contingent call option, at least 50% of the aggregate principaloriginally issued must remain outstanding after the option is exercised, and the redemption must occur within120 days of the equity offering closing date. The fair value of the contingent call option that met the definition ofan embedded derivative was a gain of $2 million at December 31, 2013, and was not material as of December 31,2012. The call option is recorded as a component of long term debt, with an offsetting unrealized gain in other,net. See Note 12, Derivatives and Note 13, Fair Value Measurements.
Mortgage Facility
On March 29, 2007, we purchased the buildings, land and furniture and fixtures located at our headquarterfacilities in Southlake, Texas, which were previously financed under a capital lease facility. The total purchaseprice of the assets was $104 million. The purchase was financed through $85 million raised by a mortgagefacility that we entered into and $19 million from cash on hand. The $85 million mortgage facility carries aninterest rate of 5.8% and is secured by the headquarters building which had a net book value of $83 million as ofDecember 31, 2013. Payments made through March 1, 2012 were applied to accrued interest only. Subsequent tothat date, payments are also applied to the principal balance of the facility. Payments are due on the first businessday of each month. The facility matures on March 1, 2017 and all unpaid principal will be due at that time. As ofDecember 31, 2013 we are in compliance with all covenants set forth in the facility agreement.
Note Payable to a Joint Venture Partner
On March 31, 2002 we entered into a promissory note with one of our joint venture partners. The notecarried an interest rate of 8.0% and matured on March 31, 2012, having a zero balance as of December 31, 2013and 2012.
12. Derivatives
Hedging Objectives—We are exposed to certain risks relating to ongoing business operations. The primaryrisks managed by using derivative instruments are foreign currency exchange rate risk and interest rate risk.Forward contracts on various foreign currencies are entered into to manage the foreign currency exchange raterisk on operational exposure denominated in foreign currencies. Interest rate swaps are entered into to manageinterest rate risk associated with our floating-rate borrowings. In accordance with authoritative guidance onaccounting for derivatives and hedging, we designate foreign currency forward contracts as cash flow hedges onoperational exposure and interest rate swaps as cash flow hedges of floating-rate borrowings.
Cash Flow Hedging Strategy—For derivative instruments that are designated and qualify as cash flowhedges, the effective portion of the gain or loss on the derivative instrument is reported as a component of othercomprehensive income (loss) and reclassified into earnings in the same line item associated with the forecastedtransaction and in the same period or periods during which the hedged transaction affects earnings. Theremaining gain or loss on the derivative instrument in excess of the cumulative change in the present value offuture cash flows of the hedged item, if any (ineffective portion) or hedge components excluded from theassessment of effectiveness, are recognized in the consolidated statements of operations during the currentperiod.
F-40

To protect against the reduction in value of forecasted foreign currency cash flows resulting from exportsales over the next year, we have instituted a foreign currency cash flow hedging program. We hedge portions ofour expenses denominated in foreign currencies with forward contracts. When the dollar strengthens significantlyagainst the foreign currencies, the decline in present value of future foreign currency revenue is offset by gains inthe fair value of the forward contracts designated as hedges. Conversely, when the dollar weakens, the increase inthe present value of future foreign currency cash flows is offset by losses in the fair value of the forwardcontracts.
We have entered into interest rate swap agreements to manage interest rate risk exposure. The interest rateswap agreements utilized effectively modify our exposure to interest rate risk by converting floating-rate debt toa fixed rate basis, thus reducing the impact of interest rate changes on future interest expense and net earnings.These agreements involve the receipt of floating rate amounts in exchange for fixed rate interest payments overthe life of the agreements without an exchange of the underlying principal amount.
Our interest rate swaps are not designated in a cash flow hedging relationship because we no longerqualified for hedge accounting treatment following the amendment and restatement of our Senior Secured CreditFacility in February of 2013 (see Note 11, Debt). Derivatives not designated as hedging instruments are carried atfair value with changes in fair value reflected in the consolidated statement of operations.
Forward Contracts—In order to hedge our operational exposure to foreign currency movements, we are aparty to certain foreign currency forward contracts that extend until December 1, 2014. We have designated theseinstruments as cash flow hedges. No hedging ineffectiveness was recorded in earnings relating to the forwardsduring the years ended December 31, 2013, 2012, or 2011. As the outstanding contracts settle, it is estimated that$5 million in gains will be reclassified from other comprehensive income (loss) to earnings. We have alsoentered into short-term forward contracts to hedge a portion of our foreign currency exposure related to travelsupplier liability payments. As part of our risk management strategy, these derivatives were not designated forhedge accounting at inception; therefore, the change in fair value of these contracts is recorded in ourconsolidated statements of operations.
As of December 31, 2013 and 2012, we had the following unsettled purchased foreign currency forwardcontracts that were entered into to hedge our operational exposure to foreign currency movements:
December 31, 2013 Outstanding Notional Amount
Buy Currency Sell CurrencyForeignAmount
USDAmount
Average ContractRate
(Amounts in thousands, excluding average contract rates)
US Dollar Australian Dollar 5,625 $ 5,041 0.8962Australian Dollar US Dollar 975 996 1.0215
Euro US Dollar 12,800 16,624 1.2988British Pound Sterling US Dollar 18,450 28,908 1.5668
Indian Rupee US Dollar 1,174,000 18,593 0.0158Polish Zloty US Dollar 170,400 52,748 0.3096
December 31, 2012 Outstanding Notional Amount
Buy Currency Sell CurrencyForeignAmount
USDAmount
Average ContractRate
(Amounts in thousands, excluding average contract rates)
Australian Dollar US Dollar 4,400 $ 4,433 1.0074Euro US Dollar 20,005 26,168 1.3081
British Pound Sterling US Dollar 15,850 25,418 1.6036Indian Rupee US Dollar 1,236,000 21,899 0.0177Polish Zloty US Dollar 158,450 48,503 0.3061
F-41

Interest Rate Swap Contracts—During April 2007, in connection with our senior secured credit facilities(see Note 11, Debt) with a three-month LIBOR as the floating interest rate, we entered into six interest rateswaps. Under the terms of the swaps, the interest rate payments and receipts are quarterly on the last day ofJanuary, April, July and October. The reset dates on the swaps are also the last day of January, April, July andOctober each year until maturity.
The table below includes the outstanding and matured interest rate swaps relevant to the years endedDecember 31, 2013, 2012 and 2011:
NotionalAmount
Interest RateReceived
InterestRate Paid Effective Date Maturity Date
Outstanding: $ 400 million 1 month LIBOR 2.03% July 29, 2011 September 30, 2014$ 350 million 1 month LIBOR 2.51% April 30, 2012 September 30, 2014
$ 750 million
Matured: $ 800 million 3 month LIBOR 5.04% April 30, 2007 April 30, 2012$ 350 million 3 month LIBOR 4.99% April 30, 2007 April 30, 2011$ 125 million 3 month LIBOR 5.04% April 30, 2007 April 28, 2011$ 125 million 3 month LIBOR 5.03% April 30, 2007 April 28, 2011
$1,400 million
The objective of the swaps is to hedge the interest payments associated with floating-rate liabilities on thenotional amounts of our Senior Secured Debt as summarized above. The effectiveness of the swaps isperiodically assessed throughout the life of the swaps using the “hypothetical derivative method.” Thehypothetical swap has terms that identically match the terms of the floating rate liability, and is thereforepresumed to perfectly offset the hedged cash flows. We review the critical terms of the swaps and the hedgedinstrument quarterly to validate that the terms continue to match and that there has been no deterioration in thecreditworthiness of the counterparties. Hedge ineffectiveness is calculated quarterly based upon the excess of thecumulative change in the fair value of the actual swap over the cumulative change in the fair value of the“perfect” hypothetical swap. The amount of ineffectiveness, if any, is recorded in earnings. For the years endedDecember 31, 2012 and 2011, no hedge ineffectiveness has been incurred.
The estimated fair values of our derivatives designated as hedging instruments as of December 31, 2013 and2012 are provided below:
Derivative Assets (Liabilities)
Derivatives designated ashedging instruments Balance Sheet Location
Fair Value as of December 31,
2013 2012
(Amounts in thousands)
Foreign exchange contracts Prepaid expenses $5,374 $ 2,568Interest rate swaps Other accrued liabilities — (15,111)
Other noncurrent liabilities — (10,461)
Total $5,374 $(23,004)
F-42
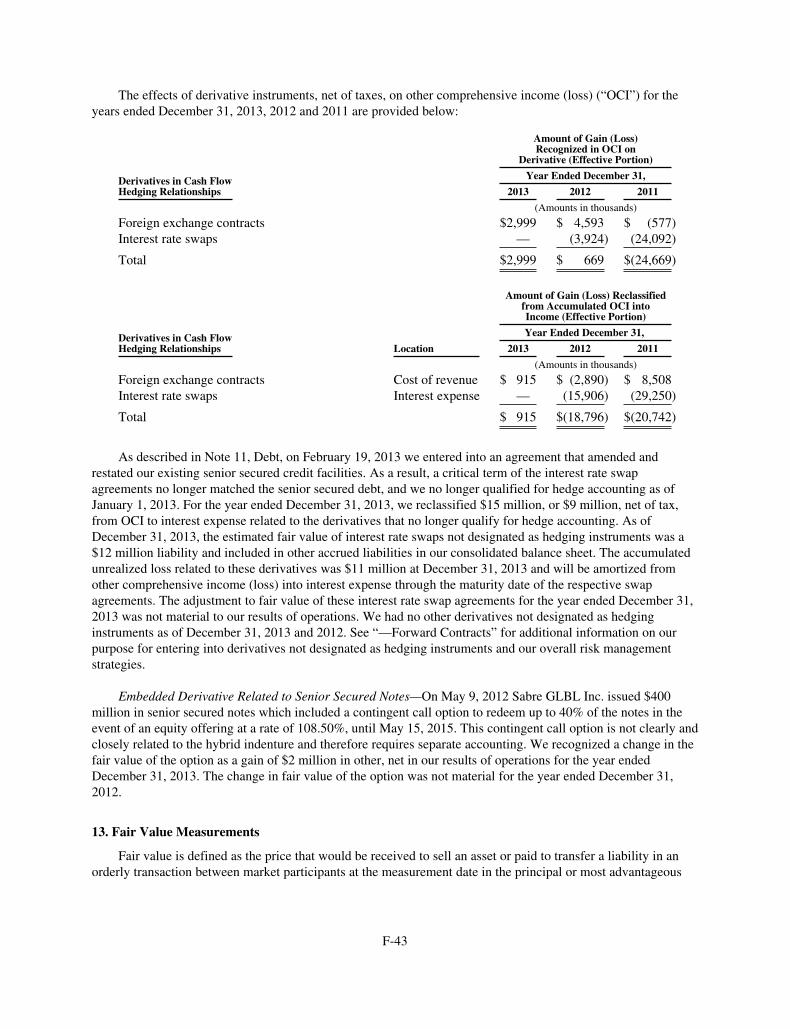
The effects of derivative instruments, net of taxes, on other comprehensive income (loss) (“OCI”) for theyears ended December 31, 2013, 2012 and 2011 are provided below:
Amount of Gain (Loss)Recognized in OCI on
Derivative (Effective Portion)
Derivatives in Cash FlowHedging Relationships
Year Ended December 31,
2013 2012 2011
(Amounts in thousands)
Foreign exchange contracts $2,999 $ 4,593 $ (577)Interest rate swaps — (3,924) (24,092)
Total $2,999 $ 669 $(24,669)
Amount of Gain (Loss) Reclassifiedfrom Accumulated OCI intoIncome (Effective Portion)
Derivatives in Cash FlowHedging Relationships Location
Year Ended December 31,
2013 2012 2011
(Amounts in thousands)
Foreign exchange contracts Cost of revenue $ 915 $ (2,890) $ 8,508Interest rate swaps Interest expense — (15,906) (29,250)
Total $ 915 $(18,796) $(20,742)
As described in Note 11, Debt, on February 19, 2013 we entered into an agreement that amended andrestated our existing senior secured credit facilities. As a result, a critical term of the interest rate swapagreements no longer matched the senior secured debt, and we no longer qualified for hedge accounting as ofJanuary 1, 2013. For the year ended December 31, 2013, we reclassified $15 million, or $9 million, net of tax,from OCI to interest expense related to the derivatives that no longer qualify for hedge accounting. As ofDecember 31, 2013, the estimated fair value of interest rate swaps not designated as hedging instruments was a$12 million liability and included in other accrued liabilities in our consolidated balance sheet. The accumulatedunrealized loss related to these derivatives was $11 million at December 31, 2013 and will be amortized fromother comprehensive income (loss) into interest expense through the maturity date of the respective swapagreements. The adjustment to fair value of these interest rate swap agreements for the year ended December 31,2013 was not material to our results of operations. We had no other derivatives not designated as hedginginstruments as of December 31, 2013 and 2012. See “—Forward Contracts” for additional information on ourpurpose for entering into derivatives not designated as hedging instruments and our overall risk managementstrategies.
Embedded Derivative Related to Senior Secured Notes—On May 9, 2012 Sabre GLBL Inc. issued $400million in senior secured notes which included a contingent call option to redeem up to 40% of the notes in theevent of an equity offering at a rate of 108.50%, until May 15, 2015. This contingent call option is not clearly andclosely related to the hybrid indenture and therefore requires separate accounting. We recognized a change in thefair value of the option as a gain of $2 million in other, net in our results of operations for the year endedDecember 31, 2013. The change in fair value of the option was not material for the year ended December 31,2012.
13. Fair Value Measurements
Fair value is defined as the price that would be received to sell an asset or paid to transfer a liability in anorderly transaction between market participants at the measurement date in the principal or most advantageous
F-43
market for that asset or liability. Guidance on fair value measurements and disclosures establishes a valuationhierarchy for disclosure of inputs used in measuring fair value defined as follows:
Level 1—Inputs are unadjusted quoted prices that are available in active markets for identical assets orliabilities.
Level 2—Inputs include quoted prices for similar assets and liabilities in active markets and quotedprices in non-active markets, inputs other than quoted prices that are observable, and inputs that are notdirectly observable, but are corroborated by observable market data.
Level 3—Inputs that are unobservable and are supported by little or no market activity and reflect theuse of significant management judgment.
A financial asset’s or liability’s classification within the hierarchy is determined based on the least reliablelevel of input that is significant to the fair value measurement. In determining fair value, we utilize valuationtechniques that maximize the use of observable inputs and minimize the use of unobservable inputs to the extentpossible. We also consider the counterparty and our own non-performance risk in our assessment of fair value.
Fair values of applicable assets and liabilities are estimated as follows:
Foreign Currency Forward Contracts—The fair value of the foreign currency forward contracts wereestimated based upon pricing models that use inputs derived from or corroborated by observable market datasuch as currency spot and forward rates.
Interest Rate Swaps—The fair value of our interest rate swaps were estimated using a combined income andmarket-based valuation methodology based upon credit ratings and forward interest rate yield curves obtainedfrom independent pricing services reflecting broker market quotes.
Contingent Consideration—On August 1, 2012, we acquired all of the outstanding stock and ownershipinterest of PRISM (see Note 3, Acquisitions). Included in the purchase price is contingent consideration, basedon management’s best estimate of fair value and future performance results on the acquisition date and is to bepaid in 24 months following the acquisition date. Fair value of this payment was estimated considering the timingof the payments and discounted at 4.75%, representing our short-term borrowing rate based on our revolvingcredit facility at the time of the acquisition. For the year ended December 31, 2013, we recognized $1 million inexpense related to the change in fair value of the contingent consideration. The expense recognized during theyear ended December 31, 2012 related to the change in fair value was not material. A 1% increase or decrease inour discount rate will result in a 1.4% change in fair value.
Embedded Derivative—On May 15, 2012, we acquired a contingent call option to redeem a portion of oursenior secured notes in the event of an equity offering (see Note 11, Debt). We modeled the fair value of this calloption by evaluating the difference in fair value of the hybrid instrument with and without the call optionrequiring separate accounting. We calculated the fair value using Level 3 unobservable inputs such asmanagement’s estimate of the probability of an equity offering, credit spreads and the expected future volatilityof interest rates based on historical trends. When other inputs are held constant, the higher our expectation offuture interest rate volatility, the lower the fair value of the call option. Changes to the unobservable inputs couldresult in a significantly higher or lower fair value measurement.
F-44
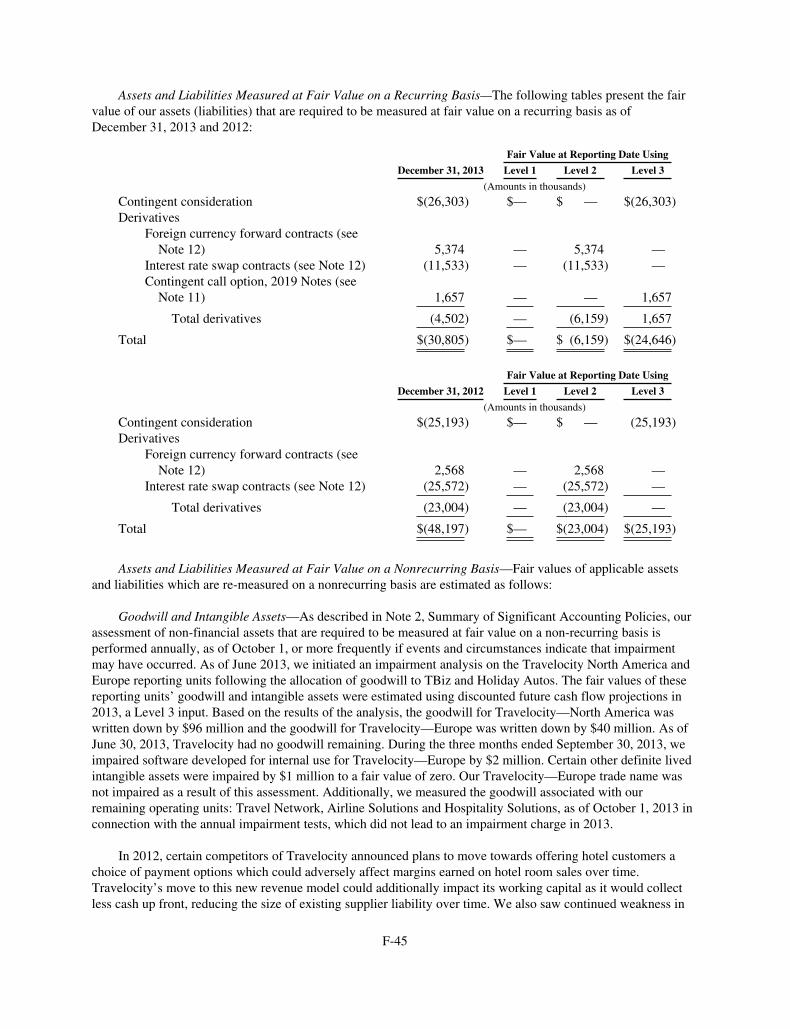
Assets and Liabilities Measured at Fair Value on a Recurring Basis—The following tables present the fairvalue of our assets (liabilities) that are required to be measured at fair value on a recurring basis as ofDecember 31, 2013 and 2012:
Fair Value at Reporting Date Using
December 31, 2013 Level 1 Level 2 Level 3
(Amounts in thousands)
Contingent consideration $(26,303) $— $ — $(26,303)Derivatives
Foreign currency forward contracts (seeNote 12) 5,374 — 5,374 —
Interest rate swap contracts (see Note 12) (11,533) — (11,533) —Contingent call option, 2019 Notes (see
Note 11) 1,657 — — 1,657
Total derivatives (4,502) — (6,159) 1,657
Total $(30,805) $— $ (6,159) $(24,646)
Fair Value at Reporting Date Using
December 31, 2012 Level 1 Level 2 Level 3
(Amounts in thousands)
Contingent consideration $(25,193) $— $ — (25,193)Derivatives
Foreign currency forward contracts (seeNote 12) 2,568 — 2,568 —
Interest rate swap contracts (see Note 12) (25,572) — (25,572) —
Total derivatives (23,004) — (23,004) —
Total $(48,197) $— $(23,004) $(25,193)
Assets and Liabilities Measured at Fair Value on a Nonrecurring Basis—Fair values of applicable assetsand liabilities which are re-measured on a nonrecurring basis are estimated as follows:
Goodwill and Intangible Assets—As described in Note 2, Summary of Significant Accounting Policies, ourassessment of non-financial assets that are required to be measured at fair value on a non-recurring basis isperformed annually, as of October 1, or more frequently if events and circumstances indicate that impairmentmay have occurred. As of June 2013, we initiated an impairment analysis on the Travelocity North America andEurope reporting units following the allocation of goodwill to TBiz and Holiday Autos. The fair values of thesereporting units’ goodwill and intangible assets were estimated using discounted future cash flow projections in2013, a Level 3 input. Based on the results of the analysis, the goodwill for Travelocity—North America waswritten down by $96 million and the goodwill for Travelocity—Europe was written down by $40 million. As ofJune 30, 2013, Travelocity had no goodwill remaining. During the three months ended September 30, 2013, weimpaired software developed for internal use for Travelocity—Europe by $2 million. Certain other definite livedintangible assets were impaired by $1 million to a fair value of zero. Our Travelocity—Europe trade name wasnot impaired as a result of this assessment. Additionally, we measured the goodwill associated with ourremaining operating units: Travel Network, Airline Solutions and Hospitality Solutions, as of October 1, 2013 inconnection with the annual impairment tests, which did not lead to an impairment charge in 2013.
In 2012, certain competitors of Travelocity announced plans to move towards offering hotel customers achoice of payment options which could adversely affect margins earned on hotel room sales over time.Travelocity’s move to this new revenue model could additionally impact its working capital as it would collectless cash up front, reducing the size of existing supplier liability over time. We also saw continued weakness in
F-45
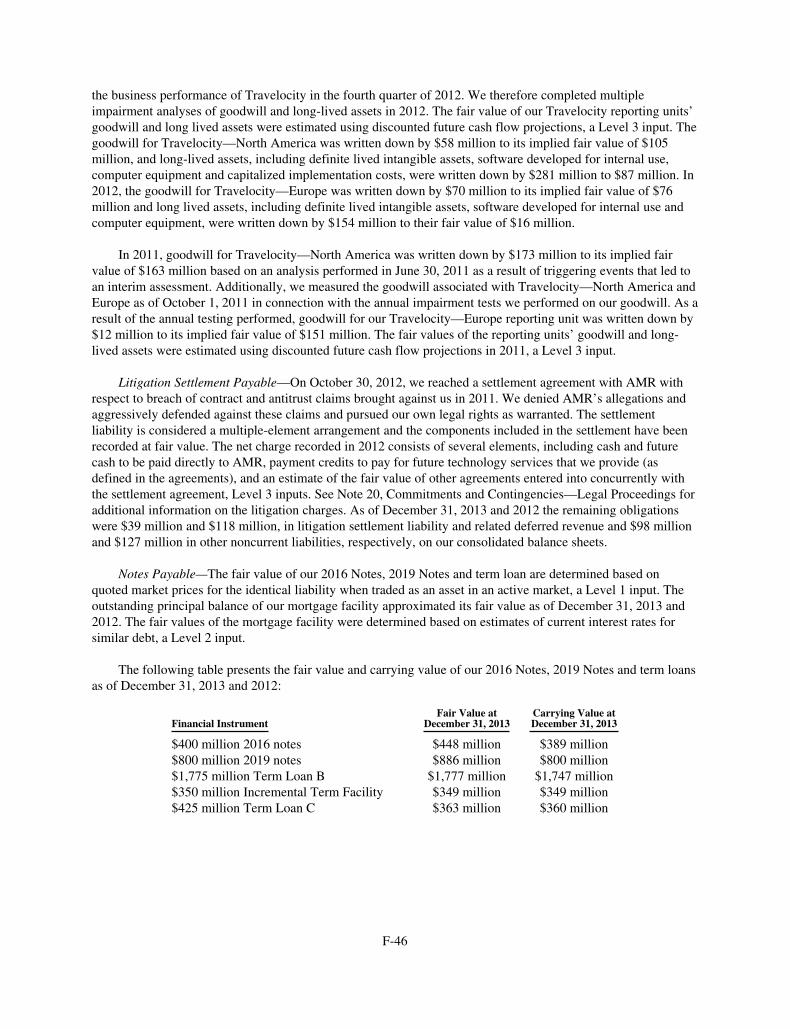
the business performance of Travelocity in the fourth quarter of 2012. We therefore completed multipleimpairment analyses of goodwill and long-lived assets in 2012. The fair value of our Travelocity reporting units’goodwill and long lived assets were estimated using discounted future cash flow projections, a Level 3 input. Thegoodwill for Travelocity—North America was written down by $58 million to its implied fair value of $105million, and long-lived assets, including definite lived intangible assets, software developed for internal use,computer equipment and capitalized implementation costs, were written down by $281 million to $87 million. In2012, the goodwill for Travelocity—Europe was written down by $70 million to its implied fair value of $76million and long lived assets, including definite lived intangible assets, software developed for internal use andcomputer equipment, were written down by $154 million to their fair value of $16 million.
In 2011, goodwill for Travelocity—North America was written down by $173 million to its implied fairvalue of $163 million based on an analysis performed in June 30, 2011 as a result of triggering events that led toan interim assessment. Additionally, we measured the goodwill associated with Travelocity—North America andEurope as of October 1, 2011 in connection with the annual impairment tests we performed on our goodwill. As aresult of the annual testing performed, goodwill for our Travelocity—Europe reporting unit was written down by$12 million to its implied fair value of $151 million. The fair values of the reporting units’ goodwill and long-lived assets were estimated using discounted future cash flow projections in 2011, a Level 3 input.
Litigation Settlement Payable—On October 30, 2012, we reached a settlement agreement with AMR withrespect to breach of contract and antitrust claims brought against us in 2011. We denied AMR’s allegations andaggressively defended against these claims and pursued our own legal rights as warranted. The settlementliability is considered a multiple-element arrangement and the components included in the settlement have beenrecorded at fair value. The net charge recorded in 2012 consists of several elements, including cash and futurecash to be paid directly to AMR, payment credits to pay for future technology services that we provide (asdefined in the agreements), and an estimate of the fair value of other agreements entered into concurrently withthe settlement agreement, Level 3 inputs. See Note 20, Commitments and Contingencies—Legal Proceedings foradditional information on the litigation charges. As of December 31, 2013 and 2012 the remaining obligationswere $39 million and $118 million, in litigation settlement liability and related deferred revenue and $98 millionand $127 million in other noncurrent liabilities, respectively, on our consolidated balance sheets.
Notes Payable—The fair value of our 2016 Notes, 2019 Notes and term loan are determined based onquoted market prices for the identical liability when traded as an asset in an active market, a Level 1 input. Theoutstanding principal balance of our mortgage facility approximated its fair value as of December 31, 2013 and2012. The fair values of the mortgage facility were determined based on estimates of current interest rates forsimilar debt, a Level 2 input.
The following table presents the fair value and carrying value of our 2016 Notes, 2019 Notes and term loansas of December 31, 2013 and 2012:
Financial InstrumentFair Value at
December 31, 2013Carrying Value atDecember 31, 2013
$400 million 2016 notes $448 million $389 million$800 million 2019 notes $886 million $800 million$1,775 million Term Loan B $1,777 million $1,747 million$350 million Incremental Term Facility $349 million $349 million$425 million Term Loan C $363 million $360 million
F-46

Financial InstrumentFair Value at
December 31, 2012Carrying Value atDecember 31, 2012
$400 million 2016 notes $ 429 million $ 385 million$800 million 2019 notes $ 854 million $ 802 million$1,802 million Term Loan B $1,812 million $1,802 million
$375 million incremental term loanFacility $ 380 million $ 371 million
14. Comprehensive Income (Loss)
At December 31, 2013 and 2012, the components of accumulated other comprehensive income (loss), net ofrelated deferred income taxes were as follows:
December 31,
2013 2012
(Amounts in thousands)
Defined benefit pension & other post retirement benefit plans $(63,762) $(86,158)Unrealized loss on foreign currency forward contracts and interest
rate swaps (2,684) (14,222)Unrealized foreign currency translation gain 15,050 1,934Other (1) 1,501 2,916
Total accumulated other comprehensive loss, net of tax $(49,895) $(95,530)
(1) Primarily relates to our share of Abacus’ accumulated other comprehensive income. See Note 6, EquityMethod Investments.
The change in defined benefit pension and other postretirement benefit plans is net of deferred tax effects ofapproximately $12 million, $19 million, and $16 million for the years ended December 31, 2013, 2012, and 2011respectively.
The change in unrealized gain (loss) on foreign currency forward contracts and interest rate swaps is net ofdeferred tax effects of approximately $6 million, $9 million and $1 million for the years ended December 31,2013, 2012, and 2011, respectively.
The change in unrealized foreign currency translation gain (loss) is net of deferred tax effects ofapproximately $3 million for the year ended December 31, 2013 and $1 million for each of the years endedDecember 31, 2012 and 2011.
The tax effects allocated to the other components of accumulated other comprehensive income during theyears ended December 31, 2013, 2012, and 2011 were not material.
Reclassification adjustments, net of tax, for (gains) losses included in net income were as follows:
Year Ended December 31,
2013 2012 2011
(Amounts in thousands)
Foreign currency translation (1) $ 8,162 $ 888 $ —Foreign exchange contracts (915) 2,890 (8,508)Interest rate swaps 9,453 15,906 29,250Prior service costs and actuarial gains (5,409) (6,716) (7,285)
Total $11,291 $12,968 $13,457
(1) Relates to the dispositions of Zuji in 2013 and TravelGuru and Sabre Pacific in 2012. See Note 4,Discontinued Operations and Dispositions.
F-47

15. Redeemable Preferred Stock
Our authorized preferred stock consists of 225 million shares with a par value of $0.01 per share of which87.5 million shares of preferred stock have been designated as Series A Preferred Stock with a stated value of$5.7468681218772 per share. As of December 31, 2013, and 2012, there were 87,229,703 preferred shares issuedand 87,184,178 preferred shares outstanding, all of which were Series A Preferred Stock.
Voting
Holders of the Series A Preferred Stock have no voting rights except with respect to the creation of any classor series of capital stock having any preference or priority over Series A Preferred Stock or the amendment orrepeal of any provision of the constituent documents of the Company that adversely changes the powers,preferences or special rights of the Series A Preferred Stock.
Dividends
Each share of Series A Preferred Stock accumulates dividends at an annual rate of 6%. Accumulated butunpaid dividends totaled $134 million and $97 million at December 31, 2013 and 2012, respectively. The SeriesA Preferred Shares were recorded at fair value at the date of issuance and have been adjusted each period to thecurrent redemption value which includes accumulated but unpaid dividends. On December 31, 2009, we declaredand paid a $90 million in-kind dividend through the conversion of our wholly-owned subsidiary Travelocity.comInc. into Travelocity.com LLC (see Note 2, Summary of Significant Accounting Policies). No cash dividendshave been paid since the inception of the Series A Preferred Shares.
Liquidation
The holders of the Series A Preferred Stock have the right to require us to repurchase their shares in theform of cash in the amount of the stated value per share plus accrued and unpaid dividends upon the occurrenceof a liquidation event as described in the Certificate of Correction of the Second Amended and RestatedCertificate of Incorporation of Sabre Corporation (“Liquidation Events”). Liquidation Events are: (a) aconsolidation or merger in which the Company is not the surviving entity to the extent that holders of commonstock of the Company receive cash, indebtedness, or preferred stock of the surviving entity and holders of SeriesA Preferred Stock do not receive preferred stock of the surviving entity with rights, powers, and preferencesequal to or more favorable than those of the Series A Preferred Stock; (b) a disposition of all or substantially allof the assets of the Company; (c) any person or group of persons acquiring beneficial ownership of more than50% of the total voting power or equity interest in the Company; (d) the first underwritten public offering andsale of the equity securities of the Company for cash; or (e) the 30th anniversary of the date of issuance of theSeries A Preferred Stock. At the time of repurchase, the Series A Preferred Stock must be presented in units, eachof which is to consist of two restricted shares of currently outstanding common stock and five shares of Series APreferred Stock. For each unit presented for repurchase, the holders will receive back two unrestricted shares ofcommon stock in addition to the cash in the amount of the stated value per share of Series A Preferred Stock plusaccrued and unpaid dividends.
Redemption
The Series A Preferred Stock are redeemable for cash in the amount of the stated value per share plusaccrued and unpaid dividends. At our option, we may redeem all or part of the Series A Preferred Stock at anytime. The majority holders of the Series A Preferred Stock are TPG and Silver Lake which have the right to electthe board of directors in their capacity as owners. Therefore, the Series A Preferred Shares are also redeemable atthe option of the holders of the Preferred Stock. As such, the Series A Preferred Stock is presented outside ofpermanent equity as temporary equity in our consolidated balance sheet. At the time of redemption, the Series APreferred Stock must be presented in units, each of which is to consist of two restricted shares of currently
F-48
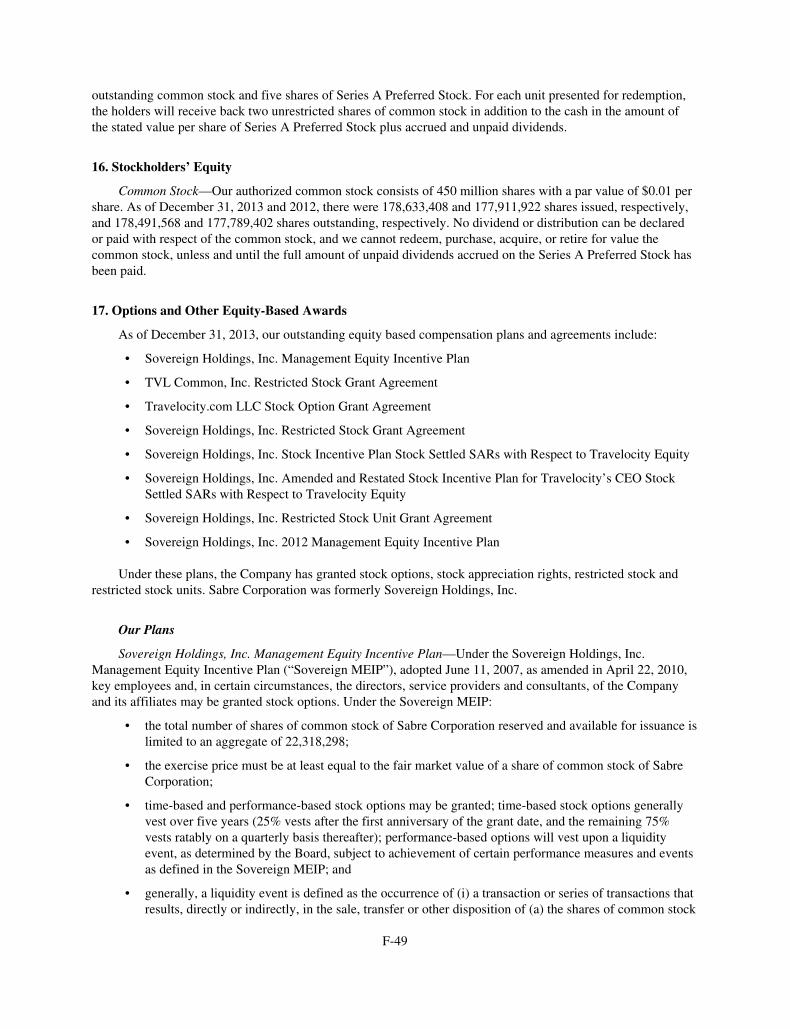
outstanding common stock and five shares of Series A Preferred Stock. For each unit presented for redemption,the holders will receive back two unrestricted shares of common stock in addition to the cash in the amount ofthe stated value per share of Series A Preferred Stock plus accrued and unpaid dividends.
16. Stockholders’ Equity
Common Stock—Our authorized common stock consists of 450 million shares with a par value of $0.01 pershare. As of December 31, 2013 and 2012, there were 178,633,408 and 177,911,922 shares issued, respectively,and 178,491,568 and 177,789,402 shares outstanding, respectively. No dividend or distribution can be declaredor paid with respect of the common stock, and we cannot redeem, purchase, acquire, or retire for value thecommon stock, unless and until the full amount of unpaid dividends accrued on the Series A Preferred Stock hasbeen paid.
17. Options and Other Equity-Based Awards
As of December 31, 2013, our outstanding equity based compensation plans and agreements include:
• Sovereign Holdings, Inc. Management Equity Incentive Plan
• TVL Common, Inc. Restricted Stock Grant Agreement
• Travelocity.com LLC Stock Option Grant Agreement
• Sovereign Holdings, Inc. Restricted Stock Grant Agreement
• Sovereign Holdings, Inc. Stock Incentive Plan Stock Settled SARs with Respect to Travelocity Equity
• Sovereign Holdings, Inc. Amended and Restated Stock Incentive Plan for Travelocity’s CEO StockSettled SARs with Respect to Travelocity Equity
• Sovereign Holdings, Inc. Restricted Stock Unit Grant Agreement
• Sovereign Holdings, Inc. 2012 Management Equity Incentive Plan
Under these plans, the Company has granted stock options, stock appreciation rights, restricted stock andrestricted stock units. Sabre Corporation was formerly Sovereign Holdings, Inc.
Our Plans
Sovereign Holdings, Inc. Management Equity Incentive Plan—Under the Sovereign Holdings, Inc.Management Equity Incentive Plan (“Sovereign MEIP”), adopted June 11, 2007, as amended in April 22, 2010,key employees and, in certain circumstances, the directors, service providers and consultants, of the Companyand its affiliates may be granted stock options. Under the Sovereign MEIP:
• the total number of shares of common stock of Sabre Corporation reserved and available for issuance islimited to an aggregate of 22,318,298;
• the exercise price must be at least equal to the fair market value of a share of common stock of SabreCorporation;
• time-based and performance-based stock options may be granted; time-based stock options generallyvest over five years (25% vests after the first anniversary of the grant date, and the remaining 75%vests ratably on a quarterly basis thereafter); performance-based options will vest upon a liquidityevent, as determined by the Board, subject to achievement of certain performance measures and eventsas defined in the Sovereign MEIP; and
• generally, a liquidity event is defined as the occurrence of (i) a transaction or series of transactions thatresults, directly or indirectly, in the sale, transfer or other disposition of (a) the shares of common stock
F-49
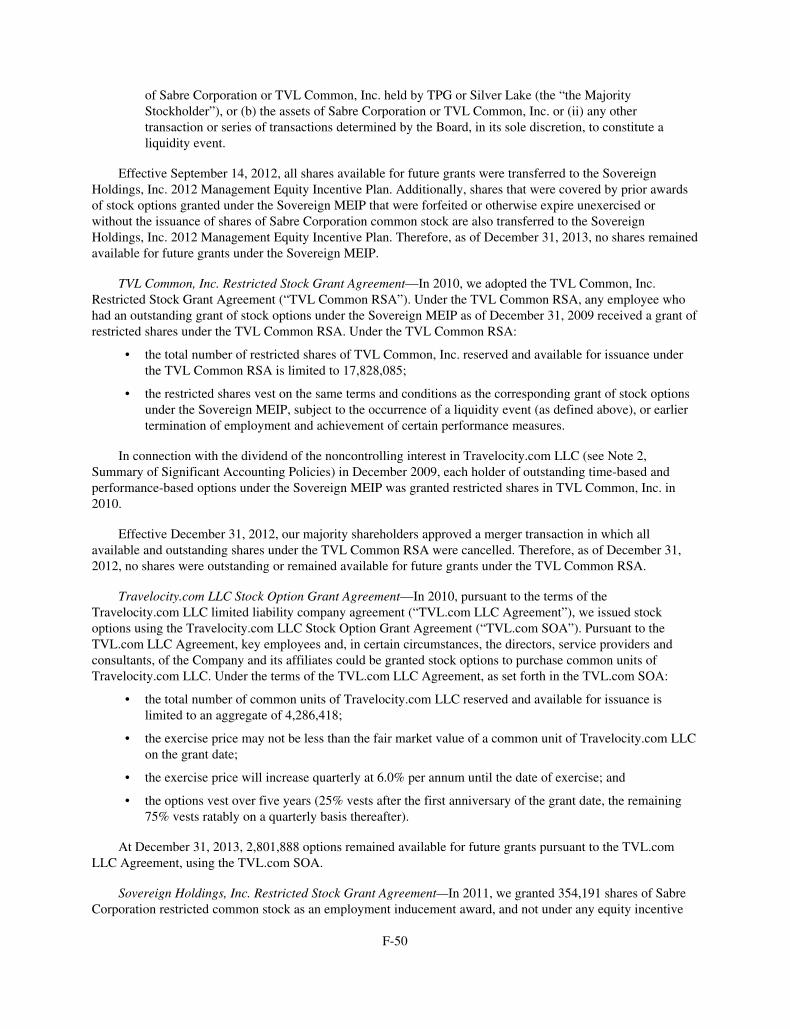
of Sabre Corporation or TVL Common, Inc. held by TPG or Silver Lake (the “the MajorityStockholder”), or (b) the assets of Sabre Corporation or TVL Common, Inc. or (ii) any othertransaction or series of transactions determined by the Board, in its sole discretion, to constitute aliquidity event.
Effective September 14, 2012, all shares available for future grants were transferred to the SovereignHoldings, Inc. 2012 Management Equity Incentive Plan. Additionally, shares that were covered by prior awardsof stock options granted under the Sovereign MEIP that were forfeited or otherwise expire unexercised orwithout the issuance of shares of Sabre Corporation common stock are also transferred to the SovereignHoldings, Inc. 2012 Management Equity Incentive Plan. Therefore, as of December 31, 2013, no shares remainedavailable for future grants under the Sovereign MEIP.
TVL Common, Inc. Restricted Stock Grant Agreement—In 2010, we adopted the TVL Common, Inc.Restricted Stock Grant Agreement (“TVL Common RSA”). Under the TVL Common RSA, any employee whohad an outstanding grant of stock options under the Sovereign MEIP as of December 31, 2009 received a grant ofrestricted shares under the TVL Common RSA. Under the TVL Common RSA:
• the total number of restricted shares of TVL Common, Inc. reserved and available for issuance underthe TVL Common RSA is limited to 17,828,085;
• the restricted shares vest on the same terms and conditions as the corresponding grant of stock optionsunder the Sovereign MEIP, subject to the occurrence of a liquidity event (as defined above), or earliertermination of employment and achievement of certain performance measures.
In connection with the dividend of the noncontrolling interest in Travelocity.com LLC (see Note 2,Summary of Significant Accounting Policies) in December 2009, each holder of outstanding time-based andperformance-based options under the Sovereign MEIP was granted restricted shares in TVL Common, Inc. in2010.
Effective December 31, 2012, our majority shareholders approved a merger transaction in which allavailable and outstanding shares under the TVL Common RSA were cancelled. Therefore, as of December 31,2012, no shares were outstanding or remained available for future grants under the TVL Common RSA.
Travelocity.com LLC Stock Option Grant Agreement—In 2010, pursuant to the terms of theTravelocity.com LLC limited liability company agreement (“TVL.com LLC Agreement”), we issued stockoptions using the Travelocity.com LLC Stock Option Grant Agreement (“TVL.com SOA”). Pursuant to theTVL.com LLC Agreement, key employees and, in certain circumstances, the directors, service providers andconsultants, of the Company and its affiliates could be granted stock options to purchase common units ofTravelocity.com LLC. Under the terms of the TVL.com LLC Agreement, as set forth in the TVL.com SOA:
• the total number of common units of Travelocity.com LLC reserved and available for issuance islimited to an aggregate of 4,286,418;
• the exercise price may not be less than the fair market value of a common unit of Travelocity.com LLCon the grant date;
• the exercise price will increase quarterly at 6.0% per annum until the date of exercise; and
• the options vest over five years (25% vests after the first anniversary of the grant date, the remaining75% vests ratably on a quarterly basis thereafter).
At December 31, 2013, 2,801,888 options remained available for future grants pursuant to the TVL.comLLC Agreement, using the TVL.com SOA.
Sovereign Holdings, Inc. Restricted Stock Grant Agreement—In 2011, we granted 354,191 shares of SabreCorporation restricted common stock as an employment inducement award, and not under any equity incentive
F-50

plan adopted by the Company. The shares of Sabre Corporation restricted common stock vest ratably over threeyears from the date of grant, one-third on each anniversary of the grant date.
Sovereign Holdings, Inc. Stock Incentive Plan for Travelocity’s CEO Stock Settled SARs With Respect toTravelocity Equity; and Sovereign Holdings, Inc. Stock Incentive Plan—Stock Settled SARs with Respect toTravelocity Equity—In 2011, we adopted the Sovereign Holdings, Inc. Stock Incentive Plan for Travelocity’sCEO Stock Settled SARs With Respect to Travelocity Equity (“Travelocity Equity 2011”) and in 2012, weadopted the Sovereign Holdings, Inc. Stock Incentive Plan—Stock-Settled SARs with Respect to TravelocityEquity (“Travelocity Equity 2012”). Under the Travelocity Equity 2011 plan, Travelocity’s CEO was grantedstock-settled SARs relating to Travelocity Holdings, Inc. (“THI”) common stock and Travelocity.com LLCcommon units. Under the Travelocity Equity 2012 plan, key employees and, in certain circumstances, directors,service providers and consultants, of the Company and its affiliates may be granted stock-settled SARs relatingto THI common stock and Travelocity.com LLC common units. Under the terms of these plans:
• SARs with respect to THI common stock and Travelocity.com LLC common units (collectively“Tandem SARs”) must be exercised in tandem in the same proportion of SARs granted, and may besettled, at our option, in shares of the underlying common stock and common units, interests in SabreCorporation or any successor to Sabre Corporation, THI or Travelocity.com LLC, or in cash.
• The SARs vest over four years (25% vests after the first anniversary of the grant date, the remaining75% vests on a quarterly basis thereafter).
• Generally, vested Tandem SARs are only exercisable in connection with a liquidity event and at anytime thereafter prior to their expiration.
• Generally, a liquidity event is defined as the occurrence of (i) a transaction or series of transactions thatresults, directly or indirectly, in the sale, transfer or other disposition of substantially all of theeconomic interest in Sabre Corporation or THI or any of its subsidiaries held by the MajorityStockholder, (ii) a change in control (as defined in the Travelocity Equity 2011 or Travelocity Equity2012 plan, respectively), (iii) any other transaction or series of transactions determined by the Board, inits sole discretion, to constitute a liquidity event or (iv) an initial public offering of equity interests inSabre Corporation or THI or any of its subsidiaries.
In 2012, the Travelocity Equity 2011 plan was amended and any outstanding Tandem SARs were cancelledand a new award of Tandem SARs was issued under the amended plan with an exercise price equal to the fairmarket value of THI common stock and THI common units on the date of grant. The terms of this amended planand the vesting schedule of the new award of Tandem SARs were consistent with the original plan and the initialgrant of Tandem SARs. The new award of Tandem SARs vests 25% after the first anniversary of the grant dateand the remainder vests quarterly thereafter. The grant of tandem SARs is accounted for as a modification andresulted in $1 million of additional expense for the year ended December 31, 2012.
The total number of SARs reserved and available for issuance under the Travelocity Equity 2012 plan islimited to an aggregate of 16,565,408 shares of THI common stock and 16,565,408 Travelocity.com LLCcommon units.
At December 31, 2013, a total of 7,505,466 shares of THI common stock and 7,505,466 Travelocity.comLLC common units remained available for future grants under both plans.
Sovereign Holdings, Inc. Restricted Stock Unit Grant Agreement—In 2012, we granted an award of time-based RSUs to the Chief Executive Officer of Travelocity that, due to the nature of these RSUs, are accounted foras liability awards and have an aggregate fixed value of $3 million using the Sovereign Holdings, Inc. RestrictedStock Unit Grant Agreement (the Sovereign RSU Agreement”) and not under any equity incentive plan adoptedby the Company. The Sovereign RSU Agreement vests as to certain fixed dollar amounts ratably each six monthsstarting on December 15, 2012 through June 15, 2015 and is settled in shares of Sabre Corporation commonstock or the prescribed cash amount. The number of shares of Sabre Corporation common stock to be delivered at
F-51
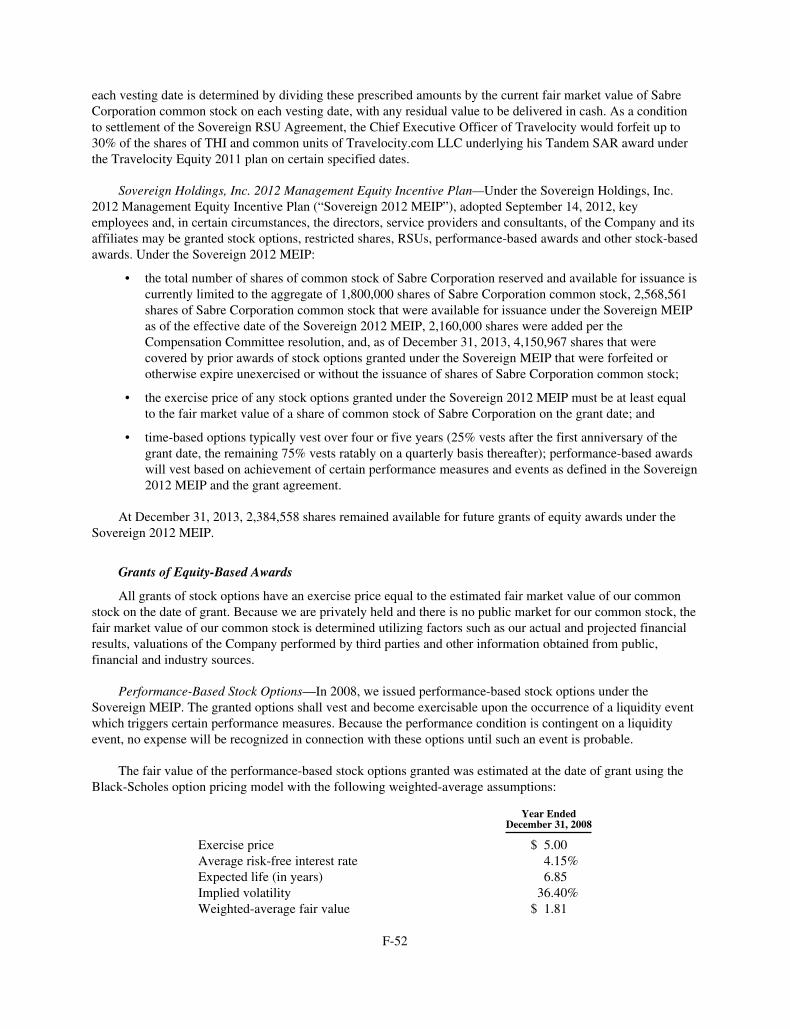
each vesting date is determined by dividing these prescribed amounts by the current fair market value of SabreCorporation common stock on each vesting date, with any residual value to be delivered in cash. As a conditionto settlement of the Sovereign RSU Agreement, the Chief Executive Officer of Travelocity would forfeit up to30% of the shares of THI and common units of Travelocity.com LLC underlying his Tandem SAR award underthe Travelocity Equity 2011 plan on certain specified dates.
Sovereign Holdings, Inc. 2012 Management Equity Incentive Plan—Under the Sovereign Holdings, Inc.2012 Management Equity Incentive Plan (“Sovereign 2012 MEIP”), adopted September 14, 2012, keyemployees and, in certain circumstances, the directors, service providers and consultants, of the Company and itsaffiliates may be granted stock options, restricted shares, RSUs, performance-based awards and other stock-basedawards. Under the Sovereign 2012 MEIP:
• the total number of shares of common stock of Sabre Corporation reserved and available for issuance iscurrently limited to the aggregate of 1,800,000 shares of Sabre Corporation common stock, 2,568,561shares of Sabre Corporation common stock that were available for issuance under the Sovereign MEIPas of the effective date of the Sovereign 2012 MEIP, 2,160,000 shares were added per theCompensation Committee resolution, and, as of December 31, 2013, 4,150,967 shares that werecovered by prior awards of stock options granted under the Sovereign MEIP that were forfeited orotherwise expire unexercised or without the issuance of shares of Sabre Corporation common stock;
• the exercise price of any stock options granted under the Sovereign 2012 MEIP must be at least equalto the fair market value of a share of common stock of Sabre Corporation on the grant date; and
• time-based options typically vest over four or five years (25% vests after the first anniversary of thegrant date, the remaining 75% vests ratably on a quarterly basis thereafter); performance-based awardswill vest based on achievement of certain performance measures and events as defined in the Sovereign2012 MEIP and the grant agreement.
At December 31, 2013, 2,384,558 shares remained available for future grants of equity awards under theSovereign 2012 MEIP.
Grants of Equity-Based Awards
All grants of stock options have an exercise price equal to the estimated fair market value of our commonstock on the date of grant. Because we are privately held and there is no public market for our common stock, thefair market value of our common stock is determined utilizing factors such as our actual and projected financialresults, valuations of the Company performed by third parties and other information obtained from public,financial and industry sources.
Performance-Based Stock Options—In 2008, we issued performance-based stock options under theSovereign MEIP. The granted options shall vest and become exercisable upon the occurrence of a liquidity eventwhich triggers certain performance measures. Because the performance condition is contingent on a liquidityevent, no expense will be recognized in connection with these options until such an event is probable.
The fair value of the performance-based stock options granted was estimated at the date of grant using theBlack-Scholes option pricing model with the following weighted-average assumptions:
Year EndedDecember 31, 2008
Exercise price $ 5.00Average risk-free interest rate 4.15%Expected life (in years) 6.85Implied volatility 36.40%Weighted-average fair value $ 1.81
F-52
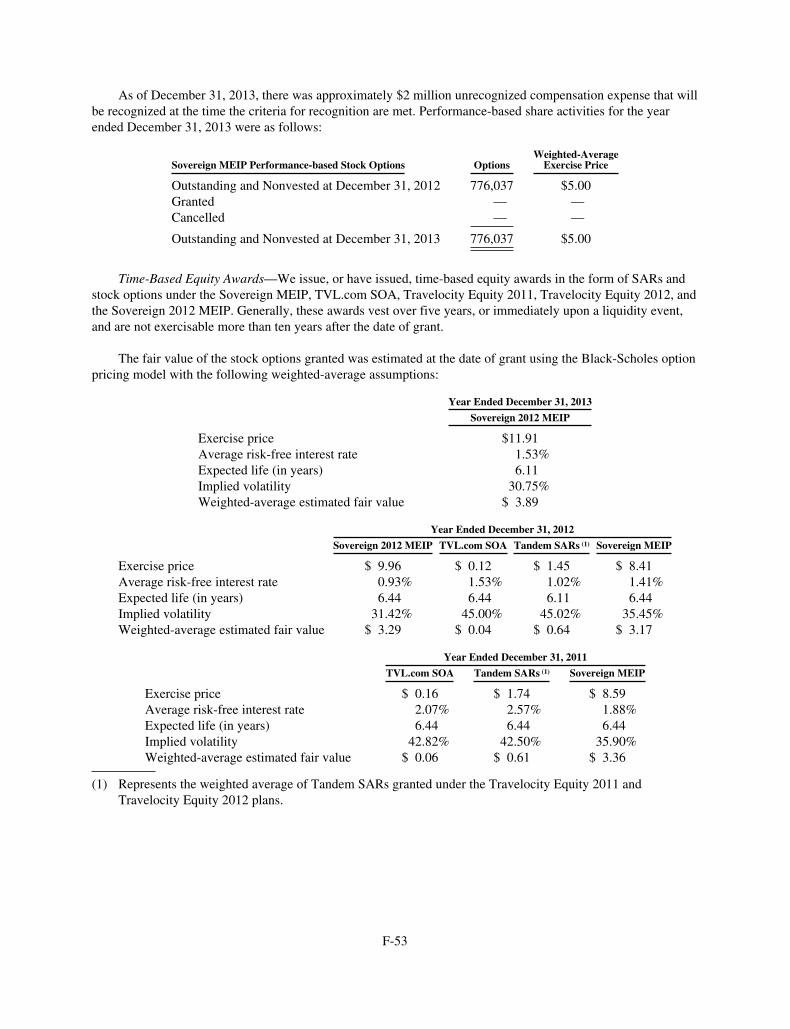
As of December 31, 2013, there was approximately $2 million unrecognized compensation expense that willbe recognized at the time the criteria for recognition are met. Performance-based share activities for the yearended December 31, 2013 were as follows:
Sovereign MEIP Performance-based Stock Options OptionsWeighted-Average
Exercise Price
Outstanding and Nonvested at December 31, 2012 776,037 $5.00Granted — —Cancelled — —
Outstanding and Nonvested at December 31, 2013 776,037 $5.00
Time-Based Equity Awards—We issue, or have issued, time-based equity awards in the form of SARs andstock options under the Sovereign MEIP, TVL.com SOA, Travelocity Equity 2011, Travelocity Equity 2012, andthe Sovereign 2012 MEIP. Generally, these awards vest over five years, or immediately upon a liquidity event,and are not exercisable more than ten years after the date of grant.
The fair value of the stock options granted was estimated at the date of grant using the Black-Scholes optionpricing model with the following weighted-average assumptions:
Year Ended December 31, 2013
Sovereign 2012 MEIP
Exercise price $11.91Average risk-free interest rate 1.53%Expected life (in years) 6.11Implied volatility 30.75%Weighted-average estimated fair value $ 3.89
Year Ended December 31, 2012
Sovereign 2012 MEIP TVL.com SOA Tandem SARs (1) Sovereign MEIP
Exercise price $ 9.96 $ 0.12 $ 1.45 $ 8.41Average risk-free interest rate 0.93% 1.53% 1.02% 1.41%Expected life (in years) 6.44 6.44 6.11 6.44Implied volatility 31.42% 45.00% 45.02% 35.45%Weighted-average estimated fair value $ 3.29 $ 0.04 $ 0.64 $ 3.17
Year Ended December 31, 2011
TVL.com SOA Tandem SARs (1) Sovereign MEIP
Exercise price $ 0.16 $ 1.74 $ 8.59Average risk-free interest rate 2.07% 2.57% 1.88%Expected life (in years) 6.44 6.44 6.44Implied volatility 42.82% 42.50% 35.90%Weighted-average estimated fair value $ 0.06 $ 0.61 $ 3.36
(1) Represents the weighted average of Tandem SARs granted under the Travelocity Equity 2011 andTravelocity Equity 2012 plans.
F-53
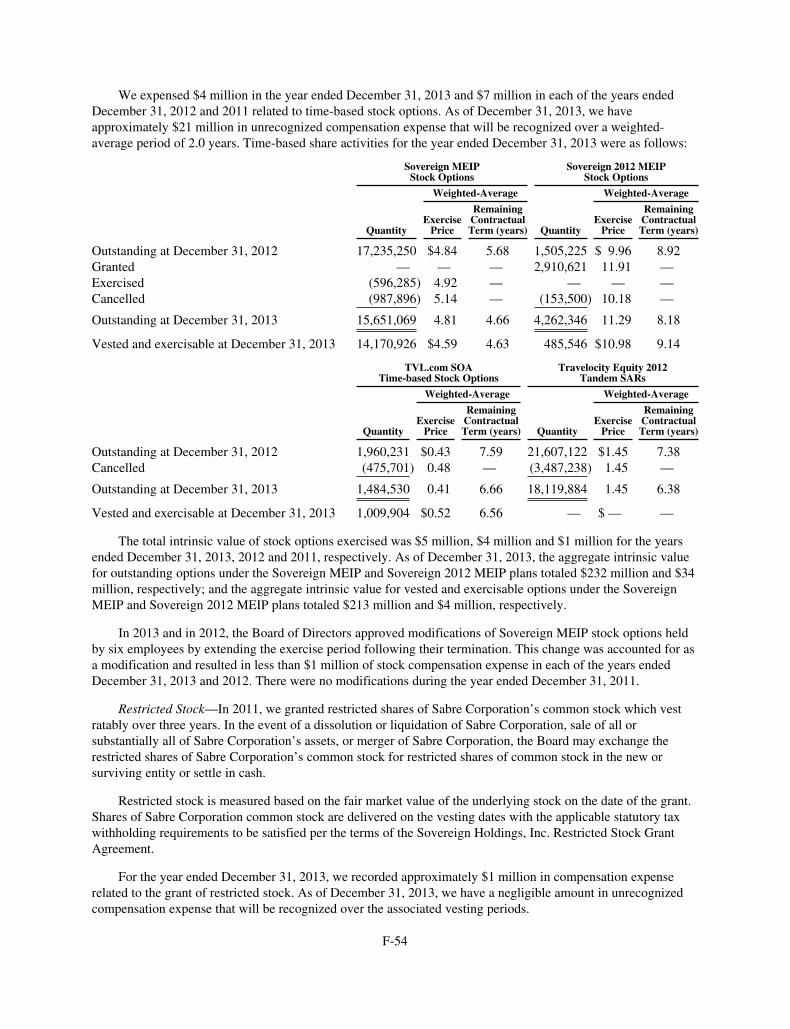
We expensed $4 million in the year ended December 31, 2013 and $7 million in each of the years endedDecember 31, 2012 and 2011 related to time-based stock options. As of December 31, 2013, we haveapproximately $21 million in unrecognized compensation expense that will be recognized over a weighted-average period of 2.0 years. Time-based share activities for the year ended December 31, 2013 were as follows:
Sovereign MEIPStock Options
Sovereign 2012 MEIPStock Options
Weighted-Average Weighted-Average
QuantityExercise
Price
RemainingContractualTerm (years) Quantity
ExercisePrice
RemainingContractualTerm (years)
Outstanding at December 31, 2012 17,235,250 $4.84 5.68 1,505,225 $ 9.96 8.92Granted — — — 2,910,621 11.91 —Exercised (596,285) 4.92 — — — —Cancelled (987,896) 5.14 — (153,500) 10.18 —
Outstanding at December 31, 2013 15,651,069 4.81 4.66 4,262,346 11.29 8.18
Vested and exercisable at December 31, 2013 14,170,926 $4.59 4.63 485,546 $10.98 9.14
TVL.com SOATime-based Stock Options
Travelocity Equity 2012Tandem SARs
Weighted-Average Weighted-Average
QuantityExercise
Price
RemainingContractualTerm (years) Quantity
ExercisePrice
RemainingContractualTerm (years)
Outstanding at December 31, 2012 1,960,231 $0.43 7.59 21,607,122 $1.45 7.38Cancelled (475,701) 0.48 — (3,487,238) 1.45 —
Outstanding at December 31, 2013 1,484,530 0.41 6.66 18,119,884 1.45 6.38
Vested and exercisable at December 31, 2013 1,009,904 $0.52 6.56 — $ — —
The total intrinsic value of stock options exercised was $5 million, $4 million and $1 million for the yearsended December 31, 2013, 2012 and 2011, respectively. As of December 31, 2013, the aggregate intrinsic valuefor outstanding options under the Sovereign MEIP and Sovereign 2012 MEIP plans totaled $232 million and $34million, respectively; and the aggregate intrinsic value for vested and exercisable options under the SovereignMEIP and Sovereign 2012 MEIP plans totaled $213 million and $4 million, respectively.
In 2013 and in 2012, the Board of Directors approved modifications of Sovereign MEIP stock options heldby six employees by extending the exercise period following their termination. This change was accounted for asa modification and resulted in less than $1 million of stock compensation expense in each of the years endedDecember 31, 2013 and 2012. There were no modifications during the year ended December 31, 2011.
Restricted Stock—In 2011, we granted restricted shares of Sabre Corporation’s common stock which vestratably over three years. In the event of a dissolution or liquidation of Sabre Corporation, sale of all orsubstantially all of Sabre Corporation’s assets, or merger of Sabre Corporation, the Board may exchange therestricted shares of Sabre Corporation’s common stock for restricted shares of common stock in the new orsurviving entity or settle in cash.
Restricted stock is measured based on the fair market value of the underlying stock on the date of the grant.Shares of Sabre Corporation common stock are delivered on the vesting dates with the applicable statutory taxwithholding requirements to be satisfied per the terms of the Sovereign Holdings, Inc. Restricted Stock GrantAgreement.
For the year ended December 31, 2013, we recorded approximately $1 million in compensation expenserelated to the grant of restricted stock. As of December 31, 2013, we have a negligible amount in unrecognizedcompensation expense that will be recognized over the associated vesting periods.
F-54
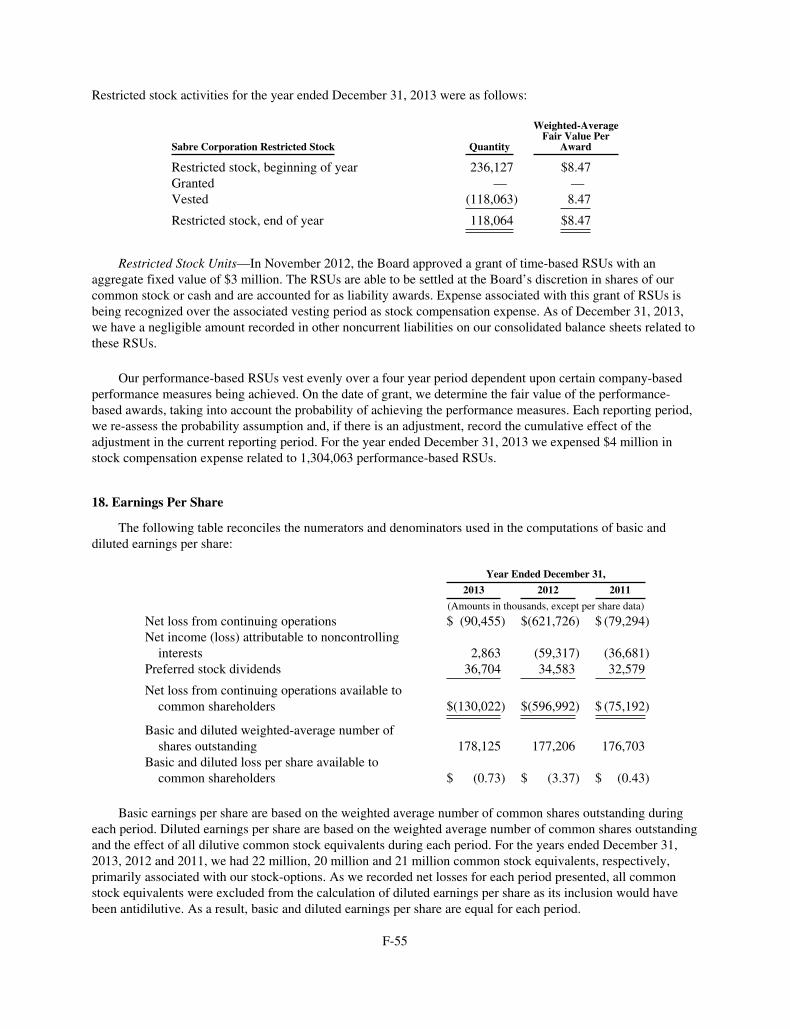
Restricted stock activities for the year ended December 31, 2013 were as follows:
Sabre Corporation Restricted Stock Quantity
Weighted-AverageFair Value Per
Award
Restricted stock, beginning of year 236,127 $8.47Granted — —Vested (118,063) 8.47
Restricted stock, end of year 118,064 $8.47
Restricted Stock Units—In November 2012, the Board approved a grant of time-based RSUs with anaggregate fixed value of $3 million. The RSUs are able to be settled at the Board’s discretion in shares of ourcommon stock or cash and are accounted for as liability awards. Expense associated with this grant of RSUs isbeing recognized over the associated vesting period as stock compensation expense. As of December 31, 2013,we have a negligible amount recorded in other noncurrent liabilities on our consolidated balance sheets related tothese RSUs.
Our performance-based RSUs vest evenly over a four year period dependent upon certain company-basedperformance measures being achieved. On the date of grant, we determine the fair value of the performance-based awards, taking into account the probability of achieving the performance measures. Each reporting period,we re-assess the probability assumption and, if there is an adjustment, record the cumulative effect of theadjustment in the current reporting period. For the year ended December 31, 2013 we expensed $4 million instock compensation expense related to 1,304,063 performance-based RSUs.
18. Earnings Per Share
The following table reconciles the numerators and denominators used in the computations of basic anddiluted earnings per share:
Year Ended December 31,
2013 2012 2011
(Amounts in thousands, except per share data)
Net loss from continuing operations $ (90,455) $(621,726) $ (79,294)Net income (loss) attributable to noncontrolling
interests 2,863 (59,317) (36,681)Preferred stock dividends 36,704 34,583 32,579
Net loss from continuing operations available tocommon shareholders $(130,022) $(596,992) $ (75,192)
Basic and diluted weighted-average number ofshares outstanding 178,125 177,206 176,703
Basic and diluted loss per share available tocommon shareholders $ (0.73) $ (3.37) $ (0.43)
Basic earnings per share are based on the weighted average number of common shares outstanding duringeach period. Diluted earnings per share are based on the weighted average number of common shares outstandingand the effect of all dilutive common stock equivalents during each period. For the years ended December 31,2013, 2012 and 2011, we had 22 million, 20 million and 21 million common stock equivalents, respectively,primarily associated with our stock-options. As we recorded net losses for each period presented, all commonstock equivalents were excluded from the calculation of diluted earnings per share as its inclusion would havebeen antidilutive. As a result, basic and diluted earnings per share are equal for each period.
F-55

Tandem SARs issued with respect to the Travelocity Equity 2012 plan may be settled in shares of theunderlying stock and units, interests in Sabre Corporation or any successor to Sabre Corporation, THI orTravelocity.com LLC, or in cash. If we elect to settle in shares of Sabre Corporation, the quantity issued is basedon the intrinsic value of the Tandem SARs at the time of settlement and the fair value of Sabre Corporationshares at the time of settlement. For the years ended December 31, 2013, 2012 and 2011, no shares were issuableunder this calculation and therefore there were no common stock equivalents associated with the Tandem SARs.
19. Related Party Transactions
On March 30, 2007, we entered into a Management Services Agreement (the “MSA”) with affiliates of TPGand Silver Lake to provide us with management services. Pursuant to the agreement, we are required to paymonitoring fees of $5 million to $7 million each year which are dependent on consolidated earnings beforeinterest, taxes, depreciation and amortization for these services. We recognized $7 million in expense related tothe annual monitoring fee for each of the years ended December 31, 2013, 2012 and 2011, respectively, in ourconsolidated statements of income. Additionally, we reimburse affiliates of TPG and Silver Lake for out-of-pocket expenses incurred by them or their affiliates in connection with services provided pursuant to the MSA.For the year ended December 31, 2013, these expenses were $1 million. For the years ended December 31, 2012and 2011, these expenses were not material. In connection with the completion of an offering or sale of thecompany, we will be required to pay to TPG and Silver Lake, in the aggregate, a $21 million fee pursuant to theMSA and the MSA will be terminated.
For related party transactions with Abacus, an equity method investment, refer to Note 6, Equity MethodInvestments.
20. Commitments and Contingencies
Future Minimum Payments under Contractual Obligations
At December 31, 2013, future minimum payments required under the Amended and Restated CreditAgreement, 2016 Notes and 2019 Notes, the mortgage facility, operating lease agreements with terms in excessof one year for facilities, equipment and software licenses and other significant contractual cash obligations wereas follows:
Payments Due by Period
Contractual Obligations 2014 2015 2016 2017 2018 Thereafter Total
(Amounts in thousands)
Total debt (1) $320,662 $315,929 $726,845 $360,459 $244,391 $2,855,934 $4,824,220Headquarters mortgage (2) 5,984 5,984 5,984 80,895 — — 98,847Operating lease obligations (3) 31,450 27,217 23,363 15,435 9,668 25,789 132,922IT outsourcing agreement (4) 165,983 156,492 135,307 99,305 — — 557,087Purchase orders (5) 137,456 2,146 1,565 — — — 141,167Letters of credit (6) 65,238 128 1,621 — — 151 67,138WNS agreement (7) 23,777 24,910 — — — — 48,687Other purchase obligations (8) 39,175 — — — — — 39,175Unrecognized tax benefits (9) — — — — — — 66,620
Total contractual cashobligations (10) $789,725 $532,806 $894,685 $556,094 $254,059 $2,881,874 $5,975,863
(1) Includes all interest and principal related to the 2016 Notes and 2019 Notes. Also includes all interest andprincipal related to borrowings under the Amended and Restated Credit Agreement, which will mature in2017 and 2019 and the Incremental Term Facility, which will mature in 2017. We are required to pay apercentage of the excess cash flow generated each year to our lenders which is not reflected in the tableabove. Interest on the term loan is based on the LIBOR rate plus a base margin and includes the effect of
F-56
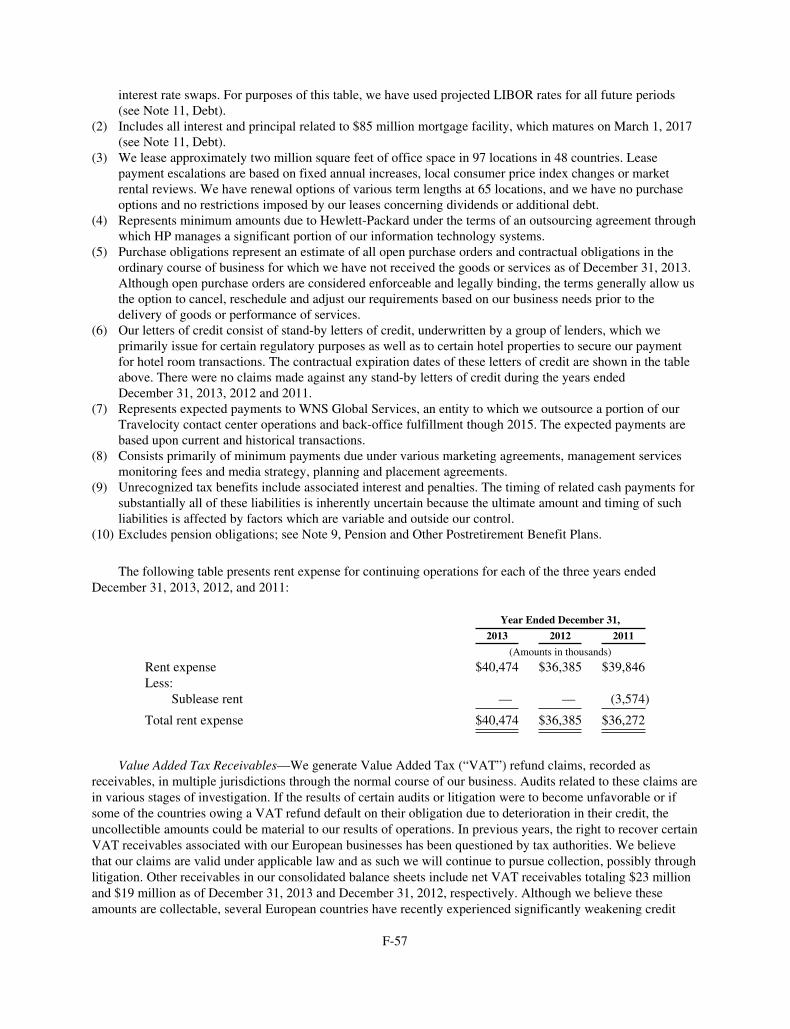
interest rate swaps. For purposes of this table, we have used projected LIBOR rates for all future periods(see Note 11, Debt).
(2) Includes all interest and principal related to $85 million mortgage facility, which matures on March 1, 2017(see Note 11, Debt).
(3) We lease approximately two million square feet of office space in 97 locations in 48 countries. Leasepayment escalations are based on fixed annual increases, local consumer price index changes or marketrental reviews. We have renewal options of various term lengths at 65 locations, and we have no purchaseoptions and no restrictions imposed by our leases concerning dividends or additional debt.
(4) Represents minimum amounts due to Hewlett-Packard under the terms of an outsourcing agreement throughwhich HP manages a significant portion of our information technology systems.
(5) Purchase obligations represent an estimate of all open purchase orders and contractual obligations in theordinary course of business for which we have not received the goods or services as of December 31, 2013.Although open purchase orders are considered enforceable and legally binding, the terms generally allow usthe option to cancel, reschedule and adjust our requirements based on our business needs prior to thedelivery of goods or performance of services.
(6) Our letters of credit consist of stand-by letters of credit, underwritten by a group of lenders, which weprimarily issue for certain regulatory purposes as well as to certain hotel properties to secure our paymentfor hotel room transactions. The contractual expiration dates of these letters of credit are shown in the tableabove. There were no claims made against any stand-by letters of credit during the years endedDecember 31, 2013, 2012 and 2011.
(7) Represents expected payments to WNS Global Services, an entity to which we outsource a portion of ourTravelocity contact center operations and back-office fulfillment though 2015. The expected payments arebased upon current and historical transactions.
(8) Consists primarily of minimum payments due under various marketing agreements, management servicesmonitoring fees and media strategy, planning and placement agreements.
(9) Unrecognized tax benefits include associated interest and penalties. The timing of related cash payments forsubstantially all of these liabilities is inherently uncertain because the ultimate amount and timing of suchliabilities is affected by factors which are variable and outside our control.
(10) Excludes pension obligations; see Note 9, Pension and Other Postretirement Benefit Plans.
The following table presents rent expense for continuing operations for each of the three years endedDecember 31, 2013, 2012, and 2011:
Year Ended December 31,
2013 2012 2011
(Amounts in thousands)
Rent expense $40,474 $36,385 $39,846Less:
Sublease rent — — (3,574)
Total rent expense $40,474 $36,385 $36,272
Value Added Tax Receivables—We generate Value Added Tax (“VAT”) refund claims, recorded asreceivables, in multiple jurisdictions through the normal course of our business. Audits related to these claims arein various stages of investigation. If the results of certain audits or litigation were to become unfavorable or ifsome of the countries owing a VAT refund default on their obligation due to deterioration in their credit, theuncollectible amounts could be material to our results of operations. In previous years, the right to recover certainVAT receivables associated with our European businesses has been questioned by tax authorities. We believethat our claims are valid under applicable law and as such we will continue to pursue collection, possibly throughlitigation. Other receivables in our consolidated balance sheets include net VAT receivables totaling $23 millionand $19 million as of December 31, 2013 and December 31, 2012, respectively. Although we believe theseamounts are collectable, several European countries have recently experienced significantly weakening credit
F-57
which could impact our future collections from these countries. We continue to assess VAT receivables forcollectability and may be required to record reserves in the future.
In addition to the normal course of business receivables, substantial sums of VAT are due in respect of crossborder supplies of rental cars by Holiday Autos, a discontinued operation (see Note 4, Discontinued Operationsand Dispositions), from the period 2004 to 2009. A number of European Community countries challenged theseclaims and litigation has been ongoing for several years. Due to significant delays and other factors impactingour settlement of these claims, we have recorded an allowance for losses relating to such events in assets ofdiscontinued operations in the consolidated balance sheets. The allowances recorded as of December 31, 2013and December 31, 2012 were $4 million and $37 million, respectively. In December 2013, we received paymentof approximately $12 million in respect to claims from Italy related to Holiday Autos VAT, enabling anequivalent amount of the allowance to be reversed at that time. The Central Economic Administrative Tribunal inSpain ruled in our favor in January 2013 on claims for 2008 and 2009 of $6 million and in September 2013 onclaims for 2004 through 2007 of $15 million. The funds were received and an equivalent amount of allowancewas reversed to net loss from discontinued operations in our consolidated results of operations for the year endedDecember 31, 2013. Separately, on June 18, 2013, the Court of Appeal in France ruled against us in respect ofoutstanding VAT refund claims of $4 million made for the periods 2007 through 2009. We believe the merits ofour VAT claims are valid and have appealed the decision to the Supreme Court. These amounts are included inthe allowance for VAT receivables above.
Legal Proceedings—
While certain legal proceedings and related indemnification obligations to which we are a party specify theamounts claimed, such claims may not represent reasonably possible losses. Given the inherent uncertainties oflitigation, the ultimate outcome of these matters cannot be predicted at this time, nor can the amount of possibleloss or range of loss, if any, be reasonably estimated, except in circumstances where an aggregate litigationaccrual has been recorded for probable and reasonably estimable loss contingencies. A determination of theamount of accrual required, if any, for these contingencies is made after careful analysis of each matter. Therequired accrual may change in the future due to new information or developments in each matter or changes inapproach such as a change in settlement strategy in dealing with these matters.
Litigation and Administrative Audit Proceedings Relating to Hotel Occupancy Taxes
Over the past nine years, various state and local governments in the United States have filed approximately70 lawsuits against us and other OTAs pertaining primarily to whether Travelocity and other OTAs owe sales oroccupancy taxes on some or all of the revenues they earn from facilitating hotel reservations using the merchantrevenue model. In the merchant revenue model, the customer pays us an amount at the time of booking thatincludes (i) service fees, which we collect, and (ii) the price of the hotel room and amounts for occupancy orother local taxes, which we pass along to the hotel supplier. The complaints generally allege, among other things,that the defendants failed to pay to the relevant taxing authority hotel accommodations taxes on the service fees.Courts have dismissed approximately 30 of these lawsuits, some for failure to exhaust administrative remediesand some on the basis that we are not subject to the sales or occupancy tax at issue based on the construction ofthe language in the ordinance. The Fourth, Sixth and Eleventh Circuits of the United States Courts of Appealseach have ruled in our favor on the merits, as have state appellate courts in Missouri, Alabama, Texas, California,Kentucky, Florida and Pennsylvania, and a number of state and federal trial courts. The remaining lawsuits are invarious stages of litigation. We have also settled some cases individually for nuisance value and, with respect tosuch settlements, have reserved our rights to challenge any effort by the applicable tax authority to imposeoccupancy taxes in the future.
Among the recent favorable decisions, on January 23, 2013, the California Supreme Court declined to hearthe appeals of the City of Anaheim and the City of Santa Monica from lower court decisions in favor ofTravelocity and other OTAs on the issue of whether local occupancy taxes apply to the merchant revenue model.
F-58

We and other OTAs have also prevailed on summary judgment motions in San Francisco and Los Angeles. Webelieve these decisions should be helpful in resolving any other California cases, which are either currentlypending or subsequently brought, in our favor.
Similarly, on January 23, 2013, the Missouri Court of Appeals upheld a lower court decision in favor ofTravelocity and other OTAs on the issue of whether local occupancy taxes in the City of Branson apply to themerchant revenue model. On February 28, 2013, the First District Court of Appeals in Florida affirmed asummary judgment ruling in favor of Travelocity and other OTAs on the issue of whether local accommodationtaxes levied by Leon County and 18 other counties in Florida apply to the merchant revenue model. The FloridaSupreme Court is currently reviewing this decision. Likewise, on March 29, 2013, a federal district court in NewMexico granted summary judgment, ruling that OTAs are not vendors subject to hotel occupancy tax in NewMexico. On December 13, 2013, the Eleventh Circuit Court of Appeals affirmed summary judgment in our favorin a case that had been pending in Rome, Georgia, finding there was no evidence that we collected but failed toremit tax that the counties could not recover on their common law claims, and that there is no basis in Georgialaw (statutory or otherwise) for an award of back taxes. On March 5, 2014, the California Court of Appealsaffirmed the trial court’s grant of summary judgment in our favor in the hotel occupancy tax litigation broughtagainst us by the City of San Diego. On March 7, 2014, the trial court in our lawsuit with the MontanaDepartment of Revenue granted our (and the other OTA defendants’) motion for summary judgment.
Although we have prevailed in the majority of these lawsuits and proceedings, there have been severaladverse judgments or decisions on the merits some of which are subject to appeal.
Among the recent adverse decisions, on June 21, 2013, a state trial court in Cook County, Illinois grantedsummary judgment in favor of the City of Chicago and against Travelocity and other OTAs, ruling that the City’shotel tax applies to the fees retained by the OTAs because, according to the trial court, OTAs act as hotel“managers” when facilitating hotel reservations. The court did not address damages. After final judgment isentered, Travelocity intends to appeal the court’s decision on the basis that we do not believe that we managehotels.
On November 21, 2013, the New York State Court of Appeals ruled against Travelocity and other OTAs,holding that New York City’s hotel occupancy tax, which was amended in 2009 to capture revenue from feescharged to customers by third-party travel companies, is constitutional because such fees constitute rent as theyare a condition of occupancy. We have been collecting and remitting taxes under the statute, so the ruling doesnot have any impact on our financial results in that regard.
On April 4, 2013, the United States District Court for the Western District of Texas (“W.D.T.”) entered afinal judgment against Travelocity and other OTAs in a class action lawsuit filed by the City of San Antonio. Thefinal judgment was based on a jury verdict from October 30, 2009 that the OTAs “control” hotels for purposes ofcity hotel occupancy taxes. Following that jury verdict, on July 1, 2011, the W.D.T. concluded that fees chargedby the OTAs are subject to city hotel occupancy taxes and that the OTAs have a duty to assess, collect and remitthese taxes. We disagree with the jury’s finding that we “control” hotels, and with the W.D.T.’s conclusionsbased on the jury finding, and intend to appeal the final judgment to the United States Court of Appeals for theFifth Circuit.
We believe the Fifth Circuit’s resolution of the San Antonio appeal may be affected by a separate Texasstate appellate court decision in our favor. On October 26, 2011, the Fourteenth Court of Appeals of Texasaffirmed a trial court’s summary judgment ruling in favor of the OTAs in a case brought by the City of Houstonand the Harris County-Houston Sports Authority on a similarly worded tax ordinance as the one at issue in theSan Antonio case. The Texas Supreme Court denied the City of Houston’s petition to review the case. Webelieve this decision should provide persuasive authority to the Fifth Circuit in its review of the San Antoniocase.
F-59
On September 24, 2012, a trial court in Washington D.C. granted summary judgment in favor of the Districtof Columbia on its claim that the OTAs are subject to hotel occupancy tax. The court has not yet addressed anyquestions related to damages, but is expected to do so during the first quarter of 2014. After final judgment isentered, Travelocity intends to appeal the court’s decision.
In late 2012, the Tax Appeal Court of the State of Hawaii granted summary judgment in favor ofTravelocity and other OTAs on the issue of whether Hawaii’s hotel occupancy tax applies to the merchantrevenue model. However, in January 2013, the same court granted summary judgment in favor of the State ofHawaii and against Travelocity and other OTAs on the issue of whether the state’s general excise tax, which isassessed on all business activity in the state, applies to the merchant revenue model for the period from 2002 to2011.
We expensed $19 million and $25 million in cost of revenue for the years ended December 31, 2013 and2012, respectively, which represents the amount we would owe to the State of Hawaii, prior to appealing the TaxAppeal Court’s ruling, in back excise taxes, penalties and interest based on the court’s interpretation of thestatute. In 2013, we made payments totaling $35 million and maintained an accrued liability of $9 million as ofDecember 31, 2013. Payment of such amount is not an admission that we believe we are subject to the taxes inquestion.
Travelocity has appealed the Tax Appeal Court’s determination that we are subject to general excise tax, aswe believe the decision is incorrect and inconsistent with the same court’s prior rulings. If any such taxes are infact owed (which we dispute), we believe the correct amount would be under $10 million. The ultimateresolution of these contingencies may differ from the liabilities recorded. To the extent our appeal is successful inreducing or eliminating the assessed amounts, the State of Hawaii would be required to refund such amounts,plus interest. On May 20, 2013, the State of Hawaii issued an additional general excise tax assessment for thecalendar year 2012. Travelocity has appealed this recent assessment to the Tax Appeal Court, and this assessmenthas been stayed pending a final appellate decision on the original assessment.
On December 9, 2013, the State of Hawaii also issued assessments of general excise tax for merchant rentalcar bookings facilitated by Travelocity and other OTAs for the period 2001 to 2012 for which we recorded a$2 million reserve in the fourth quarter of 2013. Travelocity intends to appeal the assessment to the Tax AppealCourt and does not believe the excise tax is applicable.
The aggregate impact to our results of operations for all litigation and administrative proceedings relating tohotel sales, occupancy or excise taxes for the years ended December 31, 2013, 2012 and 2011 was $27 million,$25 million, and $2 million, respectively, which include all amounts expensed related to the State of Hawaiiduring those periods. As of December 31, 2013, we have a remaining reserve of $18 million, included in otheraccrued liabilities in the consolidated balance sheet, for the potential resolution of issues identified related tolitigation involving hotel sales, occupancy or excise taxes, which includes the $9 million liability for theremaining payments to the State of Hawaii. As of December 31, 2012, the reserve for litigation involving hotelsales, occupancy or excise taxes was $28 million. Our estimated liability is based on our current best estimate butthe ultimate resolution of these issues may be greater or less than the amount recorded and, if greater, couldadversely affect our results of operations.
In addition to the actions by the tax authorities, four consumer class action lawsuits have been filed againstus and other OTAs in which the plaintiffs allege that we made misrepresentations concerning the description ofthe fees received in relation to facilitating hotel reservations. Generally, the consumer claims relate to whetherTravelocity and the other OTAs provided adequate notice to consumers regarding the nature of our fees and theamount of taxes charged or collected. One of these lawsuits was dismissed by the Texas Supreme Court and suchdismissal was subsequently affirmed; one was voluntarily dismissed by the plaintiffs; one is pending in Texasstate court, where the court is currently considering the plaintiffs’ motion to certify a class action; and the last ispending in federal court, but has been stayed pending the outcome of the Texas state court action. We believe thenotice we provided was appropriate.
F-60
In addition to the lawsuits, a number of state and local governments have initiated inquiries, audits and otheradministrative proceedings that could result in an assessment of sales or occupancy taxes on fees. If we do not toprevail at the administrative level, those cases could lead to formal litigation proceedings.
Pursuant to our Expedia SMA, we will continue to be liable for fees, charges, costs and settlements relatingto litigation arising from hotels booked on the Travelocity platform prior to the Expedia SMA. However, fees,charges, costs and settlements relating to litigation from hotels booked subsequent to the Expedia SMA will beshared with Expedia according to the terms of the Expedia SMA. Under the Expedia SMA, we are also requiredto guarantee Travelocity’s indemnification obligations to Expedia for any liabilities arising out of historicalclaims with respect to this type of litigation.
Airline Antitrust Litigation, US Airways Antitrust Litigation, and DoJ Investigation
American Airlines Litigation (state and federal court claims)—In October 2012 we settled two outstandingstate and federal lawsuits with American Airlines (“American”) relating to American’s participation in the SabreGDS. The litigation, primarily involving breach of contract and antitrust claims, arose in January 2011 afterAmerican undertook certain marketing activities relating to its “Direct Connect” program (a method of providingits information and booking services directly to travel agents without using a GDS), and we de-preferencedAmerican’s flight information on the GDS and modified certain fees for booking American flights in a mannerwe believe was permitted under the terms of our distribution and services agreement with American.
American alleged that we had taken anticompetitive actions and claimed over $1 billion in actual damagesand injunctive relief against us. We denied American’s allegations and aggressively defended against theseclaims and pursued our own legal rights as warranted.
On October 30, 2012, we agreed to settlement terms in the state and federal lawsuits with American and, asa result of the terms of the settlement, renewed our distribution agreement with American for several years. Wealso entered into renewal agreements with American for Travelocity. Terms of the settlement and distributionagreements were approved by the court presiding over the restructuring procedures for AMR, American’s parentcompany, pursuant to an order made final on December 20, 2012. The settlement agreement contains mutualreleases of all claims by each party and neither party admits any wrong doing on their part. In January 2014, wereached a long-term agreement with American to be the provider of the reservation system for the post-mergedAmerican and US Airways.
We determined that the settlement agreement constitutes a multiple-element arrangement and recognized asettlement charge of $222 million, net of tax, into our results of operations, representing the estimate of the fairvalue of the settlement components. This included $64 million on an after tax basis for a $100 million paymentmade to AMR on December 21, 2012, and a $60 million on an after tax basis that represented the fair value of asecond $100 million payment made to AMR in December 2013. The current portion of the settlement liability isreflected in litigation settlement payable and the non-current portion is included in other noncurrent liabilities inthe consolidated balance sheets. Fair value of these fixed payment settlement components were estimated usingour best estimates of the timing with the resulting values discounted using a discount rate ranging from 6% to11.5%, depending on the timing of the payment and considering an adjustment for nonperformance risk thatrepresents our own credit risk. The fair value of the settlement amounts associated with the new commercialagreements entered into with American was estimated using the differential cash flow method, by comparing thepricing under the new contracts with American to similar contracts with other customers to determine adifferential. This pricing differential was applied to future estimated volumes and discounted using a discountrate of 11.5%. We believe that the timing, discount rates and probabilities used in these estimates reflectappropriate market participant assumptions.
Because the settlement liability is considered a multiple-element arrangement and recorded at fair value, thenet charge recorded in 2012 consisted of several elements, including cash and future cash to be paid directly to
F-61

American, payment credits to pay for future technology services that we provided as defined in the agreementsand an estimate of the fair value of other agreements entered into concurrently with the settlement agreement.
Amounts shown are net of tax utilizing our combined federal and state marginal tax rate of approximately36%. The associated tax benefits are expected to be realized over the next one to four years and payment creditsare expected to be used by American from 2014 through 2017, depending on the level of services we provide.
US Airways Antitrust Litigation
In April 2011, US Airways sued us in federal court in the Southern District of New York, alleging violationsof the Sherman Act Section 1(anticompetitive agreements) and Section 2 (monopolization). The complaint wasfiled two months after we entered into a new distribution agreement with US Airways. In September 2011, thecourt dismissed all claims relating to Section 2. The claims that were not dismissed are claims brought underSection 1 of the Sherman Act that relate to our contracts with airlines, especially US Airways itself, which USAirways says contain anticompetitive content-related provisions, and an alleged conspiracy with the other GDSs,allegedly to maintain the industry structure and not to implement US Airways’ preferred system of distributingits Choice Seats product. We strongly deny all of the allegations made by US Airways. In September 2013, USAirways issued a report in which it purported to quantify its damages at either $281 million or $425 million(before trebling), depending on certain assumptions. We believe both estimates are based on faulty assumptionsand analysis and therefore are highly overstated. In the event US Airways were to prevail on the merits of itsclaim, we believe any monetary damages awarded (before trebling) would be significantly less than either of USAirways’ proposed damage amounts.
Document discovery and fact witness discovery are complete. We are now in the process of completingexpert witness discovery. We expect to complete expert depositions in March 2014. Summary judgment motionsare scheduled to be filed in April 2014, with full briefing of those motions expected to be completed in May2014. All court settings are subject to change. No trial date has been set and we anticipate the most likely trialdate would be in September or October 2014, assuming no delays with the court’s schedule and that we do notprevail completely with our summary judgment motions.
We have and will incur significant fees, costs and expenses for as long as the litigation is ongoing. Inaddition, litigation by its nature is highly uncertain and fraught with risk, and it is therefore difficult to predict theoutcome of any particular matter. If favorable resolution of the matter is not reached, any monetary damages aresubject to trebling under the antitrust laws and US Airways would be eligible to be reimbursed by us for its costsand attorneys’ fees. Depending on the amount of any such judgment, if we do not have sufficient cash on hand,we may be required to seek financing through the issuance of additional equity or from private or publicfinancing. Additionally, US Airways can and has sought injunctive relief, though we believe injunctive relief forUS Airways is precluded by the settlement agreement we reached with American Airlines in 2012, which coversaffiliates, including through merger, of American Airlines. If injunctive relief were granted, depending on itsscope, it could affect the manner in which our airline distribution business is operated and potentially forcechanges to the existing airline distribution business model. Any of these consequences could have a materialadverse effect on our business, financial condition and results of operations.
Department of Justice Investigation
On May 19, 2011, we received a civil investigative demand (“CID”) from the U.S. Department of Justice(“DOJ”) investigating alleged anticompetitive acts related to the airline distribution component of our business.We are fully cooperating with the DOJ investigation and are unable to make any prediction regarding itsoutcome. The DOJ is also investigating other companies that own GDSs, and has sent CIDs to other companiesin the travel industry. Based on its findings in the investigation, the DOJ may (i) close the file, (ii) seek a consentdecree to remedy issues it believes violate the antitrust laws, or (iii) file suit against us for violating the antitrustlaws, seeking injunctive relief. If injunctive relief were granted, depending on its scope, it could affect the
F-62

manner in which our airline distribution business is operated and potentially force changes to the existing airlinedistribution business model. Any of these consequences would have a material adverse effect on our business,financial condition and results of operations.
Insurance Carriers
We have disputes against two of our insurance carriers for failing to reimburse defense costs incurred in theAmerican Airlines antitrust litigation, which we settled in October 2012. Both carriers admitted there is coverage,but reserved their rights not to pay should we be found liable for certain of American Airlines’ allegations.Despite their admission of coverage, the insurers have only reimbursed us for a small portion of our significantdefense costs. We filed suit against the entities in New York state court alleging breach of contract and astatutory cause of action for failure to promptly pay claims. If we prevail, we may recover some or all amountsalready tendered to the insurance companies for payment within the limits of the policies and would be entitled to18% interest on such amounts. To date, settlement discussions have been unsuccessful. The court has notscheduled a trial date though we anticipate trial to begin in the latter part of 2014.
Hotel Related Antitrust Proceedings
On August 20, 2012, two individuals alleging to represent a putative class of bookers of online hotelreservations filed a complaint against Sabre Holdings, Travelocity.com LP, and several other online travelcompanies and hotel chains in the U.S. District Court for the Northern District of California, alleging federal andstate antitrust and related claims. The complaint alleges generally that the defendants conspired to enter intoillegal agreements relating to the price of hotel rooms. Over 30 copycat suits were filed in various courts in theUnited States. In December 2012, the Judicial Panel on Multi-District Litigation centralized these cases in theU.S. District Court in the Northern District of Texas, which subsequently consolidated them. The proposed classperiod is January 1, 2003 through May 1, 2013. On June 15, 2013, the court granted Travelocity’s motion tocompel arbitration of claims involving Travelocity bookings made on or after February 4, 2010. While all claimsfrom February 4, 2010 through May 1, 2013 are now excluded from the lawsuit and must be arbitrated if pursuedat all, the lawsuit still covers claims from January 1, 2003 through February 3, 2010. Together with the otherdefendants, Travelocity and Sabre filed a motion to dismiss. On February 18, 2014, the court granted the motionand dismissed the plaintiff’s claims without prejudice. The court gave the plaintiffs 30 days from the date of itsFebruary 18, 2014 order to seek leave to file an amended complaint. We deny any conspiracy or any anti-competitive actions and we intend to aggressively defend against the claims.
Even if we are ultimately successful in defending ourselves in this matter, we are likely to incur significantfees, costs and expenses for as long as it is ongoing. In addition, litigation by its nature is highly uncertain andfraught with risk, and it is difficult to predict the outcome of any particular matter. If favorable resolution of thematter is not reached, we could be subject to monetary damages, including treble damages under the antitrustlaws, as well as injunctive relief. If injunctive relief were granted, depending on its scope, it could affect themanner in which our Travelocity business is operated and potentially force changes to the existing businessmodel. Any of these consequences could have a material adverse effect on our business, financial condition andresults of operations.
Litigation Relating to Value Added Tax Receivables
In the United Kingdom, the Commissioners for Her Majesty’s Revenue & Customs (“HMRC”) haveasserted that our subsidiary, Secret Hotels2 Limited (formerly Med Hotels Limited), failed to account forUnited Kingdom Value Added Tax (“VAT”) on margins earned from hotels located within the European Union(“EU”). This business was sold in February 2009 to a third-party and we account for it as a discontinuedoperation. Because the sale was structured as an asset sale and we retained the company (Secret Hotels2 Limited)with all potential tax liabilities in respect of the same. HMRC issued assessments of tax totaling approximately$11 million for the period October 1, 2004 to September 30, 2007. We appealed the assessments and in March
F-63
2010 the VAT and Duties Tribunal (“First Tribunal”) denied the appeal. We then appealed to the Upper Tribunal(Finance and Tax Chamber) and in July 2011 were successful overturning HMRC’s original assessment. HMRCappealed this decision to the Court of Appeal who on December 3, 2012 found against Secret Hotels2 Limitedupholding the decision of the First Tribunal in favor of HMRC. Based upon this Court of Appeal judgment andthe limited ability to obtain leave to appeal, we accrued $17 million of expense in discontinued operations duringthe year ended December 31, 2012, included in liabilities of discontinued operations in the consolidated balancesheet as of December 31, 2012. Secret Hotels2 Limited successfully obtained leave to appeal the Court of Appealdecision to the Supreme Court in 2013, which is the final court of appeal in the United Kingdom, and onMarch 5, 2014 judgment was given in favor of Secret Hotels2 Limited. We therefore reversed our reserve in2013 in discontinued operations. Any further opportunities to appeal this decision through the European courtsare considered remote.
Additionally, HMRC has begun a review of other parts of our lastminute.com business in the UnitedKingdom. We believe that we have paid the correct amount of VAT on all relevant transactions as nowreinforced by the outcome of Secret Hotels 2 case with the Supreme Court and will vigorously defend ourposition with HMRC or through the courts if necessary.
Litigation Relating to Patent Infringement
In April 2010, CEATS, Inc. (“CEATS”) filed a patent infringement lawsuit against several ticketingcompanies and airlines, including JetBlue, in the Eastern District of Texas. CEATS alleged that the mouse-overseat map that appears on the defendants’ websites infringes certain of its patents. JetBlue’s website is providedby our Airline Solutions business under the SabreSonic Web service. On June 11, 2010, JetBlue requested thatwe indemnify and defend it for and against the CEATS lawsuit based on the indemnification provision in ouragreement with JetBlue, and we agreed to a conditional indemnification. CEATS claimed damages of $0.30 persegment sold on JetBlue’s website during the relevant time period totaling $10 million. A jury trial began onMarch 12, 2012, which resulted in a jury verdict invalidating the plaintiff’s patents. Final judgment was enteredand the plaintiff appealed. The Federal Circuit affirmed the jury’s decision in our favor on April 26, 2013.CEATS did not appeal the Federal Circuit’s decision, and its deadline to do so has passed. On June 28, 2013, theEastern District denied CEATS’ previously filed motion to vacate the judgment based on an alleged conflict ofinterest with a mediator. CEATS has appealed that decision.
Indian Income Tax Litigation
We are currently a defendant in income tax litigation brought by the Indian Director of Income Tax (“DIT”)in the Supreme Court of India. The dispute arose in 1999 when the DIT asserted that we have a permanentestablishment within the meaning of the Income Tax Treaty between the United States and the Republic of Indiaand accordingly issued tax assessments for assessment years ending March 1998 and March 1999, and laterissued further tax assessments for assessment years ending March 2000 through March 2006. We appealed thetax assessments and the Indian Commissioner of Income Tax Appeals returned a mixed verdict. We filed furtherappeals with the Income Tax Appellate Tribunal, or the ITAT. The ITAT ruled in our favor on June 19, 2009 andJuly 10, 2009, stating that no income would be chargeable to tax for assessment years ending March 1998 andMarch 1999, and from March 2000 through March 2006. The DIT appealed those decisions to the Delhi HighCourt, which found in our favor on July 19, 2010. The DIT has appealed the decision to the Supreme Court ofIndia and no trial date has been set.
We intend to continue to aggressively defend against these claims. Although we do not believe that theoutcome of the proceedings will result in a material impact on our business or financial condition, litigation is byits nature uncertain. If the DIT were to fully prevail on every claim, we could be subject to taxes, interest andpenalties of approximately $25 million, which could have a material adverse effect on our business, financialcondition and results of operations. We do not believe this outcome is probable and therefore have not made anyprovisions or recorded any liability for the potential resolution of this matter.
F-64
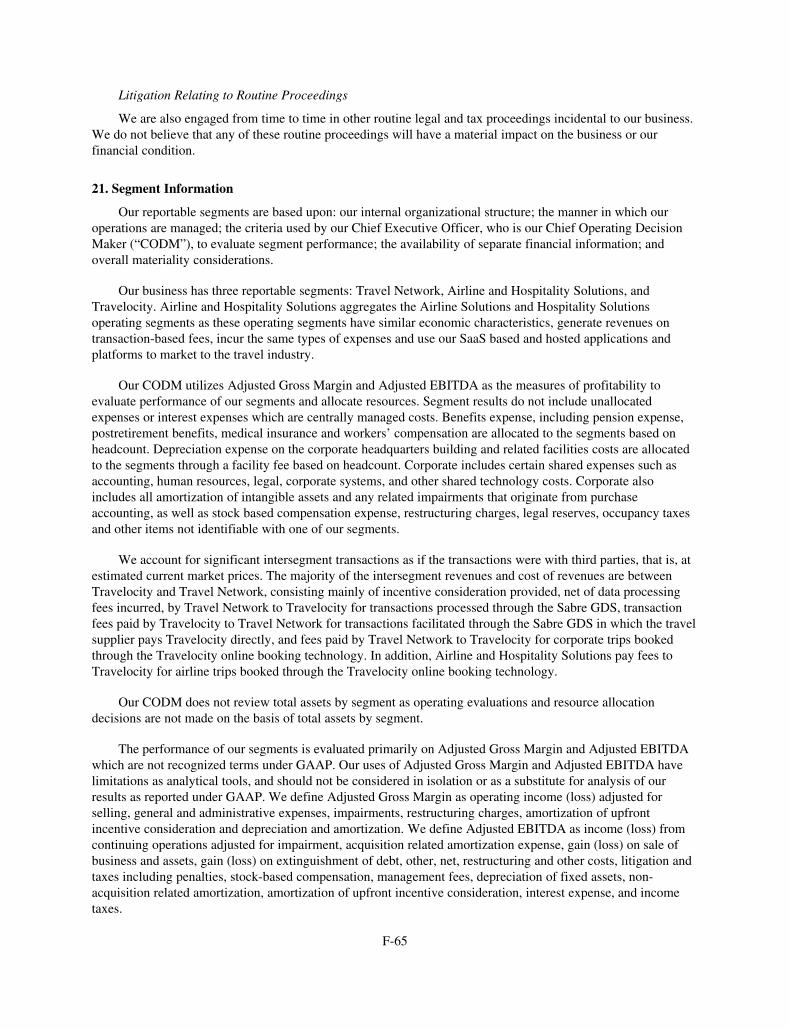
Litigation Relating to Routine Proceedings
We are also engaged from time to time in other routine legal and tax proceedings incidental to our business.We do not believe that any of these routine proceedings will have a material impact on the business or ourfinancial condition.
21. Segment Information
Our reportable segments are based upon: our internal organizational structure; the manner in which ouroperations are managed; the criteria used by our Chief Executive Officer, who is our Chief Operating DecisionMaker (“CODM”), to evaluate segment performance; the availability of separate financial information; andoverall materiality considerations.
Our business has three reportable segments: Travel Network, Airline and Hospitality Solutions, andTravelocity. Airline and Hospitality Solutions aggregates the Airline Solutions and Hospitality Solutionsoperating segments as these operating segments have similar economic characteristics, generate revenues ontransaction-based fees, incur the same types of expenses and use our SaaS based and hosted applications andplatforms to market to the travel industry.
Our CODM utilizes Adjusted Gross Margin and Adjusted EBITDA as the measures of profitability toevaluate performance of our segments and allocate resources. Segment results do not include unallocatedexpenses or interest expenses which are centrally managed costs. Benefits expense, including pension expense,postretirement benefits, medical insurance and workers’ compensation are allocated to the segments based onheadcount. Depreciation expense on the corporate headquarters building and related facilities costs are allocatedto the segments through a facility fee based on headcount. Corporate includes certain shared expenses such asaccounting, human resources, legal, corporate systems, and other shared technology costs. Corporate alsoincludes all amortization of intangible assets and any related impairments that originate from purchaseaccounting, as well as stock based compensation expense, restructuring charges, legal reserves, occupancy taxesand other items not identifiable with one of our segments.
We account for significant intersegment transactions as if the transactions were with third parties, that is, atestimated current market prices. The majority of the intersegment revenues and cost of revenues are betweenTravelocity and Travel Network, consisting mainly of incentive consideration provided, net of data processingfees incurred, by Travel Network to Travelocity for transactions processed through the Sabre GDS, transactionfees paid by Travelocity to Travel Network for transactions facilitated through the Sabre GDS in which the travelsupplier pays Travelocity directly, and fees paid by Travel Network to Travelocity for corporate trips bookedthrough the Travelocity online booking technology. In addition, Airline and Hospitality Solutions pay fees toTravelocity for airline trips booked through the Travelocity online booking technology.
Our CODM does not review total assets by segment as operating evaluations and resource allocationdecisions are not made on the basis of total assets by segment.
The performance of our segments is evaluated primarily on Adjusted Gross Margin and Adjusted EBITDAwhich are not recognized terms under GAAP. Our uses of Adjusted Gross Margin and Adjusted EBITDA havelimitations as analytical tools, and should not be considered in isolation or as a substitute for analysis of ourresults as reported under GAAP. We define Adjusted Gross Margin as operating income (loss) adjusted forselling, general and administrative expenses, impairments, restructuring charges, amortization of upfrontincentive consideration and depreciation and amortization. We define Adjusted EBITDA as income (loss) fromcontinuing operations adjusted for impairment, acquisition related amortization expense, gain (loss) on sale ofbusiness and assets, gain (loss) on extinguishment of debt, other, net, restructuring and other costs, litigation andtaxes including penalties, stock-based compensation, management fees, depreciation of fixed assets, non-acquisition related amortization, amortization of upfront incentive consideration, interest expense, and incometaxes.
F-65
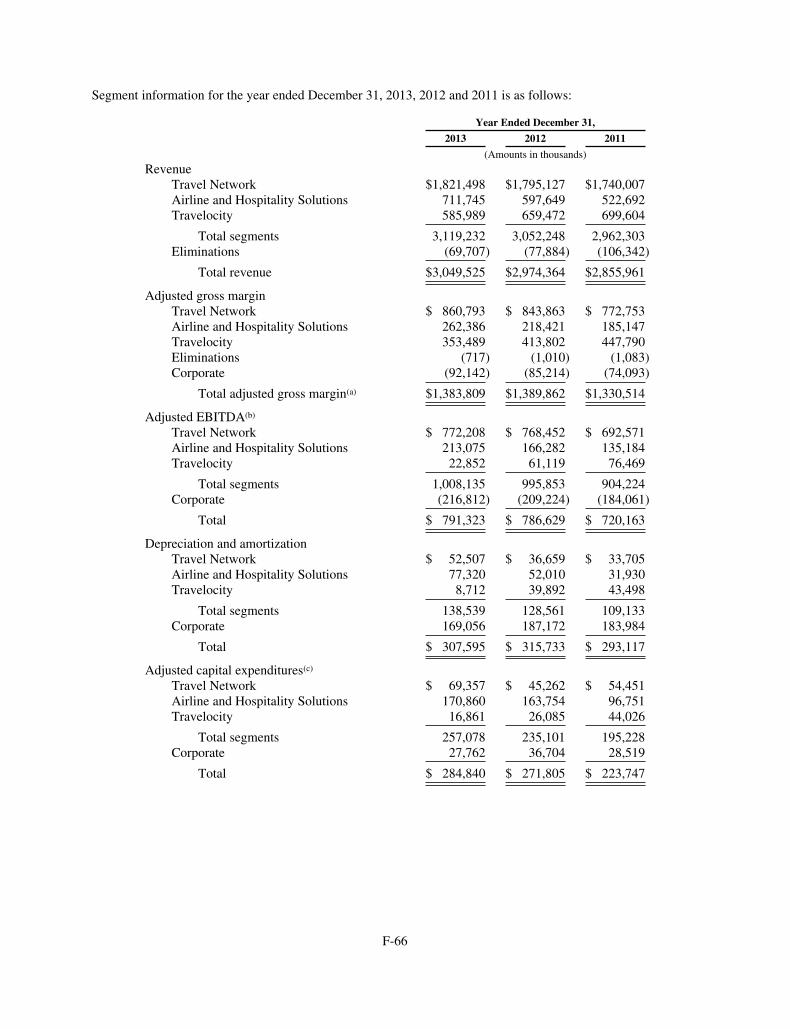
Segment information for the year ended December 31, 2013, 2012 and 2011 is as follows:
Year Ended December 31,
2013 2012 2011
(Amounts in thousands)
RevenueTravel Network $1,821,498 $1,795,127 $1,740,007Airline and Hospitality Solutions 711,745 597,649 522,692Travelocity 585,989 659,472 699,604
Total segments 3,119,232 3,052,248 2,962,303Eliminations (69,707) (77,884) (106,342)
Total revenue $3,049,525 $2,974,364 $2,855,961
Adjusted gross marginTravel Network $ 860,793 $ 843,863 $ 772,753Airline and Hospitality Solutions 262,386 218,421 185,147Travelocity 353,489 413,802 447,790Eliminations (717) (1,010) (1,083)Corporate (92,142) (85,214) (74,093)
Total adjusted gross margin(a) $1,383,809 $1,389,862 $1,330,514
Adjusted EBITDA(b)
Travel Network $ 772,208 $ 768,452 $ 692,571Airline and Hospitality Solutions 213,075 166,282 135,184Travelocity 22,852 61,119 76,469
Total segments 1,008,135 995,853 904,224Corporate (216,812) (209,224) (184,061)
Total $ 791,323 $ 786,629 $ 720,163
Depreciation and amortizationTravel Network $ 52,507 $ 36,659 $ 33,705Airline and Hospitality Solutions 77,320 52,010 31,930Travelocity 8,712 39,892 43,498
Total segments 138,539 128,561 109,133Corporate 169,056 187,172 183,984
Total $ 307,595 $ 315,733 $ 293,117
Adjusted capital expenditures(c)
Travel Network $ 69,357 $ 45,262 $ 54,451Airline and Hospitality Solutions 170,860 163,754 96,751Travelocity 16,861 26,085 44,026
Total segments 257,078 235,101 195,228Corporate 27,762 36,704 28,519
Total $ 284,840 $ 271,805 $ 223,747
F-66

(a) The following table sets forth the reconciliation of Adjusted Gross Margin to operating income (loss) in ourstatement of operations:
Year Ended December 31,
2013 2012 2011
(Amounts in thousands)
Adjusted Gross Margin . . . . . . . . . . . . . . . . . . . . . . . . . . . . $1,383,809 $1,389,862 $1,330,514Less Adjustments:
Selling, general and administrative . . . . . . . . . . . . . . . 792,929 1,188,248 806,435Impairment . . . . . . . . . . . . . . . . . . . . . . . . . . . . . . . . . 138,435 573,180 185,240Restructuring charges . . . . . . . . . . . . . . . . . . . . . . . . . 36,551 — —Depreciation and amortization in cost of revenue(1) . . 202,485 198,206 172,846Amortization of upfront incentive consideration(2) . . . 36,649 36,527 37,748
Operating income (loss) . . . . . . . . . . . . . . . . . . . . . . . . . . . $ 176,760 $ (606,299) $ 128,245
(b) The following tables set forth the reconciliation of Adjusted EBITDA to loss from continuing operations inour statement of operations:
Year Ended December 31,
2013 2012 2011
(Amounts in thousands)
Adjusted EBITDA $791,323 $ 786,629 $720,163Less Adjustments:
Depreciation and amortization of property andequipment (1a) 131,483 135,561 122,640
Amortization of capitalized implementation costs (1b) 35,551 20,855 11,365Amortization of upfront incentive consideration (2) 36,649 36,527 37,748Interest expense, net 274,689 232,450 174,390Impairment (3) 138,435 596,980 185,240Acquisition related amortization (1c) 143,765 162,517 162,312Gain on sale of business and assets — (25,850) —Loss on extinguishment of debt 12,181 — —Other, net (4) 6,724 1,385 (1,156)Restructuring and other costs (5) 59,052 6,776 12,986Litigation and taxes, including penalties (6) 39,431 418,622 21,601Stock-based compensation 9,086 9,834 7,334Management fees (7) 8,761 7,769 7,191(Benefit) provision for income taxes (14,029) (195,071) 57,806
Loss from continuing operations $ (90,455) $(621,726) $ (79,294)
(1) Depreciation and amortization expenses (see Note 2, Summary of Significant Accounting Policies forassociated asset lives):a. Depreciation and amortization of property and equipment represents depreciation of property and
equipment, including software developed for internal use.b. Amortization of capitalized implementation costs represents amortization of up-front costs to
implement new customer contracts under our SaaS and hosted revenue model.c. Acquisition related amortization represents amortization of intangible assets from the take-private
transaction in 2007 as well as intangibles associated with acquisitions since that date andamortization of the excess basis in our underlying equity in joint ventures.
(2) Our Travel Network business at times provides upfront incentive consideration to travel agencysubscribers at the inception or modification of a service contract, which are capitalized and amortizedto cost of revenue over an average expected life of the service contract, generally over three to five
F-67

years. Such consideration is made with the objective of increasing the number of clients or to ensure orimprove customer loyalty. Such service contract terms are established such that the supplier and otherfees generated over the life of the contract will exceed the cost of the incentive consideration providedup front. Such service contracts with travel agency subscribers require that the customer commit toachieving certain economic objectives and generally have terms requiring repayment of the upfrontincentive consideration if those objectives are not met.
(3) Represents impairment charges to assets (see Note 8, Goodwill and Intangible Assets) as well as $24million in 2012, representing our share of impairment charges recorded by one of our equity methodinvestments, Abacus.
(4) Other, net primarily represents foreign exchange gains and losses related to the remeasurement offoreign currency denominated balances included in our consolidated balance sheets into the relevantfunctional currency.
(5) Restructuring and other costs represents charges associated with business restructuring and associatedchanges implemented which resulted in severance benefits related to employee terminations,integration and facility opening or closing costs and other business reorganization costs.
(6) Litigation and taxes, including penalties represents charges or settlements associated with airlineantitrust litigation as well as payments or reserves taken in relation to certain retroactive hoteloccupancy and excise tax disputes (see Note 20, Commitments and Contingencies).
(7) We have been paying an annual management fee to TPG and Silver Lake in an amount equal to thelesser of (i) 1% of our Adjusted EBITDA and (ii) $7 million. This also includes reimbursement ofcertain costs incurred by TPG and Silver Lake.
(c) Includes capital expenditures and capitalized implementation costs as summarized below:
Year Ended December 31,
2013 2012 2011
(Amounts in thousands)
Additions to property and equipment $226,026 $193,262 $164,638Capitalized implementation costs 58,814 78,543 59,109
Adjusted capital expenditures $284,840 $271,805 $223,747
Transaction-based revenue accounted for approximately 89%, 90% and 93% of our Travel Network revenuefor the years ended December 31, 2013, 2012 and 2011, respectively. Transaction-based revenue accounted forapproximately 70%, 67% and 66% of our Airline and Hospitality Solutions revenue for the years endedDecember 31, 2013, 2012 and 2011, respectively. Transaction-based revenue accounted for approximately 87%,88% and 87% of our Travelocity revenue for the years ended December 31, 2013, 2012 and 2011, respectively.
All joint venture equity income and expenses relate to Travel Network.
We have operations with foreign revenue and long-lived assets in approximately 128 countries. Ourrevenues and long-lived assets, excluding goodwill and intangible assets, by geographic region are summarizedbelow. Revenues are attributed to countries based on the location of the customer.
Year Ended December 31,
2013 2012 2011
(Amounts in thousands)
RevenueUnited States $1,765,699 $1,857,771 $1,754,830Europe 501,953 470,112 451,734All other 781,873 646,481 649,397
Total $3,049,525 $2,974,364 $2,855,961
F-68
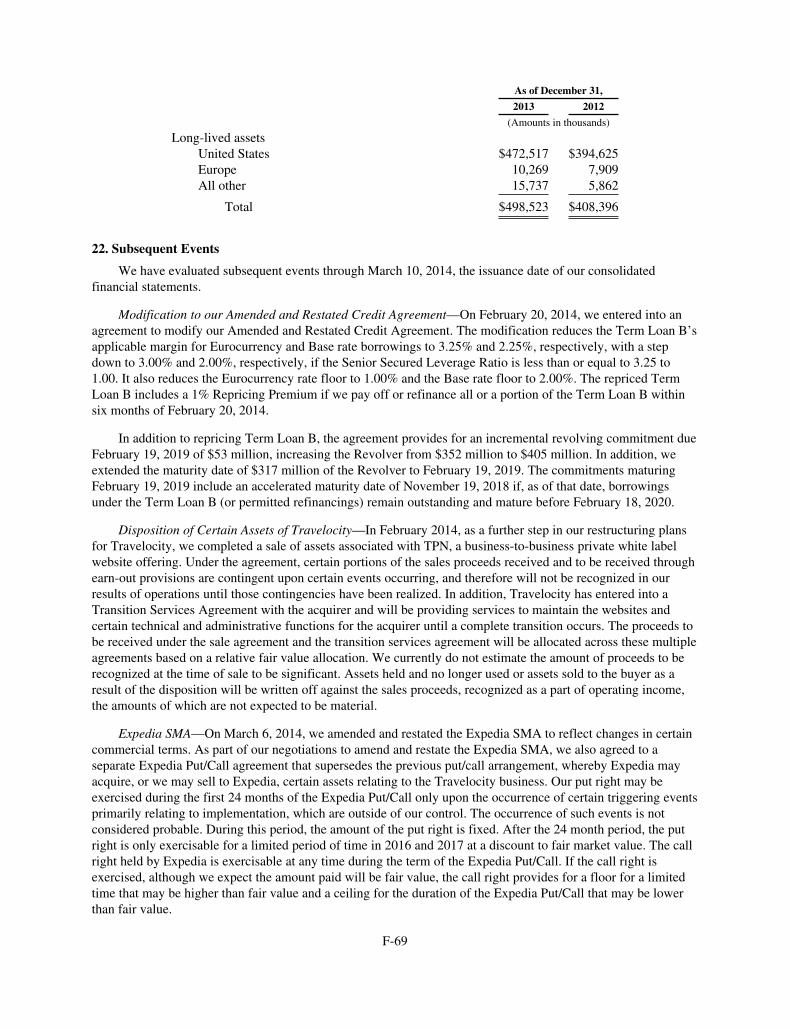
As of December 31,
2013 2012
(Amounts in thousands)
Long-lived assetsUnited States $472,517 $394,625Europe 10,269 7,909All other 15,737 5,862
Total $498,523 $408,396
22. Subsequent Events
We have evaluated subsequent events through March 10, 2014, the issuance date of our consolidatedfinancial statements.
Modification to our Amended and Restated Credit Agreement—On February 20, 2014, we entered into anagreement to modify our Amended and Restated Credit Agreement. The modification reduces the Term Loan B’sapplicable margin for Eurocurrency and Base rate borrowings to 3.25% and 2.25%, respectively, with a stepdown to 3.00% and 2.00%, respectively, if the Senior Secured Leverage Ratio is less than or equal to 3.25 to1.00. It also reduces the Eurocurrency rate floor to 1.00% and the Base rate floor to 2.00%. The repriced TermLoan B includes a 1% Repricing Premium if we pay off or refinance all or a portion of the Term Loan B withinsix months of February 20, 2014.
In addition to repricing Term Loan B, the agreement provides for an incremental revolving commitment dueFebruary 19, 2019 of $53 million, increasing the Revolver from $352 million to $405 million. In addition, weextended the maturity date of $317 million of the Revolver to February 19, 2019. The commitments maturingFebruary 19, 2019 include an accelerated maturity date of November 19, 2018 if, as of that date, borrowingsunder the Term Loan B (or permitted refinancings) remain outstanding and mature before February 18, 2020.
Disposition of Certain Assets of Travelocity—In February 2014, as a further step in our restructuring plansfor Travelocity, we completed a sale of assets associated with TPN, a business-to-business private white labelwebsite offering. Under the agreement, certain portions of the sales proceeds received and to be received throughearn-out provisions are contingent upon certain events occurring, and therefore will not be recognized in ourresults of operations until those contingencies have been realized. In addition, Travelocity has entered into aTransition Services Agreement with the acquirer and will be providing services to maintain the websites andcertain technical and administrative functions for the acquirer until a complete transition occurs. The proceeds tobe received under the sale agreement and the transition services agreement will be allocated across these multipleagreements based on a relative fair value allocation. We currently do not estimate the amount of proceeds to berecognized at the time of sale to be significant. Assets held and no longer used or assets sold to the buyer as aresult of the disposition will be written off against the sales proceeds, recognized as a part of operating income,the amounts of which are not expected to be material.
Expedia SMA—On March 6, 2014, we amended and restated the Expedia SMA to reflect changes in certaincommercial terms. As part of our negotiations to amend and restate the Expedia SMA, we also agreed to aseparate Expedia Put/Call agreement that supersedes the previous put/call arrangement, whereby Expedia mayacquire, or we may sell to Expedia, certain assets relating to the Travelocity business. Our put right may beexercised during the first 24 months of the Expedia Put/Call only upon the occurrence of certain triggering eventsprimarily relating to implementation, which are outside of our control. The occurrence of such events is notconsidered probable. During this period, the amount of the put right is fixed. After the 24 month period, the putright is only exercisable for a limited period of time in 2016 and 2017 at a discount to fair market value. The callright held by Expedia is exercisable at any time during the term of the Expedia Put/Call. If the call right isexercised, although we expect the amount paid will be fair value, the call right provides for a floor for a limitedtime that may be higher than fair value and a ceiling for the duration of the Expedia Put/Call that may be lowerthan fair value.
F-69
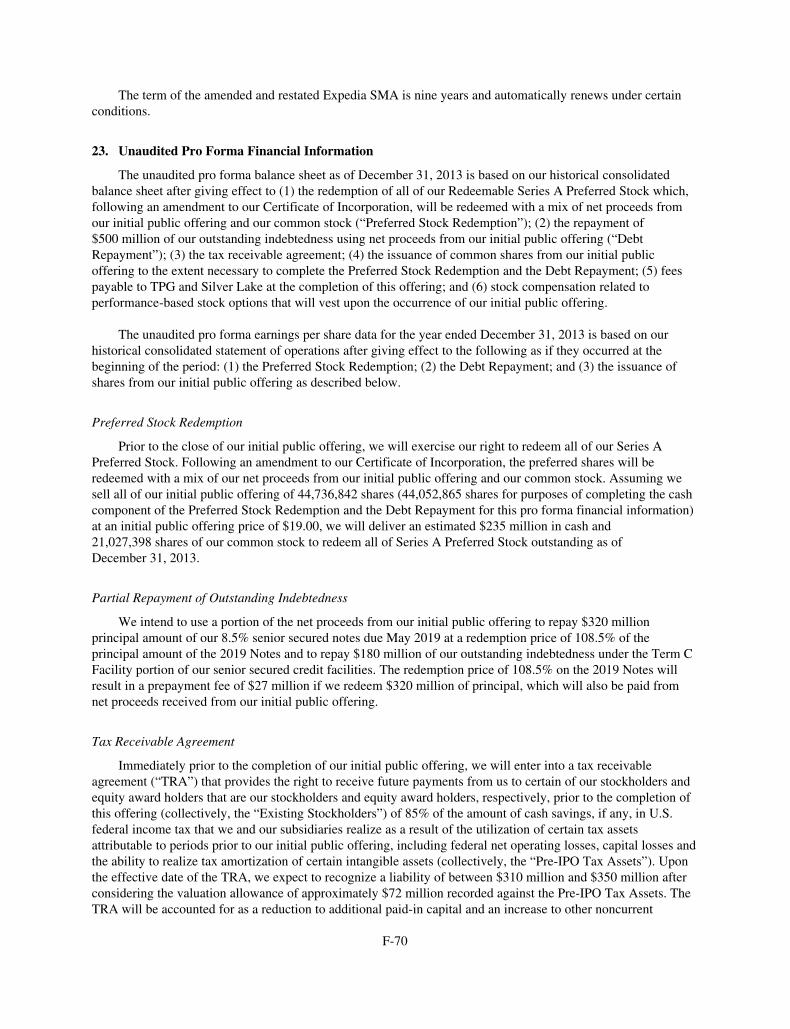
The term of the amended and restated Expedia SMA is nine years and automatically renews under certainconditions.
23. Unaudited Pro Forma Financial Information
The unaudited pro forma balance sheet as of December 31, 2013 is based on our historical consolidatedbalance sheet after giving effect to (1) the redemption of all of our Redeemable Series A Preferred Stock which,following an amendment to our Certificate of Incorporation, will be redeemed with a mix of net proceeds fromour initial public offering and our common stock (“Preferred Stock Redemption”); (2) the repayment of$500 million of our outstanding indebtedness using net proceeds from our initial public offering (“DebtRepayment”); (3) the tax receivable agreement; (4) the issuance of common shares from our initial publicoffering to the extent necessary to complete the Preferred Stock Redemption and the Debt Repayment; (5) feespayable to TPG and Silver Lake at the completion of this offering; and (6) stock compensation related toperformance-based stock options that will vest upon the occurrence of our initial public offering.
The unaudited pro forma earnings per share data for the year ended December 31, 2013 is based on ourhistorical consolidated statement of operations after giving effect to the following as if they occurred at thebeginning of the period: (1) the Preferred Stock Redemption; (2) the Debt Repayment; and (3) the issuance ofshares from our initial public offering as described below.
Preferred Stock Redemption
Prior to the close of our initial public offering, we will exercise our right to redeem all of our Series APreferred Stock. Following an amendment to our Certificate of Incorporation, the preferred shares will beredeemed with a mix of our net proceeds from our initial public offering and our common stock. Assuming wesell all of our initial public offering of 44,736,842 shares (44,052,865 shares for purposes of completing the cashcomponent of the Preferred Stock Redemption and the Debt Repayment for this pro forma financial information)at an initial public offering price of $19.00, we will deliver an estimated $235 million in cash and21,027,398 shares of our common stock to redeem all of Series A Preferred Stock outstanding as ofDecember 31, 2013.
Partial Repayment of Outstanding Indebtedness
We intend to use a portion of the net proceeds from our initial public offering to repay $320 millionprincipal amount of our 8.5% senior secured notes due May 2019 at a redemption price of 108.5% of theprincipal amount of the 2019 Notes and to repay $180 million of our outstanding indebtedness under the Term CFacility portion of our senior secured credit facilities. The redemption price of 108.5% on the 2019 Notes willresult in a prepayment fee of $27 million if we redeem $320 million of principal, which will also be paid fromnet proceeds received from our initial public offering.
Tax Receivable Agreement
Immediately prior to the completion of our initial public offering, we will enter into a tax receivableagreement (“TRA”) that provides the right to receive future payments from us to certain of our stockholders andequity award holders that are our stockholders and equity award holders, respectively, prior to the completion ofthis offering (collectively, the “Existing Stockholders”) of 85% of the amount of cash savings, if any, in U.S.federal income tax that we and our subsidiaries realize as a result of the utilization of certain tax assetsattributable to periods prior to our initial public offering, including federal net operating losses, capital losses andthe ability to realize tax amortization of certain intangible assets (collectively, the “Pre-IPO Tax Assets”). Uponthe effective date of the TRA, we expect to recognize a liability of between $310 million and $350 million afterconsidering the valuation allowance of approximately $72 million recorded against the Pre-IPO Tax Assets. TheTRA will be accounted for as a reduction to additional paid-in capital and an increase to other noncurrent
F-70

liabilities upon becoming effective and is presented as such in the pro forma balance sheet as of December 31,2013, assuming the midpoint of the range. The pro forma adjustment does not reflect any potential deductibilityfor tax purposes of payments made under the TRA, which we do not expect to be material. Proceeds from ourinitial public offering will not be utilized for payment of the TRA liability.
Issuance of Shares from Our Initial Public Offering
We estimate the necessary shares to be issued through our initial public offering to complete the cashcomponent of the Preferred Stock Redemption and the Debt Repayment will total 44,052,865 shares at anassumed initial public offering price of $19.00 per share of common stock which would result in net proceeds of$763 million, after deducting underwriting discounts and estimated offering expenses payable by us ofapproximately $53 million, and a $21 million fee, in the aggregate, payable to TPG and Silver Lake inconnection with the offering. In addition, we will recognize $2 million of compensation expense related toperformance-based stock awards that will vest upon the occurrence of the initial public offering.
The reconciliation of the historical balance sheet to the pro forma amounts presented as of December 31,2013 is as follows:
OtherAssets, net
Long-termDebt
OtherNoncurrentLiabilities
Common Stock AdditionalPaid-InCapital
RetainedDeficit
PreferredStock Shares Amount
(Amounts in thousands)Historical . . . . . . . . . . . . . . . . $469,543 $3,643,548 $263,182 $ 634,843 178,633 $1,786 $ 880,619 $(1,785,554)
Preferred StockRedemption . . . . . . . . — — — (634,843) 21,027 210 399,310 —
Debt Repayment (a) . . . . 9,249 (498,550) — — — — — (19,401)Tax Receivable
Agreement . . . . . . . . . — — 330,000 — — — (330,000) —Initial Public
Offering (b) . . . . . . . . — — — — 44,053 441 783,082 (21,000)Stock-based
compensation (c) . . . . 895 — — — — — 2,452 (1,557)
Pro Forma . . . . . . . . . . . . . . . $479,687 $3,144,998 $593,182 $ — 243,713 $2,437 $1,735,463 $(1,827,512)
(a) Adjustment to retained deficit represents a $27 million prepayment fee, or $17 million net of tax,in connection with the planned redemption of $320 million of our 2019 Notes. Adjustment toretained deficit also includes the write-off of $3 million, or $2 million net of tax, of debt issuancecosts and the net original issue discount and premium associated with the Debt Repayment.Increase to other assets, net represents the impact to deferred income taxes as a result of the taxeffect of the Debt Repayment.
(b) Adjustment to retained deficit represents a $21 million fee, in the aggregate, payable by us to TPGand Silver Lake in connection with the offering. This fee is not expected to be deductible for taxpurposes.
(c) Adjustment to retained deficit represents the compensation expense, net of tax, related toperformance-based stock awards that will vest upon the occurrence of the initial public offering.Increase to other assets, net represents the increase to deferred income taxes as a result of the taxeffect of compensation expense.
F-71
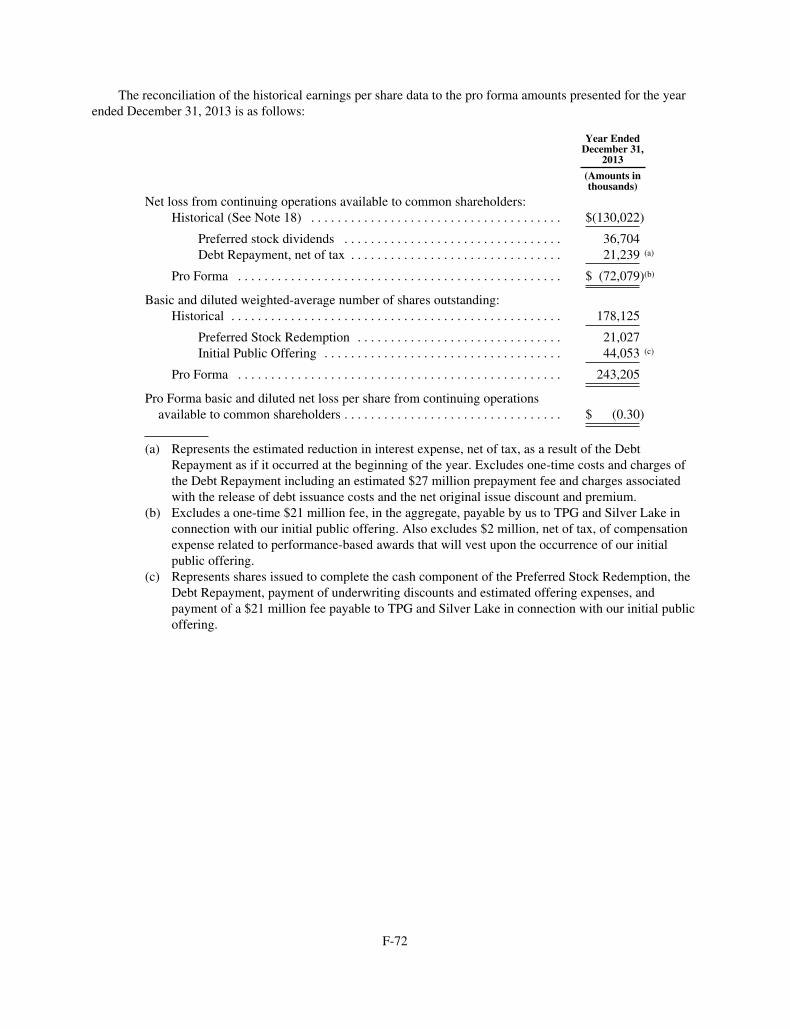
The reconciliation of the historical earnings per share data to the pro forma amounts presented for the yearended December 31, 2013 is as follows:
Year EndedDecember 31,
2013
(Amounts inthousands)
Net loss from continuing operations available to common shareholders:Historical (See Note 18) . . . . . . . . . . . . . . . . . . . . . . . . . . . . . . . . . . . . . . $(130,022)
Preferred stock dividends . . . . . . . . . . . . . . . . . . . . . . . . . . . . . . . . . 36,704Debt Repayment, net of tax . . . . . . . . . . . . . . . . . . . . . . . . . . . . . . . . 21,239 (a)
Pro Forma . . . . . . . . . . . . . . . . . . . . . . . . . . . . . . . . . . . . . . . . . . . . . . . . . $ (72,079)(b)
Basic and diluted weighted-average number of shares outstanding:Historical . . . . . . . . . . . . . . . . . . . . . . . . . . . . . . . . . . . . . . . . . . . . . . . . . . 178,125
Preferred Stock Redemption . . . . . . . . . . . . . . . . . . . . . . . . . . . . . . . 21,027Initial Public Offering . . . . . . . . . . . . . . . . . . . . . . . . . . . . . . . . . . . . 44,053 (c)
Pro Forma . . . . . . . . . . . . . . . . . . . . . . . . . . . . . . . . . . . . . . . . . . . . . . . . . 243,205
Pro Forma basic and diluted net loss per share from continuing operationsavailable to common shareholders . . . . . . . . . . . . . . . . . . . . . . . . . . . . . . . . . $ (0.30)
(a) Represents the estimated reduction in interest expense, net of tax, as a result of the DebtRepayment as if it occurred at the beginning of the year. Excludes one-time costs and charges ofthe Debt Repayment including an estimated $27 million prepayment fee and charges associatedwith the release of debt issuance costs and the net original issue discount and premium.
(b) Excludes a one-time $21 million fee, in the aggregate, payable by us to TPG and Silver Lake inconnection with our initial public offering. Also excludes $2 million, net of tax, of compensationexpense related to performance-based awards that will vest upon the occurrence of our initialpublic offering.
(c) Represents shares issued to complete the cash component of the Preferred Stock Redemption, theDebt Repayment, payment of underwriting discounts and estimated offering expenses, andpayment of a $21 million fee payable to TPG and Silver Lake in connection with our initial publicoffering.
F-72
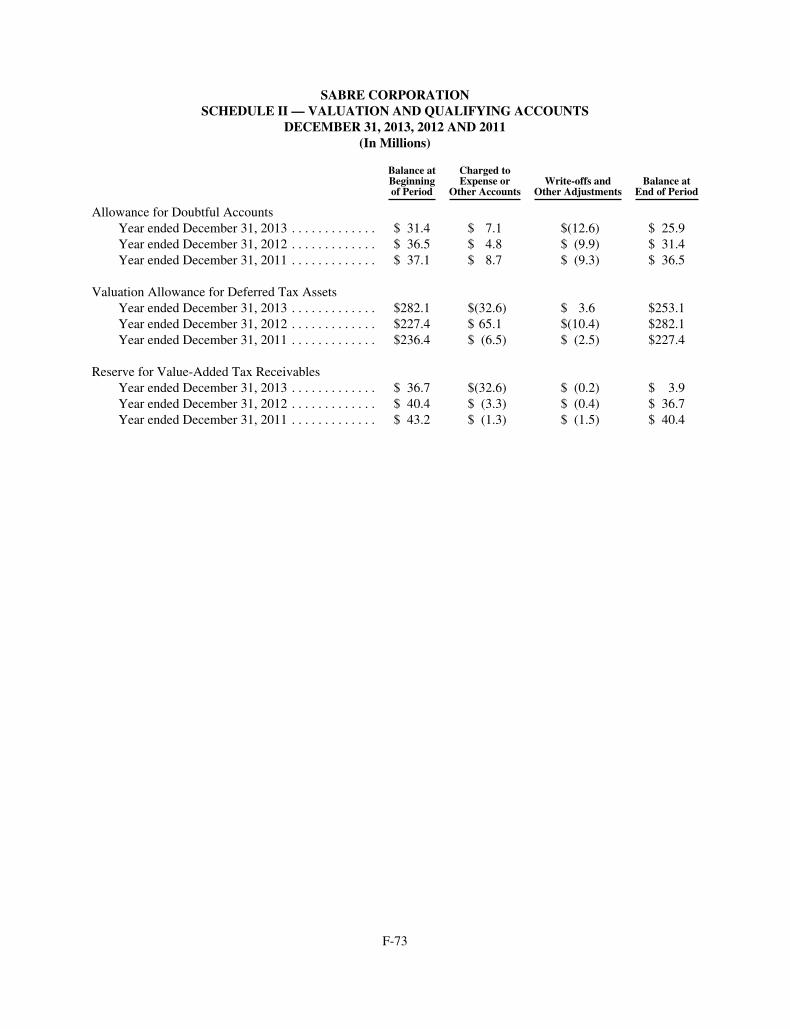
SABRE CORPORATIONSCHEDULE II — VALUATION AND QUALIFYING ACCOUNTS
DECEMBER 31, 2013, 2012 AND 2011(In Millions)
Balance atBeginningof Period
Charged toExpense or
Other AccountsWrite-offs and
Other AdjustmentsBalance at
End of Period
Allowance for Doubtful AccountsYear ended December 31, 2013 . . . . . . . . . . . . . $ 31.4 $ 7.1 $(12.6) $ 25.9Year ended December 31, 2012 . . . . . . . . . . . . . $ 36.5 $ 4.8 $ (9.9) $ 31.4Year ended December 31, 2011 . . . . . . . . . . . . . $ 37.1 $ 8.7 $ (9.3) $ 36.5
Valuation Allowance for Deferred Tax AssetsYear ended December 31, 2013 . . . . . . . . . . . . . $282.1 $(32.6) $ 3.6 $253.1Year ended December 31, 2012 . . . . . . . . . . . . . $227.4 $ 65.1 $(10.4) $282.1Year ended December 31, 2011 . . . . . . . . . . . . . $236.4 $ (6.5) $ (2.5) $227.4
Reserve for Value-Added Tax ReceivablesYear ended December 31, 2013 . . . . . . . . . . . . . $ 36.7 $(32.6) $ (0.2) $ 3.9Year ended December 31, 2012 . . . . . . . . . . . . . $ 40.4 $ (3.3) $ (0.4) $ 36.7Year ended December 31, 2011 . . . . . . . . . . . . . $ 43.2 $ (1.3) $ (1.5) $ 40.4
F-73

Independent Auditors’ Report
Board of Director and Stockholder/MemberPRISM Group, Inc. and Affiliate
We have audited the accompanying combined balance sheets of PRISM Group, Inc. (a Maryland Corporation)and Affiliate (collectively the “Company”), as of December 31, 2011 and 2010, and the related combinedstatements of income, changes in stockholder’s/member’s equity, and cash flows for the years then ended. Thesecombined financial statements are the responsibility of the Company’s management. Our responsibility is toexpress an opinion on these combined financial statements based on our audits.
We conducted our audits in accordance with auditing standards generally accepted in the United States ofAmerica. Those standards require that we plan and perform the audit to obtain reasonable assurance aboutwhether the combined financial statements are free of material misstatement. An audit includes examining, on atest basis, evidence supporting the amounts and disclosures in the combined financial statements. An audit alsoincludes assessing the accounting principles used and significant estimates made by management, as well asevaluating the overall combined financial statement presentation. We believe that our audits provide a reasonablebasis for our opinion.
In our opinion, the combined financial statements referred to above present fairly, in all material respects, thefinancial position of PRISM Group, Inc. and its Affiliate as of December 31, 2011 and 2010, and the results oftheir operations and their cash flows for the years then ended in conformity with accounting principles generallyaccepted in the United States of America.
As discussed in Note 7 to the combined financial statements, certain errors resulting in an overstatement ofpreviously reported revenues, compensation expense and compensation accrual with a correspondingunderstatement of deferred revenue as of December 31, 2010, were discovered by management of the Companyduring the current year. Accordingly, the 2010 combined financial statements have been restated to correct theerror.
As discussed in Note 2 to the combined financial statements, on August 1, 2012, the Company entered into anequity purchase agreement whereby Sabre, Inc., a Delaware corporation, acquired all of the outstanding stockand ownership interests of the Company.
/s/ REDW LLC
Albuquerque, New MexicoFebruary 28, 2014
F-74
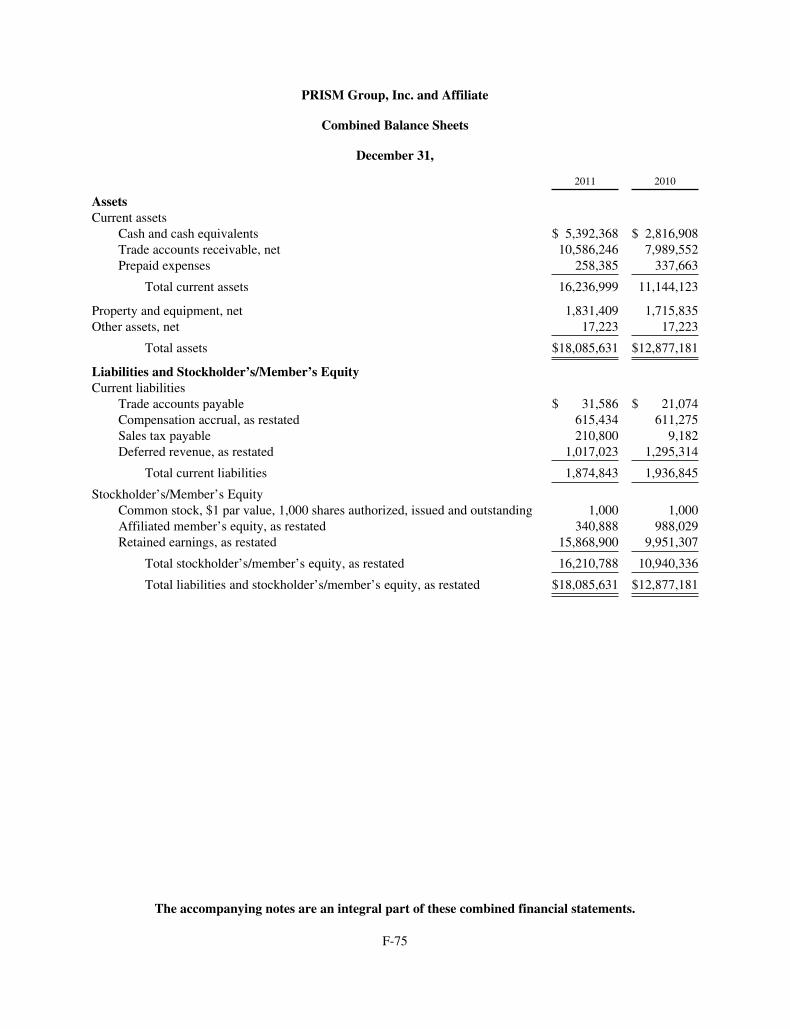
PRISM Group, Inc. and Affiliate
Combined Balance Sheets
December 31,
2011 2010
AssetsCurrent assets
Cash and cash equivalents $ 5,392,368 $ 2,816,908Trade accounts receivable, net 10,586,246 7,989,552Prepaid expenses 258,385 337,663
Total current assets 16,236,999 11,144,123
Property and equipment, net 1,831,409 1,715,835Other assets, net 17,223 17,223
Total assets $18,085,631 $12,877,181
Liabilities and Stockholder’s/Member’s EquityCurrent liabilities
Trade accounts payable $ 31,586 $ 21,074Compensation accrual, as restated 615,434 611,275Sales tax payable 210,800 9,182Deferred revenue, as restated 1,017,023 1,295,314
Total current liabilities 1,874,843 1,936,845
Stockholder’s/Member’s EquityCommon stock, $1 par value, 1,000 shares authorized, issued and outstanding 1,000 1,000Affiliated member’s equity, as restated 340,888 988,029Retained earnings, as restated 15,868,900 9,951,307
Total stockholder’s/member’s equity, as restated 16,210,788 10,940,336
Total liabilities and stockholder’s/member’s equity, as restated $18,085,631 $12,877,181
The accompanying notes are an integral part of these combined financial statements.
F-75
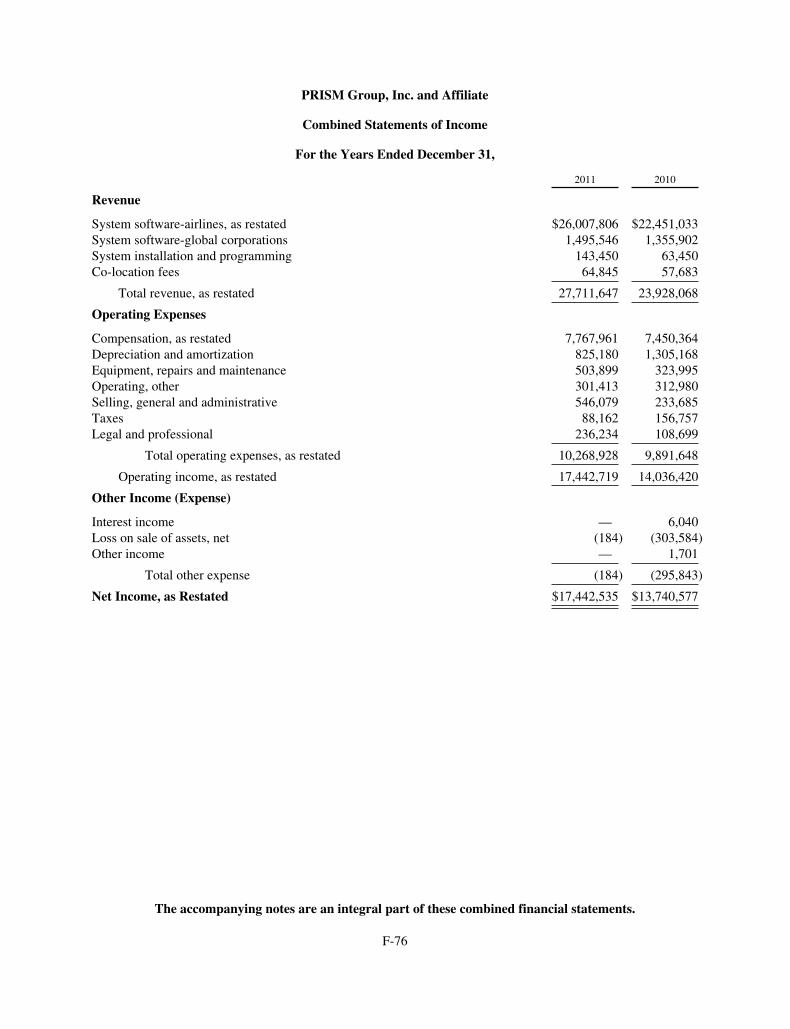
PRISM Group, Inc. and Affiliate
Combined Statements of Income
For the Years Ended December 31,
2011 2010
Revenue
System software-airlines, as restated $26,007,806 $22,451,033System software-global corporations 1,495,546 1,355,902System installation and programming 143,450 63,450Co-location fees 64,845 57,683
Total revenue, as restated 27,711,647 23,928,068
Operating Expenses
Compensation, as restated 7,767,961 7,450,364Depreciation and amortization 825,180 1,305,168Equipment, repairs and maintenance 503,899 323,995Operating, other 301,413 312,980Selling, general and administrative 546,079 233,685Taxes 88,162 156,757Legal and professional 236,234 108,699
Total operating expenses, as restated 10,268,928 9,891,648
Operating income, as restated 17,442,719 14,036,420
Other Income (Expense)
Interest income — 6,040Loss on sale of assets, net (184) (303,584)Other income — 1,701
Total other expense (184) (295,843)
Net Income, as Restated $17,442,535 $13,740,577
The accompanying notes are an integral part of these combined financial statements.
F-76

PRISM Group, Inc. and Affiliate
Combined Statements of Changes in Stockholder’s/Member’s Equity
For the Years Ended December 31,
CommonStock
AffiliateMember’s
EquityRetainedEarnings
Stockholder’s/Member’s
Equity
Balance at December 31, 2009, as restated $1,000 $ 1,823,234 $ 8,992,706 $ 10,816,940Net (loss) income, as restated — (2,635,205) 16,375,782 13,740,577Capital contribution (distributions) — 1,800,000 (15,417,181) (13,617,181)
Balance at December 31, 2010, as restated 1,000 988,029 9,951,307 10,940,336Net (loss) income — (2,026,708) 19,469,243 17,442,535Capital contribution (distributions) — 1,379,567 (13,551,650) (12,172,083)
Balance at December 31, 2011 $1,000 $ 340,888 $ 15,868,900 $ 16,210,788
The accompanying notes are an integral part of these combined financial statements.
F-77
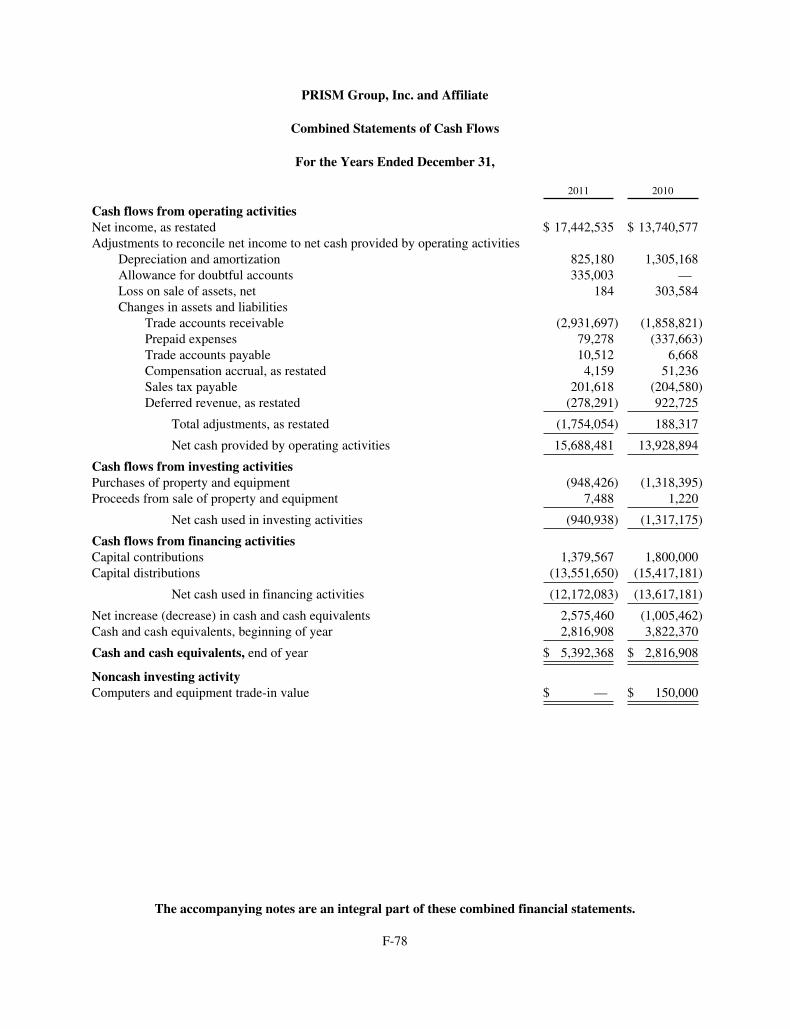
PRISM Group, Inc. and Affiliate
Combined Statements of Cash Flows
For the Years Ended December 31,
2011 2010
Cash flows from operating activitiesNet income, as restated $ 17,442,535 $ 13,740,577Adjustments to reconcile net income to net cash provided by operating activities
Depreciation and amortization 825,180 1,305,168Allowance for doubtful accounts 335,003 —Loss on sale of assets, net 184 303,584Changes in assets and liabilities
Trade accounts receivable (2,931,697) (1,858,821)Prepaid expenses 79,278 (337,663)Trade accounts payable 10,512 6,668Compensation accrual, as restated 4,159 51,236Sales tax payable 201,618 (204,580)Deferred revenue, as restated (278,291) 922,725
Total adjustments, as restated (1,754,054) 188,317
Net cash provided by operating activities 15,688,481 13,928,894
Cash flows from investing activitiesPurchases of property and equipment (948,426) (1,318,395)Proceeds from sale of property and equipment 7,488 1,220
Net cash used in investing activities (940,938) (1,317,175)
Cash flows from financing activitiesCapital contributions 1,379,567 1,800,000Capital distributions (13,551,650) (15,417,181)
Net cash used in financing activities (12,172,083) (13,617,181)
Net increase (decrease) in cash and cash equivalents 2,575,460 (1,005,462)Cash and cash equivalents, beginning of year 2,816,908 3,822,370
Cash and cash equivalents, end of year $ 5,392,368 $ 2,816,908
Noncash investing activityComputers and equipment trade-in value $ — $ 150,000
The accompanying notes are an integral part of these combined financial statements.
F-78

PRISM Group, Inc. and Affiliate
Notes to Combined Financial Statements
December 31, 2011 and 2010
1) Organization and Nature of Operations
PRISM Group, Inc. and affiliate (collectively the “Company”) are located in Albuquerque, New Mexico.PRISM Group, Inc. (PRISM Group), a Maryland close corporation, specializes in the development of travelinformation systems for airlines and global corporations and provides initial custom configuration,consulting, training and technical support to its customers. PRISM Technologies, LLC (PRISMTechnologies), a New Mexico Limited Liability Company (LLC), offers equipment storage space (co-location) to its customers, the largest of which is PRISM Group. PRISM Technologies is solely owned byPRISM Group’s sole stockholder. Accordingly, the accompanying combined financial statements have beenprepared to reflect the combined financial position, results of operations and cash flows of PRISM Groupand PRISM Technologies.
2) Summary of Significant Accounting
Combined Financial Statements
The combined financial statements include the accounts of PRISM Group and PRISM Technologies. Allsignificant intercompany balances and transactions have been eliminated.
Cash and Cash Equivalents
The Company considers all highly liquid investments with original maturities of three months or less to becash equivalents. Cash and cash equivalents are comprised of deposits with financial institutions, allavailable on demand, which at times may exceed federally insured limits. The Company has not experiencedany losses in such accounts and believes it is not exposed to any significant credit risk on its cash balances.
Use of Estimates
The preparation of financial statements in conformity with accounting principles generally accepted in theUnited States of America requires management to make estimates and assumptions that affect the reportedamounts of assets and liabilities, the disclosure of contingent liabilities at the date of the combined financialstatements and the reported amounts of revenues and expenses during the reporting period. Significantestimates include determination of revenue, allowance for doubtful accounts and impairment of long-livedassets. Actual results may differ from those estimates.
Financial Instruments
The carrying amounts of cash, receivables, and payables represent financial instruments whose recordedamounts approximate fair value due to the short maturity periods of these instruments.
Trade Accounts Receivable
Accounts receivable are recorded at the invoiced amount and are non-interest bearing. Management reviewsthe collectability of its receivables and, when appropriate, records an allowance for its estimate ofuncollectible accounts. Accounts receivables are stated at amounts due from customers net of allowance fordoubtful accounts based on the Company’s review of current status of existing receivables, subsequentcollections and ongoing dialog with customers. At December 31, 2011, the allowance for doubtful accounts
F-79

PRISM Group, Inc. and Affiliate
Notes to Combined Financial Statements
December 31, 2011 and 2010
was $335,003. There was no allowance for doubtful accounts at December 31, 2010. Management believesthe allowance for doubtful accounts is adequate to cover any uncollectible accounts at December 31, 2011and 2010; however, the actual collections may ultimately differ from such estimates. Bad debt expense forthe years ended December 31, 2011 and 2010 was $335,003 and $3,056, respectively.
The Company bills customers on a quarterly basis. Prior to 2011, the Company mailed the invoices on thefollowing fiscal year. As a result, at December 31, 2010, included in trade accounts receivable was$7,868,438, of unbilled receivables representing revenues recognized in 2010 but not billed until 2011.
Starting in 2011, the Company mailed the quarter invoices on the last day of each quarter. As a result, therewere no unbilled receivables at December 31, 2011.
Prepaid Expenses
Prepaid expenses consist of prepaid support and maintenance related to the purchase of equipment andsoftware, which is expensed over the life of the contract using the straight-line method. Amortizationexpense for the years ended December 31, 2011 and 2010 was $467,035 and $270,399, respectively, and isincluded in equipment, repairs and maintenance in the accompanying combined statements of income.
Property and Equipment
Property and equipment consist of items purchased at a cost of $1,000 or more. Depreciation is recordedover the estimated useful lives of the assets using the straight-line method. The useful lives of computersand equipment, software, furniture and fixtures and vehicles range from three to seven years. Amortizationof leasehold improvements is recorded over the shorter of the term of the lease or estimated useful lives offive years using the straight-line method.
Depreciation and amortization expense for property and equipment in 2011 and 2010 was $825,180 and$1,301,771, respectively.
Management reviews property and equipment for impairment whenever events or changes in circumstanceshave indicated that the carrying amount of assets may not be recoverable. No impairments have occurred in2011 nor 2010.
Research and Development
Development costs incurred before technological feasibility is established are expensed. Costs incurred aftertechnological feasibility is established are capitalized and amortized at the greater of the amount computedon a straight-line basis over the estimated useful life of the product. Development expenses are primarilyincluded in compensation expense in the accompanying combined statements of income. No amounts werecapitalized or amortized in 2011 nor 2010.
Patents and Trademarks
The Company uses intellectual property owned by its stockholder, royalty free. The Company expenseslegal and other costs incurred to maintain the intellectual property. Expenses related to intellectual propertyfor 2011 and 2010 were $68,703 and $13,008, respectively, and are included in legal and professionalexpense in the accompanying combined statements of income.
F-80
PRISM Group, Inc. and Affiliate
Notes to Combined Financial Statements
December 31, 2011 and 2010
Revenue and Deferred Revenue
The Company licenses software and provides data analysis to airlines and global corporations for a specifiedperiod with automatic or optional renewals at specified dollar amounts and provides equipment storagespace to other corporations. The total consideration stated in the contract is for the system software licensepass-through data and installation and programming costs together with special analyses, maintenance,support, and data updates delivered over the term of the license. Customer acceptance of software andrelated initial deliverables is deemed to occur upon delivery unless the agreement specifies an acceptanceprocess or requires the passage of a specified period of time before acceptance is deemed to occur. Revenuefrom data analysis is recognized provided that all of the following conditions are met: an agreement hasbeen signed; services have been performed; collection of the resulting receivable is deemed probable; andno other significant vendor obligations exist.
Revenues from equipment storage space, maintenance, support, and training are recognized as the respectiveservices are performed.
Included in revenue are refunds and credits issued to various customers. During the years ended December 31,2011 and 2010, the total amount of refunds and credits was $96,823 and $68,000, respectively.
The Company also has an agreement with one of its major customers where the billable data will not exceeda set amount in any contract year, which is defined as October 1 through September 30. This agreementresults in deferral of revenue on a fiscal year basis. The amount of deferred revenue was $1,017,023 and$1,295,314 at December 31, 2011 and 2010, respectively.
Advertising and Marketing
Advertising and marketing costs are expensed as incurred. In 2011 and 2010, advertising and marketingexpense, included in selling, general and administrative expenses in the accompanying combined statementsof income, was $15,483 and $8,882, respectively.
Income Taxes
PRISM Group, with the consent of its stockholder, has elected to be an “S” corporation under the InternalRevenue Code and similar state law. Similarly, PRISM Technologies is a tax pass through entity. Instead ofpaying income taxes, the stockholder/member reports the impact of the Company’s operating results on apersonal tax return. Therefore, there is no provision or liability for federal or state income taxes in theaccompanying combined financial statements.
The accounting standard on accounting for uncertainty in income taxes addresses the determination ofwhether tax benefits claimed or expected to be claimed on a tax return should be recorded in the combinedfinancial statements. Under that guidance, the Company may recognize the tax benefit from an uncertain taxposition only if it is more likely than not that the tax position will be sustained on examination by taxingauthorities based on the technical merits of the position. Tax positions include the tax-exempt status of theCompany. The Company believes that it has appropriate support for any tax positions taken, and as such,does not have any uncertain tax positions that are material to the accompanying combined financialstatements.
As of December 31, 2011, for federal tax purposes, the Company’s 2009 through 2011 tax years remainopen for examination by the tax authorities under the normal three-year statute of limitations.
F-81
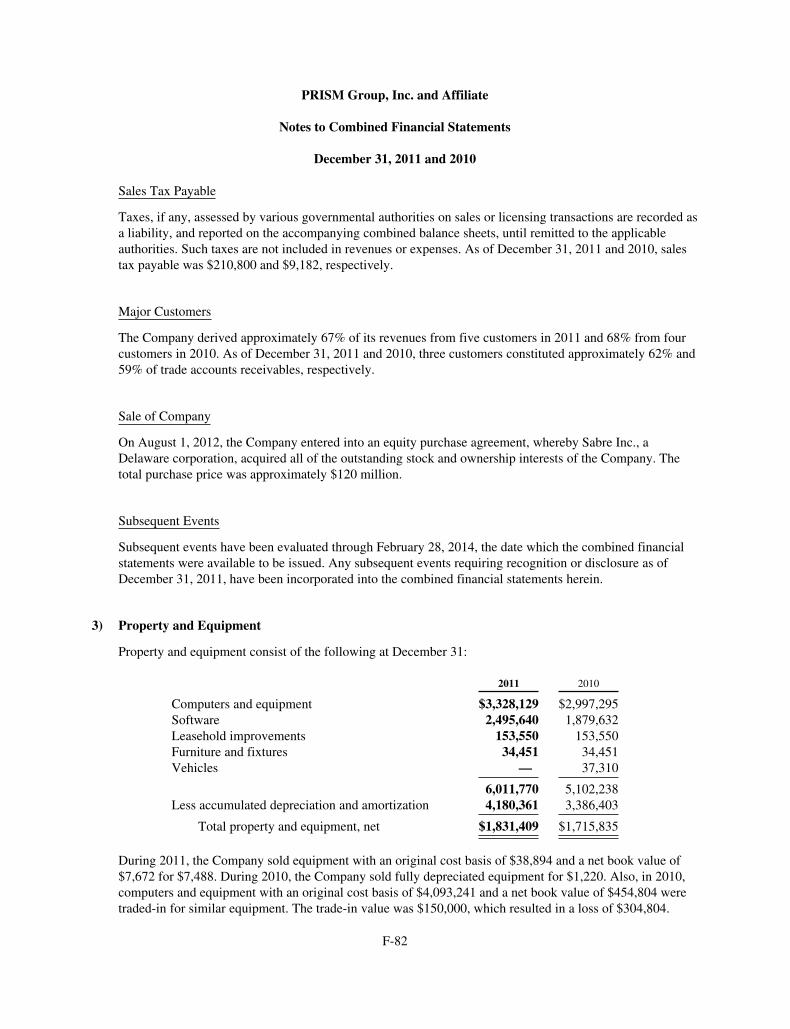
PRISM Group, Inc. and Affiliate
Notes to Combined Financial Statements
December 31, 2011 and 2010
Sales Tax Payable
Taxes, if any, assessed by various governmental authorities on sales or licensing transactions are recorded asa liability, and reported on the accompanying combined balance sheets, until remitted to the applicableauthorities. Such taxes are not included in revenues or expenses. As of December 31, 2011 and 2010, salestax payable was $210,800 and $9,182, respectively.
Major Customers
The Company derived approximately 67% of its revenues from five customers in 2011 and 68% from fourcustomers in 2010. As of December 31, 2011 and 2010, three customers constituted approximately 62% and59% of trade accounts receivables, respectively.
Sale of Company
On August 1, 2012, the Company entered into an equity purchase agreement, whereby Sabre Inc., aDelaware corporation, acquired all of the outstanding stock and ownership interests of the Company. Thetotal purchase price was approximately $120 million.
Subsequent Events
Subsequent events have been evaluated through February 28, 2014, the date which the combined financialstatements were available to be issued. Any subsequent events requiring recognition or disclosure as ofDecember 31, 2011, have been incorporated into the combined financial statements herein.
3) Property and Equipment
Property and equipment consist of the following at December 31:
2011 2010
Computers and equipment $3,328,129 $2,997,295Software 2,495,640 1,879,632Leasehold improvements 153,550 153,550Furniture and fixtures 34,451 34,451Vehicles — 37,310
6,011,770 5,102,238Less accumulated depreciation and amortization 4,180,361 3,386,403
Total property and equipment, net $1,831,409 $1,715,835
During 2011, the Company sold equipment with an original cost basis of $38,894 and a net book value of$7,672 for $7,488. During 2010, the Company sold fully depreciated equipment for $1,220. Also, in 2010,computers and equipment with an original cost basis of $4,093,241 and a net book value of $454,804 weretraded-in for similar equipment. The trade-in value was $150,000, which resulted in a loss of $304,804.
F-82

PRISM Group, Inc. and Affiliate
Notes to Combined Financial Statements
December 31, 2011 and 2010
4) Commitments and Contingencies
Leases
The Company leases its server facility under an operating lease, amended in December 2010 to expire inNovember 2015, with monthly minimum rental payments of $4,664. The Company may extend the lease foran additional five years. Future minimum lease commitments are as follows:
Year ending December 31,2012 $ 55,9682013 55,9682014 55,9682015 51,304
Total minimum payments $219,208
Rent expense for the years ended December 31, 2011 and 2010, including common area maintenance andadditional rent for space in 2010 no longer leased, was $55,968 and $85,056, respectively.
Contingencies
The Company is subject to various claims that arise in the ordinary course of business. Commercialinsurance coverage is purchased to mitigate exposure to certain claims arising from such matters. In theopinion of management, the amount of the ultimate uninsured liability with respect to these actions will notmaterially affect the financial position, results of operations, or liquidity of the Company.
5) Employee Benefit Plan
The Company has a 401(k) defined contribution plan. Full-time employees are eligible to participate and theCompany, at their discretion, may match a percentage of the participant’s contribution. For the years endedDecember 31, 2011 and 2010, the Company’s matching contribution to the plan was $155,000 and$156,611, respectively.
6) Member’s Equity
PRISM Technologies is a single member LLC. Under the terms of the Operating Agreement, the term ofPRISM Technologies is indefinite. Member’s equity includes the sole member’s original investment andcontributions, distributions to the sole member, and as well as PRISM Technologies’ accumulated loss.
F-83

PRISM Group, Inc. and Affiliate
Notes to Combined Financial Statements
December 31, 2011 and 2010
7) Restatements
The accompanying combined financial statements as of and for the years ended December 31, 2010 and2009 have been restated to reflect adjustments made to the Company’s previously issued 2010 combinedfinancial statements. The following tables summarize the impact of the restatements on balances previouslyreported:
As of and for year ended December 31, 2010:
As ReportedIncrease
(Decrease) As Restated
Balance sheetCurrent liabilities:
Deferred revenue (a) $ — $ 1,295,314 $ 1,295,314Compensation accrual (b) 954,873 (343,598) 611,275
Total current liabilities 985,129 951,716 1,936,845
Stockholder’s/member’s equity:Affiliated member’s equity 924,995 63,034 988,029Retained earnings 10,966,057 (1,014,750) 9,951,307Total stockholder’s/member’s equity 11,892,052 (951,716) 10,940,336
Statement of incomeRevenue:
System software-airlines (a) 23,373,758 (922,725) 22,451,033
Expenses:Compensation (b) 7,493,786 (43,422) 7,450,364
Net income 14,619,880 (879,303) 13,740,577
Statement of cash flowsCash flows from operating activities:
Net income 14,619,880 (879,303) 13,740,577Adjustments to reconcile net income to net cash provided
by operating activitiesChanges in assets and liabilities:
Deferred revenue (a) — 922,725 922,725Compensation accrual (b) 94,658 (43,422) 51,236
An explanation of the adjustments is as follows:(a) Adjustment to reduce previously reported revenue(b) Adjustment to adjust over accrual of compensation and related compensation expense
As of and for year ended December 31, 2009:
As ReportedIncrease
(Decrease) As Restated
Balance sheetStockholder’s/member’s equity:Affiliated member’s equity 1,792,703 30,531 1,823,234Retained earnings 9,095,650 (102,944) 8,992,706Total stockholder’s/member’s equity 10,889,353 (72,413) 10,816,940
F-84


Sabre Corporation
Until , 2014 (25 days after the date of this offering), all dealers that effect transactions inthese securities, whether or not participating in this offering, may be required to deliver a prospectus.This is in addition to the dealer’s obligation to deliver a prospectus when acting as an underwriter andwith respect to unsold allotments or subscriptions.
Related Documents