Design and Simulation of a Microturbine Trigeneration System Incorporating Hydraulic Storage and an Inverse Brayton Cycle Written By Matthew Blieske, B.Eng Carleton University Ottawa, Canada A thesis submitted to the Faculty of Graduate Studies and Research in partial fulfilment of the requirements for the degree of Master of Applied Science Ottawa-Carleton Institute of Mechanical and Aeronautical Engineering Carleton University Ottawa, Canada January 2008 © Matthew Blieske 2008

Welcome message from author
This document is posted to help you gain knowledge. Please leave a comment to let me know what you think about it! Share it to your friends and learn new things together.
Transcript
Design and Simulation of a Microturbine
Trigeneration System Incorporating
Hydraulic Storage
and an Inverse Brayton Cycle
Written By
Matthew Blieske, B.Eng
Carleton University
Ottawa, Canada
A thesis submitted to the Faculty of Graduate Studies and Research in partial
fulfilment of the requirements for the degree of
Master of Applied Science
Ottawa-Carleton Institute of Mechanical and Aeronautical Engineering
Carleton University
Ottawa, Canada
January 2008
© Matthew Blieske 2008

1*1 Library and Archives Canada
Published Heritage Branch
395 Wellington Street Ottawa ON K1A0N4 Canada
Bibliotheque et Archives Canada
Direction du Patrimoine de I'edition
395, rue Wellington Ottawa ON K1A0N4 Canada
Your file Votre reference ISBN: 978-0-494-44031-5 Our file Notre reference ISBN: 978-0-494-44031-5
NOTICE: The author has granted a nonexclusive license allowing Library and Archives Canada to reproduce, publish, archive, preserve, conserve, communicate to the public by telecommunication or on the Internet, loan, distribute and sell theses worldwide, for commercial or noncommercial purposes, in microform, paper, electronic and/or any other formats.
AVIS: L'auteur a accorde une licence non exclusive permettant a la Bibliotheque et Archives Canada de reproduire, publier, archiver, sauvegarder, conserver, transmettre au public par telecommunication ou par Plntemet, prefer, distribuer et vendre des theses partout dans le monde, a des fins commerciales ou autres, sur support microforme, papier, electronique et/ou autres formats.
The author retains copyright ownership and moral rights in this thesis. Neither the thesis nor substantial extracts from it may be printed or otherwise reproduced without the author's permission.
L'auteur conserve la propriete du droit d'auteur et des droits moraux qui protege cette these. Ni la these ni des extraits substantiels de celle-ci ne doivent etre imprimes ou autrement reproduits sans son autorisation.
In compliance with the Canadian Privacy Act some supporting forms may have been removed from this thesis.
Conformement a la loi canadienne sur la protection de la vie privee, quelques formulaires secondaires ont ete enleves de cette these.
While these forms may be included in the document page count, their removal does not represent any loss of content from the thesis.
Canada
Bien que ces formulaires aient inclus dans la pagination, il n'y aura aucun contenu manquant.
Abstract
Integrated micro-power systems that can provide electricity, heating and cooling
(i.e. trigeneration) have the potential to provide greater overall efficiencies than
traditional micro-cogeneration power systems with separate cooling devices. With
rising grid power rates, small-scale trigeneration has the potential to be
economically attractive. The majority of trigeneration systems under development
and in use utilize expensive components such as absorption chillers suitable for
medium to large-scale trigeneration, which are not economically suitable for
small-scale applications.
To bring the economic benefit of trigeneration to small-scale users without
incorporating expensive components, an inverted Brayton cycle (IBC) is
employed which makes use of the expander section already present in a
microturbine. A hydraulic accumulator, indirectly charged by a microturbine,
provides pressurized air, which is passed through the expander section of the
microturbine and cooled due to expansion; simultaneously providing power and
cooling flow. As the microturbine is indirectly fired, the flow passing through the
engine or IBC can be directly vented into the household, eliminating the need for
additional heat exchangers.
n
A study was conducted to assess the thermodynamic and economic performance
of the proposed system compared to systems currently used, such as individual
generation provided by an air conditioner, high efficiency natural gas furnace,
and grid power. Simulations were run for a full year based on actual external
temperature, electrical, and thermal loads for a single family detached dwelling
located in Winnipeg, Canada. The output of the microturbine studied is 10 kWe,
suitable for a domestic household, however the system is easily scaled for larger
commercial applications. The majority of the components in the system studied
are off-the-shelf products. Performance data was generated using MATLAB™
while economic performance was determined with time-based simulations
conducted using SIMULINK™. The system allows energy islanding by providing
for all household energy needs throughout the year, however integration with a
power grid is optional. It was found that the operating costs for the proposed
trigeneration system in an energy islanding mode of operation were equivalent to
or less than individual generation (air conditioning unit, natural gas furnace, grid
power) during heating modes of operation, and more expensive for cooling
modes of operation. The yearly energy cost for the trigeneration system
exceeded the total cost of running individual systems by 30 to 48 percent,
however there remains much room for improvement to the trigeneration concept.
All economic data was based upon fair market energy prices found in central
Canada.
iii

Acknowledgments
Writing this thesis has been the highlight of my academic career, and has been
the most challenging, exciting, and rewarding experience of my life. I could not
have achieved the results I did without the guidance and tutelage of my co-
supervisors Dr. Donald Gauthier and Dr. Xiao Huang. My gratitude to you both for
helping to improve me as an engineer, researcher, and writer.
Special thanks to Marianne Manning of the National Research Council Canadian
Centre for Housing Technology in Ottawa, Ontario for providing access to
measured thermal and electrical load data. Gratitude is expressed towards Dr.
Ian Beausoleil-Morrison, Associate Professor and Canada Research Chair at
Carleton University for providing access to ESP-r source code. Financial support
was graciously provided by Dr. John Rogers of Innovative Materials Technology
(IMT).
Finally, I must thank my wife who selflessly shelved her life in Winnipeg to set up
shop in a strange and new land to allow me to pursue my dreams. Any struggles
overcome while completing this work were far surpassed by the trials she was
forced to endure moving away from family and a career. I couldn't have done this
without you.
iv
Table of Contents
Abstract ii Acknowledgments iv Table of Contents v List of Tables viii List of Figures x Nomenclature xvi Acronyms and abbreviations xx
Chapter 1 Introduction 1
1.1. Background 1
1.2. DG, CHP, and CHCP market outlook 4
1.3. Applications of DG, CHP, and CHCP 7 1.3.1. Emergency power 7 1.3.2. Vehicles 9 1.3.3. Energy islanding 12 1.3.4. Peak shaving 14 1.3.5. Process heat and cooling 15
1.4. Small-scale CHP and CHCP technology 16 1.4.1. Reciprocating engines 16 1.4.2. Stirling engines 19 1.4.3. Microturbines 22
1.4.3.1. Available CHP microturbine packages 25 1.4.3.2. High-speed generators 26 1.4.3.3. Zero-lubrication bearings 27 1.4.3.4. SOFC-GT hybrid systems 29
1.4.4. Thermal storage 31
1.5. Thesis objective 34
Chapter 2 CHCP literature review 36
2.1. The motivation behind developing CHCP 36
2.2. Historical application of CHCP 37 2.2.1. Typical cycle profile of current commercial CHCP 38
2.2.1.1. Suitability of VCR and ACR refrigeration for small-scale CHCP....40 2.2.2. Production CHCP packages 45
2.3. Experimental small-scale CHCP systems 45
2.4. Simulated small-scale CHCP systems 48
V
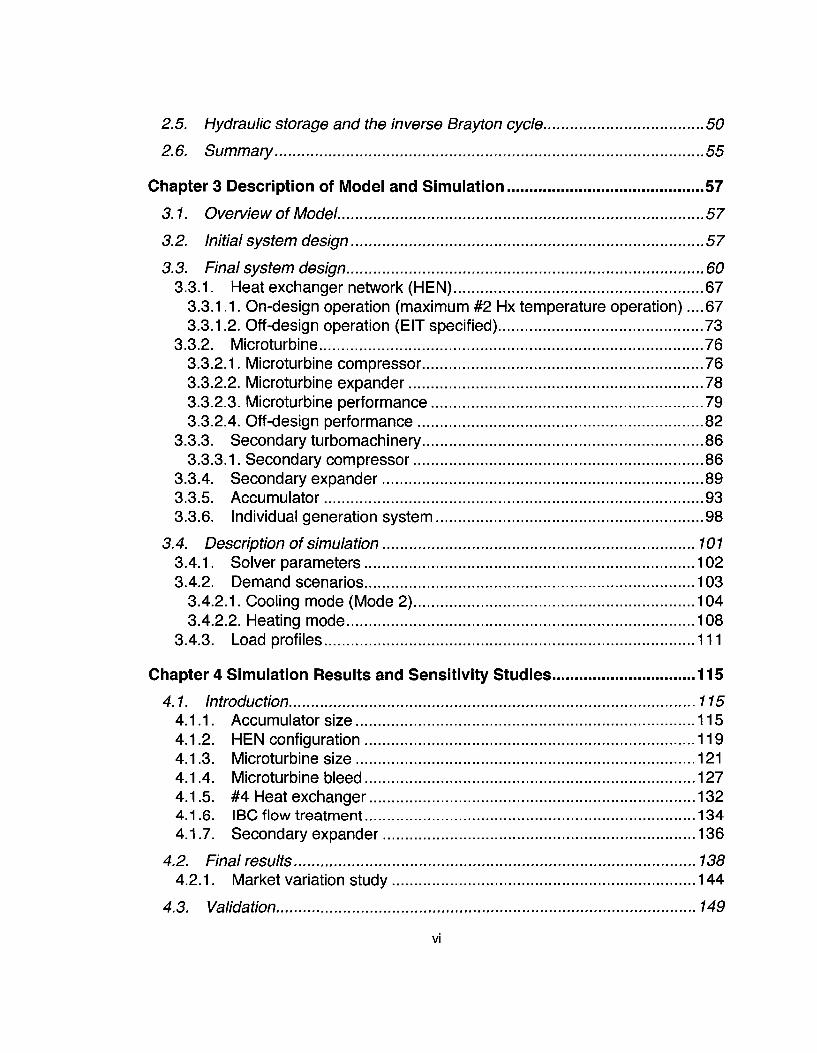
2.5. Hydraulic storage and the inverse Brayton cycle 50
2.6. Summary 55
Chapter 3 Description of Model and Simulation 57
3.1. Overview of Model 57
3.2. Initial system design 57
3.3. Final system design 60 3.3.1. Heat exchanger network (HEN) 67
3.3.1.1. On-design operation (maximum #2 Hx temperature operation) ....67 3.3.1.2. Off-design operation (EIT specified) 73
3.3.2. Microturbine 76 3.3.2.1. Microturbine compressor 76 3.3.2.2. Microturbine expander 78 3.3.2.3. Microturbine performance 79 3.3.2.4. Off-design performance 82
3.3.3. Secondary turbomachinery 86 3.3.3.1. Secondary compressor 86
3.3.4. Secondary expander 89 3.3.5. Accumulator 93 3.3.6. Individual generation system 98
3.4. Description of simulation 101 3.4.1. Solver parameters 102 3.4.2. Demand scenarios 103
3.4.2.1. Cooling mode (Mode 2) 104 3.4.2.2. Heating mode 108
3.4.3. Load profiles 111
Chapter 4 Simulation Results and Sensitivity Studies 115
4.1. Introduction 115 4.1.1. Accumulator size 115 4.1.2. HEN configuration 119 4.1.3. Microturbine size 121 4.1.4. Microturbine bleed 127 4.1.5. #4 Heat exchanger 132 4.1.6. IBC flow treatment 134 4.1.7. Secondary expander 136
4.2. Final results 138 4.2.1. Market variation study 144
4.3. Validation 149
VI
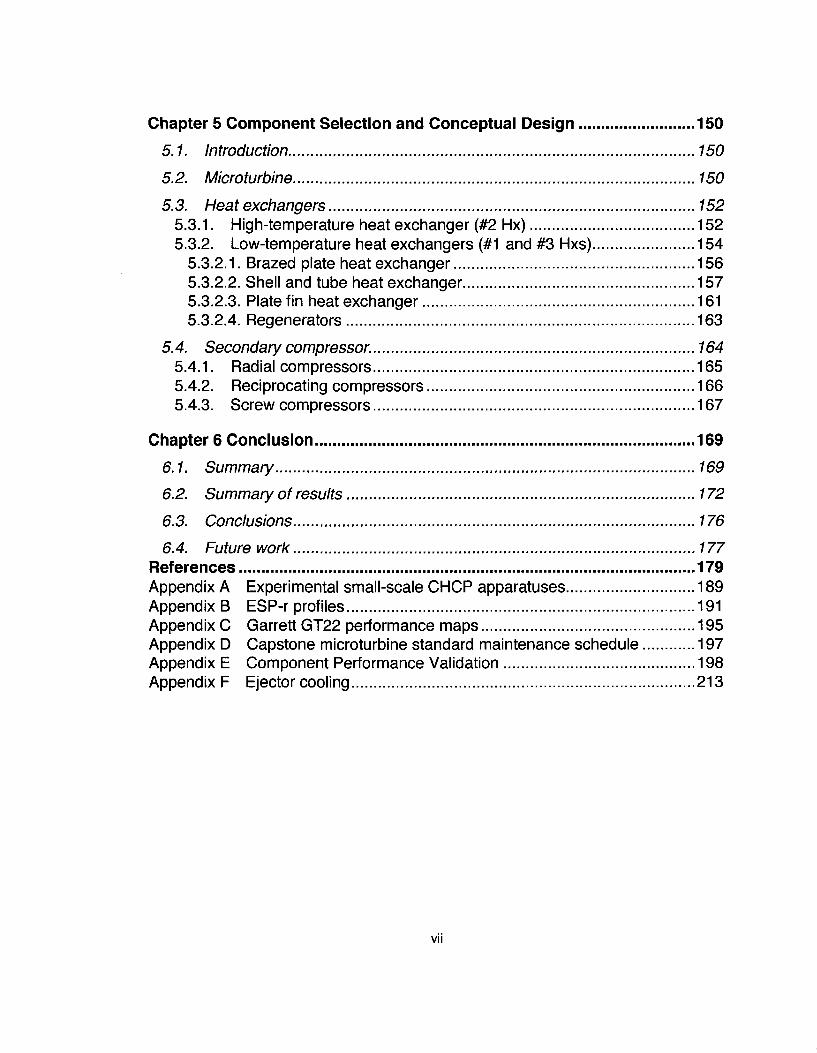
Chapter 5 Component Selection and Conceptual Design 150
5.1. Introduction 750
5.2. Microturbine 150
5.3. Heat exchangers 152 5.3.1. High-temperature heat exchanger (#2 Hx) 152 5.3.2. Low-temperature heat exchangers (#1 and #3 Hxs) 154
5.3.2.1. Brazed plate heat exchanger 156 5.3.2.2. Shell and tube heat exchanger 157 5.3.2.3. Plate fin heat exchanger 161 5.3.2.4. Regenerators 163
5.4. Secondary compressor. 164 5.4.1. Radial compressors 165 5.4.2. Reciprocating compressors 166 5.4.3. Screw compressors 167
Chapter 6 Conclusion 169
6.1. Summary 169
6.2. Summary of results 172
6.3. Conclusions 176
6.4. Future work 177 References 179 Appendix A Experimental small-scale CHCP apparatuses 189 Appendix B ESP-r profiles 191 Appendix C Garrett GT22 performance maps 195 Appendix D Capstone microturbine standard maintenance schedule 197 Appendix E Component Performance Validation 198 Appendix F Ejector cooling 213
VII
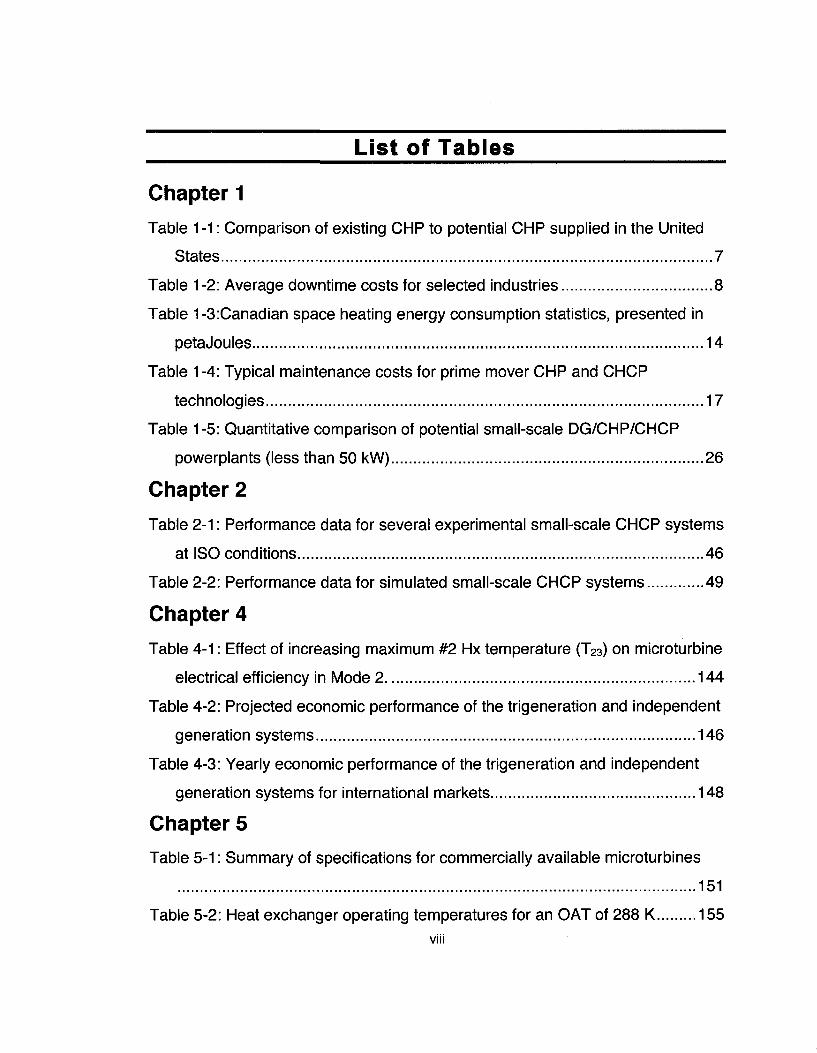
List of Tables
Chapter 1
Table 1-1: Comparison of existing CHP to potential CHP supplied in the United
States 7
Table 1-2: Average downtime costs for selected industries 8
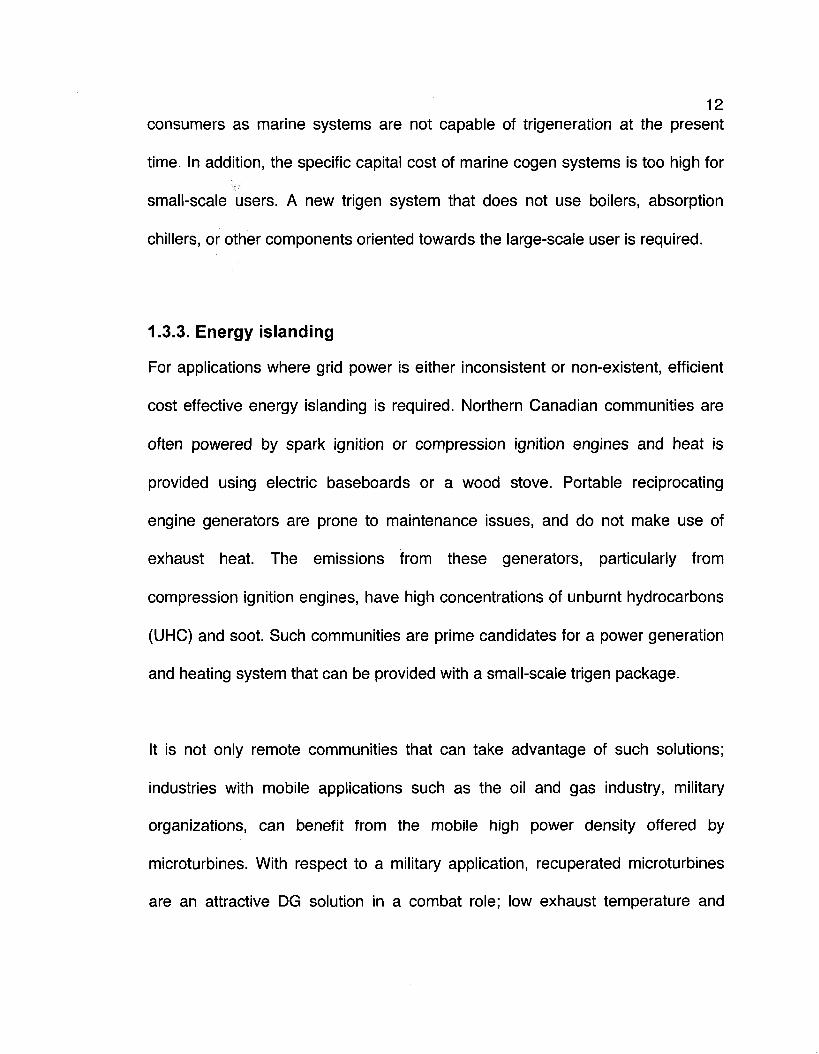
Table 1-3:Canadian space heating energy consumption statistics, presented in
petaJoules 14
Table 1 -4: Typical maintenance costs for prime mover CHP and CHCP
technologies 17
Table 1-5: Quantitative comparison of potential small-scale DG/CHP/CHCP
powerplants (less than 50 kW) 26
Chapter 2
Table 2-1: Performance data for several experimental small-scale CHCP systems
at ISO conditions 46
Table 2-2: Performance data for simulated small-scale CHCP systems 49
Chapter 4
Table 4-1: Effect of increasing maximum #2 Hx temperature (T23) on microturbine
electrical efficiency in Mode 2 144
Table 4-2: Projected economic performance of the trigeneration and independent
generation systems 146
Table 4-3: Yearly economic performance of the trigeneration and independent
generation systems for international markets 148
Chapter 5
Table 5-1: Summary of specifications for commercially available microturbines
151
Table 5-2: Heat exchanger operating temperatures for an OAT of 288 K 155
viii

Appendix E Table E-1: Comparison of design point performance of Mode 1 at standard
atmospheric conditions for several similar microturbine IFGT cycles 206
Table E-2: Comparison of design point performance of Mode 2 at standard
atmospheric conditions for several similar microturbine IFGT cycles 207
IX
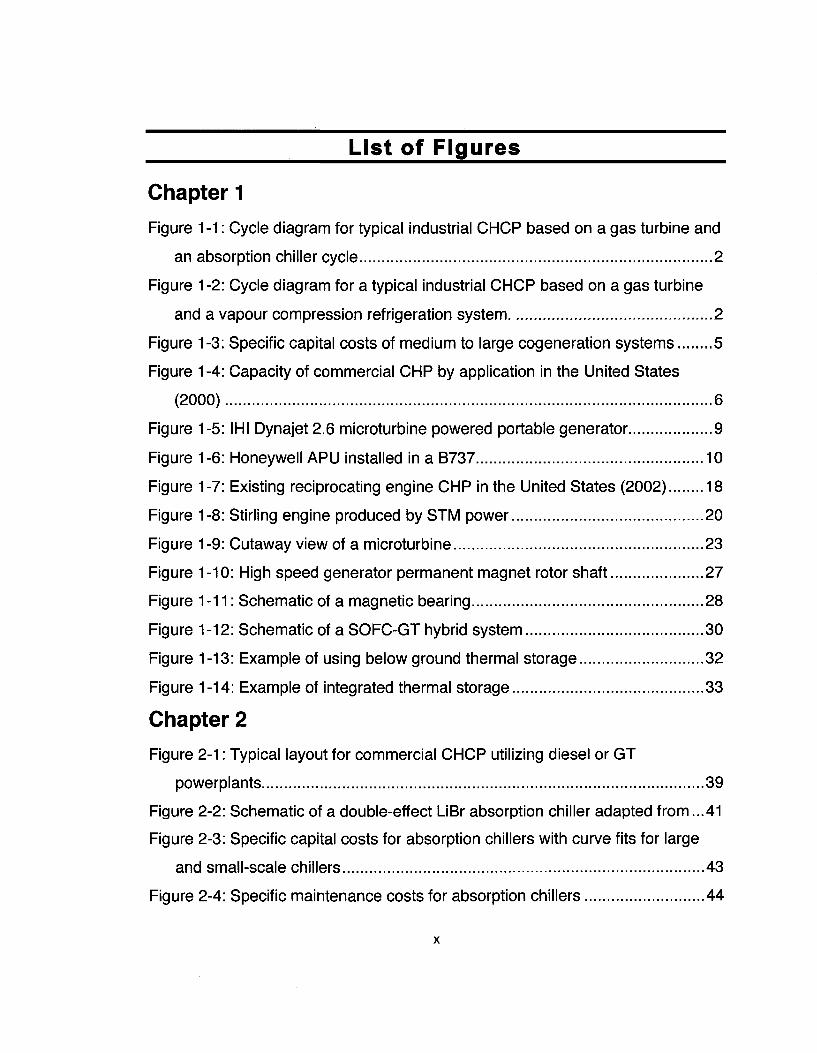
List of Figures
Chapter 1 Figure 1-1: Cycle diagram for typical industrial CHCP based on a gas turbine and
an absorption chiller cycle 2
Figure 1-2: Cycle diagram for a typical industrial CHCP based on a gas turbine
and a vapour compression refrigeration system 2
Figure 1-3: Specific capital costs of medium to large cogeneration systems 5
Figure 1-4: Capacity of commercial CHP by application in the United States
(2000) 6
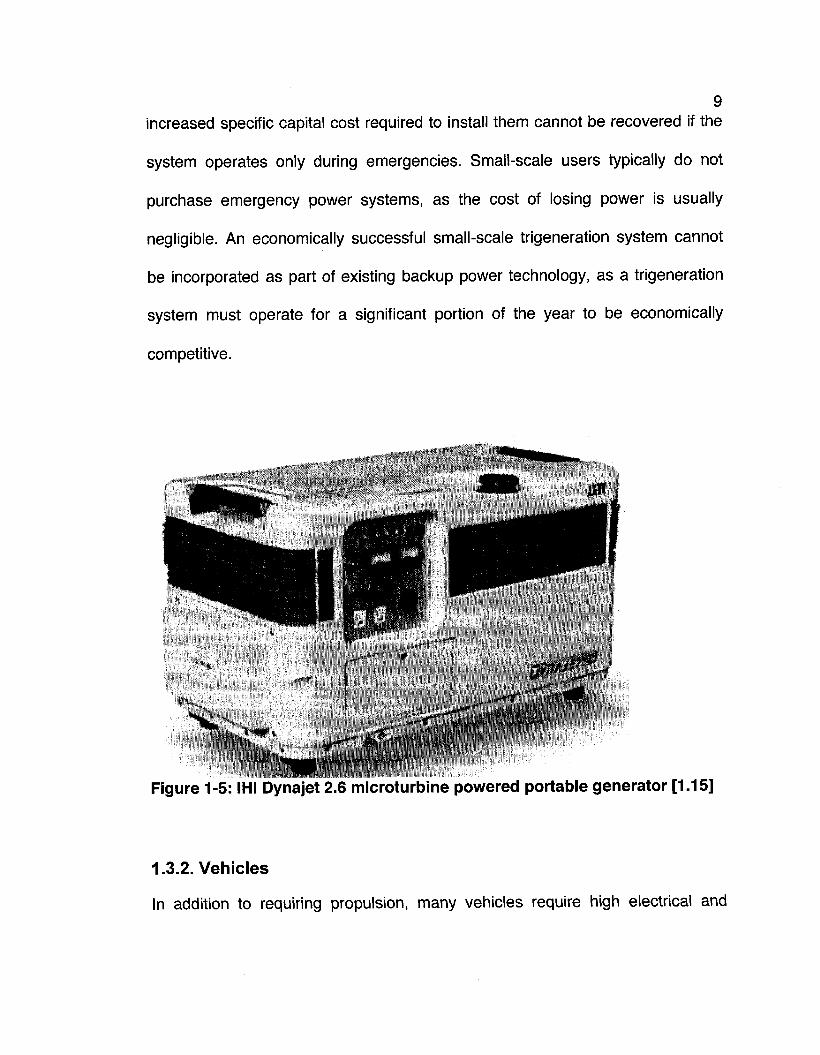
Figure 1-5: IHI Dynajet2.6 microturbine powered portable generator 9
Figure 1-6: Honeywell APU installed in a B737 10
Figure 1-7: Existing reciprocating engine CHP in the United States (2002) 18
Figure 1-8: Stirling engine produced by STM power 20
Figure 1-9: Cutaway view of a microturbine 23
Figure 1-10: High speed generator permanent magnet rotor shaft 27
Figure 1-11: Schematic of a magnetic bearing 28
Figure 1-12: Schematic of a SOFC-GT hybrid system 30
Figure 1-13: Example of using below ground thermal storage 32
Figure 1-14: Example of integrated thermal storage 33
Chapter 2 Figure 2-1: Typical layout for commercial CHCP utilizing diesel or GT
powerplants 39
Figure 2-2: Schematic of a double-effect LiBr absorption chiller adapted from ...41
Figure 2-3: Specific capital costs for absorption chillers with curve fits for large
and small-scale chillers 43
Figure 2-4: Specific maintenance costs for absorption chillers 44
X
Figure 2-5: Schematic of an IBC refrigeration system designed for use in road
transport applications 52
Figure 2-6: IBC applied to building heating and cooling 54
Chapter 3
Figure 3-1: Original trigeneration system design 59
Figure 3-2: Schematic of trigeneration system in heating mode (Mode 1) 63
Figure 3-3: Schematic of trigeneration system in cooling mode (Mode 2) 64
Figure 3-4: T-s diagram for the IBC in heating mode 65
Figure 3-5: T-s diagram for the IBC in cooling mode 66
Figure 3-6: Mode 1 on-design decision chart 69
Figure 3-7: Mode 2 on-design decision chart 69
Figure 3-8: Mode 1 off-design decision chart 74
Figure 3-9: Mode 2 off-design decision chart 74
Figure 3-10: Microturbine compressor decision chart 77
Figure 3-11: Microturbine expander decision chart 79
Figure 3-12: Microturbine performance decision chart 81
Figure 3-13: Microturbine off-design decision chart 83
Figure 3-14: Off-design performance of the microturbine compressor and
expander normalized by design point values 84
Figure 3-15: Secondary compressor decision chart 87
Figure 3-16: Isentropic efficiency as a function of power input for the secondary
compressor 89
Figure 3-17: Secondary expander decision chart 91
Figure 3-18: Secondary expander load following decision tree 92
Figure 3-19: Off-design operating line for secondary expander 93
Figure 3-20: Accumulator decision chart 95
Figure 3-21: Independent generation decision chart 100
Figure 3-22: Process logic chart for cooling control 106
xi
Figure 3-23: Flow chart for heating control logic 110
Figure 3-24: Geometry used in ESP-rto model thermal loads 111
Figure 3-25: Sample of loads estimated using ESP-r 114
Chapter 4
Figure 4-1: Accumulator behaviour in Mode 1 for low load conditions 116
Figure 4-2: Accumulator behaviour in Mode 1 for high-load conditions 116
Figure 4-3: Accumulator behaviour in Mode 2 for low-load conditions 117
Figure 4-4: Accumulator behaviour in Mode 2 for high-load conditions 118
Figure 4-5: Comparison of thermal efficiency and SFC performance from full
power to synchronous idle for HEN Mode 1 and Mode 2 configurations at
standard ambient conditions of 101.325 kPaand288K 120
Figure 4-6: Effect of microturbine size on system behaviour. Operating costs,
accumulator temperature, and pressure compared for three different
microturbine sizes while satisfying a heating load (Mode 1) 123
Figure 4-7: Household temperature response for three different microturbine
sizes while satisfying a heating load (Mode 1) 124
Figure 4-8: Effect of microturbine size on system behaviour. Operational costs
including accumulator temperature and pressure are compared for three
different microturbine sizes while satisfying a cooling load (Mode 2) 125
Figure 4-9: Household temperature response for three different microturbine
sizes while satisfying a cooling load (Mode 2) 126
Figure 4-10: Fuel costs for Mode 1 (heating load), comparison is made between
microturbine operation with compressor bleed versus using a secondary
compressor 128
Figure 4-11: Household setpoint deviation using microturbine bleed flow to
charge the accumulator while satisfying a cooling load 129
Figure 4-12: Variation in accumulator charging flows with household electrical
load for various ambient temperatures 130
xii
Figure 4-13: Fuel and purchased grid power costs for trigeneration operation with
and without #4 Hx in Mode 1 and Mode 2 modes of operation 133
Figure 4-14: Trigeneration system economic performance with and without
increasing EIT 135
Figure 4-15: Ratio of electrical to thermal output of the IBC expander at maximum
HEN firing temperature T23 = 1200 K (EIT =1163 K) 137
Figure 4-16: Yearly consumption of electricity and natural gas for the
trigeneration and independent generation systems 140
Figure 4-17: Monthly operating cost comparison between the trigeneration and
independent generation systems 141
Figure 4-18: Yearly cost comparison between the trigeneration and independent
generation systems 145
Figure 4-19: Historical and projected household natural gas and electricity prices
146
Chapter 5 Figure 5-1: Special design for microturbine powertrain 152
Figure 5-2: Directly fired heat exchanger fabricated by Selas Fluid for the oil and
gas industry 154
Figure 5-3: Illustration of alternating fluid pattern for a three fluid BPHE 156
Figure 5-4: Graphical summary of TEMA fabrication specifications 159
Figure 5-5: Cross section cutaway of a straight tube and U-tube STHE 160
Figure 5-6: Cutaway view of a PFHE in cross-flow and counter-flow 162
Figure 5-7: A rotating matrix regenerator 164
Figure 5-8: Radial compressor (foreground) and axial turbine from a compression
ignition turbocharger 165
Figure 5-9: Cutaway view of a screw compressor used in a high-performance
supercharger 168
xiii
Appendices Figure A-1: Experimental CHCP using a VCR unit 189
Figure A-2: Experimental CHCP using an ACR unit 190
Figure A-3: Experimental CHCP using an ACR unit 190
Figure B-4: Typical Canadian ground temperature profile imposed on exterior of
ground surface of 1st floor 191
Figure B-5: Occupant driven gains for 1st floor of ESP-r model 192
Figure B-6: Occupant driven gains for 2nd floor of ESP-r model 192
Figure B-7: Lighting gains for 1st floor of ESP-r model 193
Figure B-8: Lighting gains for 2nd floor of ESP-r model 193
Figure B-9: Equipment gains for 1st floor of ESP-r model 194
Figure B-10: Lighting gains for 2nd floor of ESP-r model 194
Figure C-11: Compressor map for the Garrett GT22 series turbocharger 195
Figure C-12: Expander map for the Garrett GT22 series turbocharger 196
Figure D-1: Excerpt from Capstone Turbines scheduled maintenance work
instructions for the 60 kWe C60 and C65 models 197
Figure E-1: Experimental accumulator apparatus 198
Figure E-2: Comparison of modelled accumulator (n=1.2) and experimental
results during discharge 199
Figure E-3: Comparison of modelled accumulator (n=1) and experimental results
while charging 200
Figure E-4: The effect of heat transfer on modelled accumulator behaviour with
zero flow 201
Figure E-5: Schematic of the bio-IFGT system fuelled by low heating value bio-
fuels 204
Figure E-6: Schematic of the IFGT-Rec-Rec system 208
Figure E-7: Comparison of output from GASTURB™ and the in-house model for
Mode 1 for various ambient temperatures 209
xiv

Figure E-8: Comparison of output from GASTURB™ and the in-house model in
Mode 2 for various ambient temperatures 210
Figure E-9: Power as a function of RPM for the VMXa037R screw compressor at
ISO standard atmosphere, digitized from sample maps [E.4] 211
Figure E-10: Flow rate as a function of RPM for the VMXa037R screw
compressor at ISO standard atmosphere, digitized from sample maps 212
Figure E-11: Isentropic efficiency curves for lines of constant pressure rise for the
VMXa037R compressor 212
Figure F-1: Schematic of an ejector cooling cycle as part of a CHCP system ..213
Figure F-2: Cross-section of an ejector 214
XV
Nomenclature A
cyi surface area of cylindrical portion of accumulator
A
w surface area of spherical portion of accumulator
COP Coefficient of Performance
COPmm Coefficient of Performance at ARI test conditions Cpa specific heat of air
h accumulator total free convective heat transfer coefficient
he,in heat exchanger cold stream in
^c,out heat exchanger cold stream out
h [ heat transfer coefficient for cylindrical portion of accumulator
hh household ambient enthalpy
"•H,in heat exchanger hot stream in
H ,out heat exchanger cold stream out
hin accumulator inlet enthalpy
hout accumulator outlet enthalpy
htn heat transfer coefficient for spherical portion of accumulator
m microturbine mass flow
xvi
m corrected microturbine compressor mass flow
macc accumulator total air mass
mc heat exchanger cold side mass flow
mc2 secondary compressor mass flow
me expander mass flow
me2 secondary expander mass flow
m'e corrected expander mass flow
m, specific fuel mass flow
natural gas furnace fuel mass flow f f
mH heat exchanger hot side mass flow
mh mass of air in thermally controlled volume of dwelling
min accumulator inlet mass flow
mout accumulator outlet mass flow
Pa ambient pressure
accumulator pressure
Q microturbine thermal output
Qacc accumulator thermal output
xvii
Qe2 secondary expander thermal output
Qh household thermal load
Q'acc accumulator heat loss
R universal gas constant
Ta outside air temperature
Tacc accumulator bulk fluid temperature
Tground ground temperature
Tin #4 Hx inlet temperature
"max maximum #2 Hx operating temperature
T M m ambient temperature at ARI test conditions
Tout # 4 H x e x i t temperature
Ts accumulator external surface temperature
7^ household ambient temperature
ux control volume internal energy at previous timestep
u2 control volume internal energy at current timestep
V accumulator volume
V secondary compressor volumetric flow rate
W microturbine electrical output
XVIII
Wac air conditioner work input
Wc2 secondary compressor electrical input
We2 secondary expander electrical output
Wh household electrical load
A P t o heat exchanger pressure loss
£ HEN heat exchanger effectiveness
£ 4 #4 Hx effectiveness
Tjc compressor isentropic efficiency
T]c2 secondary compressor isentropic efficiency
7lcomb combustion efficiency
T]f natural gas furnace efficiency
7]m mechanical efficiency
T]e expander isentropic efficiency
T]e2 expander isentropic efficiency
XIX

Acronyms and abbreviations
ACR
APU
ARI
BPHE
CAD
CAES
CHCP
CHP
Cogen
COP
CPR
DG
EPR
FOD
GHG
GT
HEN
HRSG
Hx
IBC
Absorption Chiller Refrigeration
Auxiliary Power Unit
Air-Conditioning and Refrigeration Institute
Brazed Plate Heat Exchanger
Canadian funds
Compressed Air Energy Storage
Combined Heat Cooling and Power
Combined Heat and Power
Cogeneration
Coefficient of Performance
Compressor Pressure Ratio
Distributed Generation
Expander Pressure Ratio
Foreign Object Damage
Greenhouse gases
Gas Turbine
Heat Exchanger Network
Heat Recovery Steam Generator
Heat exchanger
Inverse Brayton Cycle
XX
ICE
IFGT
ISO
kWe
kWt
LHV
Li Br
MCFC
MWe
PFHE
PR
RSI
SMMT
SOFC
SOFC-GT
STHE
STP
TELR
TIT
Trigen
UPS
Internal Combustion Engine
Indirectly Fired Gas Turbine
International Standards Organization
kilowatts electrical power output
kilowatts thermal output
Lower Heating Value
lithium bromide
Molten Carbonate Fuel Cell
megawatt electrical power output
Plate fin Heat Exchanger
Pressure ratio
R-value Systeme International
Setpoint Min-to-Max Time
Solid Oxide Fuel Cell
Solid Oxide Fuel Cell - Gas Turbine
Shell and Tube Heat Exchanger
Standard Temperature and Pressure
Thermal-to-Electrical Load Ratio
Turbine (Expander) Inlet Temperature
Trigeneration
Uninterruptible Power Supply
XXI

VCR Vapour Compression Refrigerator
XXII
Chapter 1 Introduction
1.1. Background
Often interesting and useful technologies are never fully explored due to
unfavourable market conditions. This was especially true for energy conversion
innovation, as the cost of improvements to cycle efficiencies had to compete with
long payback periods due to low energy prices. This has changed with recent
increases in fuel prices and projected shortages of natural gas in the near future.
Value-added technologies such as cogeneration that offer multiple energy
products have received greater attention and acceptance through validation and
operation in industrial environments. Improvements to energy conversion
efficiencies were initially the concern of large businesses, however these
concepts have drawn the interest of small-scale users as well. There is an
interesting opportunity to bring value-added energy solutions to the general
consumer, one such technology that shows promise is trigeneration (also known
as trigen or combined heat, cooling, and power (CHCP)). Typical trigeneration
systems currently found in industry use either a vapour compression cycle or an
absorption chiller (ACR) [1.1][1.22][1.45], as illustrated in Figure 1-1 and Figure
1-2. As such systems require installation of a refrigeration unit in addition to a
heat recovery steam generator (HRSG), the specific capital cost requirements
1
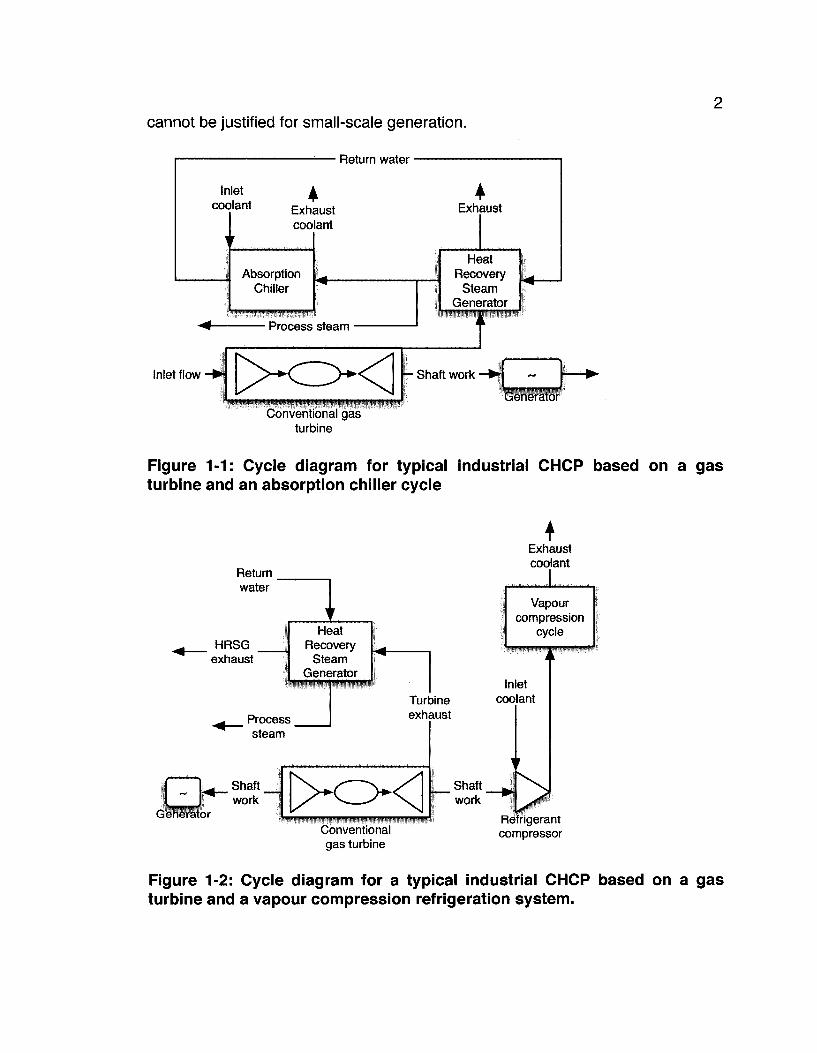
cannot be justified for small-scale generation.
Return water
Exhaust
Process steam
Heat Recovery
Steam Generator
Inlet flow •
Conventional gas turbine
Figure 1-1: Cycle diagram for typical industrial CHCP based on a gas turbine and an absorption chiller cycle
Return water
HRSG exhaust
Heat Recovery
Steam Generator
Process steam
HnHMH
Shaft work
« ^ l l ^ R r
Turbine exhaust
Iniet coolant
Shaft work
Conventional gas turbine
Refrigerant compressor
Figure 1-2: Cycle diagram for a typical industrial CHCP based on a gas turbine and a vapour compression refrigeration system.

3 To introduce trigeneration to the small-scale consumer, a cycle that eliminates
the need for expensive subsystems is required. Another key factor contributing to
an increasing interest in distributed generation (DG), cogeneration and
trigeneration (CHP and CHCP) for the small-scale consumer is the unreliable
nature of many power grid systems. As power utilities in major urban centres
such as Southern California and the Eastern United States seaboard continue to
operate close to grid capacity, brownouts and blackouts will most likely become
more frequent. A number of companies with sensitive financial and identity data
such as CitiBank and JP Morgan have already installed emergency backup
power systems [1.30]. However for a small-scale consumer, the overhead
involved in purchasing and operating a backup power system is often too high.
Combining power generation with cooling and/or heating load production is most
likely the only way such a system can be economically attractive to small-scale
customers.
Increasing demand for legislation focused on reducing greenhouse gases has
resulted in favourable environments for DG and CHP in many regions nations
around the world. California, Texas and most European countries have created
cash incentives for cogen systems that demonstrate a reduction in controlled
emissions over conventional energy systems, and meet target thermal
efficiencies [1.4]. By rewarding efficient cogen systems with cash incentives,
4 small-scale DG becomes more economically attractive. While legislation does not
cover trigeneration systems at present, it is anticipated this will change as trigen
market penetration increases.
1.2. DG, CHP, and CHCP market outlook
In North America, power is provided by a few utilities that, in many cases, enjoy
regional monopolies. This proves to be a significant deterrent for distributed
power, as electric utilities have traditionally made it hard or impossible for excess
DG power to be sold back to the grid. Looming shortfalls in grid power supply in
major urban centres along the North American coasts motivated local
governments to put pressure on major utilities to begin creating favourable
environment for distributed power generation [1.31]. In addition to reducing load
on the main grid, it has been suggested that DG has the potential to not only
provide stability via decentralization, but to improve power quality and
transmission efficiency [1.5]. With regulatory roadblocks falling away, and current
micro-generation technology sufficiently developed for commercial and industrial
implementation, it is anticipated small-scale DG, CHP, and CHCP will achieve
greater market penetration.
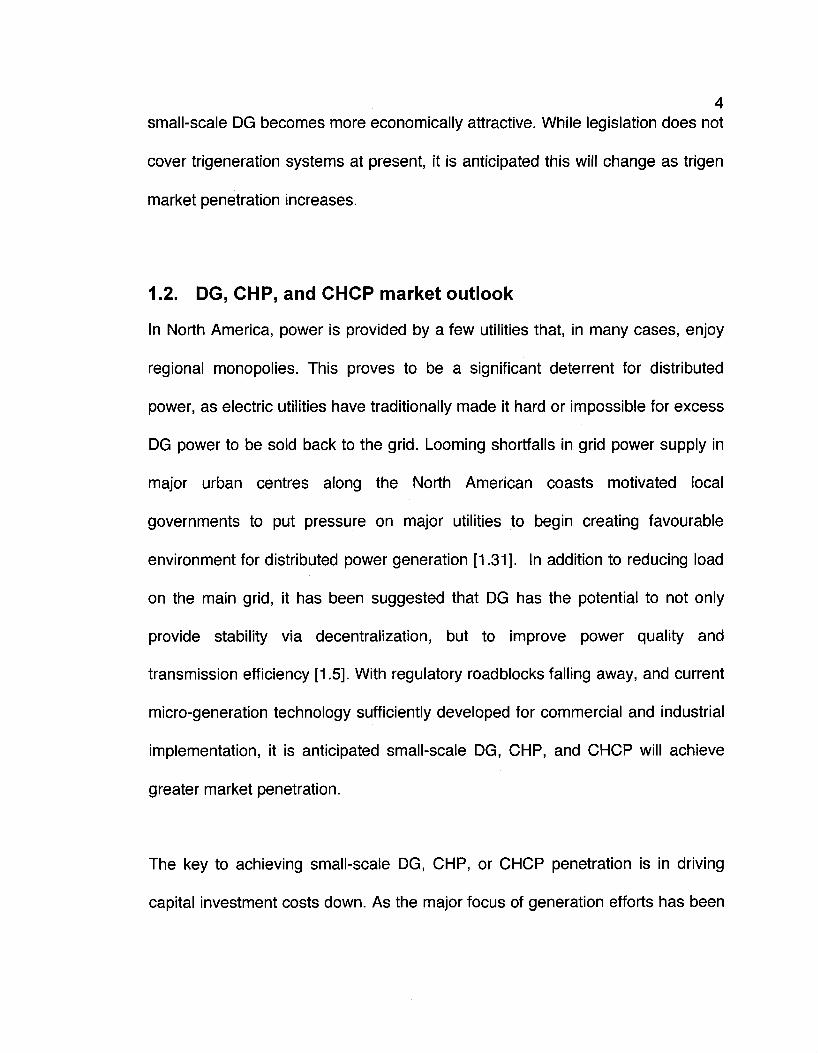
The key to achieving small-scale DG, CHP, or CHCP penetration is in driving
capital investment costs down. As the major focus of generation efforts has been
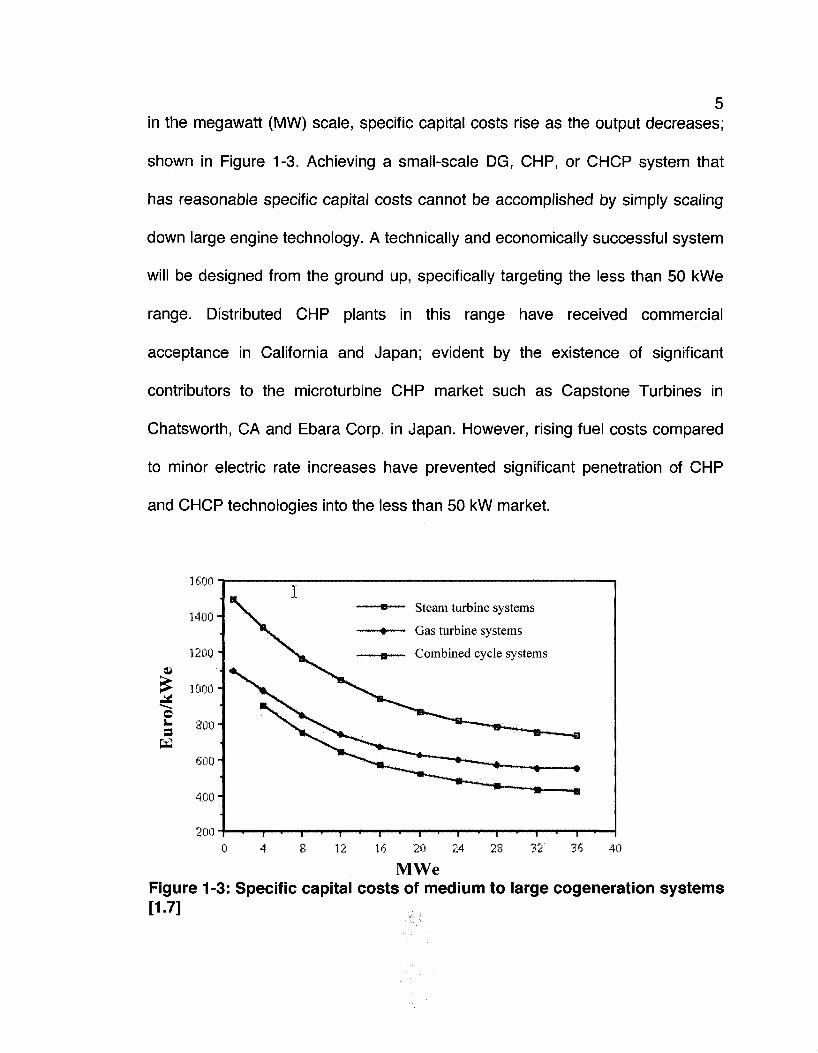
5 in the megawatt (MW) scale, specific capital costs rise as the output decreases;
shown in Figure 1-3. Achieving a small-scale DG, CHP, or CHCP system that
has reasonable specific capital costs cannot be accomplished by simply scaling
down large engine technology. A technically and economically successful system
will be designed from the ground up, specifically targeting the less than 50 kWe
range. Distributed CHP plants in this range have received commercial
acceptance in California and Japan; evident by the existence of significant
contributors to the microturbine CHP market such as Capstone Turbines in
Chatsworth, CA and Ebara Corp. in Japan. However, rising fuel costs compared
to minor electric rate increases have prevented significant penetration of CHP
and CHCP technologies into the less than 50 kW market.
1
Eur
o-
1600 -
1400-
1200"
o
800-
600-
400"
200-0 4 8 12 16 20 24 28 32 36 40
MWe Figure 1-3: Specific capital costs of medium to large cogeneration systems [1-7]
Steam turbine systems
Gas turbine systems
Combined cycle systems
1,600 -
1,400
* 1,200
"5 1,000 CO a. « u •o 0)
c
800
600 --H
400
200
0
,414.0
954.7
619.3
491.4 378.3
n ™4 ire 4 i ^ 3 14^1347
M 1 Q El n ri 3°2 142 10J 3'8 3'3 I.8 3.3 1.4 1.2 0.3 T r
,0 0> of
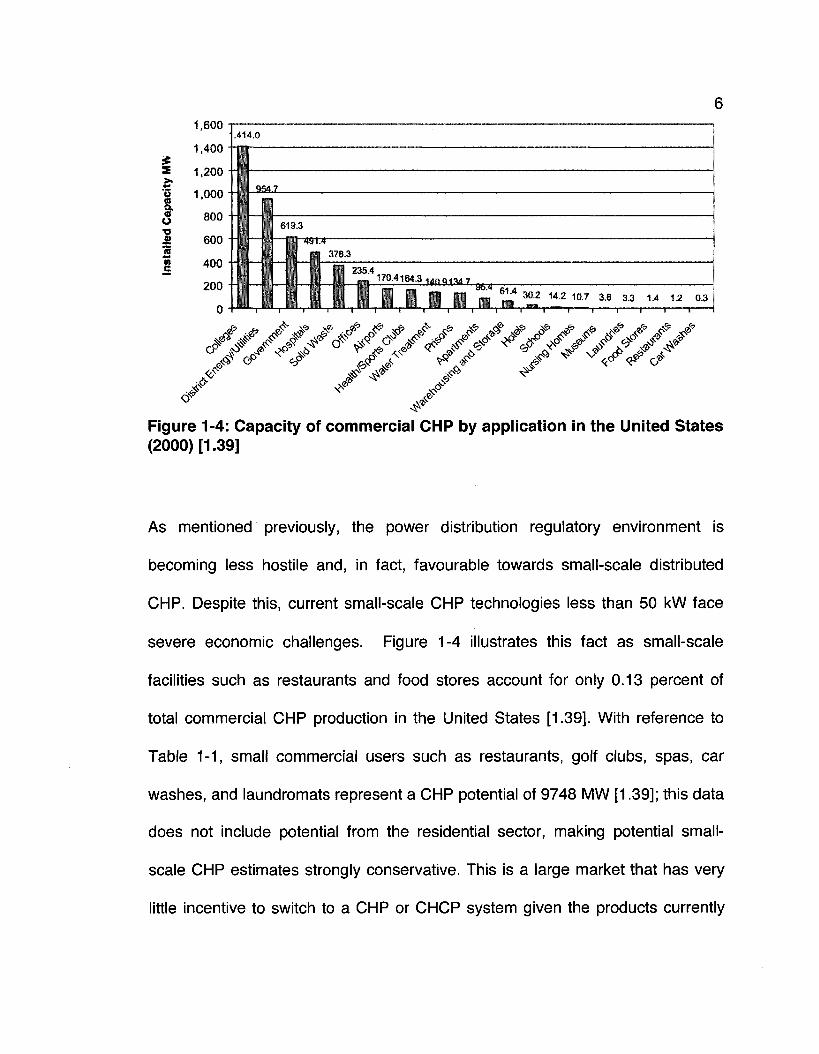
Figure 1-4: Capacity (2000) [1.39]
of commercial CHP by application in the United States
As mentioned previously, the power distribution regulatory environment is
becoming less hostile and, in fact, favourable towards small-scale distributed
CHP. Despite this, current small-scale CHP technologies less than 50 kW face
severe economic challenges. Figure 1-4 illustrates this fact as small-scale
facilities such as restaurants and food stores account for only 0.13 percent of
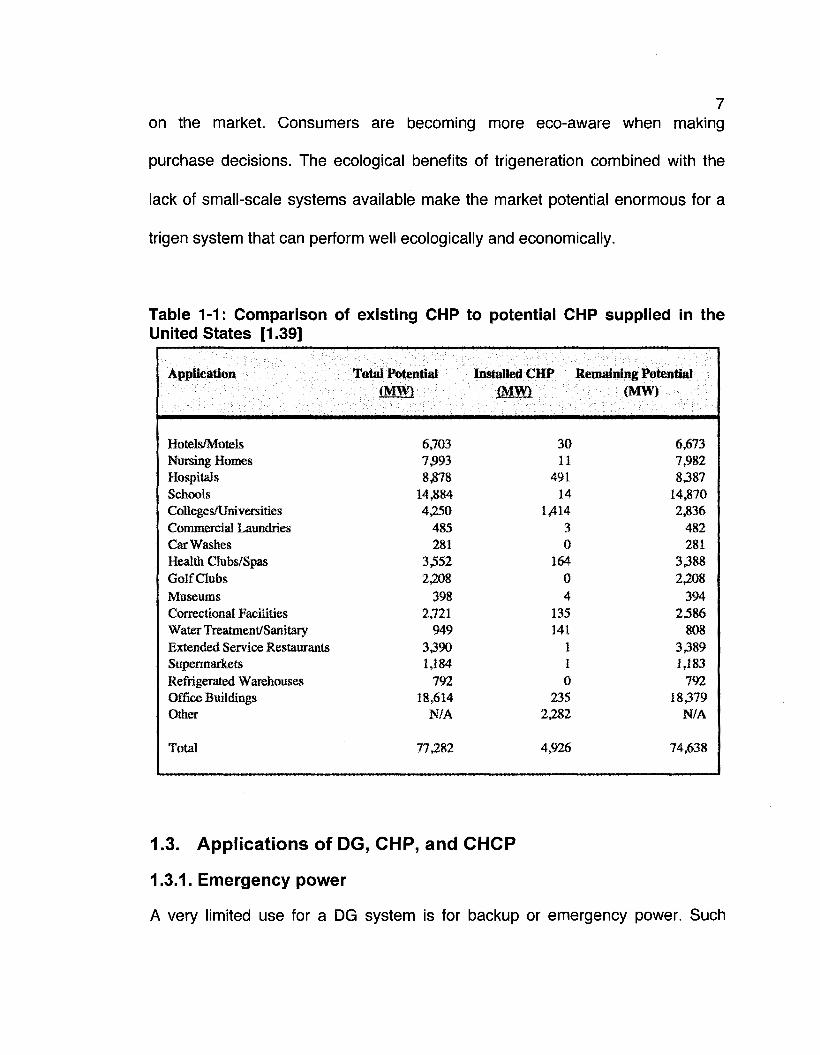
total commercial CHP production in the United States [1.39]. With reference to
Table 1-1, small commercial users such as restaurants, golf clubs, spas, car
washes, and laundromats represent a CHP potential of 9748 MW [1.39]; this data
does not include potential from the residential sector, making potential small-
scale CHP estimates strongly conservative. This is a large market that has very
little incentive to switch to a CHP or CHCP system given the products currently
7 on the market. Consumers are becoming more eco-aware when making
purchase decisions. The ecological benefits of trigeneration combined with the
lack of small-scale systems available make the market potential enormous for a
trigen system that can perform well ecologically and economically.
Table 1-1: Comparison of existing CHP to potential CHP supplied in the United States [1.39]
Application Total Potential Installed CHP Remaining Potential (MW) (MW) (MW)
Hotels/Motels Nursing Homes Hospitals Schools Colleges/Universities Commercial Laundries Car Washes Health Clubs/Spas Golf Clubs Museums Correctional Facilities Water Treatment/Sanitary Extended Service Restaurants Supermarkets Refrigerated Warehouses Office Buildings Other
Total
6,703 7,993 8378
14,884 4,250
485 281
us «fc/**/ati*
2^08 398
2,721 949
3390 1,184
792 18,614
N/A
77,282
30 11
491 14
1,414 3 0
164 0 4
135 141
1 1 0
235 JffJLoJ.
4,926
6,673 7,982 8387
14,870 2,836
482 281
3388 2208
394 2,586
808 3389 1,183
792 18379
N/A
74,638
1.3. Applications of DG, CHP, and CHCP
1.3.1. Emergency power
A very limited use for a DG system is for backup or emergency power. Such
8 systems have been sold on both large and small scales for decades; typically
small-scale units have been restricted to spark ignition or compression ignition
engines while larger units have made use of gas turbine generator sets. IHI corp.
located in Japan has drawn on Japanese microturbine expertise to produce a
mobile 2.6 kW microturbine emergency generator seen in Figure 1 -5.
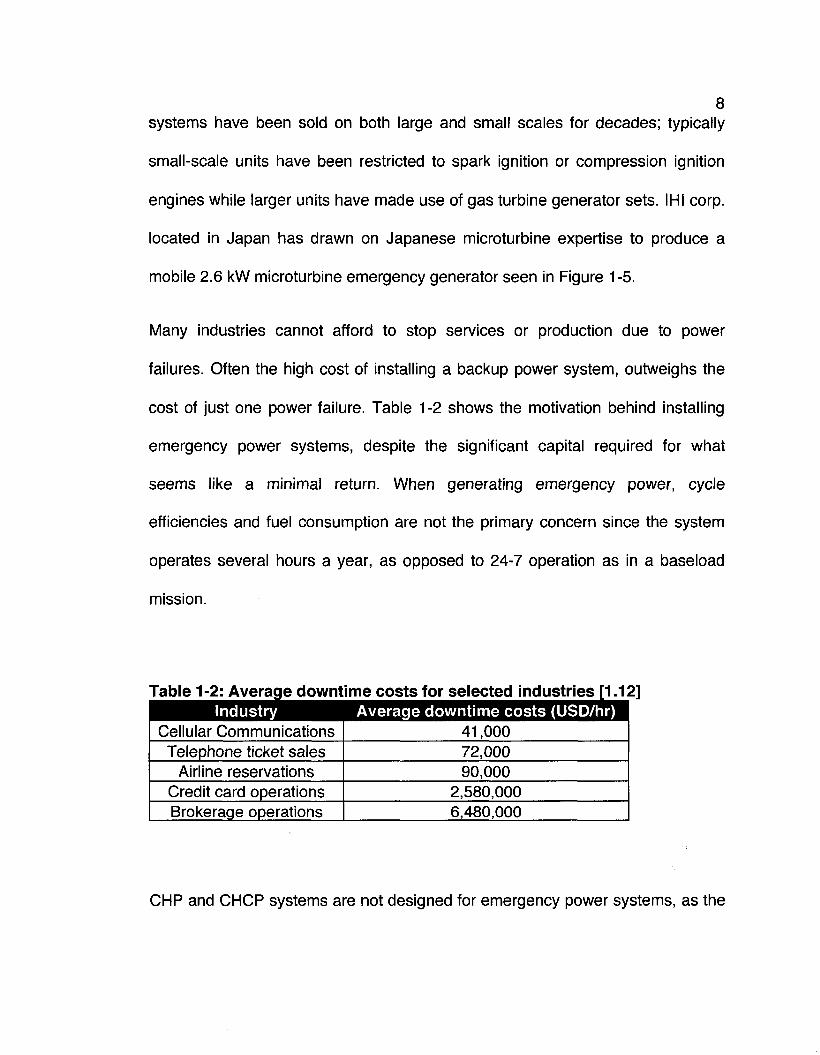
Many industries cannot afford to stop services or production due to power
failures. Often the high cost of installing a backup power system, outweighs the
cost of just one power failure. Table 1-2 shows the motivation behind installing
emergency power systems, despite the significant capital required for what
seems like a minimal return. When generating emergency power, cycle
efficiencies and fuel consumption are not the primary concern since the system
operates several hours a year, as opposed to 24-7 operation as in a baseload
mission.
Table 1-2: Average downtime costs for selected industries [1.12] Industry Average downtime costs (USD/hr)
Cellular Communications Telephone ticket sales
Airline reservations Credit card operations Brokerage operations
41,000 72,000 90,000
2,580,000 6,480,000
CHP and CHCP systems are not designed for emergency power systems, as the
increased specific capital cost required to install them cannot be recovered if the
system operates only during emergencies. Small-scale users typically do not
purchase emergency power systems, as the cost of losing power is usually
negligible. An economically successful small-scale trigeneration system cannot
be incorporated as part of existing backup power technology, as a trigeneration
system must operate for a significant portion of the year to be economically
competitive.
•r
vmf%
mm
L U
imw Figure 1-5: IHI Dynajet 2.6 microturbine powered portable generator [1.15]
1.3.2. Vehicles
In addition to requiring propulsion, many vehicles require high electrical and
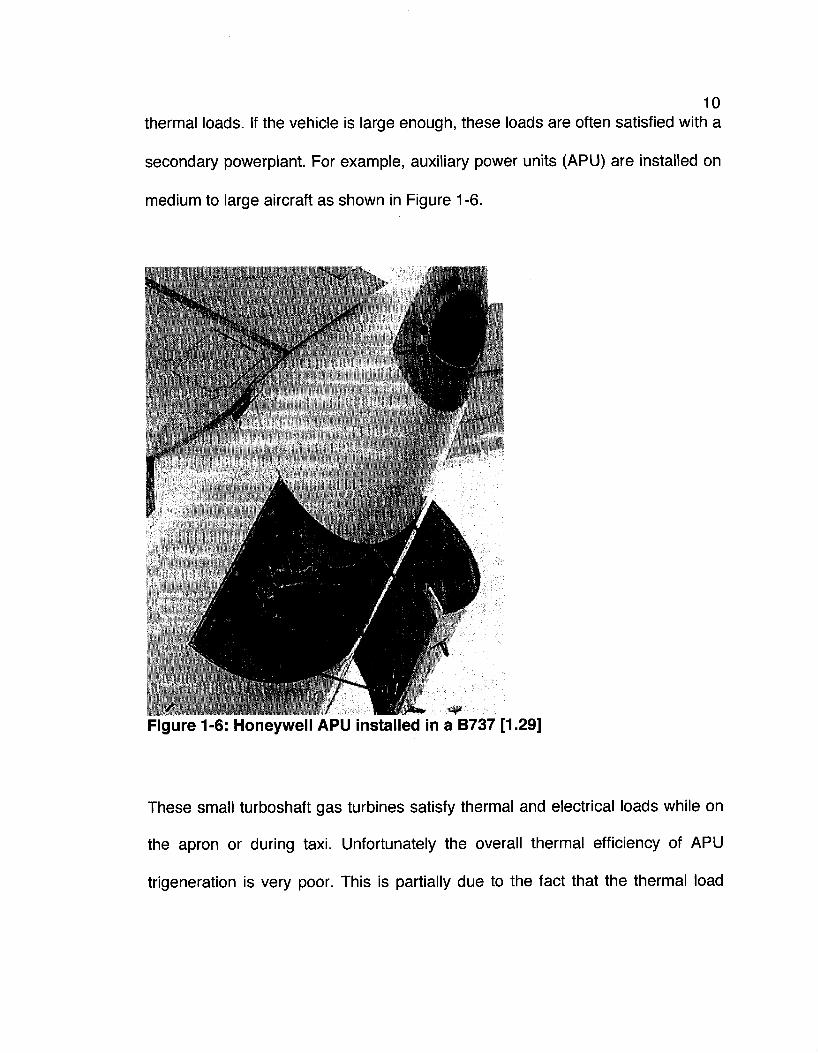
10 thermal loads. If the vehicle is large enough, these loads are often satisfied with a
secondary powerplant. For example, auxiliary power units (APU) are installed on
medium to large aircraft as shown in Figure 1 -6.
Figure 1-6: Honeywell APU installed in a B737 [1.29]
These small turboshaft gas turbines satisfy thermal and electrical loads while on
the apron or during taxi. Unfortunately the overall thermal efficiency of APU
trigeneration is very poor. This is partially due to the fact that the thermal load

11
provided by the APU is always in excess of what is required by the aircraft; the
excess is dumped overboard. There is little motivation to improve this process as
the APU is in operation for a small fraction of aircraft operating hours and
represents an even smaller fraction of fuel consumption when compared to the
consumption of the main engines. While there is much to be learned from APU-
based trigeneration, it is clear that terrestrial small-scale users require a different
trigeneration system to be economically successful.
An interesting parallel can be made between large ocean vessels employing a
CHP system, and a small-scale user. An ocean vessel requires much the same
services as a residential customer or a small business: food preparation, laundry,
lighting, environmental heating, and process heat, to name a few. Often these
loads are satisfied with either a separate dedicated system, or are supplied by
the main powerplant; creating a hybrid CHP system. Traditionally such loads
were satisfied using a main boiler. Many vessels still use one, however marine
cogen has been used in new construction as early as the late 1970s [1.24]. As
reducing specific fuel consumption is of primary concern on a marine vessel, the
technology developed for marine use should be of particular interest for land-
based CHP users; key lessons and cycle innovations developed to save fuel, and
system size can help to make a small-scale DG system more attractive to
consumers. A significantly different system is required for small-scale land-based
12 consumers as marine systems are not capable of trigeneration at the present
time. In addition, the specific capital cost of marine cogen systems is too high for
small-scale users. A new trigen system that does not use boilers, absorption
chillers, or other components oriented towards the large-scale user is required.
1.3.3. Energy islanding
For applications where grid power is either inconsistent or non-existent, efficient
cost effective energy islanding is required. Northern Canadian communities are
often powered by spark ignition or compression ignition engines and heat is
provided using electric baseboards or a wood stove. Portable reciprocating
engine generators are prone to maintenance issues, and do not make use of
exhaust heat. The emissions from these generators, particularly from
compression ignition engines, have high concentrations of unburnt hydrocarbons
(UHC) and soot. Such communities are prime candidates for a power generation
and heating system that can be provided with a small-scale trigen package.
It is not only remote communities that can take advantage of such solutions;
industries with mobile applications such as the oil and gas industry, military
organizations, can benefit from the mobile high power density offered by
microturbines. With respect to a military application, recuperated microturbines
are an attractive DG solution in a combat role; low exhaust temperature and

13 noise signatures help reduce the chance of detection from infrared seeking
equipment and munitions.
Energy islanding has the potential to be attractive for small-scale users with grid
power access as well. For customers where power service is routinely disrupted
due to inclement weather or due to a weak grid, and for customers where natural
gas service is not available, DG systems are an attractive solution to eliminating
service disruption and high heating costs. Table 1-3 shows the total energy
consumption for Canadian households for the purpose of space heating for 2000
to 2004. Note that while the majority of Canadians use natural gas for space
heating, 45.4 percent of the total energy used for space heating did not come
from natural gas, presumably due to lack of access and the use of older heating
technology. It is also interesting to note that electricity use increased from 2000
to 2004 while natural gas use did not change. This suggests that more people
are living in areas without natural gas access, where space heating can only be
accomplished with expensive alternatives such as electric heat, oil furnaces, or
wood stoves. These statistics indicate that total or partial energy islanding has
the potential to become increasingly attractive to small-scale users, however an
economically viable small-scale CHP/CHCP package is not available on the
market.
14 Table 1-3:Canadian space heating energy consumption statistics, presented in petaJoules [1.27]
Year _. . . . . Natural Heating _.. ... . Electricity G Q . . a Other Wood
2000 2001 2002 2003 2004
percent change 2000-2004
140.6 134.0 142.0 153.6 157.2
10.6
445.0 404.8 437.6 460.2 442.9
-0.5
115.4 104.4 100.9 106.7 92.7
-19.7
11.9 11.9 11.5 11.5 11.6
2.5
101.2 94.7 100.1 104.7 106.8
5.2
1.3.4. Peak shaving
To encourage customers to distribute power consumption throughout the day,
and to recover costs associated with operating 'peaking' plants, many utilities
charge peak rates during high consumption periods. This has resulted in the use
of DG as a cost-reduction strategy. As many DG systems are too costly to run
when competing with off-peak electricity prices, optimization strategies often
include operating a DG system only once a minimum electrical tariff is exceeded
[1.2][1.16][1.20]. Most DG systems installed for the purpose of peak shaving do
not include CHP or CHCP cycles, as the extra cost associated with such systems
cannot be recovered if the system operates for only a portion of the day. Peak
shaving had become so popular by the turn of the century that gas turbine
gensets in the 3 to 65 MW range are in short supply [1.33]. This trend in grid
decentralization can only be expected to continue if electricity peak tariffs
continue to climb. For a small-scale user who typically consumes 5 to 8 kW at
15 peak load (for a single family detached household) [1.11], peak shaving DG
systems do not make economical sense.
1.3.5. Process heat and cooling
Many industrial processes require large amounts of heating and/or cooling load.
This load is traditionally generated using boilers (heat load) or chiller technology
fired by natural gas or powered with electricity (cooling load). As energy
contained in high-temperature exhaust is not utilized, traditional generation of
process energy has a lower thermal efficiency compared to cogen or trigen
systems.
California DG and CHP standards are seen as the model for the rest of North
America who typically follow suit. The California Energy Commission's
Distributed Generation and Cogeneration Policy Roadmap outlines a strategy
currently being implemented through 2020 to increase DG and CHP market
penetration in California to 25 percent of total peak demand [1.31]. To do this,
the commission indicates that among other incentives and regulatory
requirements, a continued effort to "remove institutional barriers" is essential for
DG and CHP success. This is described as making permits easier to obtain, and
to provide assistance for integrating DG into the main grid efficiently. With such a
favourable regulatory climate, generating process heat and cooling load is much
16 more attractive for large-scale industrial users and small-scale users alike.
Historically it was very difficult to sell overproduction of electrical power from CHP
and CHCP back to the grid, and still remains so in some areas of North America.
This overproduction represented a 'virtual penalty' on overall efficiency, as any
energy not used on site was 'dumped overboard'. By being able to generate an
income from overproduction, the overall efficiency of a CHP or CHCP system is
increased, and an additional income source is generated to offset fuel costs. It
can only be anticipated that as peak loads become more of a concern around
North America and the world, the DG and CHP framework being established by
California will serve as a model for encouraging the growth and economic viability
of trigeneration systems.
1.4. Small-scale CHP and CHCP technology
There are several technologies to choose from when designing a small-scale
CHP or CHCP system. As there are pros and cons to all of them, the following
will give a brief overview of which system is best suited for small-scale CHP or
CHCP.
1.4.1. Reciprocating engines
Commonly referred to as diesel or gasoline engines, these reciprocating prime
movers are often seen in an emergency/backup DG role. Diesel generators have
17 been used in peaking plants and other non-baseload environments as well,
however gasoline engines have not seen the same use outside of small-scale
emergency power generation and CHP. Some have experimented with small-
scale (less than 15 kW) CHCP and CHP systems involving diesel or gasoline
prime movers [1.20][1.22][1.25]. Thermodynamically speaking these systems are
good performers with overall efficiencies of 70 to 80 percent, however these
studies do not take into consideration maintenance and reliability issues. The
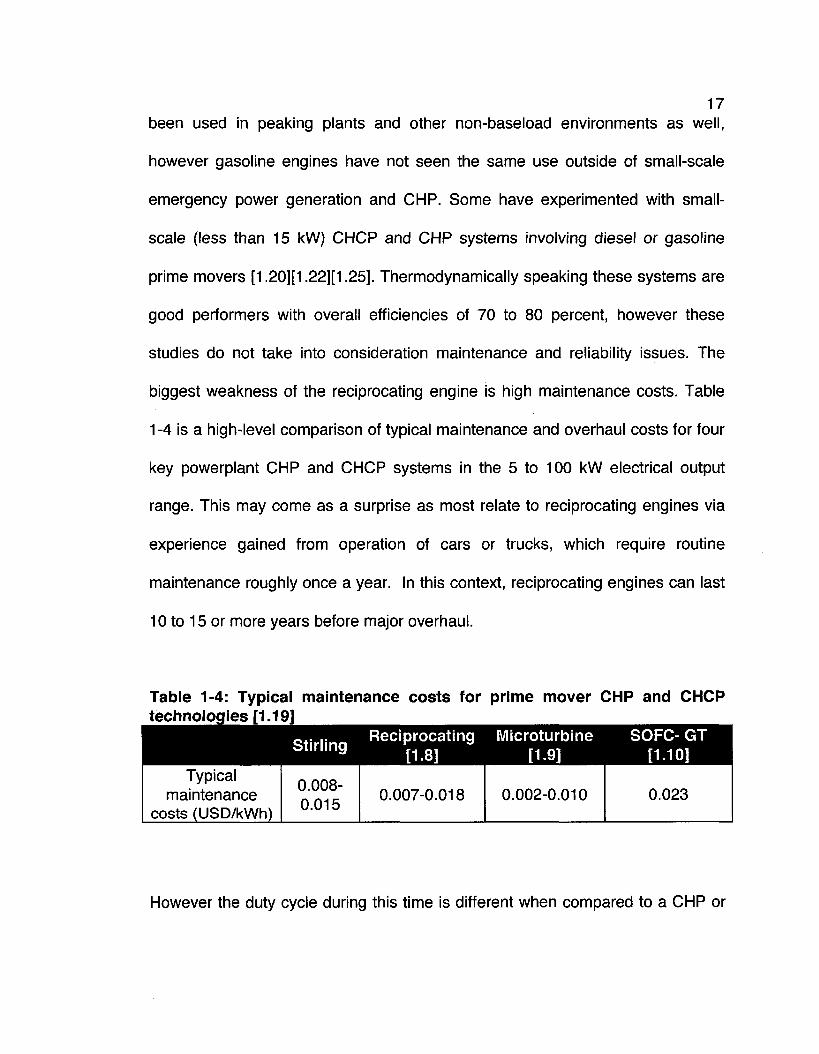
biggest weakness of the reciprocating engine is high maintenance costs. Table
1-4 is a high-level comparison of typical maintenance and overhaul costs for four
key powerplant CHP and CHCP systems in the 5 to 100 kW electrical output
range. This may come as a surprise as most relate to reciprocating engines via
experience gained from operation of cars or trucks, which require routine
maintenance roughly once a year. In this context, reciprocating engines can last
10 to 15 or more years before major overhaul.
Table 1-4: Typical maintenance costs for prime mover CHP and CHCP technologies [1.19]
Typical maintenance
costs (USD/kWh)
Stirling
0.008-0.015
Reciprocating Microturbine [1.8] [1.9]
0.007-0.018 0.002-0.010
SOFC- GT [1.10]
0.023
However the duty cycle during this time is different when compared to a CHP or
18 CHCP environment: operation of a vehicle 2 to 3 hours a day for 10 years results
in 7300 to 11000 hours of operation. A generator, CHP, or CHCP prime mover
will typically operate the majority of the day resulting in 6500 to 7000 hours of
operation per year or 6 to 10 times longer over a 10 year period, when compared
to a reciprocating engine operating in a vehicle powerplant mission.
Other Commercial
186 MW
Chemicals Processing
36 MW
Other Industrial 155 MW
Office Buildings
57 MW
Universities 100 MW
Hospitals 95 MW
Food Processing
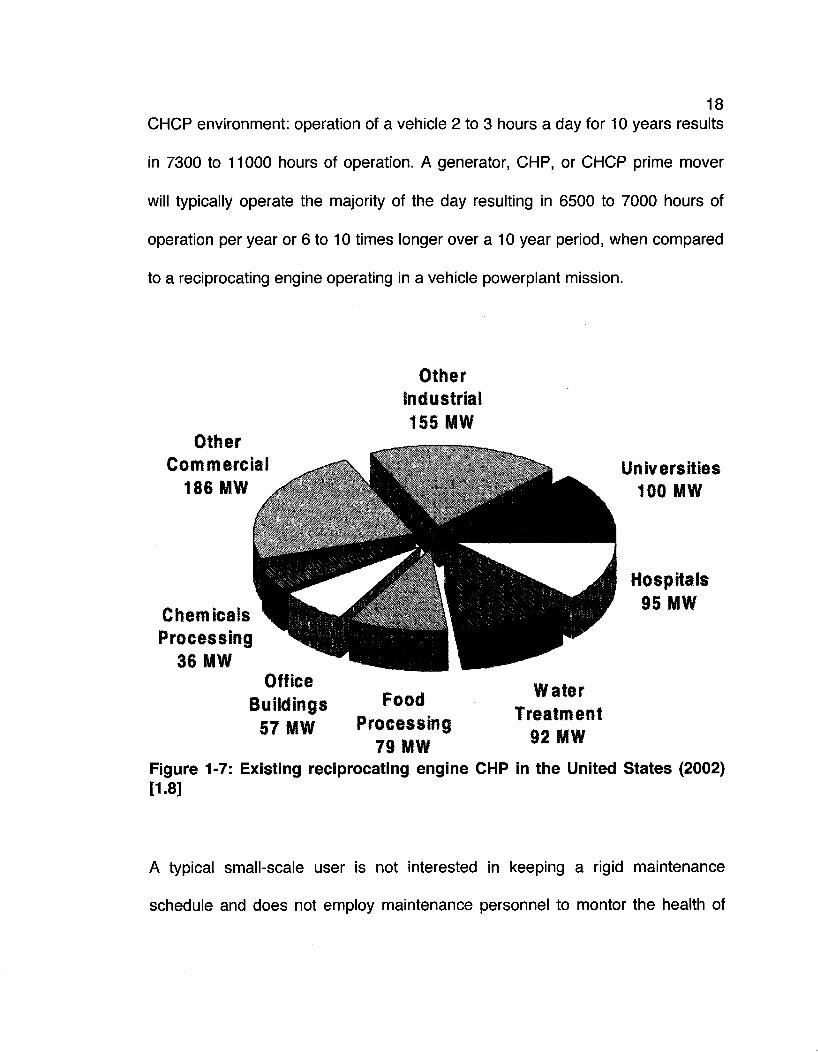
79 MW Figure 1-7: Existing reciprocating engine CHP in the United States (2002) [1.8]
Water Treatment
92 MW
A typical small-scale user is not interested in keeping a rigid maintenance
schedule and does not employ maintenance personnel to montor the health of
19
system components. When gasoline and diesel engines are employed in a large-
scale DG, CHP, or CHCP environment, the user will most likely employ a power
engineer or equivalent to monitor the health and maintain reliability of
reciprocating equipment; this is not an option for small-scale users with few
employees. As can be seen from Figure 1-7, customers who make use of a
reciprocating engine for CHP purposes typically do not have operations in the
MW scale.
In addition to maintenance scheduling and cost issues for the small user, noise is
also a problem. Reciprocating engines demonstrate steady state operation noise
levels in excess of 100 dBA [1.19]. At this level, the Canadian Centre for
Occupational Health and Safety recommends unprotected exposure not to
exceed 15 to 30 minutes a day [1.3]. While such noise levels may be acceptable
for a facility that can segregate the engine from occupied areas, small users
cannot afford the luxury of unusable noise polluted space.
1.4.2. Stirling engines
Despite being first patented in 1816 [1.46], engines using the Stirling cycle have
not received the same fame as its younger counterpart the Otto cycle (patented
in 1887) 0. While the ideal Stirling cycle is closer to Carnot cycle efficiencies, in
20 reality it is on par with Brayton and Otto cycles due to problems with piston
sealing and regenerator effectivities of less than unity. The Stirling engine uses a
closed cycle with a constant temperature heat addition and removal joined by
constant volume processes. In an alpha type Stirling engine, two pistons are
joined to a crankshaft. One cylinder is heated and the other is cooled. As the fluid
in the hot cylinder expands during constant temperature heat addition, the cold
cylinder is driven upwards. This forces cold fluid into the hot cylinder, which then
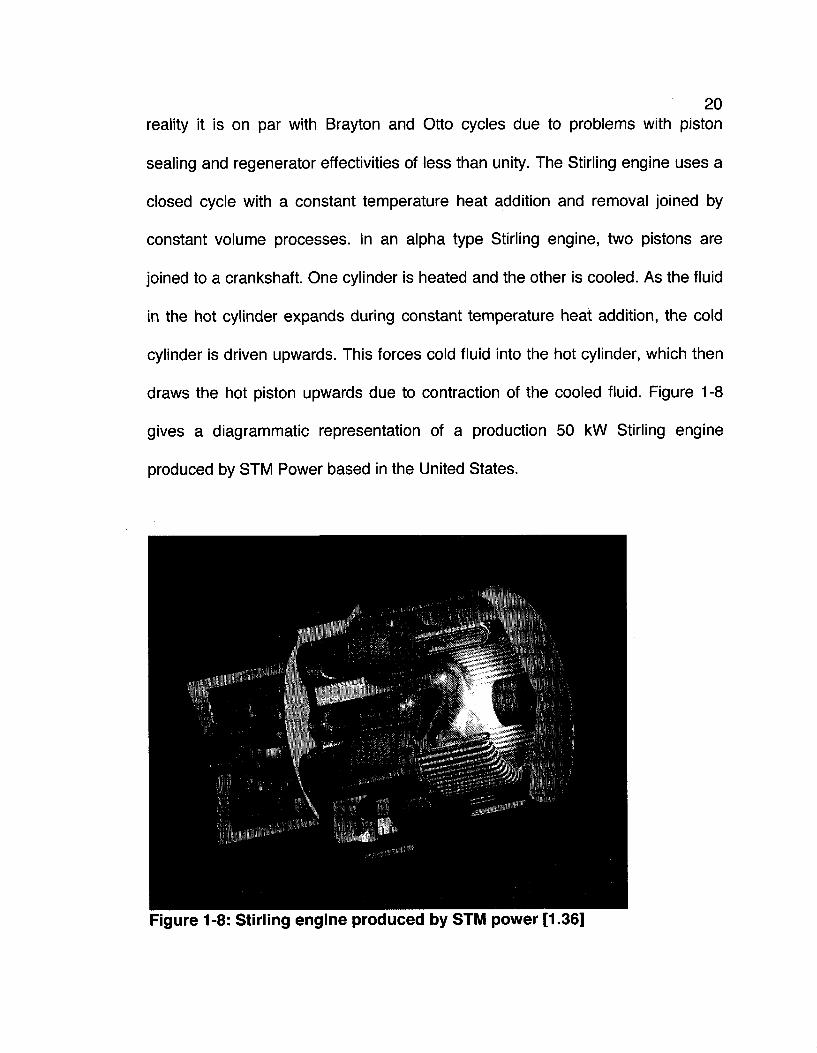
draws the hot piston upwards due to contraction of the cooled fluid. Figure 1-8
gives a diagrammatic representation of a production 50 kW Stirling engine
produced by STM Power based in the United States.
Figure 1-8: Stirling engine produced by STM power [1.36]
21 The Stirling engine demonstrates unproven potential to penetrate the less than
15 kW small-scale CHP market. The combination of low noise signature and
small package are attractive to consumers looking for either energy islanding or a
supplement to the grid. WhisperGen™, a company in New Zealand, will be
introducing a Stirling engine to the European market in 2009 capable of providing
1 kW of electrical output and upto 12 kW thermal output (in the form of hot water)
[1.42].
Purchase price and maintenance costs are still unavailable with which to make
an economic comparison with other CHP and CHCP technologies. Historical data
on Stirling engines suggest maintenance costs are slightly better than
reciprocating engines but still above microturbines (see Table 1-4). Several
companies have developed Stirling engines for use in packaged CHP
applications including: SOLO in Germany, WhisperGen™ in New Zealand, and
STM Power from the United States. With the exception of WhisperGen™, all other
commercial Stirling CHP packages are targeted for 50 kWe or greater industrial
use. Perhaps this is due to the high specific capital cost ($/kW) Stirling engine
packages have demonstrated. Very conservative estimates place the
procurement price of a Stirling CHP package at 3400 USD/kW . A typical North
American household requires about 5 kWe at peak demand [1.23], resulting in an
estimated 17,000 USD price tag (not including installation) for a small-scale
22 residential Stirling CHP unit. Considering a high-efficiency furnace can be
purchased for 3,000 to 4,000 USD [1.6], Stirling powered small-scale cogen has
some significant economic hurdles to overcome in order to achieve market
success.
1.4.3. Microturbines
Perhaps the most promising powerplant technology currently available for small-
scale trigeneration are microturbines. Having benefited from significant
government research and development funding in the United States,
microturbines are evolving from being classified as experimental to now being
widely accepted as an established technology. The Advanced Microturbine
System [1.40] and Microturbine Materials Technology [1.44] programs run by the
US Department of Energy have stated objectives to increase the thermal
efficiency of microturbines to 40 percent, making it possible for microturbine
systems to surpass the efficiencies of small-scale reciprocating engine systems
while maintaining reliability. The microturbine is a particularly robust system as
there is only one moving part: the main rotor as seen in Figure 1 -9. The result is
a technology similar to household furnaces; the consumer is aware it is
operating, but is not required to carry out any maintenance. As DG microturbine
systems have been in operation since the early 90s, maintenance periods and
service life claims have moved from estimates to being supported with field data.
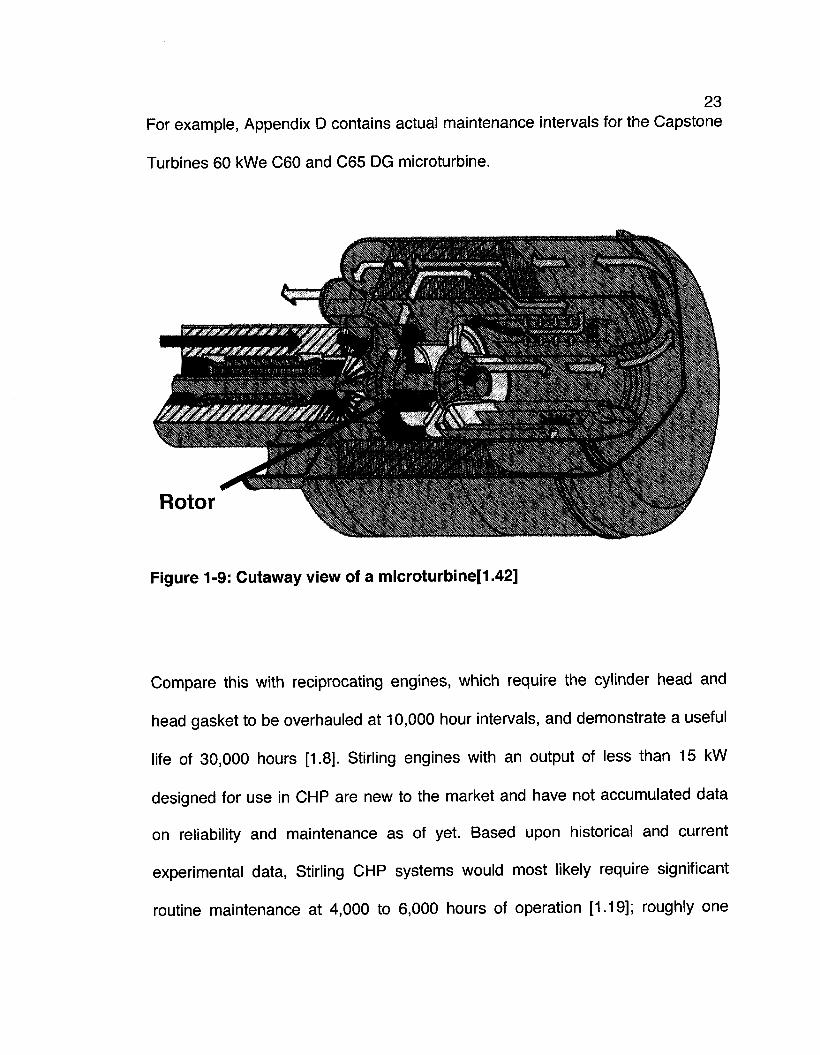
23 For example, Appendix D contains actual maintenance intervals for the Capstone
Turbines 60 kWe C60 and C65 DG microturbine.
Figure 1-9: Cutaway view of a microturbine[1.42]
Compare this with reciprocating engines, which require the cylinder head and
head gasket to be overhauled at 10,000 hour intervals, and demonstrate a useful
life of 30,000 hours [1.8]. Stirling engines with an output of less than 15 kW
designed for use in CHP are new to the market and have not accumulated data
on reliability and maintenance as of yet. Based upon historical and current
experimental data, Stirling CHP systems would most likely require significant
routine maintenance at 4,000 to 6,000 hours of operation [1.19]; roughly one
24 quarter of the demonstrated 20,000 hour interval for a microturbine (see
Appendix D). Estimates for useful life vary wildly for Stirling engines due to a lack
of historical data to draw from, therefore it is prudent to leave the useful life of a
Stirling powered DG or CHP system as unknown at this point.
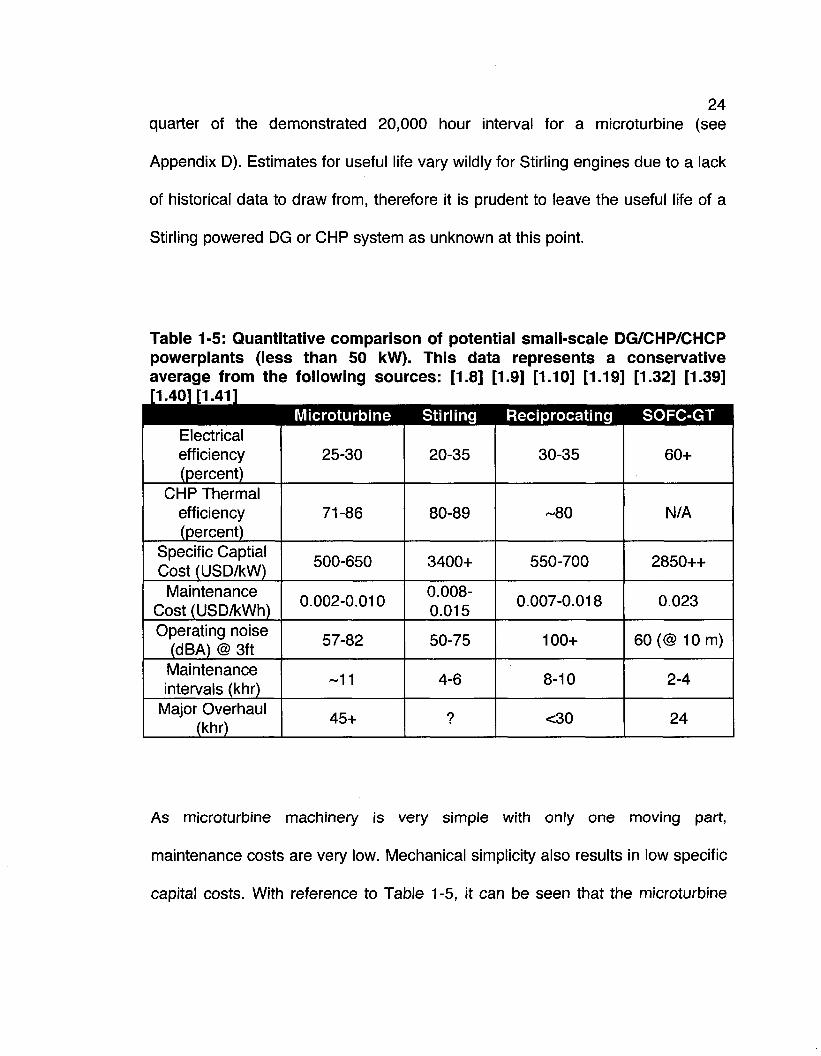
Table 1-5: Quantitative comparison of potential small-scale DG/CHP/CHCP powerplants (less than 50 kW). This data represents a conservative average from the following sources: [1.8] [1.9] [1.10] [1.19] [1.32] [1.39] [1.40] [1.41]
Microturbine Stirling Reciprocating SOFC-GT Electrical efficiency (percent)
CHP Thermal efficiency (percent)
Specific Captial Cost (USD/kW)
Maintenance Cost (USD/kWh) Operating noise
(dBA) @ 3ft Maintenance intervals (khr)
Major Overhaul (khr)
25-30
71-86
500-650
0.002-0.010
57-82
-11
45+
20-35
80-89
3400+
0.008-0.015
50-75
4-6
?
30-35
-80
550-700
0.007-0.018
100+
8-10
<30
60+
N/A
2850++
0.023
60 (@ 10 m)
2-4
24
As microturbine machinery is very simple with only one moving part,
maintenance costs are very low. Mechanical simplicity also results in low specific
capital costs. With reference to Table 1 -5, it can be seen that the microturbine
25 offers the lowest operational and startup cost of the three options discussed thus
far (SOFC-GT systems will be discussed in Section 1.4.3.4). In the case of
CHCP, a successful system has to compete with highly efficient individual
generation provided by a vapour compression air conditioner, natural gas
furnace, and grid power. To do so, low specific capital and maintenance costs
are vital. The same can be applied to small-scale DG and CHP systems as
consumers requiring less than 50 kW of electrical power cannot afford the capital
required for a Stirling system, nor the maintenance costs of a reciprocating
system.
As discussed in Section 1.4.1, a successful DG, CHP, or CHCP system targeted
for the small-scale user must demonstrate low operational noise. Table 1-5
compares operating noise levels of competing small-scale powerplants; it can be
seen that the microturbine operates within an acceptable noise range. For
comparison, the average clothes dryer operates at 60-75 dBA [1.17]. This
combination of minimal maintenance, high reliability, and low operating noise
ensures that a microturbine trigeneration system is 'out of sight and out of mind'.
1.4.3.1 .Available CHP microturbine packages
There has been substantial research and development effort made in the 50 to
150 kW range for microturbine-powered CHP. As a result, there are several
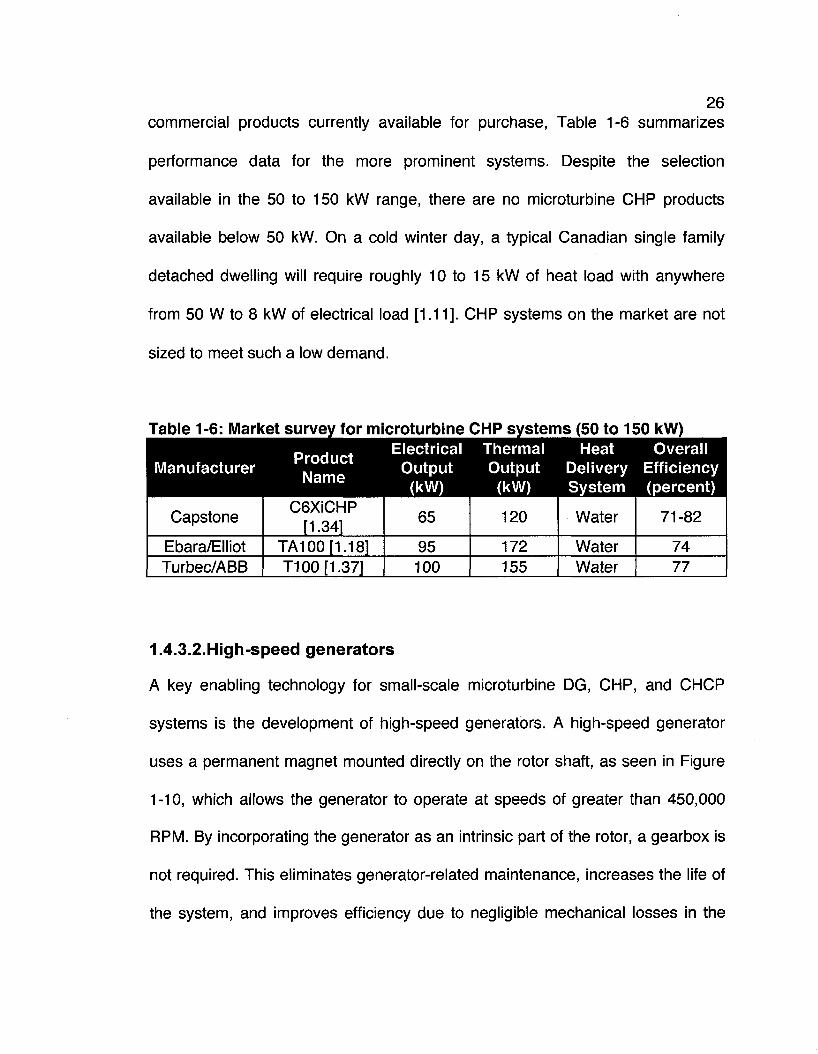
26 commercial products currently available for purchase, Table 1-6 summarizes
performance data for the more prominent systems. Despite the selection
available in the 50 to 150 kW range, there are no microturbine CHP products
available below 50 kW. On a cold winter day, a typical Canadian single family
detached dwelling will require roughly 10 to 15 kW of heat load with anywhere
from 50 W to 8 kW of electrical load [1.11]. CHP systems on the market are not
sized to meet such a low demand.
Table 1-6: Market survey for microturbine CHP systems (50 to 150 kW)
Manufacturer Product Name
Electrical Thermal Heat Overall Output Output Delivery Efficiency (kW) (kW) System (percent)
Capstone
Ebara/Elliot Turbec/ABB
C6XiCHP [1.34]
TA100[1.18] T100 [1.37]
65
95 100
120
172 155
Water
Water Water
71-82
74 77
1.4.3.2.High-speed generators
A key enabling technology for small-scale microturbine DG, CHP, and CHCP
systems is the development of high-speed generators. A high-speed generator
uses a permanent magnet mounted directly on the rotor shaft, as seen in Figure
1 -10, which allows the generator to operate at speeds of greater than 450,000
RPM. By incorporating the generator as an intrinsic part of the rotor, a gearbox is
not required. This eliminates generator-related maintenance, increases the life of
the system, and improves efficiency due to negligible mechanical losses in the
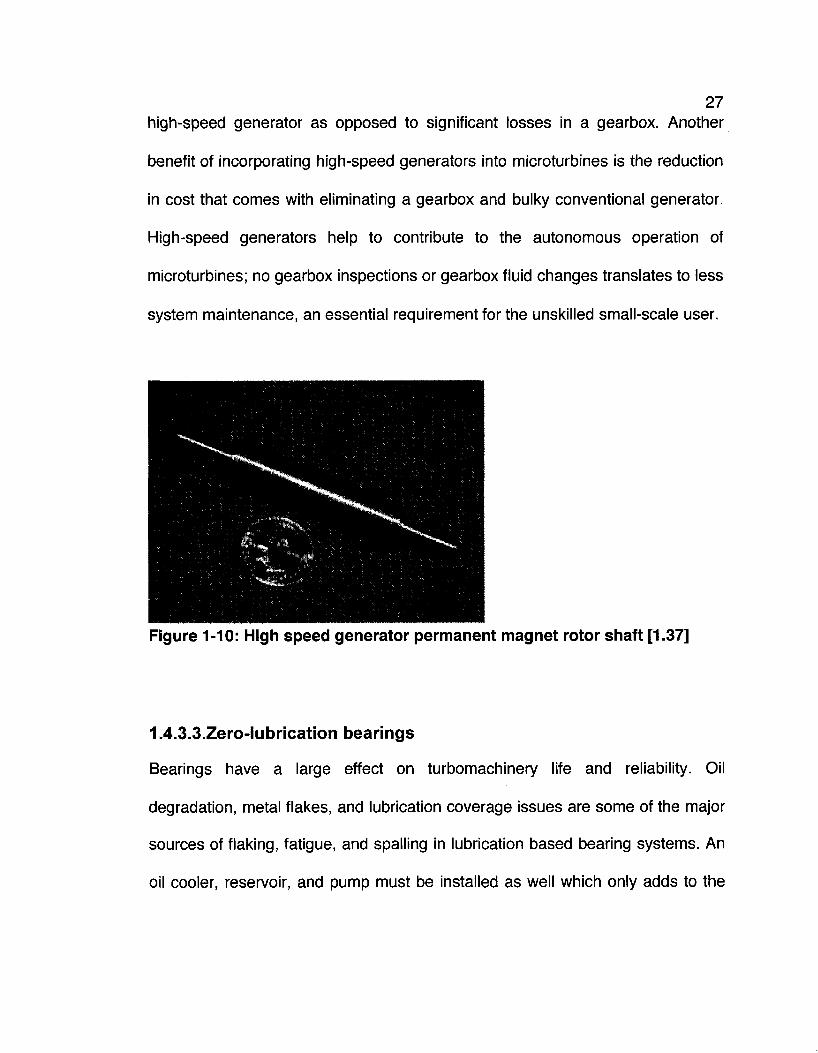
27 high-speed generator as opposed to significant losses in a gearbox. Another
benefit of incorporating high-speed generators into microturbines is the reduction
in cost that comes with eliminating a gearbox and bulky conventional generator.
High-speed generators help to contribute to the autonomous operation of
microturbines; no gearbox inspections or gearbox fluid changes translates to less
system maintenance, an essential requirement for the unskilled small-scale user.
Figure 1-10: High speed generator permanent magnet rotor shaft [1.37]
1.4.3.3.Zero-lubrication bearings
Bearings have a large effect on turbomachinery life and reliability. Oil
degradation, metal flakes, and lubrication coverage issues are some of the major
sources of flaking, fatigue, and spalling in lubrication based bearing systems. An
oil cooler, reservoir, and pump must be installed as well which only adds to the
28 complexity and cost of the system; hence it is highly desirable to eliminate the
need for a lubrication system.
Air bearings have significant potential for microturbines in that they eliminate the
need for an oil distribution system, and improve component life. The air bearing
system along with high-speed generators are enabling technologies for
microturbines that contribute to the minimal maintenance and long service life
demonstrated. An air bearing uses pressurized air forced through very small
gaps between stationary and rotating components, effectively 'floating' the
rotating component without any physical contact.
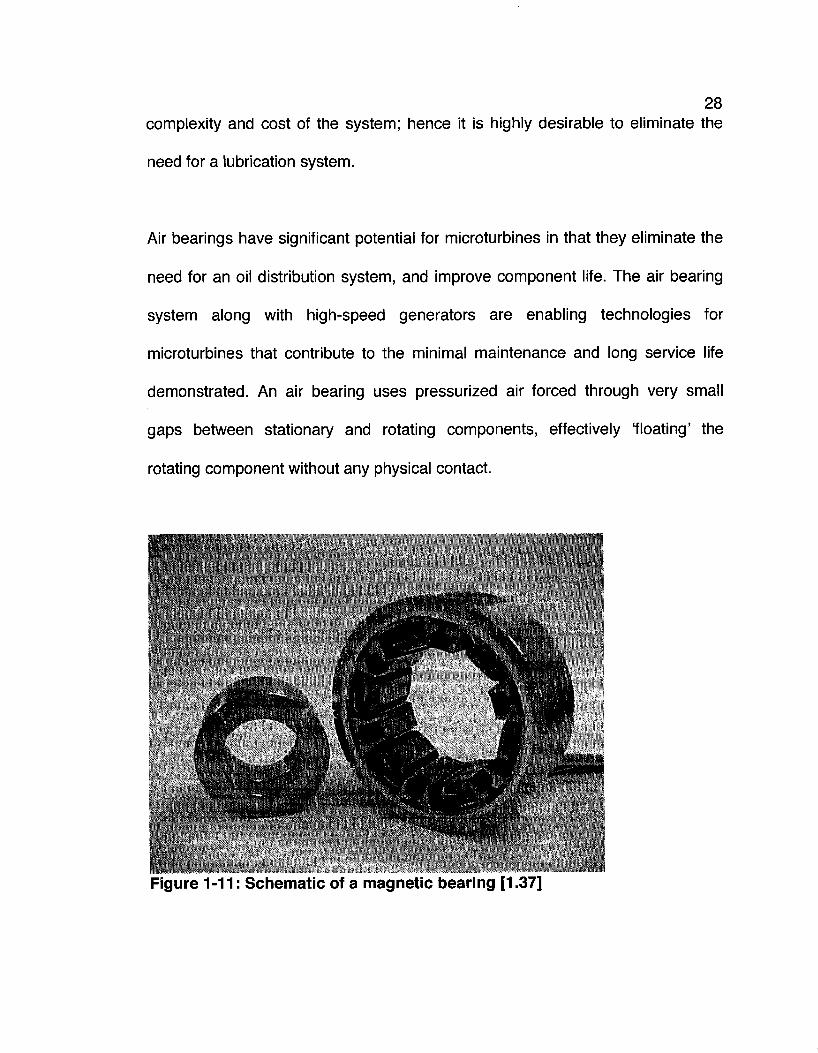
Figure 1-11: Schematic of a magnetic bearing [1-37]
29 Magnetic bearings are a more recent addition to the field of non-contact bearing
systems. Figure 1-11 shows one particular design by Synchrony, a leader in
incorporating magnetic bearings into turbomachinery systems. It can be seen that
the rotating shaft floats between the inner magnets and outer magnets,
preventing wear due to contact from occurring.
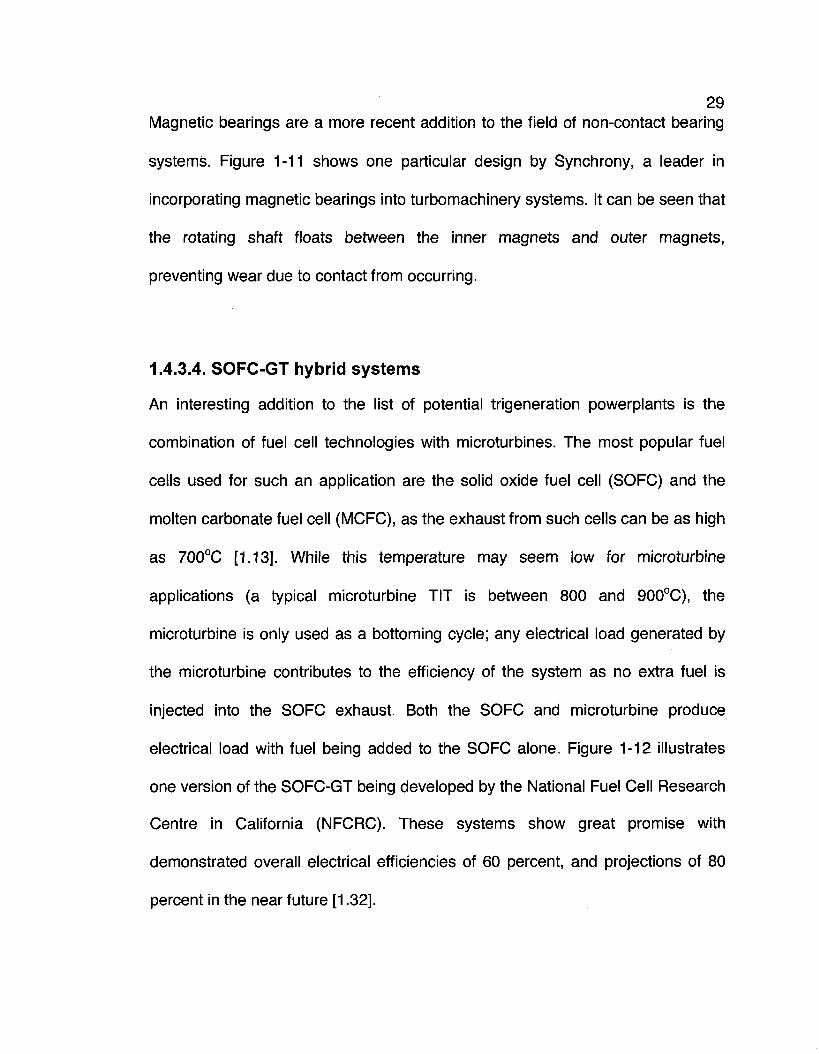
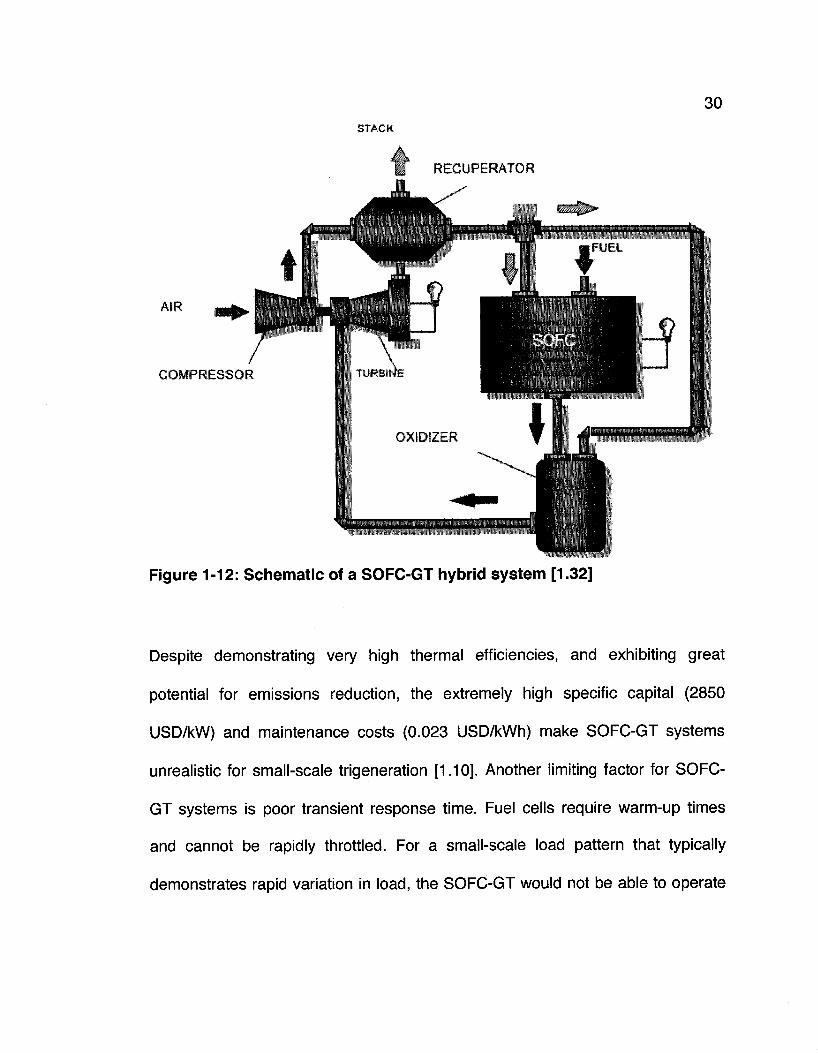
1.4.3.4. SOFC-GT hybrid systems
An interesting addition to the list of potential trigeneration powerplants is the
combination of fuel cell technologies with microturbines. The most popular fuel
cells used for such an application are the solid oxide fuel cell (SOFC) and the
molten carbonate fuel cell (MCFC), as the exhaust from such cells can be as high
as 700°C [1.13]. While this temperature may seem low for microturbine
applications (a typical microturbine TIT is between 800 and 900°C), the
microturbine is only used as a bottoming cycle; any electrical load generated by
the microturbine contributes to the efficiency of the system as no extra fuel is
injected into the SOFC exhaust. Both the SOFC and microturbine produce
electrical load with fuel being added to the SOFC alone. Figure 1-12 illustrates
one version of the SOFC-GT being developed by the National Fuel Cell Research
Centre in California (NFCRC). These systems show great promise with
demonstrated overall electrical efficiencies of 60 percent, and projections of 80
percent in the near future [1.32].
30
AIR
COMPRESSOR
STACK
RECUPERATOR
Figure 1-12: Schematic of a SOFC-GT hybrid system [1.32]
Despite demonstrating very high thermal efficiencies, and exhibiting great
potential for emissions reduction, the extremely high specific capital (2850
USD/kW) and maintenance costs (0.023 USD/kWh) make SOFC-GT systems
unrealistic for small-scale trigeneration [1.10]. Another limiting factor for SOFC-
GT systems is poor transient response time. Fuel cells require warm-up times
and cannot be rapidly throttled. For a small-scale load pattern that typically
demonstrates rapid variation in load, the SOFC-GT would not be able to operate
31 in a load following manner. No commercial SOFC-GT units are in operation
currently as this technology is still under development, however with the results
obtained so far by NFCRC and Siemens (formerly Westinghouse) shows great
promise for medium to large-scale DG or CHP applications.
SOFC-GT systems have very low thermal-to-electric load ratios (TELR). This is
inverse to what is required in a typical small-scale application that demonstrates
TELR values of 4 to 5 [1.23]. To meet a small-scale thermal load, significant
overproduction of electrical load is required. Unless this load can be sold back to
the grid, this overproduction represents a penalty on overall efficiency no matter
how efficiently it was produced.
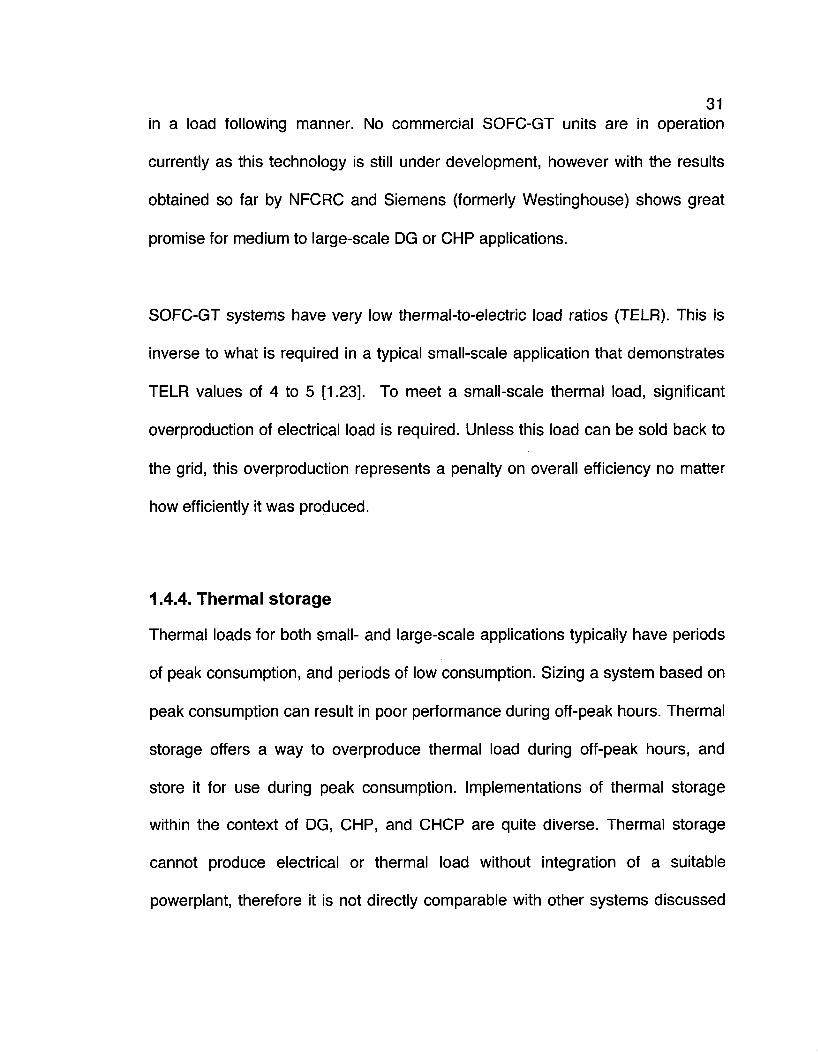
1.4.4. Thermal storage
Thermal loads for both small- and large-scale applications typically have periods
of peak consumption, and periods of low consumption. Sizing a system based on
peak consumption can result in poor performance during off-peak hours. Thermal
storage offers a way to overproduce thermal load during off-peak hours, and
store it for use during peak consumption. Implementations of thermal storage
within the context of DG, CHP, and CHCP are quite diverse. Thermal storage
cannot produce electrical or thermal load without integration of a suitable
powerplant, therefore it is not directly comparable with other systems discussed
32 in Section 1.4. Thermal storage is a proven option for providing cooling or heating
load, and for augmenting the performance of DG, CHP, and CHCP powerplants;
it will be briefly discussed as such systems are in use around the world as part of
distributed thermal systems. Some implementations of thermal storage include
below ground reservoirs (Figure 1-13), integrated reservoirs (Figure 1-14), and
two-phase storage [1.14]. There are two main strategies used when
implementing thermal storage.
Heat Pump
To Building
Figure 1-13: Example of using below ground thermal storage [1.45]
One takes advantage of the large heat capacity, and relatively constant
temperature of large underground water reservoirs to provide heating and
cooling. It typically takes advantage of a heat pump to extract or reject heat from
the reservoir. This method can only be used where large underground reservoirs
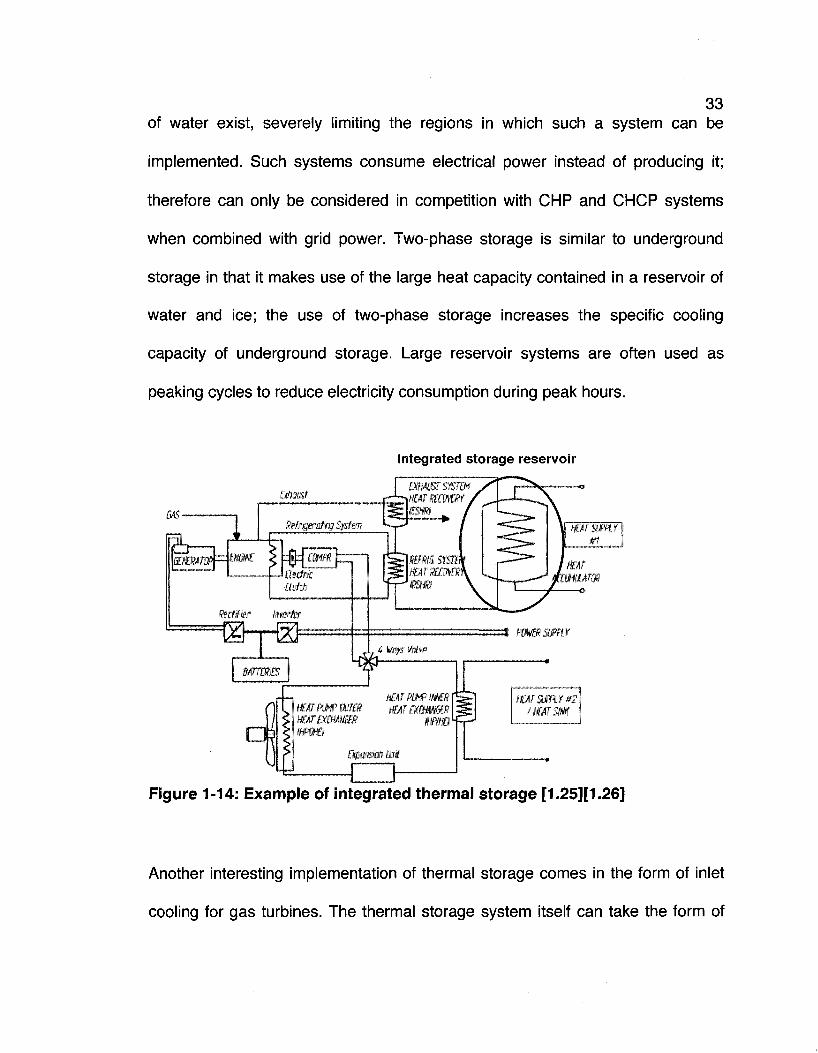
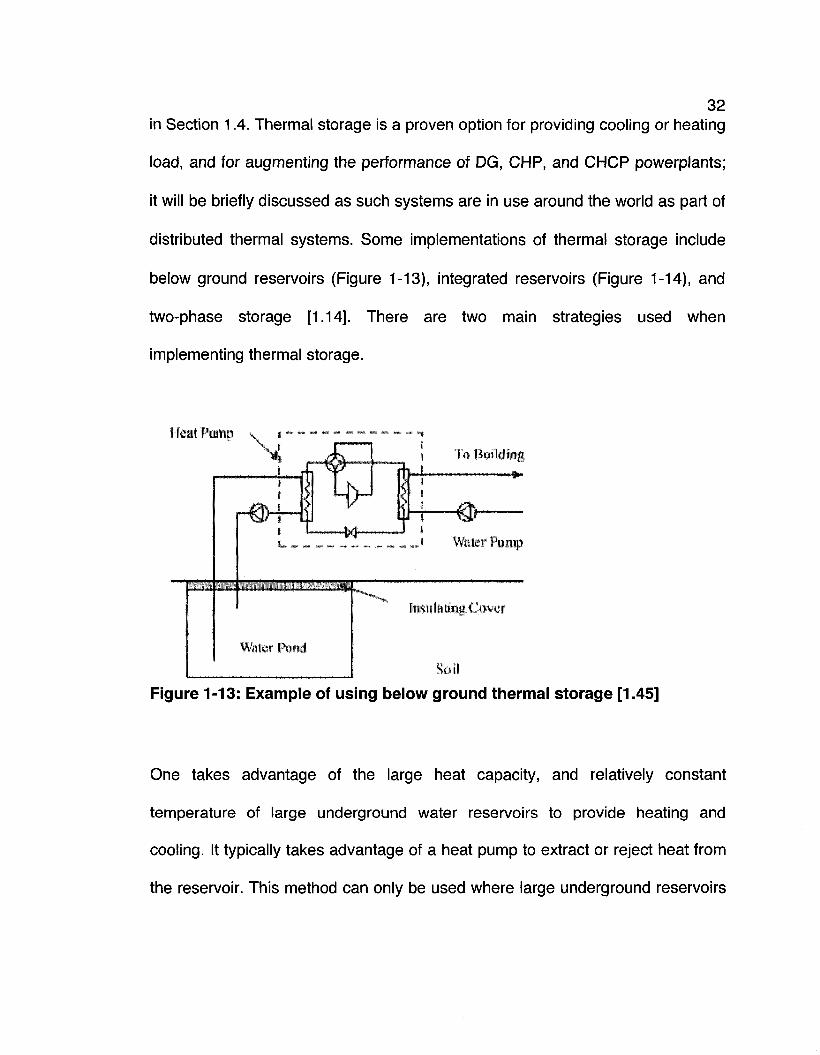
33 of water exist, severely limiting the regions in which such a system can be
implemented. Such systems consume electrical power instead of producing it;
therefore can only be considered in competition with CHP and CHCP systems
when combined with grid power. Two-phase storage is similar to underground
storage in that it makes use of the large heat capacity contained in a reservoir of
water and ice; the use of two-phase storage increases the specific cooling
capacity of underground storage. Large reservoir systems are often used as
peaking cycles to reduce electricity consumption during peak hours.
Integrated storage reservoir
Mmst
tfcfrgm&ng System
mmsrsYsm mrmmf?f raw
mm B$ttf€
Rectifier tarts* J - * TA<r
mitm
\mm. sm ISfJ
wsmr 01
'Mm
=s pomsmr i Wcf$.VA<m
mr PUMP am HUT PUMP MER HEAT EXimm mTtmimt mxi
mramr»2 /mrsm
Figure 1-14: Example of integrated thermal storage [1.25][1.26]
Another interesting implementation of thermal storage comes in the form of inlet
cooling for gas turbines. The thermal storage system itself can take the form of
34 integrated, underground, or two-phase design. However, the cooling product is
used to increase specific work output and thermal efficiency of a gas turbine
instead of producing cooling load. Estimates place the cost of such a system at
160 USD/kWt of cooling [1.21]. Inlet cooling would benefit a small-scale
microturbine-powered trigeneration system, however as a microturbine package
can be produced for only 500 to 600 USD/kWe (see Table 1 -5), any reduction in
specific fuel consumption would have to be weighed against increased specific
capital and maintenance costs.
1.5. Thesis objective
The goal of this thesis is to design a trigeneration system targeted for the
residential, small business, and institution sectors. This system will be able to be
connected to the grid or function as a total energy-islanding device. The system
is designed to be in direct economic competition with individual generation from
an air conditioning system, natural gas furnace, and grid power. The final design
will satisfy the following requirements:
• Be comprised of components that make use of existing technology
• Operation of the system requires no special training, nor should the system
require special monitoring.
• Will make use of hydraulic storage combined with an inverse Brayton cycle
powered by a microturbine. These technologies will be discussed further in
the following section.

35
• Be sized to provide for all electrical, cooling, and heating loads for a typical
detached single family Canadian household.
• The system must not introduce operational health hazards.
• No storage batteries are to be used in the design.
The work contained in this thesis represents the first phase in the design and
manufacture of a small-scale trigeneration system. A proof of concept will be built
at a later time, as the scope of this thesis is limited to simulation and modelling.
Keeping capital costs low will be a priority. Significant emphasis will be placed on
maintaining system simplicity, and using low cost components.
Chapter 2 CHCP literature review
2.1 . The motivation behind developing CHCP
Technology used in modern CHCP has been available for many years; current
efforts are focused on building cycles with proven technology in a fashion that
makes economic and thermodynamic sense. The threat of energy shortages, real
or imagined, in many places around the world have led many consumers and
energy providers alike to look for ways to stretch resources. Trigeneration is seen
as one tool to help the new reality facing consumers and energy providers alike.
A key motivation behind trigeneration is to add value to distributed energy
systems. Many studies and simulations have shown lower specific capital costs
for trigeneration systems over individual generation, in addition to lower specific
fuel consumption [2.13]. In some applications where CHP does not make
economic sense, the added value of an additional energy product to a CHP
system may be more economically viable. By providing cooling output, a
trigeneration system enables a building or plant to become completely self-
sufficient. This may not be an issue for most, however for total or partial energy
islanding, trigeneration packages are very attractive.
36
37 2.2. Historical application of CHCP
Historically CHCP has been primarily targeted for use in large institutions and
commercial space [2.36]. There are examples of successful CHCP
implementation in industry [2.5], however the number of industrial processes that
require significant cooling and heating loads are far fewer than those which
require one or the other. CHCP has been employed primarily in institutions and
commercial buildings due to the agreeable match between building energy
product requirements and CHCP energy outputs. Commercial CHCP is a new
technology, as the oldest installations are only 8 to 10 years old [2.21] with the
majority being only 3 to 4 years old [2.3][2.27][2.31][2.2][2.1]. Over the past
decade CHCP systems have achieved economic success while installed in
applications such as airports [2.1], shopping centres [2.2], supermarkets [2.21],
hospitals [2.36], and industrial plants [2.5][2.3]. The success of existing CHCP
plants around the world have motivated Saudi Arabia to form the National
Trigeneration CHP Company (NTCC), a government-backed company charged
with the development and installation of trigeneration packages throughout the
country. With social and environmental responsibility taking a more prominent
role around the world, the attractive combination of reductions in energy
consumption and carbon emissions is giving trigeneration systems some much
needed momentum [2.31]. This momentum is anticipated to give current
experimental CHCP systems the opportunity to compete commercially, and to
38 improve trigeneration technology as a whole via increased competition.
2.2.1. Typical cycle profile of current commercial CHCP
Cycle design for CHCP systems was briefly described in Section 1.1. The
following is a more in-depth summary of CHCP systems currently in operation
around the world. The most popular choice for trigeneration powerplants are
either diesel or gas turbine engines, gasoline internal combustion engines are
used on a smaller scale. A typical unit will be in the 3 to 10 MWe output range,
which coincides with requirements consistent with large institutions, airports, and
hospitals.
Figure 2-1 illustrates three common layouts used for large (3 to 10 MWe)
trigeneration systems that incorporate ACR units. Layouts A and B incorporate
an internal combustion engine (diesel or gasoline), while layout C uses a gas
turbine. The main difference between diesels and gas turbines is the way heat is
extracted, When using an internal combustion engine, a significant portion of the
waste heat from is in the form of liquid coolant. Layout A provides for one ACR
unit by re-circulating the coolant through the exhaust stack, while layout B
provides for two ACR units by incorporating exhaust heat into one cycle and
coolant flow into the other. Layout B is particularly advantageous for applications
that require different temperatures of cooling flow; two ACR units can produce
cooling load at two different temperatures. In layout C exhaust circulates directly
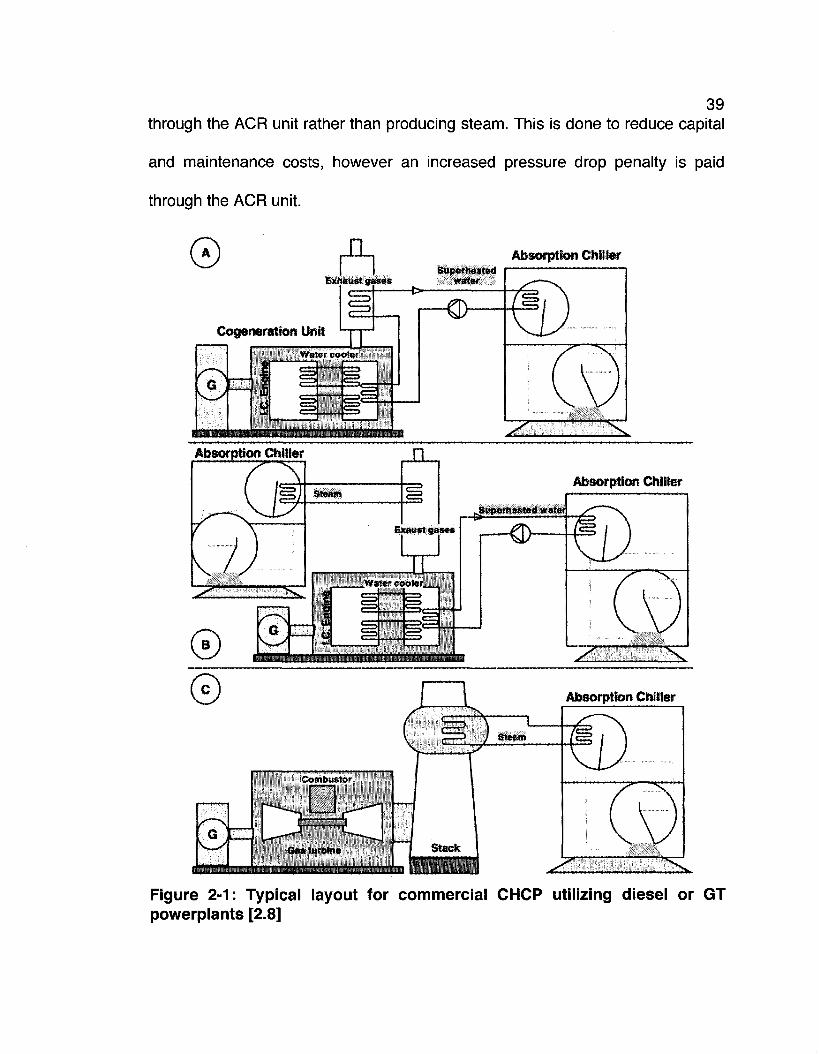
39 through the ACR unit rather than producing steam. This is done to reduce capital
and maintenance costs, however an increased pressure drop penalty is paid
through the ACR unit.
0 n Absorption Chiller Superheated
Exhaust gases water • { > _ _
Cogeneration Unit
&l
IWater coof er i
Absorption Chiller
Absorption Chiller
© Absorption Chiller
Figure 2-1: Typical layout for commercial CHCP utilizing diesel or GT powerplants [2.8]

40 For commercial systems that make use of vapour compression refrigeration units
(VCR), there are two primary configurations used: direct drive and indirect drive.
The most significant difference between them is how the compressor of the VCR
unit is driven. In a direct configuration, a clutched shaft connects the prime mover
and the VCR compressor. The VCR unit is engaged by disengaging the clutch,
thereby providing direct shaft power to the refrigerant compressor. Conversely,
an indirect configuration does not have a direct shaft connection between the
prime mover and the VCR compressor. Electrical load is supplied by the
generator (which is connected to the prime mover via a shaft), which is used to
power the refrigerant compressor.
2.2.1.1. Suitability of VCR and ACR refrigeration for small-scale CHCP
Figure 2-2 is a schematic of an ACR chiller. The chilling effect is produced from
energy provided to the generator by high-temperature powerplant exhaust. This
system is well suited for CHCP systems as when a heating load is no longer
needed or is throttled, exhaust can be re-directed into the ACR rather than
dumped overboard, while a VCR CHCP system (see Figure 1-2) does not make
use of exhaust heat when producing a cooling load. If heating and cooling loads
are required simultaneously (as in the case of a supermarket or food processing
plant [2.21]), the VCR-based CHCP system may be a viable option. Since VCR
units do not use waste exhaust to provide a cooling effect, they can only remain
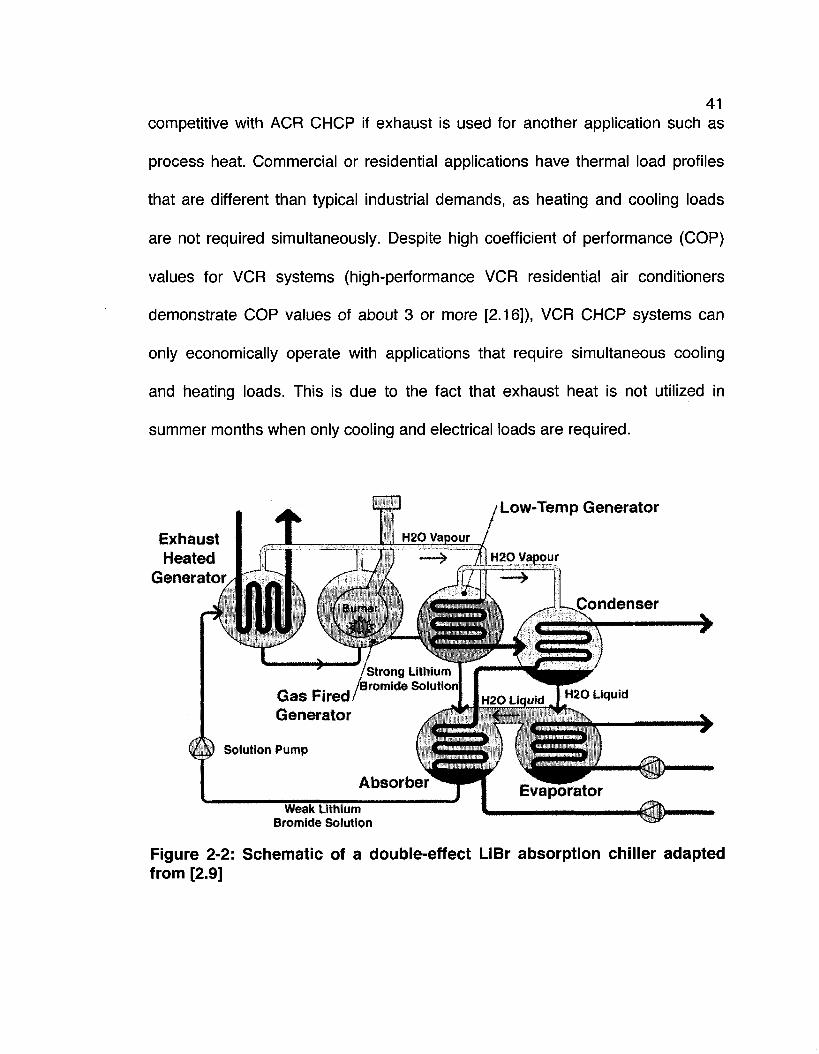
41 competitive with ACR CHCP if exhaust is used for another application such as
process heat. Commercial or residential applications have thermal load profiles
that are different than typical industrial demands, as heating and cooling loads
are not required simultaneously. Despite high coefficient of performance (COP)
values for VCR systems (high-performance VCR residential air conditioners
demonstrate COP values of about 3 or more [2.16]), VCR CHCP systems can
only economically operate with applications that require simultaneous cooling
and heating loads. This is due to the fact that exhaust heat is not utilized in
summer months when only cooling and electrical loads are required.
Low-Temp Generator
Exhaust Heated
Generator/)
Weak Lithium Bromide Solution
Figure 2-2: Schematic of a double-effect Li Br absorption chiller adapted from [2.9]
42 To maintain high overall efficiency without having to produce both cooling and
heating loads simultaneously, ACR refrigeration based CHCP is a more suitable
choice. Another factor leading to the domination of ACR over VCR in the
trigeneration market is the fact that electrical load is more economically valuable
than thermal output. Electrical load can either be used to satisfy electrical loads
that would have been purchased, or can be sold back to the grid to generate
income. Unlike electrical load waste heat cannot be exported for profit, and is
cheaper to produce; hence using electrical load to power a VCR as part of CHCP
system unit is not often an economical choice. There are two predominant ACR
configurations used in CHCP systems today: single-effect and double-effect
ACR. The single-effect ACR uses only exhaust heat to evaporate the working
fluid, while the double-effect includes an additional fired generator seen in Figure
2-2. Double-effect ACR can double the COP of single-effect ACR, but also has
20 to 70 percent higher specific capital and maintenance costs [2.23]. As is
shown in Figure 2-2, an ACR unit is complex requiring many expensive
components in addition to a cooling tower not shown in the diagram. The capital
cost for ACR units rises dramatically for smaller units and becomes prohibitively
expensive for units sized for a typical household (about 10 to 11 kWt).
Figure 2-3 contains ACR specific capital costs from several suppliers, and
provides a curve fit for small and large-scale chillers. Using the curve fit for small
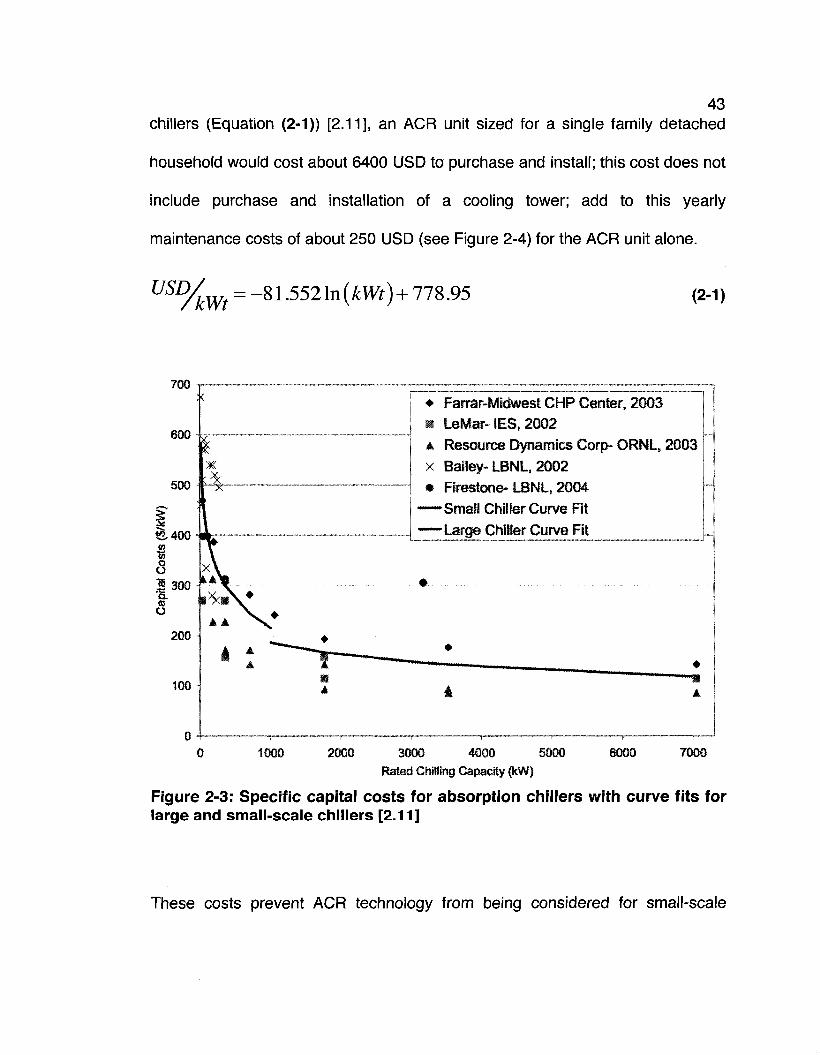
43 chillers (Equation (2-1)) [2.11], an ACR unit sized for a single family detached
household would cost about 6400 USD to purchase and install; this cost does not
include purchase and installation of a cooling tower; add to this yearly
maintenance costs of about 250 USD (see Figure 2-4) for the ACR unit alone.
ra%M = _ 8 L 5 5 2 1 n ^ M ) + 7 7 8 ' 9 5 (2-1)
700 • Farrar-Midwest CHP Center, 2003 • LeMar-IES, 2002 A Resource Dynamics Corp- ORNL, 2003 x Bailey-LBNL, 2002 • Firestone-LBNL, 2004
—Small Chiller Curve Fit —Large Chiller Curve Fit
•
1000 6000 7000 2000 3000 4000 5000 Rated Chilling Capacity (kW)
Figure 2-3: Specific capital costs for absorption chillers with curve fits for large and small-scale chillers [2.11]
These costs prevent ACR technology from being considered for small-scale
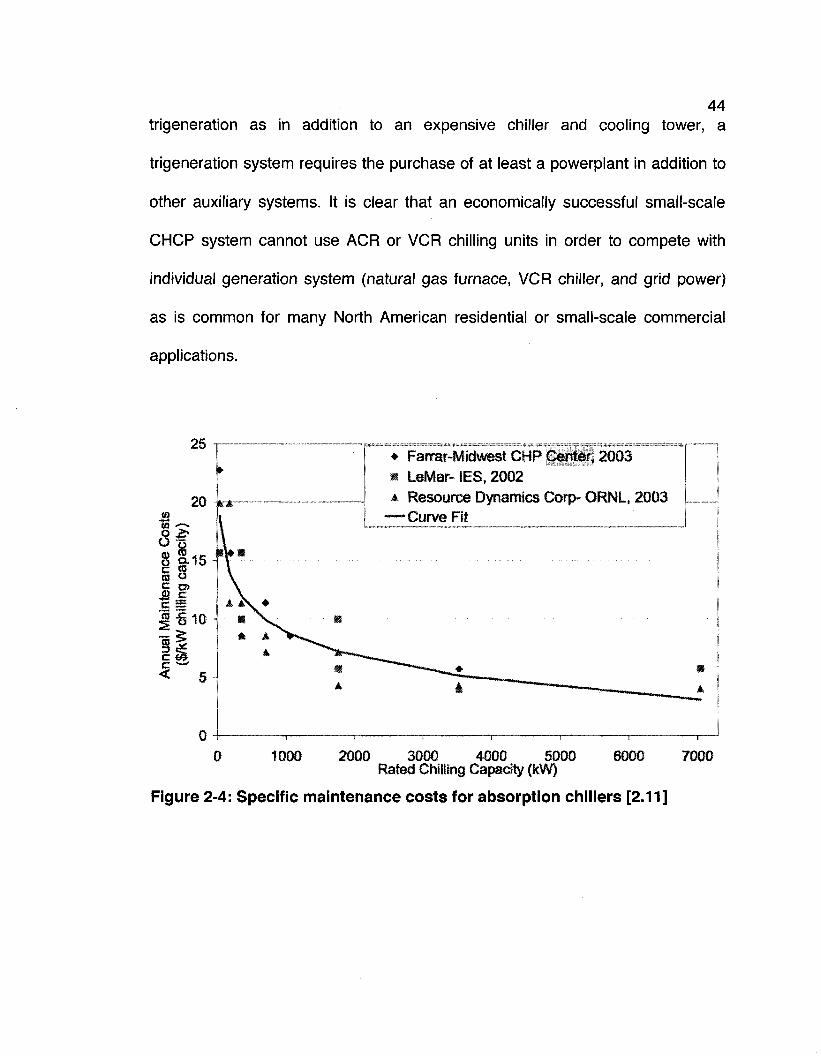
44 trigeneration as in addition to an expensive chiller and cooling tower, a
trigeneration system requires the purchase of at least a powerplant in addition to
other auxiliary systems. It is clear that an economically successful small-scale
CHCP system cannot use ACR or VCR chilling units in order to compete with
individual generation system (natural gas furnace, VCR chiller, and grid power)
as is common for many North American residential or small-scale commercial
applications.
• Farrar-Midwest CHP Center, 2003 • LeMar- IES, 2002 A Resource Dynamics Corp- QRNL, 2003
0 1000 2000 3000 4000 5000 6000 7000 Rated Chilling Capacity (kW)
Figure 2-4: Specific maintenance costs for absorption chillers [2.11]

45 2.2.2. Production CHCP packages
Current CHCP packages are most commonly designed using off-the-shelf
individual components that are matched together in an ad hoc genset package.
There are many companies making attempts at proving CHCP technologies in
conjunction with the US Department of Energy, however these CHCP
installations are not packaged units [2.10]. They are highly experimental and
custom built, involving a high degree of design overhead.
At this time, UTC Power is the only company breaking this tradition by offering
the first packaged trigeneration system on the market. This package uses four
Capstone microturbines and a LiBr absorption chiller to provide: 227 kWe, 500
kWt cooling load, and 70 kWt heating load at 91 percent overall efficiency when
operating in cooling mode. The system can also provide 227 kWe and 322.3 kWt
at 68 percent overall efficiency in heating mode [2.28]. UTC Power boasts a 46
percent reduction in CO2 emissions over coal-fired grid power and an average
cost savings of 10,000 USD monthly. The system is currently installed in hotels,
supermarkets, and shopping centres around the United States.
2.3. Experimental small-scale CHCP systems
The main focus of experimental CHCP research is centred on small-scale
applications. Perhaps this is due to the fact that large-scale CHCP systems are
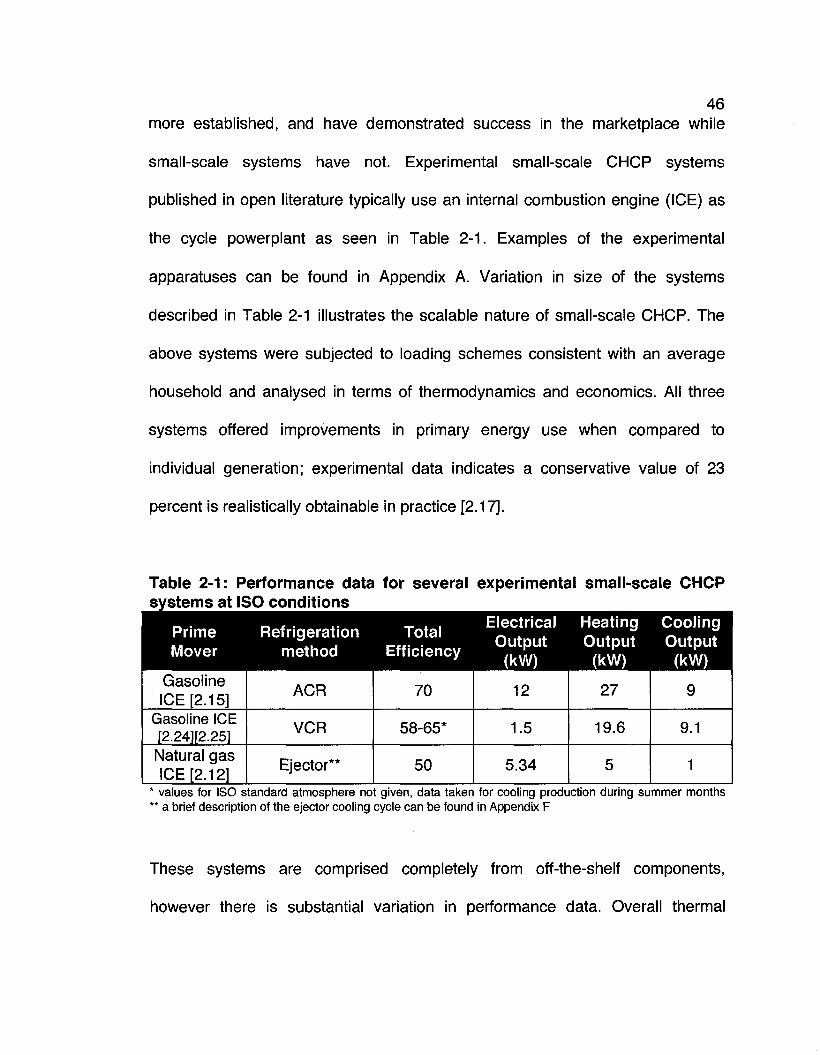
46 more established, and have demonstrated success in the marketplace while
small-scale systems have not. Experimental small-scale CHCP systems
published in open literature typically use an internal combustion engine (ICE) as
the cycle powerplant as seen in Table 2-1. Examples of the experimental
apparatuses can be found in Appendix A. Variation in size of the systems
described in Table 2-1 illustrates the scalable nature of small-scale CHCP. The
above systems were subjected to loading schemes consistent with an average
household and analysed in terms of thermodynamics and economics. All three
systems offered improvements in primary energy use when compared to
individual generation; experimental data indicates a conservative value of 23
percent is realistically obtainable in practice [2.17].
Table 2-1: Performance data for several experimental small-scale CHCP systems at ISO conditions
Prime Mover
Refrigeration method
Total Efficiency
Electrical Heating Cooling Output Output Output
(kW) (kW) (kW) Gasoline ICE [2.15]
Gasoline ICE [2.24][2.25] Natural gas ICE [2.12]
ACR
VCR
Ejector**
70
58-65*
50
12
1.5
5.34
27
19.6
5
9
9.1
1
* values for ISO standard atmosphere not given, data taken for cooling production during summer months ** a brief description of the ejector cooling cycle can be found in Appendix F
These systems are comprised completely from off-the-shelf components,
however there is substantial variation in performance data. Overall thermal
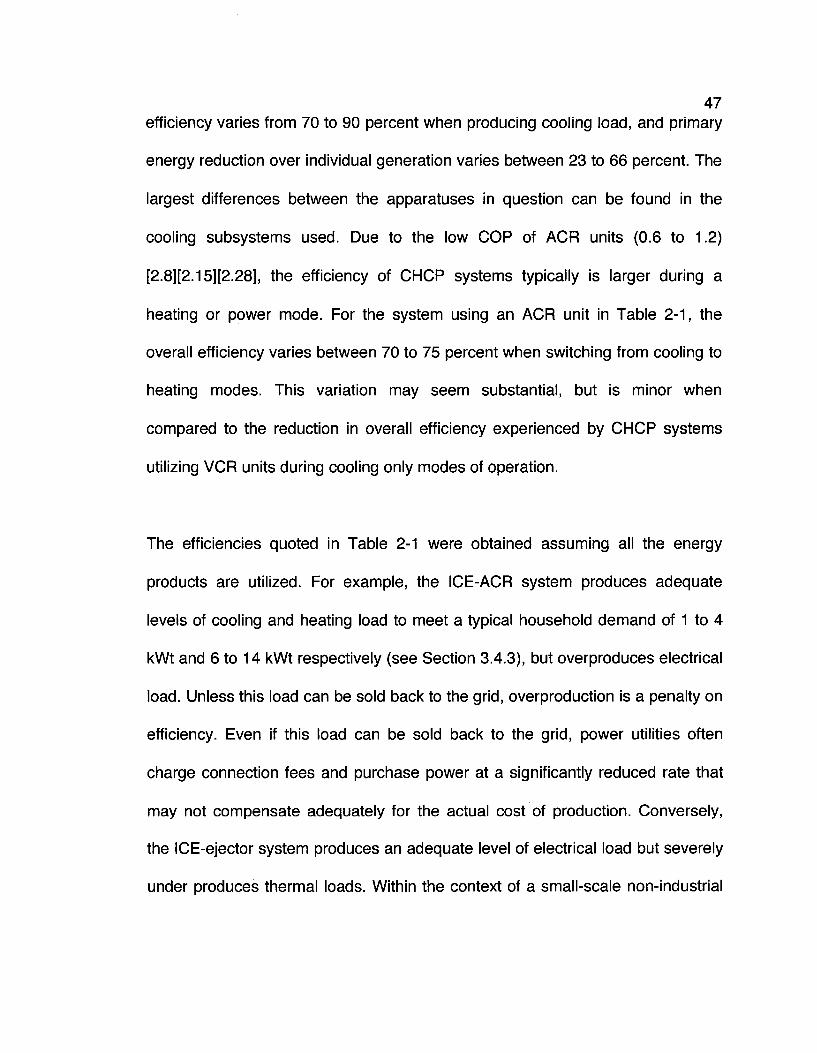
47 efficiency varies from 70 to 90 percent when producing cooling load, and primary
energy reduction over individual generation varies between 23 to 66 percent. The
largest differences between the apparatuses in question can be found in the
cooling subsystems used. Due to the low COP of ACR units (0.6 to 1.2)
[2.8][2.15][2.28], the efficiency of CHCP systems typically is larger during a
heating or power mode. For the system using an ACR unit in Table 2-1, the
overall efficiency varies between 70 to 75 percent when switching from cooling to
heating modes. This variation may seem substantial, but is minor when
compared to the reduction in overall efficiency experienced by CHCP systems
utilizing VCR units during cooling only modes of operation.
The efficiencies quoted in Table 2-1 were obtained assuming all the energy
products are utilized. For example, the ICE-ACR system produces adequate
levels of cooling and heating load to meet a typical household demand of 1 to 4
kWt and 6 to 14 kWt respectively (see Section 3.4.3), but overproduces electrical
load. Unless this load can be sold back to the grid, overproduction is a penalty on
efficiency. Even if this load can be sold back to the grid, power utilities often
charge connection fees and purchase power at a significantly reduced rate that
may not compensate adequately for the actual cost of production. Conversely,
the ICE-ejector system produces an adequate level of electrical load but severely
under produces thermal loads. Within the context of a small-scale non-industrial
48 process where loads vary widely, experimental small-scale CHCP systems
currently discussed in open literature require additional components to buffer
loads. This can take the form of a battery system to deal with over- or under
production of electrical load, or a backup boiler or furnace to deal with peak
thermal loads. The systems shown in Table 2-1 are insufficient to replace
individual generation systems while maintaining or improving economic
performance.
All three systems were compared to individual generation of electrical and
thermal loads on site. System economic performance was not compared against
purchasing grid power, electric load was satisfied on site with a generator. This is
not a fair economic comparison, as most consumers regardless of size or
classification (commercial, industrial, residential) do not generate power on site.
Designing CHCP systems that are economically superior to grid power is much
more difficult to accomplish, as grid power is usually significantly cheaper to
purchase than it is to produce using a genset; the system described in Chapter 3
is designed to compete with grid power.
2.4. Simulated small-scale CHCP systems
In addition to experimental small-scale CHCP systems discussed in open
literature, there are several simulated systems that warrant comment. Two
49 systems in the sub 100 kWe range were found, summarized in Table 2-2.
Table 2-2: Performance data for simulated small-scale CHCP systems
Prime Mover Cooling method
n .. Electrical Heating Cooling ,_.,. . Output Output Output Efficiency » * ^
Microturbine [2.17]
Stirling [2.14]
ACR and VCR ACR
70
89
100
50
117.6
76
75.8
70
The microturbine powered CHCP simulation ran two iterations which differed in
the method by which thermal load was provided; one used an ACR unit, while the
other used a heat exchanger and VCR unit. A load profile based upon a
commercial retail space was used, the dimensions of the space was scaled
according to the thermal output of the CHCP system. As was expected, the ACR
unit was superior to the VCR unit economically based upon a full year simulation;
capital costs were not taken into account in the simulation. Similar to the
experimental systems, both simulated systems made the key assumption that all
energy products were used on site in overall efficiency and economic
calculations, which is most likely not the case.
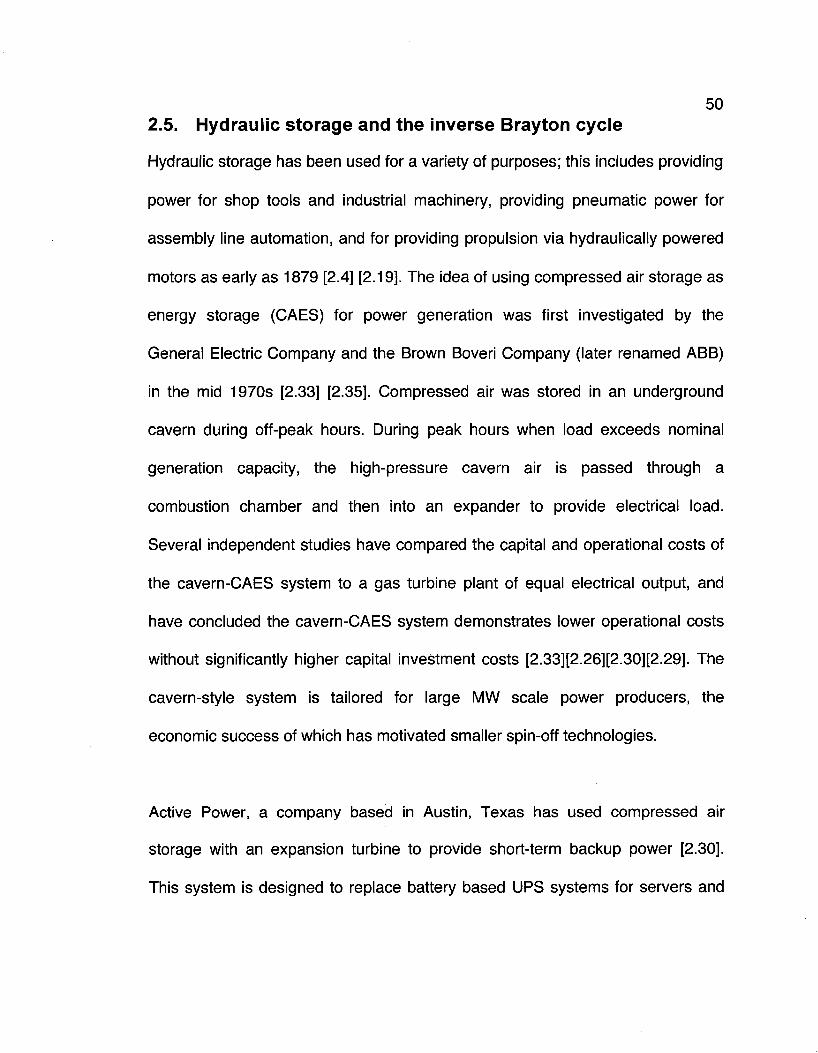
50 2.5. Hydraulic storage and the inverse Brayton cycle
Hydraulic storage has been used for a variety of purposes; this includes providing
power for shop tools and industrial machinery, providing pneumatic power for
assembly line automation, and for providing propulsion via hydraulically powered
motors as early as 1879 [2.4] [2.19]. The idea of using compressed air storage as
energy storage (CAES) for power generation was first investigated by the
General Electric Company and the Brown Boveri Company (later renamed ABB)
in the mid 1970s [2.33] [2.35]. Compressed air was stored in an underground
cavern during off-peak hours. During peak hours when load exceeds nominal
generation capacity, the high-pressure cavern air is passed through a
combustion chamber and then into an expander to provide electrical load.
Several independent studies have compared the capital and operational costs of
the cavern-CAES system to a gas turbine plant of equal electrical output, and
have concluded the cavern-CAES system demonstrates lower operational costs
without significantly higher capital investment costs [2.33][2.26][2.30][2.29]. The
cavern-style system is tailored for large MW scale power producers, the
economic success of which has motivated smaller spin-off technologies.
Active Power, a company based in Austin, Texas has used compressed air
storage with an expansion turbine to provide short-term backup power [2.30].
This system is designed to replace battery based UPS systems for servers and

51 other sensitive equipment and is capable of providing 20 kWe of continuous
power for 15 minutes. Some key advantages of the system include a long service
life of 20 years, a higher power density than lead acid batteries, and modular
construction. There is no danger of power discharge during storage, ensuring
100 percent readiness at all times. This system demonstrates the environmental
benefits of using CAES. Eliminating space consuming, environmentally harmful
batteries, which require frequent replacement not only improves system life, but
is also more suited to a growing population of consumers who wish to reduce
their environmental impact.
Others have seen the potential for small-scale hydraulic storage power systems
and have attempted to improve on the idea. A team from Lausanne, Switzerland
has modelled and built an experimental prototype of a hydraulic-pneumatic
storage hybrid system that promises greater efficiency and energy density over a
strictly pneumatic system [2.29]. The system uses a motor/generator to pump
hydraulic fluid into an accumulator already pressurized with air. When emergency
power is required, high-pressure hydraulic fluid is discharged through a hydraulic
motor, producing 1 to 4 kWe via the motor/generator. This system has the
advantage of extracting work from the hydraulic fluid at higher efficiencies than a
turbo-expander can from air; using a liquid as the working fluid allows much
higher specific work output as well. The end result is a significantly higher power
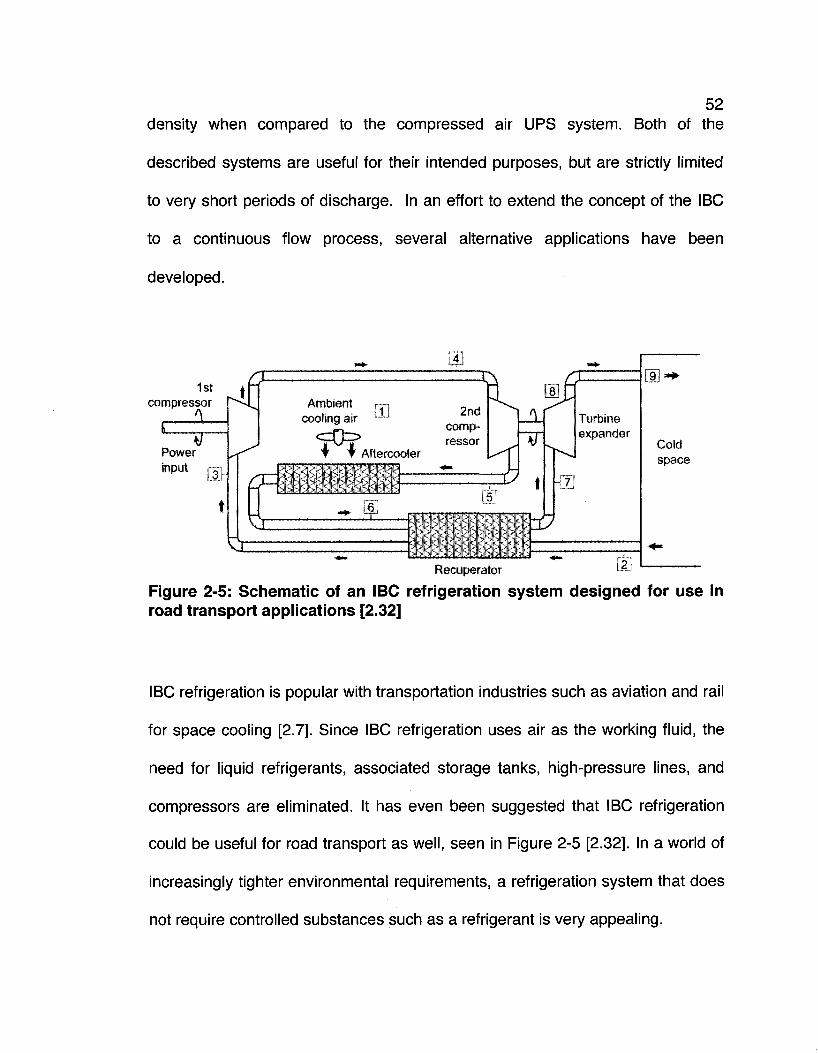
52 density when compared to the compressed air UPS system. Both of the
described systems are useful for their intended purposes, but are strictly limited
to very short periods of discharge. In an effort to extend the concept of the IBC
to a continuous flow process, several alternative applications have been
developed.
1st compressor Ambient 03 cooling air
c~Tfc> t T Aftercooler
2nd compressor
Turbine expander
& • •
Cold space
Recuperator
Figure 2-5: Schematic of an IBC refrigeration system designed for use in road transport applications [2.32]
IBC refrigeration is popular with transportation industries such as aviation and rail
for space cooling [2.7]. Since IBC refrigeration uses air as the working fluid, the
need for liquid refrigerants, associated storage tanks, high-pressure lines, and
compressors are eliminated. It has even been suggested that IBC refrigeration
could be useful for road transport as well, seen in Figure 2-5 [2.32]. In a world of
increasingly tighter environmental requirements, a refrigeration system that does
not require controlled substances such as a refrigerant is very appealing.
53 In general, IBC refrigeration cycles demonstrate COP values half that of VCR
units if generic components are used. However IBC refrigeration COP
approaching or exceeding that of VCR units has been demonstrated for
optimized systems built using specifically designed turbomachinery and heat
exchanging equipment [2.7][2.32]; this emphasises the importance of careful
design of an IBC system. Inefficient designs could result in unnecessary
abandonment due to poor performance results.
IBC technologies can be applied to gensets as well. Gas turbines experience
significant reductions in specific power output and thermal efficiency in high-
temperature environments. Systems have been proposed to reduce inlet
temperatures including thermal storage [2.20], evaporative cooling [2.6], and IBC
refrigeration [2.34]. Gas turbines have very high mass flow rates when compared
to reciprocating engines, and therefore require high-capacity inlet cooling
refrigeration equipment; IBC refrigeration systems have similar mass flow rates to
gas turbines, making them ideal for increasing performance of gas turbine
gensets in hot weather conditions.
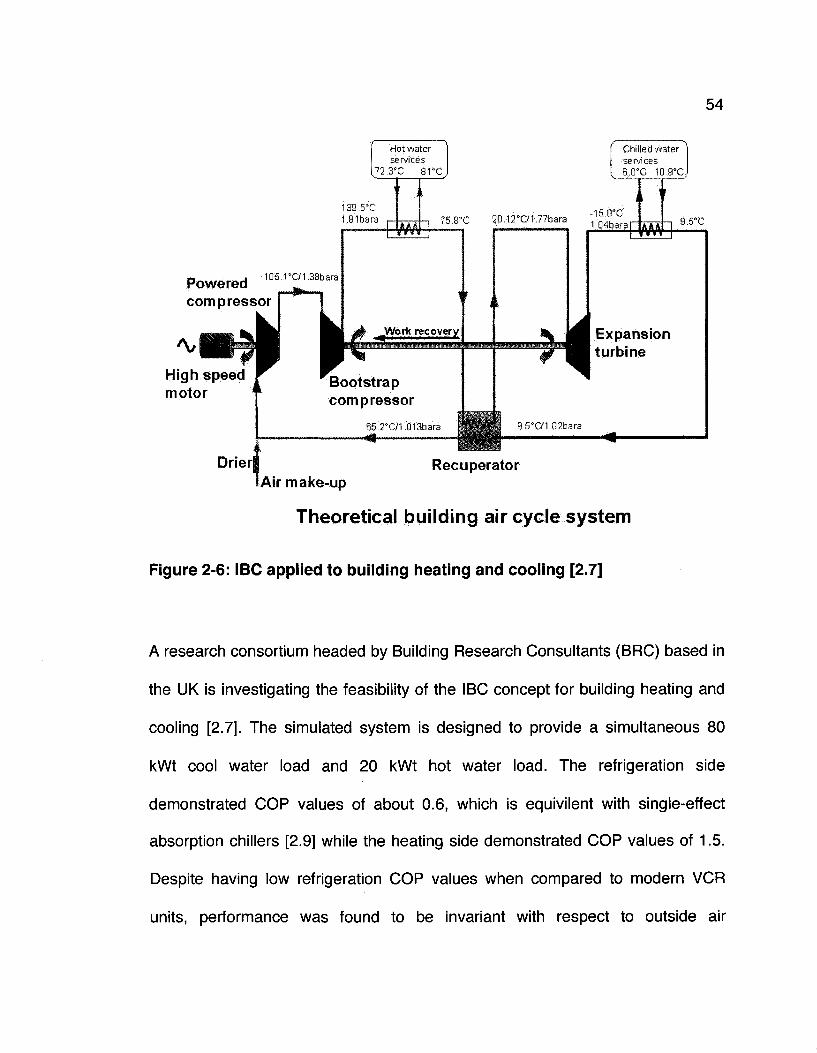
54
Hot water services
72.3°c .ere
Powered compressor
*\,
High speed motor
Drier!
105.1 °C/1.38bara
Bootstrap compressor
i. 65.rC/1.Q13bara
Chilled water services 6.0'c 10,ETC
-15.0°C 1,04bara
f T T T i.S-C
i Expansion turbine
9.5°ai.02bara
Recuperator Air make-up
Theoretical building air cycle system
Figure 2-6: IBC applied to building heating and cooling [2.7]
A research consortium headed by Building Research Consultants (BRC) based in
the UK is investigating the feasibility of the IBC concept for building heating and
cooling [2.7]. The simulated system is designed to provide a simultaneous 80
kWt cool water load and 20 kWt hot water load. The refrigeration side
demonstrated COP values of about 0.6, which is equivilent with single-effect
absorption chillers [2.9] while the heating side demonstrated COP values of 1.5.
Despite having low refrigeration COP values when compared to modern VCR
units, performance was found to be invariant with respect to outside air
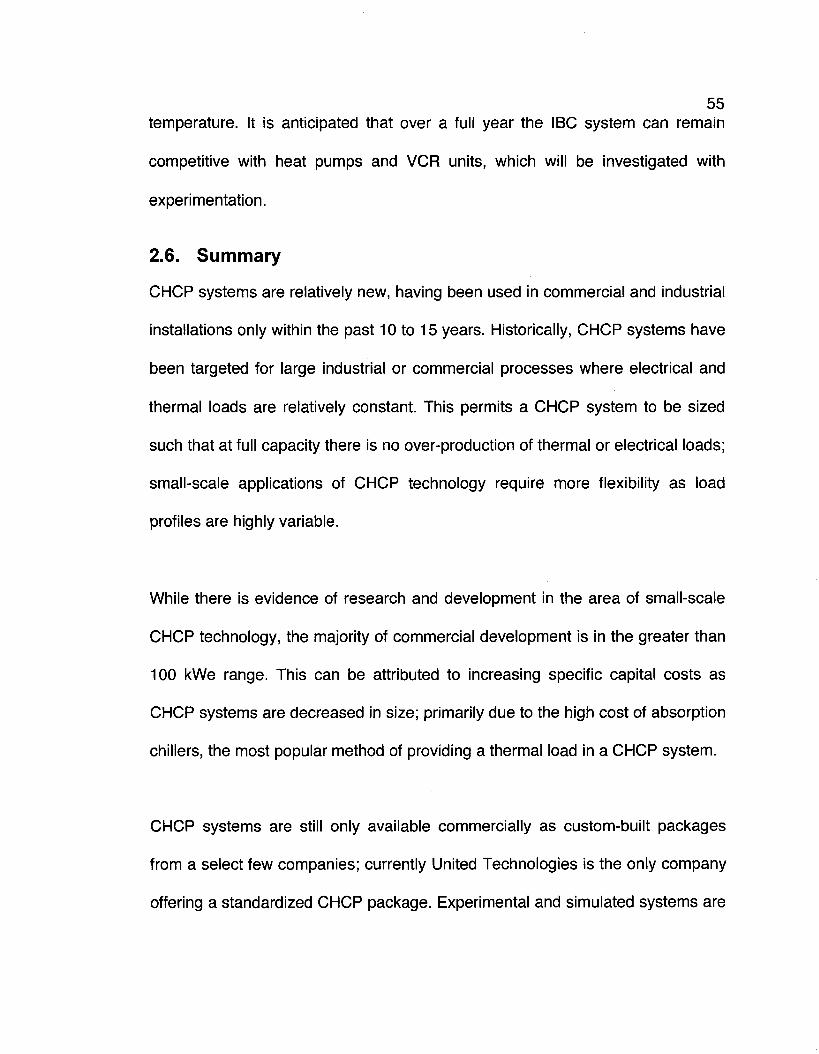
55 temperature. It is anticipated that over a full year the IBC system can remain
competitive with heat pumps and VCR units, which will be investigated with
experimentation.
2.6. Summary
CHCP systems are relatively new, having been used in commercial and industrial
installations only within the past 10 to 15 years. Historically, CHCP systems have
been targeted for large industrial or commercial processes where electrical and
thermal loads are relatively constant. This permits a CHCP system to be sized
such that at full capacity there is no over-production of thermal or electrical loads;
small-scale applications of CHCP technology require more flexibility as load
profiles are highly variable.
While there is evidence of research and development in the area of small-scale
CHCP technology, the majority of commercial development is in the greater than
100 kWe range. This can be attributed to increasing specific capital costs as
CHCP systems are decreased in size; primarily due to the high cost of absorption
chillers, the most popular method of providing a thermal load in a CHCP system.
CHCP systems are still only available commercially as custom-built packages
from a select few companies; currently United Technologies is the only company
offering a standardized CHCP package. Experimental and simulated systems are

56 discussed in open literature, however they are often sized for medium to large
applications (greater than 50 kWe). There is no system currently discussed in
open literature, or available on the market, that provides an energy islanding
CHCP solution for residential or small-scale commercial users at an economical
specific capital and maintenance cost.
While CHCP systems may be relatively new, the use of accumulators in
combination with the IBC is not. The two concepts have been combined to
produce emergency power, but have not been applied to a continuous flow power
cycle for small-scale application before. The IBC has been used for mobile
refrigeration applications, and more recently is being applied to building heating
and cooling. Despite the wide variety of simulated, tested, and commercially
applied IBC systems, there exists no IBC system applied to a trigeneration cycle
for small-scale applications. This thesis will investigate the feasibility of such a
system and report on simulated thermodynamic and economic performance. The
simulated trigeneration system will be compared against individual generation
using an air conditioning system, natural gas furnace, and grid power.

Chapter 3 Description of Model and Simulation
3.1 . Overview of Model
This section describes the design and simulation of an indirectly fired
trigeneration system with hydraulic accumulation as shown in Figure 3-2 and
Figure 3-3. The system is composed of a conventional microturbine, with a
network of heat exchangers in lieu of a conventional burner section. By using an
indirectly fired process, combustion gases never mix with microturbine flow,
allowing microturbine exhaust to be used for household heating or cooling. An air
accumulator is used as an energy storage device when the microturbine
overproduces electrical load. The compressed air stored in the accumulator is
used to generate power and thermal loads when the microturbine is turned off.
Two different heat exchanger configurations are used, Mode 1 for heating loads,
and Mode 2 for cooling loads as shown in Figure 3-2 and Figure 3-3 respectively.
3.2. Initial system design
The initial concept for the trigeneration system had one configuration for cooling
and heating modes as shown in Figure 3-1. Key differences between the initial
concept and the final system shown in Figure 3-2 and Figure 3-3 are
summarized here:
• Initial system design called for the accumulator to be charged with bleed air
57

58 from the microturbine compressor instead of using a separate compressor
• Same HEN configuration was used for both cooling and heating modes
• No secondary expander
• No in-ground #4 Hx
• Accumulator flow was not cycled through the HEN in heating mode
Once initial simulations were run, it was immediately apparent that the initial
configuration had operational difficulties that would prevent it from satisfying a
highly variable thermal and electrical load. The following sections describe the
modifications made to the base system in an effort to increase thermodynamic
and economic performance, and the related effect on system response.
59
from outside
Combustor H *
I . - . . . . . . . _ -
_ Clean Air _ side
Combustion Side
Accumulator Flow
„ Electrical load
from outside
to _ outside
Figure 3-1: Original trigeneration system design

60 3.3. Final system design
The following is a description of the final configuration and method of operation
used in the final simulation.
MICROTURBINE OPERATION:
In this system, the microturbine is used to:
1) Meet household electrical load demands.
2) Provide a heat load when operating in Mode 1.
3) Charge the accumulator.
As the microturbine almost always produces an electrical output in excess of
household demand, the excess is fed to a secondary compressor which charges
the accumulator.
INVERSE BRAYTON CYCLE (IBC):
The IBC is used to:
1) Provide household electrical load when the microturbine is not running.
2) Provide a heating load in Mode 1 when the microturbine is not running.
While the microturbine produces a thermal load in excess of household
demand, the IBC produces less than household demand.
3) Meet household cooling load in Mode 2. The IBC consists of the
secondary compressor, #4 Hx, accumulator, and secondary expander.

61 GENERAL ASSUMPTIONS AND CONSTANTS:
The following are a set of assumptions and constants that are applied to all
components and throughout the simulation:
• Air was treated as a perfect gas with a composition of 21 percent O2, 79
percent N2, and zero moisture
• No transient behaviour was modelled
• Pa= 101.325 kPa
• R=287 J/kgK
MODE 1:
Is used to produce electric and heat loads. Mode 1 does not cycle microturbine
expander exhaust through the heat exchanger network (HEN), thereby providing
high temperature flow for household heating. During accumulator discharge,
accumulator flow is directed through the HEN where flow temperature is
increased before discharge through the secondary expander; this increases the
thermal output of the IBC.
MODE 2:
Is used to produce a cooling load. Microturbine exhaust is no longer required for
heating purposes, therefore it is used to pre-heat HEN combustion air before
being vented to atmosphere. Mode 2 meets household thermal demands using
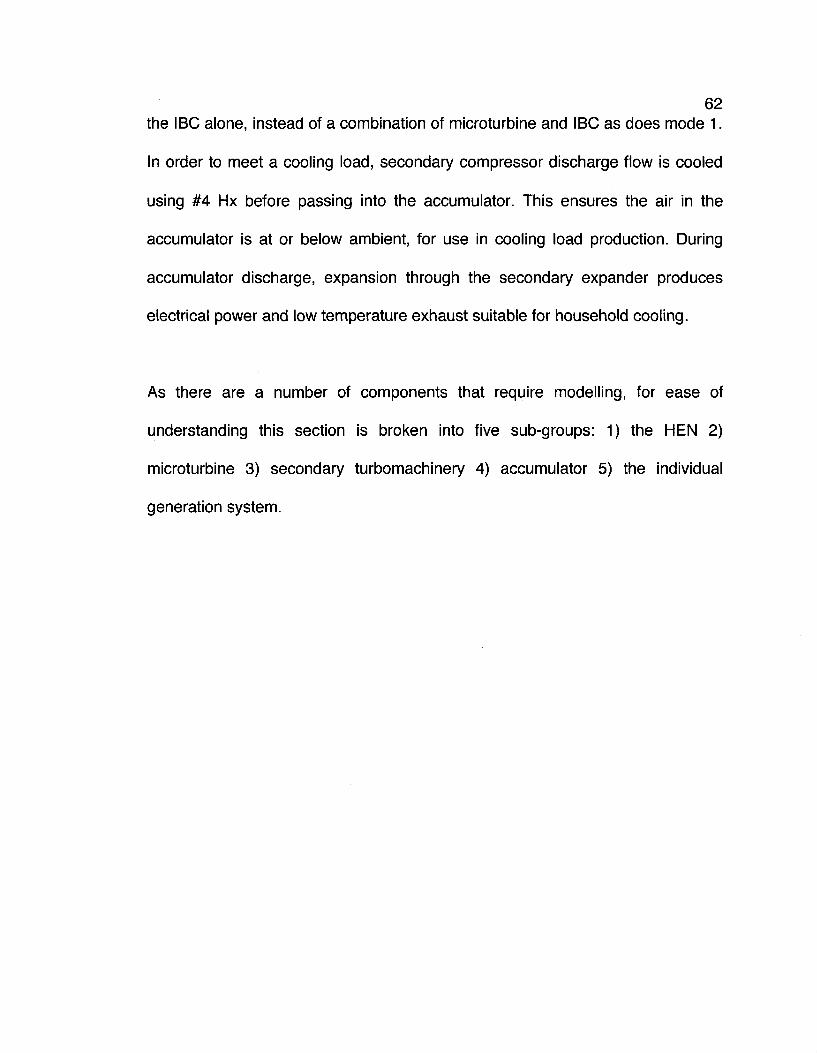
62 the IBC alone, instead of a combination of microturbine and IBC as does mode 1.
In order to meet a cooling load, secondary compressor discharge flow is cooled
using #4 Hx before passing into the accumulator. This ensures the air in the
accumulator is at or below ambient, for use in cooling load production. During
accumulator discharge, expansion through the secondary expander produces
electrical power and low temperature exhaust suitable for household cooling.
As there are a number of components that require modelling, for ease of
understanding this section is broken into five sub-groups: 1) the HEN 2)
microturbine 3) secondary turbomachinery 4) accumulator 5) the individual
generation system.
63
31 (outside)
11 (outside) ••( Accumulator
#1 Hx
s
I I B
24 I
35
$ -
14
13 or 34
J #2 Hx
«*•»»•
23 I . Combustor
_. Clean Air side
Combustion Side
Accumulator Flow
m Electrical load
excess power
22 #3 Hx
21 - — (outside)
26 (to outside)
Figure 3-2: Schematic of trigeneration system in heating mode (Mode 1)
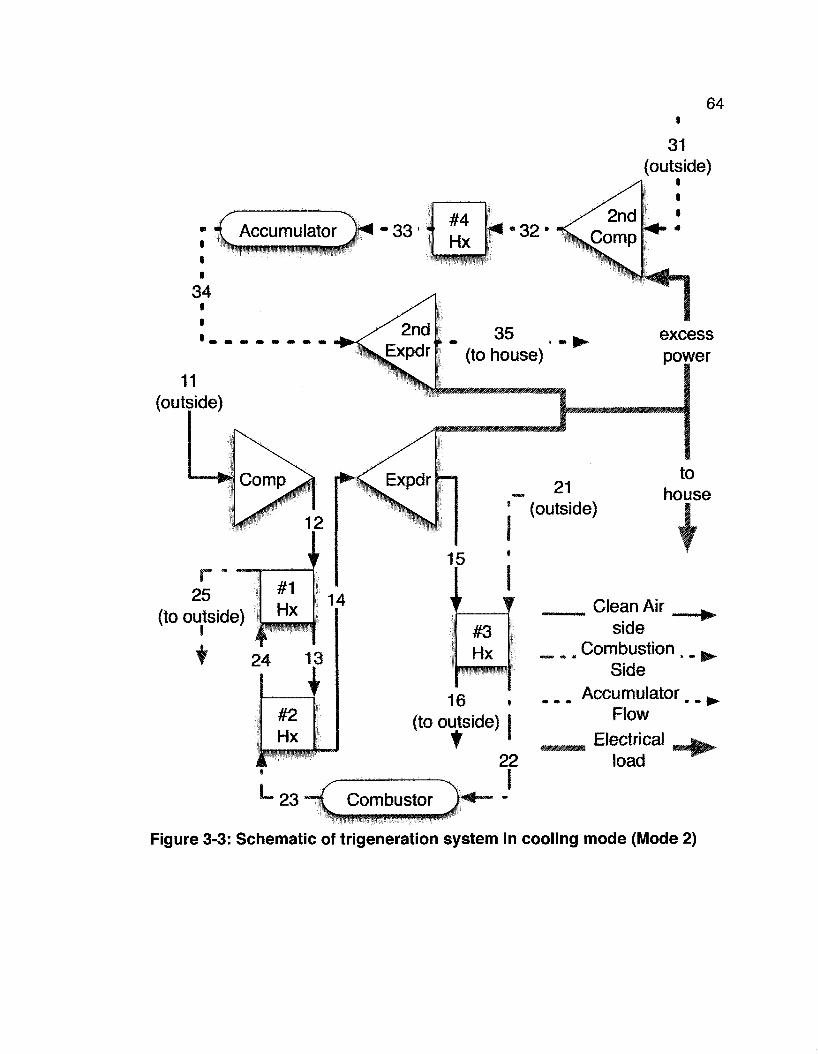
1
31 (outside)
: < Accumulator • 3 3 ' 1
#4 Hx
•mmmmmm
32
34 i i i m
11 (outside)
35 (to house)
excess power
21 ' (outside)
to house
f
(to outside)
Combustor
16 (to outside) I
22 I
„ Clean Air _ side
Combustion Side
Accumulator Flow
_ Electrical mm
load
. •
Figure 3-3: Schematic of trigeneration system in cooling mode (Mode 2)
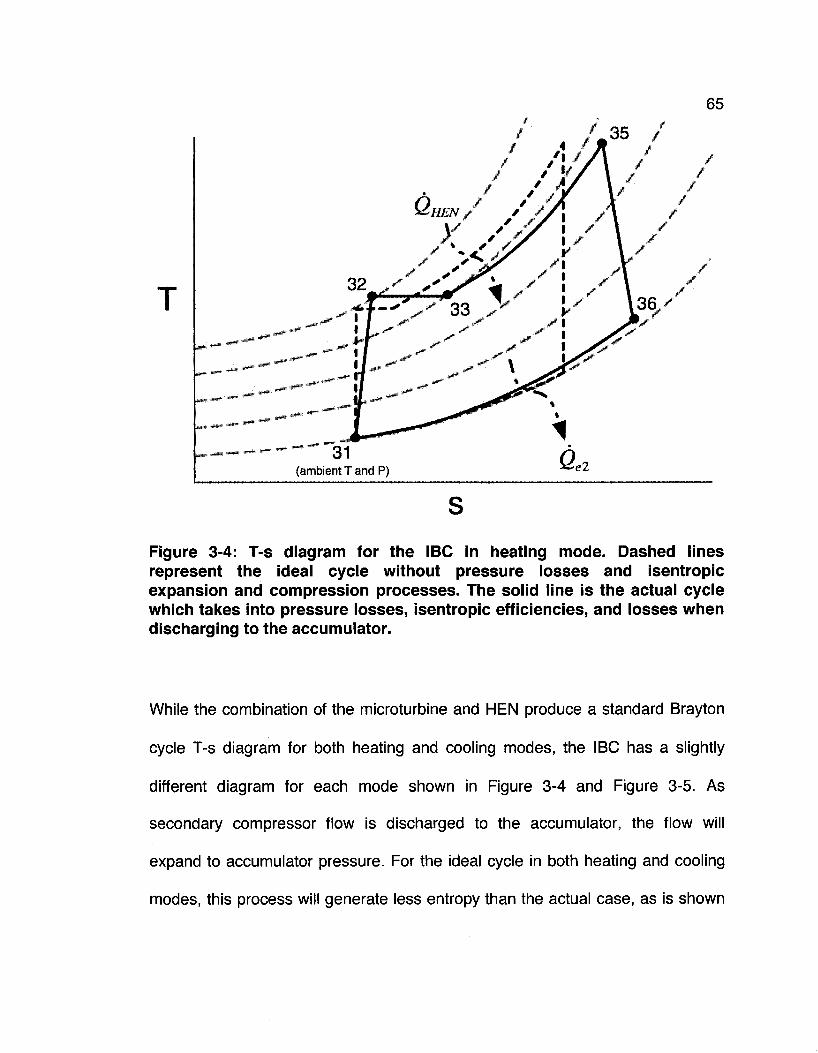
65
T
' /A
~ 31 (ambient T and P)
Figure 3-4: T-s diagram for the IBC in heating mode. Dashed lines represent the ideal cycle without pressure losses and isentropic expansion and compression processes. The solid line is the actual cycle which takes into pressure losses, isentropic efficiencies, and losses when discharging to the accumulator.
While the combination of the microturbine and HEN produce a standard Brayton
cycle T-s diagram for both heating and cooling modes, the IBC has a slightly
different diagram for each mode shown in Figure 3-4 and Figure 3-5. As
secondary compressor flow is discharged to the accumulator, the flow will
expand to accumulator pressure. For the ideal cycle in both heating and cooling
modes, this process will generate less entropy than the actual case, as is shown
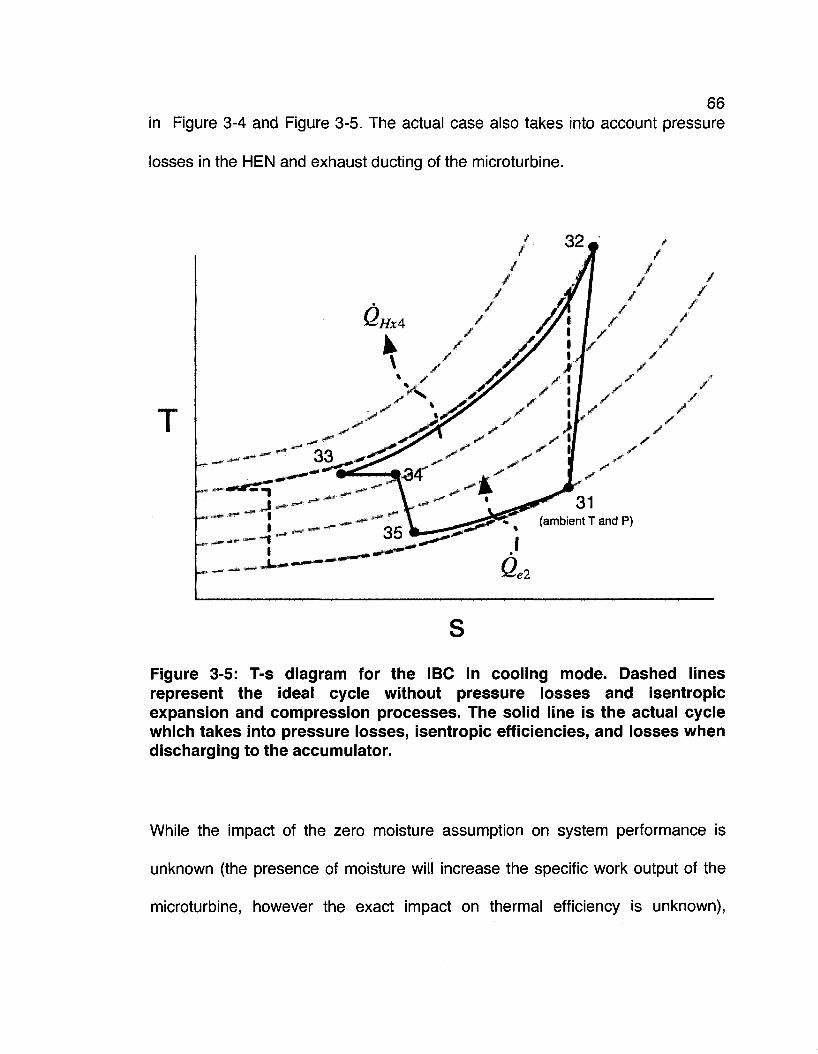
66 in Figure 3-4 and Figure 3-5. The actual case also takes into account pressure
losses in the HEN and exhaust ducting of the microturbine.
T
Figure 3-5: T-s diagram for the IBC in cooling mode. Dashed lines represent the ideal cycle without pressure losses and isentropic expansion and compression processes. The solid line is the actual cycle which takes into pressure losses, isentropic efficiencies, and losses when discharging to the accumulator.
While the impact of the zero moisture assumption on system performance is
unknown (the presence of moisture will increase the specific work output of the
microturbine, however the exact impact on thermal efficiency is unknown),
67 operational impact is less ambiguous. The presence of micro droplets in the air
poses a problem for turbomachinery, as impingement of these droplets will have
a negative impact on efficiency and cause pitting on blade and stator surfaces.
Presence of moisture in the IBC flow path will pose a problem for accumulator
and valve oxidation, in addition to the impact on turbomachinery. Drying inlet air
is a prudent course of action, should the theoretical model described in this
chapter be practically implemented.
3.3.1. Heat exchanger network (HEN)
The HEN is required to indirectly fire the microturbine. A series of three heat
exchangers are used to raise the temperature of compressor discharge flow
before discharge to the microturbine expander. The HEN operates in two
different configurations for heating and cooling loads, and are described
separately. This section deals with both on-design and off-design operation of the
HEN.
3.3.1.1. On-design operation (maximum #2 Hx temperature operation)
ASSUMPTIONS AND CONSTANTS:
• £= 0.9 for all exchangers
• Zero fouling was assumed
• AP, = 2 percent (applied across each heat exchanger)
• *?«»*= 0.99
• Combustion side and air side mass flows are equal
• T =1200K max
• Ground around #4 Hx has an infinite heat capacity and a
temperature of 8°C (281 K)
• Fuelled with natural gas (LHV = 50 MJ/kg)
INPUTS:
• Compressor discharge enthalpy and pressure: hl2, Pn
• Ambient conditions: ha, Pa
OUTPUTS:
• Specific fuel flow: mf
• Expander inlet enthalpy and pressure: hu, Pl4
DECISION CHARTS:
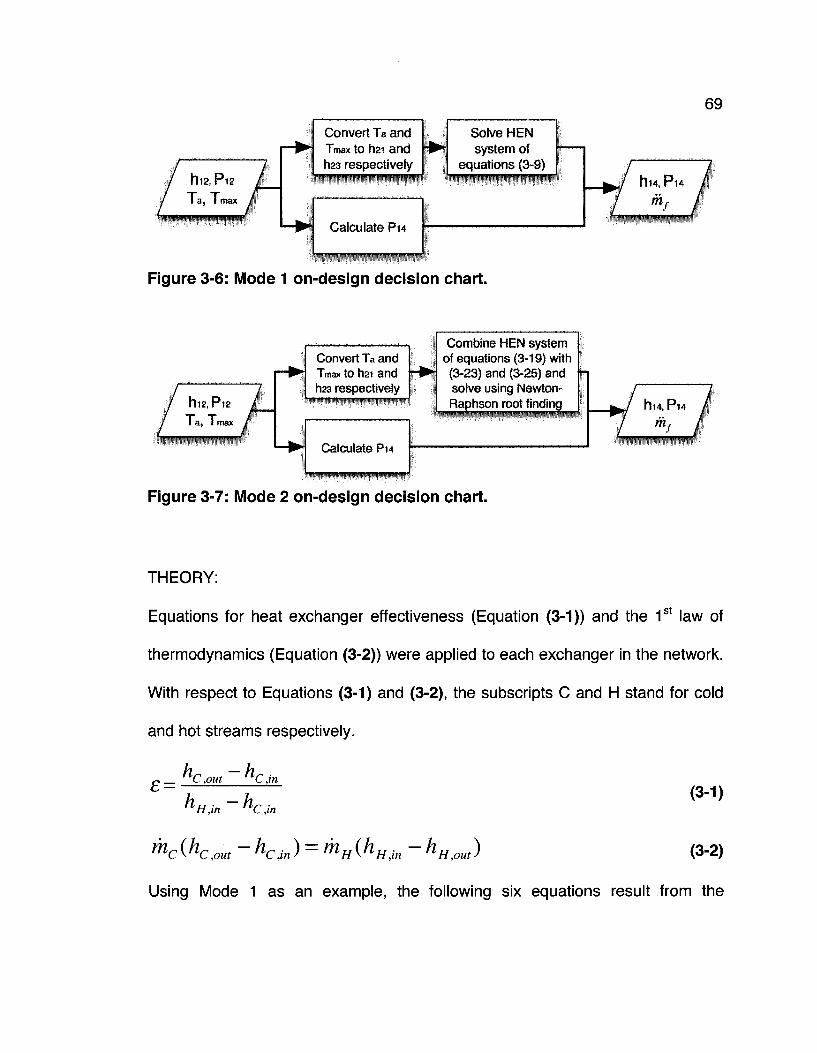
69
/ hl2, Pl2 / ' Ta, Tmax / , ™ , ^ • " , ^ " < ! ^ * * * * , * * "
Convert Ta and Tmax to ri2i and h23 respectively
Calculate Pn
Solve HEN system of
equations (3-9) / . „ / ^ / hu,Pl4 /
/ Mf I
Figure 3-6: Mode 1 on-design decision chart.
/ K D / / rti2, P12 / / l a , Tmax /
Convert Ta and 1 max to h2i and
h23 respectively
Calculate P14
Combine HEN system of equations (3-19) with (3-23) and (3-25) and solve using Newton-Raphson root finding / / ^ hl4.Pl4 /
W / / ^ l
Figure 3-7: Mode 2 on-design decision chart.
THEORY:
Equations for heat exchanger effectiveness (Equation (3-1)) and the 1st law of
thermodynamics (Equation (3-2)) were applied to each exchanger in the network.
With respect to Equations (3-1) and (3-2), the subscripts C and H stand for cold
and hot streams respectively.
£ = h -h nC,out nC,in
"-H,in ~'lC,in
(3-1)
™C(hC,out ~ kCJn) = MH^HM ~ hH,out) (3-2)
Using Mode 1 as an example, the following six equations result from the
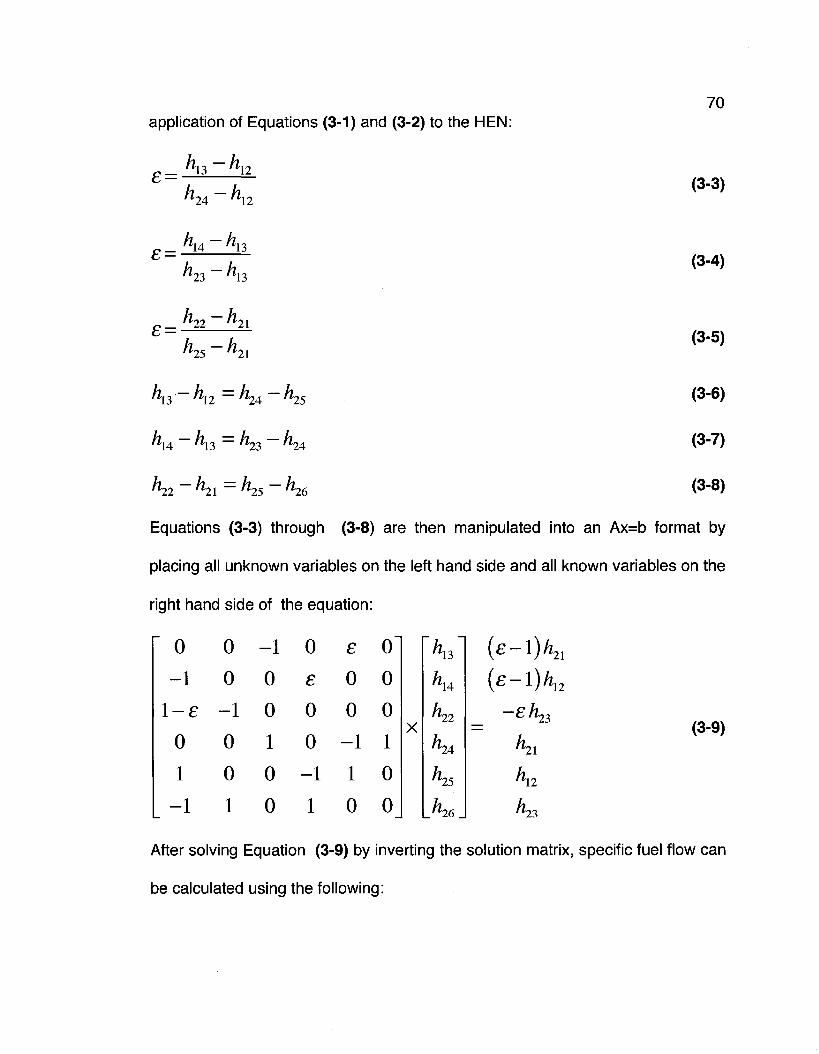
application of Equations (3-1) and (3-2) to the HEN:
h -h
h -h
h -h
"14 "13
^23 _ ^13
At2 5 At 2 1
^13 _ ^12 — ^24 " " ^ 2 5
hu hl3 n23 h24
"-2% " 2 1 — "25 "26
70
(3-3)
(3-4)
(3-5)
(3-6)
(3-7)
(3-8)
Equations (3-3) through (3-8) are then manipulated into an Ax=b format by
placing all unknown variables on the left hand side and all known variables on the
right hand side of the equation:
0 -1
-e 0
1
-1
0 0
-1
0
0
1
-1 0
0
1
0
0
0 e
0
0
-1
1
£
0
0
-1
1
0
0 0
0
1
0
0
X
"13
14
22
24
25
'26.
(e-l)h2l
{e-l)hl2
-eh '23 (3-9) 21
12
'23
After solving Equation (3-9) by inverting the solution matrix, specific fuel flow can
be calculated using the following:
h -h mf =— — (3-10)
I comb
HEN discharge pressure (expander inlet pressure) is calculated using the
assumption that each heat exchanger has a 2 percent pressure loss:
P14=P12(0.982) (3-11)
Heat exchanger #4 is not included in the HEN system of equations as there is no
relationship between the inlet and outlet enthalpies of the #4 Hx and the HEN.
The inlet and outlet enthalpies of the HEN are not independent of one another;
they must be solved simultaneously. This is not true for #4 Hx, which is
independent of the HEN. The discharge temperature for #4 Hx is simply
calculated using an adaptation of Equation (3-1) where Tout is accumulator inlet
temperature and Tin is secondary compressor discharge temperature; an
effectiveness of 0.95 was assumed for the #4 Hx:
Tout = £4 [Tground ~Tin) + *in (3_12)
The HEN solution method for Mode 2 differs from Mode 1. This is due to the fact
that as flow is directed through different paths from the heating mode, there are
different unknowns. The cooling mode system of equations has one more
unknown than equations. It therefore has to be implicitly solved with expander
discharge temperature Equations (3-26) and (3-27). This is done by using a
symbolic variable for hl5 to allow MATLAB™ to solve the system of equations
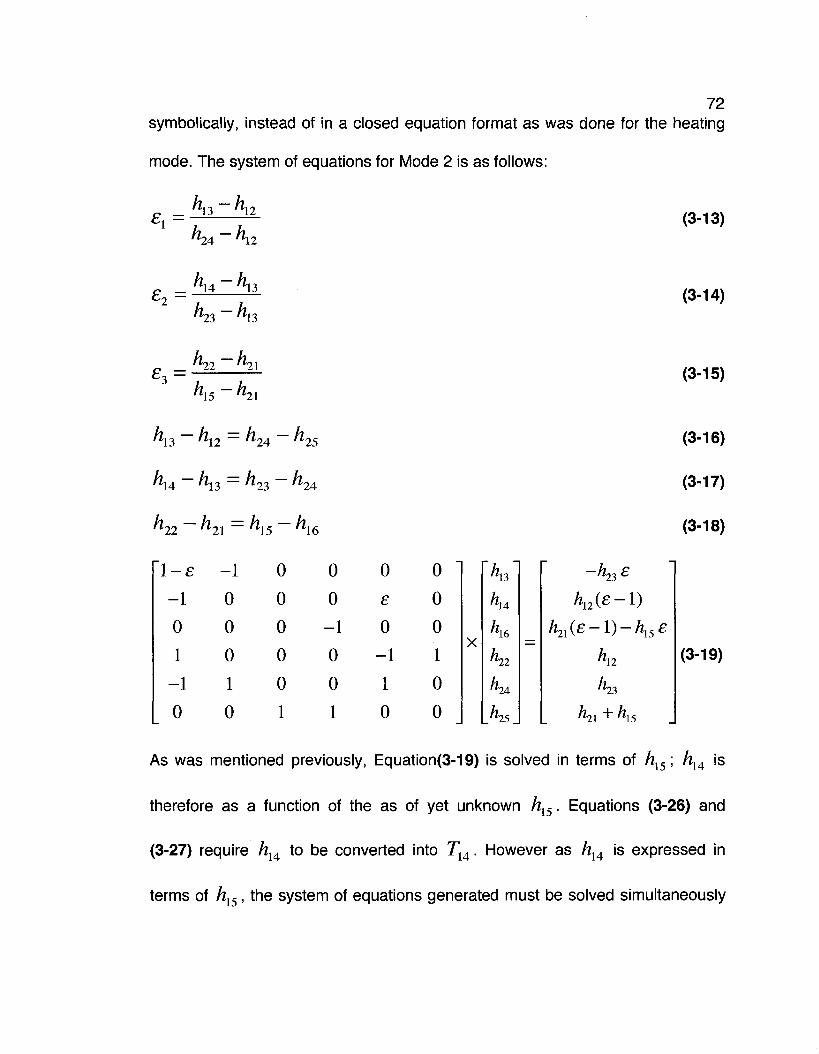
72 symbolically, instead of in a closed equation format as was done for the heating
mode. The system of equations for Mode 2 is as follows:
£1 = _ /zj3 — h 12
h -h n24 nn
(3-13)
£2 = h -h nU At13
^23 _ ^13
(3-14)
£3 = h -h
h -h "15 n2\
(3-15)
"h.3 "hi ~ ^24 . 25
'h.A ^13 ~~ ^ 2 3 ^ 2 4
h -At22
"1-e -1
0
1
-1
0
h. n
-1
0
0
0
1
0
hl5-i
0
0
0
0
0
1
&16
0
0
-1
0
0
1
0
£
0
-1
1
0
0
0
0
1
0
0
X
13
14
16
22
24
25
n23 £
hn{£-\)
h2l(e -1) - hl5 e
Ki h n23
K + Ks
(3-16)
(3-17)
(3-18)
(3-19)
As was mentioned previously, Equation(3-19) is solved in terms of hl5; h14 is
therefore as a function of the as of yet unknown hl5. Equations (3-26) and
(3-27) require hu to be converted into T14. However as hA is expressed in
terms of /z15, the system of equations generated must be solved simultaneously
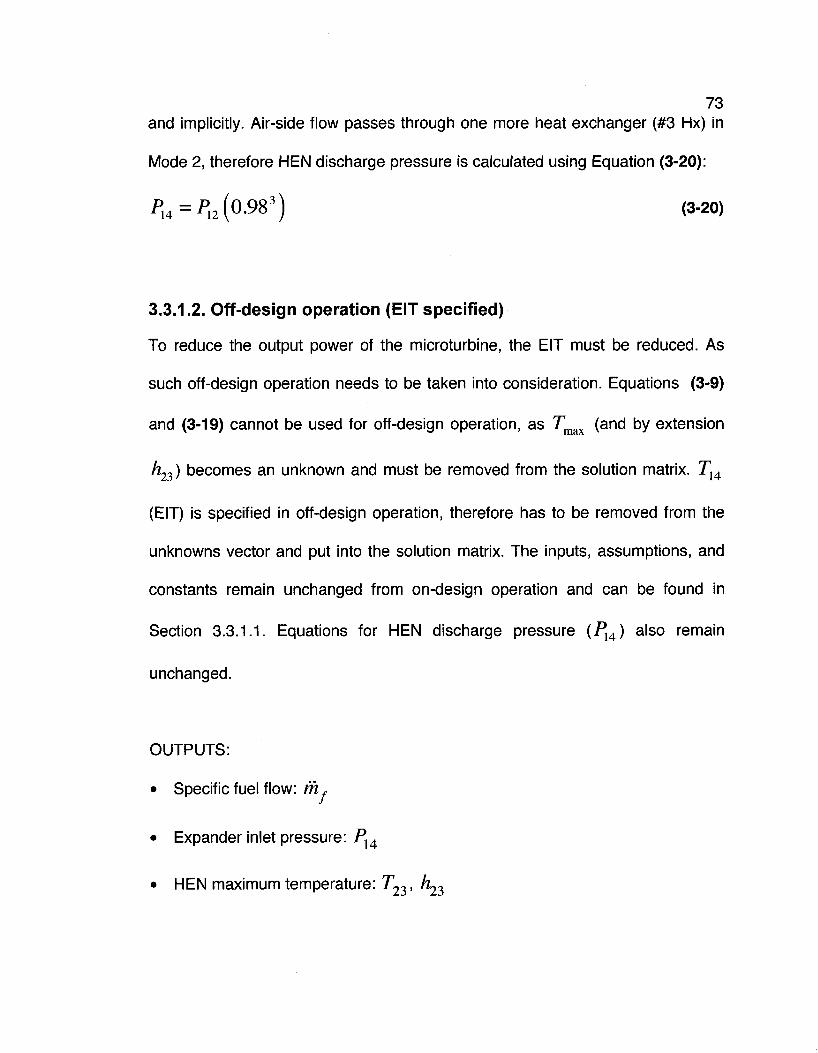
73 and implicitly. Air-side flow passes through one more heat exchanger (#3 Hx) in
Mode 2, therefore HEN discharge pressure is calculated using Equation (3-20):
P 1 4 = P 1 2 ( 0 . 9 8 3 ) (3-20)
3.3.1.2. Off-design operation (EIT specified)
To reduce the output power of the microturbine, the EIT must be reduced. As
such off-design operation needs to be taken into consideration. Equations (3-9)
and (3-19) cannot be used for off-design operation, as Tmax (and by extension
h23) becomes an unknown and must be removed from the solution matrix. TH
(EIT) is specified in off-design operation, therefore has to be removed from the
unknowns vector and put into the solution matrix. The inputs, assumptions, and
constants remain unchanged from on-design operation and can be found in
Section 3.3.1.1. Equations for HEN discharge pressure (P14) also remain
unchanged.
OUTPUTS:
• Specific fuel flow: mf
• Expander inlet pressure: P14
• HEN maximum temperature: T23, h^
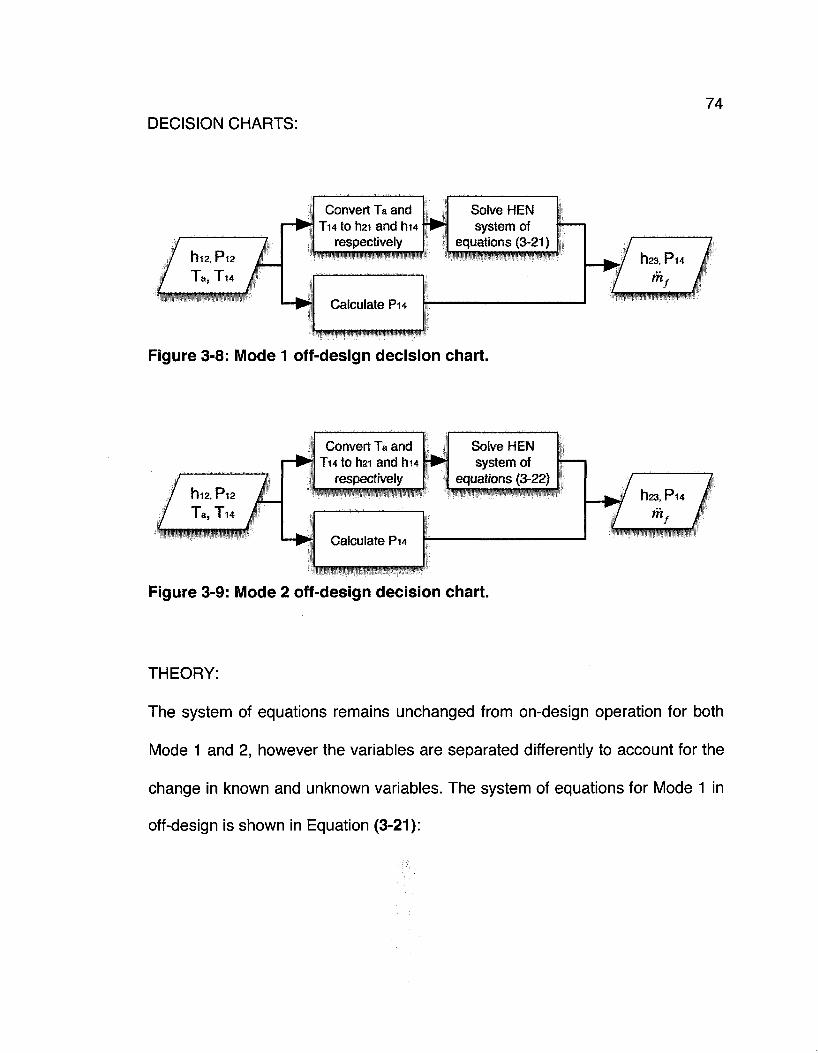
DECISION CHARTS: 74
/ u D / / M12, Pl2 /
/ Ta,Tl4 [
Convert Ta and T14 to hai and hu
respectively
Calculate Pu
Solve HEN system of
equations (3-21) / „ / ^ / ll23,Pl4 /
/ ^ I
Figure 3-8: Mode 1 off-design decision chart.
I"|12, Pl2 Ta, T u
Convert Ta and Tu to h2i and hi4
respectively w p » W W « » w « w » * W ? W » < ?
Solve HEN system of
equations (3-22)
Calculate Pu
Figure 3-9: Mode 2 off-design decision chart.
h23,P 14
m.
THEORY:
The system of equations remains unchanged from on-design operation for both
Mode 1 and 2, however the variables are separated differently to account for the
change in known and unknown variables. The system of equations for Mode 1 in
off-design is shown in Equation (3-21):
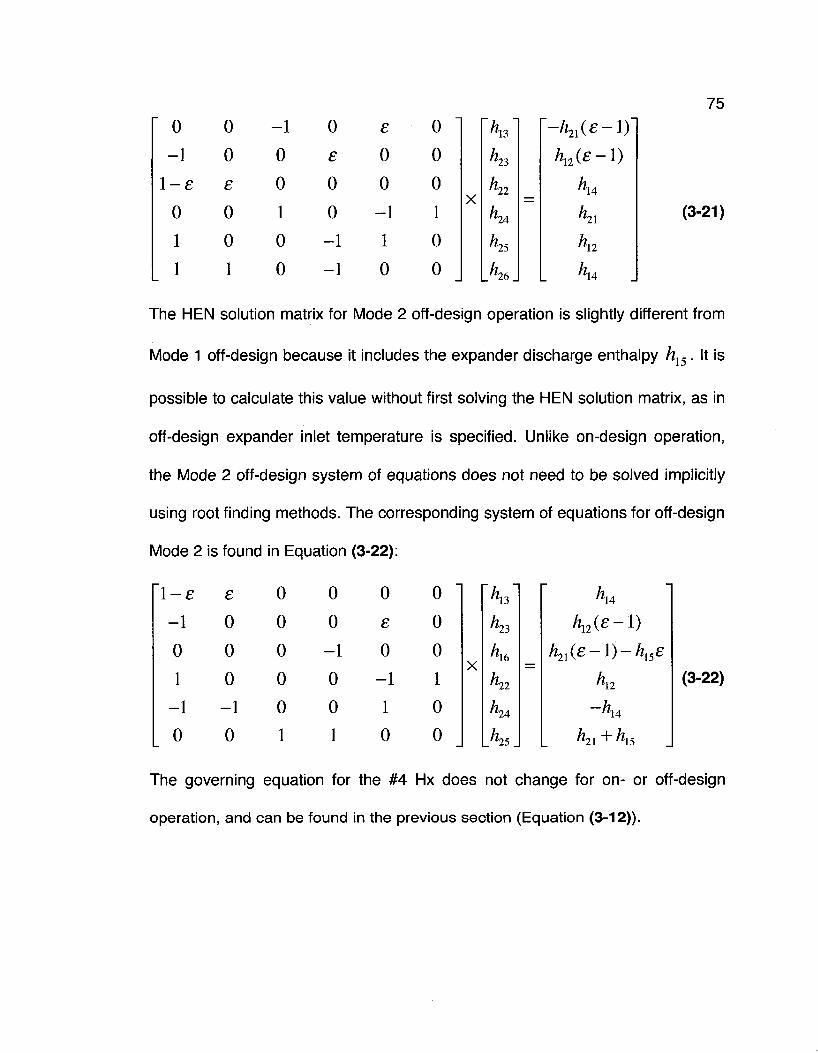
75
0 0
-1 0 1-e e
0 0 1 0 1 1
The HEN solution matrix for Mode 2 off-design operation is slightly different from
Mode 1 off-design because it includes the expander discharge enthalpy hl5. It is
possible to calculate this value without first solving the HEN solution matrix, as in
off-design expander inlet temperature is specified. Unlike on-design operation,
the Mode 2 off-design system of equations does not need to be solved implicitly
using root finding methods. The corresponding system of equations for off-design
Mode 2 is found in Equation (3-22):
1-e -1
0
1
-1
0
£
0
0
0
-1
0
The governing equation for the #4 Hx does not change for on- or off-design
operation, and can be found in the previous section (Equation (3-12)).
-1
0
0
1
0
0
0
£
0
0
-1
-1
£
0
0
-1
1
0
0 0
0
1
0
0
X
h 13
'23
22
24
25
'26
-h21(£-l)~
hn(£-\)
14
21
12
(3-21)
14
0
0
0
0
0
1
0
0
-1
0
0
1
0
£
0
-1
1
0
0
0
0
1
0
0
X
h 23
16
22
24
'25
hn(£-l)
h21(£ -1) - hl5£
Ki -hu
h2l + hl5
(3-22)
76 3.3.2. Microturbine
The microturbine is comprised of two components: the compressor and
expander. While the equations used for each component are identical in form, the
station numbering is different. To avoid confusion, each component will be
treated separately.
3.3.2.1. Microturbine compressor
ASSUMPTIONS AND CONSTANTS:
• 7]c = 0.75 at design for ISO standard atmospheric conditions
• CPR = 4 at design for ISO standard atmospheric conditions
• No microturbine compressor overboard bleed or expander cooling flows
• No inlet pressure losses
INPUTS:
• Ambient temperature and pressure: Ta , Pa
OUTPUTS:
• Compressor discharge temperature and pressure: Tl2(hl2) , Pl2
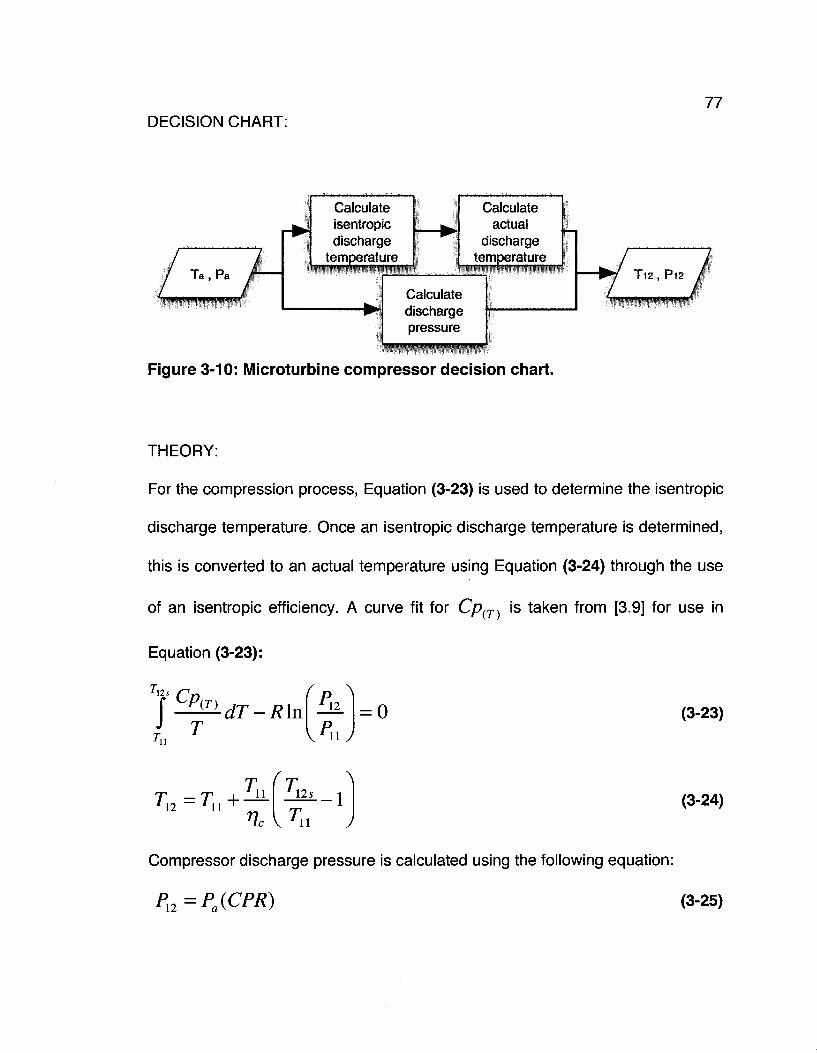
DECISION CHART: 77
Ta, Pa
"WP!WBRS9?«M5S
Calculate isentropic discharge
temperature
Calculate actual
discharge temperature
Calculate discharge pressure
Figure 3-10: Microturbine compressor decision chart.
T12 , P l2
• m ^ ^ ^ ^ ^ ^ ^ w n ^ ^ w
THEORY:
For the compression process, Equation (3-23) is used to determine the isentropic
discharge temperature. Once an isentropic discharge temperature is determined,
this is converted to an actual temperature using Equation (3-24) through the use
of an isentropic efficiency. A curve fit for C/? ( r ) is taken from [3.9] for use in
Equation (3-23):
f Cp{ J (T) dT-R\n in = 0 (3-23)
r-Tii = Tn +
i i
^ c
^ 12s
V^n 1 (3-24)
Compressor discharge pressure is calculated using the following equation:
Pi2=Pa(CpR) (3"2 5>
78 3.3.2.2. Microturbine expander
Since the expander is basically the reverse process of the compressor, the
theory is similar.
ASSUMPTIONS AND CONSTANTS:
• r\e = 0.84 at design for ISO standard atmospheric conditions
• Expander discharge pressure is 2 percent above Pa
• No cooling flows
INPUTS:
• HEN discharge temperature and pressure: Tl4 (hl4), Pl4
• Ambient pressure: Pa
OUTPUTS:
• Expander discharge temperature and pressure: Tl5 (hl5), Pl5
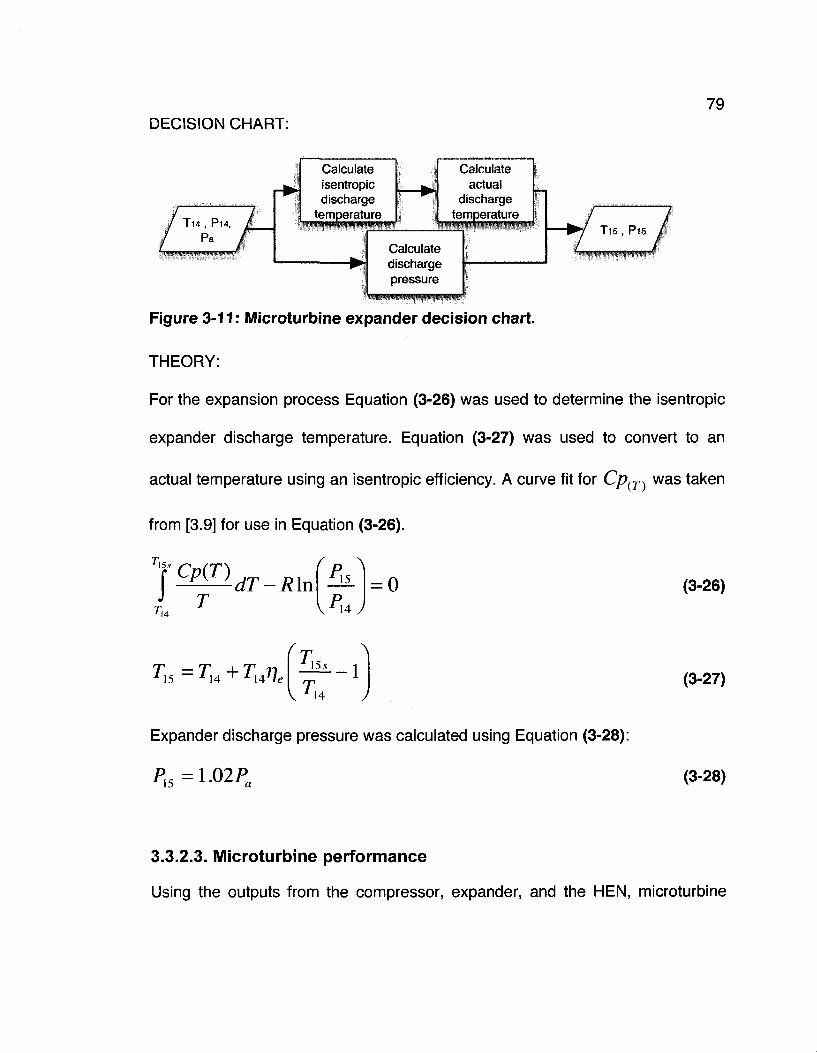
DECISION CHART: 79
/ T14 , P14. /
/ P. /—
Calculate isentropic discharge
temperature
Calculate actual
discharge temperature
Calculate discharge pressure
/ / • / T15,P15 /
Figure 3-11: Microturbine expander decision chart.
THEORY:
For the expansion process Equation (3-26) was used to determine the isentropic
expander discharge temperature. Equation (3-27) was used to convert to an
actual temperature using an isentropic efficiency. A curve fit for Cp(T) was taken
from [3.9] for use in Equation (3-26).
'15s
J Cp(T) fi> A dT-R\n •* 1 5 = 0 (3-26)
r-Tl5 = T14 + ri477,
A 15s
V^14
Expander discharge pressure was calculated using Equation (3-28):
Pl5=l.02Pa
(3-27)
(3-28)
3.3.2.3. Microturbine performance
Using the outputs from the compressor, expander, and the HEN, microturbine
performance was calculated.
ASSUMPTIONS AND CONSTANTS:
• W = 10 kWe at design and ISO standard atmospheric conditions
• ^ = 0 - 9 6
• LHV = 50 MJ/kg (natural gas)
INPUTS:
• Compressor inlet and discharge enthalpy: hn , hl2
• Expander inlet and discharge enthalpy: hu , h15
• Household ambient enthalpy: hh
• HEN specific fuel flow: m,
OUTPUTS:
• Microturbine mass flow, heat output, and thermal efficiency: m , Q ,
• HEN fuel flow: mf
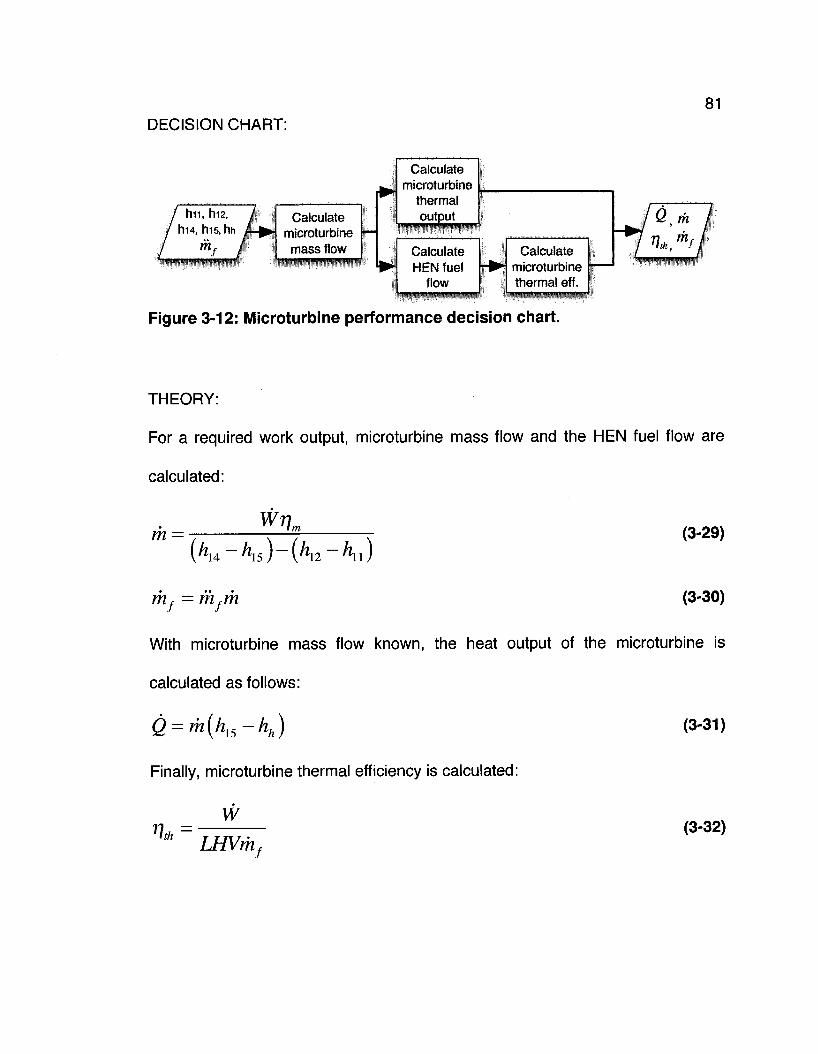
DECISION CHART: 81
hn, hi2, hu , his. hh
m 7 '-'^^^^m^^sm^m^
7H Calculate microturbine mass flow
Calculate microturbine
thermal output
Calculate HEN fuel
flow •MMMMWMWHMW
Calculate microturbine thermal eff.
4 Figure 3-12: Microturbine performance decision chart.
G, m
i,t^^es^ms^Mm^f
THEORY:
For a required work output, microturbine mass flow and the HEN fuel flow are
calculated:
m = W7!n
{hi4-hi5)-{hi2-hn)
rrif = mfm
(3-29)
(3-30)
With microturbine mass flow known, the heat output of the microturbine is
calculated as follows:
Q = m(hl5-hh)
Finally, microturbine thermal efficiency is calculated:
(3-31)
n th w_
LHVm (3-32)
/
82 3.3.2.4. Off-design performance
Off-design microturbine performance was predicted using generic compressor
and expander maps incorporated into GASTURB [3.6]. These maps represent an
averaging of several actual turbomachinery maps to approximate conventionally
designed compressors and expanders used in gas turbines.
ASSUMPTIONS AND CONSTANTS:
• Reference temperature and pressure: Tref = 288 K, Pref = 101.325 kPa
INPUTS:
• Required microturbine power output: W
• Ambient temperature and pressure: Ta , Pa
OUTPUTS:
• Microturbine mass flow, heat output, and thermal efficiency: m , Q , T)th
• Microturbine fuel flow: mf
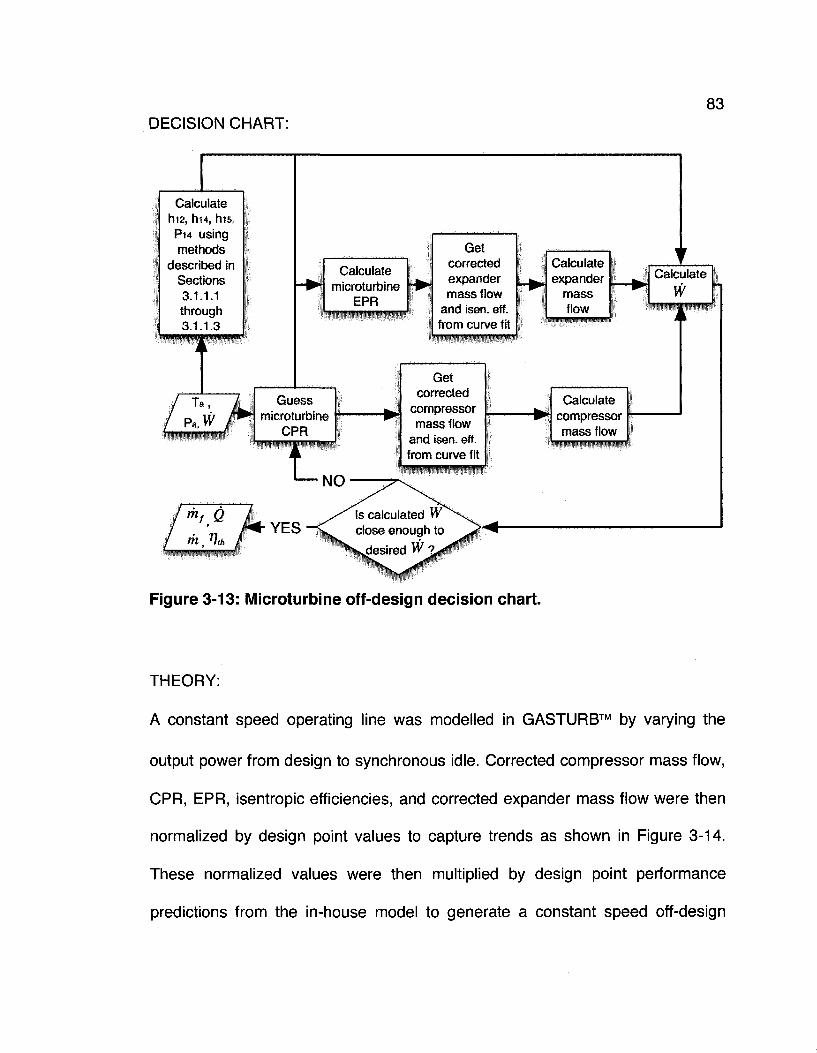
DECISION CHART: 83
Calculate hi2, hi4, hie, P14 using methods
described in Sections 3.1.1.1 through 3.1.1.3
Calculate microturbine
EPR 4piwpiffPII»WW«TO^«i
Get corrected expander mass flow
and isen. eft from curve fit
Calculate expander
mass flow
Get corrected
compressor mass flow
and isen. eff. from curve fit
WWPWyjiWIMIIMWPW
Calculate compressor mass flow
'HlPlWHWPWWffWP
Figure 3-13: Microturbine off-design decision chart.
Calculate W
•mmmmmmmmf
THEORY:
A constant speed operating line was modelled in GASTURB™ by varying the
output power from design to synchronous idle. Corrected compressor mass flow,
CPR, EPR, isentropic efficiencies, and corrected expander mass flow were then
normalized by design point values to capture trends as shown in Figure 3-14.
These normalized values were then multiplied by design point performance
predictions from the in-house model to generate a constant speed off-design
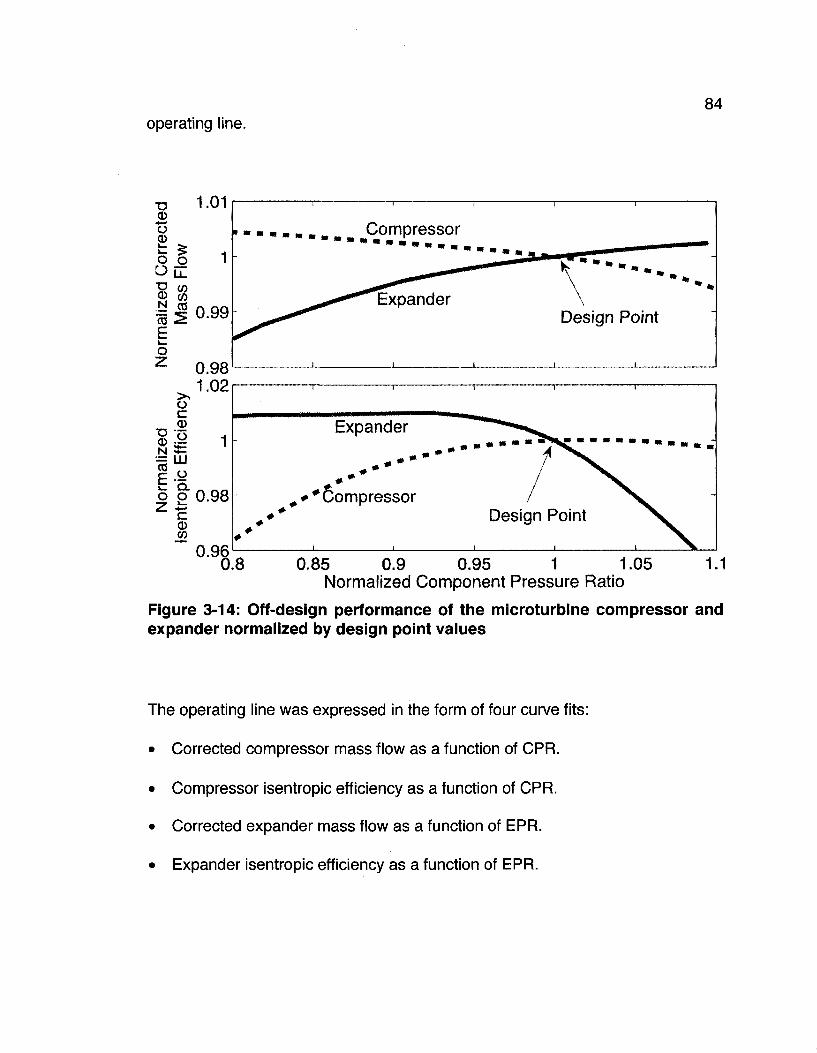
operating line. 84
T3 £
o o OK ~o u> a> c/5 N CO CO 2 E o
1.01
0.99
0.98 1.02
Compressor
Expander Design Point
o c CD
©£ 1 CO , „ E 'CL
o g 0.98 <B
0.96 . . - "
I I
Expander
* # Compressor Design
i
Point
\
.8 1.1 0.85 0.9 0.95 1 1.05 Normalized Component Pressure Ratio
Figure 3-14: Off-design performance of the microturbine compressor and expander normalized by design point values
The operating line was expressed in the form of four curve fits:
• Corrected compressor mass flow as a function of CPR.
• Compressor isentropic efficiency as a function of CPR.
• Corrected expander mass flow as a function of EPR.
• Expander isentropic efficiency as a function of EPR.
85 Calculating off-design performance was an iterative process that was broken
down into the following steps:
1) For a given ambient temperature and pressure, select a desired work
output.
2) Guess a CPR. Calculate corrected compressor mass flow and compressor
isentropic efficiency from operating line curve fits.
3) Calculate compressor mass flow using Equation (3-33).
4) Calculate hl2, hH, hl5, Pl4 using methods described in Sections 3.3.2.1
and 3.3.2.2
5) Calculate EPR and then get corrected expander mass flow and expander
isentropic efficiency from operating line curve fits.
6) Calculate expander mass flow using Equation (3-34).
7) Calculate microturbine power output using methods described in Section
3.3.2.3. Compare calculated output with desired output. If difference is
within an acceptable tolerance, terminate calculations. If not, make
another guess for CPR and continue iterations.
mPa
• f ref m = •
T 0-33) a
T 1ref
p 1 14
me^r p
3.3.3. Secondary turbomachinery
In addition to the microturbine, there are two other turbomachinery components
to model. The secondary compressor draws power from microturbine electrical
output to charge the accumulator, and the secondary expander accepts
discharge flow from the accumulator to provide household power and thermal
loads.
3.3.3.1. Secondary compressor
The secondary compressor was modelled using performance charts from a
commercially available screw compressor. Data for the compressor was digitized
from which curve fits for mass flow, power input, and isentropic efficiency were
calculated without the need for Equation (3-23); Equation (3-24) was used to
determine discharge temperature. The second compressor operates at a
constant pressure rise of 4 bar in Mode 1 and 6 bar in Mode 2. Isentropic
efficiencies vary between 0.60 and 0.92 depending on the mass flow. Digitized
performance graphs and isentropic efficiency curves can be found in Appendix E.
86
(3-34)
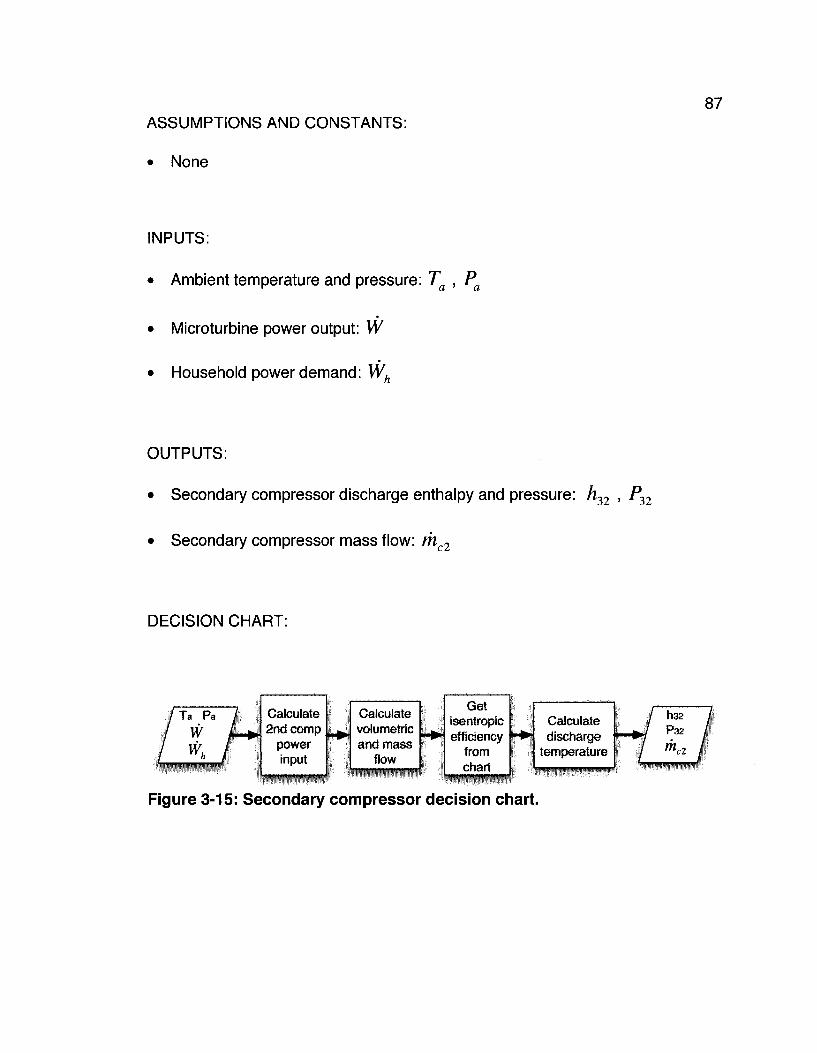
ASSUMPTIONS AND CONSTANTS:
None
INPUTS:
Ambient temperature and pressure: Ta , Pa
Microturbine power output: W
Household power demand: Wh
OUTPUTS:
• Secondary compressor discharge enthalpy and pressure: h,2 , P. 32 ' •* 32
Secondary compressor mass flow: m c2
DECISION CHART:
Calculate 2nd comp
power input
Calculate volumetric and mass
flow -xum'wwtiMStiBmw'
Get isentropic efficiency
from chart
Calculate discharge
temperature
fl32 P32
Figure 3-15: Secondary compressor decision chart.
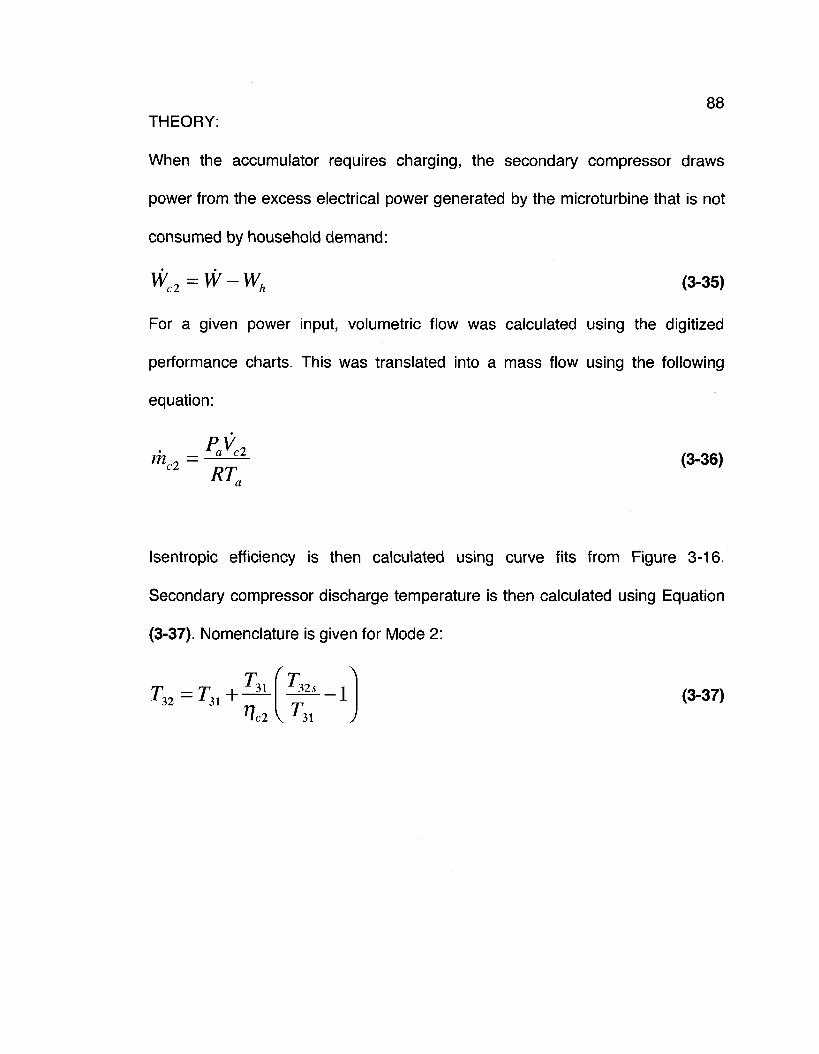
88 THEORY:
When the accumulator requires charging, the secondary compressor draws
power from the excess electrical power generated by the microturbine that is not
consumed by household demand:
Wc2=W- Wh (3-35)
For a given power input, volumetric flow was calculated using the digitized
performance charts. This was translated into a mass flow using the following
equation:
PV mr2 = - 2 - ^ (3-36)
Isentropic efficiency is then calculated using curve fits from Figure 3-16.
Secondary compressor discharge temperature is then calculated using Equation
(3-37). Nomenclature is given for Mode 2:
^ 3 2 = ^ 3 i + — — - 1 (3-37) ^c2 V ^31 J
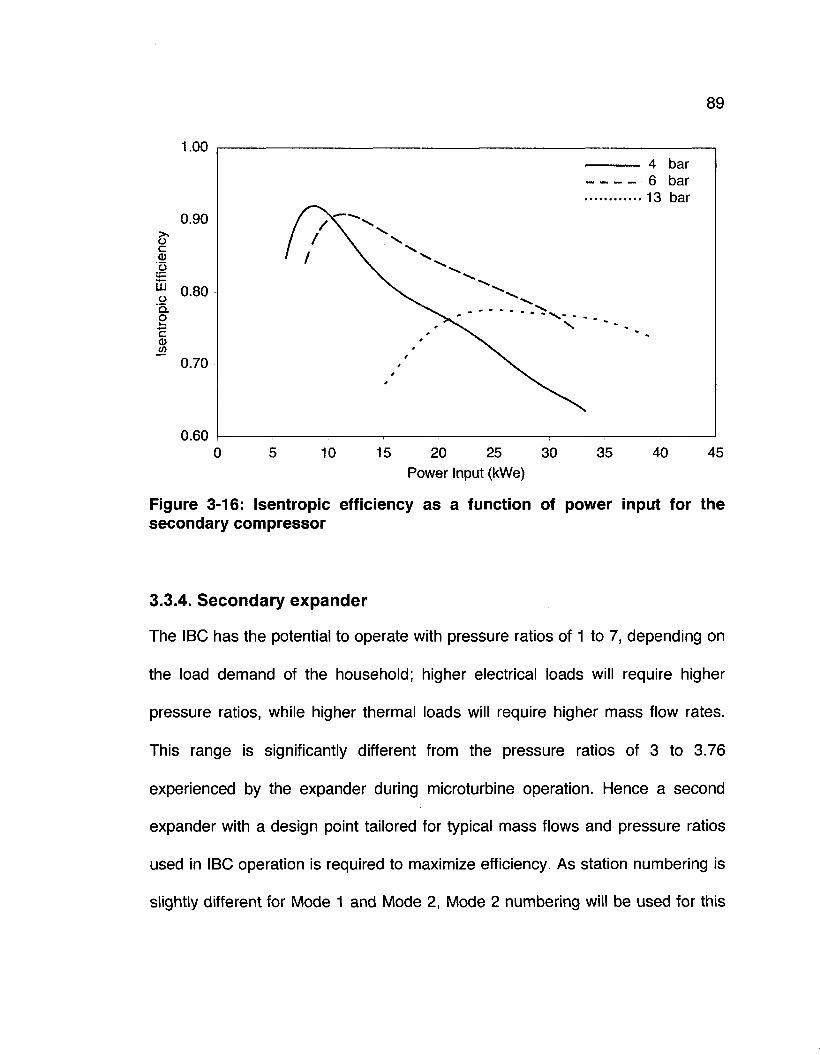
89
1.00
0.90
c 0)
o
c
0.70
0.60 0 5 10 15 20 25 30 35 40 45
Power Input (kWe)
Figure 3-16: Isentropic efficiency as a function of power input for the secondary compressor
3.3.4. Secondary expander
The IBC has the potential to operate with pressure ratios of 1 to 7, depending on
the load demand of the household; higher electrical loads will require higher
pressure ratios, while higher thermal loads will require higher mass flow rates.
This range is significantly different from the pressure ratios of 3 to 3.76
experienced by the expander during microturbine operation. Hence a second
expander with a design point tailored for typical mass flows and pressure ratios
used in IBC operation is required to maximize efficiency. As station numbering is
slightly different for Mode 1 and Mode 2, Mode 2 numbering will be used for this
section.
ASSUMPTIONS AND CONSTANTS:
• T]e2 = 0.84 at design for ISO standard atmospheric conditions
• Secondary expander discharge pressure is 2 percent above Pa
• No cooling flows
INPUTS:
• Ambient pressure: Pa
• Either household thermal (Qh) or electrical (Wh) load
• Mode 1: accumulator discharge temperature: T34 , (A34)
Mode 2: HEN discharge temperature: T36 , (h36)
OUTPUTS:
• Secondary expander discharge temperature: T35 , (h35)
• Secondary expander electrical and thermal outputs: We2 , Qe2
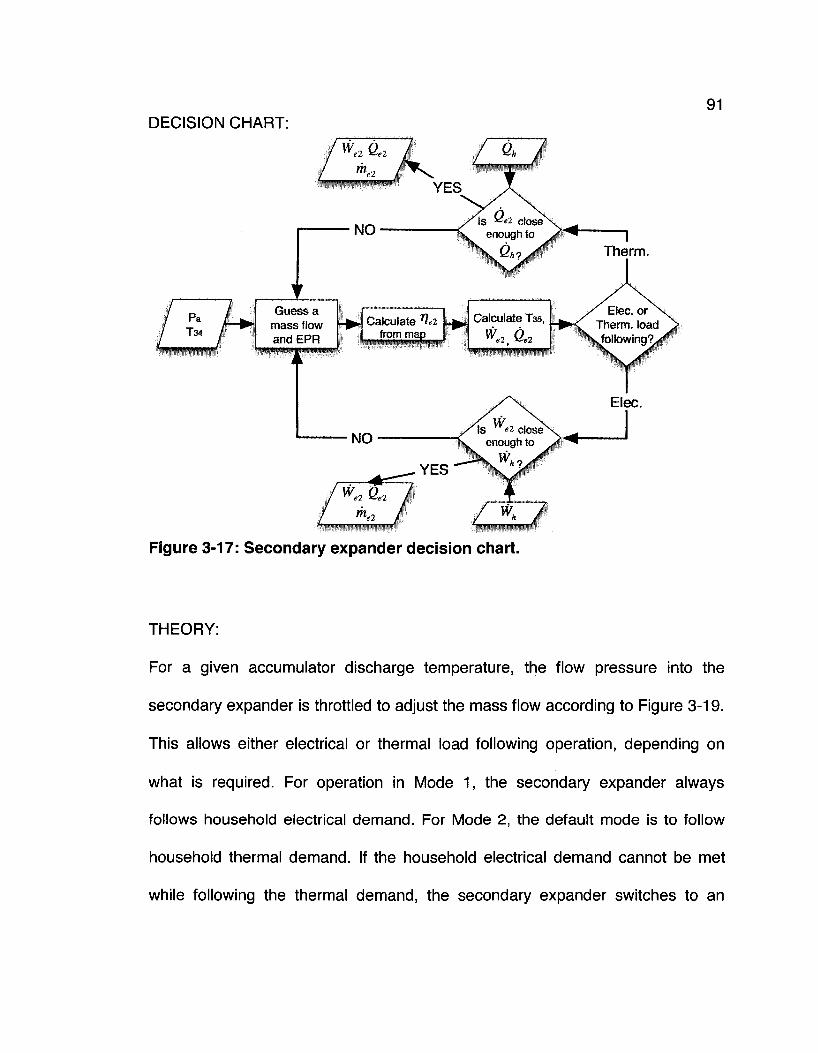
DECISION CHART:
/KQe2 / / Qh /
Pa / ^ T34 r*]
Guess a mass flow and EPR
/ #> /
Figure 3-17: Secondary expander decision chart.
THEORY:
For a given accumulator discharge temperature, the flow pressure into the
secondary expander is throttled to adjust the mass flow according to Figure 3-19.
This allows either electrical or thermal load following operation, depending on
what is required. For operation in Mode 1, the secondary expander always
follows household electrical demand. For Mode 2, the default mode is to follow
household thermal demand. If the household electrical demand cannot be met
while following the thermal demand, the secondary expander switches to an
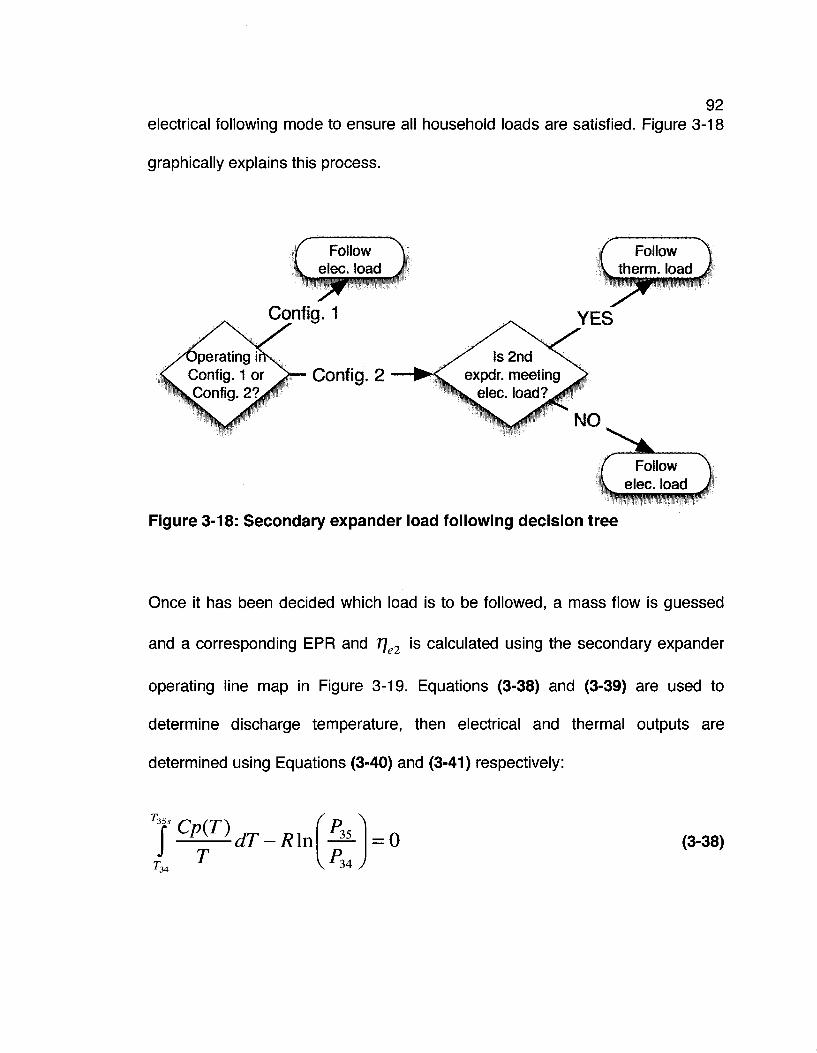
92 electrical following mode to ensure all household loads are satisfied. Figure 3-18
graphically explains this process.
Config. 1
Config. 2
Figure 3-18: Secondary expander load following decision tree
Once it has been decided which load is to be followed, a mass flow is guessed
and a corresponding EPR and T]e2 is calculated using the secondary expander
operating line map in Figure 3-19. Equations (3-38) and (3-39) are used to
determine discharge temperature, then electrical and thermal outputs are
determined using Equations (3-40) and (3-41) respectively:
'35s
J ' 3 4
Cp{T) dT-R\n 135. = 0 (3-38)
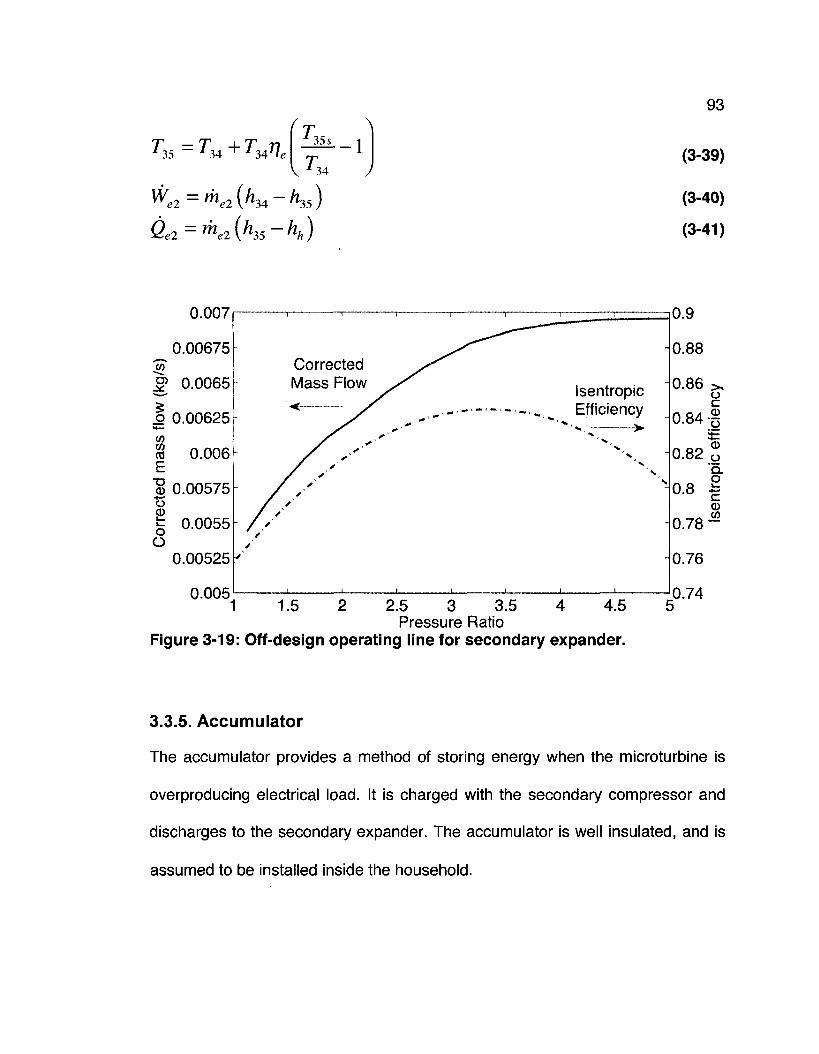
^
^35 — -* 34 "*" -* 34^7, 3 4 ' / e
J 35s
V ^34
- 1 J
^ 2 = ^ 2 ( ^ 3 4 - ^ 3 5 )
Qe2 = ^A^S ~ hk)
93
(3-39)
(3-40)
(3-41)
0.007
0.00675
9» 0.0065 XL
o 0.00625
c§ 0.006
J> 0.00575 "o § 0.0055 O
0.00525
0.005
Corrected Mass Flow Isentropic
Efficiency '-, >
1 1.5 4.5 2 2.5 3 3.5 4 Pressure Ratio
Figure 3-19: Off-design operating line for secondary expander,
0.9
iO.88
0.86 >, o c
0.84 | it
0.82 o "a.
0,8 •*-* c CD
0.78 ~
0.76
0.74
3.3.5. Accumulator
The accumulator provides a method of storing energy when the microturbine is
overproducing electrical load. It is charged with the secondary compressor and
discharges to the secondary expander. The accumulator is well insulated, and is
assumed to be installed inside the household.
94 ASSUMPTIONS AND CONSTANTS:
• Air in the accumulator is isothermal and isobaric
• A polytropic exponent of n = 1.2 was assumed for compression during
charging and expansion during discharge (Appendix E explains the motivation
behind selection of the polytropic exponent).
• Accumulator was assumed to be a horizontal cylinder with spherical end caps
• A free convection boundary condition is applied to the outer surface
• Accumulator internal surface temperature is equal to the bulk fluid
temperature
• Fluid in the accumulator is quiescent
• Insulation thickness t =0.1 m, insulation thermal conductivity kins= 0.038
W/mK, thermal resistance of the steel accumulator wall was treated as
negligible
• Radiation heat transfer from the exterior surface of the accumulator is
negligible
• Gravitational acceleration: 9.81 m/s2
INPUTS:
• Household ambient enthalpy: hh
• Discharging and charging mass flows: mout min
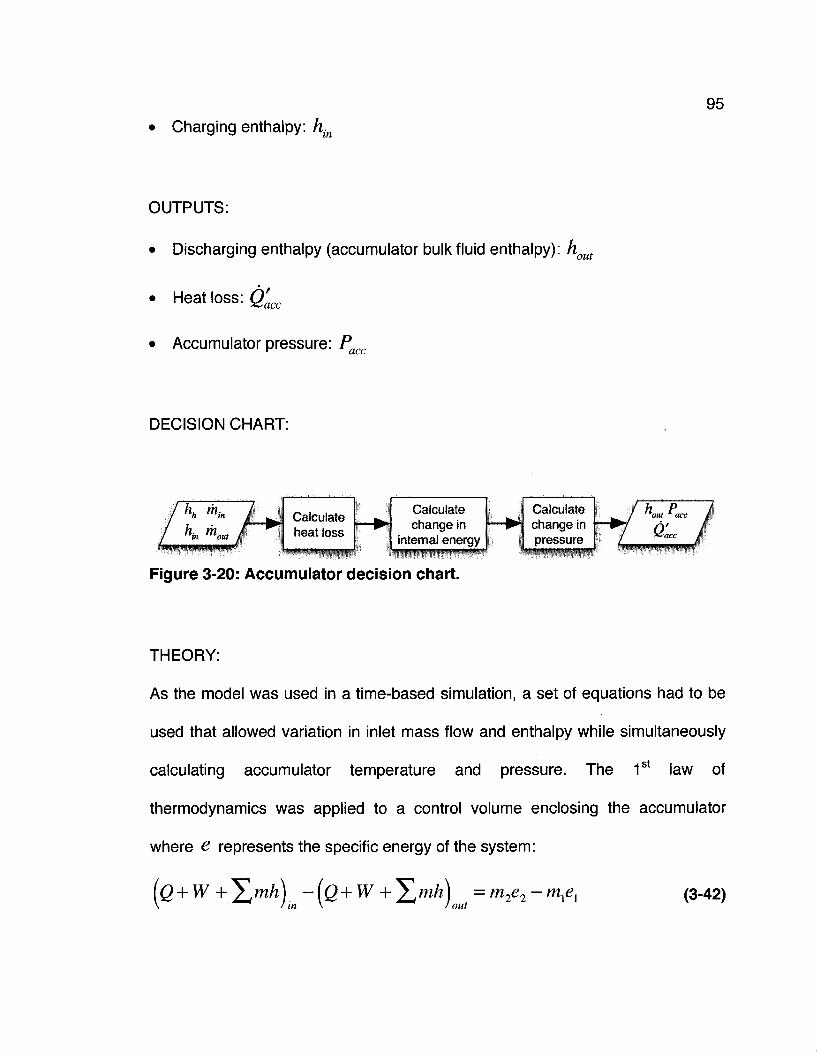
95 Charging enthalpy: h
OUTPUTS:
Discharging enthalpy (accumulator bulk fluid enthalpy): h
Heat loss: QL
Accumulator pressure: P
DECISION CHART:
out
Calculate heat loss
Calculate change in
internal energy
Figure 3-20: Accumulator decision chart.
Calculate change in pressure <
h P 'out ace Q' ace
THEORY:
As the model was used in a time-based simulation, a set of equations had to be
used that allowed variation in inlet mass flow and enthalpy while simultaneously
calculating accumulator temperature and pressure. The 1s t law of
thermodynamics was applied to a control volume enclosing the accumulator
where e represents the specific energy of the system:
(Q+W +y\mh) -IQ + W +y\mh) = m2e2 -m^ (3-42) V I in \ 'out
96
The flow entering the accumulator is a moving fluid and does boundary work on
the quiescent fluid in the accumulator. To account for this boundary work,
specific energy of the fluid in the accumulator is measured using internal energy
while specific energy of the incoming (or leaving) flow is measured using
enthalpy. Heat addition or loss is present only in the form of heat transfer to
ambient through the accumulator wall. Using these assumptions, a discrete form
of Equation (3-42) can be written as:
m h — m ,h t+mM,—0/ du in in out out ••"\""\ >Cacc _ a At\
ul — u2 ul — w-'wJ mi + min ~ mout d t
With respect to Equation (3-43), subscripts 1 and 2 correspond to the
accumulator state at the previous and current timestep respectively; this
convention applies to all equations in this section. Pressure was modelled using
a combination of differential forms of perfect gas law and the polytropic
expansion relation:
- ^ = y{Taccd™ + maccdTacc) ( 3 . 4 4 )
dT n-lT ace ace jp
dt ~ n Pj^ ™ Equations (3-44) and (3-45) are combined to form Equation (3-46):
dPacc j (nRTaee^ —— = dm S££- (3-46)
dt \ V J
97 An explicit discrete differential form is required to implement Equation (3-46) into
a simulation marched in time:
= (min-mouty J
(3-47) at v V
Finally heat loss (Qacc ) must be estimated. Under a free convection assumption,
the external convection coefficients must be estimated using empirical
correlations. Equations (3-48) and (3-49) are averaged Nusselt number
correlations for free convection around a horizontal cylinder [3.7] and a sphere
[3.3] respectively:
1 / V
NuD = y„ Raff (3-48)
0.5S9Ra$ Nu„=2 + "D
D ( , , 9 ^ 9 (3-49) i+r%j V
Where the Rayleigh number is calculated as:
_gP(Ts-T„)D3
D~ Va (3-50)
Equations (3-48) through (3-50) are then combined with Equation (3-51) to
produce an estimate for the averaged convective heat transfer coefficient, one for
the cylindrical surface and one for the spherical end caps.
98
r _ NuDk
n ~ ^ ~ < 3 _ 5 1 >
Using the assumption that the heat transferred through the insulation via
conduction is equal to the heat dissipated through free convection, Equation
(3-52) is used to determine the external surface temperature of the accumulator
where subscripts sp and cyl correspond to the spherical and cylindrical surfaces
respectively:
Ur-r,K + ^ ) _ + H jp, _ r J (3-52)
Qacc is then determined by back substituting 7^ into Equation (3-52) and
calculating the heat transfer through the accumulator wall or from the external
surface of the accumulator via convection:
QL = KP-TXK + K.) = ^ + {KA)J(TI _ TJ (3-53)
3.3.6. Individual generation system
Economic performance of the proposed system was compared against the
performance of a natural gas furnace, vapour compression air conditioner, and
purchasing grid power as is common in many North American and European
households.
99 ASSUMPTIONS AND CONSTANTS:
• Natural gas furnace has a 1 law efficiency of 7], = 0.90
• Air conditioner COP = 3 at Ta = 27.8°C and Pa = 101.325 kPa
• Same energy rates used for trigeneration system were used for the individual
generation system
• LHV = 50 MJ/kg
INPUTS:
• Ambient temperature and pressure: Ta , Pa
• Household electrical and thermal loads: Wh , Qh
OUTPUTS:
* mf\
w ac
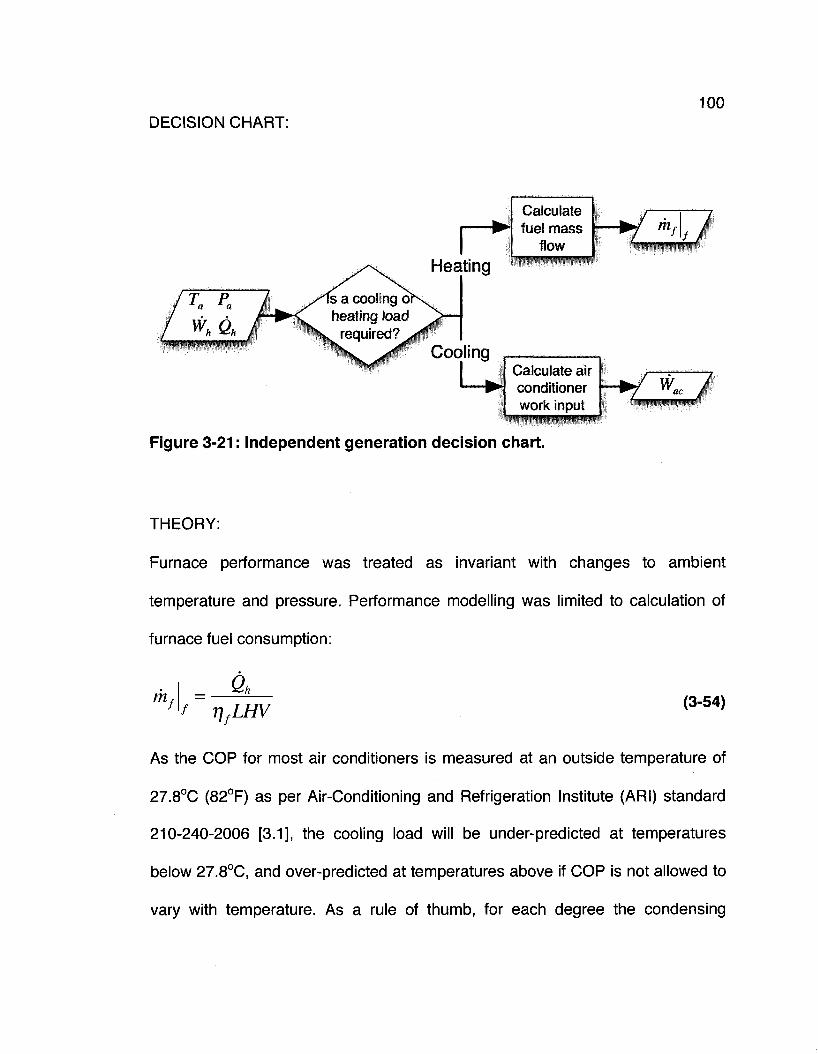
DECISION CHART: 100
Calculate fuel mass
flow *RWWP8S|^PPS
Calculate air conditioner work input
Figure 3-21: Independent generation decision chart.
m f ^l^^p^p^^^^^ 7
w„.
THEORY:
Furnace performance was treated as invariant with changes to ambient
temperature and pressure. Performance modelling was limited to calculation of
furnace fuel consumption:
m Qh
f rifLHV (3-54)
As the COP for most air conditioners is measured at an outside temperature of
27.8°C (82°F) as per Air-Conditioning and Refrigeration Institute (ARI) standard
210-240-2006 [3.1], the cooling load will be under-predicted at temperatures
below 27.8°C, and over-predicted at temperatures above if COP is not allowed to
vary with temperature. As a rule of thumb, for each degree the condensing
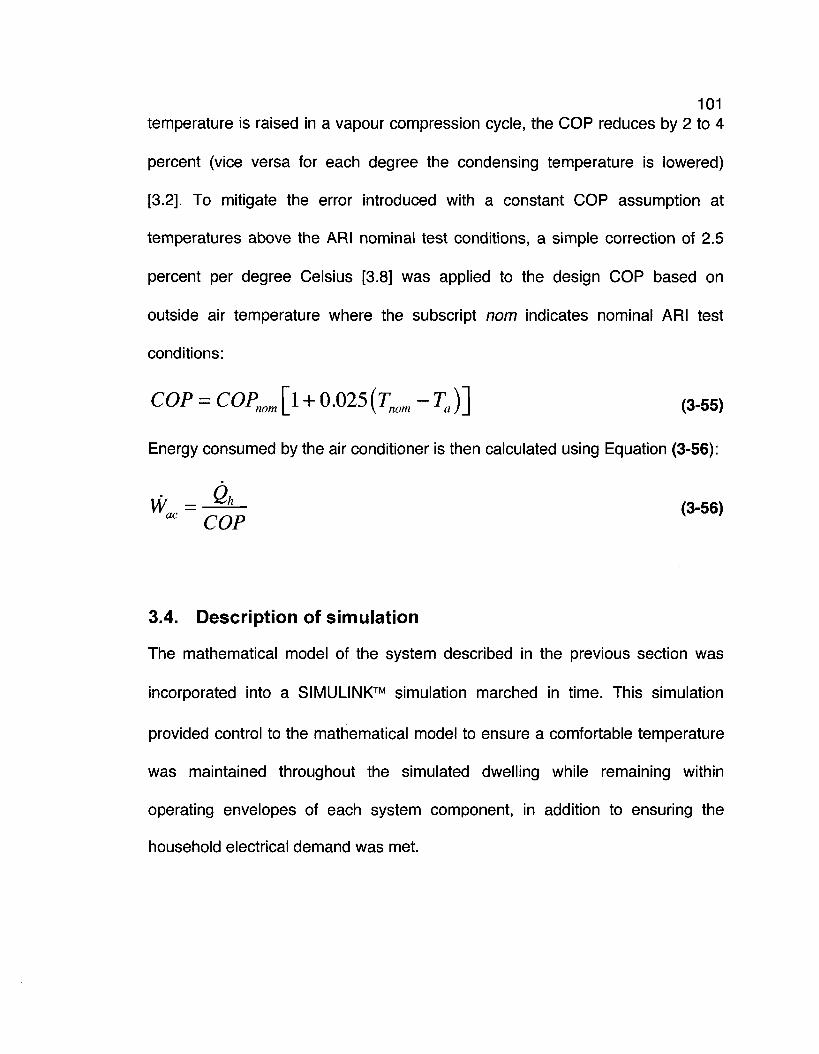
101 temperature is raised in a vapour compression cycle, the COP reduces by 2 to 4
percent (vice versa for each degree the condensing temperature is lowered)
[3.2]. To mitigate the error introduced with a constant COP assumption at
temperatures above the ARI nominal test conditions, a simple correction of 2.5
percent per degree Celsius [3.8] was applied to the design COP based on
outside air temperature where the subscript nom indicates nominal ARI test
conditions:
COP = COPmm [ l + 0.025 (Tm - Ta)] ,3.55)
Energy consumed by the air conditioner is then calculated using Equation (3-56):
Wac = - ^ - (3-56) ac C Q p
3.4. Description of simulation
The mathematical model of the system described in the previous section was
incorporated into a SIMULINK™ simulation marched in time. This simulation
provided control to the mathematical model to ensure a comfortable temperature
was maintained throughout the simulated dwelling while remaining within
operating envelopes of each system component, in addition to ensuring the
household electrical demand was met.
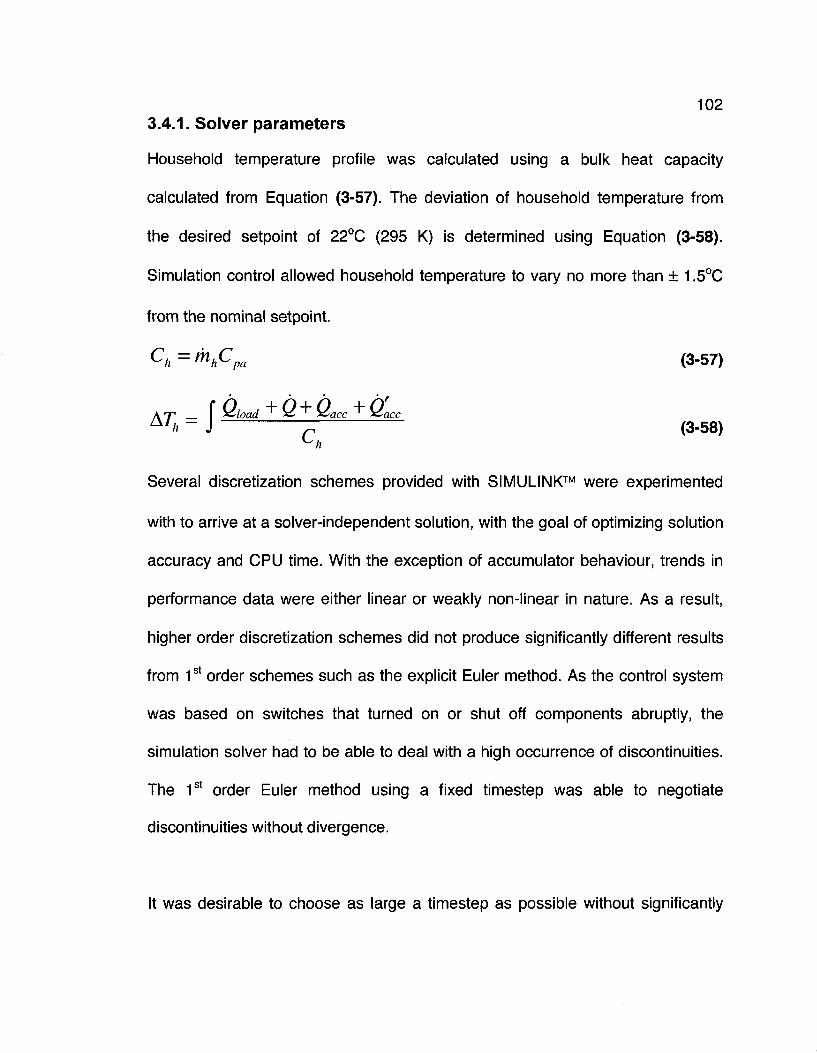
102 3.4.1. Solver parameters
Household temperature profile was calculated using a bulk heat capacity
calculated from Equation (3-57). The deviation of household temperature from
the desired setpoint of 22°C (295 K) is determined using Equation (3-58).
Simulation control allowed household temperature to vary no more than ± 1.5°C
from the nominal setpoint.
Ch = ™hCm (3-57)
*Th = j ^lload "*" & "*" Slacc "*" Hacc ^ (3-58)
'h
Several discretization schemes provided with SIMULINK™ were experimented
with to arrive at a solver-independent solution, with the goal of optimizing solution
accuracy and CPU time. With the exception of accumulator behaviour, trends in
performance data were either linear or weakly non-linear in nature. As a result,
higher order discretization schemes did not produce significantly different results
from 1st order schemes such as the explicit Euler method. As the control system
was based on switches that turned on or shut off components abruptly, the
simulation solver had to be able to deal with a high occurrence of discontinuities.
The 1st order Euler method using a fixed timestep was able to negotiate
discontinuities without divergence.
It was desirable to choose as large a timestep as possible without significantly

103 affecting accuracy or inducing solver instability. A timestep of one second was
chosen, as larger timesteps resulted in solution instability. This instability
threshold can be attributed to the high rate of change in accumulator pressure
during discharge as the IBC pressure ratio approaches atmospheric. At a lower
pressure ratio, less specific work is produced by the expander hence a larger
mass flow is required to satisfy a given electrical or thermal load. Accumulator
pressure could drop below atmospheric between timesteps larger than one
second, causing rapid solution divergence.
3.4.2. Demand scenarios
Controlling the system poses a significant programming challenge, as each
component of the complex system must be monitored while ensuring ambient
household temperature remains within a desired range. This is further
complicated by a rapidly changing household electrical demand. With respect to
the physical system, changing between modes requires redirection of flow
through the heat exchanger network in addition to using different control logic;
this could be accomplished with the use of solenoid actuated computer-controlled
three way valves. As the control methodology is different from cooling to heating
load production, they will be treated separately.
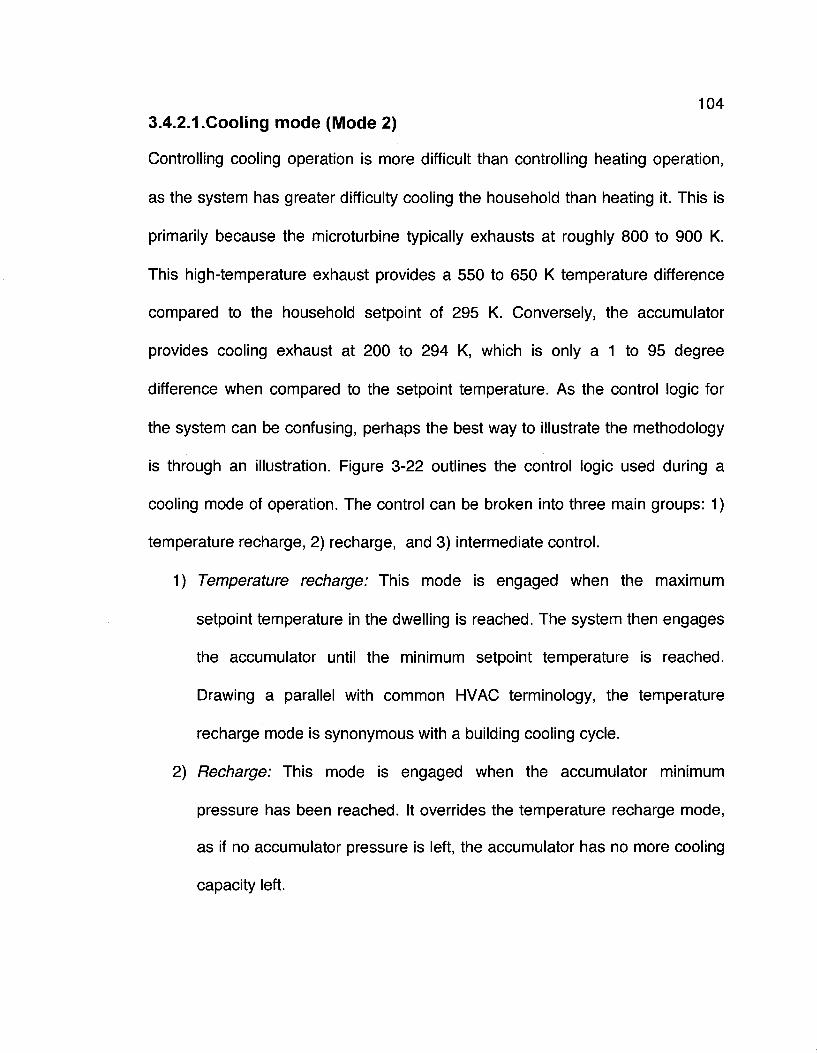
104 3.4.2.1 .Cooling mode (Mode 2)
Controlling cooling operation is more difficult than controlling heating operation,
as the system has greater difficulty cooling the household than heating it. This is
primarily because the microturbine typically exhausts at roughly 800 to 900 K.
This high-temperature exhaust provides a 550 to 650 K temperature difference
compared to the household setpoint of 295 K. Conversely, the accumulator
provides cooling exhaust at 200 to 294 K, which is only a 1 to 95 degree
difference when compared to the setpoint temperature. As the control logic for
the system can be confusing, perhaps the best way to illustrate the methodology
is through an illustration. Figure 3-22 outlines the control logic used during a
cooling mode of operation. The control can be broken into three main groups: 1)
temperature recharge, 2) recharge, and 3) intermediate control.
1) Temperature recharge: This mode is engaged when the maximum
setpoint temperature in the dwelling is reached. The system then engages
the accumulator until the minimum setpoint temperature is reached.
Drawing a parallel with common HVAC terminology, the temperature
recharge mode is synonymous with a building cooling cycle.
2) Recharge: This mode is engaged when the accumulator minimum
pressure has been reached. It overrides the temperature recharge mode,
as if no accumulator pressure is left, the accumulator has no more cooling
capacity left.

105 3) Intermediate control: This mode operates the microturbine or the
accumulator (IBC) depending on the situation. The goal of this mode is to
satisfy the electrical load, as the dwelling temperature is within the setpoint
range during this mode and no recharge or temperature recharge cycle is
engaged.
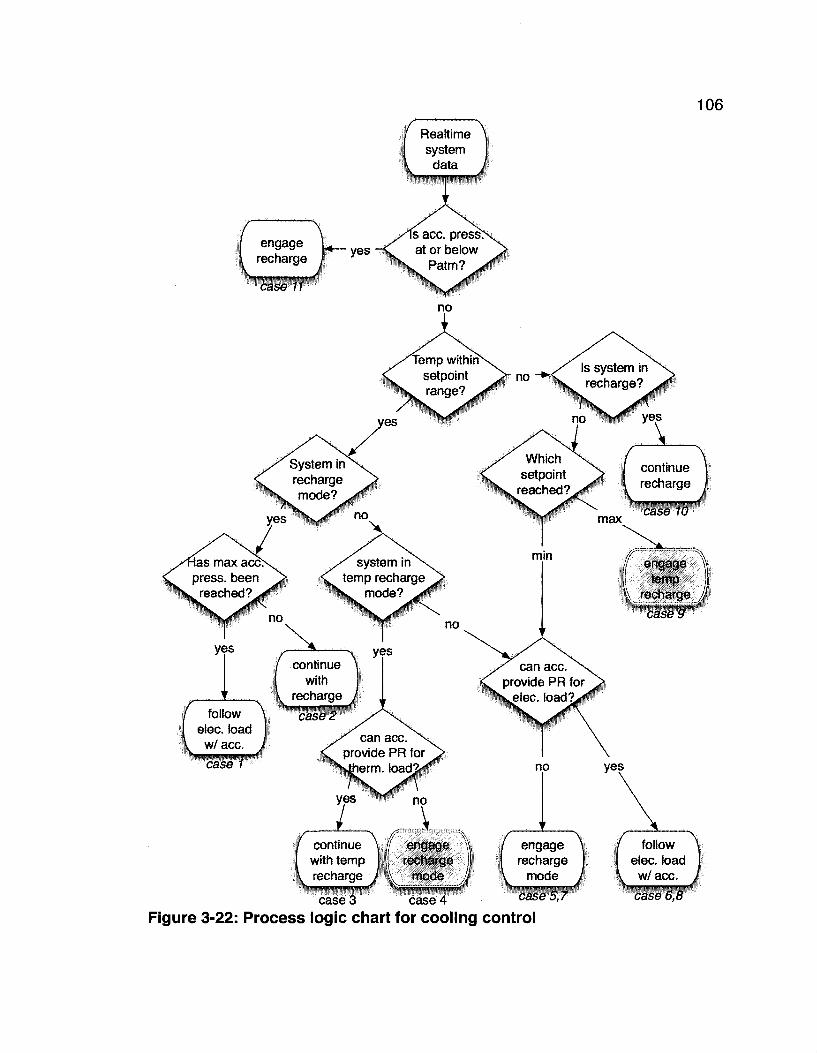
continue \ // engage \\ with temp 11 rech#ge I recharge J \ mode
case 3 case 4 case 5,7
Figure 3-22: Process logic chart for cooling control
107 The red warning markers in Figure 3-22 are to indicate that under these control
modes, there is the potential dwelling cooling demand can exceed system
cooling power. If this occurs, dwelling temperature can rise above the maximum
setpoint temperature. It is possible to size a system based upon such extreme
operating conditions, however the efficiency throughout the remainder of the
operation envelope would suffer from a severe system to dwelling mismatch. The
key parameter in determining if the system will lag behind cooling demand is the
ratio of accumulator recharge time to setpoint minimum to maximum time
(SMMT). The SMMT is defined as the time it takes the dwelling to increase bulk
air temperature from the minimum setpoint to the maximum setpoint via heat
addition from the outside. Once the accumulator is fully discharged, it must be
fully recharged before the next temperature recharge mode is engaged. If the
accumulator is not fully recharged, a charging deficit is created that will continue
to grow at each recharge phase until no cooling output is available. To prevent
this, supplementary electrical power from the grid is fed to the secondary
compressor to increase charging mass flow into the accumulator. The amount of
additional electrical power required is such that accumulator recharge time is
equal to the SMMT. By using such a ratio, the accumulator will not be charged
before the maximum dwelling setpoint temperature is reached. This is desirable
as the microturbine would have to run at off-design to satisfy household electrical
demand if the accumulator was prematurely charged; gas turbines experience a
108 significant drop in thermal efficiency at part load, therefore part-load operation is
avoided whenever possible. By using supplementary grid power, the system can
be sized for an average cooling load rather than the maximum. If total energy
islanding is required, household temperature will increase above the maximum
setpoint limit during peak cooling load conditions as no supplementary electric
power would be supplied to the secondary compressor.
3.4.2.2.Heating mode
Unlike the cooling mode of operation, there is no danger of household thermal
demand exceeding system output while in a heating mode. There are however
modes of operation that are extremely wasteful, and are highlighted in yellow in
Figure 3-23. These modes are presented in one of two ways: the need off-design
operation, or the need for heat bypass. Microturbine off-design operation is
required when under a temperature recharge mode of operation and the
accumulator is at maximum pressure. The heat load provided by the microturbine
exhaust is still required to heat the dwelling, but the secondary compressor does
not require any power as the accumulator is full. The microturbine therefore
operates in an electrical load-following mode to ensure the power requirements
of the dwelling are satisfied. Heat bypass is required when the inverse of the
previous case is encountered. While under a recharge mode of operation, if the
dwelling is at the maximum setpoint temperature, but the accumulator is not yet

109 at maximum pressure, heat must be dumped to the atmosphere; during the heat
bypass mode, a fraction of the microturbine heat output is directed into the
dwelling such that the dwelling temperature remains at the maximum setpoint
temperature.
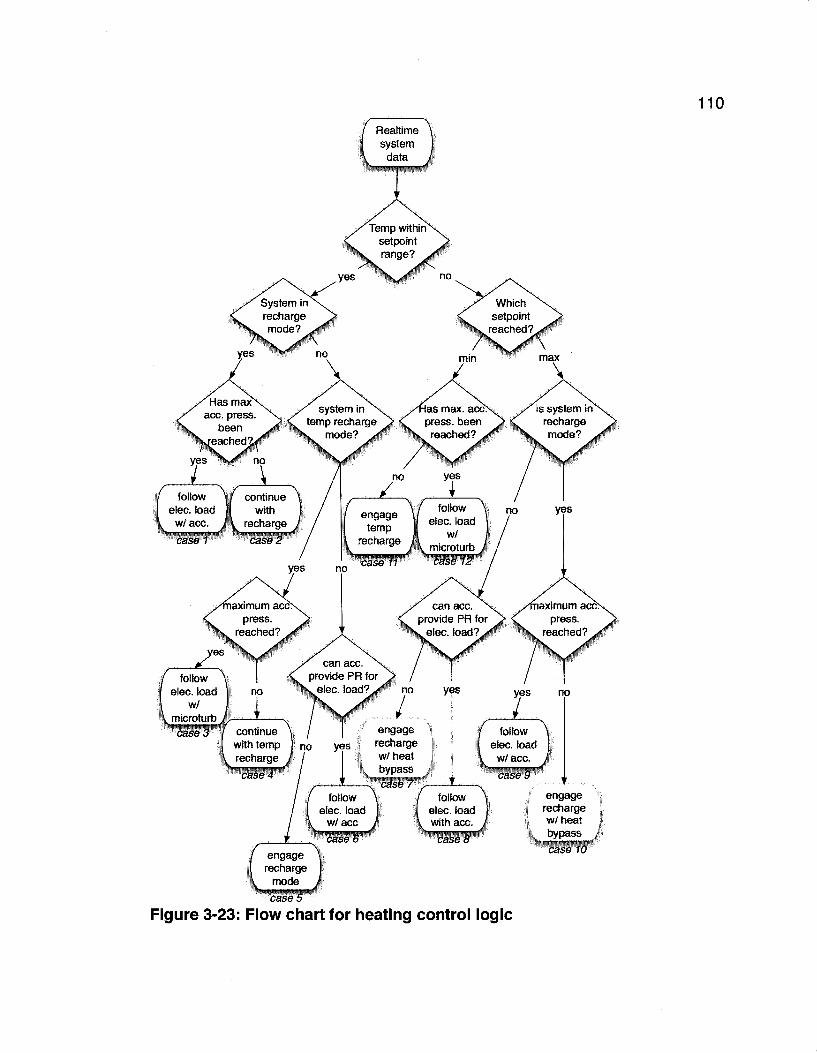
Figure 3-23: Flow chart for heating control logic

111 3.4.3. Load profiles
To perform a detailed economic evaluation of the proposed system, a full year of
operation is simulated. To accomplish this, high-resolution load data was
obtained using an open source program called ESP-r [3.4]. This was developed
in part by the Energy Systems Research Unit at the University of Strathclyde in
the UK. After decades of development, contributions from PhD theses, and
several case studies, ESP-r has the ability to predict building thermal loads with a
high degree of reliability. Factors such as solar gains, solar view factors, outside
air infiltration, circulation, customizable duct and vent locations, lighting thermal
gains, and occupant driven gains are incorporated into the model.
Figure 3-24: Geometry used in ESP-r to model thermal loads
Included in ESP-r is a basic CAD program that permits the user to build simple

112 geometry. This geometry is then used in modelling thermal loads. Figure 3-24
shows the geometry used in estimating annual household thermal loads for this
study. The parameters chosen in ESP-r were designed to reflect construction
practices common to single family detached dwellings constructed between the
1950s and 1980s:
• Occupied by a four-person family
• No basement, two story, 1500 ft2
• Brick exterior walls with glass fibre insulation for a total RSI value of 2.19
• Ceiling of the secondary floor is insulated with an air gap for a total RSI value
of 0.39
• Solar view factors typical of a suburban environment
• Double paned windows (2x3 ft.)
• Exterior surface of ground floor subjected to an averaged ground temperature
profile for Winnipeg, Canada [3.10]
• Free air exchange between 1st and 2nd floor
• Outside air infiltration set at 1 air change per hour
• No internal walls
• Volume of air on each floor and attic varies in an isothermal manner
• Ambient temperature, wind, sunshine, and precipitation data for Winnipeg,
Canada in 2001 were used
• Separate occupancy profiles used for weekdays and weekends

113 In addition, an occupancy profile was specified that included latent and sensible
gains from body heat, appliances, showers/baths, and lighting. These profiles for
weekdays and weekends can be found in Appendix B. Figure 3-25 is a sample of
the output from the thermal simulation. While a full year was modelled in five
minute increments, only data for January and July are presented to illustrate the
magnitude of the largest heating and cooling loads required throughout the year.
The electrical profiles shown in Figure 3-25 were taken from a database
maintained by the International Energy Agency called Annex 42 [3.5]. This
program is a partnership between several governmental organizations and
universities around the world. The electrical profiles used for the simulation
represent the consumption of an average detached single family Canadian
household, and was provided to Annex 42 by the Canadian Centre for Housing
Technology based in Ottawa, Canada. The electrical profile includes
consumption from air handling blowers used in furnace and air conditioning
systems. Climatic data for Winnipeg, Canada was used for load simulation as
this region experiences extreme cold and hot summers (-40°C to 40°C). This
climate requires significant heating and cooling loads, making it ideal to test the
performance of the trigeneration system under study.
In an effort to keep simulation development within a prescribed timeline, hot
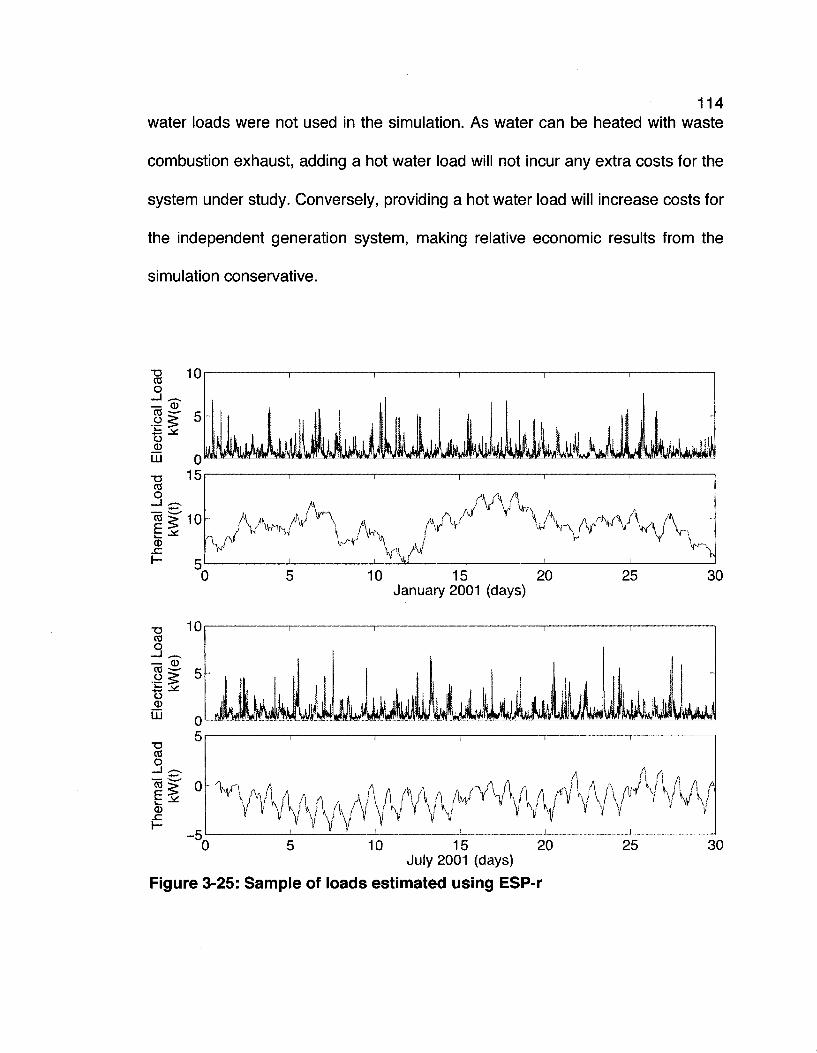
114 water loads were not used in the simulation. As water can be heated with waste
combustion exhaust, adding a hot water load will not incur any extra costs for the
system under study. Conversely, providing a hot water load will increase costs for
the independent generation system, making relative economic results from the
simulation conservative.
* 1 0
o
II 5
T5 ui 0 Jiiyiiitiy^
10 15 20 January 2001 (days)
The
rmal
Loa
d
kW(t)
n o
a
I I 5 I !
25 30
T3 CO O
10
— <D
is J * o iiui™
15 July 2001 (days)
Figure 3-25: Sample of loads estimated using ESP-r
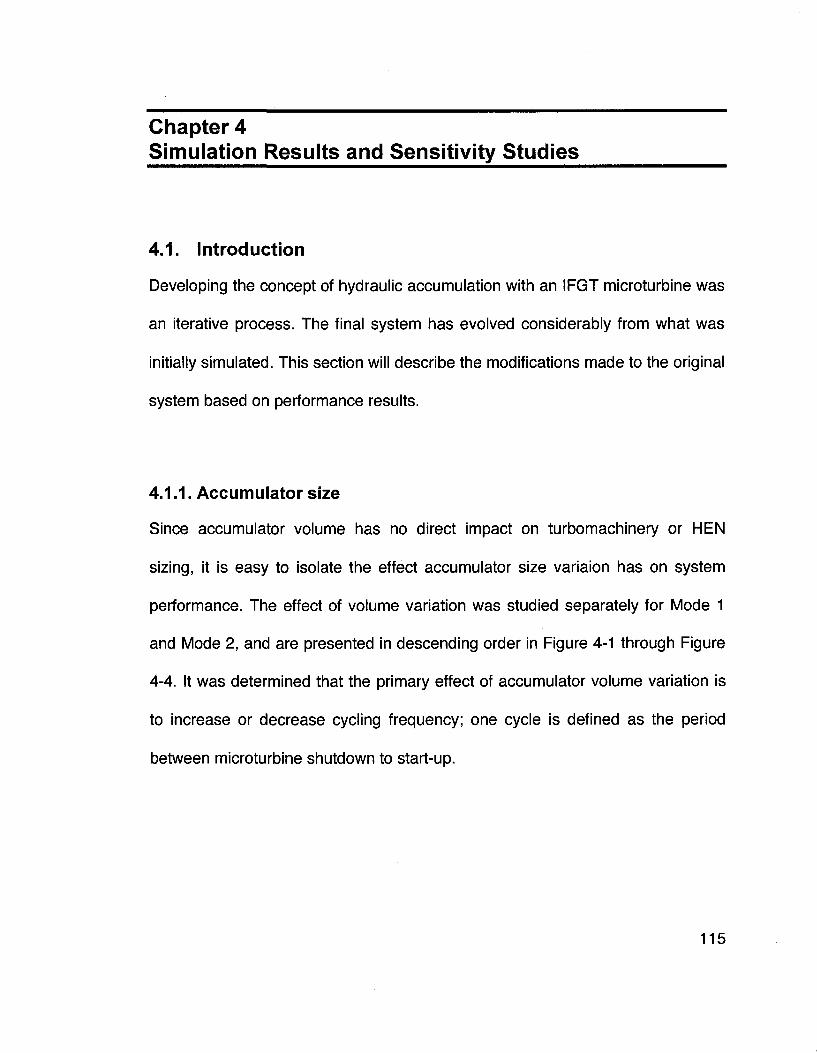
Chapter 4 Simulation Results and Sensitivity Studies
4.1. Introduction
Developing the concept of hydraulic accumulation with an IFGT microturbine was
an iterative process. The final system has evolved considerably from what was
initially simulated. This section will describe the modifications made to the original
system based on performance results.
4.1.1. Accumulator size
Since accumulator volume has no direct impact on turbomachinery or HEN
sizing, it is easy to isolate the effect accumulator size variaion has on system
performance. The effect of volume variation was studied separately for Mode 1
and Mode 2, and are presented in descending order in Figure 4-1 through Figure
4-4. It was determined that the primary effect of accumulator volume variation is
to increase or decrease cycling frequency; one cycle is defined as the period
between microturbine shutdown to start-up.
115
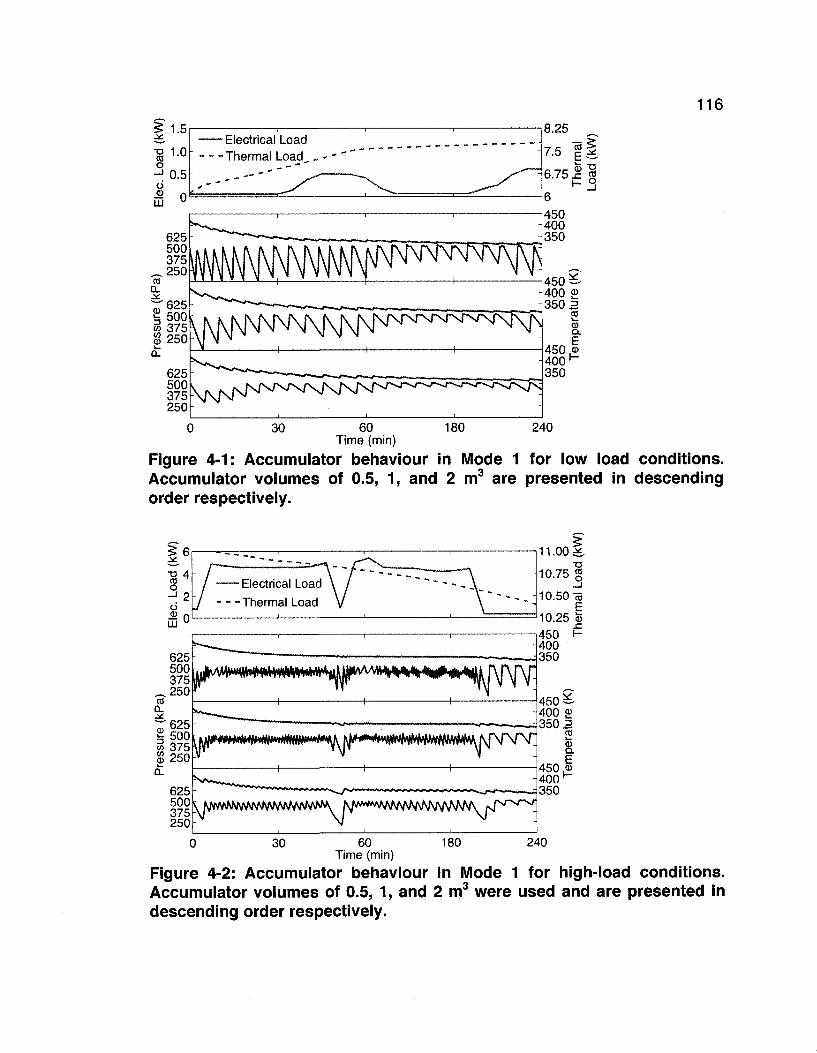
116
625 500 375 250
Figure 4-1:
60 Time (min)
Accumulator behaviour in Mode 1 for low load conditions. Accumulator volumes of 0.5, 1, and 2 order respectively.
m3 are presented in descending
Electrical Load
Thermal Load
625 500 375 250
f4^^W#^
mt»bHl*tHl*ititNHtl*'*i*' J^*4*«M#»*#V#^^
"^rfs/^h^m^^
kjmMwwmN^WA / MW^ A N M A /s ^M
n.oog. 10.75 «
10.50T5 E
10.25 o3 450 H 400 350
450^-400 £ 350 =
03
I 450 <» 400 H
350
0 30 180 240 60 Time (min)
Figure 4-2: Accumulator behaviour in Mode 1 for high-load conditions. Accumulator volumes of 0.5, 1, and 2 m3 were used and are presented in descending order respectively.
117 As was expected, cycle frequency increased for high-load conditions for both
configurations; however, under Mode 2 high-load conditions cycle frequency was
significantly higher than for Mode 1 high-load. Figure 4-2 and Figure 4-4 (high-
load) show a cycling frequency that would most likely be unachievable in practice
for an accumulator volume of 0.5 m3.
60 Time (min)
Figure 4-3: Accumulator behaviour in Mode 2 for low-load conditions. Accumulator volumes of 0.5, 1, and 2 m3 were used and are presented in descending order respectively.
As the trigeneration system is controlled with components such as solenoid flow
control valves, and intake and exhaust fans, rapidly cycling these components
will lead to premature component failure and degradation of system performance
due to more frequent transient operation. As transient responses were not
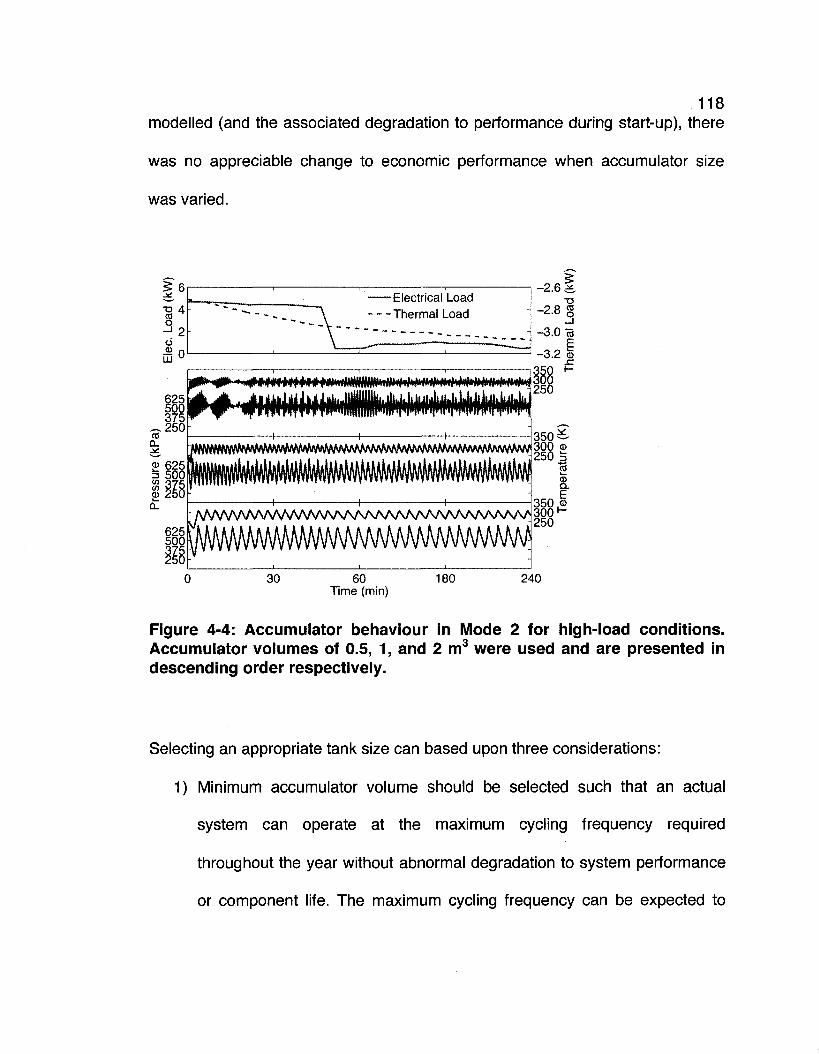
118 modelled (and the associated degradation to performance during start-up), there
was no appreciable change to economic performance when accumulator size
was varied.
60 Time (min)
Figure 4-4: Accumulator behaviour in Mode 2 for high-load conditions. Accumulator volumes of 0.5, 1, and 2 m3 were used and are presented in descending order respectively.
Selecting an appropriate tank size can based upon three considerations:
1) Minimum accumulator volume should be selected such that an actual
system can operate at the maximum cycling frequency required
throughout the year without abnormal degradation to system performance
or component life. The maximum cycling frequency can be expected to
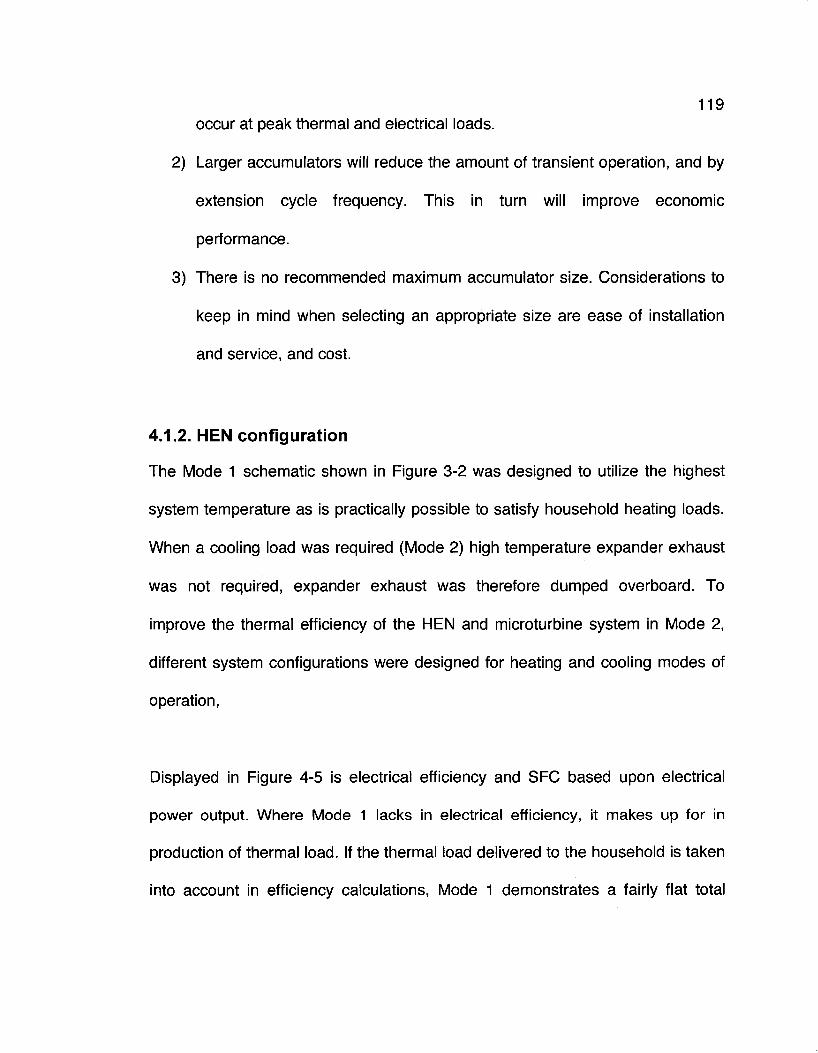
119 occur at peak thermal and electrical loads.
2) Larger accumulators will reduce the amount of transient operation, and by
extension cycle frequency. This in turn will improve economic
performance.
3) There is no recommended maximum accumulator size. Considerations to
keep in mind when selecting an appropriate size are ease of installation
and service, and cost.
4.1.2. HEN configuration
The Mode 1 schematic shown in Figure 3-2 was designed to utilize the highest
system temperature as is practically possible to satisfy household heating loads.
When a cooling load was required (Mode 2) high temperature expander exhaust
was not required, expander exhaust was therefore dumped overboard. To
improve the thermal efficiency of the HEN and microturbine system in Mode 2,
different system configurations were designed for heating and cooling modes of
operation,
Displayed in Figure 4-5 is electrical efficiency and SFC based upon electrical
power output. Where Mode 1 lacks in electrical efficiency, it makes up for in
production of thermal load. If the thermal load delivered to the household is taken
into account in efficiency calculations, Mode 1 demonstrates a fairly flat total
120 efficiency of 93 to 95 percent from synchronous idle to full power.
1 o c <D
"g
^ 0 . 5
o x:
CD
O
CO
0
HEN Config. 1
HEN Config. 2
total efficiency HEN Config. 1
~
1 1 ' '
\ * \ x
\ \
i i
i
- - _
i
. . . . .
i
i
~
-
0 10 2 4 6 8 Electrical Power Output (kWe)
Figure 4-5: Comparison of thermal efficiency and SFC performance from full power to synchronous idle for HEN Mode 1 and Mode 2 configurations at standard ambient conditions of 101.325 kPa and 288K
When the microturbine is operating in heating mode, any losses due to
turbomachinery isentropic efficiencies of less than unity are translated into
increased flow temperature. This increased flow energy is not utilized if exhaust
energy is vented to atmosphere. In the modelled system, any turbomachinery
losses are recaptured when the exhaust is delivered to the household for space
heating purposes. 121
Mode 1 total efficiency losses can be attributed to pressure losses in the HEN
and exhaust ducting, and due to mechanical, combustion, and electrical
conversion efficiencies less than unity. This high overall efficiency is possible due
to the implementation of the IFGT concept within the system, as the microturbine
exhaust is free of combustion products and can be vented directly into the
household. While operating in Mode 1, the microturbine and HEN are analogous
to a high-efficiency natural gas furnace that produces electrical load as a by
product.
4.1.3. Microturbine size
The effect of varying the electrical output of the microturbine on economic
performance and system response was investigated. To size the microturbine,
compressor and expander maps were adjusted by varying corrected mass flows
(compressor and expander) until the desired power output was achieved. Design
and off-design PR and isentropic efficiency characterisics were left unchanged. It
is acknowledged that this assumption will introduce some error in the smaller
sizes, as isentropic efficiencies will degrade in smaller machines when compared
to larger geometrically similar machines. It is believed that this error will not be
significant enough to affect the conclusions drawn from the microturbine sizing

122 study. Three microturbine sizes were used for the sensitivity study: 5, 10, and 20
kWe. All component pressure temperature and power input and outputs were
monitored to ensure the simulation was behaving as expected, however three
key performance parameters were compared to determine the effect of
microturbine size variation on system performance: fuel cost, accumulator
behaviour, and household temperature. The latter two measures of performance
were selected to give a measure of cycling frequency, and the corresponding
effect on household temperature. While satisfying a heating load (as in Mode 1),
microturbine size had a negligible effect on cost. This may seem counterintuitive
given the fact that for the same accumulator pressure, larger microturbine sizes
demonstrated higher accumulator temperatures as seen in Figure 4-6.
Higher accumulator temperatures translate to less fuel required to bring
accumulator discharge flow up to temperature through the HEN, and therefore
reduces SFC during IBC operation. The higher accumulator temperature should
therefore translate to a reduction in fuel costs. A more in-depth look into how the
system charges the accumulator is required to explain this phenomenon.
Household electrical load varies between zero and about 6 kWe, which means
with the exception of the 5 kWe engine, the microturbine is always overproducing
electrical load at full load. Excess load is fed to the secondary compressor, which
then charges the accumulator. The secondary compressor was sized to ensure
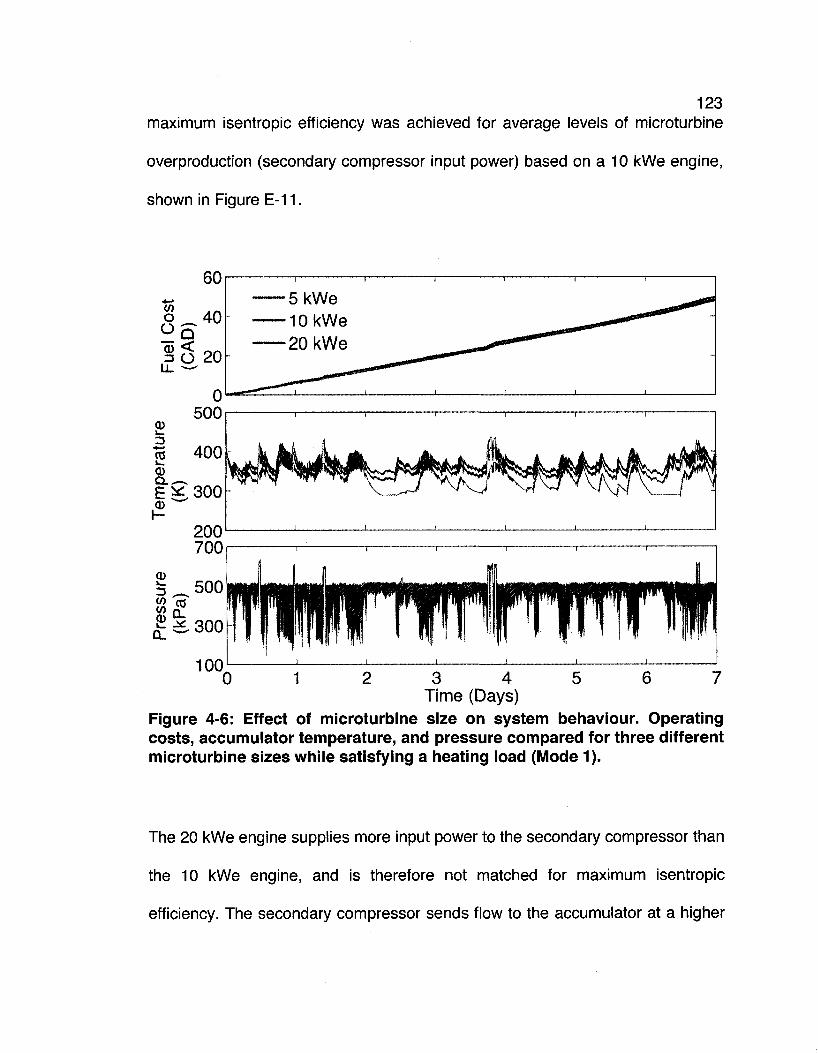
123 maximum isentropic efficiency was achieved for average levels of microturbine
overproduction (secondary compressor input power) based on a 10 kWe engine,
shown in Figure E-11.
60 •5kWe •10kWe •20kWe
3 4 Time (Days)
Figure 4-6: Effect of microturbine size on system behaviour. Operating costs, accumulator temperature, and pressure compared for three different microturbine sizes while satisfying a heating load (Mode 1).
The 20 kWe engine supplies more input power to the secondary compressor than
the 10 kWe engine, and is therefore not matched for maximum isentropic
efficiency. The secondary compressor sends flow to the accumulator at a higher
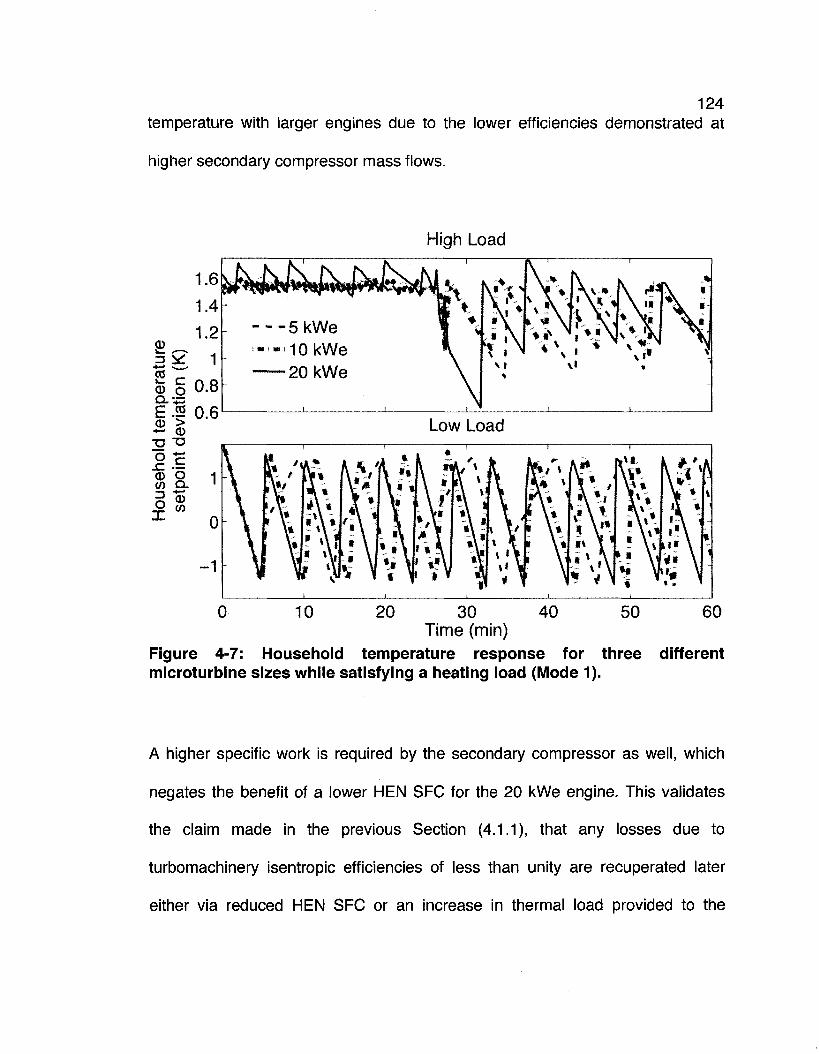
124 temperature with larger engines due to the lower efficiencies demonstrated at
higher secondary compressor mass flows.
High Load
Figure 4-7: Household temperature response for three different microturbine sizes while satisfying a heating load (Mode 1).
A higher specific work is required by the secondary compressor as well, which
negates the benefit of a lower HEN SFC for the 20 kWe engine. This validates
the claim made in the previous Section (4.1.1), that any losses due to
turbomachinery isentropic efficiencies of less than unity are recuperated later
either via reduced HEN SFC or an increase in thermal load provided to the
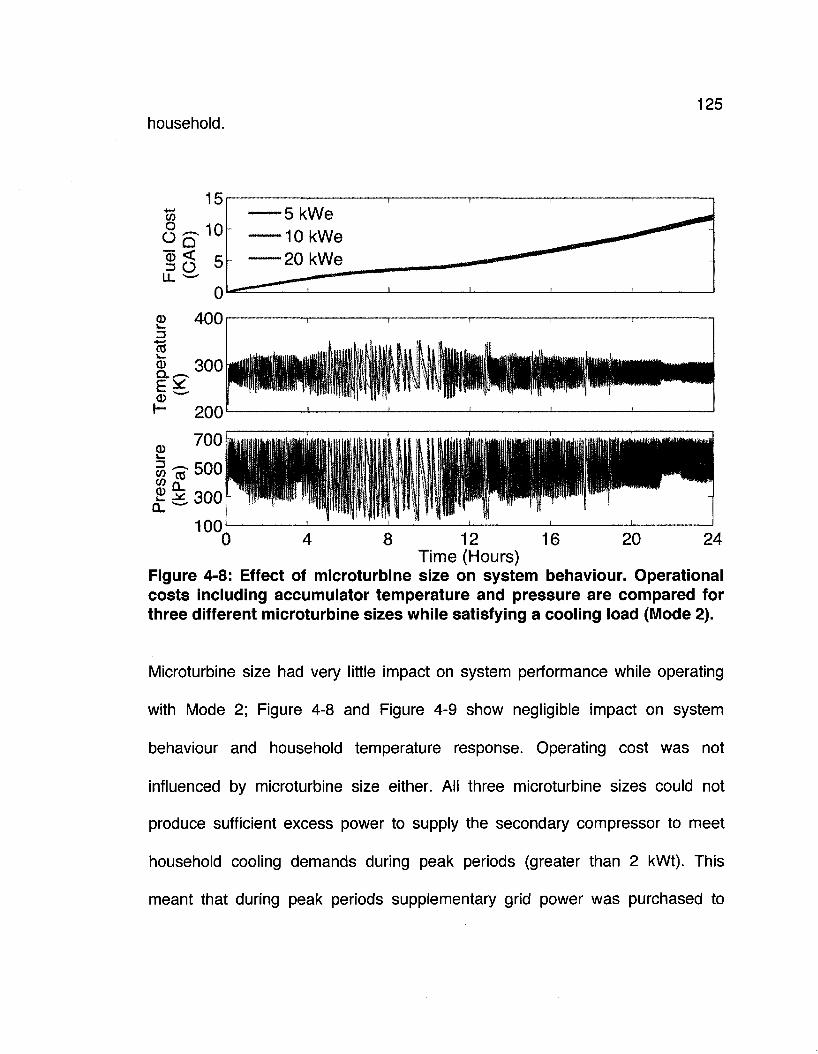
household. 125
Time (Hours) Figure 4-8: Effect of microturbine size on system behaviour. Operational costs including accumulator temperature and pressure are compared for three different microturbine sizes while satisfying a cooling load (Mode 2).
Microturbine size had very little impact on system performance while operating
with Mode 2; Figure 4-8 and Figure 4-9 show negligible impact on system
behaviour and household temperature response. Operating cost was not
influenced by microturbine size either. All three microturbine sizes could not
produce sufficient excess power to supply the secondary compressor to meet
household cooling demands during peak periods (greater than 2 kWt). This
meant that during peak periods supplementary grid power was purchased to
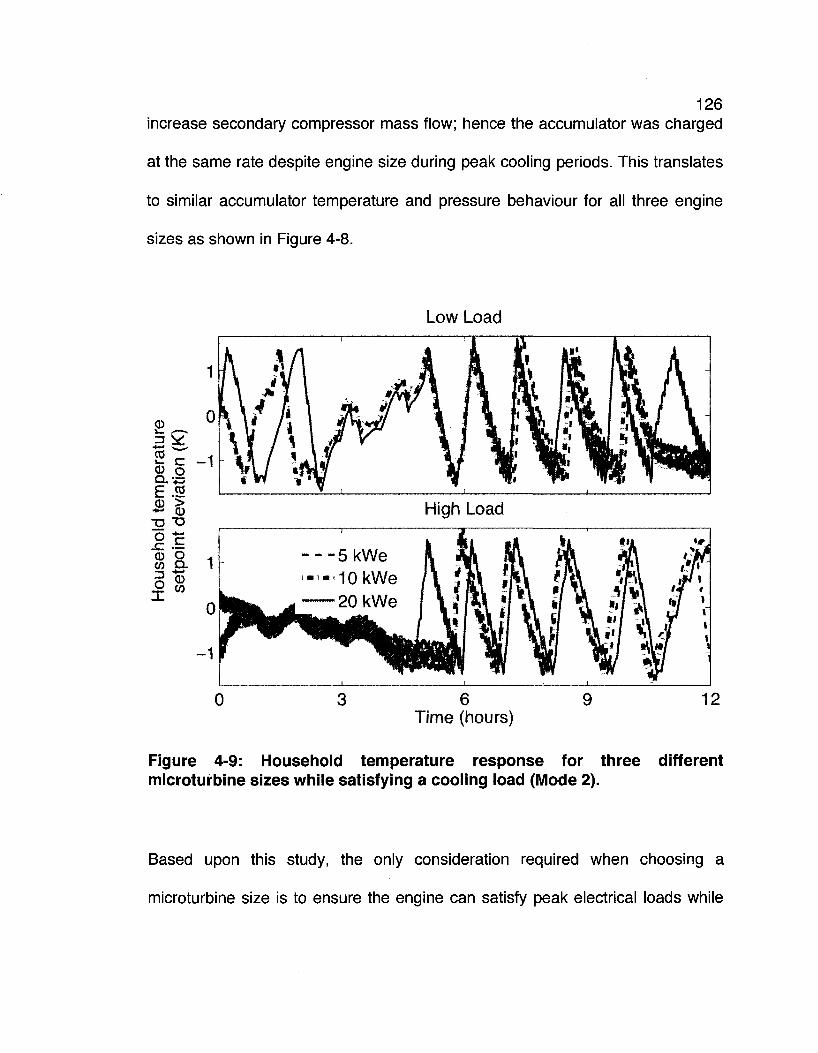
126 increase secondary compressor mass flow; hence the accumulator was charged
at the same rate despite engine size during peak cooling periods. This translates
to similar accumulator temperature and pressure behaviour for all three engine
sizes as shown in Figure 4-8.
Low Load
Figure 4-9: Household temperature response for three different microturbine sizes while satisfying a cooling load (Mode 2).
Based upon this study, the only consideration required when choosing a
microturbine size is to ensure the engine can satisfy peak electrical loads while

127 providing a power input to the secondary compressor. This will ensure total
energy islanding can be attained for Mode 1, and for Mode 2 (if a higher
household setpoint temperature is acceptable during peak summer
temperatures). The 10 kWe engine is therefore recommended, as the 5 kWe
engine cannot satisfy peak electrical loads, and no benefit is realized from
choosing the more expensive 20 kWe microturbine.
4.1.4. Microturbine bleed
In an effort to reduce system complexity and cost, initial design called for the
accumulator to be charged with microturbine compressor bleed flow instead of a
secondary compressor, as shown in Figure 3-1. The microturbine compressor
was run at design conditions with output power controlled by throttling
compressor discharge bleed flow. This allowed the microturbine to operate in an
electric load following manner, while simultaneously charging the accumulator
and satisfying a heating load. While satisfying a heating load, fuel costs for the
system using compressor bleed flow to charge the accumulator were slightly
higher than if a secondary compressor was used, as shown in Figure 4-10. The
difference in cost is due to the fact that the time to increase household setpoint
temperature from minimum to maximum limits was sometimes less than the time
required to charge an empty accumulator. To prevent household overheating,
expander exhaust was discharged to atmosphere while waiting for the
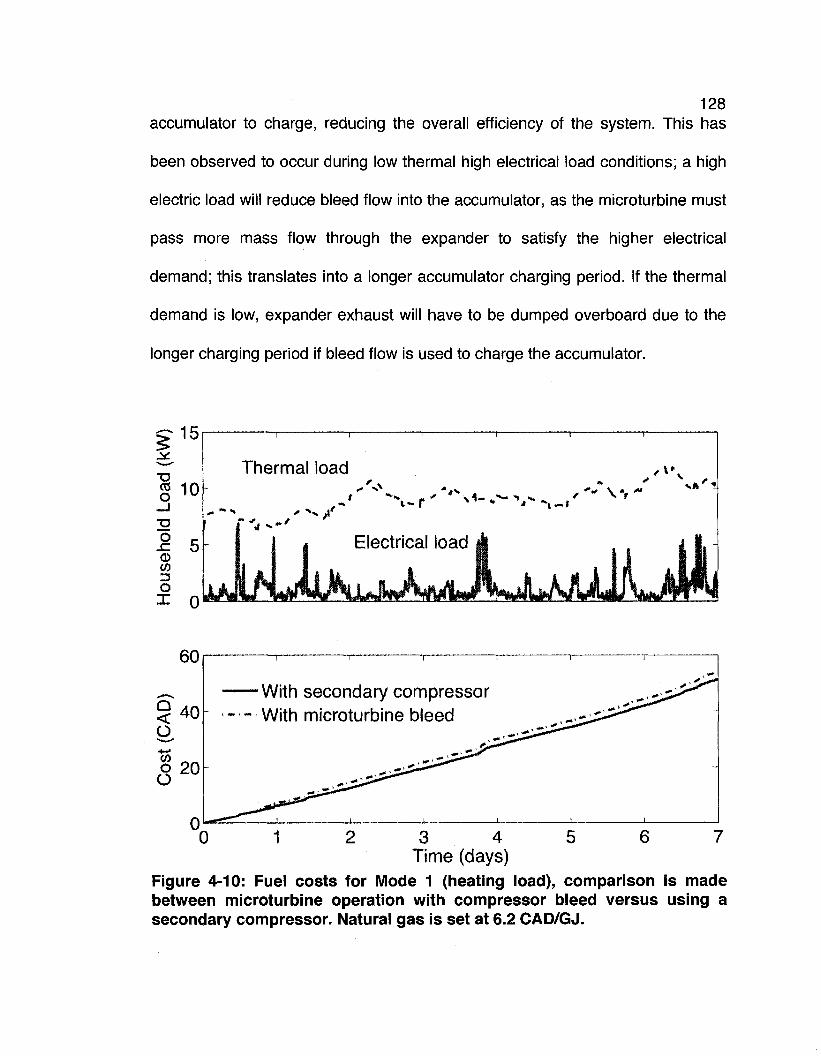
128 accumulator to charge, reducing the overall efficiency of the system. This has
been observed to occur during low thermal high electrical load conditions; a high
electric load will reduce bleed flow into the accumulator, as the microturbine must
pass more mass flow through the expander to satisfy the higher electrical
demand; this translates into a longer accumulator charging period. If the thermal
demand is low, expander exhaust will have to be dumped overboard due to the
longer charging period if bleed flow is used to charge the accumulator.
15 £ J *
I 10 _J
JZ 5 CO
O
x o
Thermal load *r*s "*rf \ « . *** V r \h' %
- - •* - • * * /
I 1 Electrical load k | |. -
60
Q < O
40
O20
•With secondary compressor With microturbine bleed
1 2 3 4 5 6 7 Time (days)
Figure 4-10: Fuel costs for Mode 1 (heating load), comparison is made between microturbine operation with compressor bleed versus using a secondary compressor. Natural gas is set at 6.2 CAD/GJ.
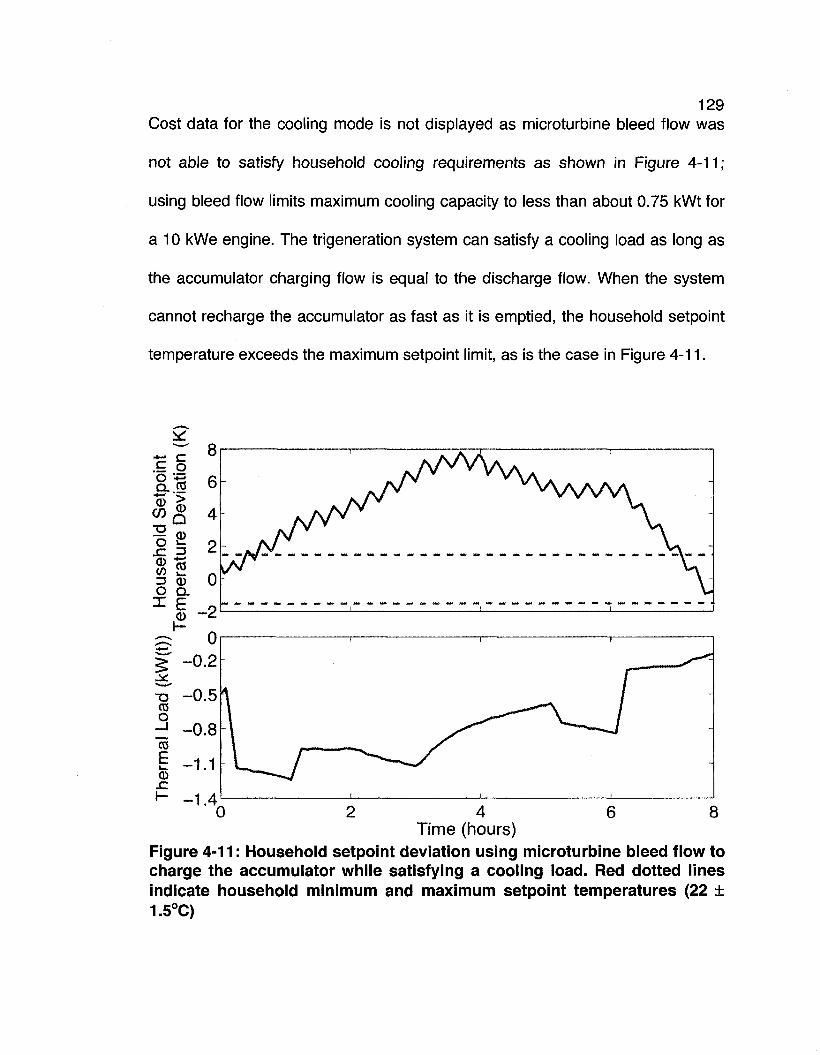
129 Cost data for the cooling mode is not displayed as microturbine bleed flow was
not able to satisfy household cooling requirements as shown in Figure 4-11;
using bleed flow limits maximum cooling capacity to less than about 0.75 kWt for
a 10 kWe engine. The trigeneration system can satisfy a cooling load as long as
the accumulator charging flow is equal to the discharge flow. When the system
cannot recharge the accumulator as fast as it is emptied, the household setpoint
temperature exceeds the maximum setpoint limit, as is the case in Figure 4-11.
0 2 4 6 8 Time (hours)
Figure 4-11: Household setpoint deviation using microturbine bleed flow to charge the accumulator while satisfying a cooling load. Red dotted lines indicate household minimum and maximum setpoint temperatures (22 ± 1.5°C)
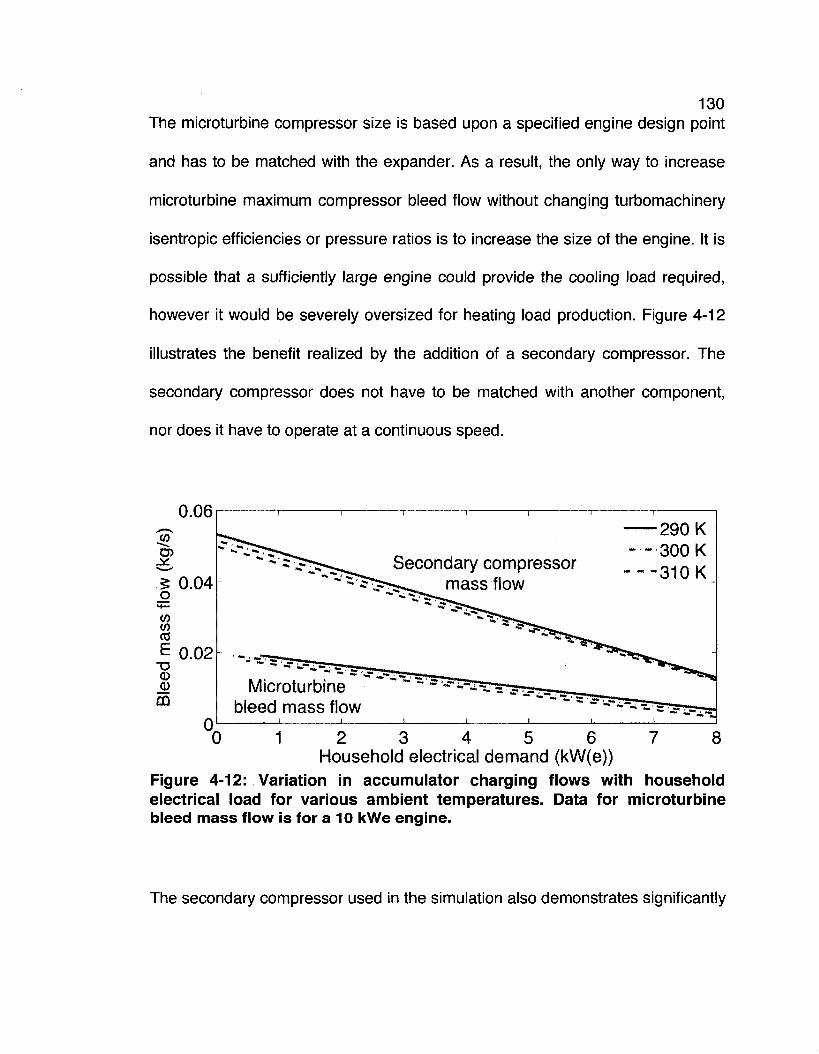
130 The microturbine compressor size is based upon a specified engine design point
and has to be matched with the expander. As a result, the only way to increase
microturbine maximum compressor bleed flow without changing turbomachinery
isentropic efficiencies or pressure ratios is to increase the size of the engine. It is
possible that a sufficiently large engine could provide the cooling load required,
however it would be severely oversized for heating load production. Figure 4-12
illustrates the benefit realized by the addition of a secondary compressor. The
secondary compressor does not have to be matched with another component,
nor does it have to operate at a continuous speed.
Household electrical demand (kVV(e)) Figure 4-12: Variation in accumulator charging flows with household electrical load for various ambient temperatures. Data for microturbine bleed mass flow is for a 10 kWe engine.
The secondary compressor used in the simulation also demonstrates significantly
131 higher isentropic efficiencies (up to 0.92) when compared to the microturbine
compressor (0.75 at design). When in a constant pressure mode of operation,
this higher efficiency translates to higher mass flows for the same input power.
The secondary compressor also has the benefit of being able to accept grid
power if necessary to boost mass flow. This ensures no accumulator flow deficit
exists, thereby maintaining household temperature within setpoint limits.
A typical operating line for a gas turbine in constant speed mode of operation is
almost vertical on a graph of corrected compressor mass flow versus CPR;
hence compressor mass flow is virtually invariant from full power to synchronous
idle. If bleed flow is to be boosted without using a separate compressor or re
sizing the microturbine, the engine must deviate from constant speed operation.
During peak loads compressor mass flow, and by extension bleed flow, could be
boosted by supplying grid power to the high-speed generator; at the same time
household electrical demand could be supplied by grid power as well. Supplying
grid power to the high-speed generator would increase shaft power to the
compressor and increase CPR; this in turn would permit a larger maximum bleed
flow. This concept was not modelled or simulated, and remains a topic of further
investigation. It is always desirable to reduce system complexity and
maintenance costs; any concept that involves elimination of the secondary
compressor is worth pursuing.
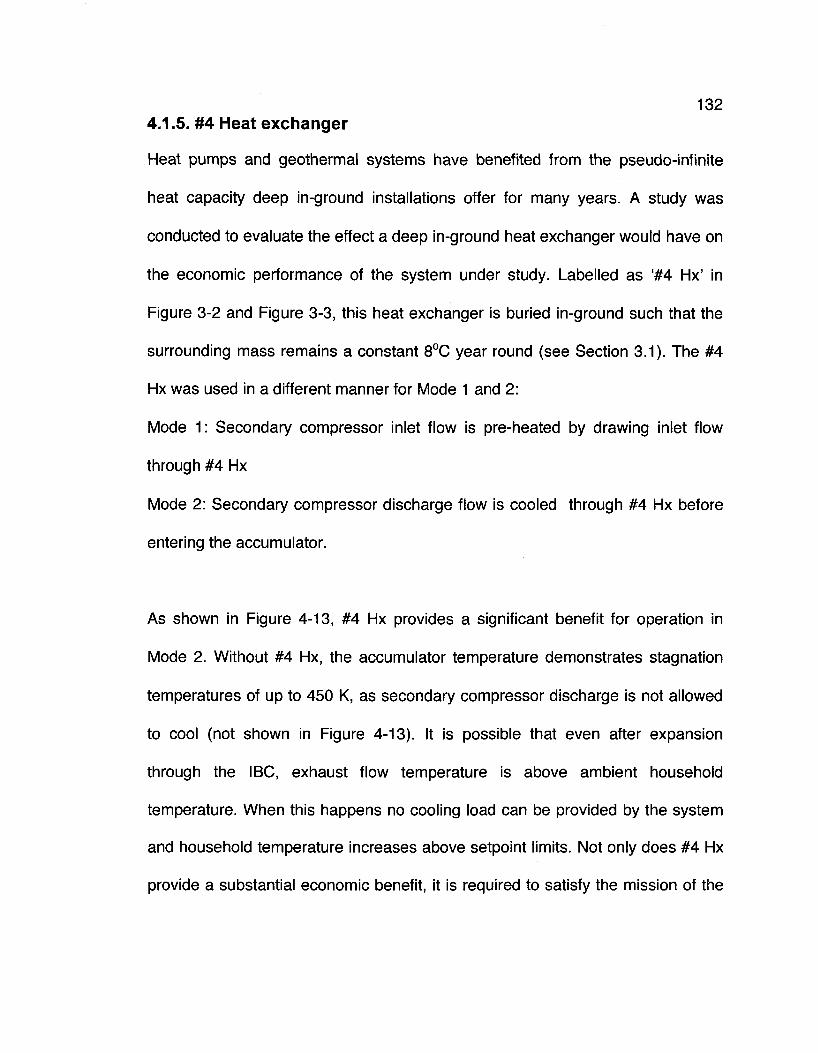
132 4.1.5. #4 Heat exchanger
Heat pumps and geothermal systems have benefited from the pseudo-infinite
heat capacity deep in-ground installations offer for many years. A study was
conducted to evaluate the effect a deep in-ground heat exchanger would have on
the economic performance of the system under study. Labelled as '#4 Hx' in
Figure 3-2 and Figure 3-3, this heat exchanger is buried in-ground such that the
surrounding mass remains a constant 8°C year round (see Section 3.1). The #4
Hx was used in a different manner for Mode 1 and 2:
Mode 1: Secondary compressor inlet flow is pre-heated by drawing inlet flow
through #4 Hx
Mode 2: Secondary compressor discharge flow is cooled through #4 Hx before
entering the accumulator.
As shown in Figure 4-13, #4 Hx provides a significant benefit for operation in
Mode 2. Without #4 Hx, the accumulator temperature demonstrates stagnation
temperatures of up to 450 K, as secondary compressor discharge is not allowed
to cool (not shown in Figure 4-13). It is possible that even after expansion
through the IBC, exhaust flow temperature is above ambient household
temperature. When this happens no cooling load can be provided by the system
and household temperature increases above setpoint limits. Not only does #4 Hx
provide a substantial economic benefit, it is required to satisfy the mission of the
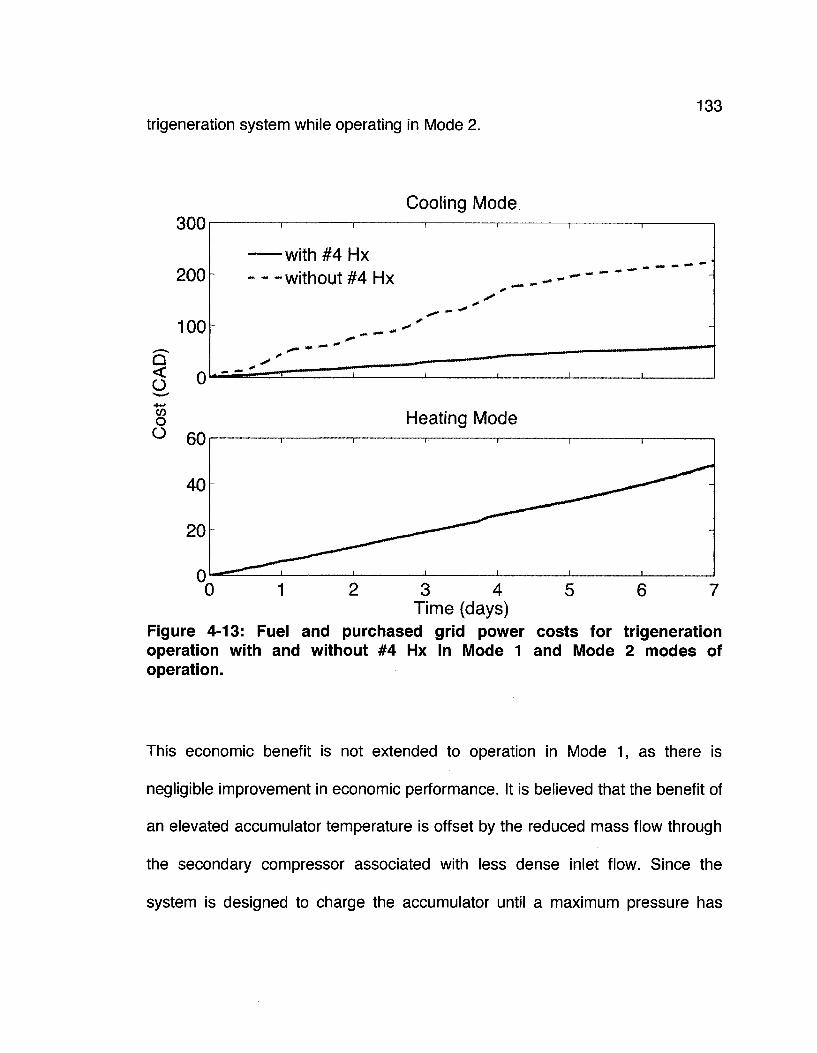
133 trigeneration system while operating in Mode 2.
200
100
Cooling Mode
<
o 'Sm*'
.i.|xi.-
CO O O
A U
60
•with #4 Hx •without #4 Hx
Heating Mode
3 4 5 6 7 Time (days)
Figure 4-13: Fuel and purchased grid power costs for trigeneration operation with and without #4 Hx in Mode 1 and Mode 2 modes of operation.
This economic benefit is not extended to operation in Mode 1, as there is
negligible improvement in economic performance. It is believed that the benefit of
an elevated accumulator temperature is offset by the reduced mass flow through
the secondary compressor associated with less dense inlet flow. Since the
system is designed to charge the accumulator until a maximum pressure has

134 been reached, any reduction in mass flow into the accumulator during charging
will increase the time required until fully charged. This translates into longer
microturbine run times and increased fuel consumption. Of course this increase
in microturbine fuel consumption is offset by a decrease in HEN fuel consumption
due to higher accumulator temperature; the results shown in Figure 4-13 indicate
that this offset is equal in magnitude. To reduce unnecessary wear and tear on
the #4 Hx, It is therefore recommended that the #4 Hx be used for Mode 2 only.
4.1.6. IBC flow treatment
To extract more specific work from the IBC expander, the effect of increasing
expander inlet temperature (EIT) was investigated. Two cases were studied: the
first case did not cycle accumulator discharge flow through the HEN. As
accumulator discharge flow is typically anywhere from 300 to 400 K, secondary
expander discharge flow temperature was too low to provide a useful thermal
load. The second case increased accumulator discharge temperature by cycling
through the HEN before entering the secondary expander. The HEN was fired at
a constant maximum combustion temperature (T23) of 1200 K for all accumulator
discharge pressures and flow rates. Despite consuming fuel during IBC
operation, cycling accumulator discharge flow through the HEN reduced overall
fuel consumption as shown in Figure 4-14. While the cost savings may seem
marginal, note that the data in Figure 4-14 spans only a week. Fuel savings over
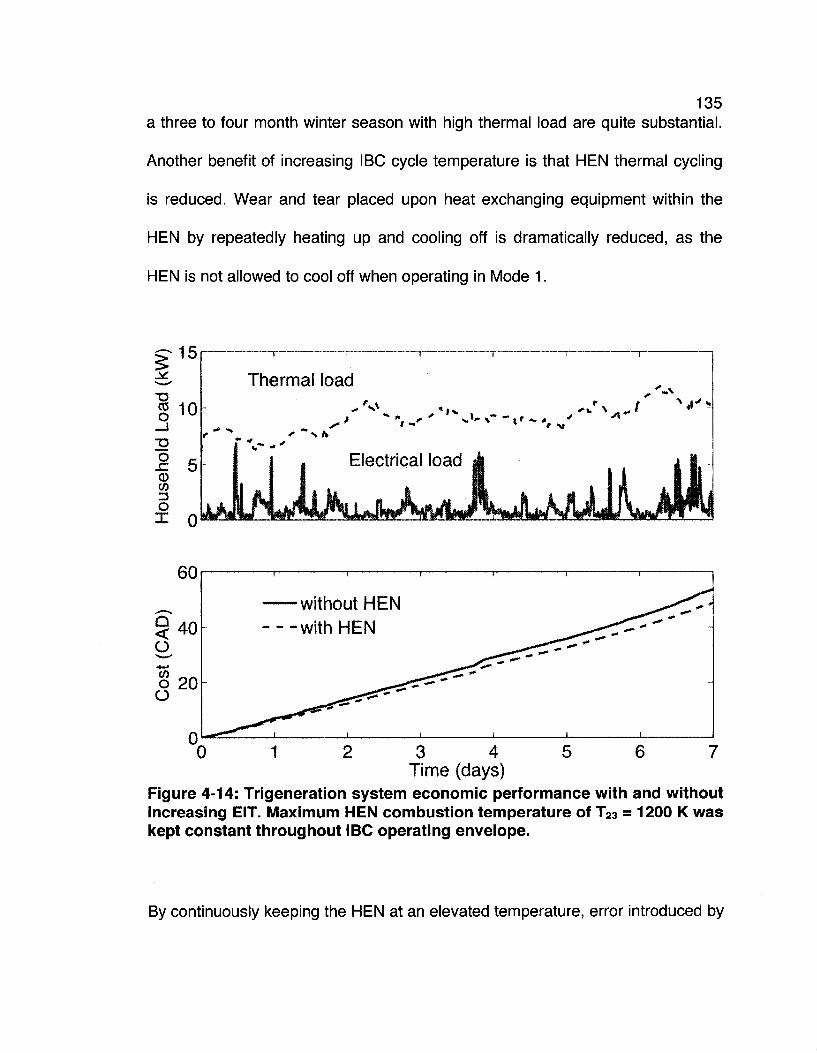
135 a three to four month winter season with high thermal load are quite substantial.
Another benefit of increasing IBC cycle temperature is that HEN thermal cycling
is reduced. Wear and tear placed upon heat exchanging equipment within the
HEN by repeatedly heating up and cooling off is dramatically reduced, as the
HEN is not allowed to cool off when operating in Mode 1.
15 .M
S 10
-c 5 CD w o
Thermal load - \
. / V J "
*• V l k
J^l/'
I Electrical load k i J
60
§ 4 0 O
O20
0 0
—without HEN - -with HEN
1 2 3 4 5 6 7 Time (days)
Figure 4-14: Trigeneration system economic performance with and without increasing EIT. Maximum HEN combustion temperature of T23 = 1200 K was kept constant throughout IBC operating envelope.
By continuously keeping the HEN at an elevated temperature, error introduced by
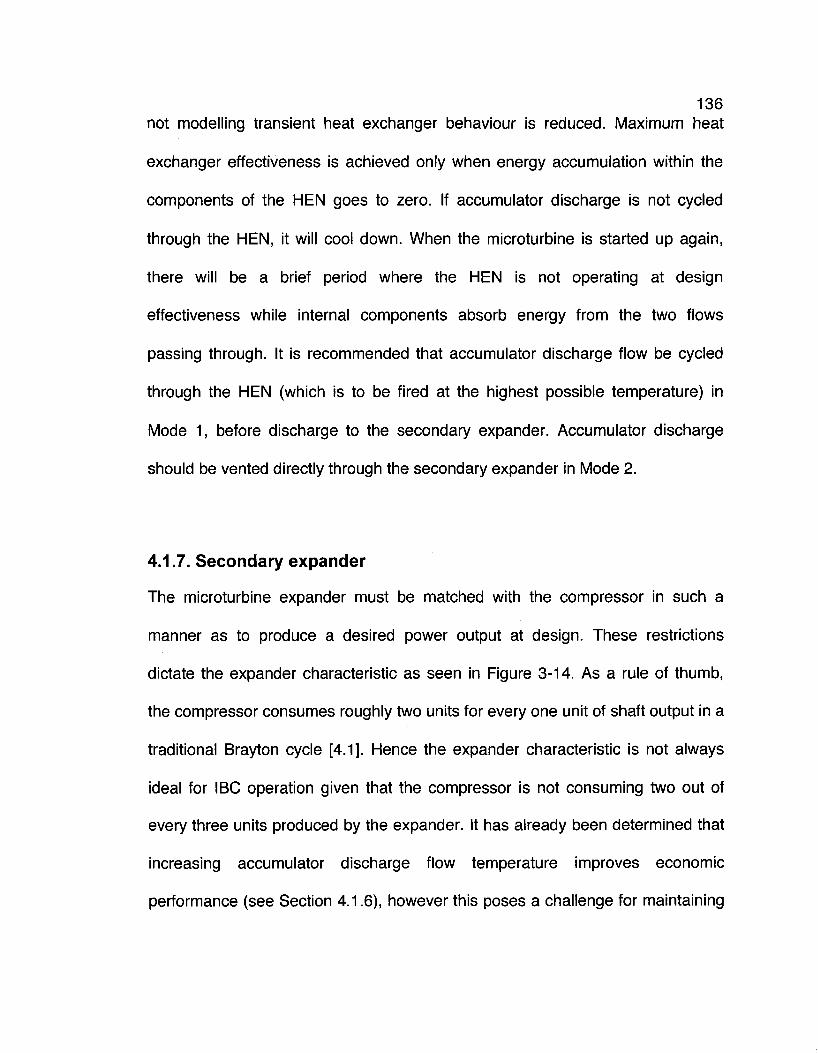
136 not modelling transient heat exchanger behaviour is reduced. Maximum heat
exchanger effectiveness is achieved only when energy accumulation within the
components of the HEN goes to zero. If accumulator discharge is not cycled
through the HEN, it will cool down. When the microturbine is started up again,
there will be a brief period where the HEN is not operating at design
effectiveness while internal components absorb energy from the two flows
passing through. It is recommended that accumulator discharge flow be cycled
through the HEN (which is to be fired at the highest possible temperature) in
Mode 1, before discharge to the secondary expander. Accumulator discharge
should be vented directly through the secondary expander in Mode 2.
4.1.7. Secondary expander
The microturbine expander must be matched with the compressor in such a
manner as to produce a desired power output at design. These restrictions
dictate the expander characteristic as seen in Figure 3-14. As a rule of thumb,
the compressor consumes roughly two units for every one unit of shaft output in a
traditional Brayton cycle [4.1]. Hence the expander characteristic is not always
ideal for IBC operation given that the compressor is not consuming two out of
every three units produced by the expander. It has already been determined that
increasing accumulator discharge flow temperature improves economic
performance (see Section 4.1.6), however this poses a challenge for maintaining
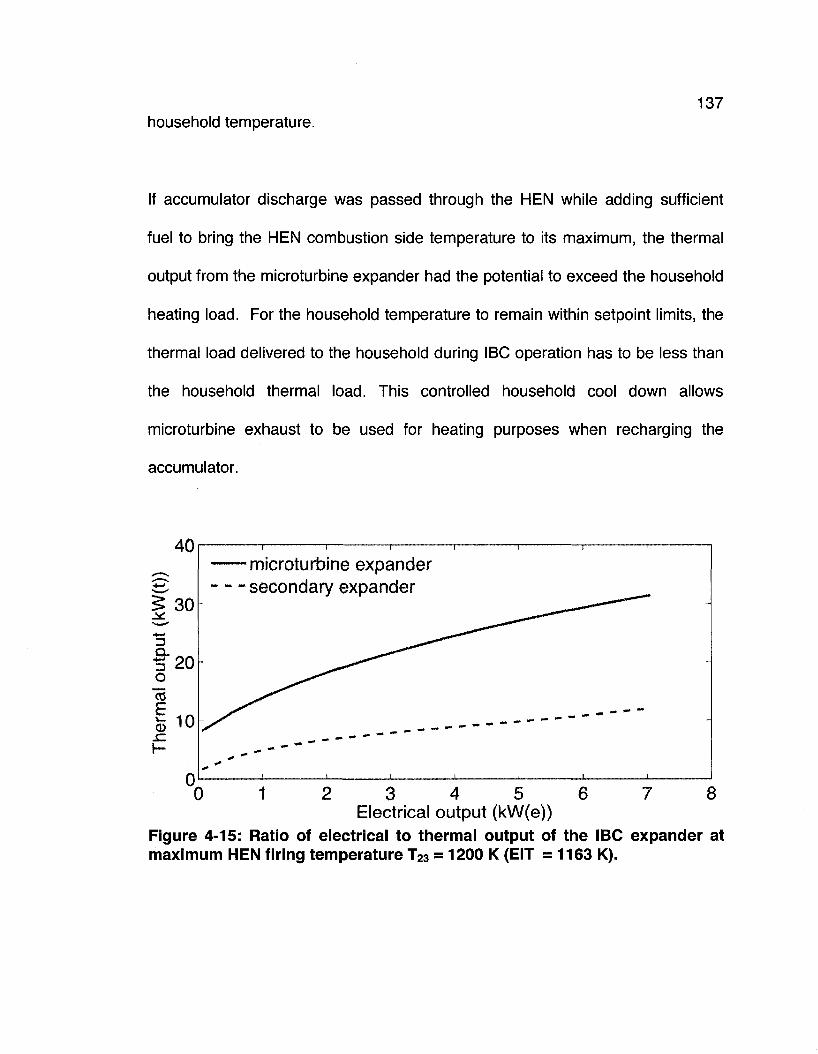
household temperature. 137
If accumulator discharge was passed through the HEN while adding sufficient
fuel to bring the HEN combustion side temperature to its maximum, the thermal
output from the microturbine expander had the potential to exceed the household
heating load. For the household temperature to remain within setpoint limits, the
thermal load delivered to the household during IBC operation has to be less than
the household thermal load. This controlled household cool down allows
microturbine exhaust to be used for heating purposes when recharging the
accumulator.
40
0
— microturbine expander - - secondary expander
0 1 8 2 3 4 5 6 7 Electrical output (kW(e))
Figure 4-15: Ratio of electrical to thermal output of the IBC expander at maximum HEN firing temperature T23 = 1200 K (EIT =1163 K).

138 If the household temperature is too high when the microturbine engages an
accumulator recharge cycle, exhaust will have to be dumped overboard to
prevent household overtemp. At the same time to minimize fuel costs, IBC
maximum cycle temperature (T23) must be kept as high as possible. Figure 4-15
shows the relationship between thermal and electrical output of the IBC using the
microturbine expander, and a separate re-sized secondary expander. The
secondary expander used is geometrically similar to the microturbine expander
with a scaling factor applied such that the corrected mass flow is 1/6th of the
microturbine expander. Household heating loads during severe winter months
typically vary between 8 and 15 kWt. Figure 4-15 shows secondary expander
thermal output is almost always below this demand, yet is sufficiently sized to
provide for peak household electrical demand of about 7 kWe. Using the re-sized
secondary expander allows the HEN to be fired at maximum temperature for
improved economic performance while not exceeding household thermal
demand.
4.2. Final results
Based upon the results from the studies described in Section 4.1, a final
configuration was selected for maximum economic performance. See Figures
Figure 3-2 and Figure 3-3 for schematics of the final configurations for Mode 1
and Mode 2. Key design points are summarized as follows:
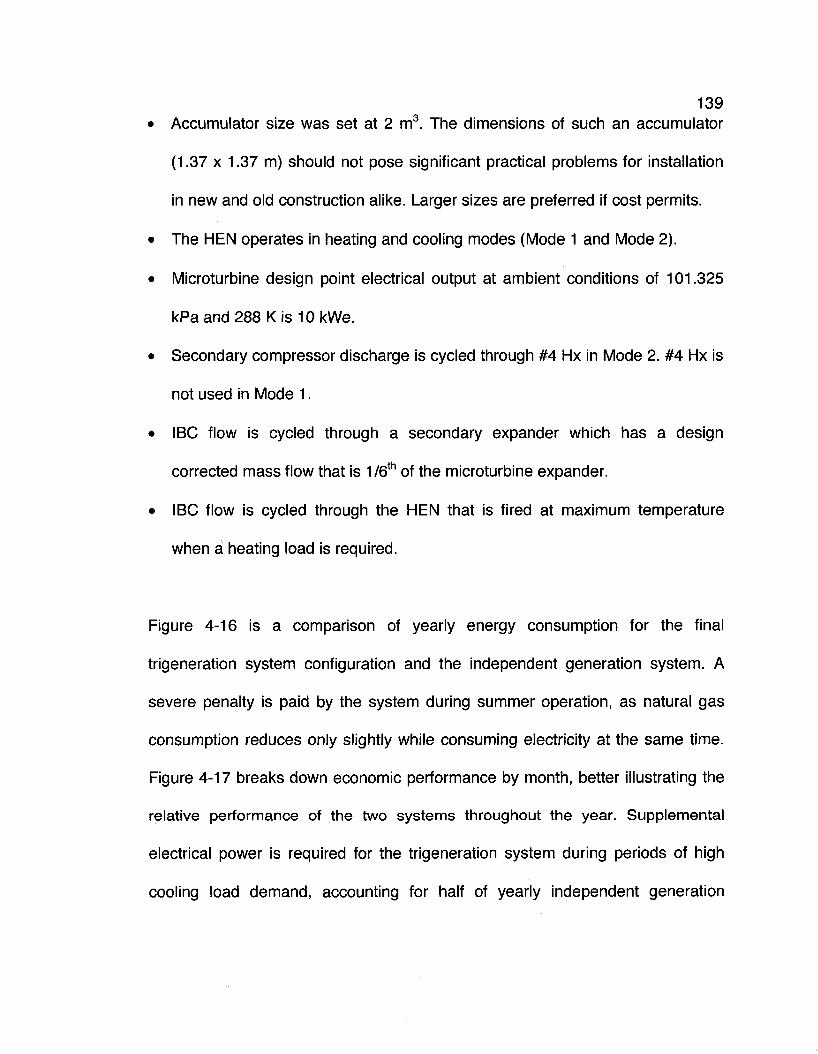
139
• Accumulator size was set at 2 m3. The dimensions of such an accumulator
(1.37 x 1.37 m) should not pose significant practical problems for installation
in new and old construction alike. Larger sizes are preferred if cost permits.
• The HEN operates in heating and cooling modes (Mode 1 and Mode 2).
• Microturbine design point electrical output at ambient conditions of 101.325
kPaand288Kis10kWe.
• Secondary compressor discharge is cycled through #4 Hx in Mode 2. #4 Hx is
not used in Mode 1.
• IBC flow is cycled through a secondary expander which has a design
corrected mass flow that is 1/6th of the microturbine expander.
• IBC flow is cycled through the HEN that is fired at maximum temperature
when a heating load is required.
Figure 4-16 is a comparison of yearly energy consumption for the final
trigeneration system configuration and the independent generation system. A
severe penalty is paid by the system during summer operation, as natural gas
consumption reduces only slightly while consuming electricity at the same time.
Figure 4-17 breaks down economic performance by month, better illustrating the
relative performance of the two systems throughout the year. Supplemental
electrical power is required for the trigeneration system during periods of high
cooling load demand, accounting for half of yearly independent generation
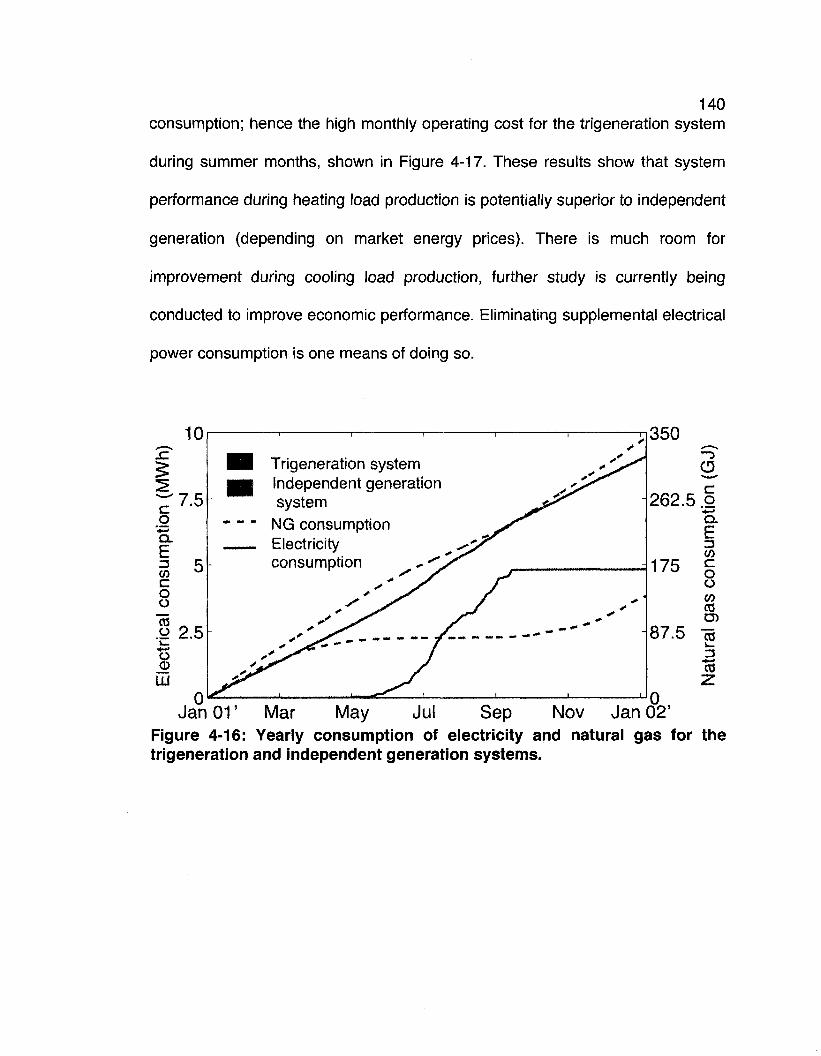
140 consumption; hence the high monthly operating cost for the trigeneration system
during summer months, shown in Figure 4-17. These results show that system
performance during heating load production is potentially superior to independent
generation (depending on market energy prices). There is much room for
improvement during cooling load production, further study is currently being
conducted to improve economic performance. Eliminating supplemental electrical
power consumption is one means of doing so.
Jan 01' Mar May Jul Sep Nov Jan 02' Figure 4-16: Yearly consumption of electricity and natural gas for the trigeneration and independent generation systems.
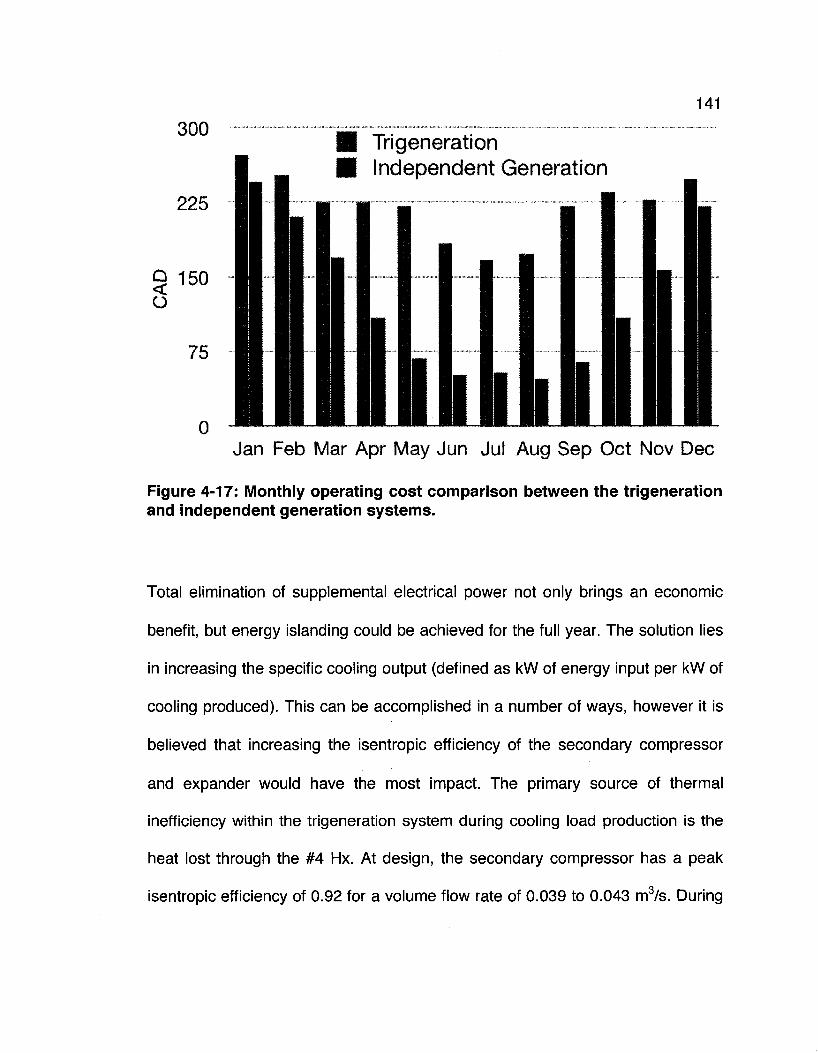
141
300
225
O
75
0
Trigeneration Independent Generation
Jan Feb Mar Apr May Jun Jul Aug Sep Oct Nov Dec
Figure 4-17: Monthly operating cost comparison between the trigeneration and independent generation systems.
Total elimination of supplemental electrical power not only brings an economic
benefit, but energy islanding could be achieved for the full year. The solution lies
in increasing the specific cooling output (defined as kW of energy input per kW of
cooling produced). This can be accomplished in a number of ways, however it is
believed that increasing the isentropic efficiency of the secondary compressor
and expander would have the most impact. The primary source of thermal
inefficiency within the trigeneration system during cooling load production is the
heat lost through the #4 Hx. At design, the secondary compressor has a peak
isentropic efficiency of 0.92 for a volume flow rate of 0.039 to 0.043 m3/s. During
142 peak cooling load production, the volume flow rate increases to as much as
0.110 m3/s with a corresponding isentropic efficiency as low as 0.64; the
secondary compressor is clearly optimized for lower flow rates. During heating
load production, a low isentropic efficiency is not a penalty to economic
performance as the additional heat added to the compressed air is recovered
later as a heat load. Low isentropic efficiencies are a penalty during cooling load
production, as any excess heat added to secondary compressor flow is removed
through the #4 Hx. If a compressor is optimized for operation close to its
maximum flow rate, it is believed that specific cooling output would increase. A
similar argument is made for the secondary expander. With a higher isentropic
efficiency, expander discharge temperatures will be lower. The secondary
expander typically operates at pressure ratios between 1.05 and 2.5 with a
corresponding variation in isentropic efficiency of about 0.76 to 0.83 (see Figure
3-19). Modern aerodynamic design has allowed radial turbines to achieve
isentropic efficiencies in excess of 0.92 [4.7]; hence there is much room for
improvement in the current design.
Electrical efficiency is not a concern when satisfying a heat load, as a reduction
in electrical output translates to a proportional increase in heat load output.
Electrical efficiency is a concern when satisfying a cooling load, as any reduction
in electrical output due to a decrease in electrical efficiency mean less power is
143 provided to the secondary compressor; hence the accumulator takes longer to
charge. While the HEN is effective in extracting energy from microturbine
expander exhaust, combustion flow from the HEN is still discharged at about 510
K and microturbine exhaust is discharged at about 350 K in Mode 2. Future
iterations of the simulation will use these flows to provide a hot water load without
an increase in fuel consumption. As the independent generation system would
require additional fuel or electricity to satisfy a hot water load, the difference
between the economic performance of the trigeneration and independent
systems would decrease.
In an effort to ensure results were not unrealistically optimistic, microturbine
parameters such as PR, maximum cycle temperature, and component isentropic
efficiencies were selected to be conservative. An upper limit for microturbine
compressor and expander efficiencies of 0.85 and 0.90 respectively could be
used, however the economic performance was not investigated. Perhaps the
largest potential gain to system electrical efficiency can be achieved by uprating
the HEN.
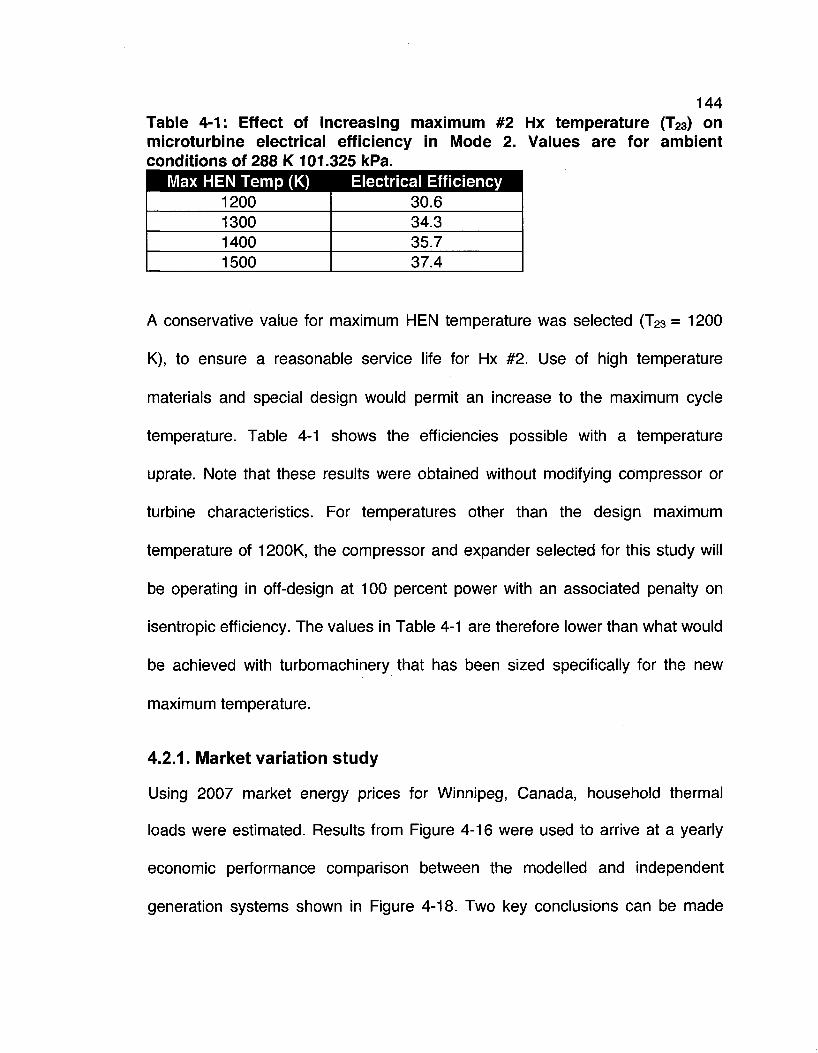
144 Table 4-1: Effect of increasing maximum #2 Hx temperature (T23) on microturbine electrical efficiency in Mode 2. Values are for ambient conditions of 288 K 101.325 kPa.
Max HEN Temp (K) Electrical Efficiency 1200 1300 1400 1500
30.6 34.3 35.7 37.4
A conservative value for maximum HEN temperature was selected (T23 = 1200
K), to ensure a reasonable service life for Hx #2. Use of high temperature
materials and special design would permit an increase to the maximum cycle
temperature. Table 4-1 shows the efficiencies possible with a temperature
uprate. Note that these results were obtained without modifying compressor or
turbine characteristics. For temperatures other than the design maximum
temperature of 1200K, the compressor and expander selected for this study will
be operating in off-design at 100 percent power with an associated penalty on
isentropic efficiency. The values in Table 4-1 are therefore lower than what would
be achieved with turbomachinery that has been sized specifically for the new
maximum temperature.
4.2.1. Market variation study
Using 2007 market energy prices for Winnipeg, Canada, household thermal
loads were estimated. Results from Figure 4-16 were used to arrive at a yearly
economic performance comparison between the modelled and independent
generation systems shown in Figure 4-18. Two key conclusions can be made
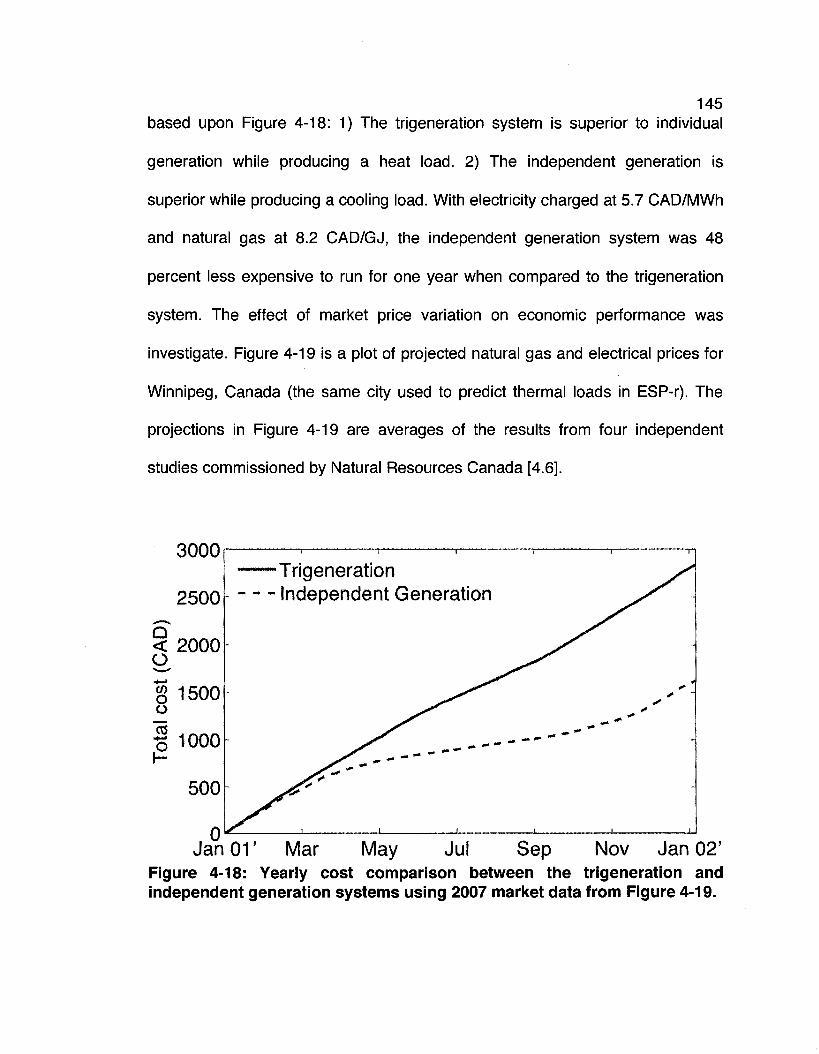
145 based upon Figure 4-18: 1) The trigeneration system is superior to individual
generation while producing a heat load. 2) The independent generation is
superior while producing a cooling load. With electricity charged at 5.7 CAD/MWh
and natural gas at 8.2 CAD/GJ, the independent generation system was 48
percent less expensive to run for one year when compared to the trigeneration
system. The effect of market price variation on economic performance was
investigate. Figure 4-19 is a plot of projected natural gas and electrical prices for
Winnipeg, Canada (the same city used to predict thermal loads in ESP-r). The
projections in Figure 4-19 are averages of the results from four independent
studies commissioned by Natural Resources Canada [4.6].
3000
2500
S < 2000 o
I 1500 o "co
"5 1000 r-
500
" • 1 1 1
Trigeneration - - - - Independent Generation
^r^ *«. ""* **" ""*
^ ^ wm *•* "*•
^ i i .J
\ • i i"
**
„ ,1. 1 I. 0 Jan 01' Mar May Jul Sep Nov Jan 02'
Figure 4-18: Yearly cost comparison between the trigeneration and independent generation systems using 2007 market data from Figure 4-19.
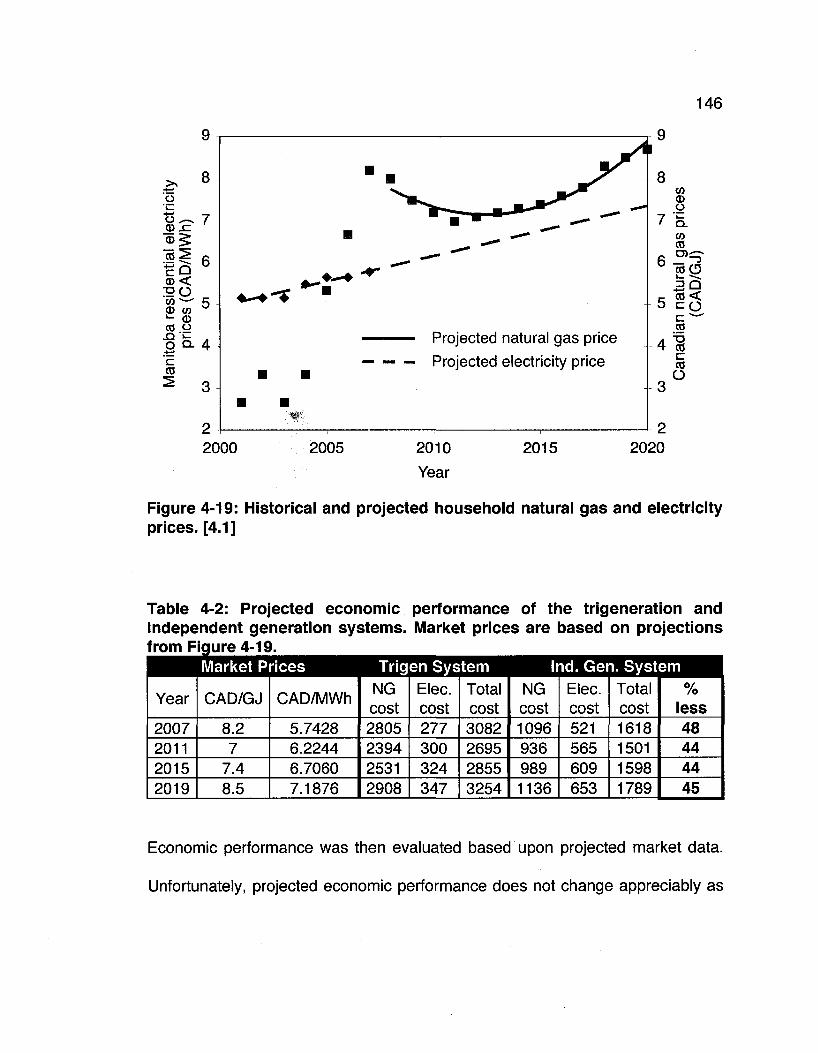
146
a
o^-v 7 _g> x:
" * ^ ft 1 | 6
CD < S O
cc o | o . 4 'c cc
.•—•
Projected natural gas price
Projected electricity price
w 2 2000
T3 CO C CO
O
2005 2010
Year
2015 2020
Figure 4-19: Historical and projected household natural gas and electricity prices. [4.1]
Table 4-2: Projected economic performance of the trigeneration and independent generation systems. Market prices are based on projections from Figure 4-19.
Market Prices Trigen System Ind. Gen. System
Year
2007 2011 2015 2019
CAD/GJ
8.2 7
7.4 8.5
CAD/MWh
5.7428 6.2244 6.7060 7.1876
NG cost 2805 2394 2531 2908
Elec. cost 277 300 324 347
Total cost 3082 2695 2855 3254
NG cost 1096 936 989 1136
Elec. cost 521 565 609 653
Total cost 1618 1501 1598 1789
% less 48 44 44 45
Economic performance was then evaluated based upon projected market data.
Unfortunately, projected economic performance does not change appreciably as
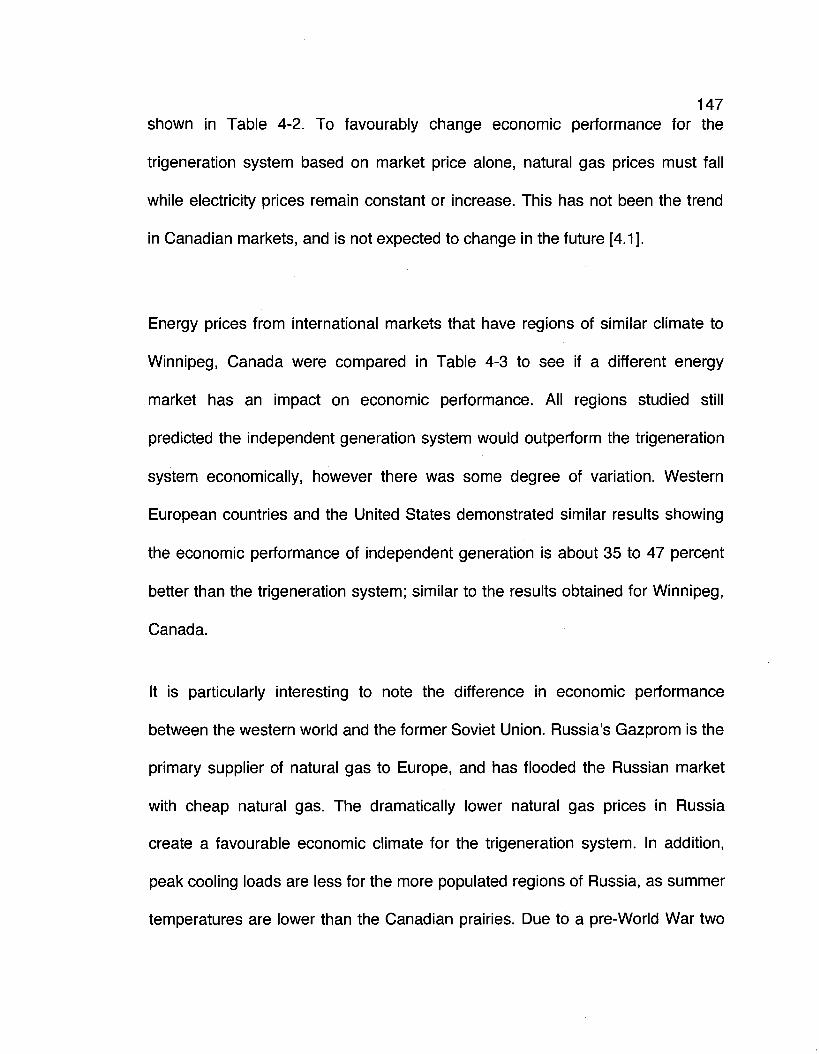
147 shown in Table 4-2. To favourably change economic performance for the
trigeneration system based on market price alone, natural gas prices must fall
while electricity prices remain constant or increase. This has not been the trend
in Canadian markets, and is not expected to change in the future [4.1].
Energy prices from international markets that have regions of similar climate to
Winnipeg, Canada were compared in Table 4-3 to see if a different energy
market has an impact on economic performance. All regions studied still
predicted the independent generation system would outperform the trigeneration
system economically, however there was some degree of variation. Western
European countries and the United States demonstrated similar results showing
the economic performance of independent generation is about 35 to 47 percent
better than the trigeneration system; similar to the results obtained for Winnipeg,
Canada.
It is particularly interesting to note the difference in economic performance
between the western world and the former Soviet Union. Russia's Gazprom is the
primary supplier of natural gas to Europe, and has flooded the Russian market
with cheap natural gas. The dramatically lower natural gas prices in Russia
create a favourable economic climate for the trigeneration system. In addition,
peak cooling loads are less for the more populated regions of Russia, as summer
temperatures are lower than the Canadian prairies. Due to a pre-World War two
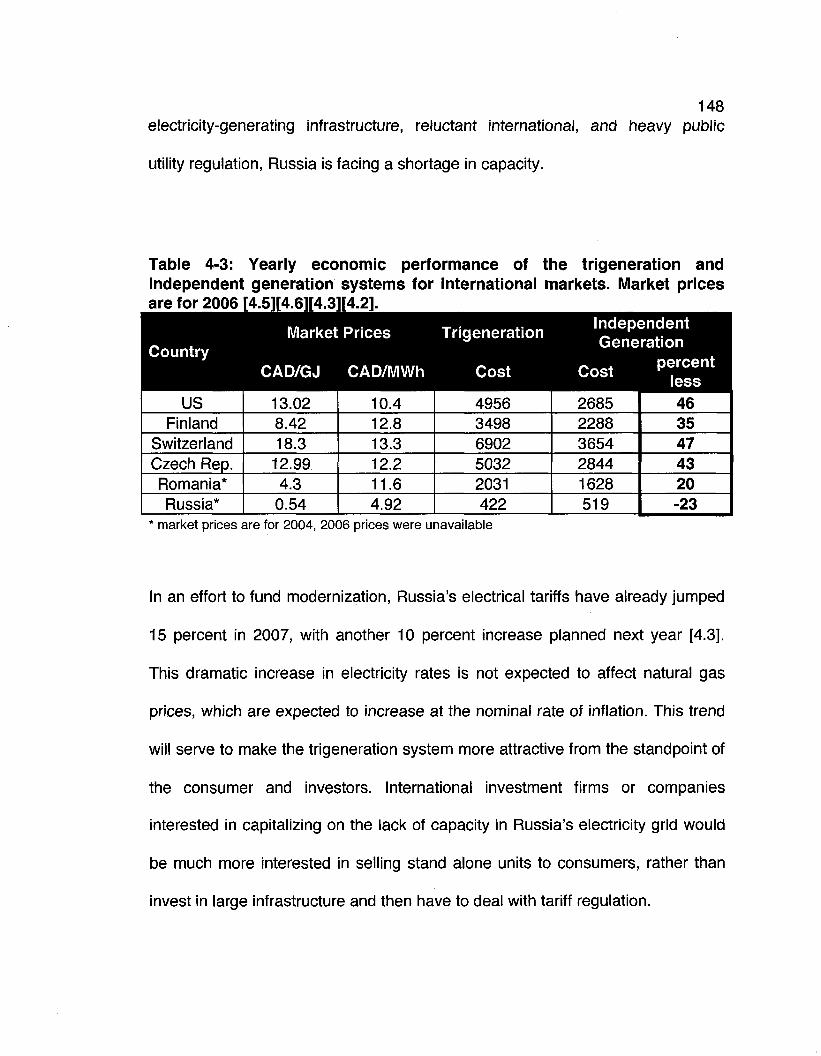
148 electricity-generating infrastructure, reluctant international, and heavy public
utility regulation, Russia is facing a shortage in capacity.
Table 4-3: Yearly economic performance of the trigeneration and independent generation systems for international markets. Market prices are for 2006 [4.5][4.6][4.3][4.2].
Country Market Prices
CAD/GJ CAD/MWh
Trigeneration
Cost
Independent Generation
Cost percent
less US
Finland Switzerland Czech Rep. Romania* Russia*
13.02 8.42 18.3
12.99 4.3
0.54
10.4 12.8 13.3 12.2 11.6 4.92
4956 3498 6902 5032 2031 422
2685 2288 3654 2844 1628 519
46 35 47 43 20 -23
market prices are for 2004, 2006 prices were unavailable
In an effort to fund modernization, Russia's electrical tariffs have already jumped
15 percent in 2007, with another 10 percent increase planned next year [4.3].
This dramatic increase in electricity rates is not expected to affect natural gas
prices, which are expected to increase at the nominal rate of inflation. This trend
will serve to make the trigeneration system more attractive from the standpoint of
the consumer and investors. International investment firms or companies
interested in capitalizing on the lack of capacity in Russia's electricity grid would
be much more interested in selling stand alone units to consumers, rather than
invest in large infrastructure and then have to deal with tariff regulation.

149 4.3. Validation
Modules contained within the in-house model and simulation were externally
verified to provide a measure of confidence in conclusions made. A description of
the methodology used, and results from the validation studies performed can be
found in Appendix E.
Chapter 5 Component Selection and Conceptual Design
5.1. Introduction
Simulating and modelling physical systems gives valuable information about
system behaviour, economic performance, and parameter sensitivity without the
need of costly prototyping processes. A simulation may produce favourable
results that lead to promising conclusions, but practical considerations prevent
prototyping. The conclusions drawn in Chapter 4 are invalid if the modelled
system has significant practical challenges. These challenges can present
themselves in high component purchase costs, high design costs for specialized
equipment, and unfavourable market conditions to name a few. The following
chapter will investigate if any such challenges are foreseen for the trigeneration
system, and suggest solutions.
5.2. Microturbine
One of the strengths of the trigeneration system under study is the fact that the
majority of the components used employ proven industry tested technologies; the
microturbine is a good example of such a component. While there are several
companies that produce commercial microturbine packages, none produce an
150
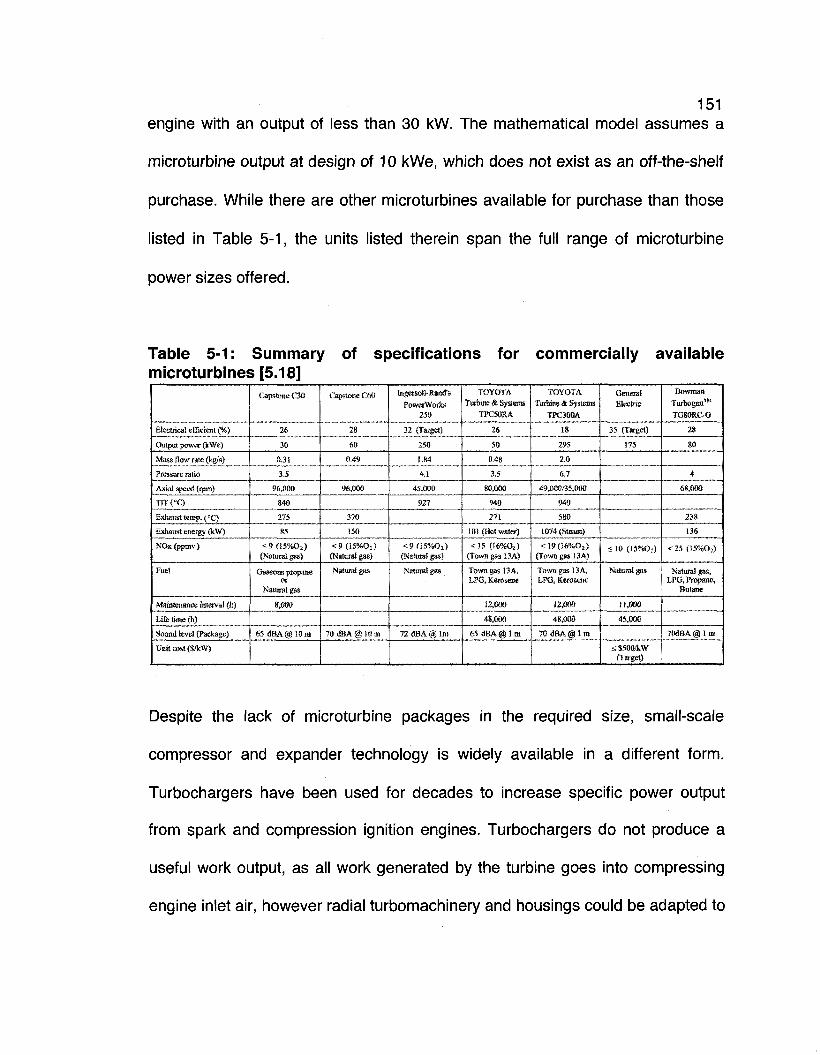
151 engine with an output of less than 30 kW. The mathematical model assumes a
microturbine output at design of 10 kWe, which does not exist as an off-the-shelf
purchase. While there are other microturbines available for purchase than those
listed in Table 5-1, the units listed therein span the full range of microturbine
power sizes offered.
Table 5-1: Summary of specifications for commercially available microturbines [5.18]
Electrical efficient {%)
Output power (kWe)
Mass flow rate (kg/s)
Pressure ratio
Axis! speed (rpm)
T i n a
Lxliaest temp. ^°C)
bxhausi energy ft W)
NOx (ppmv)
Fuel
Maintenance interval (it)
Life time (h)
Sound level (Package)
Unit cost (SAW)
Capstone C30
26
30
0.31
3.5
96,000
840
275
85
< 9 ( 1 5 % 0 2 ) (Natural gas)
Gaseous propane or
Natural gs&
8,000
65 dBA@10m
Capstone C60
28
60
0.49
96,000
370
150
< 9 ( 1 5 % 0 2 ) (Natural gas)
Natural gas
70(fBA@ 10 m
fagersoil- Rand's
FowerWotks 250
32 (Target)
250
1.84
4.1
45,000
927
< » ( ! 5 % 0 ; ) (Natural gas)
Natural gas
72 dBA @ im
TOYOTA Turbine & Systems
TPC50RA
26
50
0.48
3.5
80,000
940
271
101 (Hot water)
<15 (16%Oj) (Town gas BA)
Town gas 13 A, LPG, Kerosene
12,000
48,000
65 d B A @ l m
TOYOTA
Turbine & Systems
TPC300A
18
295
2.0
6.7
49,000/35,000
940
580
1074 (Steam)
<19(16%0 2 ) (Town gas 13A)
Town gas 13 A, LPG, Kerosene
12,000
48,000
70 dBA @ 1 m
General Electric
35 (Target)
175
< 10 (15%Oj)
Natural gas
11,000
45,000
£$500*W (Target)
Bowman
Tlu•l»geIl^,,,
TG80RC-G
28
80
4
68,000
238
136
< 25 (iS%Q2)
Natural gas, LPG, Propane,
Butane
70dBA@lnt
Despite the lack of microturbine packages in the required size, small-scale
compressor and expander technology is widely available in a different form.
Turbochargers have been used for decades to increase specific power output
from spark and compression ignition engines. Turbochargers do not produce a
useful work output, as all work generated by the turbine goes into compressing
engine inlet air, however radial turbomachinery and housings could be adapted to
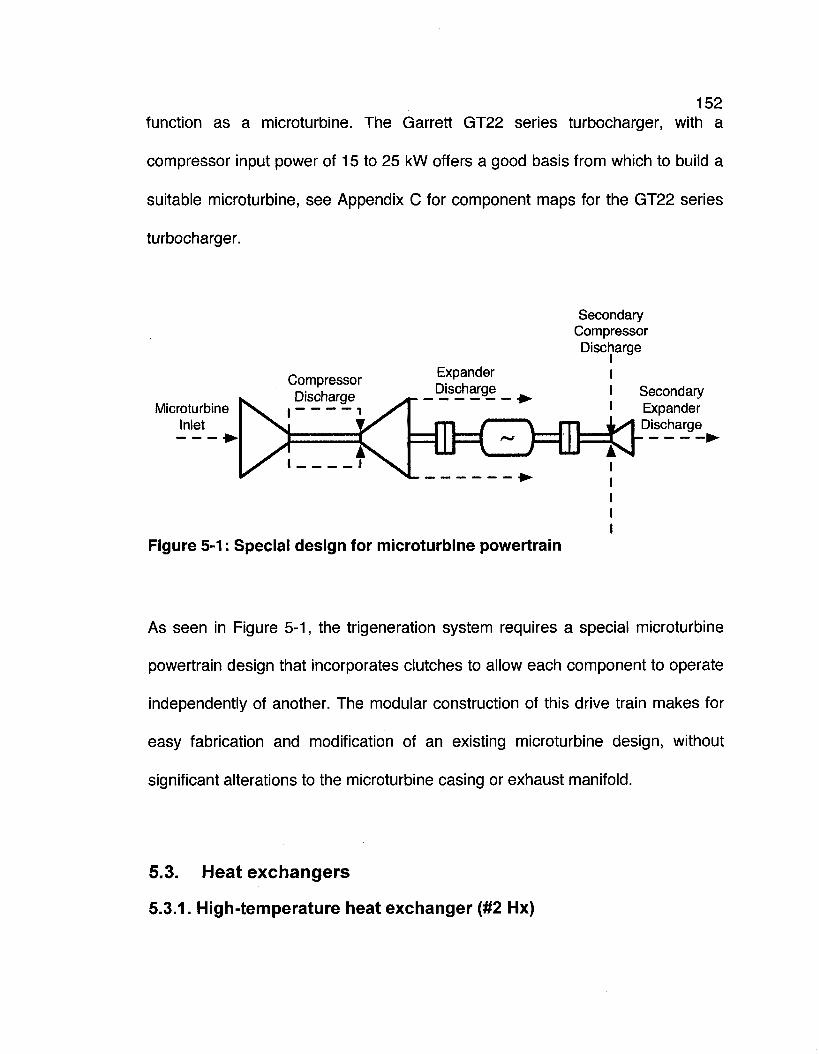
152 function as a microturbine. The Garrett GT22 series turbocharger, with a
compressor input power of 15 to 25 kW offers a good basis from which to build a
suitable microturbine, see Appendix C for component maps for the GT22 series
turbocharger.
Secondary Compressor
Microturbine Inlet
Compressor Discharge
Expander Discharge
Discharge
I I Secondary I Expander
h#<ZHlHCF"a-e-'
Figure 5-1: Special design for microturbine powertrain
As seen in Figure 5-1, the trigeneration system requires a special microturbine
powertrain design that incorporates clutches to allow each component to operate
independently of another. The modular construction of this drive train makes for
easy fabrication and modification of an existing microturbine design, without
significant alterations to the microturbine casing or exhaust manifold.
5.3. Heat exchangers
5.3.1. High-temperature heat exchanger (#2 Hx)

153 The fired heat exchanger (#2 Hx) is similar in appearance to a common
household natural gas furnace, however the operating pressure and temperature
is significantly higher. This requires alternate materials and design to ensure an
adequate service life is achieved. As the exchanger will be subject to a high rate
of thermal cycling, reducing cracking and fatigue due to thermal expansion is of
paramount importance in a successful design. Exchanger designs using plates
and thin metal membranes such as plate fin, plate, and spiral constructions
would most likely not be able to withstand burner operating temperatures (1200K)
without some degree of warp and/or cracking. Ceramic heat exchangers show
signs they may be able to be adapted for use in a fired exchanger with high
thermal cycles. Exchangers fabricated from SiC exhibit very low thermal
expansion coefficients, have good strength at elevated temperatures and have
very low heat capacities [1.44]. SiC would be ideally suited for systems that are
frequently cycled due to the very high thermal conduction coefficient (which
exceeds copper and almost doubles aluminium). This would allow the exchanger
to be brought up to temperature rapidly. Although ceramic heat exchangers have
been in use for some time, their application to compact heat exchangers is still in
the experimental phase. As they are unproven in both performance and cost,
ceramic heat exchangers will not be considered for use in the fired heat
exchanger module for this study. Directly fired heat exchangers are typically built
to order, hence the few companies that do make them do not have a standard
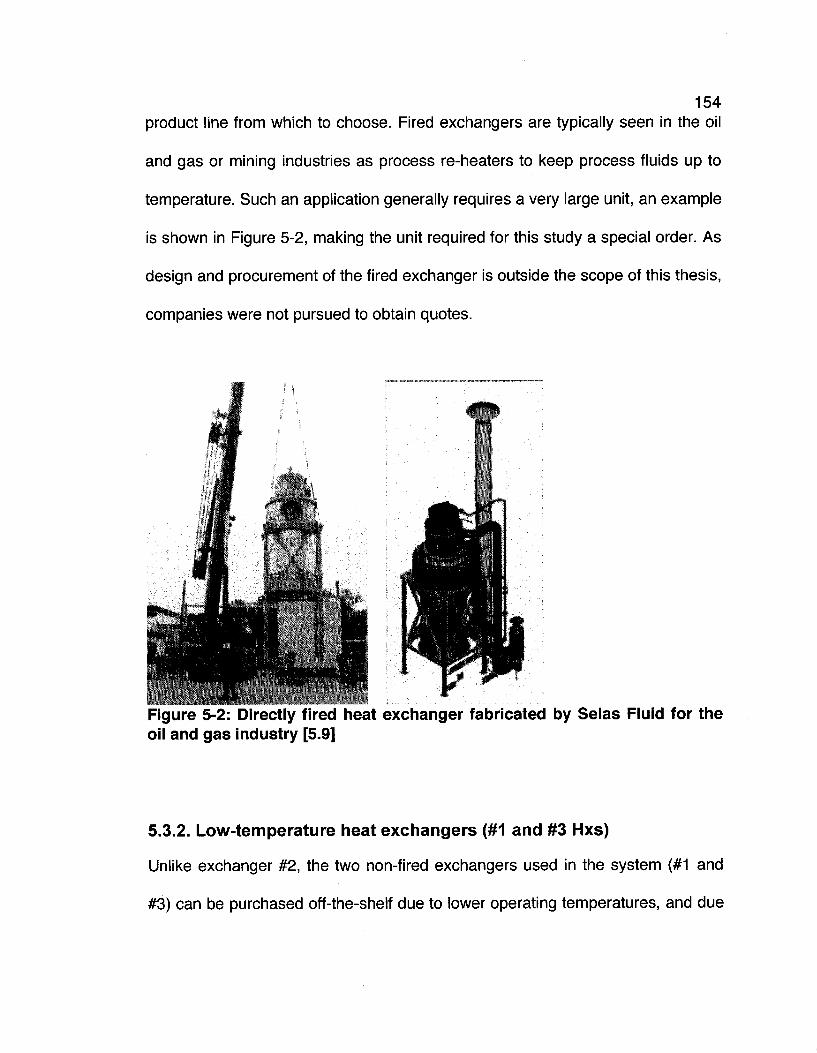
154 product line from which to choose. Fired exchangers are typically seen in the oil
and gas or mining industries as process re-heaters to keep process fluids up to
temperature. Such an application generally requires a very large unit, an example
is shown in Figure 5-2, making the unit required for this study a special order. As
design and procurement of the fired exchanger is outside the scope of this thesis,
companies were not pursued to obtain quotes.
Figure 5-2: Directly fired heat exchanger fabricated by Selas Fluid for the oil and gas industry [5.9]
5.3.2. Low-temperature heat exchangers (#1 and #3 Hxs)
Unlike exchanger #2, the two non-fired exchangers used in the system (#1 and
#3) can be purchased off-the-shelf due to lower operating temperatures, and due

155 to the fact that they operate with a common gas-to-gas exchange process. Table
5-2 lists the operating temperatures of the heat exchangers in the HEN; Figure
3-2 and Figure 3-3 show the locations of the heat exchangers within the modelled
system. Evaluation and selection of heat exchanger construction was subject to
the following design constraints for exchangers #1 and #3:
• Must be able to withstand sustained maximum operating temperatures as
listed in Table 5-2.
• Must demonstrate a service life of 10 to 15 years of normal operation.
• Must be resistant to degradation due to high thermal cycling during
operation.
• Must demonstrate an effectiveness of 85 percent or higher, 90 percent is
preferred.
• Unit cost must be realistic for purchase by a household consumer.
This evaluation process identified the following heat exchanger classifications as
potential candidates for use as non-fired exchangers in the subject system:
brazed plate, shell and tube, plate fin, and regenerators.
Table 5-2: Heat exchanger operating temperatures for an OAT of 288 K
Air Side (K)
Comb. Side (K)
Hx#1 In
452
868
Out 830
513
Hx#2 In
830
1200
Out 1164
868
Hx#3 In
513 897
Out 839
491
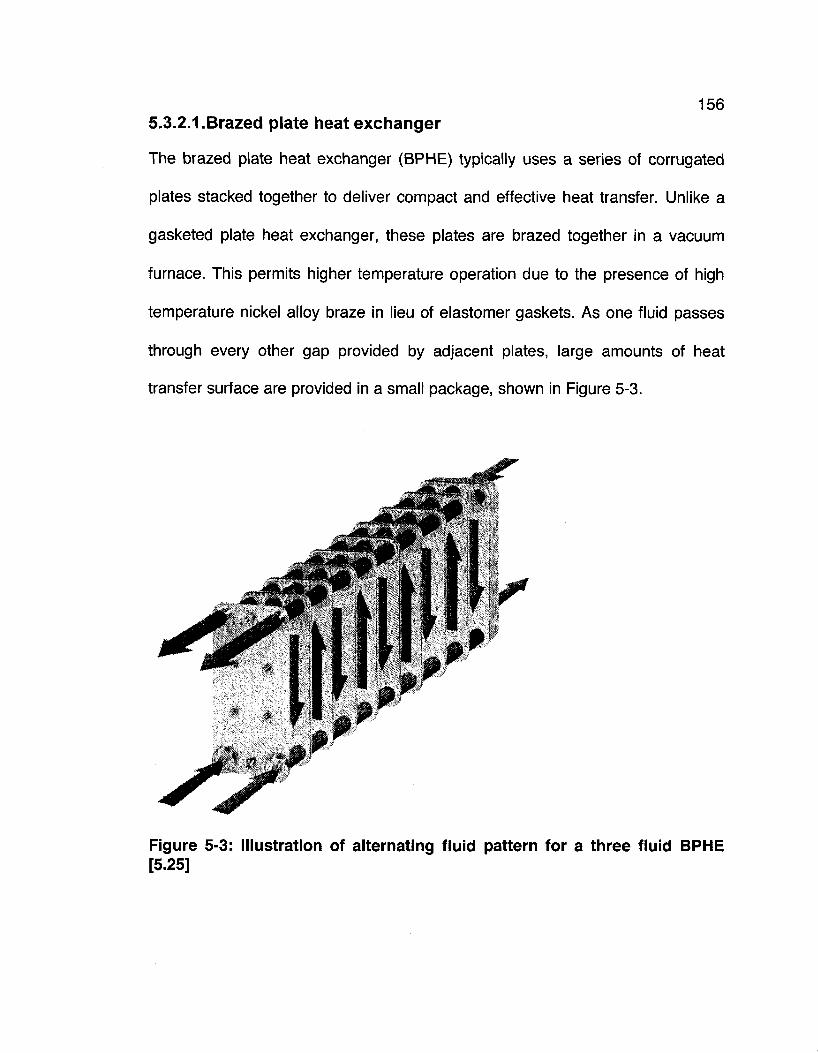
156 5.3.2.1.Brazed plate heat exchanger
The brazed plate heat exchanger (BPHE) typically uses a series of corrugated
plates stacked together to deliver compact and effective heat transfer. Unlike a
gasketed plate heat exchanger, these plates are brazed together in a vacuum
furnace. This permits higher temperature operation due to the presence of high
temperature nickel alloy braze in lieu of elastomer gaskets. As one fluid passes
through every other gap provided by adjacent plates, large amounts of heat
transfer surface are provided in a small package, shown in Figure 5-3.
Figure 5-3: Illustration of alternating fluid pattern for a three fluid BPHE [5.25]
157 BPHEs offer very high heat transfer performance due to low velocities and high
turbulence induced by rapidly changing flow directions; high turbulence also
contributes to reducing fouling, effectively increasing service life [5.22]. When
combined with a large heat transfer surface area, plate exchangers can achieve
fluid exit temperature differentials of 0.5 to 1 K [5.13]. Due to the simple modular
construction of the BPHE, capital costs are very low compared to equivalent shell
and tube exchangers. Although brazing plates together raises the allowable
operating temperature, the thin plate construction is susceptible to warping due to
thermal cycling at temperatures well below the softening points of the braze and
plate materials. As the plates are constrained at the outside perimeter with braze
material, any warp will break the brazed joint and vent fluid to atmosphere.
Brazing the plates together also limits de-fouling maintenance to chemical
cleaning only, which is not always effective. Despite the very attractive low cost
and high effectiveness demonstrated by BPHE units, they are not suitable for use
in the subject system due to operating temperatures that would severely limit
service life.
5.3.2.2.Shell and tube heat exchanger
The shell and tube heat exchanger (STHE) is the most common variety of heat
exchanger, accounting for 80 percent of all industrially installed exchangers in the
European market [5.22]. This can be partially attributed to the versatility of the
158 design and due to a high degree of standardization. Such standardization allows
fabrication of the STHE without requiring a costly design process. The standard
most commonly used around the world is the Tubular Exchanger Manufacturers
Association (TEMA); this standard is meant to augment the ASME boiler and
pressure codes [5.22]. A STHE can be built by choosing from the various
standardized components available under the specification, a summary of the
specification is shown in Figure 5-4. STHE units are typically larger and heavier
than plate fin or BPHE units, but benefit from a more robust design. For
processes that require high pressure (greater than 30 bar) or high temperature
(greater than 800°C), non-tubular exchangers are generally not suitable. For
mobile applications such as powerplant recuperation, the prohibitively large size
and weight of the STHE force designers to consider lighter and smaller
alternatives. The STHE consists of a shell which determines the flow pattern
within the exchanger. Different shell constructions can be used to achieve
different overall heat transfer coefficients. Depending on internal baffle
construction and where inlet and output ports are placed flow can be made to
travel in a cross, counter, parallel, or split-flow manner.
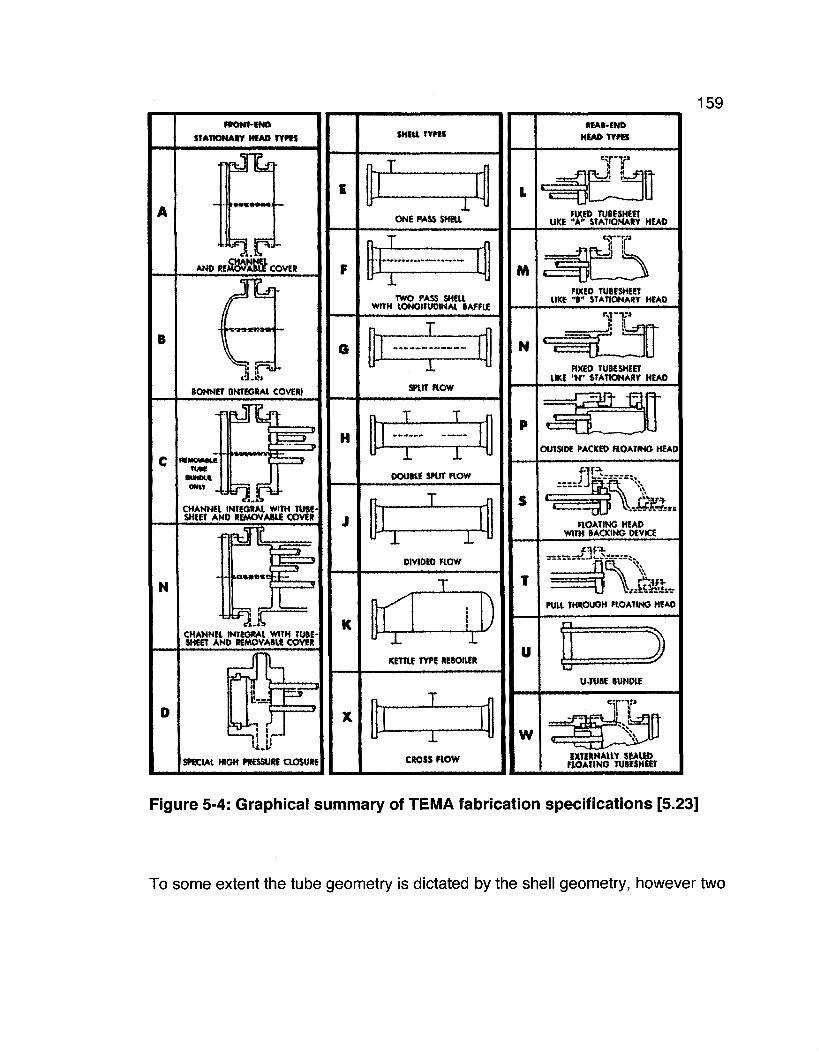
HtOMt-MO
STATKJNAtY HEAD TYPES
flJlff
AW
Aferpd-M&80KS COVM
BONNET {INTEGRA! COVBtt
"fpJTIjT"
•UMMI
CHANNEL (NTEGtAt WITH TU6t SHEET AND REMOVABLE COVER
N
CHANNEL INTEGRAL WITH TUBE SHEET AND REMQVABMS COVER
" i r
H
SPECIAL HIGH PRESSURE CLOSURE I
SMItl TYPES
O N I PASS SHELL
T TWO P A S SHRl
WITH LONGITUDINAL BAFftC
X
SPLIT now
Down SPUT now
01VI0B) WOW
X KETTLE TYPE REIOIW
— r —
CROSS « O W
159
M
N
•EAR-ENB
HEAD TYPES
*::,,,;,;:":ii
eg—til
==£10^ U3 LT FIXED TUBESHEET
LIKE "A" STATIONARY HEAD
ffcj L =f>££=8 ^ m
HXEO TUBESHEET LIKE "B" STATIONARY HEAD
FIXED TUBESHEET UKt t r STATIONARY HIAO
=p3& -a
OUTSIDE PACK© FtOATING HEAD
z " : » J
gj vuaa.. FIOATING HEAD
WITH BACKING DEVICE
u
w
xtan.
fleL " \
TOU THROUGH FLOATING HIAO
U-TIWE BUNDLE
EXTERNALLY SEALED flOATING TUBESHEET
Figure 5-4: Graphical summary of TEMA fabrication specifications [5.23]
To some extent the tube geometry is dictated by the shell geometry, however two
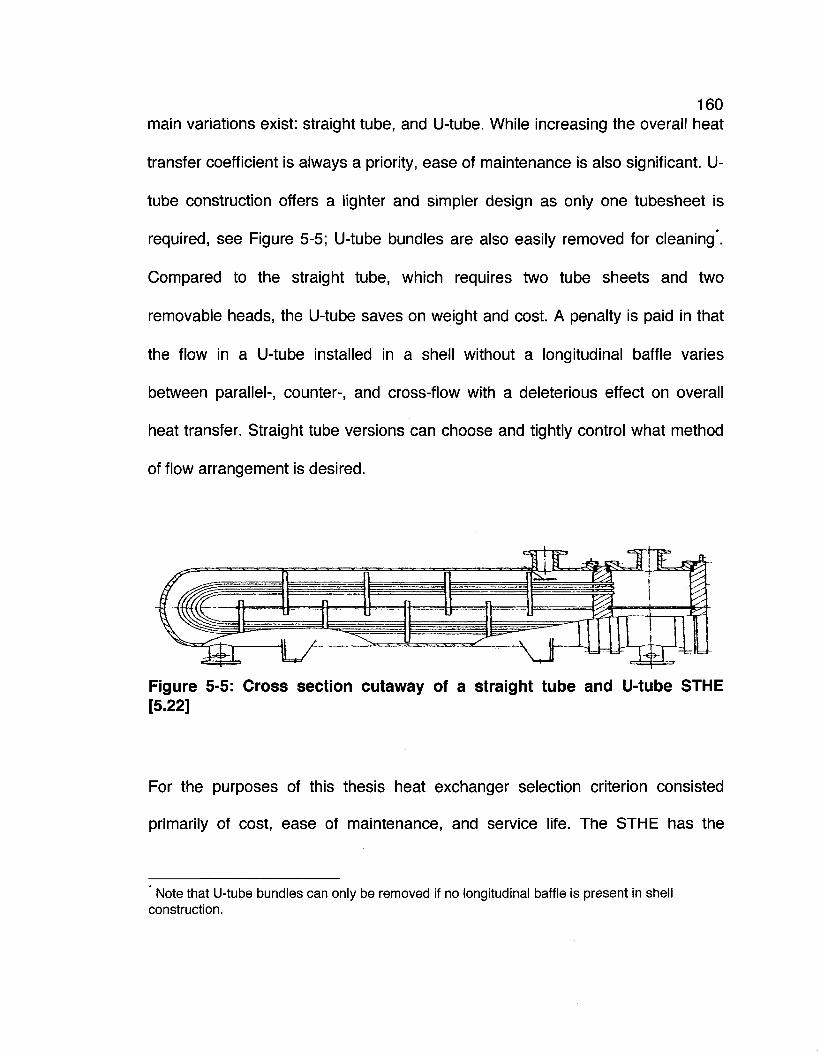
160 main variations exist: straight tube, and U-tube. While increasing the overall heat
transfer coefficient is always a priority, ease of maintenance is also significant. U-
tube construction offers a lighter and simpler design as only one tubesheet is
required, see Figure 5-5; U-tube bundles are also easily removed for cleaning*.
Compared to the straight tube, which requires two tube sheets and two
removable heads, the U-tube saves on weight and cost. A penalty is paid in that
the flow in a U-tube installed in a shell without a longitudinal baffle varies
between parallel-, counter-, and cross-flow with a deleterious effect on overall
heat transfer. Straight tube versions can choose and tightly control what method
of flow arrangement is desired.
Figure 5-5: Cross section cutaway of a straight tube and U-tube STHE [5.22]
For the purposes of this thesis heat exchanger selection criterion consisted
primarily of cost, ease of maintenance, and service life. The STHE has the
* Note that U-tube bundles can only be removed if no longitudinal baffle is present in shell construction.

161 potential to meet or exceed the maximum operating temperatures and pressures
found in the modelled system, and has decades of successful industry use.
Quotes from suppliers for dual pass cross-flow STHE units sized for the
trigeneration system under study were obtained at an average specific cost of
60.5 CAD per kW of heat transfer [5.11]. This cost was quoted for two units, it is
anticipated this price would be significantly lower for bulk orders. As the price for
a suitable STHE unit is sufficiently low for small-scale applications, and the
operating characteristics permit high temperature and pressure operation the
STHE is ideal for use as a low temperature heat exchanger in the subject
system.
5.3.2.3.Plate fin heat exchanger
The plate fin heat exchanger (PFHE) consists of a stack of alternating plates and
folded fin spacers as shown in Figure 5-6. Flow is directed into the spaces
between the plates provided by the fins in an alternating manner. This flow can
be cross- or counter-flow. PFHE have very high area densities (heat transfer
surface area per volume), which makes them ideal for compact applications
[1.46][2.36][5.13]. Due to the thin wall construction of the PFHE, a differential
pressure of less than 1000 kPa must be maintained; however high service
temperatures upwards of 800°C can be achieved [5.13]. Because construction
involves numerous brazing operations, cost can be high. Due to extensive use of
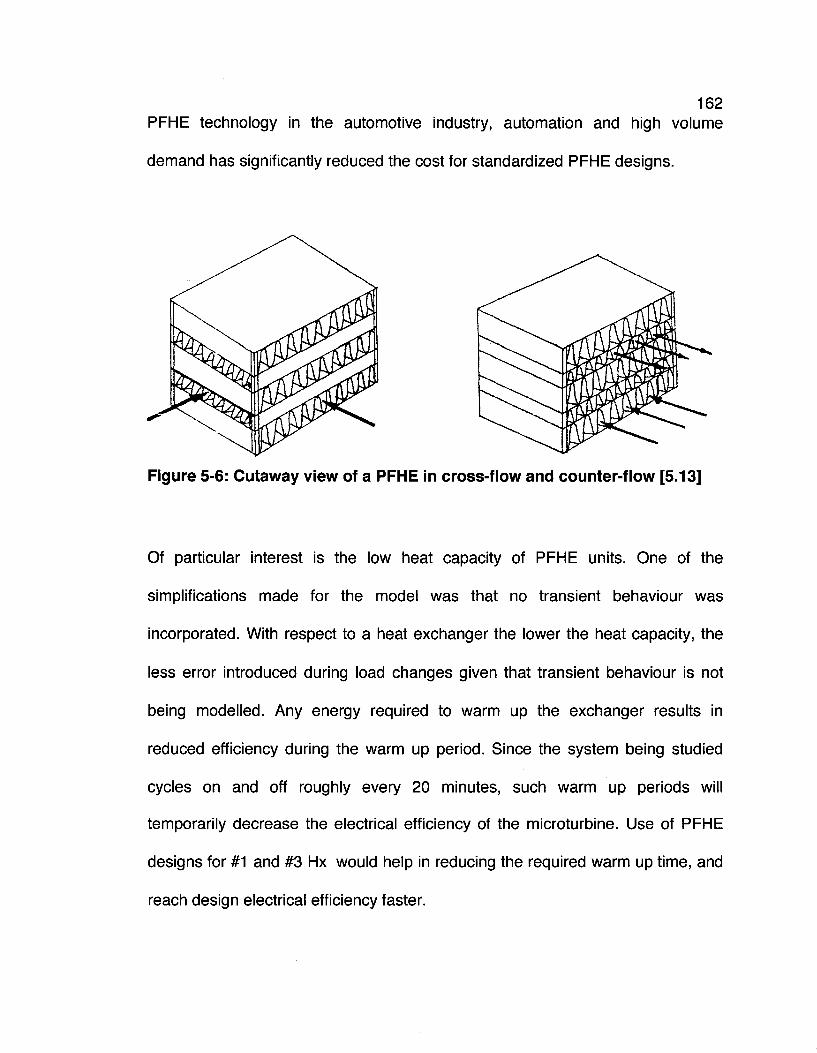
162 PFHE technology in the automotive industry, automation and high volume
demand has significantly reduced the cost for standardized PFHE designs.
Figure 5-6: Cutaway view of a PFHE in cross-flow and counter-flow [5.13]
Of particular interest is the low heat capacity of PFHE units. One of the
simplifications made for the model was that no transient behaviour was
incorporated. With respect to a heat exchanger the lower the heat capacity, the
less error introduced during load changes given that transient behaviour is not
being modelled. Any energy required to warm up the exchanger results in
reduced efficiency during the warm up period. Since the system being studied
cycles on and off roughly every 20 minutes, such warm up periods will
temporarily decrease the electrical efficiency of the microturbine. Use of PFHE
designs for #1 and #3 Hx would help in reducing the required warm up time, and
reach design electrical efficiency faster.
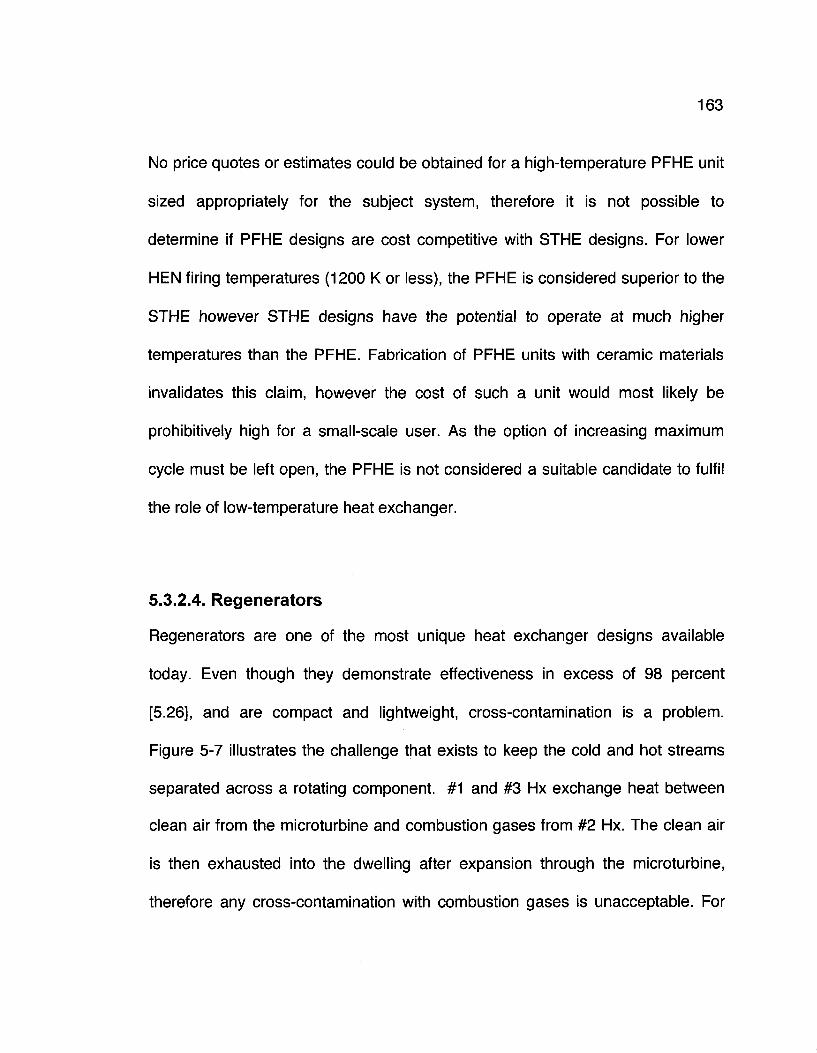
163
No price quotes or estimates could be obtained for a high-temperature PFHE unit
sized appropriately for the subject system, therefore it is not possible to
determine if PFHE designs are cost competitive with STHE designs. For lower
HEN firing temperatures (1200 K or less), the PFHE is considered superior to the
STHE however STHE designs have the potential to operate at much higher
temperatures than the PFHE. Fabrication of PFHE units with ceramic materials
invalidates this claim, however the cost of such a unit would most likely be
prohibitively high for a small-scale user. As the option of increasing maximum
cycle must be left open, the PFHE is not considered a suitable candidate to fulfil
the role of low-temperature heat exchanger.
5.3.2.4. Regenerators
Regenerators are one of the most unique heat exchanger designs available
today. Even though they demonstrate effectiveness in excess of 98 percent
[5.26], and are compact and lightweight, cross-contamination is a problem.
Figure 5-7 illustrates the challenge that exists to keep the cold and hot streams
separated across a rotating component. #1 and #3 Hx exchange heat between
clean air from the microturbine and combustion gases from #2 Hx. The clean air
is then exhausted into the dwelling after expansion through the microturbine,
therefore any cross-contamination with combustion gases is unacceptable. For
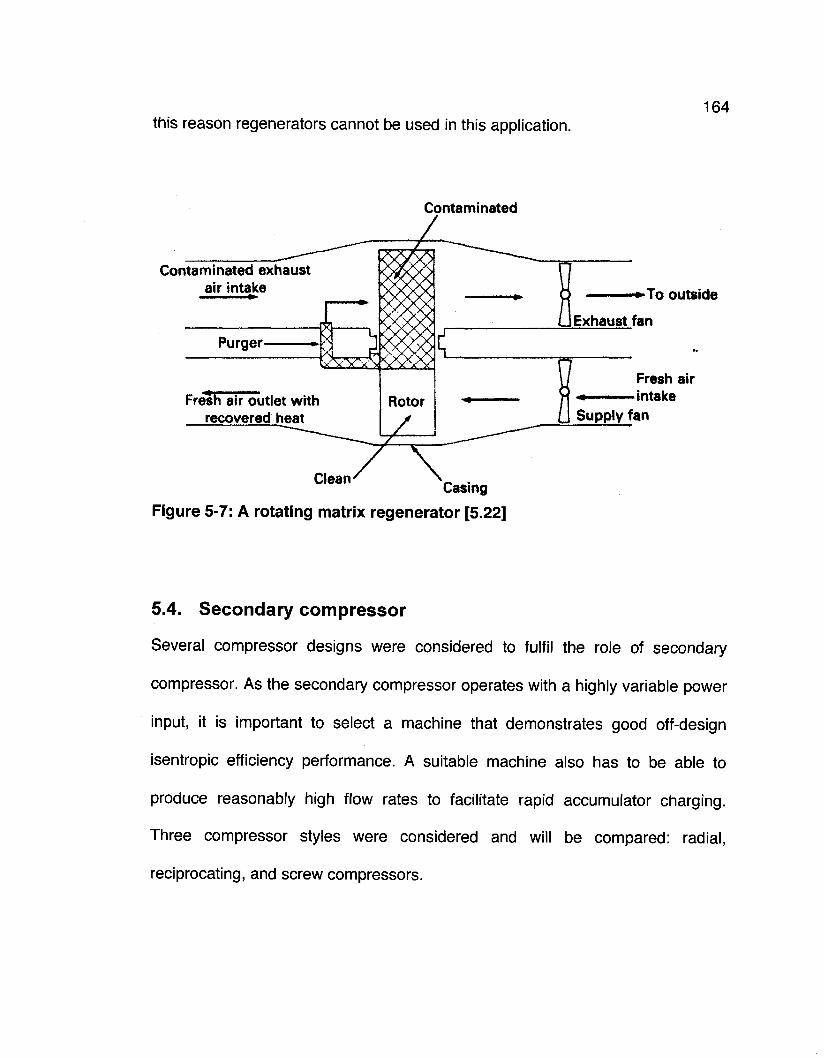
this reason regenerators cannot be used in this application. 164
Contaminated
Contaminated exhaust air intake
Purger
Fresh air outlet with recovered heat
Clean _ . Casing
Figure 5-7: A rotating matrix regenerator [5.22]
•-To outside
Fresh air intake
5.4. Secondary compressor
Several compressor designs were considered to fulfil the role of secondary
compressor. As the secondary compressor operates with a highly variable power
input, it is important to select a machine that demonstrates good off-design
isentropic efficiency performance. A suitable machine also has to be able to
produce reasonably high flow rates to facilitate rapid accumulator charging.
Three compressor styles were considered and will be compared: radial,
reciprocating, and screw compressors.

165 5.4.1. Radial compressors
Most small gas turbines and almost all microturbines make use of radial
compressors, an example of a radial compressor wheel from a turbocharger is
shown in Figure 5-8. Radial machines offer high flow rates in a compact and
cost-effective design, making them ideal for aerospace applications. Designed for
applications with small to medium flow rates that require high RPM operation,
radial machines are capable of continuous operation above 250,000 RPM is due
to robust design.
Figure 5-8: Radial compressor (foreground) and axial turbine from a turbocharger [5.19].
166 Radial machines have traditionally demonstrated design point isentropic
efficiencies of 0.75 to 0.80 at a PR of up to 4, however high-performance
machines can operate at a PR up to 8 [5.19] with efficiencies in excess of 0.90
[5.20]. Unfortunately to enjoy the benefit of high compression with high efficiency
a premium must be paid to achieve efficiencies in excess of 0.85. Radial
machinery is therefore not considered an economical candidate for the
secondary compressor.
5.4.2. Reciprocating compressors
Gas-compression applications for reciprocating compressors range from
provision of shop air for air tools to providing natural gas pipeline compression.
The pros and cons of reciprocating technology have been discussed in Sections
1.4.1 and 1.4.3. With respect to a small-scale application, some concerns with
regard to the use of reciprocating equipment include: high operational noise, high
maintenance cost, inclusion of expensive auxiliary systems. A suitable secondary
compressor must not reduce the life cycle of the system as a whole; hence
maintenance intervals and service life of the secondary compressor must be
equal to or greater than that of the microturbine. Reciprocating compressor
technology cannot meet this requirement, therefore is not considered a suitable
candidate for the secondary compressor.
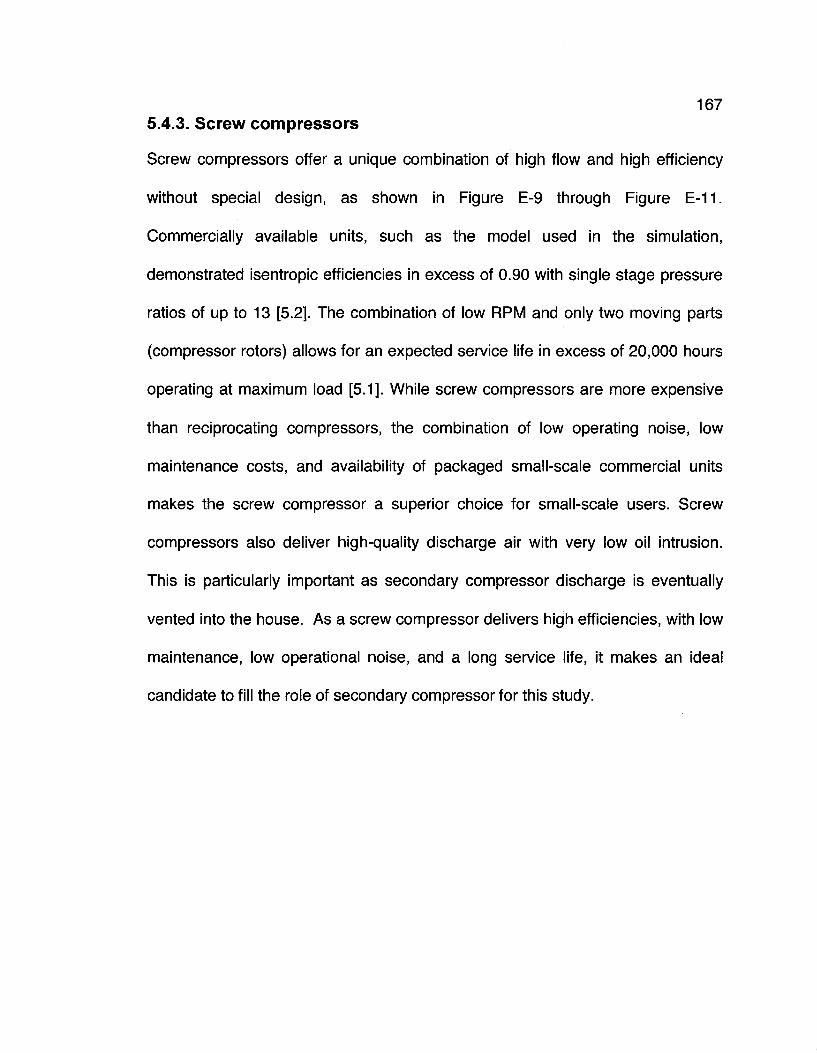
167 5.4.3. Screw compressors
Screw compressors offer a unique combination of high flow and high efficiency
without special design, as shown in Figure E-9 through Figure E-11.
Commercially available units, such as the model used in the simulation,
demonstrated isentropic efficiencies in excess of 0.90 with single stage pressure
ratios of up to 13 [5.2]. The combination of low RPM and only two moving parts
(compressor rotors) allows for an expected service life in excess of 20,000 hours
operating at maximum load [5.1]. While screw compressors are more expensive
than reciprocating compressors, the combination of low operating noise, low
maintenance costs, and availability of packaged small-scale commercial units
makes the screw compressor a superior choice for small-scale users. Screw
compressors also deliver high-quality discharge air with very low oil intrusion.
This is particularly important as secondary compressor discharge is eventually
vented into the house. As a screw compressor delivers high efficiencies, with low
maintenance, low operational noise, and a long service life, it makes an ideal
candidate to fill the role of secondary compressor for this study.
168
Figure 5-9: Cutaway view of a screw compressor used in a high-performance supercharger [5.6].
169
Chapter 6 Conclusion
6.1. Summary
Severe weather, greenhouse gases, and energy tariff fluctuations have typically
not been primary concerns of individual consumers when making decisions
regarding energy needs in the 20th century; this will not be the case in the 21st
century. With the dawn of rolling blackouts due to insufficient power grid capacity,
communities becoming isolated due to inclement weather, and rising energy
prices new solutions for small-scale users are becoming increasingly important to
meet future energy needs. Several ingenious small-scale solutions that reduce
energy consumption and decrease dependence on grid power have been in use
for many years. Heat pumps, geothermal heating and cooling, and thermal
storage systems have proven to be effective at providing thermal control for
residential and small commercial customers alike. These solutions are still at the
mercy of disruptions in grid power service. Each system has problems that
prevent widespread acceptance; for example, heat pumps do not work well in
extreme cold and geothermal heating cannot be installed in northern
communities where disruption of the permafrost layer results in geological
instability. No system currently exists in practice that can provide the option of
complete energy islanding for the small-scale user. To meet these challenges,
this study was initiated to design and model a trigeneration system capable of on-

170
site production of heating cooling and power.
Large trigeneration systems have been successfully implemented for industrial
purposes; they work well and are thoroughly documented. These systems have
not filtered down to small-scale users in part due to the use of chilling equipment
with very high specific capital cost. A successful small-scale trigeneration system
must compete with the most efficient form of individually providing heating
cooling and electric power via a natural gas furnace, vapour compression air
conditioner, and grid power. A successful small-scale trigeneration system will
demonstrate the following qualities: a long service life with minimal maintenance
requirements, autonomous operation, low capital costs to compete with individual
generation systems, and operating costs competitive with individual generation.
A new trigeneration system was proposed to satisfy these requirements for a
small-scale application. An indirectly fired microturbine was combined with
energy storage in the form of a hydraulic accumulator. The accumulator was
used in an inverse Brayton cycle in combination with a microturbine to provide for
all heating cooling and peak power needs for a typical detached single-family
dwelling. To ensure capital costs stay as low as possible, state-of-the-art
turbomachinery and heat exchangers were not used in modelling and
simulations. This produced conservative results that provide for additional
studies. Performance data for the proposed system was mathematically modelled
using MATLAB™. This model was then incorporated into a time-based

171
SIMULINK™ simulation, using modelled energy load profiles for a typical
household located in central Canada. The simulation provided control to ensure a
comfortable household temperature was maintained, and electrical demands
were satisfied. The simulation was used to measure economic performance and
to identify areas of future improvement in the system. Microturbine design and
off-design performance data was validated against performance data from
GASTURB™, commercially available microturbines, and simulated systems
discussed in open literature, and were found to be in good agreement. The
accumulator model was verified against experimental data for both charging and
discharging. As pressure and temperature of the experimental and modelled
accumulators were in agreement once fully charged or discharged, the model
maintained conservation of mass.
After experimenting with various system modifications in an effort to improve
economic performance, a final configuration was arrived at which operates in two
modes; one for heating and one for cooling load production. This configuration
uses a secondary compressor and expander in addition to the indirectly fired
microturbine and accumulator. An additional heat exchanger (#4 Hx) was used in
addition to the heat exchangers installed as part of the indirectly fired
microturbine assembly. The #4 Hx is buried in-ground to take advantage of the
year round pseudo-infinite heat capacity offered by deep ground installation.
172
6.2. Summary of results
The effect of varying accumulator size on system performance was investigated.
It was determined that accumulator size has negligible impact on economic
performance. Size variation did have an effect on cycle frequency, with smaller
sizes decreasing the period between successive microturbine starts. Accumulator
size was therefore determined to only have an impact on system life and
durability. Larger sizes were found to reduce system cycling; this is expected to
increase component life and reduce maintenance costs. Selection of an
appropriate size should also be based upon practical considerations such as
ease of installation, cost, and microturbine cycling limitations.
Different HEN modes were used for heating and cooling load production. Mode 1
was designed to ensure a high microturbine exhaust temperature of 860 to 880 K
(depending on ambient temperature) was delivered for household heating
purposes. A thermal efficiency of 15.7 percent and total efficiency of 95 percent
was achieved at ISO standard atmospheric conditions for Mode 1. Mode 2 was
designed to maximize the thermal efficiency of the microturbine while producing a
cooling load. Since high-temperature exhaust was not required, a thermal
efficiency of 29.3 percent was achieved at ISO standard atmospheric conditions.
Microturbine size had a negligible effect on economic performance. Microturbine
size determined how fast household temperature was recharged during heating
mode, and how fast the accumulator was recharged during cooling mode. In
combination with accumulator size, microturbine size determined the period
173
between successive starts. To achieve energy islanding during heating mode, a
minimum engine size was required to satisfy peak household electrical demand.
An oversized engine should be avoided as well to avoid excessive household
heating mass flows and increased capital costs. Factors influencing microturbine
selection therefore include capital cost, household electrical load, and household
thermal load. A microturbine with 10 kWe output at standard conditions was
selected.
Two different methods to charge the accumulator were investigated. The first
method attempted to use the microturbine to simultaneously provide electrical
load and charge the accumulator. By extracting varying levels of compressor
bleed flow, the microturbine could be operated in an electrical load following
manner. The second method used a separate compressor to charge the
accumulator. Electrical input was fed to the secondary compressor from a
microturbine that operated at full power. Using bleed flow consumed 4 percent
more fuel when compared to use of a secondary compressor when operating in
Mode 1. If bleed flow is used in Mode 2, the system could not provide a cooling
load greater than 0.75 kWt, while a cooling load of up to 2 kWt was provided with
a secondary compressor without supplemental electrical power. The addition of a
secondary compressor also provided the option of using grid power to increase
the cooling capacity of the system. A secondary compressor was incorporated
into the final configuration to benefit from the reduced fuel costs, and to provide
174
sufficient cooling load during peak summer months.
The effect of using an in-ground heat exchanger (#4 Hx) to increase the thermal
output of the accumulator was studied. Cooling secondary compressor flow in an
in-ground heat exchanger before discharge to the accumulator reduced system
operation costs by up to 72 percent for high cooling load conditions. This
reduction in cost can be attributed to a significant increase in specific cooling
capacity of expander discharge flow with cooler accumulator temperatures. Pre
heating secondary compressor inlet flow in the in-ground heat exchanger had a
negligible effect on system operational costs; therefore the in-ground heat
exchanger was used for Mode 2 only.
To increase specific work output from the expander when operating as part of the
inverse Brayton cycle in Mode 1, accumulator discharge was cycled through the
heat exchanger network to raise expander inlet temperature to design point
levels. Fuel costs were reduced by 9 percent when firing the HEN at a constant
design temperature of 1200 K.
It was found that if the microturbine expander was used as part of the inverse
Brayton cycle in Mode 1, thermal output often exceeded household demand. If
household temperature was not allowed to cool down during inverse Brayton
cycle operation, microturbine exhaust had to be dumped overboard to prevent
175
household temperature from exceeding setpoint limits; which reduced system
economic performance. A second expander 1/6th the size of the microturbine
expander was added to modify the thermal output of the inverse Brayton cycle.
This ensured household thermal demand was not exceeded. The smaller second
expander permitted the HEN to be operated at maximum temperature during IBC
operation for maximum economic performance, without exceeding the household
thermal load.
The independent generation system was found to be 48 percent cheaper to
operate based on one year of operation in Winnipeg, Canada when compared to
the trigeneration system. Economic performance was compared for regions
around the world with similar climates to central Canada. As the ratio of electricity
tariffs to natural gas prices were relatively constant throughout the regions
investigated, economic performance demonstrate minor variation; independent
generation was found to be between 35 and 47 percent cheaper to operate when
compared to the trigeneration system. This was not the case for countries in the
former Soviet Union, where the combination of extremely low natural gas prices
and relatively high electricity prices result in the trigeneration system being 20
percent cheaper to operate when compared to the independent system, based
on one year of operation.

176
6.3. Conclusions
The preliminary design and simulation of a small-scale trigeneration system was
successfully completed with promising results and provided direction for future
studies. Preliminary designs indicate that the system can be built using a
combination of modifying existing technology, and off-the-shelf components such
as shell and tube heat exchangers. Despite the lower than expected economic
performance of the system in Mode 2, there is much room for optimization and
improvement. The results obtained represent a conservative prediction of
performance, and can be improved upon with future system designs. Economic
performance while providing a heating load was predicted to be marginally higher
than an independent generation system.
It was a goal of this project to create a system that offered total energy islanding
to small-scale consumers. The results show that if peak summer thermal loads
are to be satisfied, connection to a grid is required. The trigeneration system is
capable of supplying continuous cooling loads of about 2 kWt or less. For the
climate in the geographical region used for load prediction (central Canada),
cooling loads exceeded 2 kWt only 5 percent of the year. This means total
energy islanding was achieved for 95 percent of the year. Energy islanding for
the full year is possible if any of the following criteria are satisfied: 1) the region
has mild cooling demands, 2) the household setpoint temperature is raised
during summer months, 3) improvements to the trigeneration system increases
cooling capacity.
177
Perhaps what is most promising about the trigeneration system is that there is no
other product being simulated, tested, or made available for purchase that can
satisfy the same load demands. Trigeneration has not yet been brought to the
small-scale consumer in an economical manner that permits energy islanding,
leaving no current solution for a growing niche market. Energy islanding is an
attractive option for mobile and remote users, and provides a solution for those
dissatisfied with frequent power outages. It is difficult to place an economic value
on the intrinsic benefit of energy islanding, as this value will change from user to
user. For some users, operating a household free from grid power may justify the
increased fuel costs associated with the subject trigeneration system. Despite
demonstrating inferior economic performance when compared to the
independent generation system, the subject trigeneration system still has much
to offer.
6.4. Future work
A sensitivity study should be performed to investigate the effect component
isentropic efficiencies have on economic performance. Such a study has the
most impact on cooling load production, which requires as much energy to be
extracted from microturbine flow as possible to increase electrical efficiency.
Increasing HEN maximum temperature was found to increase microturbine
electrical efficiency, however as no suitable high-temperature heat exchanger
with integrated burner exists in the size required, a realistic maximum
178
temperature is unknown. Research and testing are required to be able to
estimate maximum HEN temperatures with accuracy.
Further work is required to increase the accuracy of the accumulator model. As
estimates of heat transfer coefficients are highly empirical, the heat transfer
coefficients used in the simulation are not calibrated for the application.
Removing isothermal and isobaric assumptions will also improve accumulator
behaviour prediction.
There is potential for improvement to system economic and thermodynamic
performance with the incorporation of water injection. This system could also be
used to maintain household humidity levels year round. Simulation is required to
investigate if such a system would justify the increased capital cost.
The simulated trigeneration system must be prototyped to confirm simulation
predictions with confidence. The simulation could then be modified and used to
predict system performance due to subsequent modifications with a higher
degree of confidence.

References
CHAPTER 1
[1.1] Bassols, J. Kuckelkorn, B., Langreck, J., Schneider, R., Veelken, H., "Trigeneration in the food industry," Applied Thermal Engineering 22: 595-602, 2002.
[1.2] Campanari, S., Boncompagni, L, Macchi, E., "Microturbines and Trigeneration: Optimization Strategies and Multiple Engine Configuration Effects", ASME Turbo Expo proceedings: GT2002-30417, Amsterdam, Netherlands, 2002.
[1.3] Canadian Centre for Occupational Health and Safety, "Noise -Occupational Exposure Limits in Canada", accessed June 11, 2007. www.ccohs.ca/oshanswers/phys_agents/exposure_can .
[1.4] Cardona, E., Piacentino, A., "Cogeneration: a Regulatory Framework Toward Growth," Energy Policy 33: 2100-2111, Reno-Tahoe, USA, 2005.
[1.5] Chiradeja, P., "An approach to Quantify the Technical Benefits of Distributed Generation," IEEE Transactions on Energy Conversion vol.19 no.4: 764-773, 2004.
[1.6] Consumer search: Furnace reviews, accessed June 10, 2007. www.consumersearch.com/ww/house_and_home/furnaces/index.html
[1.7] EDUCOGEN, "The European Educational tool on Cogeneration". accessed June 12, 2007. www.cogen.org/projects/educogen.htm .
[1.8] EPA Climate Protection Partnership Division, "Technology Characterization: Reciprocating Engines", prepared by Energy Nexus Group, Feb 2002.
[1.9] EPA Climate Protection Partnership Division, "Technology Characterization: Microturbines", prepared by Energy Nexus Group, March 2002.
[1.10] EPA Climate Protection Partnership Division, "Technology Characterization: Fuel Cells", prepared by Energy Nexus Group, March 2002.
[1.11] FC+Cogen-Sim, Annex 42, International Energy Association, accessed
179
Oct 2007. http://cogen-sim.net. 180
[1.12] Galdo, J., "Distributed Energy Resources - A National Perspective", Distributed Energy Resources: Policy options for Virginia, May 2002.
[1.13] Grillo, O., Magistri, L, Massardo, A.F., "Hybrid Systems for Distributed Power Generation Based on Pressurization and Heat Recovering of an Existing 100 kW Molten Carbonate Fuel Cell," Journal of Power Sources 115: 252-267, 2003.
[1.14] Hasnain, S. M., Alabbadi, N. M., "Need for Thermal-Storage Air-Conditioning in Saudi Arabia", Applied Energy 65:153-164, 2000.
[1.15] Hirotaka, K., Hirohiko, M., "Development of Portable Gas Turbine Generator 'Dynajet 2.6'," IHI Engineering Review 37-3:113-114, 2004.
[1.16] Huang, J., Feng, Z., Yue, C, Liu, L, "Operation Modes and Economic Performance Study of 100 kW Microturbine Building Cooling, Heating and Power Systems," ASME Turbo Expo Proceedings: GT2005-68277, Reno-Tahoe, USA, 2005.
[1.17] Jackson, G.M., Leventhall, H.G., "Household Appliance Noise", Applied Acoustics, 8:101-118,1975.
[1.18] Kataoka, T., Nakajima, T., Sakata, S., Kishikawa, T., "A Microturbine Cogeneration Package for Japanese Market", ASME Turbo Expo proceedings: GT2007-27697, Montreal, Canada, 2007.
[1.19] Kong, X.Q., Wang, R.Z., Huang, X.H., "Energy Efficiency and Economic Feasibility of CCHP Driven by Stirling Engine,", Energy Conversion and Management 45: 1433-1442, 2004.
[1.20] Kong, X.Q., Wang, R.Z., Wu, J.Y., Huang, X.H., Huangfu, D.W., Wu, D.W., Xu, Y.X., "Experimental Investigation of a Micro-Combined Cooling, Heating and Power System Driven by a Gas Engine," International Journal of Refrigeration 28: 977-987, 2005.
[1.21] Mackie, E. I., "Inlet Air Cooling for a Combustion Turbine Using Thermal Storage", ASHRAE Transactions 100-1: 572-582, 1994.
[1.22] Maidment, G.G., Zhao, X., Riffat, S.B., "Combined Cooling and Heating Using a Gas Engine in a Supermarket," Applied Energy 68: 321-335, 2001.
[1.23] Manning, M., "Reference House Load Data" .Canadian Centre for Housing Technologies. Obtained via email communication, June 2007.

181 [1.24] Mastronarde, T.P., "Shipboard Cogeneration - A Second Generation Design Approach", Naval Engineers Journal, 97: 306-314, May 1985.
[1.25] Miguez, J.L., Murillo, S., Porteiro, J., Lopez, L.M., "Feasibility of a New Domestic CHP Trigeneration With Heat Pump: I. Design and Development," Applied Thermal Engineering 24:1409-1419, 2004.
[1.26] Miguez, J.L, Murillo, S., Porteiro, J., Lopez, L.M., "Feasibility of a New Domestic CHP Trigeneration With Heat Pump: II. Availability Analysis," Applied Thermal Engineering 24:1421-1429, 2004.
[1.27] Natural Resources Canada, "Energy use data handbook", 2006.
[1.28] Otto, N.A., 1887, "Gas motor engine", United States patent, 365,701
[1.29] Personal files from experience at Air Canada Technical Services, 2006.
[1.30] Personal files from experience at Standard Aero Energy Limited, 2003.
[1.31] Rawson, M., Sugar, J., "Distributed Generation and Cogeneration Policy Roadmap for California", California Energy Commission Staff Report, CEC-500-2007-021, March 2007.
[1.32] Samuelsen, S., "Fuel Cell/Gas Turbine Hybrid Systems", National Fuel Cell Research Centre. ASME International Gas Turbine Institute, 2004.
[1.33] Smith, D.J., "Cogeneration, Distributed Generation and Peak Shaving Drive the Market for Small Gas Turbines", Power Engineering, pgs. 70-72, Oct 2000.
[1.34] Smugeresky, C.S, "An Integrated Combined Heat and Power Distributed Energy Resource for Modular Applications," ASME Turbo Expo proceedings: GT2007-28294, Montreal, Canada, 2007.
[1.35] Stirling, R., 1816, "Economiser", British patent, 4081.
[1.36] STM Power, accessed June 11, 2007, www.stmpower.com/Technology/Technology.asp
[1.37] Synchrony, www.synchrony.com/images/indmb.jpg, downloaded January 18, 2007.
[1.38] Turbec Inc., "On site turbine power", sales brochure, accessed June 7, 2007, http://www.turbec.com/pdf/Turbec%20brochure%202005... %20eng Email%20version. pdf
[1.39] U.S. Dept. of Energy Information Administration, "The Market and
182 Technical Potential for Combined Heat and Power in the Commercial/Institutional Sector", prepared by Onsite Sycom Energy Corp., Jan. 2000.
[1.40] United States Department of Energy, "Advanced Microturbine System: Market Assessment", prepared by Energy and Environmental Analysis Inc. May 2003.
[1.41] Veyo, S.," Westinghouse Fuel Cell Combined Cycle Systems", Fuel Cells Review Meeting: DOE/MC/28055-97/C0772, Morgantown, West Virginia. August 1996.
[1.42] Weaver, H. F., "NASA PS304 Lubricant Tested in World's First Commercial Oil-Free Gas Turbine", NASA Glenn Research and Technology Report accessed Jan 19, 2008, http://www.grc.nasa.gov/WWW/RT2002/5000/5960weaver.html.
[1.43] WhisperGen Limited, "WhisperGen product brochure" accessed June 11, 2007, www.whispergen.com/main/acwhispergen .
[1.44] Wilson, M.A., Recknagle, K., Brooks, K., "Design and Development of a Low-Cost High Temperature Silicon Carbide Micro-Channel Recuperator," ASME Turbo Expo proceedings: GT2005-69143, Reno-Tahoe, USA, 2005.
[1.45] Zhang, H.F., Ge, X.S., Ye, H., "Modelling of a Space Heating and Cooling System With Seasonal Energy Storage", Energy 32: 51-58, 2007.
[1.46] Ziher, D., Poredos, A., "Economics of a Trigeneration System in a Hospital," Applied Thermal Engineering 26: 680-687, 2006.
CHAPTER 2
[2.1] "Barajas T4 Trigeneration Plant", InfoPower: Trigeneration, October 2006.
[2.2] "New Contract for Dalkia in Chongquing, China", Dalkia corp., press release July 31, 2006.
[2.3] "TPGS Green Energy PTE LTD Develops and Constructs Singapore's First Trigeneration Facility", TPGS Green Energy, press release November 7, 2006.
[2.4] AMTUIR Musee des Transports Urbains, "Automotrice Mekarski a Air Comprime no. 22 (1879)", accessed Dec. 5, 07, http://www.amtuir.org/01_musee/collection/fiches_tv_tm/fiche_nantes_tramway_ mekarski_22.htm
[2.5] Bassols, J. Kuckelkorn, B., Langreck, J., Schneider, R., Veelken, H.,
183 "Trigeneration in the Food Industry," Applied Thermal Engineering 22: 595-602, 2002.
[2.6] Bolatturk, A., "Thermodyanamic Evaluation of First and Second Law Performance of Evaporative Cooling Scheme for Regenerative Gas Turbines", Energy Exploration and Exploitation, 25-3:. 227-246, June 2007.
[2.7] Building Research Consultants, "Air Cycle Project", accessed Dec. 6, 07. http://projects.bre.co.uk/aircycle/aircycleproject.htm
[2.8] Colonna, P., Gabrielli, S., "Industrial Trigeneration Using Ammonia-Water Absorption Refrigeration Systems (AAR)", Applied Thermal Engineering, 23: 381-396, 2003.
[2.9] Dewis, Dave., "Absorption Chiller Integration System Development", Micro-CHP Technologies Workshop Proceedings, U.S. Department of Energy. Greenbelt, Maryland, June 11-12, 2003.
[2.10] Engle, D., " The New Trigeneration Player: Integrated Cooling, Heating, and Power Systems are Here", Distributed Energy, May/June, 2004.
[2.11] Firestone, R., "Distributed Energy Resources Customer Adoption Model Technology Data", Ernest Orlando Lawrence Berkeley National Laboratory, January 2004.
[2.12] Godefroy, J., Boukhanouf, S.R., "Design, Testing and Mathematical Modelling of a Small-Scale CHP and Cooling System (Small CHP-Ejector Trigeneration)", Applied Thermal Engineering 27: 68-77, 2007.
[2.13] Hernandez-Santoyo, J., Sanches-Cifuentes, A., "Trigeneration: An Alternative for Energy Savings", Applied Energy 76: 219-227, 2003.
[2.14] Kong, X.Q., Wang, R.Z., Huang, X.H., "Energy Efficiency and Economic Feasibility of CCHP Driven by Stirling Engine,", Energy Conversion and Management 45:1433-1442, 2004.
[2.15] Kong, X.Q., Wang, R.Z., Wu, J.Y., Huang, X.H., Huangfu, D.W., Wu, D.W., Xu, Y.X., "Experimental Investigation of a Micro-Combined Cooling, Heating and Power System Driven by a Gas Engine," International Journal of Refrigeration 28: 977-987, 2005.
[2.16] Lennox home comfort systems, accessed Dec. 4, 2007, www.lennox.com/residential.
[2.17] Liang, H.X., Wnag, Q.W., "Evaluation of Energy Efficiency for a CCHP System With Available Microturbine", ASME Turbo Expo proceedings: GT2007-
27883, Montreal, Canada, 2007. 184
[2.18] Lin, L, Yaodong, W., et. al., "An Experimental Investigation of a Household Size Trigeneration", Applied Thermal Engineering, 27: 576-585, 2007.
[2.19] Lynn, A., Smid, E., Eshraghi, M., Caldwell, N., Woody, D., "Modelling Hydraulic Regenerative Hybrid Vehicles Using AMESim and MATLAB/SIMULINK", Proceedings of SPIE 5805: 24-40. Bellingham, USA, 2005.
[2.20] Mackie, E. I., "Inlet Air Cooling for a Combustion Turbine Using Thermal Storage", ASHRAE Transactions 100-1: 572-582,1994.
[2.21] Maidment, G.G., Zhao, X., Riffat, S.B., "Combine Cooling and Heating Using a Gas Engine in a Supermarket," Applied Energy 68: 321-335, 2001.
[2.22] Meunier, F., "Co- and Tri-Generation Contribution to Climate Change Control", Applied Thermal Engineering, 22: 703-718, 2002.
[2.23] Midwest CHP Application Centre, "Financial Institutions - Economics", accessed Dec. 6, 07, www.chpcentermw.org/08-043_economics.html
[2.24] Miguez, J.L., Murillo, S., Porteiro, J., Lopez, L.M., "Feasibility of a New Domestic CHP Trigeneration With Heat Pump: I. Design and Development," Applied Thermal Engineering 24: 1409-1419, 2004.
[2.25] Mfguez, J.L., Murillo, S., Porteiro, J., Lopez, L.M., "Feasibility of a New Domestic CHP Trigeneration With Heat Pump: II. Availability Analysis," Applied Thermal Engineering 24:1421-1429, 2004.
[2.26] Najjar, Y.S.H, Jubeh, N.M., "Comparison of Performance of Compressed-Air Energy Storage Plant with Compressed-Air Storage with Humidification", Proceedings of I MECH E Part A Journal of Power and Energy, 220-6: 581-588, 2006.
[2.27] Oztop, H.F., Hepbasli, A., "Cogeneration and Trigeneration Applications", Energy Sources, Part A 28: 743-750, 2006.
[2.28] "Pure Comfort™ Cooling, Heating and Power Solutions". UTC Power South Windsor, USA, 2005.
[2.29] Rufer, A., Lemofouet, S., "Energetic Performance of a Hybrid Energy Storage System Based on Compressed Air and Super Capacitors", International Symposium on Power Electronics Electrical Drives Automation and Motion, 2006.
[2.30] Sears, J.R., "Thermal and Compressed-Air Storage (TACAS): The Next
185 Generation of Energy Storage Technology", Proceedings of the International Stationary Battery Conference, Miami Beach, USA, 2005. Downloaded Dec. 5, 07. www.battcon.com/PapersFinal2005/SearsPaper2005.pdf.
[2.31] "Social Responsibility Report 2006", pgs. 14-15. Athens, Greece: Coca-Cola HBC, 2006.
[2.32] Spence, S.W.T., Doran, W.J., Artt, D.W., McCullough, G., "Performance Analysis of a Feasible Air-Cycle Refrigeration System for Road Transport", International Journal of Refrigeration 28: 381-388 2005.
[2.33] Vosburgh, K.G., "Compressed Air Energy Storage", Proceedings of AIAA/EEI/IEEE Conference on New Options in Energy Technology: 77-1008. San Fransisco, USA, August 2-4, 1977.
[2.34] Zaki, G.M., Jassim, R.K., Alhazmy, M.M., "Brayton Refrigeration Cycle for Gas Turbine Inlet Air Cooling", International Journal of Energy Research 31: 1292-1306,2007.
[2.35] Zaugg, P., "Brown Boveri Air-Storage Gas Turbines", Brown Boveri Review 64-1: 34-39, January 1977.
[2.36] Ziher, D., Poredos, A., "Economics of a Trigeneration System in a Hospital," Applied Thermal Engineering 26: 680-687, 2006.
Chapter 3
[3.1] Air-Conditioning Refrigeration Institute, "Performance Rating of Unitary Air-Conditioning and Air-Source Heat Pump Equipment", ARI 210-240-2006, © 2006. accessed Sept. 2007, www.ari.org .
[3.2] Cengle, Y.A., Boles, M.A., "Thermodynamics an Engineering Approach",pg. 568, McGraw Hill, New York, 2002.
[3.3] Churchill, S.W., "Free Convection Around Immersed Bodies", Heat Exchange Design Handbook, hemisphere publishing, New York, 1983.
[3.4] Energy Systems Research Unit, University of Strathclyde, accessed Sept. 2007, www.esru.strath.ac.uk/programs/ESP-r.htm .
[3.5] FC+Cogen-Sim, Annex 42, International Energy Association accessed Oct. 2007, http://cogen-sim.net.
[3.6] Kurzke, J., GASTURB™ 11, available from www.gasturb.de .
[3.7] Morgan, V.T., "The Overall Convective Heat Transfer from Smooth

186 Circular Cylinders," Advances in Heat Transfer, 11:199-264, 1974.
[3.8] Neal, L, O'Neal, D., "The Impact of Residential Air Conditioner Charging and Sizing on Peak Electrical Demand," Proceedings of the Summer Study on Energy Efficiency in Buildings, Vol. 2: 189, American Council for an Energy Efficient Economy, Washington D.C., USA 1993.
[3.9] Turns, S.R., "An Introduction to Combustion, Concepts and Applications", Second ed., McGraw Hill, Singapore, 2000.
[3.10] Williams, G.P., Gold, L.W., "Ground Temperatures", NRC Digest CBD-180, National Research Council. Ottawa, Canada 2007.
Chapter 4
[4.1] Manitoba Hydro, "Historical Electricity Rate Changes", accessed Dec. 12 2007, www.hydro.mb.ca/regulatory_affairs/energy_rates/electricity/historical.shtml
[4.2] Natural Resources Canada, "Canadian Natural Gas Review of 2005 and outlook to 2020", Dec 2006.
[4.3] Pogrebnyak, E., "Russian Electricity Sector: Reform Overview and Modelling Issues", Modelling and Managing Competitive Electricity Markets Conference. London Business School, Sept. 2007.
[4.4] Saravanamuttoo, H.I.H, Rogers, G.F.C., Cohen, H., "Gas Turbine Theory", 5th ed., Pearson Education Ltd., Essex, UK. 2001.
[4.5] US Energy Information Administration, "International Electricity Price and Fuel Cost Tables", accessed Dec. 12 2007. www.eia.doe.gov/emeu/international/elecprih.html
[4.6] US Energy Information Administration, "International and United States Natural Gas Price Tables", accessed Dec. 12 2007. www.eia.doe.gov/emeu/international/ngasprih.html
[4.7] Yin, J., Li, M.S., Huang, W.M., "Performance Analysis and Diagnostics of a Small Gas Turbine", Proceedings of the International Gas Turbine Congress, Tokyo, Japan, Nov. 2-7 2003.
Chapter 5
[5.1] Aerzen USA Corporation, VMX0a37R screw compressor operator's manual, obtained via email with sales representative Pierre Noack, Nov 7 2007.
[5.2] Aerzen USA Corporation, VMX0a37R screw compressor performance

187 maps, obtained via email with sales representative Pierre Noack, Oct 24 2007.
[5.3] Canadian Centre for Housing Technologies, "Twin Houses Project", Ottawa, Canada, accessed Sept. 2007, www.ccht-cctr.gc.ca/twinhouses_e.html.
[5.4] Carlyle Compressors, accessed Dec. 12, 07, www.carlylecompressor.com
[5.5] Churchill, S.W., "Free Convection Around Immersed Bodies", Heat Exchange Design Handbook, Hemisphere Publishing, New York, 1983.
[5.6] "Cut-Away Model Screw Compressor with Charge Air Cooling", accessed on Dec. 13, 07, www.technolab.org.
[5.7] Energy Systems Research Unit, University of Strathclyde, www.esru.strath.ac.uk/programs/ESP-r.htm, 2007.
[5.8] FC+Cogen-Sim, Annex 42, International Energy Association, http://cogen-sim.net, 2007.
[5.9] Fired Heat Exchangers, Selas Fluid, accessed Oct. 26 2007, www.selasfluid.com/international/web/le/us/likelesfus.nsf/docbyalias/fired_heat... _exch, 2007.
[5.10] Gauther, J.E.D., "Analysis of Indirectly Fired Gas Turbine Power Systems", ASME Turbo Expo Proceedings: GT2007-27226, Montreal, Canada 2007.
[5.11] Heat Exchangers, Belfast, PEL Price quote obtained from Peter Metaxas via personal email on Oct. 16 2007.
[5.12] Incropera, F.P., DeWitt, D.P., "Fundamentals of Heat and Mass Transfer", 4th ed., John Wiley & Sons, New York, 1996.
[5.13] Kirloskar Copeland Ltd., "Scroll Compressors ... The Technology for the 3rd Millennium", National Conference on Refrigeration and Air Conditioning, Chennai, India, Aug 29-30 2002.
[5.14] Kuppan, T., "Heat Exchanger Design Handbook", Marcel Dekker Inc., New York, 2000.
[5.15] Kurzke, J., GASTURB™ 11, available from www.gasturb.de .
[5.16] The Mathworks Inc., "MATLAB 7.1.0.21 R14 Service Pack 3 Student Edition Help Files", © 2005.
[5.17] Morgan, V.T., "The Overall Convective Heat Transfer from Smooth Circular Cylinders," Advances in Heat Transfer, 11:199-264,1974.
188 [5.18] Ohkubo, Y., "Outlook on Gas Turbine", R&D Review of Toyota CRDL 41-1, 2005.
[5.19] Robby foundation, accessed Dec. 12, 07, www.robbyfoundation.com
[5.20] Rolls Royce Energy Division, Pipeline centrifugal compressors, accessed Dec. 12, 07, http://energy.rolls-royce.com/oil-and-gas-industry-compressors/.
[5.21] Saravanamuttoo, H.I.H, Rogers, G.F.C, Cohen, H., "Gas Turbine Theory", 5th ed., Pearson Education Ltd., Essex, UK. 2001.
[5.22] Saunders, E.A.D, "Heat Exchangers: Selection, Design & Construction", Longman Scientific & Technical, Essex, UK, 1988.
[5.23] Tubular Exchanger Manufacturers Association, Section N-1, 1978.
[5.24] Turns, S.R., "An Introduction to Combustion, Concepts and Applications", 2nd ed., McGraw Hill, Singapore, 2000.
[5.25] WCR heat exchangers, accessed Jan 22 2007. www.wcr-regasketing.com/bhe/lmages/2circuitgraphicll.gif
[5.26] Wilson, D.G., Ballou, J., "Design and Performance of a High-Temperature Regenerator Having Very High Effectiveness, Low Leakage and Negligible Seal Wear", ASME Turbo Expo Proceedings: GT2006-90095, Barcelona, Spain, 2006.
Appendix E
[E.1] Aerzen USA Corporation, VMX0a37R screw compressor performance maps, obtained via email with sales representative Pierre Noack, Oct 24 2007.
[E.2] Aerzen USA Corporation, quotation for a VMX0a37R screw compressor, obtained via email with sales representative Pierre Noack, Nov 6 2007.
[E.3] Gauthier, J.E.D., "Analysis of Indirectly Fired Gas Turbine Power Systems", ASME Turbo Expo Proceedings: GT2007-27226, Montreal, Canada, 2007.
[E.4] Kaikko, J., Backman, J.L.H, Koskelainen, L., Larjola, J., "Optimum Operation of Externally-Fired Microturbine in Combined Heat and Power Generation", ASME Turbo Expo Proceedings: GT2007-28264, Montreal, Canada, 2007.
[E.5] Ohkubo, Y., "Outlook on Gas Turbine", R&D Review of Toyota CRDL 41-1, 2005.
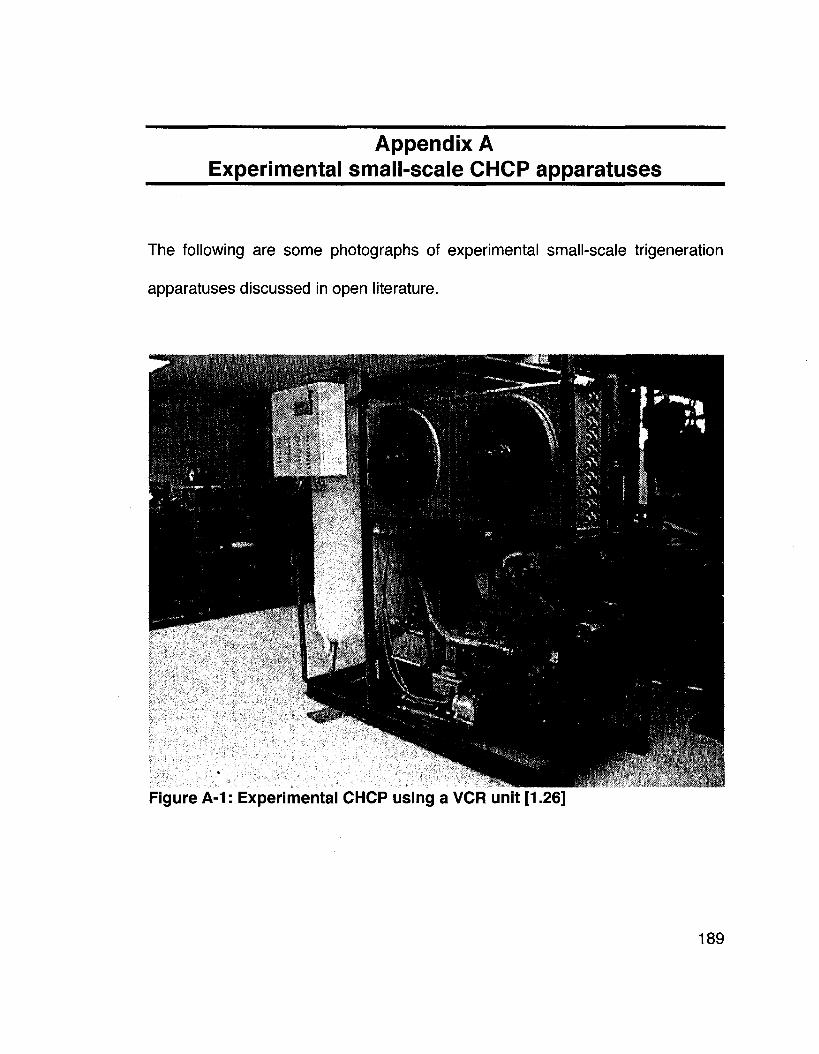
Appendix A Experimental small-scale CHCP apparatuses
The following are some photographs of experimental small-scale trigeneration
apparatuses discussed in open literature.
Figure A-1: Experimental CHCP using a VCR unit [1.26]
189
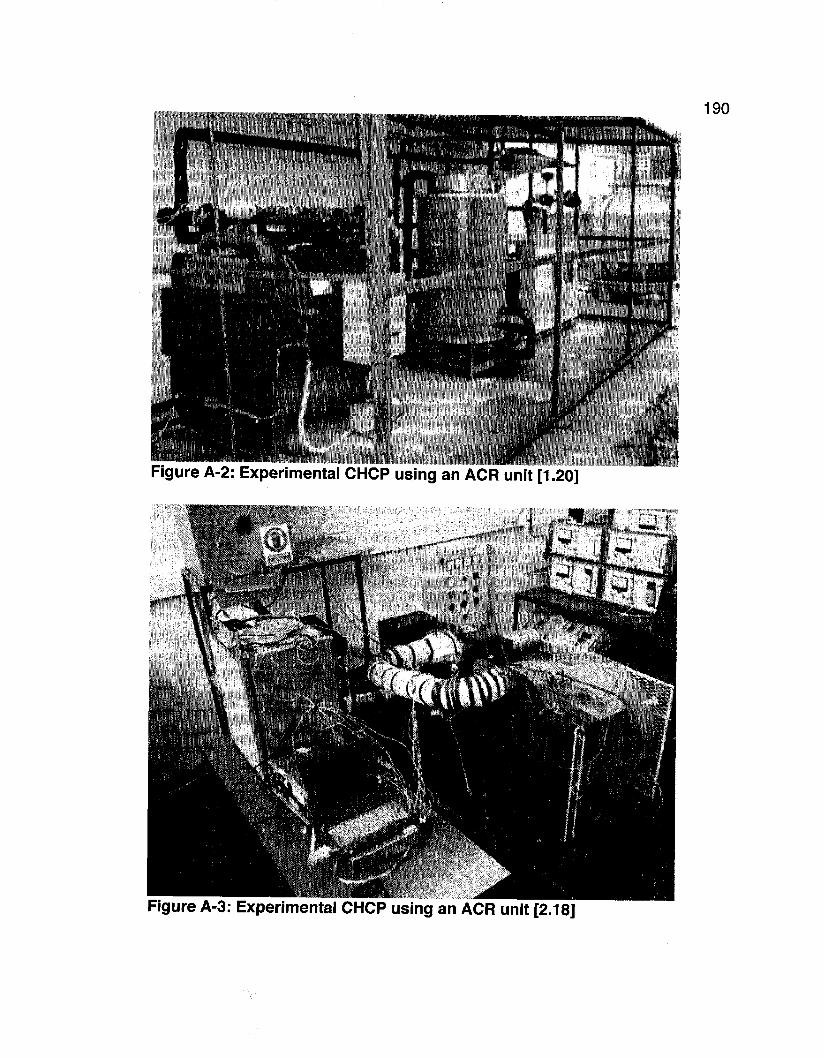
190
Figure A-2: Experimental CHCP using an ACR unit [1 ;2o]
Figure A-3: Experimental CHCP using an ACR unit [2.18]
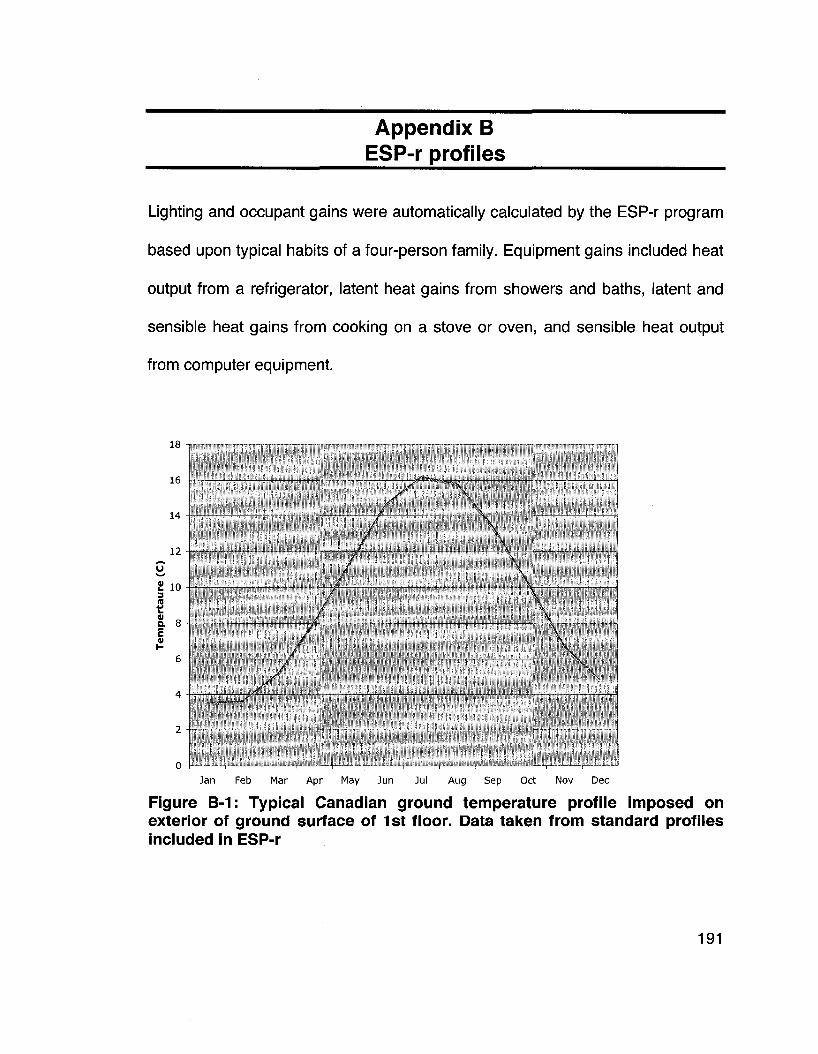
Appendix B ESP-r profiles
Lighting and occupant gains were automatically calculated by the ESP-r program
based upon typical habits of a four-person family. Equipment gains included heat
output from a refrigerator, latent heat gains from showers and baths, latent and
sensible heat gains from cooking on a stove or oven, and sensible heat output
from computer equipment.
18 i
16
14
12
U
« 10 i
t a 8 E « i-
/ S
t
Jan Feb Mar Apr May Jun Jul Aug Sep Oct Nov Dec
Figure B-1: Typical Canadian ground temperature profile imposed on exterior of ground surface of 1st floor. Data taken from standard profiles included in ESP-r
191
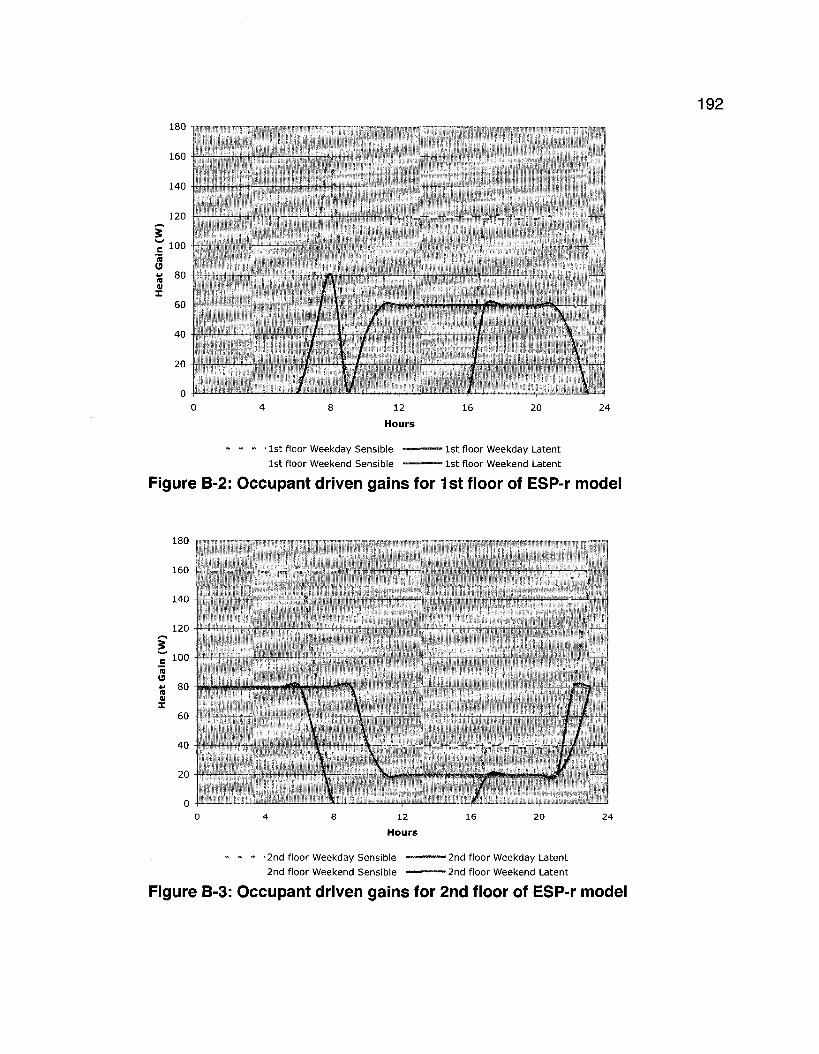
180
160 41
140
120
~ 100 '5 (9 X 80 is ai X
60
40
20
24
• 1st floor Weekday Sensible
1st floor Weekend Sensible
• 1st floor Weekday Latent
• 1st floor Weekend Latent
Figure B-2: Occupant driven gains for 1st floor of ESP-r model
12nd floor Weekday Sensible
2nd floor Weekend Sensible
• 2nd floor Weekday Latent
• 2nd floor Weekend Latent
Figure B-3: Occupant driven gains for 2nd floor of ESP-r model
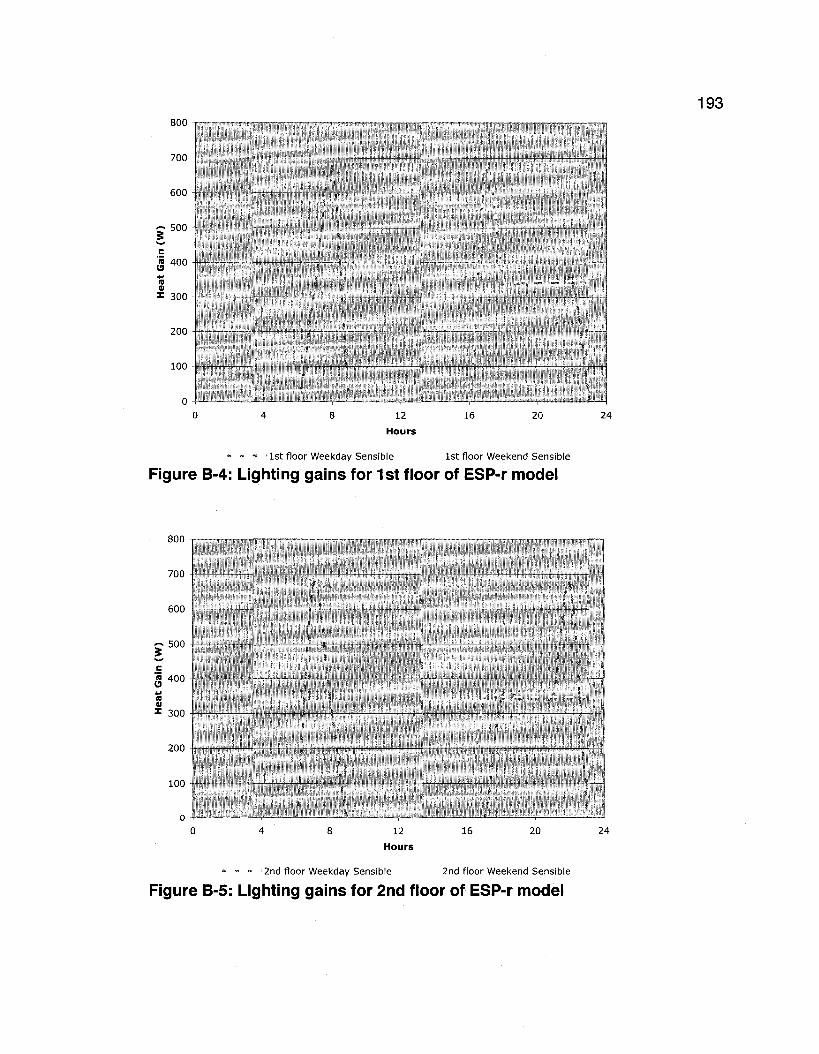
800
700
600
j 500
3 400 n
I 300
200
100
12
Hours
16 20 24
- • 1st floor Weekday Sensible 1st floor Weekend Sensible
Figure B-4: Lighting gains for 1st floor of ESP-r model
800 -f
700
600
j 500
« 400 (9
« 1 300
200
100
12
Hours
16 20 24
- - • 2nd floor Weekday Sensible 2nd floor Weekend Sensible
Figure B-5: Lighting gains for 2nd floor of ESP-r model
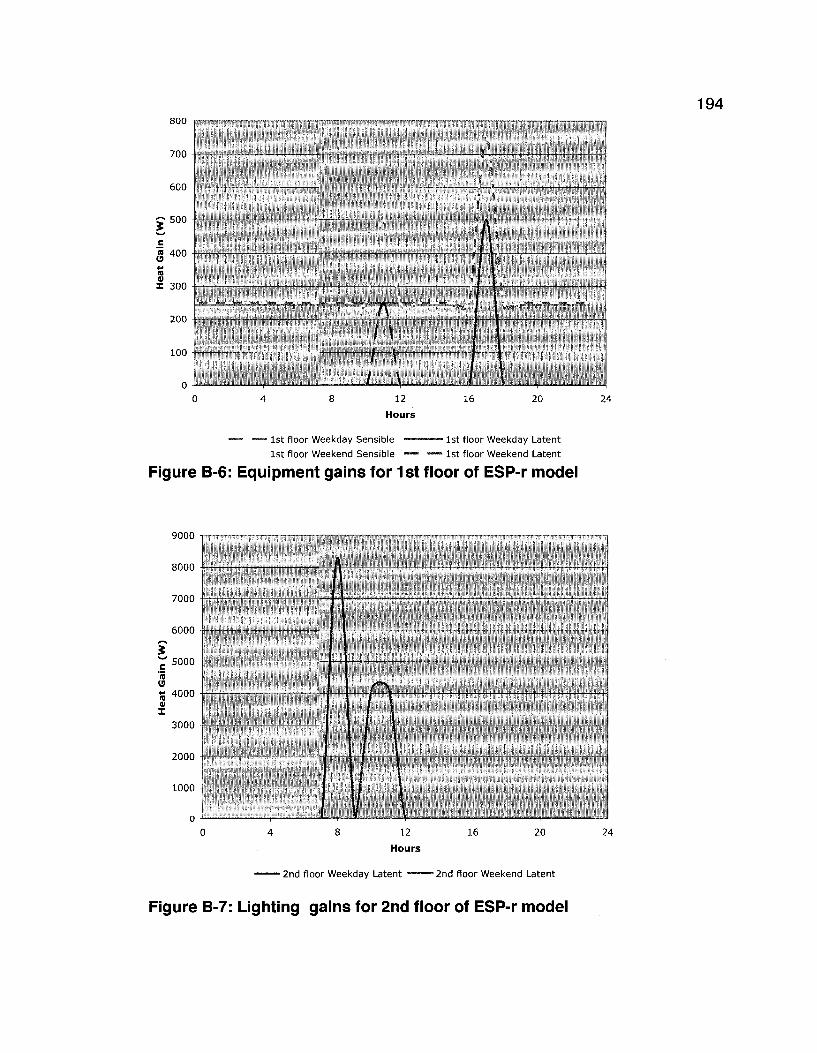
800 -j
700 - i
600
500
,<» 400
n o> I 300
200
100
""A"" / \
/ I
12
Hours
• 1st floor Weekday Sensible
1st floor Weekend Sensible
20
• 1st floor Weekday Latent 11st floor Weekend Latent
Figure B-6: Equipment gains for 1st floor of ESP-r model
9000
8000
7000
6000
~ 5000
"(5 u * 4000
X
3000
2000 - -
1000 -
0 -
16 20
• 2nd floor Weekday Latent • 2nd floor Weekend Latent
Figure B-7: Lighting gains for 2nd floor of ESP-r model
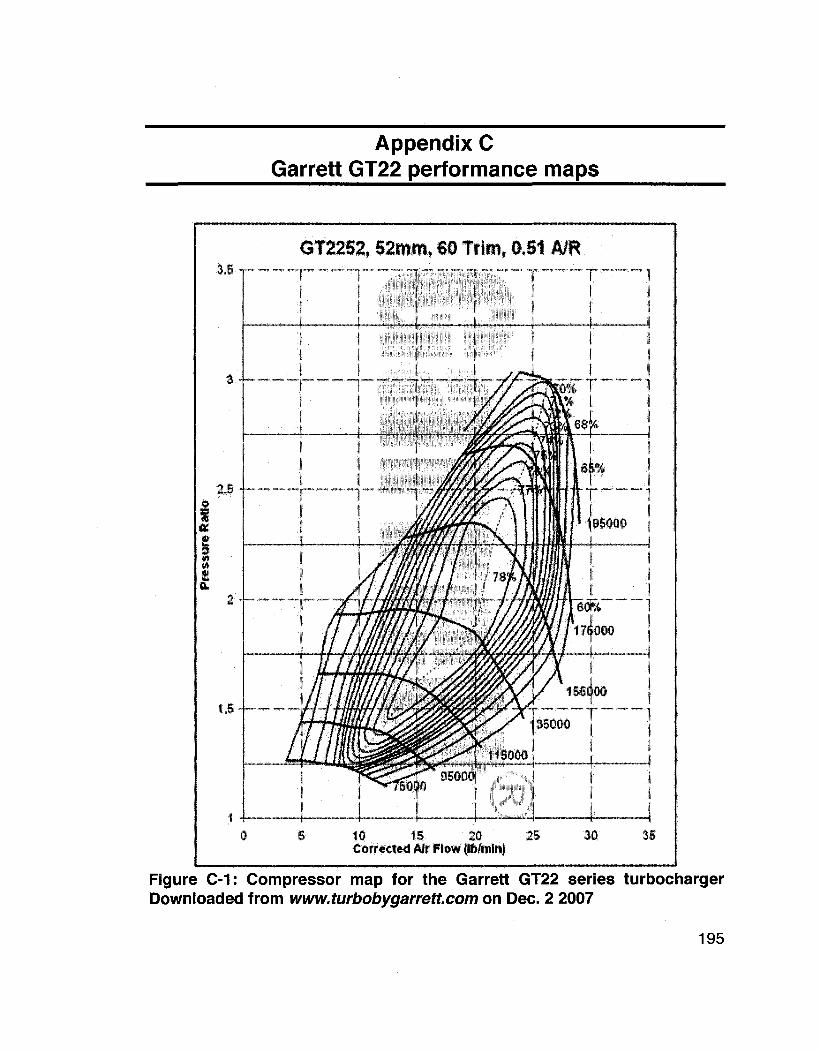
Appendix C Garrett GT22 performance maps
3.5 GT2252, 52mm, 60 Trim, 0.51 A/R
20 26 C orr ected Air Plow (pbfttfnj)
3§
Figure C-1: Compressor map for the Garrett GT22 series turbocharger Downloaded from www.turbobygarrett.com on Dec. 2 2007
195
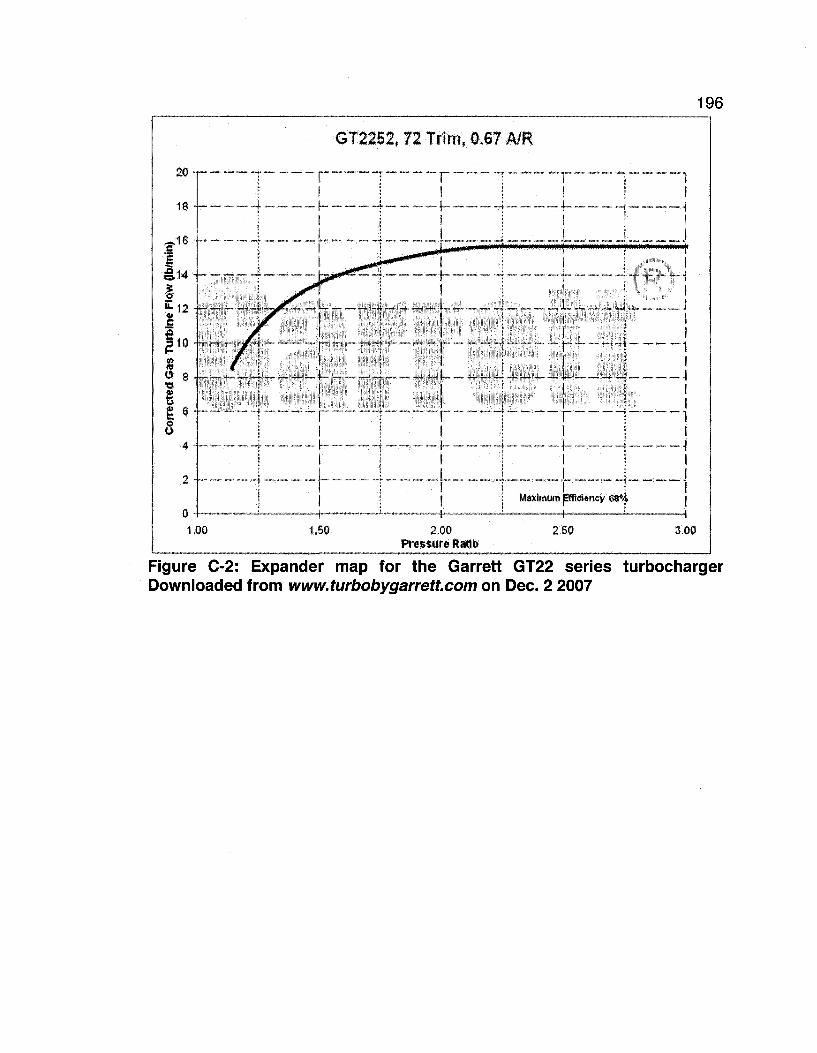
196
GT2252, 72 Trim, 0.67 A/R
1,00 1.50 2,00 Pressure Ratio
2.50 3,00
Figure C-2: Expander map for the Garrett GT22 series turbocharger Downloaded from www.turbobygarrett.com on Dec. 2 2007
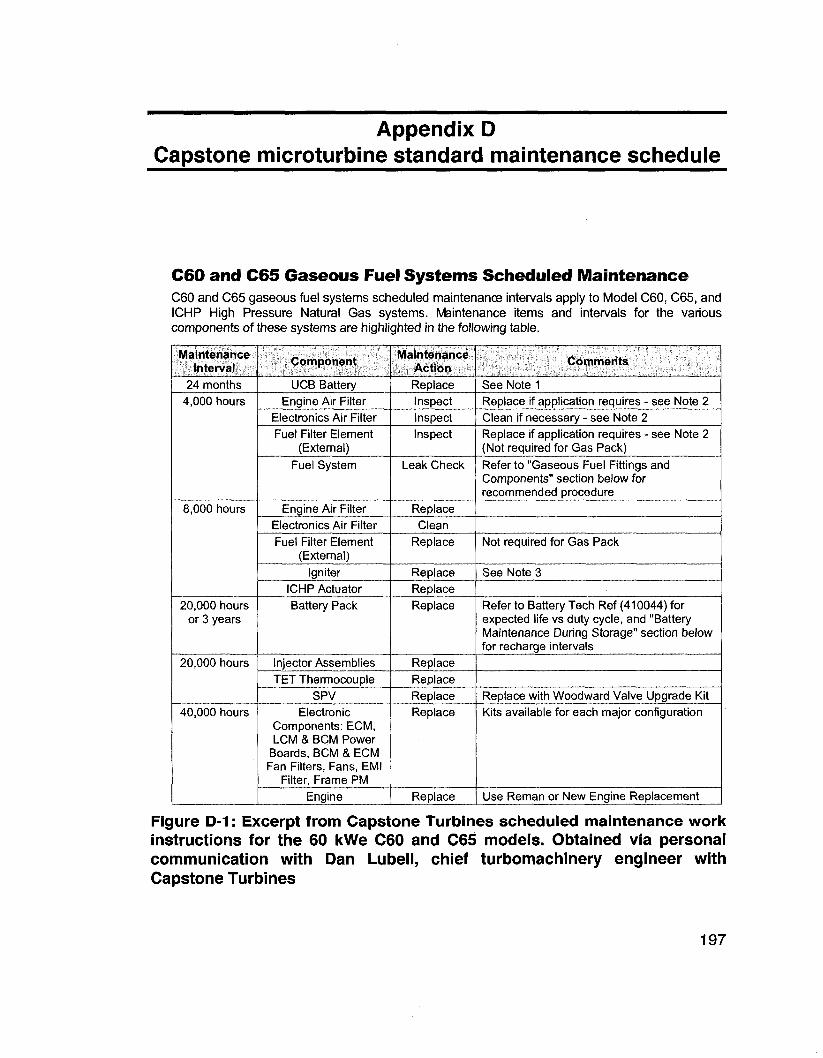
Appendix D Capstone microturbine standard maintenance schedule
C60 and C65 Gaseous Fuel Systems Scheduled Maintenance C60 and C65 gaseous fuel systems scheduled maintenance intervals apply to Model C60, C65, and ICHP High Pressure Natural Gas systems. Maintenance items and intervals for the various components of these systems are highlighted in the following table.
Maintenance Interval
24 months 4,000 hours
8,000 hours
20,000 hours or 3 years
20,000 hours
40,000 hours
Component
UCB Battery Engine Air Filter
Electronics Air Filter Fuel Filter Element
(External) Fuel System
Engine Air Filter Electronics Air Filter Fuel Filter Element
(External) Igniter
ICHP Actuator Battery Pack
Injector Assemblies TET Thermocouple
SPV Electronic
Components: ECM, LCM & BCM Power
Boards, BCM & ECM Fan Filters, Fans, EMI
Filter, Frame PM Engine
Maintenance Action Replace Inspect Inspect Inspect
Leak Check
Replace Clean
Replace
Replace Replace Replace
Replace Replace Replace Replace
Replace
Comments
See Note 1 Replace if application requires - see Note 2 Clean if necessary - see Note 2 Replace if application requires - see Note 2 (Not required for Gas Pack) Refer to "Gaseous Fuel Fittings and Components" section below for recommended procedure
Not required for Gas Pack
See Note 3
Refer to Battery Tech Ref (410044) for expected life vs duty cycle, and "Battery Maintenance During Storage" section below for recharge intervals
Replace with Woodward Valve Upgrade Kit Kits available for each major configuration
Use Reman or New Engine Replacement
Figure D-1: Excerpt from Capstone Turbines scheduled maintenance work instructions for the 60 kWe C60 and C65 models. Obtained via personal communication with Dan Lubell, chief turbomachinery engineer with Capstone Turbines
197
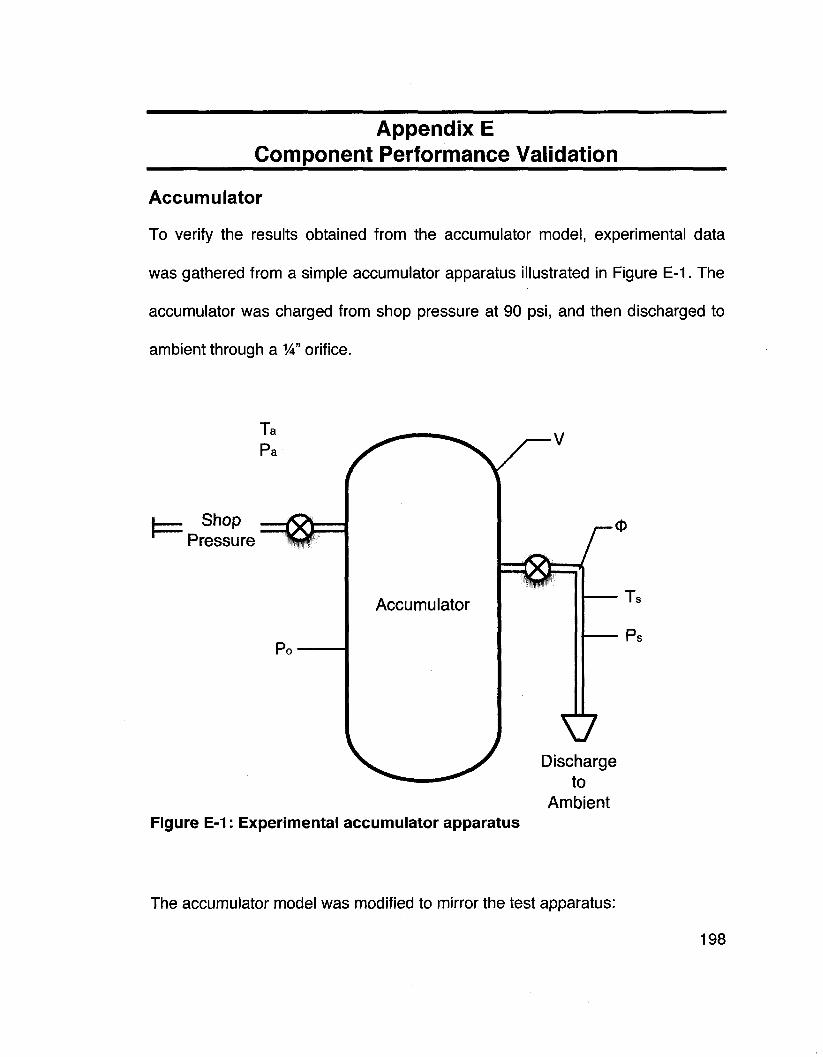
Appendix E Component Performance Validation
Accumulator
To verify the results obtained from the accumulator model, experimental data
was gathered from a simple accumulator apparatus illustrated in Figure E-1. The
accumulator was charged from shop pressure at 90 psi, and then discharged to
ambient through a W orifice.
Ta Pa
I Shop Pressure
Accumulator
Figure E-1: Experimental accumulator apparatus
0
Ts
Ps
tt Discharge
to Ambient
The accumulator model was modified to mirror the test apparatus:
198
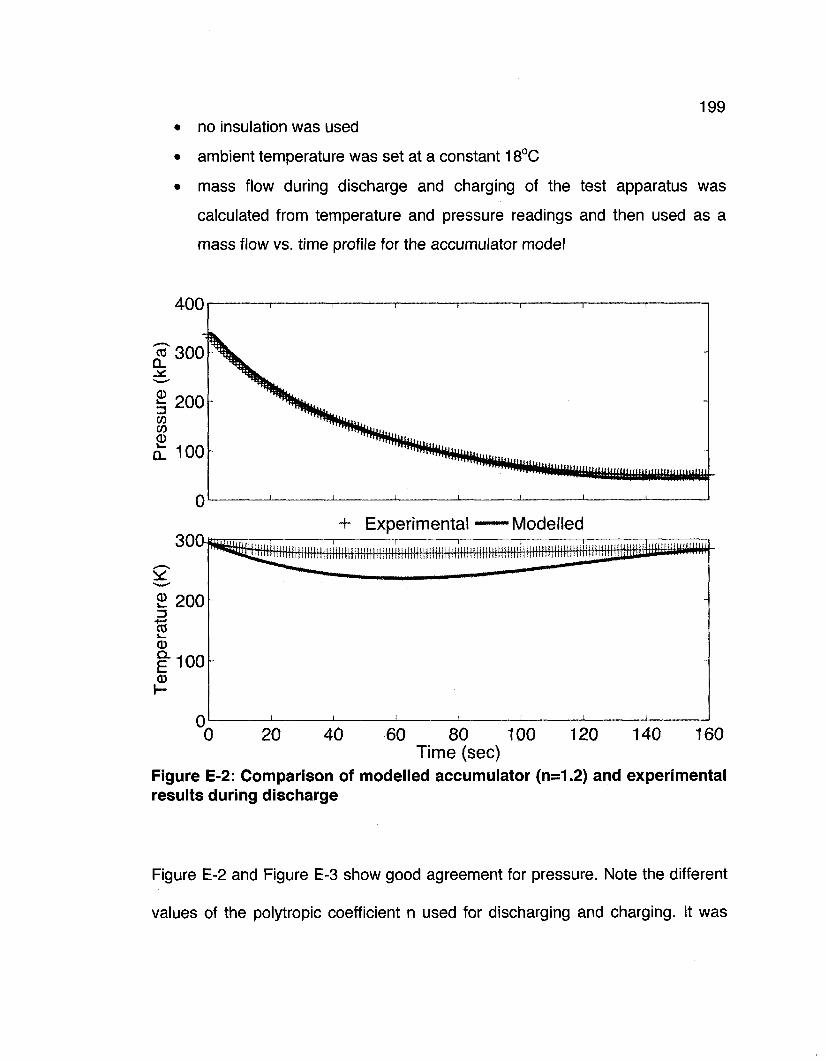
199
• no insulation was used
• ambient temperature was set at a constant 18°C
• mass flow during discharge and charging of the test apparatus was
calculated from temperature and pressure readings and then used as a
mass flow vs. time profile for the accumulator model
400
3 200 w in o DL 100
+ Experimental — Modelled
60 80 100 120 140 160 Time (sec)
Figure E-2: Comparison of modelled accumulator (n=1.2) and experimental results during discharge
Figure E-2 and Figure E-3 show good agreement for pressure. Note the different
values of the polytropic coefficient n used for discharging and charging. It was
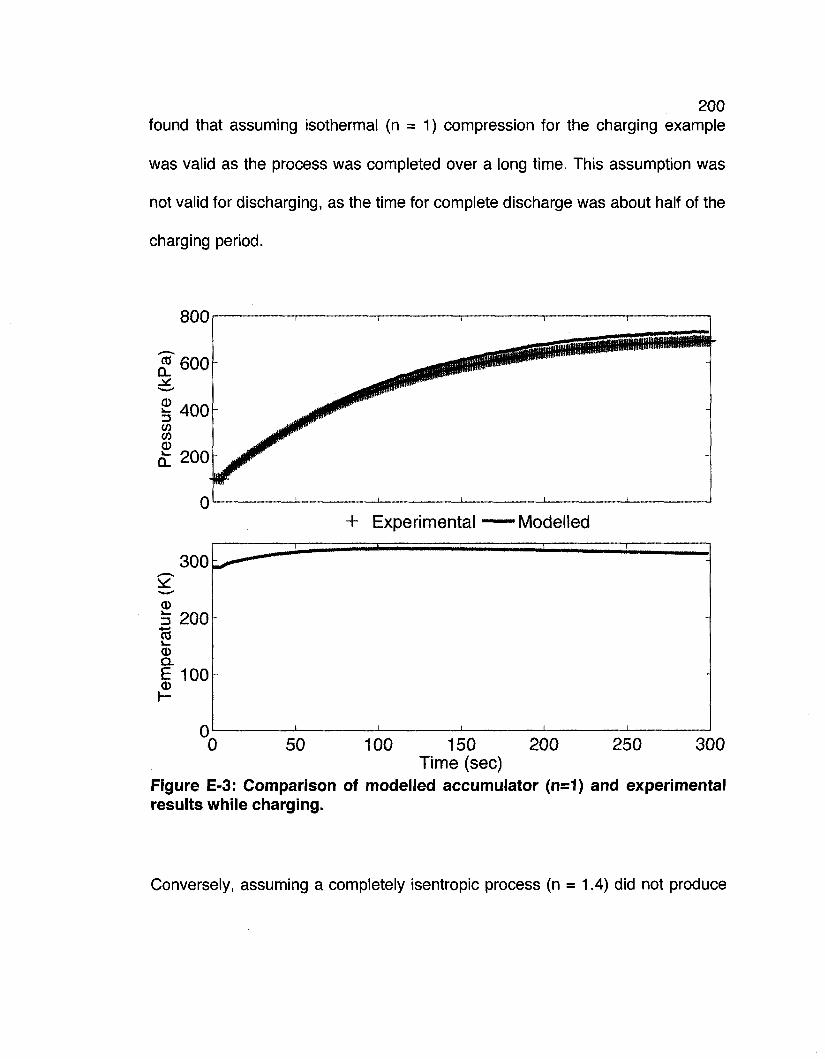
200 found that assuming isothermal (n = 1) compression for the charging example
was valid as the process was completed over a long time. This assumption was
not valid for discharging, as the time for complete discharge was about half of the
charging period.
800
0
+ Experimental Modelled
50 250 300 100 150 200 Time (sec)
Figure E-3: Comparison of modelled accumulator (n=1) and experimental results while charging.
Conversely, assuming a completely isentropic process (n = 1.4) did not produce
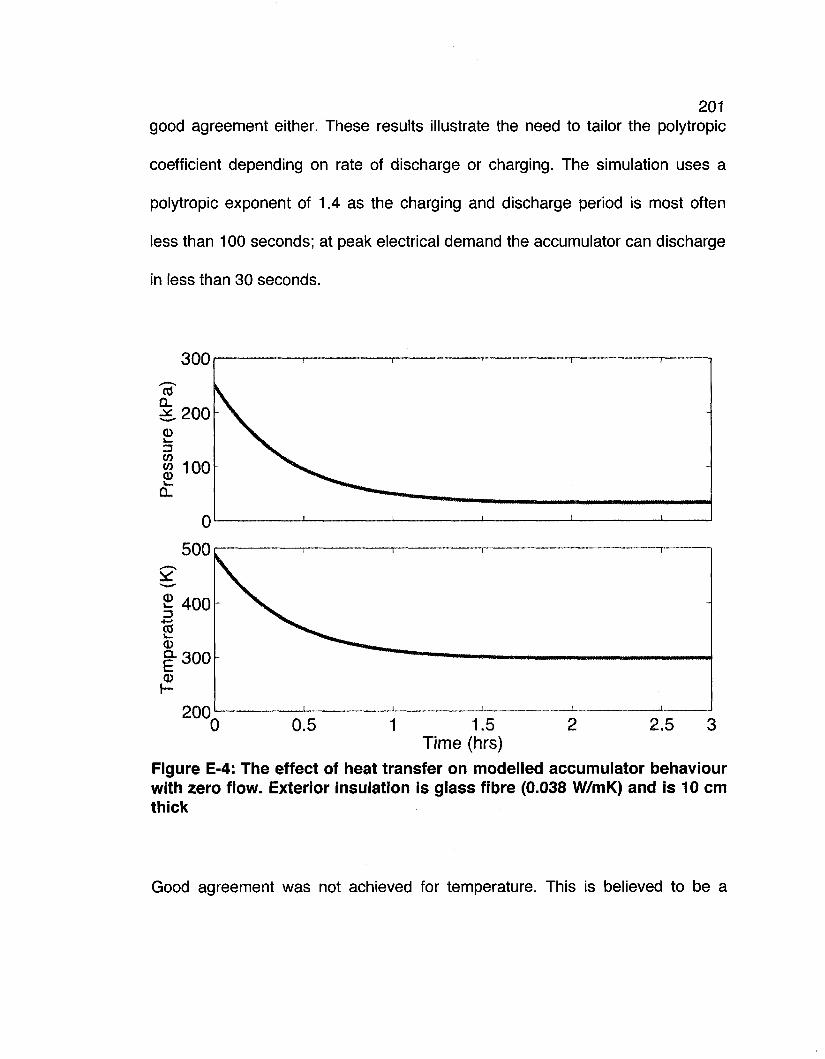
201 good agreement either. These results illustrate the need to tailor the polytropic
coefficient depending on rate of discharge or charging. The simulation uses a
polytropic exponent of 1.4 as the charging and discharge period is most often
less than 100 seconds; at peak electrical demand the accumulator can discharge
in less than 30 seconds.
300
1.5 Time (hrs)
Figure E-4: The effect of heat transfer on modelled accumulator behaviour with zero flow. Exterior insulation is glass fibre (0.038 W/mK) and is 10 cm thick
Good agreement was not achieved for temperature. This is believed to be a
202 combination of two factors. Heat transfer calculations for the model are for a
horizontal cylinder and are based upon empirical correlations for convection
coefficients that are a best guess; actual convection coefficients are most likely
much higher. Flow temperature is also recorded at the end of a 1 m long, 0.0508
m (2 in.) diameter pipe rather than in the accumulator (as seen in Figure E-1).
Residence time for flow in the pipe was on average about 1 second for the
blowdown period. Combined with a large wetted area, this makes for a high rate
of heat transfer between the accumulator and the temperature measuring point.
As the disagreement in temperature is believed to be a result of heat transfer to
ambient not accounted for in the model, it is anticipated that if the test apparatus
was well insulated this discrepancy would be negligible. Mass is conserved
during discharge, as the final temperature and pressure readings agree.
Temperature data was not measured during charging, as there was no provision
to measure the accumulator temperature; measuring pipe flow temperature did
not provide any information as there was no flow in the pipe during charging.
Therefore there is no comparison available for accumulator temperature during
charging.
Figure E-4 is an example of the effect of heat transfer on the accumulator with
zero flow. The accumulator was charged at a high temperature and then allowed
203 to remain static, with no discharge or charging flows to observe the temperature
and pressure drop over time. Ambient air was set at 22°C. The accumulator took
roughly an hour to equalize its temperature with ambient. This result shows that
heat transfer has a negligible effect on IBC performance if the accumulator is
discharged and charged frequently. During low load periods, there is greater
potential for heat loss or gain to occur.
Microturbine
The trigeneration system under study is complex, involving off-design component
matching, over a wide range of operating conditions. To have a measure of
confidence in the results obtained from the simulation, verification of the model is
required. A good place to start is by looking at IFGT performance at design.
Design point performance
As the trigeneration model is based upon component maps generated from
GASTURB™, external validation is required in addition to using GASTURB™ to
validate in-house model performance. A team from the Lappeenranta University
of Technology has designed an IFGT CHP microturbine system fueled by
biomass (wood, corn, etc..) for a medium sized commercial application as shown
in Figure E-5; this system will be referred to as the bio-IFGT system. The bio-
IFGT system differs in how the heat load is provided and in the fuel used,
however the heat exchanger configuration is similar to what is used for Mode 1.
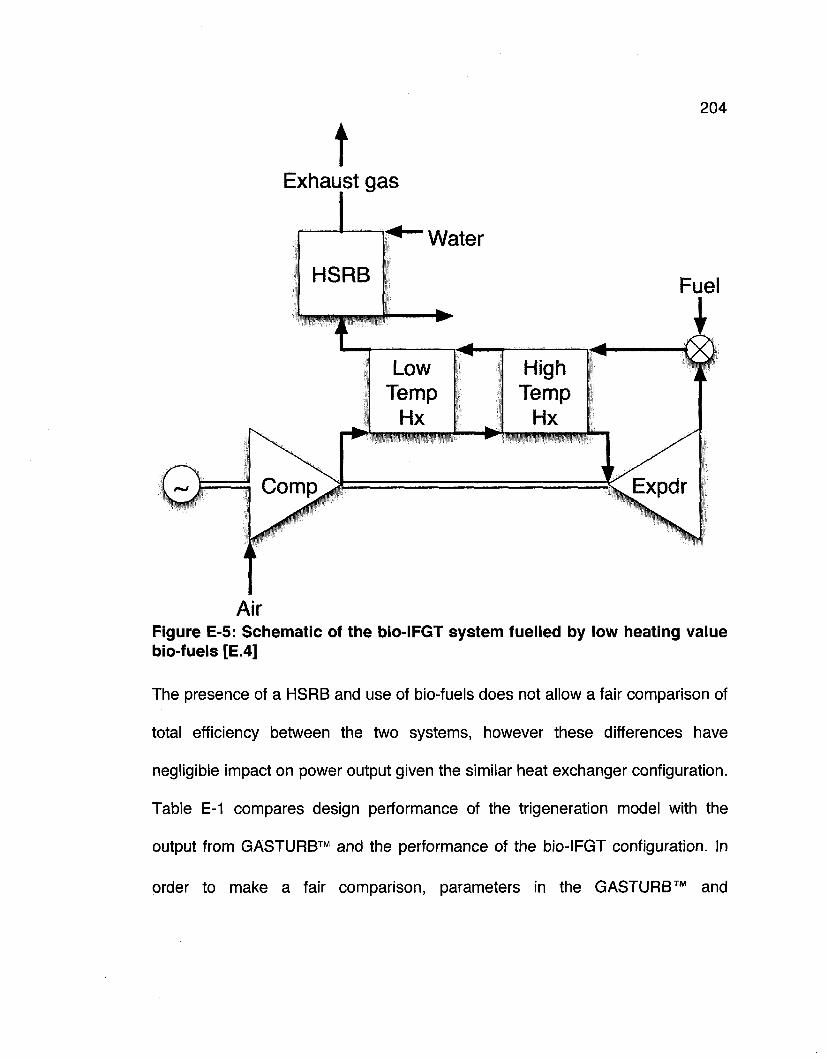
t 204
Exhaust gas
HSRB
Water
Fuel
Low Temp
Hx tMHUHWWWmWK
High Temp
Hx 'jmrnmrnmummm*
Figure E-5: Schematic of the bio-IFGT system fuelled by low heating value bio-fuels [E.4]
The presence of a HSRB and use of bio-fuels does not allow a fair comparison of
total efficiency between the two systems, however these differences have
negligible impact on power output given the similar heat exchanger configuration.
Table E-1 compares design performance of the trigeneration model with the
output from GASTURB™ and the performance of the bio-IFGT configuration. In
order to make a fair comparison, parameters in the GASTURB™ and
205 trigeneration models were modified to match those used in the bio-IFGT
simulation. They are as follows:
• Tic = 0.84
• Tie = 0.83
• APexhaust = 9 percent
• APhx = 4 percent
• EIT=1223K
• LHV = 10.459 MJ/kg
• T|m = 0.98
• W = 80 kWe
The results, tabulated in Table E-1, show good agreement for all three
simulations. GASTURB™ does not have an option to model the burner section of
a gas turbine as a series of heat exchangers. The effect is similar to specifying
heat exchangers with 100 percent effectiveness. As a result, the GASTURB™
simulation predicted a high thermal efficiency. Even though the thermal
efficiencies do not match, it is expected the trigen system should have a lower
predicted value. With an HEN effectiveness of unity, the thermal efficiency of the
trigen system increases, shown in Table E-1. The bio-IFGT model used an in-
house heat exchanger heat transfer model that made use of the log mean
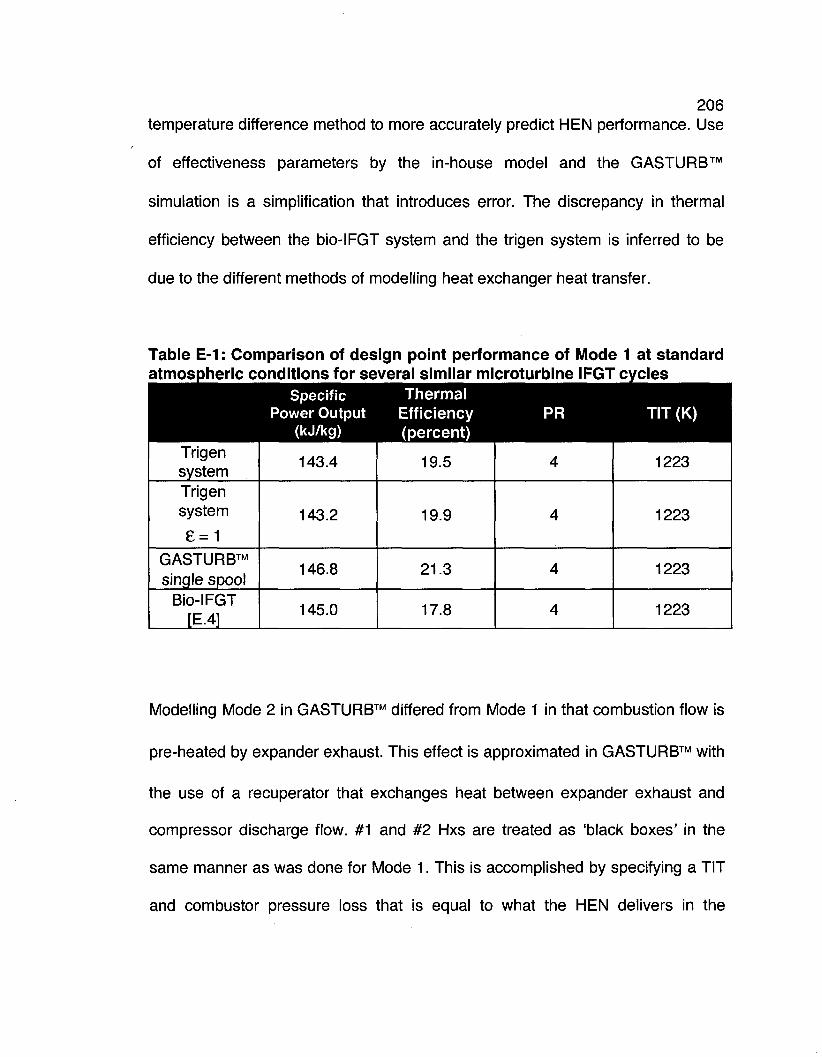
206 temperature difference method to more accurately predict HEN performance. Use
of effectiveness parameters by the in-house model and the GASTURB™
simulation is a simplification that introduces error. The discrepancy in thermal
efficiency between the bio-IFGT system and the trigen system is inferred to be
due to the different methods of modelling heat exchanger heat transfer.
Table E-1: Comparison of design point performance of Mode 1 at standard atmospheric conditions for several similar microturbine IFGT cycles
Specific Power Output
(kJ/kg)
Thermal Efficiency (percent)
TIT (K)
Trigen system Trigen system
£ = 1
GASTURB™ single spool
Bio-IFGT [E.4]
143.4
143.2
146.8
145.0
19.5
19.9
21.3
17.8
4
4
4
4
1223
1223
1223
1223
Modelling Mode 2 in GASTURB™ differed from Mode 1 in that combustion flow is
pre-heated by expander exhaust. This effect is approximated in GASTURB™ with
the use of a recuperator that exchanges heat between expander exhaust and
compressor discharge flow. #1 and #2 Hxs are treated as 'black boxes' in the
same manner as was done for Mode 1. This is accomplished by specifying a TIT
and combustor pressure loss that is equal to what the HEN delivers in the
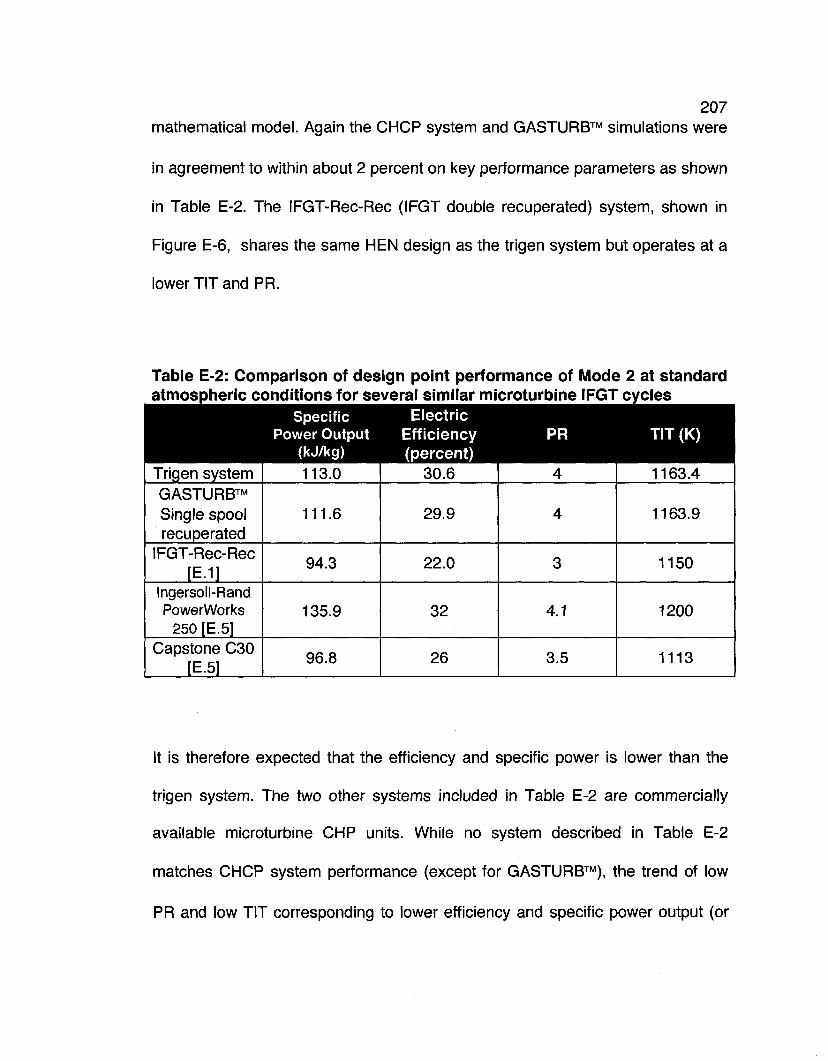
207 mathematical model. Again the CHCP system and GASTURB™ simulations were
in agreement to within about 2 percent on key performance parameters as shown
in Table E-2. The IFGT-Rec-Rec (IFGT double recuperated) system, shown in
Figure E-6, shares the same HEN design as the trigen system but operates at a
lower TIT and PR.
Table E-2: Comparison of design point performance of Mode 2 at standard atmospheric conditions for several similar microturbine IFGT cycles
Specific Power Output
(kJ/kg)
Electric Efficiency (percent)
TIT (K)
Trigen system GASTURB™ Single spool recuperated
IFGT-Rec-Rec [E.1]
Ingersoll-Rand PowerWorks
250 [E.5] Capstone C30
[E.5]
113.0
111.6
94.3
135.9
96.8
30.6
29.9
22.0
32
26
4
4
3
4.1
3.5
1163.4
1163.9
1150
1200
1113
It is therefore expected that the efficiency and specific power is lower than the
trigen system. The two other systems included in Table E-2 are commercially
available microturbine CHP units. While no system described in Table E-2
matches CHCP system performance (except for GASTURB™), the trend of low
PR and low TIT corresponding to lower efficiency and specific power output (or
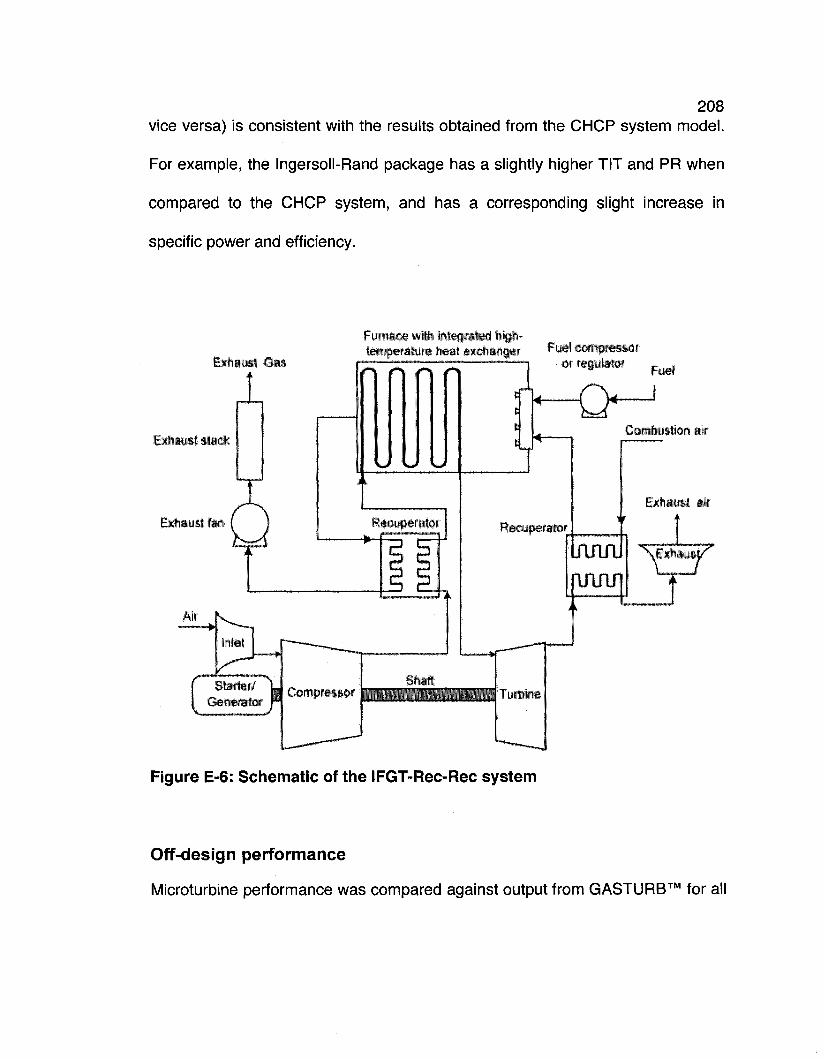
208 vice versa) is consistent with the results obtained from the CHCP system model.
For example, the Ingersoll-Rand package has a slightly higher TIT and PR when
compared to the CHCP system, and has a corresponding slight increase in
specific power and efficiency.
Exhauil Sas
Fu»nar.f> wilh intecj;»t£d hiqh-temperahire heat exchanger Fuel COmpKSSOT
or regulator _ ^
gxttaual stseM Combustion air
Exhaust air
Exhaust fiMi
**^^S^7"
„ R Compres&or Generator r
Turbine
Figure E-6: Schematic of the IFGT-Rec-Rec system
Off-design performance
Microturbine performance was compared against output from GASTURB™ for all
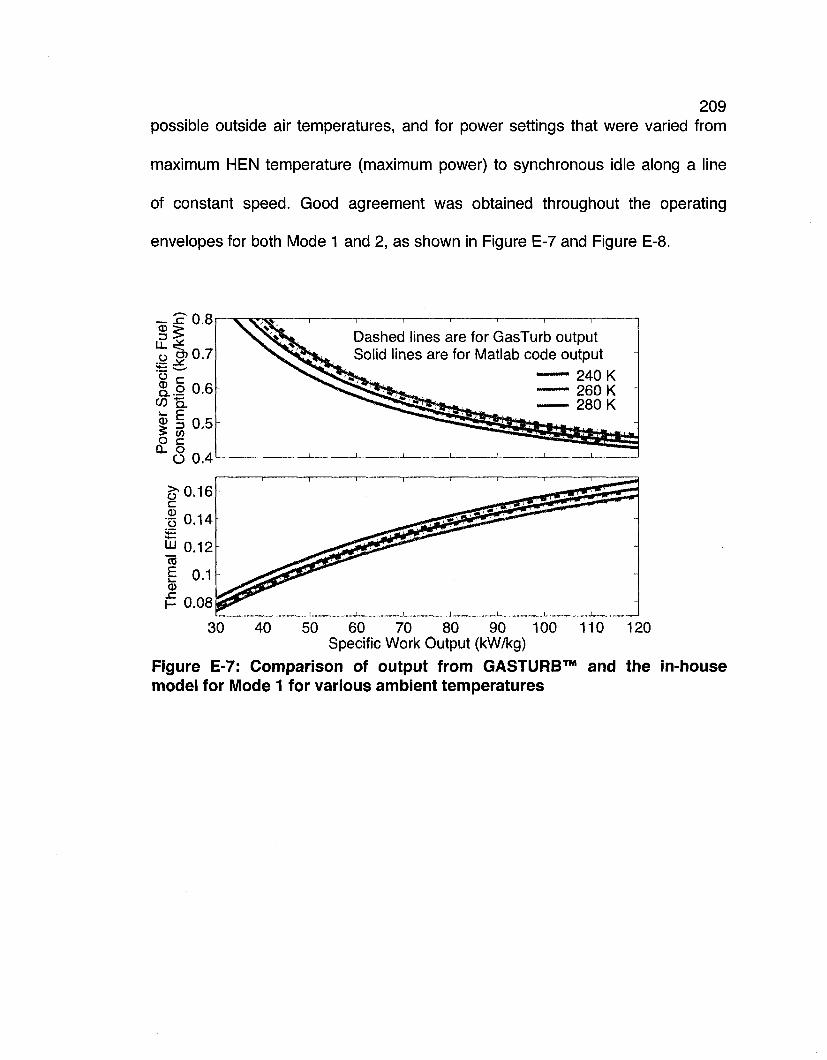
209 possible outside air temperatures, and for power settings that were varied from
maximum HEN temperature (maximum power) to synchronous idle along a line
of constant speed. Good agreement was obtained throughout the operating
envelopes for both Mode 1 and 2, as shown in Figure E-7 and Figure E-8.
* € 0 8
u. =¥ o raO.7
g. .2 0.6 co "B. | I 0.5 o w
^ Q 0.4
^ 0.12 CO
i 0.1
H 0.08
30
Dashed lines are for GasTurb output Solid lines are for Matlab code output
240 K 260 K 280 K
40 50 60 70 80 90 100 110 120 Specific Work Output (kW/kg)
Figure E-7: Comparison of output from GASTURB™ and the in-house model for Mode 1 for various ambient temperatures
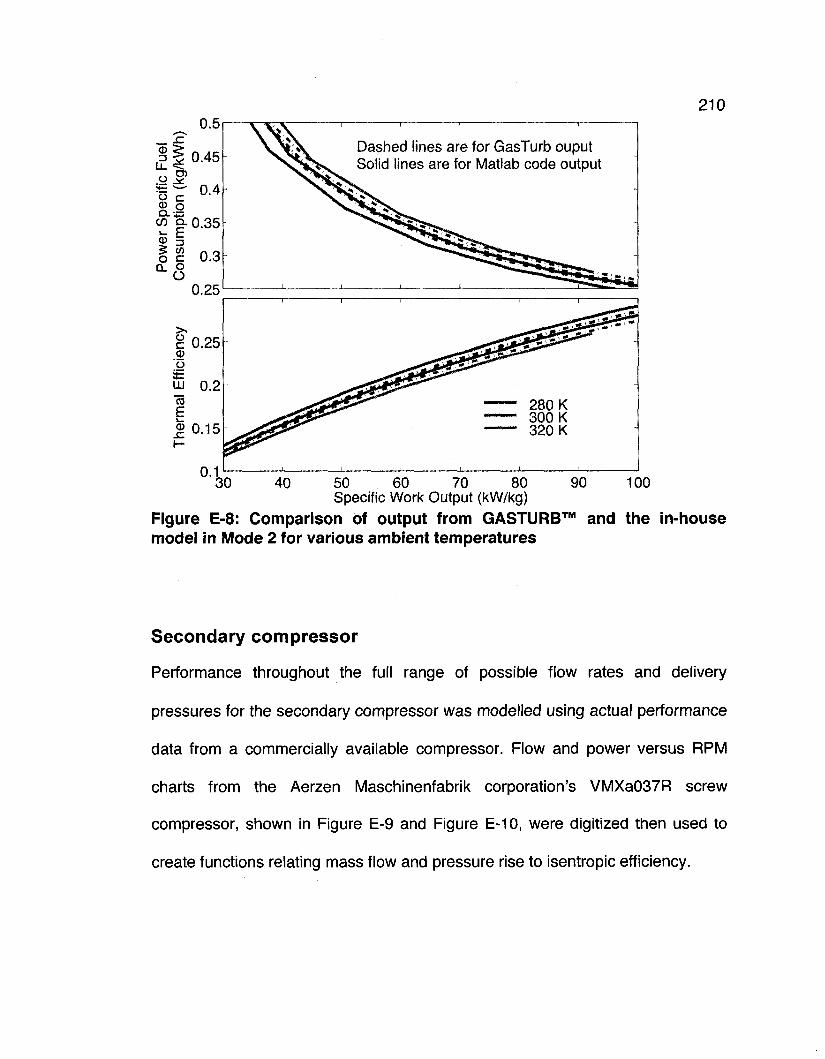
210
Specific Work Output (kW/kg) Figure E-8: Comparison of output from GASTURB™ and the in-house model in Mode 2 for various ambient temperatures
Secondary compressor
Performance throughout the full range of possible flow rates and delivery
pressures for the secondary compressor was modelled using actual performance
data from a commercially available compressor. Flow and power versus RPM
charts from the Aerzen Maschinenfabrik corporation's VMXa037R screw
compressor, shown in Figure E-9 and Figure E-10, were digitized then used to
create functions relating mass flow and pressure rise to isentropic efficiency.
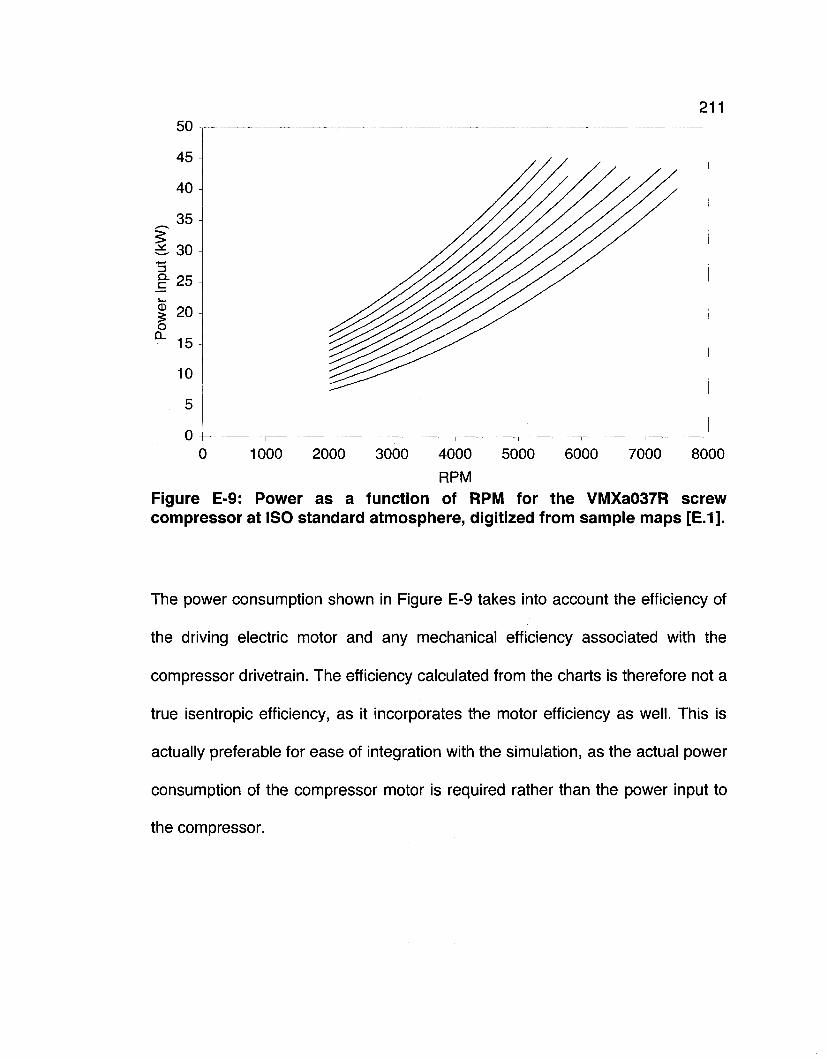
211
0 1000 2000 3000 4000 5000 6000 7000 8000
RPM Figure E-9: Power as a function of RPM for the VMXa037R screw compressor at ISO standard atmosphere, digitized from sample maps [E.1].
The power consumption shown in Figure E-9 takes into account the efficiency of
the driving electric motor and any mechanical efficiency associated with the
compressor drivetrain. The efficiency calculated from the charts is therefore not a
true isentropic efficiency, as it incorporates the motor efficiency as well. This is
actually preferable for ease of integration with the simulation, as the actual power
consumption of the compressor motor is required rather than the power input to
the compressor.
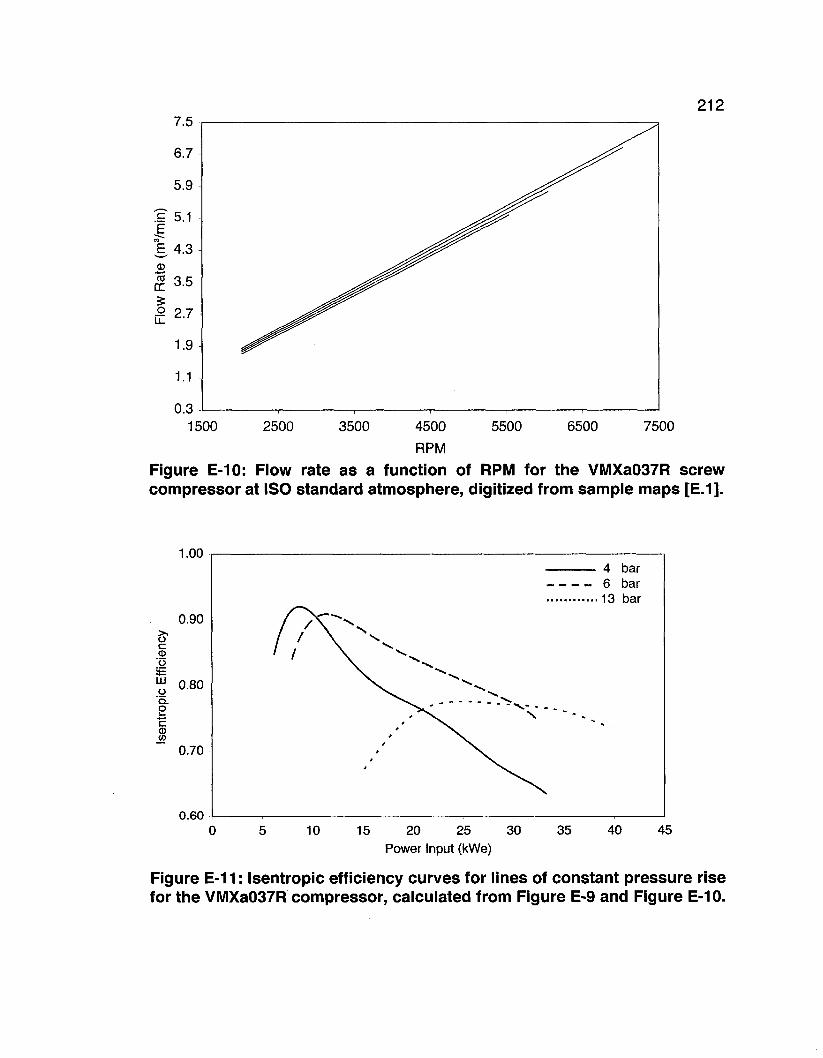
212
2500 7500
Figure E-10: Flow rate as a function of RPM for the VMXa037R screw compressor at ISO standard atmosphere, digitized from sample maps [E.1].
c © 'o i t LU g 'a. S +-•
c <D (/>
1.00
0.90
0.80
0.70
0.60
/ / / / ' /
\ "^
* ^ v
— — — —
- ..
4 6
• 13
-
bar bar bar
10 15 20 25 30 Power Input (kWe)
35 40 45
Figure E-11: Isentropic efficiency curves for lines of constant pressure rise for the VMXa037R compressor, calculated from Figure E-9 and Figure E-10.
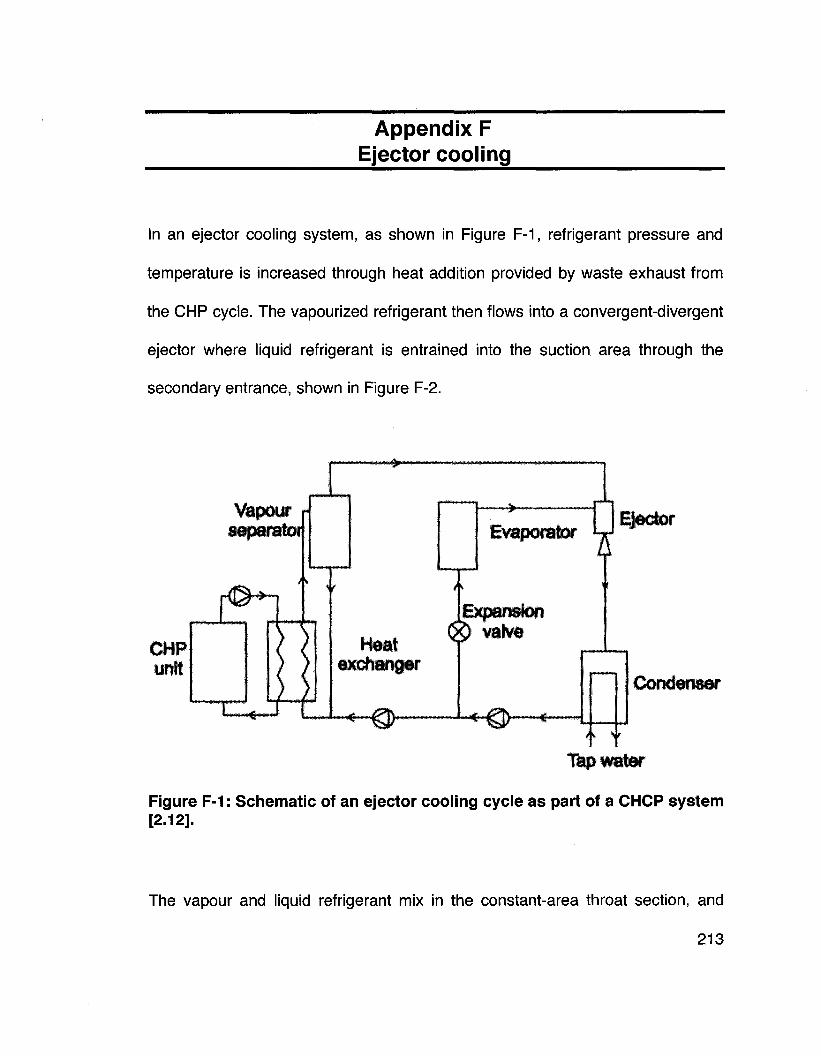
Appendix F Ejector cooling
In an ejector cooling system, as shown in Figure F-1, refrigerant pressure and
temperature is increased through heat addition provided by waste exhaust from
the CHP cycle. The vapourized refrigerant then flows into a convergent-divergent
ejector where liquid refrigerant is entrained into the suction area through the
secondary entrance, shown in Figure F-2.
Vapour separator!
Heat exchanaer
Evaporator
Expansion 0 vaJva
Condenser
f f Tap water
Figure F-1: Schematic of an ejector cooling cycle as part of a CHCP system [2.12].
The vapour and liquid refrigerant mix in the constant-area throat section, and
213
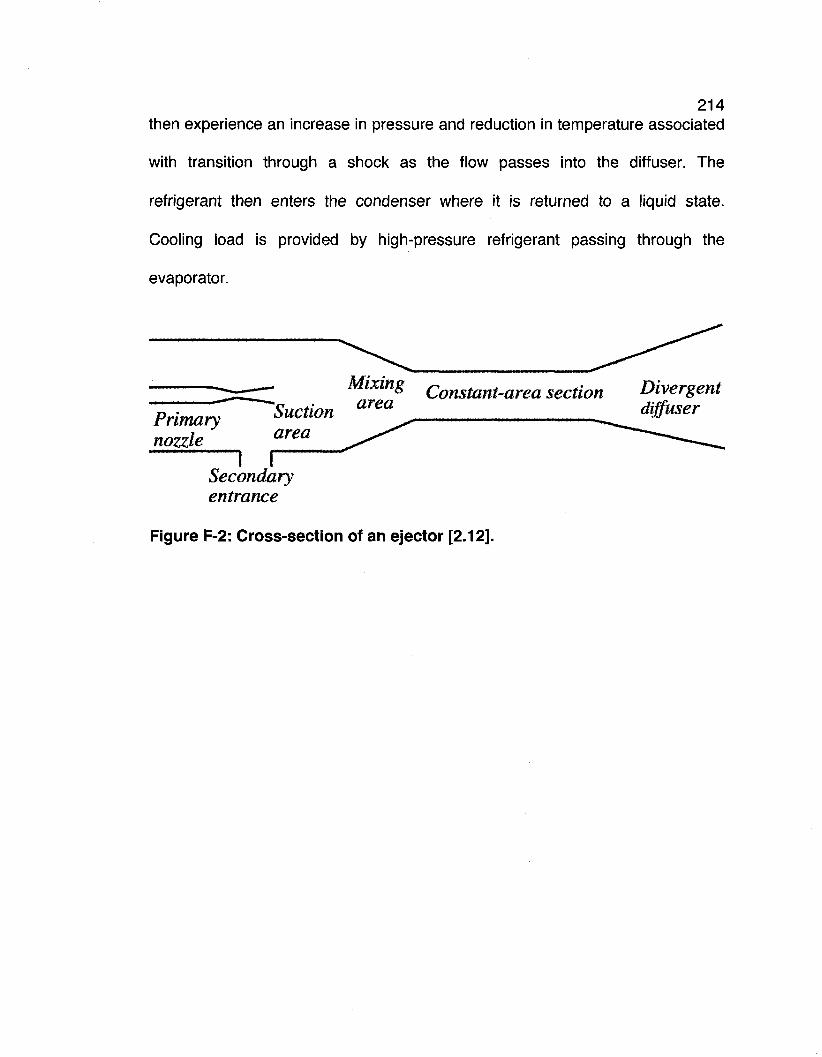
214 then experience an increase in pressure and reduction in temperature associated
with transition through a shock as the flow passes into the diffuser. The
refrigerant then enters the condenser where it is returned to a liquid state.
Cooling load is provided by high-pressure refrigerant passing through the
evaporator.
Primary nozzle
MMnS Constant-, Suction area
area area section Divergent
diffuser
i r Secondary entrance
Figure F-2: Cross-section of an ejector [2.12].
Related Documents