Journal of Academic and Applied Studies Vol. 3(2) February 2013, pp. 1-19 Available online @ www.academians.org ISSN1925-931X 1 Proposing an Effective Feature Extraction Model for EEG Signals to Enhance Quality of Hand’s Motion Detection Mehdi Hoodgar 1 , Mohammad Mehrani 2 , Amin mehranzadeh 1 , Faraz Forootan 1 1 Department of Computer Engineering, Dezful Branch, Islamic Azad University, Dezful, Iran 2 Department of Computer Engineering, Andimeshk Branch, Islamic Azad University, Andimeshk, Iran Abstract Electroencephalogram (EEG) is one of the useful methods in analysis and simulation of different organs of human body. Human hand motion detection is one of the interesting issues in robotic, computer vision and many other applications. One of the main problems in human hand motion detection is inaccuracy in classification of extracted features from EEG signals. Although many motion detection methods have been proposed and developed, many of them suffer from extracting less accurate data from EEG signals. This paper proposes an effective feature extraction model to enhance the quality of hand motion detection using a combination of obtained feature extraction parameters from autoregressive model, Hjorth parameters, fractional dimensions in time, frequency, and spatial domains. Furthermore, one-second Hamming window with half-second overlap is used for signal windowing. The Competition-III data set and mean absolute error of prediction method are used to evaluate the performance of the proposed method. The obtained results indicate that the proposed method shows more accuracy in feature classification when compared with the other hand motion detection methods. Keywords: Electroencephalogram (EEG), Signal Processing, Feature Extraction, Power Spectral Density (PSD), Fractal Dimension, Biomedical Signals. I. INTRODUCTION Human brain includes billions of nerve cells that make a large complex neural network. Every nerve in the human brain is connected to about 10,000 other nerves. EEG signal is a measure of electrical current during stimulation of synaptic dendrites flow in pyramidal nerves within cortex (Guyton, et al., 2006).The main categories of brain signals based on the frequency ranges, 0Hz-45Hz, are delta (δ), alpha (α), theta (θ), beta (β), and gamma (γ). EEG is a simple method of diagnosis of many injuries and neurological abnormalities within human body. EEG can be used as a powerful tool to control the intelligent rehabilitation systems (Sanei, et al. 2007 and Wozczowski, et al. 2010).Over the past decade, many efforts have been done to use the electroencephalogram (EEG) as a new communication channel between human brain and computer. This new communication channel is called brain–computer interface (BCI). A variety of BCI systems have been described in the literature mostly differing in the requested mental strategy and in the type of brain signal used for classification. Any BCI consists of some parts such as preprocessing, feature extraction, and classification. The preprocessing task includes monitoring and enhancing acquiring signals. In an invasive BCI, the signals are

Welcome message from author
This document is posted to help you gain knowledge. Please leave a comment to let me know what you think about it! Share it to your friends and learn new things together.
Transcript
Journal of Academic and Applied Studies
Vol. 3(2) February 2013, pp. 1-19
Available online @ www.academians.org
ISSN1925-931X
1
Proposing an Effective Feature Extraction Model
for EEG Signals to Enhance Quality of Hand’s
Motion Detection
Mehdi Hoodgar1, Mohammad Mehrani
2, Amin mehranzadeh
1, Faraz Forootan
1
1Department of Computer Engineering, Dezful Branch, Islamic Azad University, Dezful, Iran
2Department of Computer Engineering, Andimeshk Branch, Islamic Azad University, Andimeshk, Iran
Abstract Electroencephalogram (EEG) is one of the useful methods in analysis and simulation of different organs
of human body. Human hand motion detection is one of the interesting issues in robotic, computer vision
and many other applications. One of the main problems in human hand motion detection is inaccuracy in
classification of extracted features from EEG signals. Although many motion detection methods have
been proposed and developed, many of them suffer from extracting less accurate data from EEG signals.
This paper proposes an effective feature extraction model to enhance the quality of hand motion detection
using a combination of obtained feature extraction parameters from autoregressive model, Hjorth
parameters, fractional dimensions in time, frequency, and spatial domains. Furthermore, one-second
Hamming window with half-second overlap is used for signal windowing. The Competition-III data set
and mean absolute error of prediction method are used to evaluate the performance of the proposed
method. The obtained results indicate that the proposed method shows more accuracy in feature
classification when compared with the other hand motion detection methods.
Keywords: Electroencephalogram (EEG), Signal Processing, Feature Extraction, Power
Spectral Density (PSD), Fractal Dimension, Biomedical Signals.
I. INTRODUCTION
Human brain includes billions of nerve cells that make a large complex neural network. Every
nerve in the human brain is connected to about 10,000 other nerves. EEG signal is a measure of
electrical current during stimulation of synaptic dendrites flow in pyramidal nerves within
cortex (Guyton, et al., 2006).The main categories of brain signals based on the frequency ranges,
0Hz-45Hz, are delta (δ), alpha (α), theta (θ), beta (β), and gamma (γ). EEG is a simple method
of diagnosis of many injuries and neurological abnormalities within human body. EEG can be
used as a powerful tool to control the intelligent rehabilitation systems (Sanei, et al. 2007 and
Wozczowski, et al. 2010).Over the past decade, many efforts have been done to use the
electroencephalogram (EEG) as a new communication channel between human brain and
computer. This new communication channel is called brain–computer interface (BCI). A
variety of BCI systems have been described in the literature mostly differing in the requested
mental strategy and in the type of brain signal used for classification. Any BCI consists of some
parts such as preprocessing, feature extraction, and classification. The preprocessing task
includes monitoring and enhancing acquiring signals. In an invasive BCI, the signals are

Journal of Academic and Applied Studies
Vol. 3(2) February 2013, pp. 1-19
Available online @ www.academians.org
ISSN1925-931X
2
acquired from the scalp over. Signal processing is a key concept in brain computer
interface (BCI), which is used in feature extraction and pattern recognition areas. In BCI,
different types of EEGs can be used such as visual epoch potential (VEP) and event relate
potential (ERP).
The main advantages of VEP signals are high data transmission rate, short training time, and no
risk to patients (Sanei, et al. 2007). In based on VEP BCI, the low and medium frequency
ranges of EEG signal are obtained from stimulating an image, which is applied on subjects.
For detecting hand motion, the low frequency ranges from 5Hz to 12Hz, named µ band, and the
medium frequency ranges from 13Hz to 25Hz, named β band can be used as the best frequency
ranges (Schels, et al., 2013 and Xiao et al., 2009). The obtained Data from EEG signals and
extracted features are significant issues in analyzing the human biological information.
The brain signals are stochastic and transient that result in inaccuracy of information obtained
from these signals. Many signal processing methods such as ARMA, FD, Hjorith parameter,
FFT, and PSD have been proposed in time and frequency domains, individually, to overcome
the inaccuracy of EEG signals. According to the Heisenberg uncertainty principle, the accuracy
of measurement cannot be enhanced in both time and frequency domains, simultaneously. In
other words, increasing accuracy in time domain leads to reduced accuracy of frequency
domain, and vise versa. Using a combination of features in time and frequency domains may
result in producing more accurate results, when compared to using features in each domain,
separately. This paper proposes an effective feature extraction model in time and frequency
domains to improve the accuracy of signals.The proposed method in (Sun, S., et al. 2006)
focuses on a problem about classifying time-varying Electroencephalographic (EEG) signals in
the feature extractors field such that it proposes a kind of adaptive feature extractor named
Adaptive Common Spatial Patterns (ACSP).
Multi-class Common Spatial Patterns (CSP) tries to extract features related to the current brain
states using signal covariance that have been updated by weighing process. The effectiveness
of the proposed adaptive feature extractor can be evaluated when a Support Vector Machine
(SVM) classifier is applied for simulating of EEG signal classification. The idea mentioned in
(Sun, S., et al. 2006) updates feature extractors to solve adaptive learning problem in EEG signal
classification. The basic feature extraction strategy is CSP. CSP may not work correctly due to
the problems of inherent variability of EEG patterns, so Adaptive Common Spatial Patterns
(ACSP) would be presented instead of CSP. Actually, CSP feature extractor can be assumed as
a linear spatial filter that results in optimal discrimination between two existed conditions.
The mentioned operation is based upon a decomposition of the raw multi-channel signals into
spatial patterns. To achieve at this, the author added one versus the rest (OVR) technique to
CSP. In (Sun, S., et al. 2006) after signal acquisition, a band-pass filter is applied to separate the
mu rhythm frequency range from the signal. Then, the signal segmentation occurs based on
one-second window with a half a second overlap. After that, the features are classified by
applying SVM classifier with Radial Basis Function (RBF) kernel. Using the so-called method
leads to 65.12% classification accuracy for author.
In (Xu, et al. 2004) for detecting the movement of right and left hand fingers a high accuracy
EEG signal classification method has been proposed by employing single trial EEG signal. In
this research after signal acquisition, a band-pass filter is applied to separate the mu rhythm
frequency range from the signal. Then, a combination of CSP and Principle Component
Analysis (PCA) has been used for feature extraction. Then Orthogonal Least Square (OLS)

Journal of Academic and Applied Studies
Vol. 3(2) February 2013, pp. 1-19
Available online @ www.academians.org
ISSN1925-931X
3
algorithm has been used for enhancing the process of key features selection. After that, the
features have been classified by applying SVM classifier with Radial Basis Function (RBF)
kernel. Using the so-called method leads to 90% classification accuracy. Ref (Leeb, et al. 2004)
introduces a problem named "feasibility of walking through a virtual city by using motor
imagery". In order to solve the problem an EEG based BCI was combined with Virtual Reality
technology. In (Leeb, et al. 2004), signal acquisition is performed by three bipolar EEG
channels C3, Cz and C4 based on visual stimulation of subject. The stimulation process begins
by showing a cursor at the center of the display and then moving the cursor to the right or
downwards. To imagine the movement of a hand or foot, the subject is instructed by applying
an acoustic affiliation and visual cue. Most BCI experiments are based on relatively simple
feedback scenario, e.g. a bar or a ball moving left / right or upwards / downwards. Then by
using a band-pass filter frequency, range between 0.5Hz-30Hz, was separated from raw signal.
For removing 50Hz noise, a notch filter was applied to the signal.
Furthermore, feature extraction was performed by calculating logarithmic band power of 1-
second windows of EEG signal and these features were classified by a Linear Discriminate
Analysis (LDA). Gained result of this research shows that detecting the hand movement by
using EEG channels C3, Cz and C4 is better than detecting the foot movement, and detecting
the foot movement (such as standing, setting, moving) needs more EEG channels. In
(Bashashati, et al., 2007a) one self-paced (asynchronous) BCI for detecting the hand movement
has been proposed. The capability of this system is its ability to distinguish two separate groups
of brain activities. In (Bashashati, et al., 2007a) the system performances have been evaluated
based on two kinds of different inputs (mono-polar and bipolar electrodes). The results
demonstrate that bipolar electrodes have better functionality. In the so-called research, 15 mono
polar electrodes have been embedded that were based on international standard 10-20 on the
sensory motor domain of the brain. The moving related potentials were used as the features,
which can control the self-paced states. For feature extraction and analysis of this feature a
composed method has been performed. The performance of the so-described method is 54.7%
for the rate of movement detection and 70.25% for left and right hands detection. In
(Bashashati, et al., 2007b) author was following his previous work (Bashashati, et al., 2007a) to
enhance hand movement detection. To reach this purpose, the extracted futures should be
combined with the previous features. Using this strategy led to 55.9 % increasing in the rate of
movement detection. In addition, left and right hands detection showed 72.5% increasing in
the system overview which can be seen in the following figure. In (Lemm, S. 2007a and Lemm,
et al. 2004b and Burmeister, et al 2007 and Pei, et al. 2006 and Parini, et al. 2009 and
Hinterberger, et al. 2004) the EEG signals are acquiesced from C3 and C4 bipolar electrodes
that have been embedded over the sensory motor domain of the brain based on international
standard 10-20. These signals have been sampled by 125 Hz frequency then a band-pass filter
has separated their 0.5 Hz to 30 Hz ranges. Besides, a notch filter has removed the 50 Hz
distribution. Signal windowing has been performed as one-second length hamming or hanning
windows and 50% overlap. in (Lemm, S. 2007a and Burmeister, et al 2007), the mu and beta
bands have been separated through a Morlet Wavelet filter. For feature extraction, the multi
variant normal distribution of samples has been calculated. Furthermore, for each time-sample,
upper band of Bayes error for two statistical models was assumed. Based on this process a
weighting function has been proposed as follow:

Journal of Academic and Applied Studies
Vol. 3(2) February 2013, pp. 1-19
Available online @ www.academians.org
ISSN1925-931X
4
(1) w(t) = 0.5 - Bayes error(t)
For feature extraction, all the pervious samples have been considered, meaning that:
(2) p_t(left|x) = P_t(x_t|left) / P_t(x_t|left) + P_t(x_t|right) ,
D_T(left|x_1, ..., x_T) = (sum_{t<=T} w(t) p_t(left|x_t)) / (sum_{t<=T} w(t)
The negative and positive amounts show the left and right hands respectively.
Also, the results would be reversed using the following relation:
(3) D'_T = 0.5 - D_T
The calculated domain based on (3) results an accurate factor for decision making. In
(Burmeister, et al 2007), the bands alfa and beta, between 0.5 Hz to 30 Hz range, have been
separated by applying a 5th
order squared Batrouth filter. Also, band power (BP) rate and
differential BP were calculated as the features for each segment. For feature selection process,
the multi variant analysis method (MANOVA) was used to select better features. Finally, SVM
classifier and LDA have processed results. The results are shown in the Table 3. In (Pei, et al.,
2006), the FFT coefficients were calculated from one-second hanning window. Finally, feature
classification was performed by fisher distance analysis. The results are shown in Table 5.
In (Parini, et al. 2009), mu and beta bands were separated through both the shifting Cauer
Elliptic Filter and a Band-Power analysis on a LDA-based (Linear Discriminate Analysis)
classifier. For feature extraction, the 4th
order AR parameters were applied by Bourg and PSD
methods in a one-second window. Finally, classification was performed by LDA algorithm
(Table 3).
In (Hinterberger, et al. 2004), for feature extraction, a statistical method selects subject-
specified scales of the complex Morlet wavelet, transforms the EEG data with the complex
Morlet wavelet on the selected scale and calculates the squared wavelet coefficient as the
element of the following feature vector. Finally, feature classification was performed by SVM
classifier. The results are shown in Table 5.
II. METHODS
A. Brain Computer Interfaces (BCIs) Review
BCI systems based on their functionality can be separated into some different categories. An
example those who are based on spontaneous EEG components that are independent from
sensory events. These categories can include slow cortical potentials (Hinterberger, et al. 2004
and Fabiani, et al. 2004), mu and/or beta rhythms (Krusienski, et al. 2007 and Pfurtscheller, et
al. 2000), and features extracted from the spontaneous EEG (Yom, et al. 2002 and Borisoff, et
al. 2004 and Dornhege, et al. 2006 and Farwell, et al. 1988). Despite this mentioned category
there is another one, which includes some other BCI systems like visual event-related potential
(VERP) (Rakotomamonjy, et al. 2008 and Serby, et al. 2005 and Middendorf, et al. 2000).
P300 is an example of VERP. These categories are dependent on the response given to an
external stimulus in the visual form.
As mentioned in (Wang, et al. 2007 and Friman, et al. 2007 and Hazrati, et al. 2010) the steady-
state visual evoked potential (SSVEP) is another BCI that has same functionality. SSVEP is

Journal of Academic and Applied Studies
Vol. 3(2) February 2013, pp. 1-19
Available online @ www.academians.org
ISSN1925-931X
5
defined as a periodic response that is given to a repeating visual stimulation. The strategy in
this method: object focuses on a stimulus and then its EEG activity would be sensed. For
example, the references (Muller-Putz, et al. 2005 and Pfurtscheller, et al. 2005) used this
method for foot and left hand motion detections. One of the interested fields on BCI is to use
the mental tasks for imagination. The functional structure of different objects can be different
when controlled by the BCI (Muller-Putz, et al. 2005 and Pfurtscheller, et al. 2005 and
Hwang,et al. 2009 and Leeb, et al. 2007), therefore, the object’s mental task should be
consistent with BCI system functionality. Subject training and classification training are two
important challenges in this matter. To solve the so-called problem in lots of online BCI
systems, offline training is done on the data obtained in the experiment step, then in later step
the subject’s feedbacks would be added to the system (Wang, et al. 2007 and Leeb, et al. 2007
and Blankertz, et al. 2008 and Wozczowski, et al. 2010 and Dezhong,et al. 2004 and Hwang, et
al. 2009).
B. EEG Signal Processing
The EEG research has always been focusing by the researchers continuously, which backs to
almost seven centuries ago and includes some case studies like the computational, experimental
and clinical to be performed in the matters like discovery, recognition, diagnosis of
neurological and physiological brain abnormalities central nervous system (CNS) of human.
Two kinds of invasively and noninvasively recordation have been applied for EEG.
C. Subjects and EEG recording
In this research dataset of BCI competition 2003 are used. This dataset produced by Graz
University of Technology, which included three subjects: O3, X11 and S4.
EEG-data from three different subjects during a BCI experiment. The experiment consists of 3
sessions for each subject. Each session consists of 4 to 9 runs. The recordings were made with a
bipolar EEG amplifier from g.tec. The EEG was sampled with 125 Hz, which for remove noise
it was filtered between 0.5 and 30Hz with Notch filter. The subject sat in a relaxing chair with
armrests. The task was to perform imagery left hand, right hand, foot or tongue movements
according to a cue.
Figure1: Basket paradigm used for S4 and X11 [48].
The order of cues was random. The experiment consists of several runs (>= 6) with 40 trials
each after each. After trial begin the first 2s were quite, at t=3s an acoustic stimulus indicated
the beginning of the trial, and a cross “+” is displayed. From t=3s an arrow to the left, right, up
or down was displayed for 1s. at the same time the subject was asked to imagine a left hand,
right hand, respectively, until the cross disappeared at t=8s (Figure1). Each of the 4 cues was
displayed 10 times within each run in a randomized order(Figure2) (Schlogl, A., et al. 2005-
2008). The brief of paradigm observe on table1.

Journal of Academic and Applied Studies
Vol. 3(2) February 2013, pp. 1-19
Available online @ www.academians.org
ISSN1925-931X
6
Figure2.(a) Timing scheme of the paradigm for recording O3 dataset; (b) electrode montage for electrodes used to
derive bipolar channels c3, cz and c4 (based on 10-20 system). (Schlogl, A., et al. 2005-2008).
Table1.The brief of paradigm of construction the dataset.
D. Data collection and feature extraction
In the frequency domain when a signal is processed by tools such as Fourier transform,
although the frequency components are determined but occurrence time of them remains
ambiguous (Hwang, et al. 2009). In the biological signals viewpoint the certain frequencies at
different times have different meanings. This leads biological signals processing using time-
frequency domain changeovers. However, the calculations of time-frequency domain
changeovers have high complexity. In this article, we use advantages of both the time and
frequency domains. Feature extraction is done by applying precision tools of the two areas,
simultaneously. Finally, the quality of feature extraction in the two areas together is gone up,
eventually feature vector composed of the time and frequency characteristics are calculated in
(Xiao, et al. 2009).
EEG signals are unstable and have a random nature. The EEG signal feature has to include all
the signal properties that could analyze the component and behaviors of the signal. This paper
focuses on extracting feature parameters of signal such as Hjorth (activity, movement,
complexity), Fractal Dimensions (FD) in the time domain, PSD signal analysis and ARMA
model coefficients in the frequency domain.
E. Autoregressive Moving Average (ARMA) model
Data Set Feedback
Feedback
presentation
Channels # of Trials
Classes
O3 Virtual reality 4-8s C3, C4 640 Left-Right
S4 Basket, adaptive
classifier 4-7s C3, C4 1080 Left-Right
X11 Basket, adaptive
classifier 4-7s C3, C4 1080 Left-Right

Journal of Academic and Applied Studies
Vol. 3(2) February 2013, pp. 1-19
Available online @ www.academians.org
ISSN1925-931X
7
Parametric spectrum estimation methods based on modeling the ARMA or AR have higher
efficiency than the discrete Fourier transform (DFT). AR is able to present an exact expression
of a frequency domain signal characteristics. AR may have problems to estimate the models
parameters when the measured signal has limited length. For example, modeling EEGs by
using an AR model needs accurate values for prediction order and coefficients. High prediction
order cannot split the true peaks in the frequency spectrum and low prediction order causes to
combining near peaks in frequency domain. AR modeling has usages, because it presents a
higher and more accurate spectral resolution analysis (Hwang, et al. 2009).
AR modeling measures every sample of single-channel EEG by defining a linear relation with
some of previous samples, as follows:
(4)
In (4), ak, k = 1, 2. . . p, is the linear parameters while n defines the discrete sample time
normalized to unity and X(n) shows the noise. Achieving at samples in an autoregressive
moving average (ARMA) linear predictive model can be performed based on some of previous
input and output sample values, i.e.
(5)
In (5), bk, k = 1, 2, . . . , q, shows the additional linear parameters while the model orders by
using parameters p and q can be described.
Finding out the order of the proper model of a measurement signal can be performed by using
the Akaike criterion. This can be done by minimizing the following equation (Akaike 1974) and
considering the model order:
(6)
In (6), i and j represent AR and MA (moving average) model prediction orders, respectively, N
is the number of signal samples and 𝜎𝑖𝑗2 represents the noise power of ARMA model in i and j
stage. Error prediction in AR model for mth frame would be defined easily:
(7)
In (7), p is the prediction order and ak(m), k = 1, 2, . . . , p, are prediction coefficients. For certain p
the coefficients can be found directly (e.g., Durbin's method) in such a way as to minimize the
error (residual) signal energy.
This approach assumes the frames of length N has overlapped with one sample. The prediction
coefficients estimated for the (m-1)th frame are then used to predict the first sample in the mth
frame, ê(1, m). If this error is small then this means the statistics of mth frame are similar to (m-
1)th frame. For an AR model of the signal x(n) the error or driving signal is considered to be
)()()( nXKnyany K
p
K
q
K
KK KnxbKnyany
1 0
)()()(
)(2)ln(),( 2 jiNjiAIC ij
p
k
k mknxmamnxmne1
),()(),(),(

Journal of Academic and Applied Studies
Vol. 3(2) February 2013, pp. 1-19
Available online @ www.academians.org
ISSN1925-931X
8
zero mean white noise, by applying z-transform to the previous formula (7) that removes the
index m and replaying z with je leads:
(8)
In (8), E(ω) = Kω (constant) is the power spectrum of white noise and Xp(ω) is used to indentify
the power spectrum. So,
(9)
Also in (9), the parameters Kω, ak, k = 1, . . . , p, are the exact values. In empirical based AR
estimation modeling the measurement is performed based on a finite length; as the result
spectrum estimation will degrade.
F. Fractal Dimensions
In fractional geometry, fractional dimensions (D for short), are statistical quality that show the
way space filling is done by a fractional amount (Esteller, et al. 2001 and Sevcik 2006)
Calculating D in the Box-Counting Dimension (BCD) is as following:
𝐷 = lim𝜀→∞
log(𝑀 𝜀 )
log(1𝜀
) (10)
In this formula, ε is the cell size, and M(ε) is the number of cells.
In this research, calculating the fractional dimensions for a wave is performed using Sevcik's
method (Sevcik, 2006) as follows:
a) first, wave is normalized to 1(Figure3).
(11)
In the entire formula the highest and lowest amplitudes of the signal are denoted by xmax and
xmin , respectively. So, the waveform’s approaching FD is calculated as following:
b) FD Calculation: (12)
In (12), L is length of the normalized curve that is calculated by Euclidean distance, which is
defined as follows:
L = (x∗ n − x∗ n − 1 )2 + n∗ − n − 1 ∗ 2
N
n=2
(13)
p
k
jk
k
p
eaE
X
`1
1
)(
)(
p
k
jk
k
p
ea
KX
`1
)(
* * min
max min
,x xn
n xN x x
ln1
ln, 1
2
LFD
MM N

Journal of Academic and Applied Studies
Vol. 3(2) February 2013, pp. 1-19
Available online @ www.academians.org
ISSN1925-931X
9
Figure3. normalizing signal to one (amplitude and time).
G. Hjorth parameters
In fact, Hjorth parameters measure the below values (Boostani, et al. 2004 and Hjorth 1970 and
Ansari-Asl et al.2009):
1. Signal variance x[n] (activity)
(14)
2. Signal mel-frequency (mobility)
(15)
3. Complexity is measured as the deviation from the sine wave.
(16)
H. PSD Analysis
PSD describes how to the power of a signal or time series distribute with frequency. Power in
some case is physical power but on the other case, as a simple abstract, signal is defined as the
squared value of the signal. This instantaneous power (the mean or expected value of the
average power) is then given by (Oppenheim,et al. 1997):
P(t) = s(t)2 (17) Where s(t) is signal.
Fourier transform is not available in this case because a signal with squared nonzero average
power is not square integrable. In this case, the Winning-Kinchin theorem is a good alternative.
As mentioned in ( Brown, et al. 1983).PSD would be the Fourier transform of autocorrelation
function of the signal R(t) when the signal is a wide–sense stationary random process.
S t = R t e−2πifτdτ = F(R τ )+∞
−∞
(18)
The ensemble average of the average periodogram as average time interval approaches infinity
(T→∞ ) can be proved ( Shalev-Shwartz, et al. 2007) to approach the Power Spectral Density
(PSD).
E |F fT t |2
T → S(f) (19)
The signal power in a frequency band can be calculate by integrating over positive and negative
frequencies,
0 200 400 600 800 1000 -3 -2 -1 0 1 2 3 4
0
0.5 1
0.5
1
2
1
N
nx n x
Activity xN
var, is the derivative of
var
xMobility x x x
x
Mobility xComplexity x
Mobility x

Journal of Academic and Applied Studies
Vol. 3(2) February 2013, pp. 1-19
Available online @ www.academians.org
ISSN1925-931X
10
P = S f dfF2
F1
+ S f df−F1
−F2
(20)
The power spectrum G(f) is determined:
G f = S f ′ df′f
−∞
(21)
The calculated parameters include three extracted Hjorth elements, seven elements of
ARMA(6) model coefficients, nine elements of FD and 35 elements of the PSD analysis that
totally form a feature vector which includes 54 element. As the result, the processing creates data set matrixes with dimensions of 54 * 2226 for O3 data
set and 54 * 4539 for S4 and X11.Considering the small space of gained state space, in the next
section we are seeing calculation results with the lowest classification error. The computing
feature vectors are evaluated by using ranking algorithms. Because it ensures the quality and
influences them in classification process and the following results is gained (table2).
Table2. Evaluation of selected features
Number Feature Search type Algorithm
9 30,36,37,38,39,40,43,50,51 Best first CfsSubsetEval1
54 38,39,36,37,43,40,49,50,44,48,46,45,42,47,41,51,30,29,31,7,3,28,32,2,27,26,4,5,25,8,54,6,11,
10,13,12,52,53,9,1,23,21,22,34,33,24,35,16,14,15,19,20,17,18 Ranking Filter Chi-squared2
25 1,2,3,4,5,6,7,8,9,10,11,12,13,14,15,16,17,18,19,20,21,22,23,24,25 Attribute ranking Principal Components
Attribute Transformer3
I. Classification
Different classification algorithms like SVM, Bayeisan and MLP are used independently and in
combinational way to classify data. In this paper, different algorithms with different approaches
for feature classification have been used to prove the quality of feature extraction which uses
feature vector includes time and frequency domains feature simultaneously considering spatial
domain. Comparison to the previous works shows Significant improvements in the results
which will be presented in the next section as the analytical results.
The characteristics of the some algorithms that used to test the feature space in this paper listed
in Table3.
1 Evaluates the worth of a subset of attributes by considering the individual predictive ability of each feature along
with the degree of redundancy between them. 2 Evaluates the worth of an attribute by computing the value of the chi-squared statistic with respect to the class.
3 Performs a principal components analysis and transformation of the data. Use in conjunction with a Ranker
search.

Journal of Academic and Applied Studies
Vol. 3(2) February 2013, pp. 1-19
Available online @ www.academians.org
ISSN1925-931X
11
Table3. Brief of classification algorithm feature.
Description Feature Algorithm
Gaussian and Laplace Priors
Hyper parameter range= 0.01-3.16 , selection hyper parameter=NORM-
BASED, Hyper parameter value=0.27, NumIteration=100, Threshold =0.5
Bayesian Logistic
Regression
Discriminative Multinomial Naive Bayes Binaryword=true, NumIteration=1 DMNBtext
Naive Bayes classifier KernelEstimator = normal distribution. Naive Bayes
normalized Gaussian radial basis function network (It uses the k-means clustering
algorithm to provide the basis functions
and learns either a linear regression
clusteringSeed=1, maxIts= -1, minStdDev= 0.1, numClusters=2,
ridge=1.0E-8 RBFNetwork
Build linear logistic regression models.
LogitBoost with simple regression functions as base learners is used for
fitting the logistic models
heuristicStop=50, maxBoostingIterations= 500,
numBoostingIterations= 0, useAIC=False , useCrossValidation=True ,
weightTrimBeta= 0.
SimpleLogistic
c-svc,nu-svc Cashe size=40, Coef0=0, Cost=1, Degree=3, Epsilon=0.0010,
Gamma=0.0, Kernel= RBF and Sigmoid, Loss=0.1, Nu=0.5 Libsvm
Implements John Platt's sequential
minimal optimization algorithm for
training a support vector classifier.
buildLogisticModels=False, c=1.0, checksTurnedOff=false, epsilon=
1.0E-12, filterType=Normalized training data , kernel= polynomial kernel : K(x, y) = <x, y>^p, numFolds=-1 (training data are used),
randomSeed=1, toleranceParameter= 0.0010 .
SMO
backpropagation to classify instances Hidden-layer= 6, Learningrate= 0.3, Momentum= 0.2, Trainingtime=
500, Validationsetsize=0, Validationthershold= 20 Multilayerperceptron
Implements the stochastic variant of the Pegasos (Primal Estimated sub-Gradient
Solver for SVM) method of Shalev-
Shwartz et al[49].
dontNormalize=false, dontReplaceMissing=false, epochs=500,
lambda= 0.0001, lossFunction= Hinge loss (SVM) SPegasos
Implementation of the voted perceptron
algorithm by Freund and Schapire [50]. Exponent=1.0, maxK=10000, numIterations=1 , seed=1 VotedPerceptron
Nearest-neighbour classifier
Uses normalized Euclidean distance to find the training instance closest to the given test instance, and predicts the same class as this training
instance. If multiple instances have the same (smallest) distance to the
test instance, the first one found is used.
LB1
K-nearest neighbours classifier
KNN =3, crossValidate=false, distanceWeighting=1/distance,
meanSquared=true, nearestNeighbourSearchAlgorithm= LinearNNSearch, windowSize=0
LBK
K* is an instance-based classifier, that is
the class of a test instance is based upon
the class of those training instances similar to it, as determined by some
similarity function.
entropicAutoBlend=true, globalBlend=20, missingMode=Avreage
column entropy curves KStar
III. RESULTS

Journal of Academic and Applied Studies
Vol. 3(2) February 2013, pp. 1-19
Available online @ www.academians.org
ISSN1925-931X
12
In the classification section, a few algorithms with different principals are used and results are
compared to each other based on MAE4 parameters and training time; these results are briefly
mentioned in table4, table5, Figure4, Figure5, and Figure6.
Figure4. Comparison of different algorithms on feature space based on MAE
4 Mean absolute error
00.10.20.30.40.50.6
MAE
s4
00.05
0.10.15
0.20.25
0.30.35
MAE
x11
00.05
0.10.15
0.20.25
0.30.35
MAE
o3

Journal of Academic and Applied Studies
Vol. 3(2) February 2013, pp. 1-19
Available online @ www.academians.org
ISSN1925-931X
13
Figure5. Comparison of different algorithms applied on the feature space based on training time
The obtained results are compared with the results mentioned in some other papers. Results of
previous researches and average performance of this paper are briefly shown table4 and
Figure6.
1
20
400
Bay
sian
Logi
stic
Reg…
Nav
eBay
es
DM
NB
text
C-S
VC
(RB
F)
nu
-SV
C(R
BF)
C-S
VC
(sig
mo
id)
nu
-SV
C(s
igm
oid
)
RB
F n
etw
ork
sim
ple
logi
stic
SMO
SPEG
ASO
S
Vo
ted
Per
cep
tro
n
Mu
lti L
ayer
…
IB1
IBK
Kst
ar
LWL
AD
AB
oo
st
Cla
ssif
icat
ion
via
…
Rac
ed In
crem
nta
l …
Hyp
erP
ipe
VFI
Sin
gle
Co
nju
nct
ive…
Dec
isio
nTa
ble
Nn
ge(5
)
FUR
IA
OLM J4
8
LMT
Ran
do
m F
ore
st
Sim
ple
Car
t
REP
Tree
TIME(sec)
x11
1
20
400
Bay
sian
Logi
stic
Reg…
Nav
eBay
es
DM
NB
text
C-S
VC
(RB
F)
nu
-SV
C(R
BF)
C-S
VC
(sig
mo
id)
nu
-SV
C(s
igm
oid
)
RB
F n
etw
ork
sim
ple
logi
stic
SMO
SPEG
ASO
S
Vo
ted
Per
cep
tro
n
Mu
lti L
ayer
…
IB1
IBK
Kst
ar
LWL
AD
AB
oo
st
Cla
ssif
icat
ion
via
…
Rac
ed In
crem
nta
l …
Hyp
erP
ipe
VFI
Sin
gle
Co
nju
nct
ive…
Dec
isio
nTa
ble
Nn
ge(5
)
FUR
IA
OLM J4
8
LMT
Ran
do
m F
ore
st
Sim
ple
Car
t
REP
Tree
TIME(sec)
s4
1
20
400
Bay
sian
Logi
stic
Reg…
Nav
eBay
es
DM
NB
text
C-S
VC
(RB
F)
nu
-SV
C(R
BF)
C-S
VC
(sig
mo
id)
nu
-SV
C(s
igm
oid
)
RB
F n
etw
ork
sim
ple
logi
stic
SMO
SPEG
ASO
S
Vo
ted
Pe
rce
ptr
on
Mu
lti L
ayer
…
IB1
IBK
Kst
ar
LWL
AD
AB
oo
st
Cla
ssif
icat
ion
via
…
Rac
ed In
crem
nta
l …
Hyp
erP
ipe
VFI
Sin
gleC
on
jun
ctiv
e…
Dec
isio
nTa
ble
Nn
ge(5
)
FUR
IA
OLM J4
8
LMT
Ran
do
m F
ore
st
Sim
ple
Car
t
REP
Tree
TIME(sec)
o3
Journal of Academic and Applied Studies
Vol. 3(2) February 2013, pp. 1-19
Available online @ www.academians.org
ISSN1925-931X
14
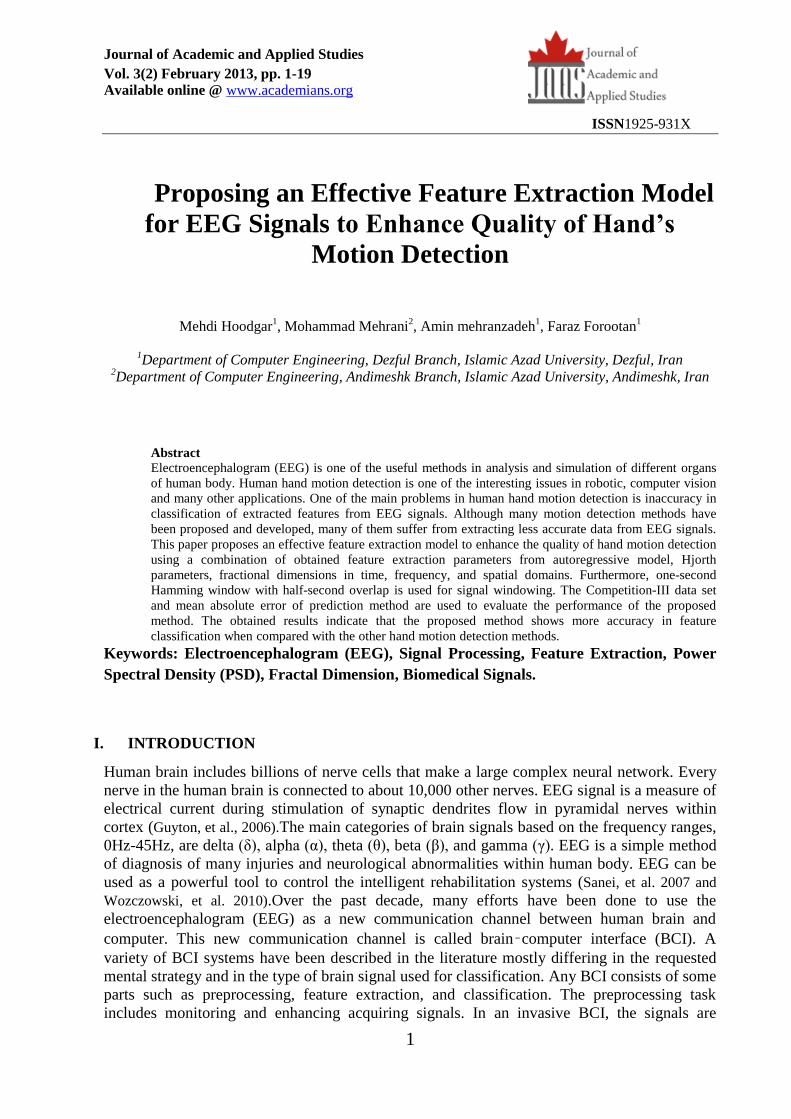
Table4. Results of previous researches on the used data sets by this paper based on MAE and average of
proposed method
Designer O3 S4 X11 Feature extraction method Algorithm
S. Lemm[16] 0.1698 0.4382 0.3489 multi-variant normal distribution Statical classifier
O. Burmeister[16] 0.1626 0.4174 0.1719 Band power SVM
Xiaomei Pei[16] 0.2030 0.0936 0.1173 FFT Fisher's distance
analysis
S. Parini[16] 0.1153 0.1218 0.1181 4th order PSD and AR model LDA
Dezhong Yao[16] 0.1184 0.1516 0.0612 Band power SVM
Average of proposed
method 0.0965 0.0811 0.0781 ARMA(6), PSD, FD, Hjorth parameter
Multiple algorithm
Show in figure [3]
Figure6. Comparison of previous results with the proposed method
00.10.20.30.40.5
S. Lemm O. Burmeister Xiaomei Pei S. Parini Dezhong Yao Average of proposed method
MAE
S4
00.10.20.3
S. Lemm O. Burmeister Xiaomei Pei S. Parini Dezhong Yao Average of proposed method
MAE
O3
0
0.2
0.4
S. Lemm O. Burmeister Xiaomei Pei S. Parini Dezhong Yao Average of proposed method
MAE
X11

Journal of Academic and Applied Studies
Vol. 3(2) February 2013, pp. 1-19
Available online @ www.academians.org
ISSN1925-931X
15
Comparing the results with the results of previous works based on MAE, shows the reduced
error percent and the increased overall accuracy of the system.
Considering the used features and comparing them to the selected features of other works this
can be understood that the frequency features have better performance, but this should be said
that event time in EEG signals is very crucial and important, so event time shouldn’t be
neglected. Based on the research results using both the time and frequency features – together –
have better performance.
The main reason of error reduction is the length of feature vector and kind of used features in
the proposed method because it reduces the chance of likeness of features extracted from
signals gives us this ability to do classification in different classes.
Although the previous methods used the combinational features, but they just used one of the
time-domain or frequency-domain for feature extraction. In such cases, as discussed in the
previous section, because of high variability of EEG signals on time using time domain features
would not be of enough accuracy. In addition, because of getting extreme affect of noise from
the internal and external sources, presenting an accurate analysis in the time or frequency
domain cannot be done because the extracted features from signal do not determine its behavior
as well and may lose their credibility.
The recent researches almost never used time, frequency and spatial domains at the same time.
However, because of the entity of stochastic EEG signals and their constant pattern this would
be better to estimate them in the three mentioned domains simultaneously. This research
considered the three mentioned domains: the fractal dimensions and HJORTH pay attention to
the signal pattern in the time domain but because of the occurrence time importance of an EEG
signal this is necessary to estimate its events from time viewpoint so the time series of events
has been analyzed by autoregressive component (6); frequency components – that can be very
useful in the hands motion detection- are considered by PSD features. Because of the sensors
position in the left and right lateral lobes in sensory motor area of brain (C3, C4) the spatial
domain is considered.
As a result, combining these features on most of times shows at least 20 percent improving in
the examination results comparing to recent works. This performance demonstrates the good
functionality of the proposed method.
The words must be said are the convergence speed of the proposed method - because of the
used features - is good. According to the shown tables, the proposed method assumes a short
training time in the most of examinations whether in the linear classification algorithms over
the Gaussian and Heuristic algorithms.

Journal of Academic and Applied Studies
Vol. 3(2) February 2013, pp. 1-19
Available online @ www.academians.org
ISSN1925-931X
16
Selecting such characteristics makes long length feature vectors, but should keep in mind that
such selection increases the quality of decision making. The higher accuracy of decisions
increases the performance in the real world. However, some methods can be applied to reduce
complexity and speed up the system, which are presented in the suggestion section.
Making fast and right decisions for received EEG signal is the most important purpose in a
BCI. To reach to this goal, the system components should be designed to converge the system
to the correct answer with minimum computational operations. There are many natural
limitations in EEG signals, like noise, large dimensions of feature vectors, time dependency
and doubtfulness. These limitations cause lack of correct decisions and increased calculations.
In addition, signal acquisition should not be neglected; the words must be said is acquiring
noninvasive signals through the electrodes on the head’s skin is an important reason that creates
noise.
To remove these limitations two fundamental sections in a BCI should be noted as following:
1. pre-processing phase
2. feature extraction phase
In the preprocessing phase some common tasks can be performed like noise removing using
various filters. Second phase of a BCI system extract some features from the signal. based on
the acquired results, this part of BCI is the most important part of the system because the so-
called acquired results will lead the next phase to decide strongly and preciously.
In the two initial steps, signal is refined and most effective information is extracted from it.
Finally, using a simple classifier with minimum calculations leads to safe and reliable results in
the classification section of the system that consequently converges towards the final answer.
IV. CONCLUSION
Reducing the period of system delay and response time makes the designed BCI system to be
closer to the real-time systems. Such BCI can be closed to its eventual purpose which is more
speed and decision-making accuracy for system. The previous results show that a major
percentage reliability of BCI system depends on the feature extraction phase. Also, considering
the selected features and the results of different applied classifications on the features can lead
to suitable and appropriate selective features.
Combining faster algorithms with less calculations can be used for improving the decision
making process. In addition, using algorithms that pay attention to both feature extraction and
classification at the same time is suggested. For example using ICA, chaotic ideas, Lyapunov
Exponents, etc. Parallelized architectures can be used for configuring such mentioned
algorithms which leads speeding up in feature extraction and classification. However, the
combinational classification algorithms can be replaced by simple classifiers, as well.

Journal of Academic and Applied Studies
Vol. 3(2) February 2013, pp. 1-19
Available online @ www.academians.org
ISSN1925-931X
17
Acknowledgements
This research is the result of a research plan supported by Islamic Azad University, Dezful
branch.
Reference:
Ansari-Asl, K., G. Chanel, T. Pun (2009). A Channel Selection Method For EEG Classification In
Emotion Assessment Based On Synchronization Likelihood. 15th European Signal Processing
Conference (EUSIPCO), Poznan, Poland. pp 1241-1245.
Akaike H., (1974). A new look at statistical model order identification. IEEE Transaction Automation
Control. vol(19), pp 716–723.
Bashashati, A., K.Ward, R., E.Birch, G.(2007a). Comparison of Using Mono-Polar and Bipolar
Electroencephalogram (EEG) Electrodes for Detection of Right and Left Hand Movements in a Self-
Paced Brain Computer Interface (BCI). Proceedings of the 3rd International ieee embs Conference on
Neural Engineering Kohala Coast, Hawaii, USA, May 2-5, pp 725-728.
Bashashati, A., Ward, R., Birch, G.(2007b). Recent Advances in the Design of a 3-State Self-Paced
(Asynchronous) Brain Computer Interface. Proceedings of the 3rd International ieee embs Conference
on Neural Engineering Kohala Coast, Hawaii, USA, May 2-5, pp 188-191.
Besserve M., Philippe M., G. Florence, F. Laurent, L. Garnero, J. Martinerie,(2008). Prediction of
performance level during a cognitive task from ongoing EEG oscillatory activities. ELSEVIER Journal
of Clinical Neurophysiology. Vol(119), pp 897-908.
Blankertz B, Losch F, Krauledat M, Dornhege G, Curio G, Muller KR.(2008). The Berlin brain–computer interface: accurate performance from first-session in BCInaive subjects. IEEE Transaction on
Biomedical Engineering. Vol(55), pp 2452–2462.
Borisoff JF, Mason SG, Bashashati A, Birch GE. (2004). Brain–computer interface design for
asynchronous control applications: improvements to the LF-ASD asynchronous brain switch. IEEE
Transaction on Biomedical Engineering, vol(51), pp 985–992.
Burmeister, O., Reischl, M., Gröll L., Mikut R. (2007). Zeitvariante Klassifikatoren zur Steuerung von
Brain Machine Interfaces und Neuroprothesen (Time-variant Classifiers to Control Brain Machine
Interfaces and Neuroprostheses). Automatisierungstechnik, 54(11), pp 537-545.
Brown, R.G. and P. Y. C., Hwang,(1983). Introduction to Random Signal Analysis and Kalman
Filtering. John Willey & Sons Inc.
Boostani, R., M. H. Moradi (2004). A new approach in the BCI research based on fractal dimension as
feature and Adaboost as classifier. J. Neural Eng. , vol(1) , pp 212-217.
Dezhong, Y., ZhongKe, Y., XiangHong Z., Arendt-Nielsen Lars, Andrew, C.(2004). High-resolution
electroencephalogram (EEG) mapping: scalp charge layer. Physics in medicine and biology. vol 49(22),
pp 5073-5086.
Dornhege G, Blankertz B, Krauledat M, Losch F, Curio G, Muller KR.(2006). Combined optimization
of spatial and temporal filters for improving brain–computer interfacing. IEEE Transaction on
Biomedical Engineering. Vol(53), pp 2274–2281.
Esteller R., G. Vachtsevanos, J. Echauz, and B. Litt,(2001). A comparison of waveform fractal
dimension algorithms. IEEE Transaction Circuits and Systems. vol 48, pp 177-183.
Fabiani GE, McFarland DJ, Wolpaw JR, Pfurtscheller G.(2004). Conversion of EEG activity into cursor
movement by a brain–computer interface (BCI). IEEE Transactions on Neural Systems and
Rehabilitation Engineering. Vol(12), pp 331–338.

Journal of Academic and Applied Studies
Vol. 3(2) February 2013, pp. 1-19
Available online @ www.academians.org
ISSN1925-931X
18
Farwell LA, Donchin E.(1988). Talking off the top of your head: toward a mental prosthesis utilizing
event-related brain potentials. Electroencephalography and Clinical Neurophysiology. Vol(70), pp 510–523.
Freund, Y., Schapire, R. E.,(1998). Large margin classification using the perceptron algorithm. 11th
Annual Conference on Computational Learning Theory, New York, pp: 209-217.
Friman O, Volosyak I, Graser A.(2007). Multiple channel detection of steady-state visual evoked
potentials for brain–computer interfaces. IEEE Transaction on Biomedical Engineering. vol(54), pp
742–750.
Guyton, Arthur C., and J.E. Hall (2006). Textbook of Medical Physiology. Elsevier Saunders.
Hazrati, M.Kh. , Erfanian, A.(2010). An online EEG-based brain–computer interface for controlling
hand grasp using an adaptive probabilistic neural network. Medical Engineering & Physics,Vol 32(7),
pp 730–739.
Hinterberger T, Schmidt S, Neumann N, Mellinger J, Blankertz B, Curio G, et al(2004). Brain–computer communication and slow cortical potentials. IEEE Transaction on Biomedical Engineering.
Vol(51), pp 1011–1018.
Hjorth, B.,(1970). EEG analysis based on time domain properties. Electroencephalography and Clinical
Neurophysiology. vol 29(3), pp 306-310.
Hwang, H.-J., Kwon, K., Im, C.-H.(2009). Neurofeedback-based motor imagery training for brain–
computer interface (BCI). ELSEVIER, Journal of Neuroscience Methods. Vol(179), pp 150–156.
Krusienski DJ, Schalk G, McFarland DJ, Wolpaw JR.(2007). A µ-rhythm matched filter or continuous
control of a brain–computer interface. IEEE Transaction on Biomedical Engineering, vol(54), pp 273–280.
Leeb, R., Pfurtscheller, G.(2004). Walking through a Virtual City by Thought. Proceedings of the 26th
Annual International Conference of the IEEE EMBS, San Francisco, CA, USA, September 1-5, pp
4503-4506.
Leeb R, Lee F, Keinrath C, Scherer R, Bischof H, Pfurtscheller G.(2007). Brain–computer
communication: motivation, aim, and impact of exploring a virtual apartment. IEEE Transactions on
Neural Systems and Rehabilitation Engineering. Vol(15), pp 473–484.
Lemm, S.(2007a). SINGLE TRIAL ANALYSES of ENCEPHALOGRAM DATA. Post doctora thesis,
Technology University of Berlin.
Lemm, S., Schafer, V., Curio, G.(2004b). Probabilistic Modelling of Sensorimotor μ-Rhythms for
Classification of Imaginary Hand Movements. IEEE Transactions on Biomedical Engineering, 51(6), pp
1077–1080.
Middendorf M, McMillan G, Calhoun G, Jones K.(2000). Brain–computer interfaces based on the
steady-state visual-evoked response. IEEE Transactions on Rehabilitation Engineering. Vol(8), pp 211–214.
Muller-Putz GR, Scherer R, Pfurtscheller G, Rupp R.(2005). EEG-based neuroprosthesis control: a step
towards clinical practice. Neuroscience Letters, vol(382), pp 169–174.
Oppenheim, A.S., A.S. Willsky, and S.H. Nawab,(1997). Signal & Systems. 2nd edition, Prentice Hall. Parini, S., Maggi, L., Turconi, A.C., Andreoni, G. (2009). A Robust and Self-Paced BCI System Based
on a Four Class SSVEP Paradigm: Algorithms and Protocols for a High-Transfer-Rate Direct Brain
Communication. Computational Intelligence and Neuroscience, vol. 2009, Article ID
864564,doi:10.1155/2009/864564.
Pei XM, Zheng CX, Xu J, Bin GY, Wang HW(2006). Multi-channel linear descriptors for event-related
EEG collected in brain computer interface. J Neural Eng., 3(1), pp 52-58.
Pfurtscheller G, Neuper C, Guger C, Harkam W, Ramoses H, Schlogl A, et al.(2000). Current trends in
graz brain–computer interface (BCI) research. IEEE Transactions on Neural Systems and Rehabilitation
Engineering, vol(8), pp 216–219.

Journal of Academic and Applied Studies
Vol. 3(2) February 2013, pp. 1-19
Available online @ www.academians.org
ISSN1925-931X
19
Pfurtscheller G, Muller-Putz GR, Pfurtscheller J, Rupp R.(2005). EEG-based asynchronous BCI
controls functional electrical stimulation in a tetraplegic patient. EURASIP Journal on Applied Signal
Processing. Vol(19), pp 3152–3155.
Rakotomamonjy A, Guigue V.(2008). BCI competition III-dataset II: ensemble of SVMs for BCI P300
speller. IEEE Transaction on Biomedical Engineering, vol(55), pp 1147–1154.
Sanei, S. and J. Chambers, (2007). EEG Signal Processing. John Wiley & Sons Ltd.
Serby H, Yom-Tov E, Inbar GF.(2005). An improved P300-based brain–computer interface. IEEE
Transactions on Neural Systems and Rehabilitation Engineering, vol(13), pp 89–98.
Schels, M., S. Scherer, M. Glodek, H.A. Kestler, G. Palm, and F. Schwenker(2013). On the discovery of
events in EEG data utilizing information fusion. Springer Comput Stat, Computational Statistics. Vol
28(1), pp 5-18.
Schlogl, A., et al.,(2005-2008). BCI-competitions III (Dataset IIIa) and IV (Dataset 2A). Available:
http://www.bbci.de/competition/iii/#data_set_iiia and http://www.bbci.de/competition/iv/desc_2a.pdf.
Sevcik, C.,(2006). On fractal dimension of waveforms. Chaos Solitons & Fractals, vol 28, pp 579-580.
Shalev-Shwartz S., Singer Y., Srebro N.,(2007). Pegasos: Primal Estimated sub-GrAdient SOlver for
SVM. 24th International Conference on MachineLearning, pp: 807-814.
Wang Y, Wang R, Gao X, Hong B, Gao SS(2007). A practical VEP-based brain–computer interface.
IEEE Transactions on Neural Systems and Rehabilitation Engineering, vol(14), pp 234–239.
Wozczowski, A., Kurzynski, M.(2010). Human–machine interface in bioprosthesis control using EMG
signal classification. Blackwell ,Expert Systems. Vol 27(1), 53-70.
Xiao, D., Z. Mu, J. Hu (2009). "Classification of motor imagery EEG signals based on energy entropy.
International Symposium on Intelligent Ubiquitous Computing and Education. pp 61-65.
Sun, S., Zhang, C.(2006). Adaptive Feature Extraction for EEG Signal Classification. IEEE Trans.
Biomed. Engng, 53(6), pp 1209–1214.
Xu, W., Guan, C.(2004). Siong, C.Eng, Ranganatha, S., Thulasidas, M., Wu, J., 'High Accuracy
Classification of EEG Signal', Proceedings of the 17rd International Conference on Pattern Recognition
(ICPR'04) , 2004, 180-183.
Yom-Tov E, Inbar GF.(2002). Feature selection for the classification of movements from single
movement-related potentials. IEEE Transactions on Neural Systems and Rehabilitation Engineering,
vol(10), pp 170–178.
Related Documents