Welcome message from author
This document is posted to help you gain knowledge. Please leave a comment to let me know what you think about it! Share it to your friends and learn new things together.
Transcript

Proposed TOTAL MAXIMUM DAILY LOAD (TMDL)
For
Nutrient, Dissolved Oxygen, Turbidity and Un-ionized
Ammonia
In
Munson Slough/Lake Munson Watershed (WBIDs 807, 807A, 807C, and 807D)
Prepared by:
US EPA Region 4 61 Forsyth Street SW
Atlanta, Georgia 30303
September 2008
ii
Acknowledgments
EPA would like to acknowledge that the contents of this report and the Total Maximum Daily Load (TMDL) contained herein were developed by the Florida Department of Environmental Protection (FDEP). EPA is officially proposing this TMDL for nutrients, dissolved oxygen, turbidity and unionized ammonia in the Munson Lake Watershed (WBIDs 807, 807A, 807C, and 807D), and soliciting comment, in order to meet requirements pursuant to the Consent Decree entered in the case of Florida Wildlife Federation et al. v. Carol Browner, et al., Case No. 98-356-CIV-Stafford. EPA will accept comments on this proposed TMDL for 60 days in accordance with the public notice issued on September 30, 2008. Should EPA be unable to approve a TMDL established by FDEP for the 303(d)-listed impairment addressed in this document, EPA will establish this TMDL in lieu of FDEP, after full review of public comment. This study could not have been accomplished without significant contributions from staff in the Department’s Watershed Assessment Section. George Jackson and William Weatherspoon provided most of the recent flow and data logger collections. Tricia McClenahan provided the basin delineations and Florida land use aggregations. Many agencies were involved with field data collection over several years, including DEP’s Watershed Assessment Section and Biology Section (Nia Wellendorf), NWFWMD, DEP Invasive Plant Bureau (Jesse Van Dyke), Leon County (Theresa Heiker and Johnny Richardson), and City of Tallahassee (Geoffrey Watts and Katherine Bray), and McGlynn Labs (Sean McGlynn). Editorial assistance provided by Jan Mandrup-Poulsen and Linda Lord. Map production assistance provided by Erin G. Wilcox. For additional information on the watershed management approach and impaired waters in the St. Marks/Wakulla River Basin, contact: Douglas Gilbert Florida Department of Environmental Protection Bureau of Watershed Management Watershed Assessment Section 2600 Blair Stone Road, Mail Station 3555 Tallahassee, FL 32399-2400 [email protected] Phone: (850) 245-8450 Access to all data used in the development of this report can be obtained by contacting: Erin G. Wilcox Florida Department of Environmental Protection Bureau of Watershed Management Watershed Assessment Section 2600 Blair Stone Road, Mail Station 3555 Tallahassee, FL 32399-2400 [email protected] Phone: (850) 245-8442
iii
Contents
Chapter 1: INTRODUCTION___________________________________1
1.1 Purpose of Report ________________________________________________1
1.2 Identification of Waterbody ________________________________________1
1.3 Background _____________________________________________________5
Chapter 2: DESCRIPTION OF WATER QUALITY PROBLEM ________6
2.1 Statutory Requirements and Rule-Making History _____________________6
2.2 Information on Verified Impairment__________________________________6
Chapter 3. DESCRIPTION OF APPLICABLE WATER QUALITY STANDARDS AND TARGETS _______________________9
3.1 Classification of the Waterbody and Criteria Applicable to the TMDL______9
3.2 Applicable Water Quality Standards ________________________________11
Chapter 4: ASSESSMENT OF SOURCES_______________________24
4.1 Types of Sources________________________________________________24
4.2 Potential Sources of Nutrients in the Munson Slough/Lake Munson Watershed _________________________________________________________24
4.2.1 Point Sources ________________________________________________24 4.2.2 Land Uses and Nonpoint Sources ________________________________29
4.4 Source Summary________________________________________________39
Chapter 5: DETERMINATION OF ASSIMILATIVE CAPACITY_______52
5.1 Determination of Loading Capacity _________________________________52
5.2 TMDL Development Process_______________________________________60 5.2.1 Develop Reference Stream Nutrient Target concentration from
Reference Streams ___________________________________________60 5.2.2 Develop Lake Nutrient TMDL ____________________________________61
5.3 Turbidity TMDL Percent Reduction for Lake Munson __________________71
5.4 Develop Lake Nutrient Concentration to Meet Downstream Needs _______71
5.5 Develop BOD5 and Nutrient Concentrations Based on DO Response _____72
5.6 Critical Conditions/Seasonality_____________________________________76
Chapter 6: DETERMINATION OF THE TMDL ____________________78
6.1 Expression and Allocation of the TMDL _____________________________78
6.2 Load Allocation (LA) _____________________________________________80
6.3 Wasteload Allocation (WLA)_______________________________________81
iv
6.3.1 NPDES Wastewater Discharges__________________________________81 6.3.2 NPDES Stormwater Discharges __________________________________81
6.4 Margin of Safety (MOS)___________________________________________81
Chapter 7: NEXT STEPS: IMPLEMENTATION PLAN DEVELOPMENT AND BEYOND _____________________82
7.1 Basin Management Action Plan____________________________________82
References _______________________________________________83
Appendices _______________________________________________88
Appendix A: Background Information on Federal and State Stormwater Programs - NPDES MS4 Data _________________________________________88 Appendix B: Summary of Land Use Loads and Trends by Category _________95
List of Tables
Table 2.1. Verified Impaired Segments in the Ochlockonee/St. Marks Basin ____________________________________________________7
Table 2.2. Seansonal and Annual Average TSI ____________________________7 Table 2.3. DO exceedances, DO% >110%, DO%>150%, snf NH3U
esceedances ______________________________________________8 Table 2.4. Summary of Biology SCI Survey for Munson Slough _______________8 Table 2.5. Summary of Lake Vegetation Index (LVI) Data for Lake Munson
and Lake Bradford __________________________________________8 Table 3.1. EPA Set of Reference Streams in North Florida __________________13 Table 3.2. EPA Stream Nutrient Targets ________________________________13 Table 3.3. DEP Statistical Summary of Reference Lakes Nutrient TMDL
Targets -Lake Bradford Chain of Lakes (BCL), 1966-2007 _________14 Table 3.4. Ranking of Lakes as Compared to Lake Munson _________________17 Table 3.5. Chla Comparison of Lakes 1986 - 2007 ________________________19 Table 3.6. TN Comparison of Lakes 1986 - 2007__________________________19 Table 3.7. TP Comparison of Lakes 1986 - 2007 __________________________20 Table 3.8. TN/TP Ratio Comparison of Lakes 1986 - 2007 __________________20 Table 3.9. Conductivity Comparison of Lakes 1986 - 2007 __________________21 Table 3.10. Turbidity Comparison of Lakes 1986 - 2007 _____________________21 Table 3.11. Alkalinity Comparison of Lakes 1986 - 2007 _____________________22 Table 3.12. TSI Comparison of Lakes 1986 - 2007 _________________________22 Table 3.13. Color Comparison of Lakes 1986 - 2007 ________________________23 Table 3.14. pH Comparison of Lakes 1986 - 2007 __________________________23 Table 4.1. Point Sources in the Munson Slough/Lake Munson Watershed ______27 Table 4.2a. Classification of Land Use Categories in Leon County _____________29 Table 4.2b. Classification of Land Use Categories in the Munosn
Slough/Lake Munson Watershed______________________________30 Table 4.3. COT 2002 Model Loads_____________________________________37
v
Table 4.4a. Summary of BOD5 Loads to Munson Slough/Lake Munson Watershed, 1997 __________________________________________39
Table 4.4b. Summary of TKN Loads to Munson Slough/Lake Munson Watershed, 199 ___________________________________________41
Table 4.4c. Summary of TN Loads to Munson Slough/Lake Munson Watershed, 1997 __________________________________________42
Table 4.4d. Summary of TP Loads to Munson Slough/Lake Munson Watershed, 1997 __________________________________________43
Table 4.5. WMM Event Mean Concentrations ____________________________45 Table 4.6. Percentage of Directly Connected Impervious Area Used in
WMM ___________________________________________________46 Table 4.7. Runoff Coefficients by Year Used in WMM ______________________46 Table 5.1. Organizations that are sampling Munson Slough/Lake Munson
Watershed _______________________________________________53 Table 5.2a. Statistical Summary of Observed Annual Data Lake Munson,
WBID 807C _____________________________________________54 Table 5.2b. Statistical Summary of Observed Annual Data Lake Munson,
WBID 807C _____________________________________________54 Table 5.2c. Statistical Summary of Observed Annual Data Munson Slough,
WBID 807 and 807D ______________________________________55 Table 5.3a. Statistical Summary of Observed Data from Munson
Slough/Lake Munson Watershed (WBID 807C), 1971-2007 _________58 Table 5.3b. Statistical Summary of Observed Data from Munson
Slough/Lake Munson Watershed (WBID 807D), 1971-2007 _________59 Table 5.3c. Statistical Summary of Observed Data from Munson
Slough/Lake Munson Watershed (WBID 807), 1971-2007 __________60 Table 5.4. Summary of Nutrient Reduction Needed for Munson Slough
(WBID 807D) Using EPA Reference Streams ___________________61 Table 5.5. Weather Station Information _________________________________62 Table 5.6. Annual rainfall Used in WMM_________________________________62 Table 5.7. Measured and Simulated Flows for Calibration in Munson
Slough sub-basin __________________________________________64 Table 5.8. Simulated Flows and Nutrient Loads for the Lake Munson
Watershed _______________________________________________64 Table 5.9. Data Not Used in Development of the Multi-Varible Regression
Equation_________________________________________________66 Table 5.10. Measured Data, Regression Model, Matural Land Use for Chla,
TN, TP, and TSI ___________________________________________69 Table 5.11. Acerage for Natural Background Land Use ______________________69 Table 5.12. Natural Background Annual Loads For TN and TP ________________69 Table 5.13. Results for TN, TP, Chla, TSI, and TN/TP for Measured,
Predicted, Background and TMDL Condition_____________________70 Table 5.14. Summary of Nutrient Reduction Needed for Lake Munson
(WBID 807C) and Munson Slough (WBID 807D) to meet NH3U using Monte Carlo Distributions of pH and Temperature ___________72
vi
Table 5.15. Summary of BOD5 Reduction Needed for Lake Munson (WBID 807C) and Munson Slough (WBID 807 and 807D) to meet DO ______76
Table 6.1a. TMDL Components for the Munson Slough/Lake Munson Watershed (WBID 807D) ____________________________________79
Table 6.1b. TMDL Components for the Munson Slough/Lake Munson Watershed (807D) _________________________________________79
Table 6.1c. TMDL Components for the Munson Slough/Lake Munson Watershed (WBID 807C) ____________________________________80
Table 6.1d. TMDL Components for the Munson Slough/Lake Munson Watershed (WBID 807) _____________________________________80
List of Figures
Figure 1.1. Munson Slough/Lake Munson Watershed in Florida, Major Geopolitical Features _______________________________________2
Figure 1.2. WBIDs in the Munson Slough/Lake Munson Watershed, Including WBID 807C _______________________________________3
Figure 1.3. Lake Munson, WBID 807C ___________________________________4 Figure 3.1. Lake Munson with Cypress Trees ______________________________9 Figure 3.2. Lake Munson with Hydrilla ___________________________________10 Figure 3.3. Lake Munson with Alga Mats _________________________________10 Figure 4.1. Wastewater Facilities in the Lake Munson Watershed _____________28 Figure 4.2a. Principal Land Use in the St. Marks/Wakulla River Basin ___________31 Figure 4.2b. Principal Land Use in the Lake Munson Watershed_______________32 Figure 4.3. Population Density in Leon County, Florida______________________36 Figure 4.4. Lake Munson Watershed and Calibration Sub-basin_______________47 Figure 4.5. Lake Munson Watershed existing Land Use Categories____________49 Figure 4.6. Percent Acerage of Land Use Categories in the Lake Munson
Watershed _______________________________________________50 Figure 4.7. Percent Acerage of Land Use Categories in the Munson Slough
Sub-basin________________________________________________50 Figure 5.1a. Monitoring Sites in Munson Slough/Lake Munson Watershed _______52 Figure 5.1b. Monitoring Sites in WBID 807C _______________________________53 Figure 5.2a. Chart of Annual TN Observations for WBID 807C_________________56 Figure 5.2b. Chart of Annual TP Observations for WBID 807C_________________56 Figure 5.2c. Chart of Annual CHLA Observations for WBID 807C______________57 Figure 5.2d. Chart of Annual TSI Observations for WBID 807C________________57 Figure 5.3. Total Annual Rainfall during the Verified Period (2000-2007)________63 Figure 5.4. Relationship Between Chla and TN in Lake Munson_______________67 Figure 5.5. Relationship Between Chla and TP in Lake Munson_______________67 Figure 5.6. Predicted Chla VS Measured Chla in Lake Munson _______________68 Figure 5.7. Chla Concentration VS TN/TP Ratio in Lake Munson ______________68 Figure 5.8. Chart of Number of NH3U Esceedances (NGTSTD) vs. NH3N
for WBID 807 _____________________________________________72 Figure 5.4a. WDD/Munson Slough- DO vs. River Miles ______________________73 Figure 5.4b. Wdd/Munson Slough- Conductivity vs. River Miles ________________74
vii
Figure 5.5. DO Diurnal Variation _______________________________________75
Web sites
Florida Department of Environmental Protection, Bureau of Watershed Management
TMDL Program http://www.dep.state.fl.us/water/tmdl/index.htm Identification of Impaired Surface Waters Rule http://www.dep.state.fl.us/water/tmdl/docs/AmendedIWR.pdf STORET Program http://www.dep.state.fl.us/water/storet/index.htm 2004 305(b) Report http://www.dep.state.fl.us/water/docs/2004_Integrated_Report.pdf Criteria for Surface Water Quality Classifications http://www/dep.state.fl.us/legal/legaldocuments/rules/ruleslistnum.htm Basin Status Report http://www.dep.state.fl.us/water/tmdl/stat_rep.htm Water Quality Assessment Report http://www.dep.state.fl.us/water/tmdl/stat_rep.htm Allocation Technical Advisory Committee (ATAC) Report http://www.dep.state.fl.us/water/tmdl/docs/Allocation.pdf
U.S. Environmental Protection Agency, National STORET Program
http://www.epa.gov/storet/ Region 4: Total Maximum Daily Loads in Florida
http://www.epa.gov/region4/water/tmdl/florida/

Draft TMDL for Munson Slough/Munson Lake Watershed (WBIDs 807, 807C, and 807D) September 2008
1
Chapter 1: INTRODUCTION
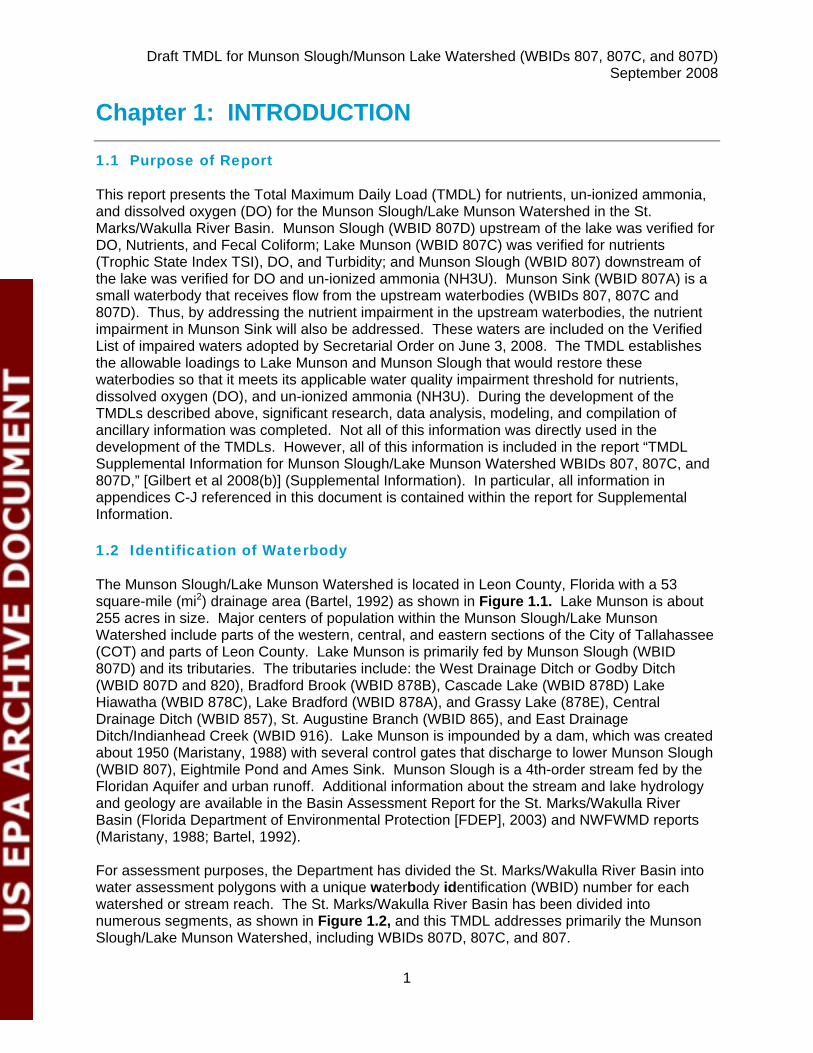
1.1 Purpose of Report
This report presents the Total Maximum Daily Load (TMDL) for nutrients, un-ionized ammonia, and dissolved oxygen (DO) for the Munson Slough/Lake Munson Watershed in the St. Marks/Wakulla River Basin. Munson Slough (WBID 807D) upstream of the lake was verified for DO, Nutrients, and Fecal Coliform; Lake Munson (WBID 807C) was verified for nutrients (Trophic State Index TSI), DO, and Turbidity; and Munson Slough (WBID 807) downstream of the lake was verified for DO and un-ionized ammonia (NH3U). Munson Sink (WBID 807A) is a small waterbody that receives flow from the upstream waterbodies (WBIDs 807, 807C and 807D). Thus, by addressing the nutrient impairment in the upstream waterbodies, the nutrient impairment in Munson Sink will also be addressed. These waters are included on the Verified List of impaired waters adopted by Secretarial Order on June 3, 2008. The TMDL establishes the allowable loadings to Lake Munson and Munson Slough that would restore these waterbodies so that it meets its applicable water quality impairment threshold for nutrients, dissolved oxygen (DO), and un-ionized ammonia (NH3U). During the development of the TMDLs described above, significant research, data analysis, modeling, and compilation of ancillary information was completed. Not all of this information was directly used in the development of the TMDLs. However, all of this information is included in the report “TMDL Supplemental Information for Munson Slough/Lake Munson Watershed WBIDs 807, 807C, and 807D,” [Gilbert et al 2008(b)] (Supplemental Information). In particular, all information in appendices C-J referenced in this document is contained within the report for Supplemental Information.
1.2 Identification of Waterbody
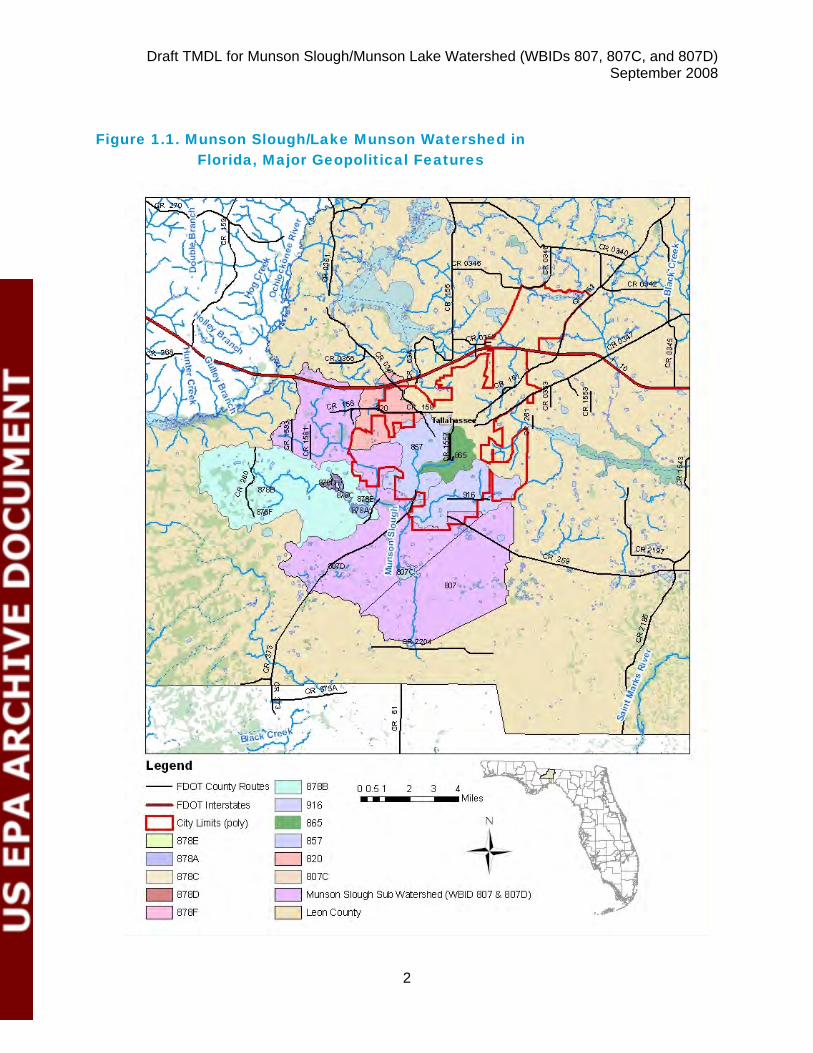
The Munson Slough/Lake Munson Watershed is located in Leon County, Florida with a 53 square-mile (mi2) drainage area (Bartel, 1992) as shown in Figure 1.1. Lake Munson is about 255 acres in size. Major centers of population within the Munson Slough/Lake Munson Watershed include parts of the western, central, and eastern sections of the City of Tallahassee (COT) and parts of Leon County. Lake Munson is primarily fed by Munson Slough (WBID 807D) and its tributaries. The tributaries include: the West Drainage Ditch or Godby Ditch (WBID 807D and 820), Bradford Brook (WBID 878B), Cascade Lake (WBID 878D) Lake Hiawatha (WBID 878C), Lake Bradford (WBID 878A), and Grassy Lake (878E), Central Drainage Ditch (WBID 857), St. Augustine Branch (WBID 865), and East Drainage Ditch/Indianhead Creek (WBID 916). Lake Munson is impounded by a dam, which was created about 1950 (Maristany, 1988) with several control gates that discharge to lower Munson Slough (WBID 807), Eightmile Pond and Ames Sink. Munson Slough is a 4th-order stream fed by the Floridan Aquifer and urban runoff. Additional information about the stream and lake hydrology and geology are available in the Basin Assessment Report for the St. Marks/Wakulla River Basin (Florida Department of Environmental Protection [FDEP], 2003) and NWFWMD reports (Maristany, 1988; Bartel, 1992). For assessment purposes, the Department has divided the St. Marks/Wakulla River Basin into water assessment polygons with a unique waterbody identification (WBID) number for each watershed or stream reach. The St. Marks/Wakulla River Basin has been divided into numerous segments, as shown in Figure 1.2, and this TMDL addresses primarily the Munson Slough/Lake Munson Watershed, including WBIDs 807D, 807C, and 807.
Draft TMDL for Munson Slough/Munson Lake Watershed (WBIDs 807, 807C, and 807D) September 2008
2
Figure 1.1. Munson Slough/Lake Munson Watershed in Florida, Major Geopolitical Features

Draft TMDL for Munson Slough/Munson Lake Watershed (WBIDs 807, 807C, and 807D) September 2008
3
Figure 1.2. WBIDs in the Munson Slough/Lake Munson Watershed, Including WBID 807C
Draft TMDL for Munson Slough/Munson Lake Watershed (WBIDs 807, 807C, and 807D) September 2008
4
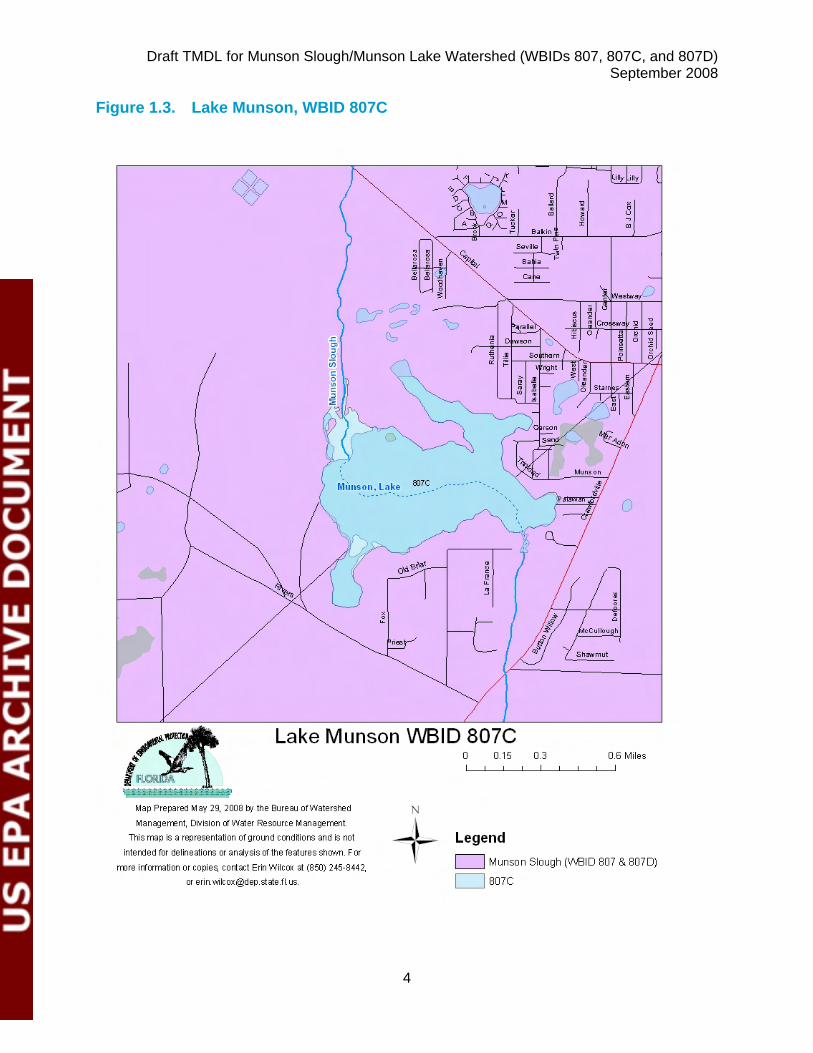
Figure 1.3. Lake Munson, WBID 807C
Draft TMDL for Munson Slough/Munson Lake Watershed (WBIDs 807, 807C, and 807D) September 2008
5
1.3 Background
This report was developed as part of the Florida Department of Environmental Protection’s (Department) watershed management approach for restoring and protecting state waters and addressing TMDL Program requirements. The watershed approach, which is implemented using a cyclical management process that rotates through the state’s fifty-two river basins over a five-year cycle, provides a framework for implementing the TMDL Program–related requirements of the 1972 federal Clean Water Act and the 1999 Florida Watershed Restoration Act (FWRA, Chapter 99-223, Laws of Florida). A TMDL represents the maximum amount of a given pollutant that a waterbody can assimilate and still meet water quality standards, including its applicable water quality criteria and its designated uses. TMDLs are developed for waterbodies that are verified as not meeting their water quality standards. TMDLs provide important water quality restoration goals that will guide restoration activities. This TMDL Report will be followed by the development and implementation of a Basin Management Action Plan, or BMAP, to reduce the amount of nutrients, un-ionized ammonia, and BOD5 that caused the verified impairments of Lake Munson and Munson Slough. These activities will depend heavily on the active participation of the Northwest Florida Water Management District, local governments, businesses, and other stakeholders. The Department will work with these organizations and individuals to undertake or continue reductions in the discharge of pollutants and achieve the established TMDLs for impaired waterbodies. The problems of Lake Munson have been well documented in the literature (see Chapter 3). This TMDL is also intimately tied to the nutrient TMDL for Wakulla Springs and Wakulla River, which is in the process of completion (Wieckowicz, 2008). Public meetings on Florida Springs, including Wakulla, were held quarterly at FDEP (including two in 2008) to discuss data collection, stakeholder involvement, and future research. Another significant workshop on Wakulla Springs was held May 12-13, 2005. The meeting included publication of a “Peer Review Committee Report” (Loper, 2005) that summarized current research (Hand, 2007a, b, c, d) and mitigation strategies for reducing nutrient loading.
Draft TMDL for Munson Slough/Munson Lake Watershed (WBIDs 807, 807C, and 807D) September 2008
6
Chapter 2: DESCRIPTION OF WATER QUALITY PROBLEM
2.1 Statutory Requirements and Rulemaking History
Section 303(d) of the federal Clean Water Act requires states to submit to the EPA a list of surface waters that do not meet applicable water quality standards (impaired waters) and establish a TMDL for each pollutant causing impairment of listed waters on a schedule. The Department has developed such lists, commonly referred to as 303(d) lists, since 1992. The list of impaired waters in each basin, referred to as the Verified List, is also required by the FWRA (Subsection 403.067[4)] Florida Statutes [F.S.]), and the state’s 303(d) list is amended annually to include basin updates. Florida’s 1998 303(d) list included (13) waterbodies in the St. Marks/Wakulla River Basin. However, the FWRA (Section 403.067, F.S.) stated that all previous Florida 303(d) lists were for planning purposes only and directed the Department to develop, and adopt by rule, a new science-based methodology to identify impaired waters. After a long rulemaking process, the Environmental Regulation Commission adopted the new methodology as Chapter 62-303, Florida Administrative Code (FAC) (Identification of Impaired Surface Waters Rule, or IWR), in April 2001. The IWR Rule has since been modified in 2007.
2.2 Information on Verified Impairment
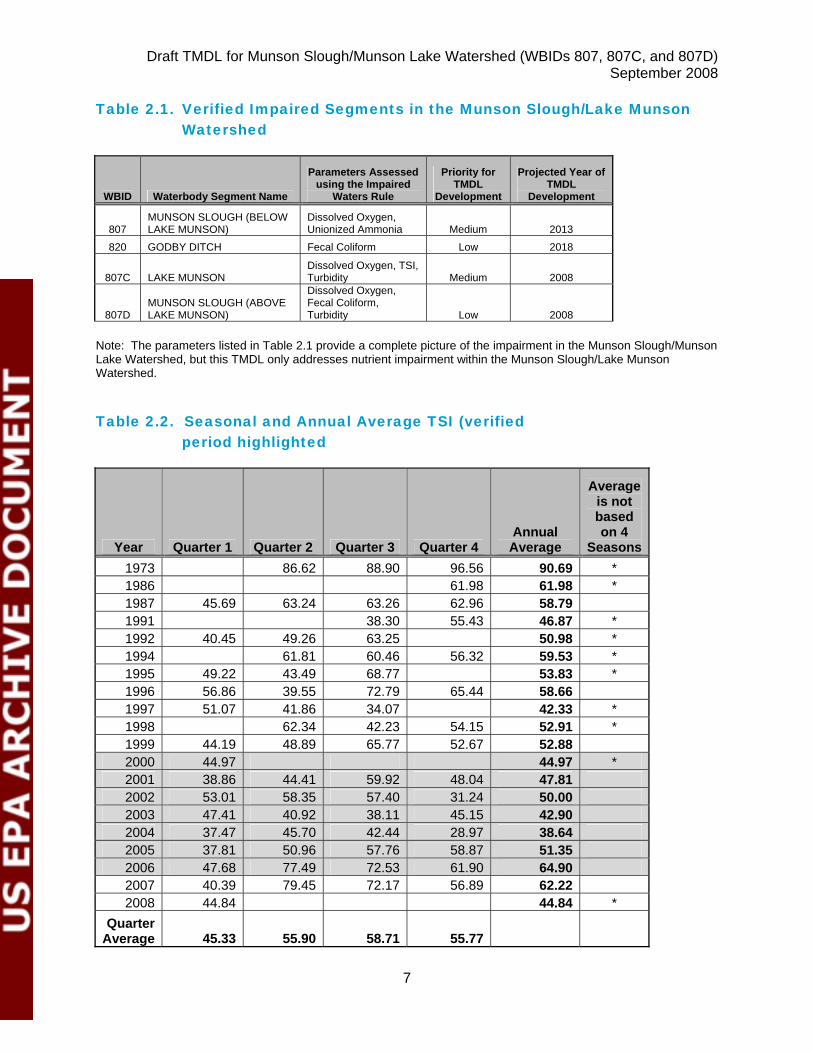
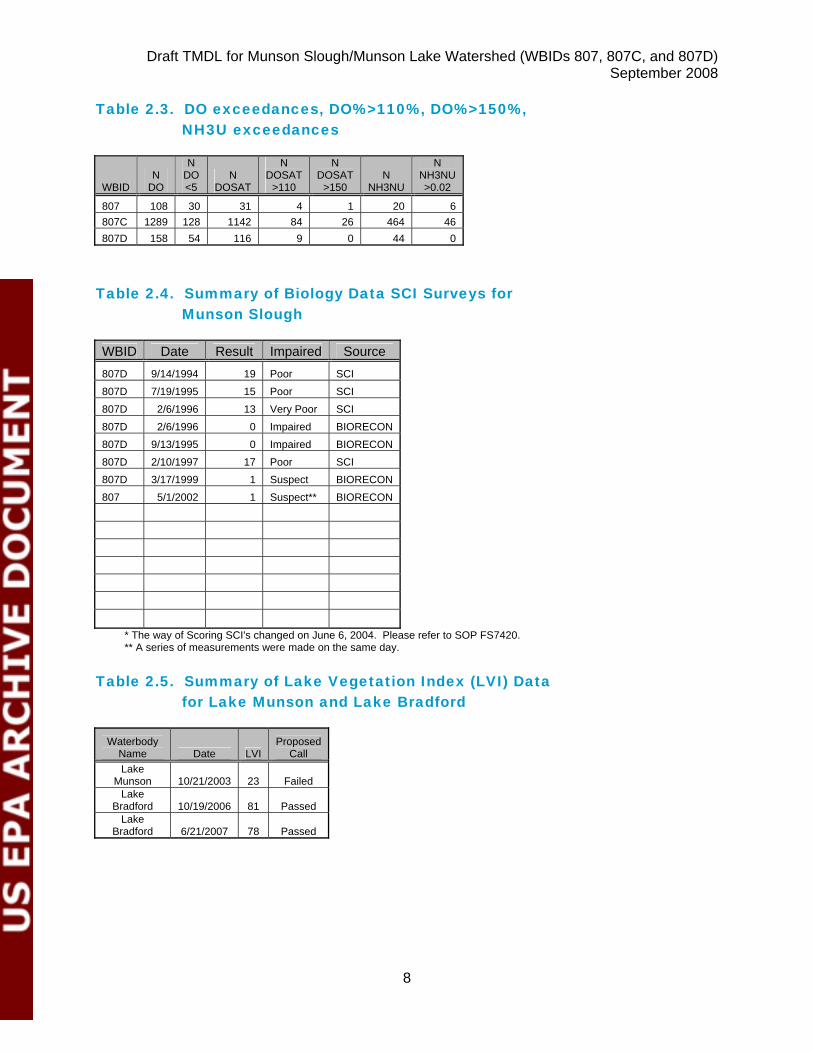
The Department used the IWR to assess water quality impairments in the Munson Slough/Lale Munson watershed and has verified the impairments listed in Table 2.1. Table 2.2. provides assessment results for the Trophic State Index (TSI) for the period of record and the verification period for Lake Munson. The verification period for Group 1 is January 1, 2000 through June 30, 2007. As the year 2007 of the verified period contains only six months, the annual average TSI for this year is not considered for verifying TSI impairment for lakes. Color was also compared due to rule 62-303.352, FAC, which states that for lakes with a mean color greater then 40 platinum cobalt units, the annual TSI must not exceeded 60. The lake and Munson Slough also have related problems with low dissolved oxygen (DO), supersaturated DO, un-ionized ammonia (NH3U), high turbidity, high sediment nutrients and organics, aquatic vegetation, fish kills, and problems with PCBs in fish tissue.(Richardson, 2008). The number of exceedances for DO, for WBIDs 807, 807C, and 807D, are shown in Table 2.3. It should be noted, that while all three waterbodies have many low DO values, Lake Munson has many in the supersaturated range (DOSAT> 110% or DOSAT>150%). Biological exceedances are also noted in Table 2.4. Recent biorecon data were not available, but the many recent photos of algae blooms (Chapter 3) suggest that that the biological problems have continued to the present. The Lake Vegetation Index (LVI) listed in Table 2.5 shows that the Lake Bradford, located upstream of Lake Munson, passed the LVI screening.
Draft TMDL for Munson Slough/Munson Lake Watershed (WBIDs 807, 807C, and 807D) September 2008
7
Table 2.1. Verified Impaired Segments in the Munson Slough/Lake Munson Watershed
WBID Waterbody Segment Name
Parameters Assessed using the Impaired
Waters Rule
Priority for TMDL
Development
Projected Year of TMDL
Development
807 MUNSON SLOUGH (BELOW LAKE MUNSON)
Dissolved Oxygen, Unionized Ammonia Medium 2013
820 GODBY DITCH Fecal Coliform Low 2018
807C LAKE MUNSON Dissolved Oxygen, TSI, Turbidity Medium 2008
807D MUNSON SLOUGH (ABOVE LAKE MUNSON)
Dissolved Oxygen, Fecal Coliform, Turbidity Low 2008
Note: The parameters listed in Table 2.1 provide a complete picture of the impairment in the Munson Slough/Munson Lake Watershed, but this TMDL only addresses nutrient impairment within the Munson Slough/Lake Munson Watershed.
Table 2.2. Seasonal and Annual Average TSI (verified
period highlighted
Year Quarter 1 Quarter 2 Quarter 3 Quarter 4 Annual Average
Average is not based on 4
Seasons 1973 86.62 88.90 96.56 90.69 * 1986 61.98 61.98 * 1987 45.69 63.24 63.26 62.96 58.79 1991 38.30 55.43 46.87 * 1992 40.45 49.26 63.25 50.98 * 1994 61.81 60.46 56.32 59.53 * 1995 49.22 43.49 68.77 53.83 * 1996 56.86 39.55 72.79 65.44 58.66 1997 51.07 41.86 34.07 42.33 * 1998 62.34 42.23 54.15 52.91 * 1999 44.19 48.89 65.77 52.67 52.88 2000 44.97 44.97 * 2001 38.86 44.41 59.92 48.04 47.81 2002 53.01 58.35 57.40 31.24 50.00 2003 47.41 40.92 38.11 45.15 42.90 2004 37.47 45.70 42.44 28.97 38.64 2005 37.81 50.96 57.76 58.87 51.35 2006 47.68 77.49 72.53 61.90 64.90 2007 40.39 79.45 72.17 56.89 62.22 2008 44.84 44.84 *
Quarter Average 45.33 55.90 58.71 55.77
Draft TMDL for Munson Slough/Munson Lake Watershed (WBIDs 807, 807C, and 807D) September 2008
8
Table 2.3. DO exceedances, DO%>110%, DO%>150%, NH3U exceedances
WBID N
DO
N DO <5
N DOSAT
N DOSAT
>110
N DOSAT
>150 N
NH3NU
N NH3NU >0.02
807 108 30 31 4 1 20 6 807C 1289 128 1142 84 26 464 46 807D 158 54 116 9 0 44 0
Table 2.4. Summary of Biology Data SCI Surveys for Munson Slough
WBID Date Result Impaired Source 807D 9/14/1994 19 Poor SCI 807D 7/19/1995 15 Poor SCI 807D 2/6/1996 13 Very Poor SCI 807D 2/6/1996 0 Impaired BIORECON 807D 9/13/1995 0 Impaired BIORECON 807D 2/10/1997 17 Poor SCI 807D 3/17/1999 1 Suspect BIORECON 807 5/1/2002 1 Suspect** BIORECON
* The way of Scoring SCI's changed on June 6, 2004. Please refer to SOP FS7420. ** A series of measurements were made on the same day.
Table 2.5. Summary of Lake Vegetation Index (LVI) Data for Lake Munson and Lake Bradford
Waterbody Name Date LVI
Proposed Call
Lake Munson 10/21/2003 23 Failed
Lake Bradford 10/19/2006 81 Passed
Lake Bradford 6/21/2007 78 Passed
Draft TMDL for Munson Slough/Munson Lake Watershed (WBIDs 807, 807C, and 807D) September 2008
9
Chapter 3. DESCRIPTION OF APPLICABLE WATER QUALITY STANDARDS AND TARGETS
3.1 Classification of the Waterbody and Criteria Applicable to the TMDL
Florida’s surface waters are protected for five designated use classifications, as follows: Class I Potable water supplies Class II Shellfish propagation or harvesting Class III Recreation, propagation, and maintenance of a healthy, well-
balanced population of fish and wildlife Class IV Agricultural water supplies Class V Navigation, utility, and industrial use (there are no state
waters currently in this class)
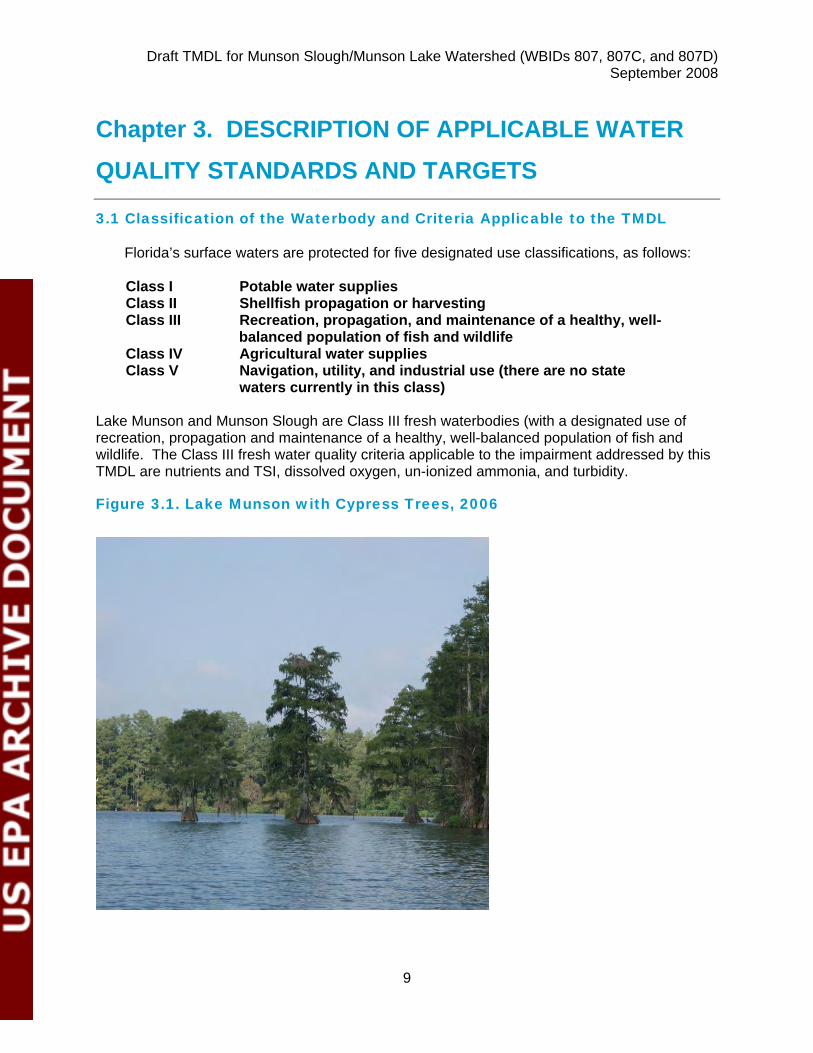
Lake Munson and Munson Slough are Class III fresh waterbodies (with a designated use of recreation, propagation and maintenance of a healthy, well-balanced population of fish and wildlife. The Class III fresh water quality criteria applicable to the impairment addressed by this TMDL are nutrients and TSI, dissolved oxygen, un-ionized ammonia, and turbidity.
Figure 3.1. Lake Munson with Cypress Trees, 2006
Draft TMDL for Munson Slough/Munson Lake Watershed (WBIDs 807, 807C, and 807D) September 2008
10
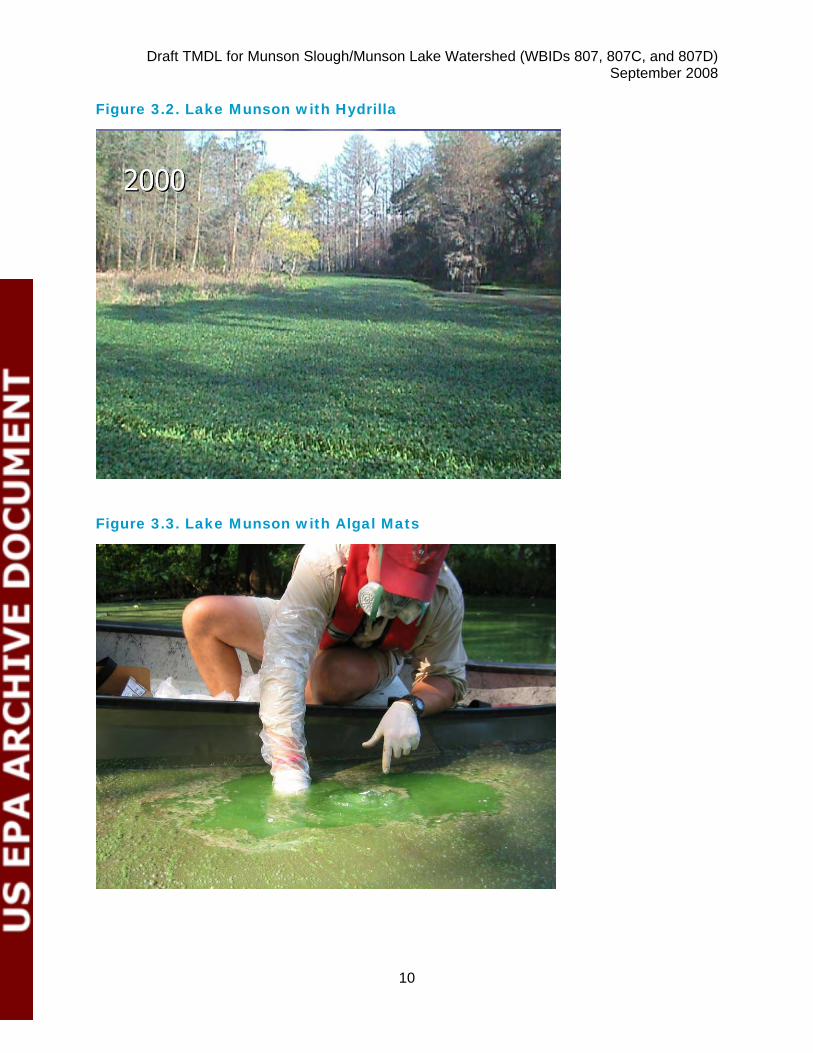
Figure 3.2. Lake Munson with Hydrilla
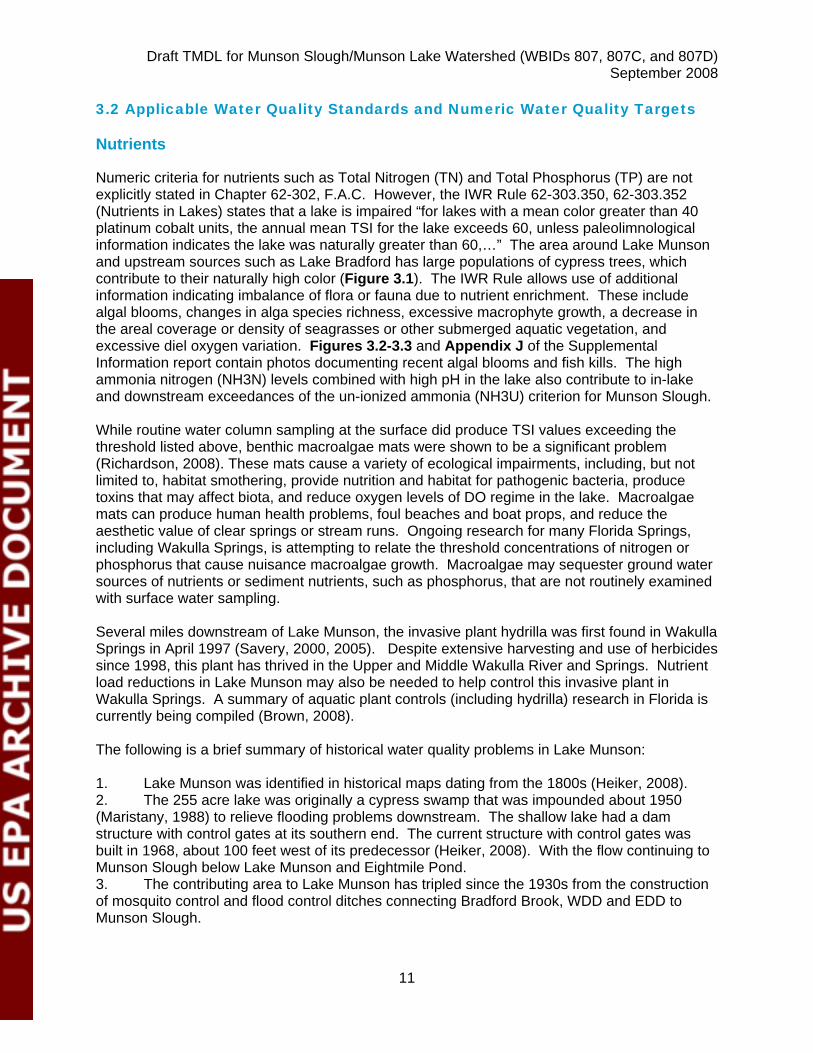
Figure 3.3. Lake Munson with Algal Mats
Draft TMDL for Munson Slough/Munson Lake Watershed (WBIDs 807, 807C, and 807D) September 2008
11
3.2 Applicable Water Quality Standards and Numeric Water Quality Targets
Nutrients
Numeric criteria for nutrients such as Total Nitrogen (TN) and Total Phosphorus (TP) are not explicitly stated in Chapter 62-302, F.A.C. However, the IWR Rule 62-303.350, 62-303.352 (Nutrients in Lakes) states that a lake is impaired “for lakes with a mean color greater than 40 platinum cobalt units, the annual mean TSI for the lake exceeds 60, unless paleolimnological information indicates the lake was naturally greater than 60,…” The area around Lake Munson and upstream sources such as Lake Bradford has large populations of cypress trees, which contribute to their naturally high color (Figure 3.1). The IWR Rule allows use of additional information indicating imbalance of flora or fauna due to nutrient enrichment. These include algal blooms, changes in alga species richness, excessive macrophyte growth, a decrease in the areal coverage or density of seagrasses or other submerged aquatic vegetation, and excessive diel oxygen variation. Figures 3.2-3.3 and Appendix J of the Supplemental Information report contain photos documenting recent algal blooms and fish kills. The high ammonia nitrogen (NH3N) levels combined with high pH in the lake also contribute to in-lake and downstream exceedances of the un-ionized ammonia (NH3U) criterion for Munson Slough. While routine water column sampling at the surface did produce TSI values exceeding the threshold listed above, benthic macroalgae mats were shown to be a significant problem (Richardson, 2008). These mats cause a variety of ecological impairments, including, but not limited to, habitat smothering, provide nutrition and habitat for pathogenic bacteria, produce toxins that may affect biota, and reduce oxygen levels of DO regime in the lake. Macroalgae mats can produce human health problems, foul beaches and boat props, and reduce the aesthetic value of clear springs or stream runs. Ongoing research for many Florida Springs, including Wakulla Springs, is attempting to relate the threshold concentrations of nitrogen or phosphorus that cause nuisance macroalgae growth. Macroalgae may sequester ground water sources of nutrients or sediment nutrients, such as phosphorus, that are not routinely examined with surface water sampling. Several miles downstream of Lake Munson, the invasive plant hydrilla was first found in Wakulla Springs in April 1997 (Savery, 2000, 2005). Despite extensive harvesting and use of herbicides since 1998, this plant has thrived in the Upper and Middle Wakulla River and Springs. Nutrient load reductions in Lake Munson may also be needed to help control this invasive plant in Wakulla Springs. A summary of aquatic plant controls (including hydrilla) research in Florida is currently being compiled (Brown, 2008). The following is a brief summary of historical water quality problems in Lake Munson: 1. Lake Munson was identified in historical maps dating from the 1800s (Heiker, 2008). 2. The 255 acre lake was originally a cypress swamp that was impounded about 1950 (Maristany, 1988) to relieve flooding problems downstream. The shallow lake had a dam structure with control gates at its southern end. The current structure with control gates was built in 1968, about 100 feet west of its predecessor (Heiker, 2008). With the flow continuing to Munson Slough below Lake Munson and Eightmile Pond. 3. The contributing area to Lake Munson has tripled since the 1930s from the construction of mosquito control and flood control ditches connecting Bradford Brook, WDD and EDD to Munson Slough.
Draft TMDL for Munson Slough/Munson Lake Watershed (WBIDs 807, 807C, and 807D) September 2008
12
4. In 1956, the split-pea soup description of the lake was noted by the Florida State Board of Health (Beck, 1963). 5. Limited diel water quality sampling (6/12/1963 and 6/13/1963) at 4 stations showed early morning DO near 0.0 mg/L and late afternoon values supersaturated (Beck, 1963). The pH values were also extremely high (9.2-9.6 su). The number of bottom organisms had increased by a factor of seven since 1956. A fish kill was also noted on 6/10/1963 and was attributed to an algae bloom. 6. In 1973, EPA’s National Eutrophication Survey (EPA, 1975) analyzed 41 lakes in Florida that were suspected of being eutrophic. Lake Munson ranked as hypereutrophic (scored 39th highest out of the 41 analyzed) using a combination of 6 lake parameters. Limnologists also noted emergent and floating vegetation at all stations, heavy phytoplankton blooms, and clumps of filamentous blue-green algae at one station. Algal assay results showed that the lake was nitrogen limited. The three surveys (06/20/1973, 08/30/1973, 11/05/1973) included nutrient sampling. About one USGS stream flow estimate per month, for one year, was completed for the input via Munson Slough. 7. In September, 1976, a ”limited” drawdown of Lake Munson was proposed (Leseman, 1977). Water quality sampling was performed monthly at six lake stations and one station on Munson Slough inflow from February 1976 to March 1977. Additional sampling was done for sediment nutrients and heavy metals and water quality of nearby resident’s wells. The Florida Game and Commission (GFC) also analyzed the fish species and populations in the lake. This report also showed the water quality trends for TN and OPO4P from 1966 to 1975 (Appendix F of the Supplemental Information). The loading from the three City Sewage Treatment Plants (T.P. Smith, Dale Mabry, and Lake Bradford) was also quantified (Appendix C of the Supplemental Information). In 1977, when the drawdown was attempted, a dense stand of weeds formed in the lake, but the bottom sediments were too soft to support equipment to remove the weeds. 8. Around 1978, a decision was made (Bocz, 1985) to phase out the STP discharges to Munson Slough and Lake Munson and utilize landspreading at two different sites. Sampling of sediment for PCBs, nutrients, pesticides, and heavy metals was completed by USGS in August 1981. These samples were summarized for four area lakes, including Munson. The effluent discharges from T.P. Smith stopped in 1980, Dale Mabry STP discontinued in 1982, while Lake Bradford Rd STP stopped in 1984. 9. The FDER (FDER, 1988) conducted a large study of the lake from November, 1986 to October, 1987. Algal growth potential (AGP) and nutrient limiting assays were performed on water samples from seven lake stations. Nitrogen was found to be the limiting nutrient and AGP were still above the threshold level of 5.0 mg dry wt/l, but much reduced from 1977 levels (62.61 mg dry weight/l). This indicated that the lake was recovering from cessation of STP discharges, but was still receiving a large fraction of the stormwater from Tallahassee. 10. Aquatic plants have been a periodic problem in Lake Munson. The FDNR (Van Dyke, 1986) noted that on October 17, 1986 the aquatic plant community was primarily emersed species such as smartweed, willow, beggar-ticks, and elephant ear. The most potentially harmful plant present was water hyacinth. This floating species only occupied 0.45 ha (1.11 acres), but can expand rapidly. No dense phytoplankton coverage was found in the lake at that time. A summary of the annual plant coverage from 1983-2004, by species, is shown in Appendix G of the Supplemental Information (FDEP, 2008). Note that hyacinth (Eichornia crassipes) maximum coverage (15 ac.) occurred in 1994. The submersed species hydrilla (Hydrilla verticillata) was found to cover 25 ac. in 1993 and expanded to cover 200 ac. by 1995. In 2003, hydrilla covered 180 ac., while filamentous algae covered 60 ac. and Nelumba Lutea extended over 60 ac (Figures 3.2, 3.3).
Draft TMDL for Munson Slough/Munson Lake Watershed (WBIDs 807, 807C, and 807D) September 2008
13
11. The most recent invasive species in Lake Munson are apple snails, which has decimated the aquatic plants throughout the lake. Nutrient reductions called for by this TMDL may not address the invasive snail issue. Turbidity During the 1986-1987 period, the NWFWMD conducted a comprehensive sampling of lake water quality (Maristany, 1988) and found significant relationships among several water quality parameters. Part of the correlation matrix is included in Appendix F of the Supplemental Information. TURB was positively correlated (R>0.2) with Alkalinity (ALK), Total Solids (TS), Total Nonfiltrable Residue or Suspended Solids (SS), Nonfiltrable Volatile Residue (NVR), TKN, and TP. TURB was negatively correlated (R<0.2) with Secchi depth (SECI), Dissolved TKN (DTKN), Total Organic Carbon (TOC), and very weakly correlated with CHLA. ZSD (or SECI) was positively correlated with NO23N (NO32), and negatively correlated with Color (COLOR), SS, NVR, TN, TKN, TP, TOC, and CHLA. Dissolved Oxygen The dissolved oxygen (DO) criterion Rule 62-302.530(30), F.A.C. requires that DO shall not be less than 5.0 mg/l. Normal daily and seasonal fluctuations above these levels shall be maintained. Algae blooms can also cause DO supersaturation. Rule 62-302.530(x) F.A.C. notes that Total Dissolved Gases (TDG) shall not be greater than 110%. This translates into a requirement for the DO% portion of TDG to be less than about 150% (Kumar, 1984). These exceedances are noted in Table 2.3. Additional recent data on Diurnal DO data is in Appendix F of the Supplemental Information. and Chapter 5. Reference stream TMDLs
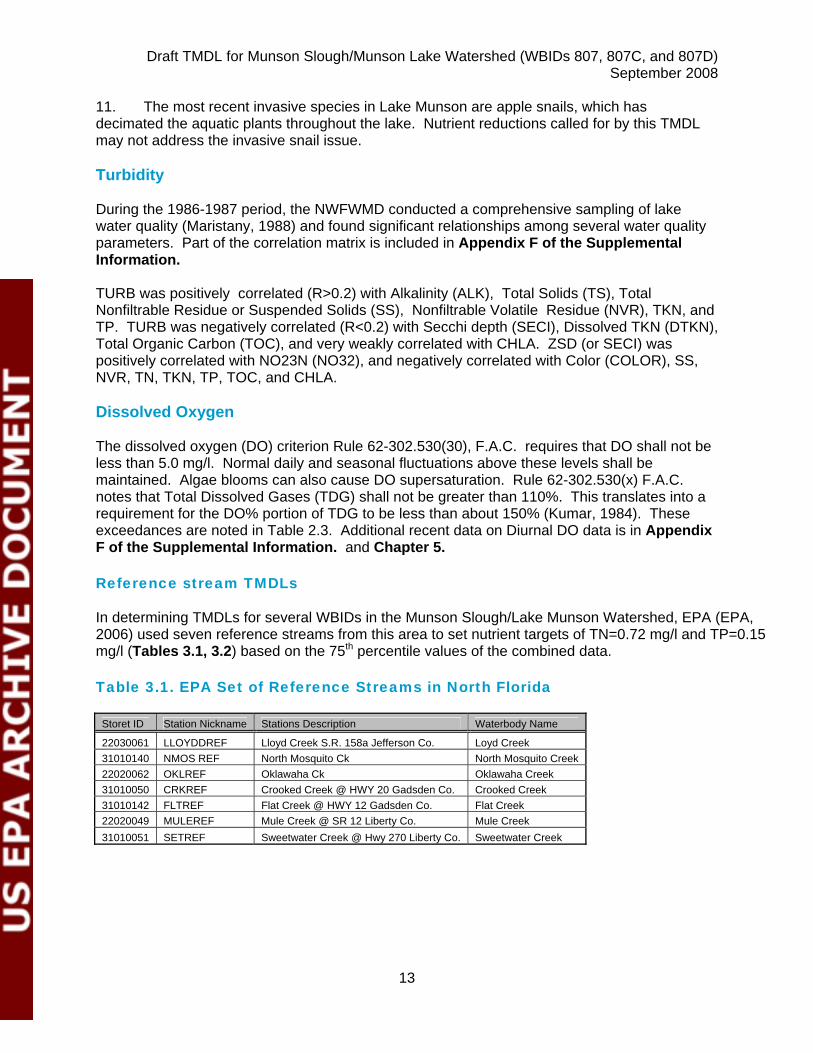
In determining TMDLs for several WBIDs in the Munson Slough/Lake Munson Watershed, EPA (EPA, 2006) used seven reference streams from this area to set nutrient targets of TN=0.72 mg/l and TP=0.15 mg/l (Tables 3.1, 3.2) based on the 75th percentile values of the combined data. Table 3.1. EPA Set of Reference Streams in North Florida
Storet ID Station Nickname Stations Description Waterbody Name
22030061 LLOYDDREF Lloyd Creek S.R. 158a Jefferson Co. Loyd Creek 31010140 NMOS REF North Mosquito Ck North Mosquito Creek 22020062 OKLREF Oklawaha Ck Oklawaha Creek 31010050 CRKREF Crooked Creek @ HWY 20 Gadsden Co. Crooked Creek 31010142 FLTREF Flat Creek @ HWY 12 Gadsden Co. Flat Creek 22020049 MULEREF Mule Creek @ SR 12 Liberty Co. Mule Creek 31010051 SETREF Sweetwater Creek @ Hwy 270 Liberty Co. Sweetwater Creek
Draft TMDL for Munson Slough/Munson Lake Watershed (WBIDs 807, 807C, and 807D) September 2008
14
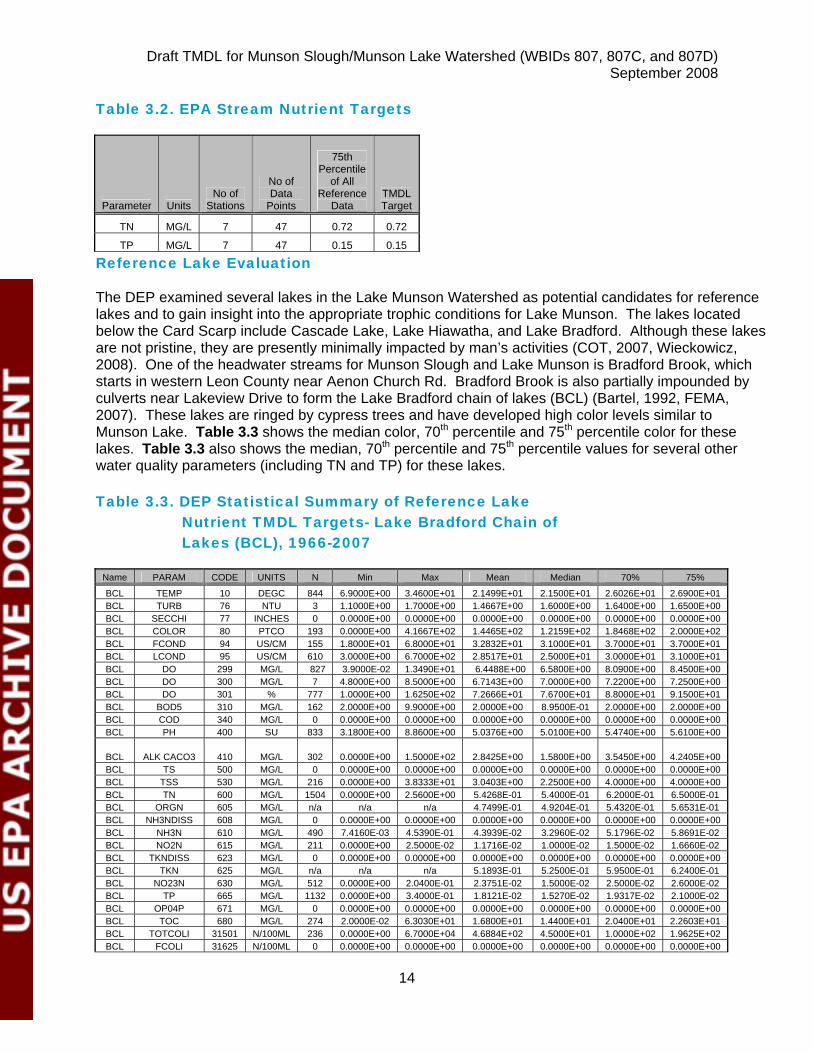
Table 3.2. EPA Stream Nutrient Targets
Parameter Units No of
Stations
No of Data
Points
75th Percentile
of All Reference
Data TMDL Target
TN MG/L 7 47 0.72 0.72
TP MG/L 7 47 0.15 0.15
Reference Lake Evaluation
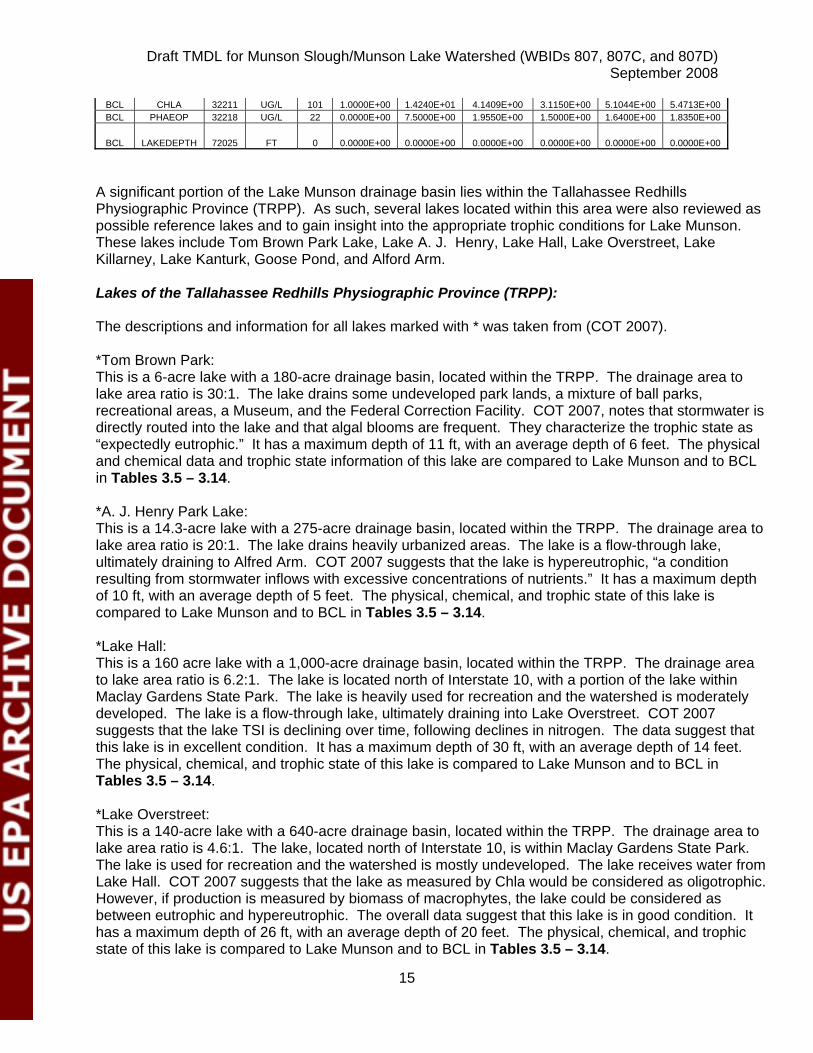
The DEP examined several lakes in the Lake Munson Watershed as potential candidates for reference lakes and to gain insight into the appropriate trophic conditions for Lake Munson. The lakes located below the Card Scarp include Cascade Lake, Lake Hiawatha, and Lake Bradford. Although these lakes are not pristine, they are presently minimally impacted by man’s activities (COT, 2007, Wieckowicz, 2008). One of the headwater streams for Munson Slough and Lake Munson is Bradford Brook, which starts in western Leon County near Aenon Church Rd. Bradford Brook is also partially impounded by culverts near Lakeview Drive to form the Lake Bradford chain of lakes (BCL) (Bartel, 1992, FEMA, 2007). These lakes are ringed by cypress trees and have developed high color levels similar to Munson Lake. Table 3.3 shows the median color, 70th percentile and 75th percentile color for these lakes. Table 3.3 also shows the median, 70th percentile and 75th percentile values for several other water quality parameters (including TN and TP) for these lakes. Table 3.3. DEP Statistical Summary of Reference Lake
Nutrient TMDL Targets- Lake Bradford Chain of Lakes (BCL), 1966-2007
Name PARAM CODE UNITS N Min Max Mean Median 70% 75%
BCL TEMP 10 DEGC 844 6.9000E+00 3.4600E+01 2.1499E+01 2.1500E+01 2.6026E+01 2.6900E+01 BCL TURB 76 NTU 3 1.1000E+00 1.7000E+00 1.4667E+00 1.6000E+00 1.6400E+00 1.6500E+00 BCL SECCHI 77 INCHES 0 0.0000E+00 0.0000E+00 0.0000E+00 0.0000E+00 0.0000E+00 0.0000E+00 BCL COLOR 80 PTCO 193 0.0000E+00 4.1667E+02 1.4465E+02 1.2159E+02 1.8468E+02 2.0000E+02 BCL FCOND 94 US/CM 155 1.8000E+01 6.8000E+01 3.2832E+01 3.1000E+01 3.7000E+01 3.7000E+01 BCL LCOND 95 US/CM 610 3.0000E+00 6.7000E+02 2.8517E+01 2.5000E+01 3.0000E+01 3.1000E+01 BCL DO 299 MG/L 827 3.9000E-02 1.3490E+01 6.4488E+00 6.5800E+00 8.0900E+00 8.4500E+00 BCL DO 300 MG/L 7 4.8000E+00 8.5000E+00 6.7143E+00 7.0000E+00 7.2200E+00 7.2500E+00 BCL DO 301 % 777 1.0000E+00 1.6250E+02 7.2666E+01 7.6700E+01 8.8000E+01 9.1500E+01 BCL BOD5 310 MG/L 162 2.0000E+00 9.9000E+00 2.0000E+00 8.9500E-01 2.0000E+00 2.0000E+00 BCL COD 340 MG/L 0 0.0000E+00 0.0000E+00 0.0000E+00 0.0000E+00 0.0000E+00 0.0000E+00 BCL PH 400 SU 833 3.1800E+00 8.8600E+00 5.0376E+00 5.0100E+00 5.4740E+00 5.6100E+00
BCL ALK CACO3 410 MG/L 302 0.0000E+00 1.5000E+02 2.8425E+00 1.5800E+00 3.5450E+00 4.2405E+00 BCL TS 500 MG/L 0 0.0000E+00 0.0000E+00 0.0000E+00 0.0000E+00 0.0000E+00 0.0000E+00 BCL TSS 530 MG/L 216 0.0000E+00 3.8333E+01 3.0403E+00 2.2500E+00 4.0000E+00 4.0000E+00 BCL TN 600 MG/L 1504 0.0000E+00 2.5600E+00 5.4268E-01 5.4000E-01 6.2000E-01 6.5000E-01 BCL ORGN 605 MG/L n/a n/a n/a 4.7499E-01 4.9204E-01 5.4320E-01 5.6531E-01 BCL NH3NDISS 608 MG/L 0 0.0000E+00 0.0000E+00 0.0000E+00 0.0000E+00 0.0000E+00 0.0000E+00 BCL NH3N 610 MG/L 490 7.4160E-03 4.5390E-01 4.3939E-02 3.2960E-02 5.1796E-02 5.8691E-02 BCL NO2N 615 MG/L 211 0.0000E+00 2.5000E-02 1.1716E-02 1.0000E-02 1.5000E-02 1.6660E-02 BCL TKNDISS 623 MG/L 0 0.0000E+00 0.0000E+00 0.0000E+00 0.0000E+00 0.0000E+00 0.0000E+00 BCL TKN 625 MG/L n/a n/a n/a 5.1893E-01 5.2500E-01 5.9500E-01 6.2400E-01 BCL NO23N 630 MG/L 512 0.0000E+00 2.0400E-01 2.3751E-02 1.5000E-02 2.5000E-02 2.6000E-02 BCL TP 665 MG/L 1132 0.0000E+00 3.4000E-01 1.8121E-02 1.5270E-02 1.9317E-02 2.1000E-02 BCL OP04P 671 MG/L 0 0.0000E+00 0.0000E+00 0.0000E+00 0.0000E+00 0.0000E+00 0.0000E+00 BCL TOC 680 MG/L 274 2.0000E-02 6.3030E+01 1.6800E+01 1.4400E+01 2.0400E+01 2.2603E+01 BCL TOTCOLI 31501 N/100ML 236 0.0000E+00 6.7000E+04 4.6884E+02 4.5000E+01 1.0000E+02 1.9625E+02 BCL FCOLI 31625 N/100ML 0 0.0000E+00 0.0000E+00 0.0000E+00 0.0000E+00 0.0000E+00 0.0000E+00
Draft TMDL for Munson Slough/Munson Lake Watershed (WBIDs 807, 807C, and 807D) September 2008
15
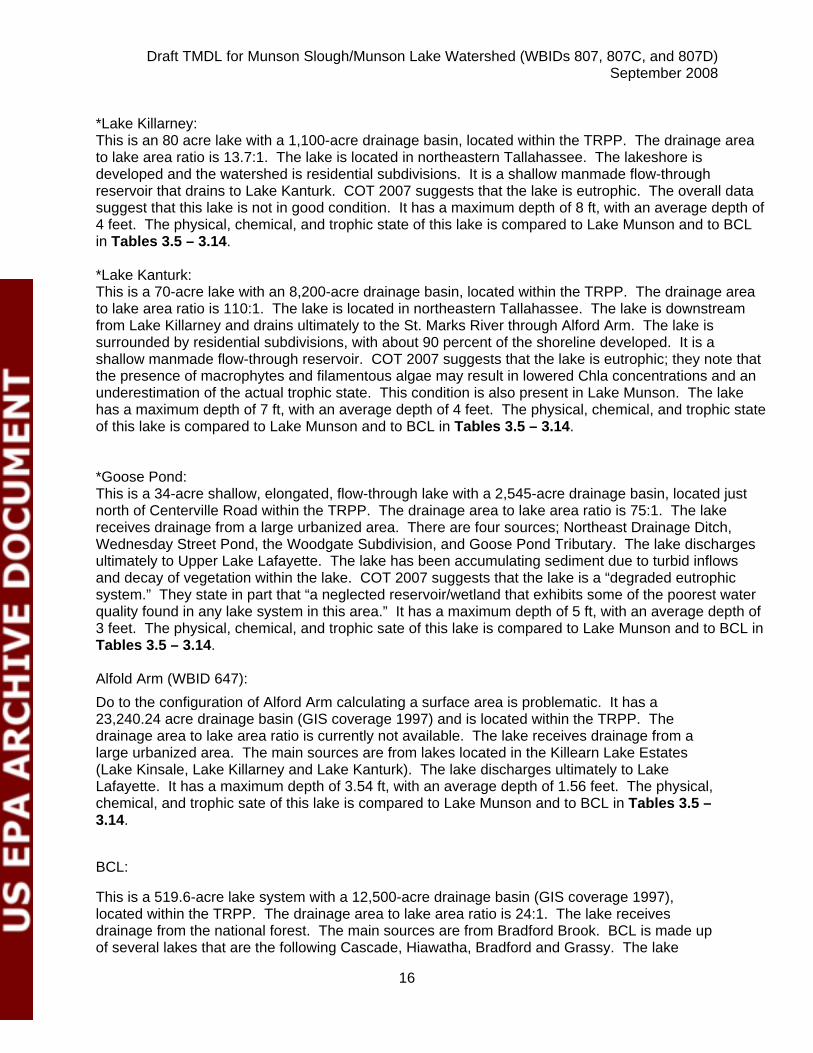
BCL CHLA 32211 UG/L 101 1.0000E+00 1.4240E+01 4.1409E+00 3.1150E+00 5.1044E+00 5.4713E+00 BCL PHAEOP 32218 UG/L 22 0.0000E+00 7.5000E+00 1.9550E+00 1.5000E+00 1.6400E+00 1.8350E+00
BCL LAKEDEPTH 72025 FT 0 0.0000E+00 0.0000E+00 0.0000E+00 0.0000E+00 0.0000E+00 0.0000E+00
A significant portion of the Lake Munson drainage basin lies within the Tallahassee Redhills Physiographic Province (TRPP). As such, several lakes located within this area were also reviewed as possible reference lakes and to gain insight into the appropriate trophic conditions for Lake Munson. These lakes include Tom Brown Park Lake, Lake A. J. Henry, Lake Hall, Lake Overstreet, Lake Killarney, Lake Kanturk, Goose Pond, and Alford Arm. Lakes of the Tallahassee Redhills Physiographic Province (TRPP): The descriptions and information for all lakes marked with * was taken from (COT 2007). *Tom Brown Park: This is a 6-acre lake with a 180-acre drainage basin, located within the TRPP. The drainage area to lake area ratio is 30:1. The lake drains some undeveloped park lands, a mixture of ball parks, recreational areas, a Museum, and the Federal Correction Facility. COT 2007, notes that stormwater is directly routed into the lake and that algal blooms are frequent. They characterize the trophic state as “expectedly eutrophic.” It has a maximum depth of 11 ft, with an average depth of 6 feet. The physical and chemical data and trophic state information of this lake are compared to Lake Munson and to BCL in Tables 3.5 – 3.14. *A. J. Henry Park Lake: This is a 14.3-acre lake with a 275-acre drainage basin, located within the TRPP. The drainage area to lake area ratio is 20:1. The lake drains heavily urbanized areas. The lake is a flow-through lake, ultimately draining to Alfred Arm. COT 2007 suggests that the lake is hypereutrophic, “a condition resulting from stormwater inflows with excessive concentrations of nutrients.” It has a maximum depth of 10 ft, with an average depth of 5 feet. The physical, chemical, and trophic state of this lake is compared to Lake Munson and to BCL in Tables 3.5 – 3.14. *Lake Hall: This is a 160 acre lake with a 1,000-acre drainage basin, located within the TRPP. The drainage area to lake area ratio is 6.2:1. The lake is located north of Interstate 10, with a portion of the lake within Maclay Gardens State Park. The lake is heavily used for recreation and the watershed is moderately developed. The lake is a flow-through lake, ultimately draining into Lake Overstreet. COT 2007 suggests that the lake TSI is declining over time, following declines in nitrogen. The data suggest that this lake is in excellent condition. It has a maximum depth of 30 ft, with an average depth of 14 feet. The physical, chemical, and trophic state of this lake is compared to Lake Munson and to BCL in Tables 3.5 – 3.14. *Lake Overstreet: This is a 140-acre lake with a 640-acre drainage basin, located within the TRPP. The drainage area to lake area ratio is 4.6:1. The lake, located north of Interstate 10, is within Maclay Gardens State Park. The lake is used for recreation and the watershed is mostly undeveloped. The lake receives water from Lake Hall. COT 2007 suggests that the lake as measured by Chla would be considered as oligotrophic. However, if production is measured by biomass of macrophytes, the lake could be considered as between eutrophic and hypereutrophic. The overall data suggest that this lake is in good condition. It has a maximum depth of 26 ft, with an average depth of 20 feet. The physical, chemical, and trophic state of this lake is compared to Lake Munson and to BCL in Tables 3.5 – 3.14.
Draft TMDL for Munson Slough/Munson Lake Watershed (WBIDs 807, 807C, and 807D) September 2008
16
*Lake Killarney: This is an 80 acre lake with a 1,100-acre drainage basin, located within the TRPP. The drainage area to lake area ratio is 13.7:1. The lake is located in northeastern Tallahassee. The lakeshore is developed and the watershed is residential subdivisions. It is a shallow manmade flow-through reservoir that drains to Lake Kanturk. COT 2007 suggests that the lake is eutrophic. The overall data suggest that this lake is not in good condition. It has a maximum depth of 8 ft, with an average depth of 4 feet. The physical, chemical, and trophic state of this lake is compared to Lake Munson and to BCL in Tables 3.5 – 3.14. *Lake Kanturk: This is a 70-acre lake with an 8,200-acre drainage basin, located within the TRPP. The drainage area to lake area ratio is 110:1. The lake is located in northeastern Tallahassee. The lake is downstream from Lake Killarney and drains ultimately to the St. Marks River through Alford Arm. The lake is surrounded by residential subdivisions, with about 90 percent of the shoreline developed. It is a shallow manmade flow-through reservoir. COT 2007 suggests that the lake is eutrophic; they note that the presence of macrophytes and filamentous algae may result in lowered Chla concentrations and an underestimation of the actual trophic state. This condition is also present in Lake Munson. The lake has a maximum depth of 7 ft, with an average depth of 4 feet. The physical, chemical, and trophic state of this lake is compared to Lake Munson and to BCL in Tables 3.5 – 3.14. *Goose Pond: This is a 34-acre shallow, elongated, flow-through lake with a 2,545-acre drainage basin, located just north of Centerville Road within the TRPP. The drainage area to lake area ratio is 75:1. The lake receives drainage from a large urbanized area. There are four sources; Northeast Drainage Ditch, Wednesday Street Pond, the Woodgate Subdivision, and Goose Pond Tributary. The lake discharges ultimately to Upper Lake Lafayette. The lake has been accumulating sediment due to turbid inflows and decay of vegetation within the lake. COT 2007 suggests that the lake is a “degraded eutrophic system.” They state in part that “a neglected reservoir/wetland that exhibits some of the poorest water quality found in any lake system in this area.” It has a maximum depth of 5 ft, with an average depth of 3 feet. The physical, chemical, and trophic sate of this lake is compared to Lake Munson and to BCL in Tables 3.5 – 3.14. Alfold Arm (WBID 647): Do to the configuration of Alford Arm calculating a surface area is problematic. It has a 23,240.24 acre drainage basin (GIS coverage 1997) and is located within the TRPP. The drainage area to lake area ratio is currently not available. The lake receives drainage from a large urbanized area. The main sources are from lakes located in the Killearn Lake Estates (Lake Kinsale, Lake Killarney and Lake Kanturk). The lake discharges ultimately to Lake Lafayette. It has a maximum depth of 3.54 ft, with an average depth of 1.56 feet. The physical, chemical, and trophic sate of this lake is compared to Lake Munson and to BCL in Tables 3.5 – 3.14. BCL:
This is a 519.6-acre lake system with a 12,500-acre drainage basin (GIS coverage 1997), located within the TRPP. The drainage area to lake area ratio is 24:1. The lake receives drainage from the national forest. The main sources are from Bradford Brook. BCL is made up of several lakes that are the following Cascade, Hiawatha, Bradford and Grassy. The lake
Draft TMDL for Munson Slough/Munson Lake Watershed (WBIDs 807, 807C, and 807D) September 2008
17
discharges ultimately to Munson Slough. It has a maximum depth of 2.80 ft, with an average depth of 1.33 feet. The physical, chemical, and trophic state of this lake is compared to Munson Lake are contained in Tables 3.5 – 3.14.
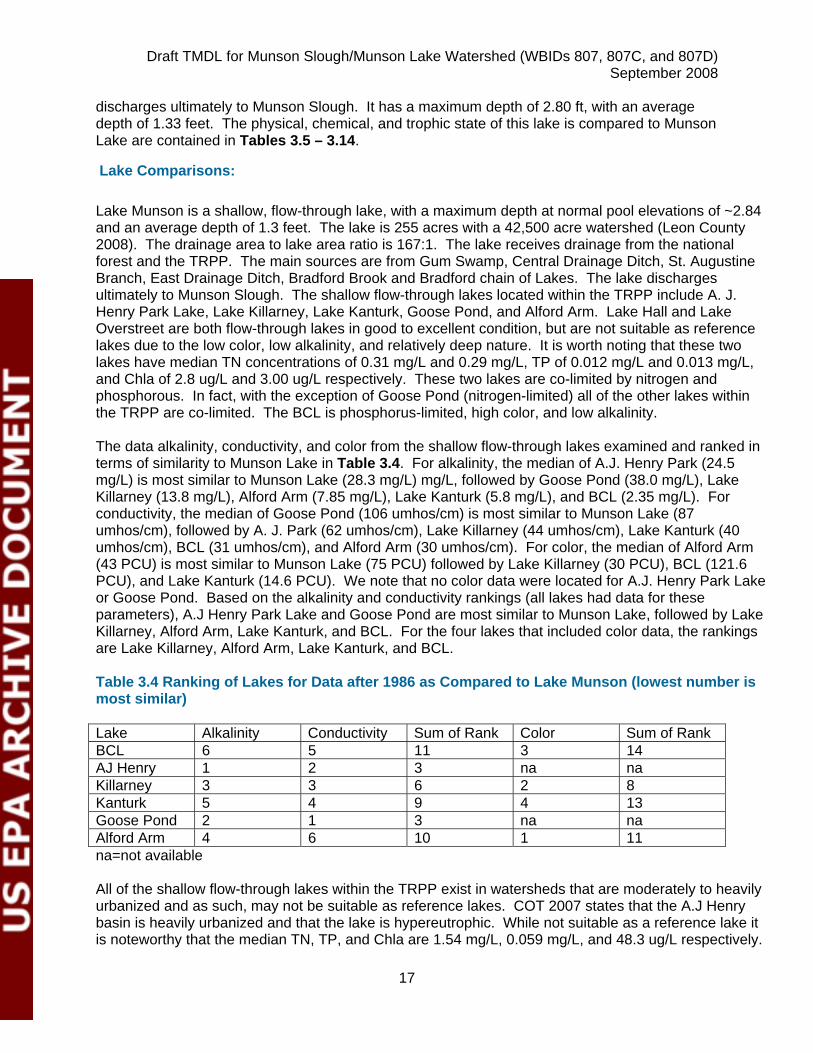
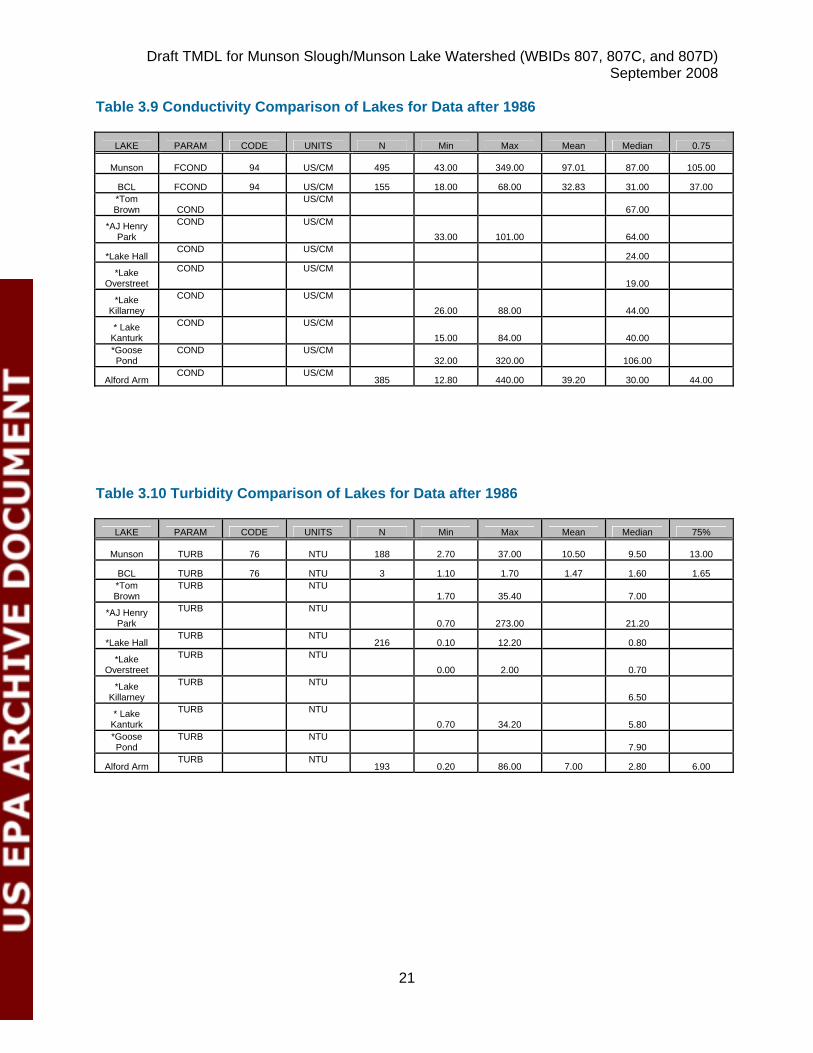
Lake Comparisons: Lake Munson is a shallow, flow-through lake, with a maximum depth at normal pool elevations of ~2.84 and an average depth of 1.3 feet. The lake is 255 acres with a 42,500 acre watershed (Leon County 2008). The drainage area to lake area ratio is 167:1. The lake receives drainage from the national forest and the TRPP. The main sources are from Gum Swamp, Central Drainage Ditch, St. Augustine Branch, East Drainage Ditch, Bradford Brook and Bradford chain of Lakes. The lake discharges ultimately to Munson Slough. The shallow flow-through lakes located within the TRPP include A. J. Henry Park Lake, Lake Killarney, Lake Kanturk, Goose Pond, and Alford Arm. Lake Hall and Lake Overstreet are both flow-through lakes in good to excellent condition, but are not suitable as reference lakes due to the low color, low alkalinity, and relatively deep nature. It is worth noting that these two lakes have median TN concentrations of 0.31 mg/L and 0.29 mg/L, TP of 0.012 mg/L and 0.013 mg/L, and Chla of 2.8 ug/L and 3.00 ug/L respectively. These two lakes are co-limited by nitrogen and phosphorous. In fact, with the exception of Goose Pond (nitrogen-limited) all of the other lakes within the TRPP are co-limited. The BCL is phosphorus-limited, high color, and low alkalinity. The data alkalinity, conductivity, and color from the shallow flow-through lakes examined and ranked in terms of similarity to Munson Lake in Table 3.4. For alkalinity, the median of A.J. Henry Park (24.5 mg/L) is most similar to Munson Lake (28.3 mg/L) mg/L, followed by Goose Pond (38.0 mg/L), Lake Killarney (13.8 mg/L), Alford Arm (7.85 mg/L), Lake Kanturk (5.8 mg/L), and BCL (2.35 mg/L). For conductivity, the median of Goose Pond (106 umhos/cm) is most similar to Munson Lake (87 umhos/cm), followed by A. J. Park (62 umhos/cm), Lake Killarney (44 umhos/cm), Lake Kanturk (40 umhos/cm), BCL (31 umhos/cm), and Alford Arm (30 umhos/cm). For color, the median of Alford Arm (43 PCU) is most similar to Munson Lake (75 PCU) followed by Lake Killarney (30 PCU), BCL (121.6 PCU), and Lake Kanturk (14.6 PCU). We note that no color data were located for A.J. Henry Park Lake or Goose Pond. Based on the alkalinity and conductivity rankings (all lakes had data for these parameters), A.J Henry Park Lake and Goose Pond are most similar to Munson Lake, followed by Lake Killarney, Alford Arm, Lake Kanturk, and BCL. For the four lakes that included color data, the rankings are Lake Killarney, Alford Arm, Lake Kanturk, and BCL. Table 3.4 Ranking of Lakes for Data after 1986 as Compared to Lake Munson (lowest number is most similar) Lake Alkalinity Conductivity Sum of Rank Color Sum of Rank BCL 6 5 11 3 14 AJ Henry 1 2 3 na na Killarney 3 3 6 2 8 Kanturk 5 4 9 4 13 Goose Pond 2 1 3 na na Alford Arm 4 6 10 1 11 na=not available All of the shallow flow-through lakes within the TRPP exist in watersheds that are moderately to heavily urbanized and as such, may not be suitable as reference lakes. COT 2007 states that the A.J Henry basin is heavily urbanized and that the lake is hypereutrophic. While not suitable as a reference lake it is noteworthy that the median TN, TP, and Chla are 1.54 mg/L, 0.059 mg/L, and 48.3 ug/L respectively.
Draft TMDL for Munson Slough/Munson Lake Watershed (WBIDs 807, 807C, and 807D) September 2008
18
In this case, the median lake TP in this hypereutrophic lake is less than 0.06 mg/L. COT 2007 notes that Goose Pond receives drainage from a large urbanized watershed and is a “degraded eutrophic system” with “some of the poorest water quality found in any lake system in the area.” Based on this characterization Goose Pond is not suitable as a reference lake. However, we note that the median TN, TP, and Chla are 0.57 mg/L, 0.062 mg/L, and 10.1 ug/L respectively. Alford Arm, while not a true "lake" is flow through, shallow and has other characteristics similar to Lake Munson. Alford Arm has median concentrations for TN, TP, and Chla of 0.60 mg/L, 0.044 mg/L, and 8.3 ug/L respectively. The TN/TP ratio for Alford Arm is 13.6. Lake Killarney, characterized by COT, as eutrophic and surrounded by residential development has a median TN, TP, and Chla of 0.73 mg/L, 0.033 mg/L, and 11.8 ug/L respectively. The trophic state target for developing a nutrient TMDL for Lake Munson is a long-term average TSI less than 60. Based on the evaluation of similar lakes within the TRPP, achieving co-limitation of TN and TP should also be factored into the restoration of the lake. Based on the condition of all lakes evaluated within the TRPP (except Goose Pond which is slightly n-limited with a ratio of 9.3) co-limitation is a reasonable target for Munson Lake. The average TN/TP ratio for the co-limited lakes within the TRPP is 21.8. EPA has proposed nutrient TMDLs for tributaries of Lake Munson. Although these TMDLs are considered to be protective of the tributaries, based on this evaluation, the proposed stream concentrations (0.72 mg/L for TN and 0.15 mg/L for TP) are not expected to result in Lake Munson achieving a targeted trophic state of mesotrophic and co-limitation for TN and TP. Identifying a more specific TSI target than simply achieving a long-term average TSI less than 60 is an important part of developing the TMDL. Acknowledging that Lake Munson would not have historically been identical to BCL does not negate the information contained in the data for BCL. Acknowledging that moderately impacted lakes located within the TRPP have TN and TP median concentrations lower than the nutrient targets developed for tributaries to Lake Munson suggests that these stream concentrations may not be protective of Lake Munson. The following lake classification system was selected by the COT 2007 to assess concentrations of TN, TP, and Chla relative to trophic state. TP ≥ 0.1 mg/L = hypereutrophic TP ≥ 0.025 and < 0.1 mg/L = eutrophic TP ≥ 0.015 and < 0.025 mg/L = mesotrophic TP < 0.015 mg/L = oligotrophic TN ≥ 1.5 mg/L = hypereutrophic TN ≥ 0.601 mg/L and < 1.5 mg/L = eutrophic TN ≥ 0.4 mg/L and < 0.6 mg/L = mesotrophic TN < 0.4 mg/L = oligotrophic Chla ≥ 40 ug/L = hypereutrophic Chla ≥ 7.0 ug/L and < 40 ug/L = eutrophic Chla ≥ 4.0 ug/L and < 7.0 ug/L = mesotrophic Chla < 4.0 ug/l = oligotrophic Given the data for the lakes located within the TRPP, the 75th percentile of BCL, data for Lake Munson and the thresholds selected by the COT for mesotrophic lakes it appears reasonable to
Draft TMDL for Munson Slough/Munson Lake Watershed (WBIDs 807, 807C, and 807D) September 2008
19
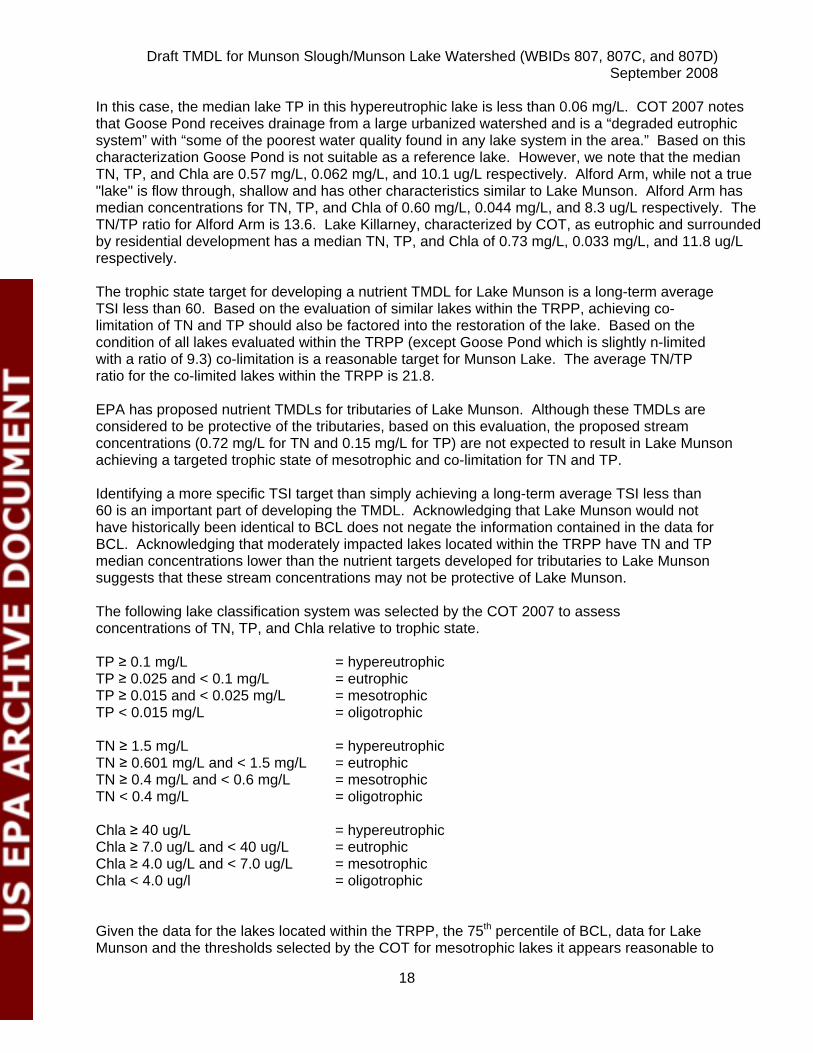
incorporate these thresholds developed by the COT into the information used to establish the TMDL targets. The COT thresholds suggest the upper limits of mesotrophic and co-limitation of TN and TP would be possible targets for the Lake Munson nutrient TMDL. The thresholds for mesotrophic lakes suggested by the COT report would be a TN of 0.60 mg/L, TP of 0.025 mg/L, a Chla of 7.0 ug/L, and a TN/TP ratio of 24. Table 3.5 Chla Comparison of Lakes for Data after 1986
LAKE PARAM CODE UNITS N Min Max Mean Median 75%
Munson Chla 32211 UG/L 87 1.00 201.40 33.60 13.49 45.08
BCL Chla 32211 UG/L 101 1.00 14.24 4.14 3.12 5.47 *Tom Brown Chla
UG/L 1.20 114.00 14.00
*AJ Henry Park Chla
UG/L 48.30
*Lake Hall Chla UG/L
220 0.00 24.10 2.80
*Lake Overstreet Chla
UG/L 3.00
*Lake Killarney Chla
UG/L 127.60 11.80
* Lake Kanturk Chla
UG/L 150.00 9.90
*Goose Pond Chla
UG/L 10.10
Alford Arm Chla UG/L
149 1.00 227.00 17.50 8.30 15.00
Table 3.6 TN Comparison of Lakes for Data after 1986
LAKE PARAM CODE UNITS N Min Max Mean Median 75%
Munson TN 600 MG/L 545 0.00 10.46 1.07 0.73 1.15
BCL TN 600 MG/L 1504 0.00 2.56 0.54 0.54 0.65 *Tom Brown TN
MG/L ~0.39 ~0.83 0.54
*AJ Henry Park
TN
MG/L 1.54
*Lake Hall TN
MG/L
~0.24 ~0.39 0.31
*Lake Overstreet
TN
MG/L ~.21 ~.33 0.29
*Lake Killarney
TN
MG/L ~0.47 ~0.98 0.73
* Lake Kanturk
TN
MG/L ~0.47 ~1.5 0.68
*Goose Pond
TN
MG/L ~0.47 ~1.1 0.57
Alford Arm TN
MG/L
235 0.03 4.50 0.74 0.60 0.85
~ data inferred from graphs in COT 2007
Draft TMDL for Munson Slough/Munson Lake Watershed (WBIDs 807, 807C, and 807D) September 2008
20
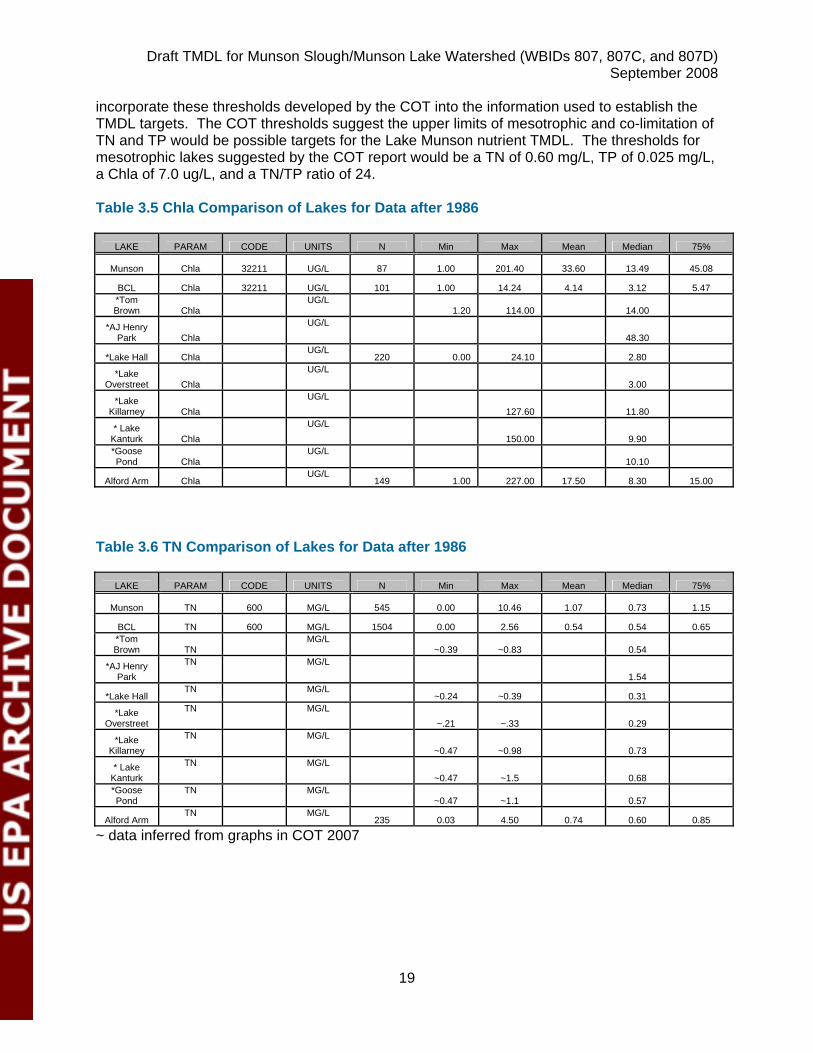
Table 3.7 TP Comparison of Lakes for Data after 1986 LAKE PARAM CODE UNITS N Min Max Mean Median 75%
Munson TP 665 MG/L 453 0.000 7.300 0.320 0.200 0.307
BCL TP 665 MG/L 1132 0.000 0.340 0.018 0.015 0.021 *Tom Brown
TP
MG/L <0.01 0.043 0.023
*AJ Henry Park
TP
MG/L 0.059
*Lake Hall TP
MG/L
<.01 ~0.016 0.012
*Lake Overstreet
TP
MG/L ~.012 ~0.016 0.013
*Lake Killarney
TP
MG/L ~0.019 ~0.042 0.033
* Lake Kanturk
TP
MG/L ~0.02 ~0.85 0.037
*Goose Pond
TP
MG/L ~0.033 ~0.1 0.062
Alford Arm TP
MG/L
178 0.003 0.640 0.780 0.044 0.096
~ data inferred from graphs in COT 2007 Table 3.8 TN/TP Ratio Comparison of Lakes for Data after 1986
LAKE PARAM CODE UNITS N Min Max Mean Median 75%
Munson TN/TP Ratio none 3.3 3.6 3.7
BCL TN/TP
Ratio none 29.9 35.4 30.9 *Tom Brown
TN/TP Ratio none 21.8 23.5
*AJ Henry Park
TN/TP Ratio none 17.2 26.1
*Lake Hall TN/TP
Ratio none 25.8
*Lake Overstreet
TN/TP Ratio none 21.5
*Lake Killarney
TN/TP Ratio none 23.7
* Lake Kanturk
TN/TP Ratio none 18.4
*Goose Pond
TN/TP Ratio none 9.3
Alford Arm TN/TP
Ratio none 13.6
Draft TMDL for Munson Slough/Munson Lake Watershed (WBIDs 807, 807C, and 807D) September 2008
21
Table 3.9 Conductivity Comparison of Lakes for Data after 1986
LAKE PARAM CODE UNITS N Min Max Mean Median 0.75
Munson FCOND 94 US/CM 495 43.00 349.00 97.01 87.00 105.00
BCL FCOND 94 US/CM 155 18.00 68.00 32.83 31.00 37.00 *Tom Brown COND
US/CM 67.00
*AJ Henry Park
COND
US/CM 33.00 101.00 64.00
*Lake Hall COND
US/CM
24.00
*Lake Overstreet
COND
US/CM 19.00
*Lake Killarney
COND
US/CM 26.00 88.00 44.00
* Lake Kanturk
COND
US/CM 15.00 84.00 40.00
*Goose Pond
COND
US/CM 32.00 320.00 106.00
Alford Arm COND
US/CM
385 12.80 440.00 39.20 30.00 44.00
Table 3.10 Turbidity Comparison of Lakes for Data after 1986
LAKE PARAM CODE UNITS N Min Max Mean Median 75%
Munson TURB 76 NTU 188 2.70 37.00 10.50 9.50 13.00
BCL TURB 76 NTU 3 1.10 1.70 1.47 1.60 1.65 *Tom Brown
TURB
NTU 1.70 35.40 7.00
*AJ Henry Park
TURB
NTU 0.70 273.00 21.20
*Lake Hall TURB
NTU
216 0.10 12.20 0.80
*Lake Overstreet
TURB
NTU 0.00 2.00 0.70
*Lake Killarney
TURB
NTU 6.50
* Lake Kanturk
TURB
NTU 0.70 34.20 5.80
*Goose Pond
TURB
NTU 7.90
Alford Arm TURB
NTU
193 0.20 86.00 7.00 2.80 6.00
Draft TMDL for Munson Slough/Munson Lake Watershed (WBIDs 807, 807C, and 807D) September 2008
22
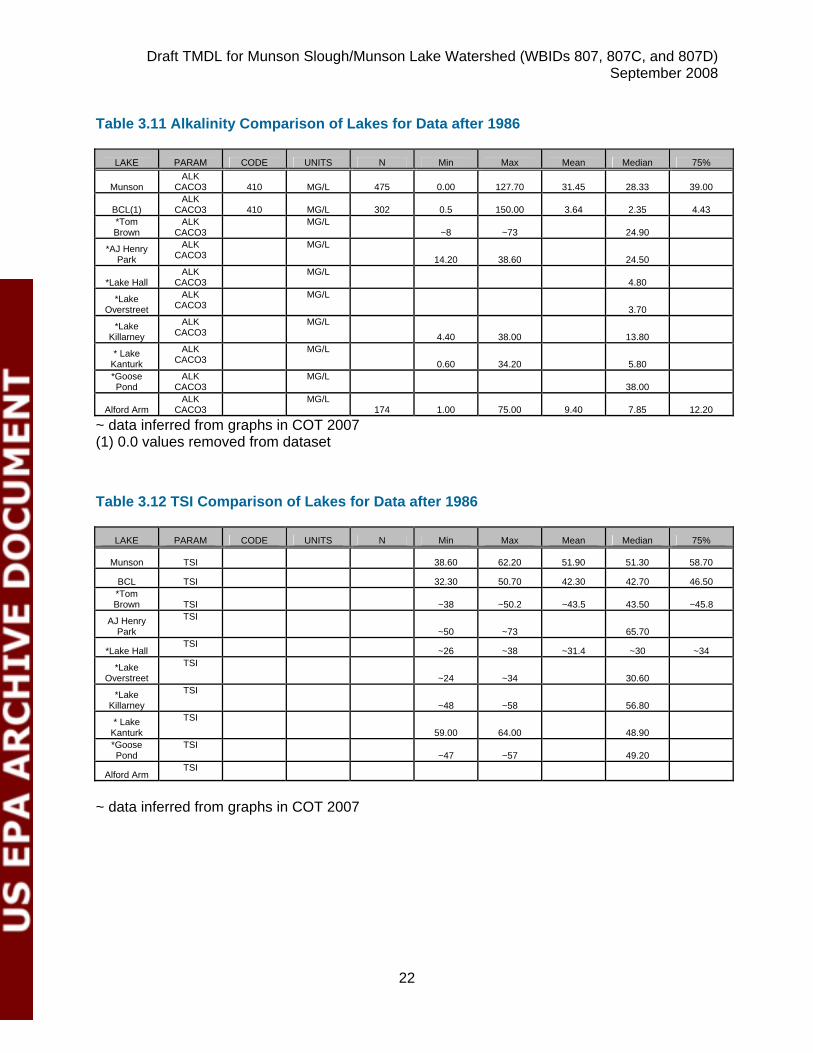
Table 3.11 Alkalinity Comparison of Lakes for Data after 1986
LAKE PARAM CODE UNITS N Min Max Mean Median 75%
Munson ALK
CACO3 410 MG/L 475 0.00 127.70 31.45 28.33 39.00
BCL(1) ALK
CACO3 410 MG/L 302 0.5 150.00 3.64 2.35 4.43 *Tom Brown
ALK CACO3
MG/L ~8 ~73 24.90
*AJ Henry Park
ALK CACO3
MG/L 14.20 38.60 24.50
*Lake Hall ALK
CACO3 MG/L
4.80
*Lake Overstreet
ALK CACO3
MG/L 3.70
*Lake Killarney
ALK CACO3
MG/L 4.40 38.00 13.80
* Lake Kanturk
ALK CACO3
MG/L 0.60 34.20 5.80
*Goose Pond
ALK CACO3
MG/L 38.00
Alford Arm ALK
CACO3 MG/L
174 1.00 75.00 9.40 7.85 12.20
~ data inferred from graphs in COT 2007 (1) 0.0 values removed from dataset Table 3.12 TSI Comparison of Lakes for Data after 1986
LAKE PARAM CODE UNITS N Min Max Mean Median 75%
Munson TSI 38.60 62.20 51.90 51.30 58.70
BCL TSI 32.30 50.70 42.30 42.70 46.50 *Tom Brown TSI ~38 ~50.2 ~43.5 43.50 ~45.8
AJ Henry Park
TSI ~50 ~73 65.70
*Lake Hall TSI
~26 ~38 ~31.4 ~30 ~34
*Lake Overstreet
TSI ~24 ~34 30.60
*Lake Killarney
TSI ~48 ~58 56.80
* Lake Kanturk
TSI 59.00 64.00 48.90
*Goose Pond
TSI ~47 ~57 49.20
Alford Arm TSI
~ data inferred from graphs in COT 2007
Draft TMDL for Munson Slough/Munson Lake Watershed (WBIDs 807, 807C, and 807D) September 2008
23
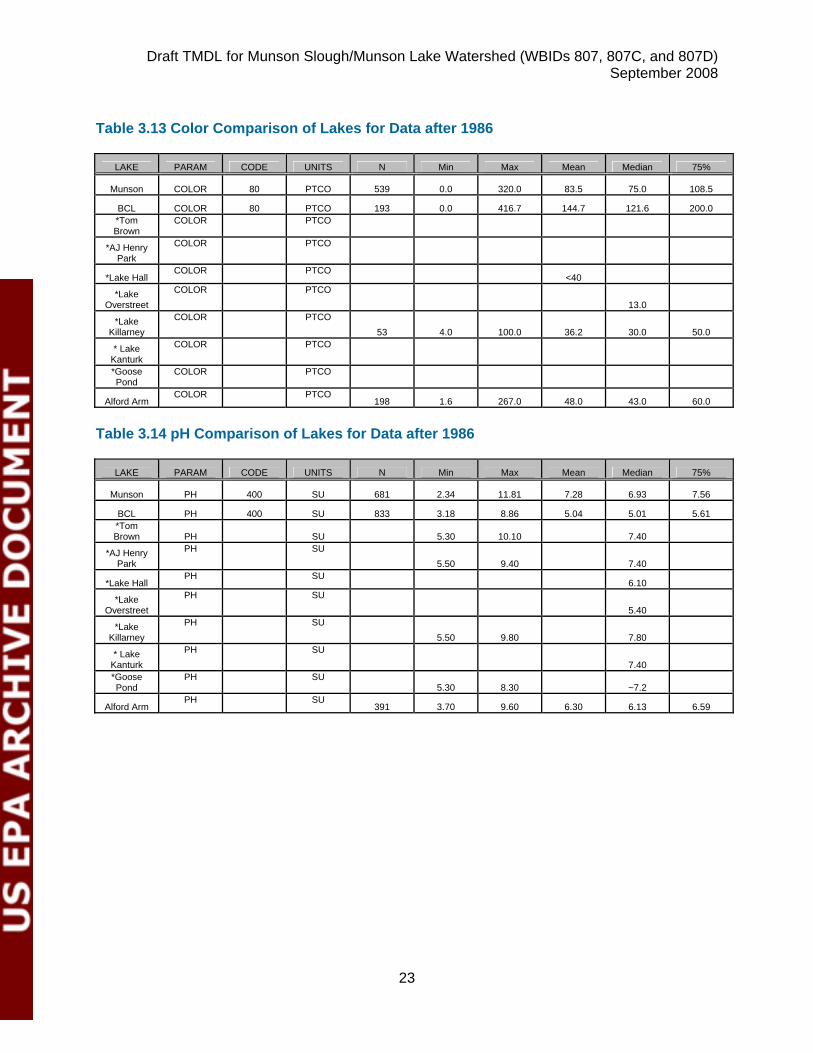
Table 3.13 Color Comparison of Lakes for Data after 1986
LAKE PARAM CODE UNITS N Min Max Mean Median 75%
Munson COLOR 80 PTCO 539 0.0 320.0 83.5 75.0 108.5
BCL COLOR 80 PTCO 193 0.0 416.7 144.7 121.6 200.0 *Tom Brown
COLOR
PTCO
*AJ Henry Park
COLOR
PTCO
*Lake Hall COLOR
PTCO
<40
*Lake Overstreet
COLOR
PTCO 13.0
*Lake Killarney
COLOR
PTCO 53 4.0 100.0 36.2 30.0 50.0
* Lake Kanturk
COLOR
PTCO
*Goose Pond
COLOR
PTCO
Alford Arm COLOR
PTCO
198 1.6 267.0 48.0 43.0 60.0
Table 3.14 pH Comparison of Lakes for Data after 1986
LAKE PARAM CODE UNITS N Min Max Mean Median 75%
Munson PH 400 SU 681 2.34 11.81 7.28 6.93 7.56
BCL PH 400 SU 833 3.18 8.86 5.04 5.01 5.61 *Tom Brown PH SU 5.30 10.10 7.40
*AJ Henry Park
PH
SU 5.50 9.40 7.40
*Lake Hall PH
SU
6.10
*Lake Overstreet
PH
SU 5.40
*Lake Killarney
PH
SU 5.50 9.80 7.80
* Lake Kanturk
PH
SU 7.40
*Goose Pond
PH
SU 5.30 8.30 ~7.2
Alford Arm PH
SU
391 3.70 9.60 6.30 6.13 6.59
Draft TMDL for Munson Slough/Munson Lake Watershed (WBIDs 807, 807C, and 807D) September 2008
24
Chapter 4: ASSESSMENT OF SOURCES
4.1 Types of Sources
An important part of the TMDL analysis is the identification of pollutant source categories, source subcategories, or individual sources of nutrients in the watershed and the amount of pollutant loading contributed by each of these sources. Sources are broadly classified as either “point sources” or “nonpoint sources.” Historically, the term point sources has meant discharges to surface waters that typically have a continuous flow via a discernable, confined, and discrete conveyance, such as a pipe. Domestic and industrial wastewater treatment facilities (WWTFs) are examples of traditional point sources. In contrast, the term “nonpoint sources” was used to describe intermittent, rainfall driven, diffuse sources of pollution associated with everyday human activities, including runoff from urban land uses, agriculture, silviculture, and mining; discharges from failing septic systems; and atmospheric deposition. However, the 1987 amendments to the Clean Water Act redefined certain nonpoint sources of pollution as point sources subject to regulation under the EPA’s National Pollutant Discharge Elimination Program (NPDES). These nonpoint sources included certain urban stormwater discharges, including those from local government master drainage systems, construction sites over five acres, and a wide variety of industries (see Appendix A for background information on the federal and state stormwater programs). To be consistent with Clean Water Act definitions, the term “point source” will be used to describe traditional point sources (such as domestic and industrial wastewater discharges) and stormwater systems requiring an NPDES stormwater permit when allocating pollutant load reductions required by a TMDL (see Section 6.1). However, the methodologies used to estimate nonpoint source loads do not distinguish between NPDES stormwater discharges and non-NPDES stormwater discharges, and as such, this source assessment section does not make any distinction between the two types of stormwater.
4.2 Potential Sources of Nutrients in the Munson Slough/Lake Munson
Watershed
4.2.1 Point Sources
In Leon County, there are currently 15 permitted wastewater treatment facilities that are located in the Munson Slough/Lake Munson Watershed. These facilities are permitted through the NPDES Program in Florida. During the past decade, several treatment plants have changed their discharge point and or treatment process (Table 4.1). These facilities do not directly discharge to surface waters, so they do not have a wasteload allocation. The facilities are the following: Ready Mix USA- Mosely Street Plant (FLG11358), Florida Rock- Tallahassee (FLG110319), Trinity Materials Plant 32 (FLG110307), Lake Bradford Estates STP (FLA010148), Sandstone Ranch WWTF (FLA010167), National High Magnetic Field Laboratory- FSU (FLA01633), Southern Bell Trailer Park (FLA010151), Western Estates MHP (FLA010152), Lake Bradford Road WWTP (FLA010140) and T.P. Smith Water Reclamation Facility (FLA010139).
Draft TMDL for Munson Slough/Munson Lake Watershed (WBIDs 807, 807C, and 807D) September 2008
25
Ready Mix USA-Mosely Street Plant, Florida Rock-Tallahassee and Trinity Materials Plant 32 are considered general industrial waste permits and discharge to a Type I pond. No monitoring is required for these ponds and they only discharge during wet weather events. Nutrients are probably not a source from this facility. Ready Mix USA-Mosely Street Plant was recently permitted on 05/07/2007 and is not due for permit renewal until 05/06/2012. Florida Rock-Tallahassee was originally permitted on 02/05/2001 with a current status of active and is not due for renewal until 02/05/2011. Trinity Materials Plant 32 was originally permitted on 12/28/1995 with a current status of active and is not due for renewal until 01/18/2012. National High Magnetic Field Laboratory- FSU (NHMFL) is located in south of Roberts Ave and east of WDD/Munson Slough. NHMFL develops and operates high magnetic field facilities that are used for several scientific research projects. NHMFL buildings produce wastewater from air conditioning condensate and cooling tower blowdown water. This wastewater is then land applied by a timed and zone irrigation system, to the public area surrounding the NHMFL facilities. This facility not considered a source of nutrients. Sandstone Ranch WWTF is located south of Blountstown Hwy and north of Bradford Brook. Sandstone is a 0.0707 million gallons per day (MGD) annual average daily flow (AADF) wastewater treatment facility with a rapid infiltration basin system consisting of two percolation ponds. This system currently contains surge tanks, influent screening, aeration, and anoxic zone, a re-aeration zone clarification, and disinfection. Sandstone Ranch WWTF will be under going construction to expand the existing WWTP from 0.070 MGD to 0.25 MGD AADF. The proposed headworks will consist of a mechanical screen unit, two-basin aerobic Sequential Batch Reactor (SBR) system to be operated on a four-cycle per day per basin schedule, two chlorine contact chambers, two sludge digesters, and two sludge drying beds. Residuals are aerobically digested on beds and transported to Lake Jackson WWTP. This facility is not considered to be a significant source of nutrients. Southern Bell Trailer Park is located north of US 90 and to the west of North Gum Branch Creek. Southern Bell Trailer Park is a 0.025 MGD AADF activated sludge wastewater treatment facility with a slow-rate public access system, surface drip irrigation system, consisting of two one-half acre fields. Southern Bell Trailer Park contains a grease trap, a wet well, a surge tank, an anoxic tank, five aeration tanks, two clarifiers, two pyradeck polishing clarifiers, two chlorine contact chamber, two digestor tanks, a micro aeration tank and a reclaimed water pump tank. Recently, Southern Bell Trailer Park has had a number of compliance issues ranging from a failure to have a certified operator to not complying with the monitoring requirements of the permit. Southern Bell Trailer Park recently also had a sewage leak. This is believed to be due to a lack of maintenance. This facility is not considered to be a significant source of nutrients. Lake Bradford Estates Mobile Home Park is located east of Lake Bradford Rd and west of Black Swamp. Lake Bradford MHP is a 0.043 MGD AADF activated sludge wastewater treatment facility with an absorption field and land application system. The system consists of three absorption beds which have a capacity of 0.043 MGD. Lake Bradford Estates MHP contains equalization, nitrification/denitrification, re-aeration, secondary clarification, chlorination, and digester. Residuals are transported to T.P. Smith Water Reclamation Facility (WRF) for treatment and disposal. In the past, Lake Bradford Estates MHP has had a compliance issue. This facility is not considered to be a significant source of nutrients.
Draft TMDL for Munson Slough/Munson Lake Watershed (WBIDs 807, 807C, and 807D) September 2008
26
Western Estates Mobile Home Parks is located north of Blountstown Hwy and to the south of West Gum Branch Creek. Western Estates MHP is a 0.02 MGD AADF activated sludge wastewater treatment facility. The system contains a Part IV rapid-rate land application system, consisting of two dual absorption beds. Western Estates MHP operates an extended aeration mode. The treatment facility has provisions for nitrification, denitrification, re-aeration, secondary clarification, filter, disinfection, dozing tank and aerobic digestion of residuals. Residuals will be transported to a Class I or II landfill or a residual management facility for further treatment and disposal. In the past Western Estates MHP has had a number of compliance issues due the lack of maintenance on the system. At one point in time Western Estates MHP was trying to tie into the City of Tallahassee (COT) sewer service. This facility is not considered to be a significant source of nutrients. Lake Bradford Road WWTF is located in between Lake Bradford Rd and Central Drainage Ditch. Lake Bradford Rd WWTF is a 4.5 MGD AADF, but will be modified to a membrane bioreactor process advanced wastewater treatment (AWT) plant producing reclaimed water. The system currently contains reclaimed water that is pumped to an existing slow rate restricted public access facility outside the Munson Slough/Lake Munson Watershed. Southeast Farm Spray Field is operated and monitored by the T.P. Smith WRF and is regulated by permit number FLA010139. Along with the Southeast Farm Spray Field, a new 4.5 MGD AADF slow-rate public access system will be built. The construction date will be determined after a feasibility study is conducted. The modified treatment process will include coarse screening, grit removal, a flow equalization tank, primary clarification, fine screening, four stage Bardenpho nitrogen removal process, membrane filtration, high-level disinfection using sodium hypochlorite, and a 1.0 MG Reclaimed Water Storage Tank. All or part of the influent flow can be redirected to the T.P. Smith WRF for treatment. Residuals are not treated at this facility; primary sludge from the primary clarifiers and waste activated sludge from the Bardenpho process are transferred via the COT sewage collection system to the T.P. Smith WRF for further treatment. As of February 3, 2008, the Lake Bradford Rd WWTF has discontinued processing flows. This is due to the upgrades that are occurring to the plant. Lake Bradford Road WWTF is not likely to be a source of nutrients to the watershed. This facility is not a source of nutrients to this basin. T.P. Smith WRF is located at the corner of Capital Circle and Springhill Rd and to the west of Munson Slough. T.P. Smith WRF is a modified 26.5 MGD AADF existing treatment system, but will be modified to a four-stage Bardenpho type activated sludge process, advanced wastewater treatment (AWT) plant producing reclaimed water. T.P Smith WRF contains 23.25 MDG AADF and a 7.31 MGD AADF slow-rate restricted public access system, located outside the Munson Slough/Lake Munson Watershed at the Southeast Farm Spray Field. A 0.8 MDG AADF slow-rate restricted public access system, located inside the Munson Slough/Lake Munson Watershed at the T.P. Smith WRF. A new 1.2 MGD AADF slow-rate public access system is the planning stages and will consist of reclaimed water. The modified treatment system consists of new headworks and three substantially modified treatment trains: Train 2 (6.9 MGD), Train 3 (6.9 MGD) and Train 4 (12.7 MGD). Pretreatment at the new headworks consists of coarse screening, grit removal odor mitigation and flow equalization. Flow equalization is used if storm flows exceed 53 MGD peak hourly flow and it consists of a diversion structure and a 30 MGD flow equalization basin. The modified treatment process at each of the three trains includes: primary clarification, primary effluent pumping, four stage Bardenpho nitrogen removal process, secondary clarification, tertiary filtration with deep-bed sand filters, high-level disinfection using chlorine, and a 97 MG of reclaimed water storage in six effluent storage ponds at the T.P. Smith WRF. This facility is not a source of nutrients to this basin.
Draft TMDL for Munson Slough/Munson Lake Watershed (WBIDs 807, 807C, and 807D) September 2008
27
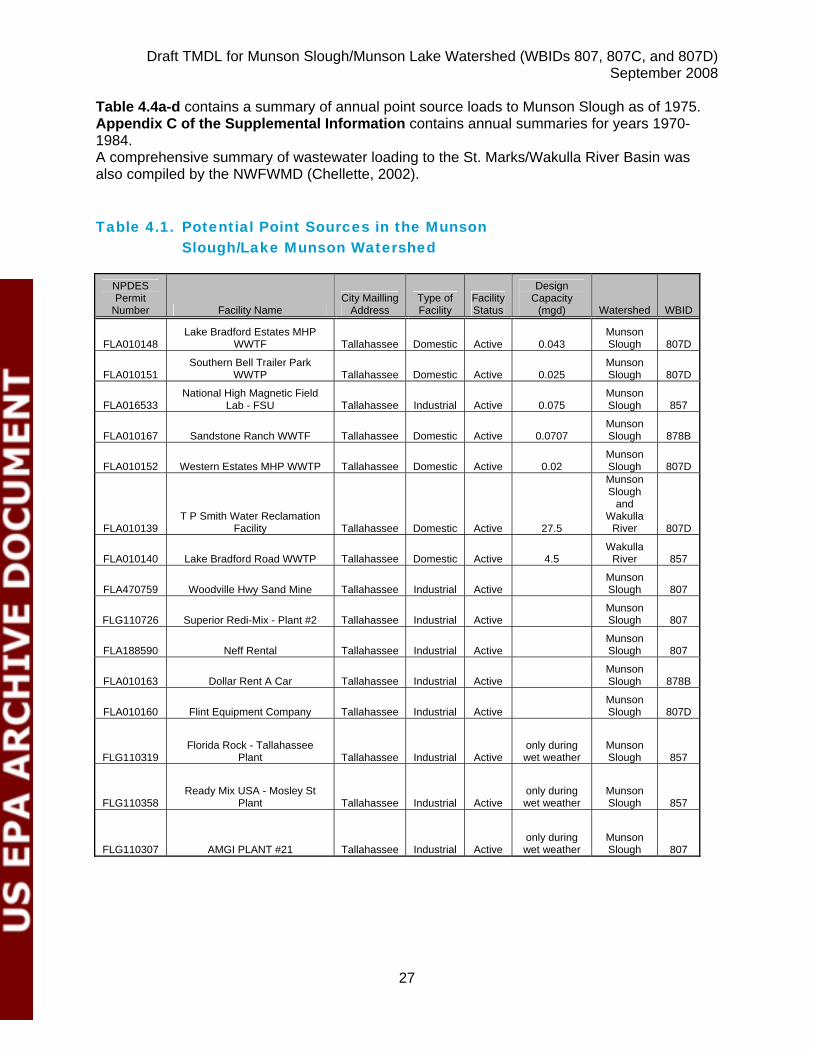
Table 4.4a-d contains a summary of annual point source loads to Munson Slough as of 1975. Appendix C of the Supplemental Information contains annual summaries for years 1970-1984. A comprehensive summary of wastewater loading to the St. Marks/Wakulla River Basin was also compiled by the NWFWMD (Chellette, 2002).
Table 4.1. Potential Point Sources in the Munson
Slough/Lake Munson Watershed
NPDES Permit
Number Facility Name City Mailling
Address Type of Facility
Facility Status
Design Capacity
(mgd) Watershed WBID
FLA010148 Lake Bradford Estates MHP
WWTF Tallahassee Domestic Active 0.043 Munson Slough 807D
FLA010151 Southern Bell Trailer Park
WWTP Tallahassee Domestic Active 0.025 Munson Slough 807D
FLA016533 National High Magnetic Field
Lab - FSU Tallahassee Industrial Active 0.075 Munson Slough 857
FLA010167 Sandstone Ranch WWTF Tallahassee Domestic Active 0.0707 Munson Slough 878B
FLA010152 Western Estates MHP WWTP Tallahassee Domestic Active 0.02 Munson Slough 807D
FLA010139 T P Smith Water Reclamation
Facility Tallahassee Domestic Active 27.5
Munson Slough
and Wakulla
River 807D
FLA010140 Lake Bradford Road WWTP Tallahassee Domestic Active 4.5 Wakulla
River 857
FLA470759 Woodville Hwy Sand Mine Tallahassee Industrial Active Munson Slough 807
FLG110726 Superior Redi-Mix - Plant #2 Tallahassee Industrial Active Munson Slough 807
FLA188590 Neff Rental Tallahassee Industrial Active Munson Slough 807
FLA010163 Dollar Rent A Car Tallahassee Industrial Active Munson Slough 878B
FLA010160 Flint Equipment Company Tallahassee Industrial Active Munson Slough 807D
FLG110319 Florida Rock - Tallahassee
Plant Tallahassee Industrial Active only during wet weather
Munson Slough 857
FLG110358 Ready Mix USA - Mosley St
Plant Tallahassee Industrial Active only during wet weather
Munson Slough 857
FLG110307 AMGI PLANT #21 Tallahassee Industrial Active only during wet weather
Munson Slough 807
Draft TMDL for Munson Slough/Munson Lake Watershed (WBIDs 807, 807C, and 807D) September 2008
28
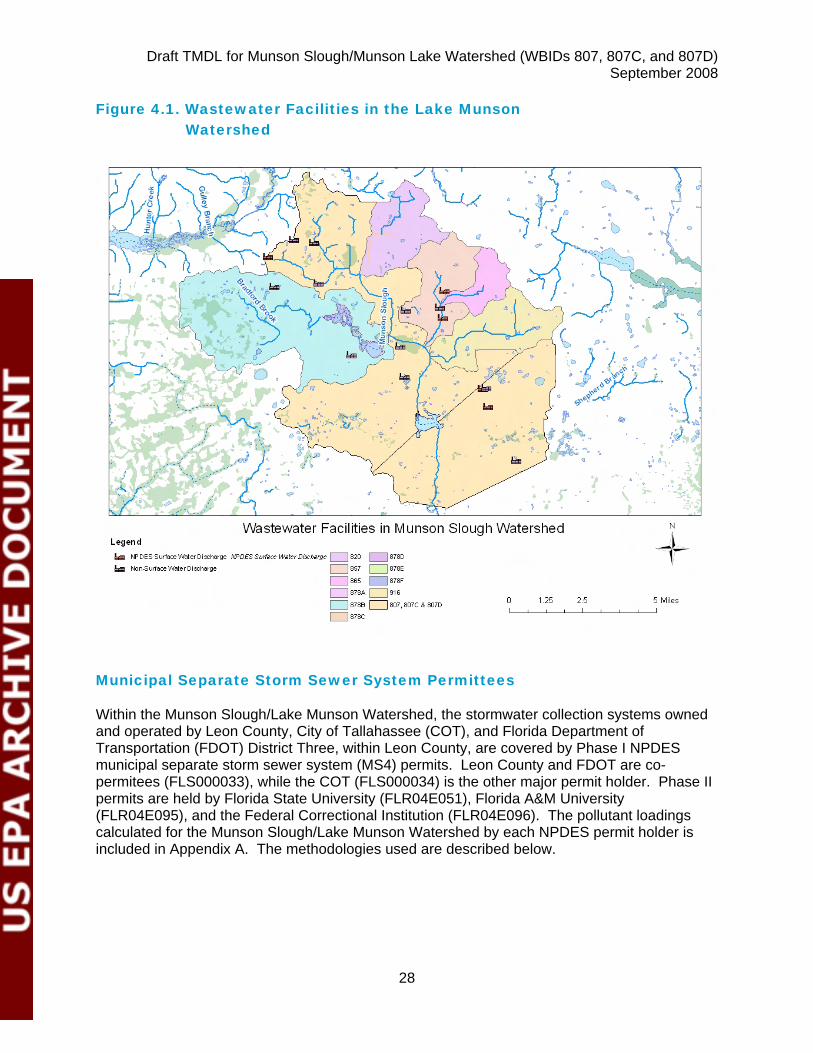
Figure 4.1. Wastewater Facilities in the Lake Munson Watershed
Municipal Separate Storm Sewer System Permittees
Within the Munson Slough/Lake Munson Watershed, the stormwater collection systems owned and operated by Leon County, City of Tallahassee (COT), and Florida Department of Transportation (FDOT) District Three, within Leon County, are covered by Phase I NPDES municipal separate storm sewer system (MS4) permits. Leon County and FDOT are co-permitees (FLS000033), while the COT (FLS000034) is the other major permit holder. Phase II permits are held by Florida State University (FLR04E051), Florida A&M University (FLR04E095), and the Federal Correctional Institution (FLR04E096). The pollutant loadings calculated for the Munson Slough/Lake Munson Watershed by each NPDES permit holder is included in Appendix A. The methodologies used are described below.
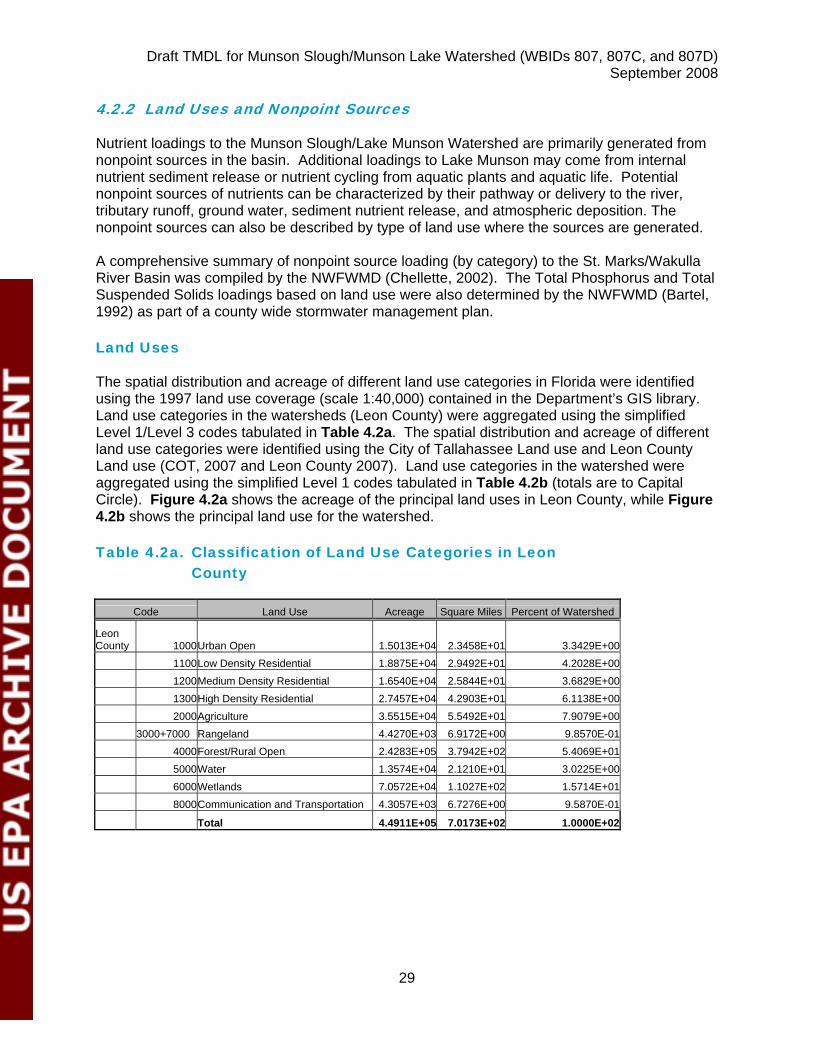
Draft TMDL for Munson Slough/Munson Lake Watershed (WBIDs 807, 807C, and 807D) September 2008
29
4.2.2 Land Uses and Nonpoint Sources
Nutrient loadings to the Munson Slough/Lake Munson Watershed are primarily generated from nonpoint sources in the basin. Additional loadings to Lake Munson may come from internal nutrient sediment release or nutrient cycling from aquatic plants and aquatic life. Potential nonpoint sources of nutrients can be characterized by their pathway or delivery to the river, tributary runoff, ground water, sediment nutrient release, and atmospheric deposition. The nonpoint sources can also be described by type of land use where the sources are generated. A comprehensive summary of nonpoint source loading (by category) to the St. Marks/Wakulla River Basin was compiled by the NWFWMD (Chellette, 2002). The Total Phosphorus and Total Suspended Solids loadings based on land use were also determined by the NWFWMD (Bartel, 1992) as part of a county wide stormwater management plan.
Land Uses
The spatial distribution and acreage of different land use categories in Florida were identified using the 1997 land use coverage (scale 1:40,000) contained in the Department’s GIS library. Land use categories in the watersheds (Leon County) were aggregated using the simplified Level 1/Level 3 codes tabulated in Table 4.2a. The spatial distribution and acreage of different land use categories were identified using the City of Tallahassee Land use and Leon County Land use (COT, 2007 and Leon County 2007). Land use categories in the watershed were aggregated using the simplified Level 1 codes tabulated in Table 4.2b (totals are to Capital Circle). Figure 4.2a shows the acreage of the principal land uses in Leon County, while Figure 4.2b shows the principal land use for the watershed.
Table 4.2a. Classification of Land Use Categories in Leon
County
Code Land Use Acreage Square Miles Percent of Watershed
Leon County 1000 Urban Open 1.5013E+04 2.3458E+01 3.3429E+00 1100 Low Density Residential 1.8875E+04 2.9492E+01 4.2028E+00 1200 Medium Density Residential 1.6540E+04 2.5844E+01 3.6829E+00 1300 High Density Residential 2.7457E+04 4.2903E+01 6.1138E+00 2000 Agriculture 3.5515E+04 5.5492E+01 7.9079E+00 3000+7000 Rangeland 4.4270E+03 6.9172E+00 9.8570E-01 4000 Forest/Rural Open 2.4283E+05 3.7942E+02 5.4069E+01 5000 Water 1.3574E+04 2.1210E+01 3.0225E+00 6000 Wetlands 7.0572E+04 1.1027E+02 1.5714E+01 8000 Communication and Transportation 4.3057E+03 6.7276E+00 9.5870E-01
Total 4.4911E+05 7.0173E+02 1.0000E+02
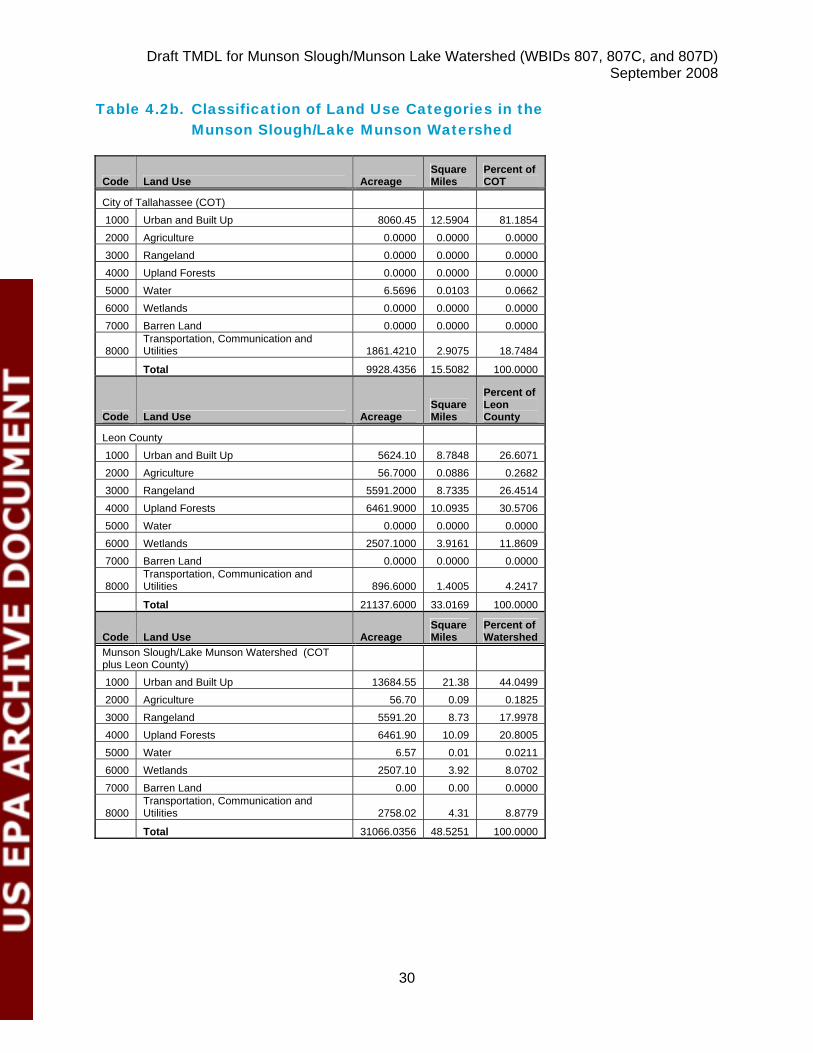
Draft TMDL for Munson Slough/Munson Lake Watershed (WBIDs 807, 807C, and 807D) September 2008
30
Table 4.2b. Classification of Land Use Categories in the Munson Slough/Lake Munson Watershed
Code Land Use Acreage Square Miles
Percent of COT
City of Tallahassee (COT) 1000 Urban and Built Up 8060.45 12.5904 81.1854 2000 Agriculture 0.0000 0.0000 0.0000 3000 Rangeland 0.0000 0.0000 0.0000 4000 Upland Forests 0.0000 0.0000 0.0000 5000 Water 6.5696 0.0103 0.0662 6000 Wetlands 0.0000 0.0000 0.0000 7000 Barren Land 0.0000 0.0000 0.0000
8000 Transportation, Communication and Utilities 1861.4210 2.9075 18.7484
Total 9928.4356 15.5082 100.0000
Code Land Use Acreage Square Miles
Percent of Leon County
Leon County 1000 Urban and Built Up 5624.10 8.7848 26.6071 2000 Agriculture 56.7000 0.0886 0.2682 3000 Rangeland 5591.2000 8.7335 26.4514 4000 Upland Forests 6461.9000 10.0935 30.5706 5000 Water 0.0000 0.0000 0.0000 6000 Wetlands 2507.1000 3.9161 11.8609 7000 Barren Land 0.0000 0.0000 0.0000
8000 Transportation, Communication and Utilities 896.6000 1.4005 4.2417
Total 21137.6000 33.0169 100.0000
Code Land Use Acreage Square Miles
Percent of Watershed
Munson Slough/Lake Munson Watershed (COT plus Leon County) 1000 Urban and Built Up 13684.55 21.38 44.0499 2000 Agriculture 56.70 0.09 0.1825 3000 Rangeland 5591.20 8.73 17.9978 4000 Upland Forests 6461.90 10.09 20.8005 5000 Water 6.57 0.01 0.0211 6000 Wetlands 2507.10 3.92 8.0702 7000 Barren Land 0.00 0.00 0.0000
8000 Transportation, Communication and Utilities 2758.02 4.31 8.8779
Total 31066.0356 48.5251 100.0000
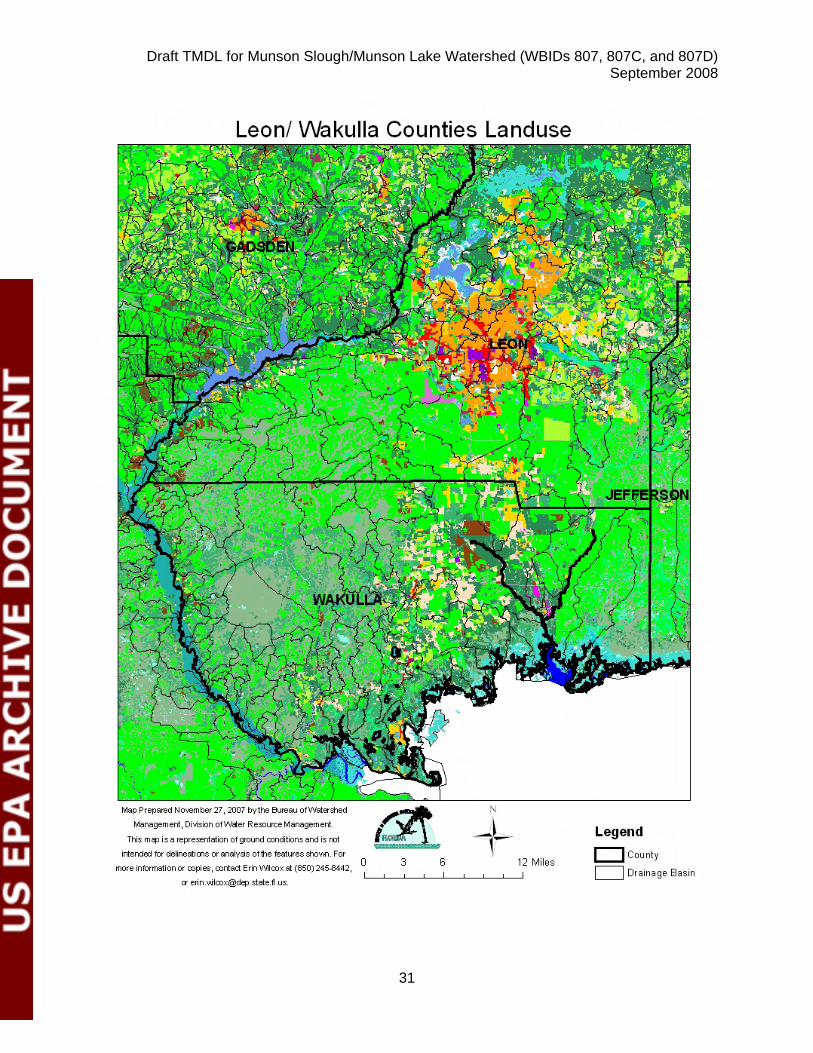
Draft TMDL for Munson Slough/Munson Lake Watershed (WBIDs 807, 807C, and 807D) September 2008
31

Draft TMDL for Munson Slough/Munson Lake Watershed (WBIDs 807, 807C, and 807D) September 2008
32
Figure 4.2a. Principal Land Uses in the St. Marks/Wakulla River Basin
Figure 4.2b. Principal Land Uses in the Munson Slough/Lake Munson Watershed
Septic Tanks
Onsite sewage treatment and disposal systems (OSTDSs), including septic tanks, are commonly used where providing central sewer is not cost-effective or practical. When properly sited, designed, constructed, maintained, and operated, OSTDSs are a safe means of disposing of domestic waste. The effluent from a well-functioning OSTDS is comparable to secondarily treated wastewater from a sewage treatment plant. When not functioning properly, OSTDSs can be a source of nutrients, coliforms, pathogens, and other pollutants to both ground water and surface water. As of 2006, Leon County had roughly 38,530 septic systems (Florida Department of Health Web site, 2008). Data for septic tanks are based on 1970 to 2007 DOH Census results, with year-by-year additions based on new septic tank construction. The data do not reflect septic tanks that
Draft TMDL for Munson Slough/Munson Lake Watershed (WBIDs 807, 807C, and 807D) September 2008
33
have been removed going back to 1970. From years 1991 to 2005, 5,849 permits (389.9/yr) for repairs were issued (Florida Department of Health Web site, 2008). Based on the number (81,325) of housing units (HU) located in the county (US Census, 1990), approximately 58,881 (72.40 percent) of the HU are connected to a wastewater treatment facility; with the remaining 22,090 (27.16 percent) utilizing septic tanks or cesspools, and 354 (0.44 percent) using other systems. The distribution of septic tanks within the county was obtained from the DOH web site as shown in Appendix B. To estimate the TN and TP loading per septic system, the EPA methodology was used. The mean household use in Tampa, FL is 65.8 gal/cap/day (EPA, 2002). We used a value of: Qseptic = 70 gal/cap/day* 2.6 persons /household*0.1337 (cuft/gal)*(1 day/(24*3600 sec) Qseptic = 2.8164E-04 cfs/tank. To represent the water quality exiting the septic tank, the mean values for TN=50.5 mg/l and TP=9.0 mg/l were used (EPA, 2002). The estimates from 1970-2006 for Leon county is shown in Appendix B. Table 4.4a-d contains the loads for 1997.
Agriculture
The USGS (Ruddy, 2006) has estimated nutrient inputs to the land surface at the county level from livestock, fertilizer use, and atmospheric deposition. The estimates from 1987-2001 for Leon County is shown in Appendix B. Table 4.4a-d contains the loads for 1997. Livestock
The USGS (Goolsby, 1999) developed methods to estimate the nitrogen (TN) and phosphorus (TP) content of manure generated by various types of livestock. The method accounts for the different life cycles of the animals on an annual basis and whether the animals were in confined or unconfined conditions. Losses of nitrogen due to storage, handling, and volatilization have also been determined. The estimates from 1987-2001 for Leon county is shown in Appendix B. Table 4.4a-d contains the loads for 1997. Fertilizer
Several methods have been used to allocate State fertilizer data to counties. State fertilizer-sales data, in tons, were compiled by US Census of Agriculture from 1945 through 1985. The USGS (Alexander, 1990) used county fertilized-acreage data from the Census to allocate the State-level sales to fertilizer use within individual counties. Additional data from 1985-2001 have also been compiled by USGS (Battaglin, 1995). It was assumed fertilizer sold within the county was used in the same year. Fertilizer in tons of product was converted to tons of nitrogen and phosphorus based on the chemical composition data for each product. In addition, fertilizer was divided into farm (agricultural) and non-farm (urban) land use. The estimates from 1987-2001 for Leon and Wakulla counties is shown in Appendix B. Table 4.4a-d contains the loads for 1997. Atmospheric Deposition
The annual summaries of wet deposition in kg/ha were obtained by USGS from the NADP web page (NADP, 2002). Nationwide wet deposition sites were utilized and developed into 1 km resolution grid cells. Annual wet deposition for each county by year was then developed from the grid cells within each county. Appendix B contains tables of TN (kg/yr). No TP data were
Draft TMDL for Munson Slough/Munson Lake Watershed (WBIDs 807, 807C, and 807D) September 2008
34
developed, because concentrations were not considered significant and samples were subject to contamination. The wet and dry atmospheric deposition rates (kg/ha/yr) for Leon and Wakulla counties were calculated separately from the USGS as noted in Table 4.4a-d. NADP data from 1984-2006 for the Quincy, FL site (FL14) were used and applied to the Leon county areas with values converted to lb/yr. This data is included in Appendix B. Dry deposition was assumed equal to wet deposition (wet:dry ratio = 1.00) based on studies in Tampa Bay area, (Poor, 2001; Pribble, 1999). However, there are some monitoring sites (Pollman, 2003) where the wet:dry ratio is much lower (Sumatra, Florida wet:dry ratio = 1:0.19). However, the wet deposition data at the Sumatra, Florida site (SUM156, CASTNET web site, 2007) were comparable to the Quincy site (FL14). Additional studies from air pollution files at FDEP (Rogers, 2006) have compiled Nitrogen Oxides Emissions (Tons/Yr) by county for various source categories. These categories include: stationary point, stationary area, on-road mobile, non-road mobile, and total sources. TP deposition data from early studies in Florida (Brezonik, 1983) show that wet+dry deposition of TP= 59 mg/sqm/yr. However, their analysis showed that dry deposition accounted for 80% of the total. Concentration ranges for Florida studies from 1955-1975 ranged from 26 to 50 ug/l. The USGS (Irwin, 1980) monitored TP in bulk precipitation (1977-1978) at a site in Leon County near the Ochlockonee River and US 27. Results for five samples gave a mean TP of 0.03 mg/l (30 ug/l) and range of 0.01-0.05 mg/l. Domesticated Animals
Domesticated animals can also provide a source of nutrients to the Munson Watershed. The number of households (HH) can be used to estimate the numbers of dogs, cats, and horses within each county. Using nationwide figures from the American Veterinary web site (www.avma.org), the numbers are: NDOGS = 0.58* HH NCATS = 0.66* HH NHORSES = 0.05*HH The fecal loading rates from a variety of farm and domestic animals are well documented in the literature (EPA, 2001). However, the nutrient loading rates for dogs and cats were much more difficult to find. Warden (2007) of the Lahontan Regional Water Quality Control Board estimated an average 45 lb dog will produce TN=13 lb/yr and TP=2 lb/yr. Using household census figures from 1990 and 2000, linear interpolation was used to estimate the number of dogs (NDOGS) for each year from 1970-2006 and the corresponding load. Domestic cats are not considered equivalent to dogs, because many use a litter box. However, the number of feral or wild cats (NFERALCATS) can be quite large. Veterinary research in Canada (Funaba, 2005) tested a variety of cat foods and measured the input and output of TN, TP, and other nutrients based on an average cat with Body Weight (BW= 4 kg). Domestic horses and ponies utilize the same loading rates as agricultural horses (Ruddy, 2006). The estimates from 1970-2005 for Leon county is shown in Appendix B. Table 4.4a-d contains the loads for 1997.

Draft TMDL for Munson Slough/Munson Lake Watershed (WBIDs 807, 807C, and 807D) September 2008
35
Wildlife
Another possible source of nutrients to Lake Munson could be wild animals. The Department of Agriculture and Consumer Services (DACS) (Knight, 2004) notes that there are major wildlife areas along much of lower Pine Barren Creek basin in Escambia County. We assumed the deer density data is transferable to other areas until better data becomes available. The white-tailed deer population has been estimated at various densities (Knight, 2004), however, we used a deer density of 1/50 ac or 12.8/mi2. Appendix B shows the estimated deer population for the St. Marks/Wakulla River Basin. Using the average TN and TP loading per animal (Ontario, 2007), the annual TN and TP loads to the watershed can be calculated. Migratory waterfowl and other wild bird populations have been estimated annually from 1998-2006 (Birdsource, 2007, Knight, 2003) as shown in Appendix B. The numbers of waterfowl and other birds are compiled annually through the Christmas bird count. Some birds may frequent wetland areas, while others may congregate near landfills. Studies of nutrient loading from migratory waterfowl showed that median TN=3.15 g/day/bird and TP=0.45 g/day/bird (Post, 1998). USGS summaries (Ruddy, 2006) of livestock nutrient loading show values for chickens and hens, tom and hen turkeys similar to these numbers, The most recent TMDL work (Benham, 2007) quantifying wildlife contributions to fecal coliform divide the load among eight categories of wildlife: deer, raccoons, muskrats, beavers, geese, ducks, wild turkeys, and other. The estimates for Leon County are shown in Appendix B. Table 4.4a-d contains the loads for 1997.
Population
The US Census Bureau reports that, in Leon County the total population for 2000 was 239,452 with 96,521 households (HH) and 119,420 housing units (HU). For all of Leon County (Figure 4.3), the Bureau reported a housing density of 144.8 HH per square mile (155.9 HU per square mile). This places Leon County among the highest in housing densities in Florida (U.S. Census Bureau Web site, 2007). This is also supported by the land use, where 17.342 percent of the land use in Leon County is dedicated to urban and residences.
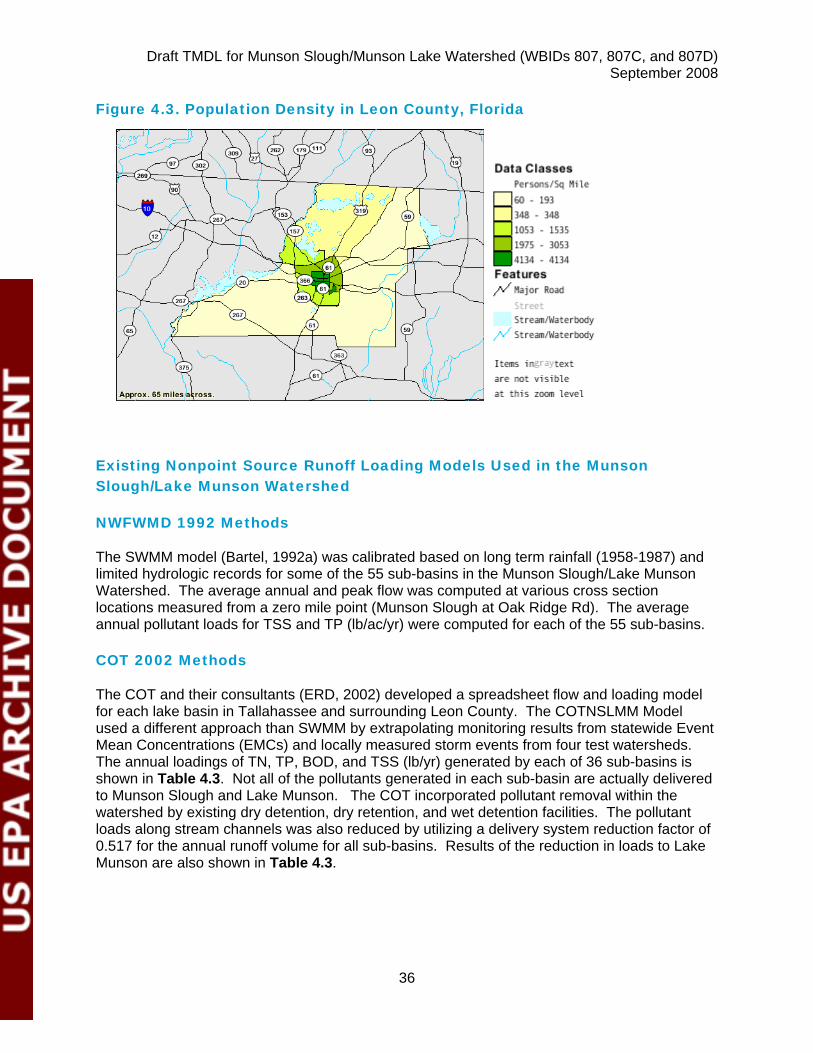
Draft TMDL for Munson Slough/Munson Lake Watershed (WBIDs 807, 807C, and 807D) September 2008
36
Figure 4.3. Population Density in Leon County, Florida
Existing Nonpoint Source Runoff Loading Models Used in the Munson Slough/Lake Munson Watershed
NWFWMD 1992 Methods
The SWMM model (Bartel, 1992a) was calibrated based on long term rainfall (1958-1987) and limited hydrologic records for some of the 55 sub-basins in the Munson Slough/Lake Munson Watershed. The average annual and peak flow was computed at various cross section locations measured from a zero mile point (Munson Slough at Oak Ridge Rd). The average annual pollutant loads for TSS and TP (lb/ac/yr) were computed for each of the 55 sub-basins. COT 2002 Methods
The COT and their consultants (ERD, 2002) developed a spreadsheet flow and loading model for each lake basin in Tallahassee and surrounding Leon County. The COTNSLMM Model used a different approach than SWMM by extrapolating monitoring results from statewide Event Mean Concentrations (EMCs) and locally measured storm events from four test watersheds. The annual loadings of TN, TP, BOD, and TSS (lb/yr) generated by each of 36 sub-basins is shown in Table 4.3. Not all of the pollutants generated in each sub-basin are actually delivered to Munson Slough and Lake Munson. The COT incorporated pollutant removal within the watershed by existing dry detention, dry retention, and wet detention facilities. The pollutant loads along stream channels was also reduced by utilizing a delivery system reduction factor of 0.517 for the annual runoff volume for all sub-basins. Results of the reduction in loads to Lake Munson are also shown in Table 4.3.
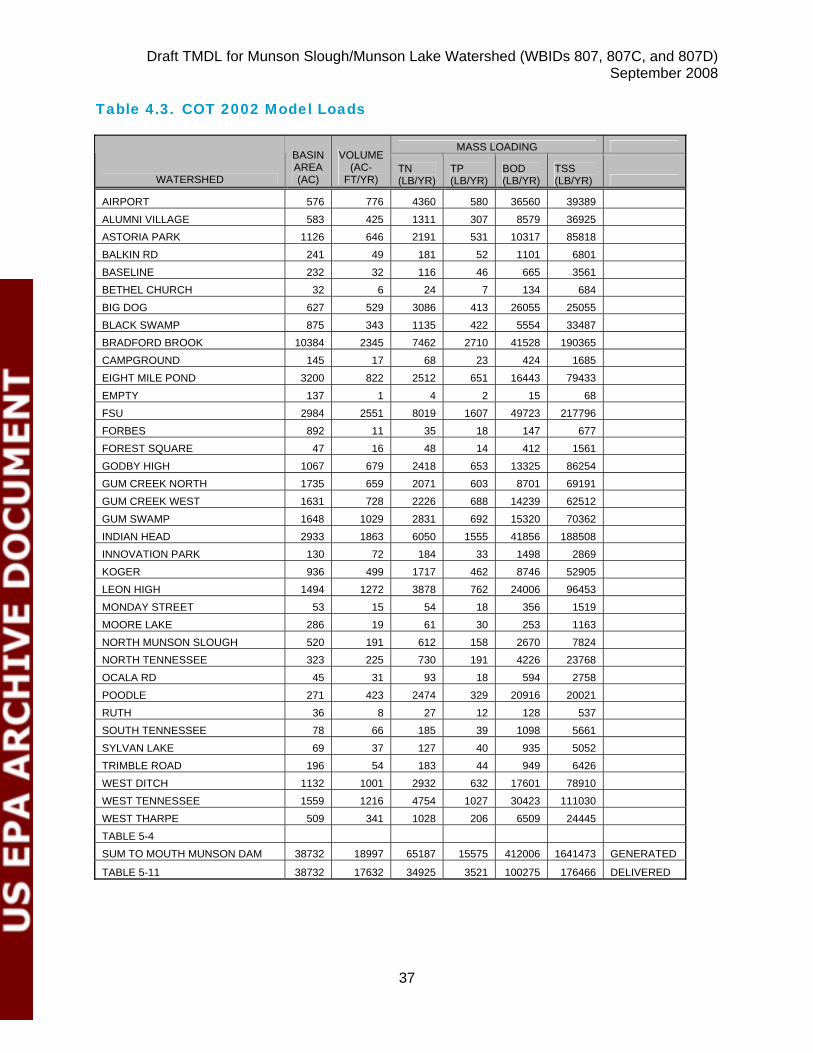
Draft TMDL for Munson Slough/Munson Lake Watershed (WBIDs 807, 807C, and 807D) September 2008
37
Table 4.3. COT 2002 Model Loads
MASS LOADING
WATERSHED
BASIN AREA (AC)
VOLUME (AC-
FT/YR) TN (LB/YR)
TP (LB/YR)
BOD (LB/YR)
TSS (LB/YR)
AIRPORT 576 776 4360 580 36560 39389
ALUMNI VILLAGE 583 425 1311 307 8579 36925 ASTORIA PARK 1126 646 2191 531 10317 85818 BALKIN RD 241 49 181 52 1101 6801 BASELINE 232 32 116 46 665 3561 BETHEL CHURCH 32 6 24 7 134 684 BIG DOG 627 529 3086 413 26055 25055 BLACK SWAMP 875 343 1135 422 5554 33487 BRADFORD BROOK 10384 2345 7462 2710 41528 190365 CAMPGROUND 145 17 68 23 424 1685 EIGHT MILE POND 3200 822 2512 651 16443 79433 EMPTY 137 1 4 2 15 68 FSU 2984 2551 8019 1607 49723 217796 FORBES 892 11 35 18 147 677 FOREST SQUARE 47 16 48 14 412 1561 GODBY HIGH 1067 679 2418 653 13325 86254 GUM CREEK NORTH 1735 659 2071 603 8701 69191 GUM CREEK WEST 1631 728 2226 688 14239 62512 GUM SWAMP 1648 1029 2831 692 15320 70362 INDIAN HEAD 2933 1863 6050 1555 41856 188508 INNOVATION PARK 130 72 184 33 1498 2869 KOGER 936 499 1717 462 8746 52905 LEON HIGH 1494 1272 3878 762 24006 96453 MONDAY STREET 53 15 54 18 356 1519 MOORE LAKE 286 19 61 30 253 1163 NORTH MUNSON SLOUGH 520 191 612 158 2670 7824 NORTH TENNESSEE 323 225 730 191 4226 23768 OCALA RD 45 31 93 18 594 2758 POODLE 271 423 2474 329 20916 20021 RUTH 36 8 27 12 128 537 SOUTH TENNESSEE 78 66 185 39 1098 5661 SYLVAN LAKE 69 37 127 40 935 5052 TRIMBLE ROAD 196 54 183 44 949 6426 WEST DITCH 1132 1001 2932 632 17601 78910 WEST TENNESSEE 1559 1216 4754 1027 30423 111030 WEST THARPE 509 341 1028 206 6509 24445 TABLE 5-4 SUM TO MOUTH MUNSON DAM 38732 18997 65187 15575 412006 1641473 GENERATED
TABLE 5-11 38732 17632 34925 3521 100275 176466 DELIVERED
Draft TMDL for Munson Slough/Munson Lake Watershed (WBIDs 807, 807C, and 807D) September 2008
38
COT 2007 Methods
The COT method used in their 2007 NPDES MS4 permit submittal (COT, 2007) was based on a different model than noted above. This current model is WMM (CDM, 1998). The COT portion of the Munson Slough/Lake Munson Watershed was subdivided into 64 sub-basins with labels defined by Outfall IDs. The total drainage area covered was 9,897.46 acres, which yielded a runoff of 26,801.84 ac-ft/yr. For example, the TP load was computed as 22,508 lb/yr. A summary for an average year (1948-2005) is given in Table 4.4a-d. Leon County 2007 Methods
Leon County and their consultants (CDM) developed pollutant load estimates using WMM for portions of 19 watersheds within unincorporated Leon County. The Leon County portion of the Munson Slough/Lake Munson Watershed included 21,137.7 acres. Annual load estimates for flow (29,540 ac-ft/yr), BOD, COD, TSS, TDS, TKN, NO23N, DP, TP, Cd, Cu, Pb, and Zn (lb/yr) were computed as shown in Appendix A Table A-2, both with and without BMPs. For example, the TP load without BMPs was 16,956 lb/yr and was only slightly reduced (5.2%) to 16,073 lb/yr with BMPs implemented. It should be noted that the loads did not include baseflow. A summary for an average year rainfall of 61.8 inches (1948-2005) is given in Table 4.4a-d. DEP LOADEST Model
DEP completed a regression analysis of loads for Munson Slough upstream of Lake Munson at Capital Circle SW (SR 263). This site corresponds to NWFWMD Station 3 and DEP WAS Station 955. The concentrations of nutrients were compiled from several agencies that collected data near these gage sites. The final regression equation is: Ln (L) = A0 + A1 * Ln(Q) + A2 * [ Ln (Q) ]2 + A3 * sin(2π t/T) + A4 * cos(2π t/T) Here L is the instantaneous load, t is decimal time (yr), T is 1.0 yr, Q (cfs) is average daily discharge or flow, Ln is the natural logarithm, and the An are regression coefficients. The five parameter regression fit the data very well over the entire period analyzed (1987-2000). The R2 values ranged from 0.92 for the TN data and 0.87 for the TP data. Appendix D of the Supplemental Information contains the semilog plots of predicted and measured daily loads (lb/day) of LTN and LTP for each year from 1987-2000. Annual loads were the sum of daily loads. This analysis was repeated for parameters such as LBOD5. Flow measurements at NWFWMD gaging stations at Central Drainage Ditch at Orange Ave (Station S19) and Munson Slough at SR 263 (Station S3) were unfortunately discontinued in mid-2000. This data loss occurred at a critical time during the Leon County project to dredge and reconfigure Lake Henrietta and Munson Slough downstream of Springhill Rd. The DEP made miscellaneous flow measurements (Appendix H of the Supplemental Information) for Munson Slough and tributaries during the 1997-2008 period, but these data were insufficient to reconstruct a daily flow record from daily stage data. Several techniques used to calculate daily flow are summarized below and in Appendix H of the Supplemental Information. 1. The S3 stage and flow data were correlated annually for the years 1987-2000 as well as individual years. The correlation equations were then applied to the S3 stage data beyond 2000. Since Munson Slough was reconfigured into a somewhat uniform trapezoidal channel, the older relationships yielded flow values which were too high. Construction of a weir upstream of SR 263 and backwater effects from Lake Munson also complicated the analysis.
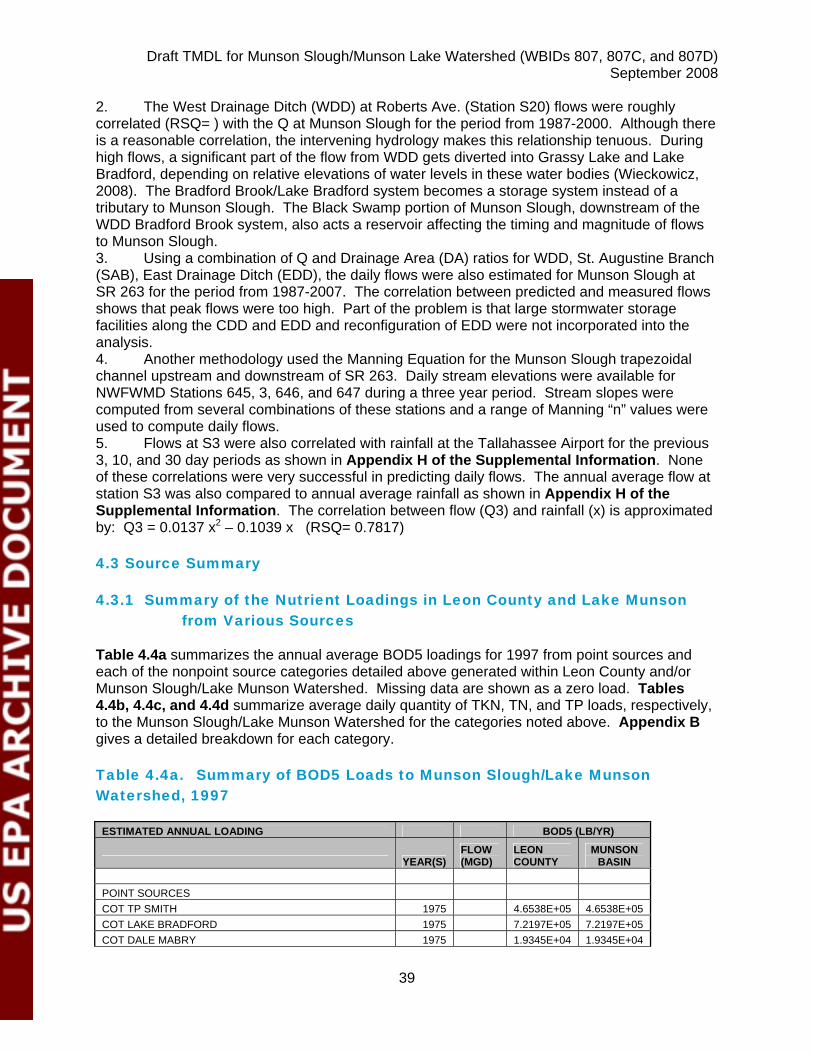
Draft TMDL for Munson Slough/Munson Lake Watershed (WBIDs 807, 807C, and 807D) September 2008
39
2. The West Drainage Ditch (WDD) at Roberts Ave. (Station S20) flows were roughly correlated (RSQ= ) with the Q at Munson Slough for the period from 1987-2000. Although there is a reasonable correlation, the intervening hydrology makes this relationship tenuous. During high flows, a significant part of the flow from WDD gets diverted into Grassy Lake and Lake Bradford, depending on relative elevations of water levels in these water bodies (Wieckowicz, 2008). The Bradford Brook/Lake Bradford system becomes a storage system instead of a tributary to Munson Slough. The Black Swamp portion of Munson Slough, downstream of the WDD Bradford Brook system, also acts a reservoir affecting the timing and magnitude of flows to Munson Slough. 3. Using a combination of Q and Drainage Area (DA) ratios for WDD, St. Augustine Branch (SAB), East Drainage Ditch (EDD), the daily flows were also estimated for Munson Slough at SR 263 for the period from 1987-2007. The correlation between predicted and measured flows shows that peak flows were too high. Part of the problem is that large stormwater storage facilities along the CDD and EDD and reconfiguration of EDD were not incorporated into the analysis. 4. Another methodology used the Manning Equation for the Munson Slough trapezoidal channel upstream and downstream of SR 263. Daily stream elevations were available for NWFWMD Stations 645, 3, 646, and 647 during a three year period. Stream slopes were computed from several combinations of these stations and a range of Manning “n” values were used to compute daily flows. 5. Flows at S3 were also correlated with rainfall at the Tallahassee Airport for the previous 3, 10, and 30 day periods as shown in Appendix H of the Supplemental Information. None of these correlations were very successful in predicting daily flows. The annual average flow at station S3 was also compared to annual average rainfall as shown in Appendix H of the Supplemental Information. The correlation between flow (Q3) and rainfall (x) is approximated by: Q3 = 0.0137 x2 – 0.1039 x (RSQ= 0.7817) 4.3 Source Summary
4.3.1 Summary of the Nutrient Loadings in Leon County and Lake Munson from Various Sources
Table 4.4a summarizes the annual average BOD5 loadings for 1997 from point sources and each of the nonpoint source categories detailed above generated within Leon County and/or Munson Slough/Lake Munson Watershed. Missing data are shown as a zero load. Tables 4.4b, 4.4c, and 4.4d summarize average daily quantity of TKN, TN, and TP loads, respectively, to the Munson Slough/Lake Munson Watershed for the categories noted above. Appendix B gives a detailed breakdown for each category.
Table 4.4a. Summary of BOD5 Loads to Munson Slough/Lake Munson Watershed, 1997
ESTIMATED ANNUAL LOADING BOD5 (LB/YR)
YEAR(S) FLOW (MGD)
LEON COUNTY
MUNSON BASIN
POINT SOURCES COT TP SMITH 1975 4.6538E+05 4.6538E+05 COT LAKE BRADFORD 1975 7.2197E+05 7.2197E+05 COT DALE MABRY 1975 1.9345E+04 1.9345E+04
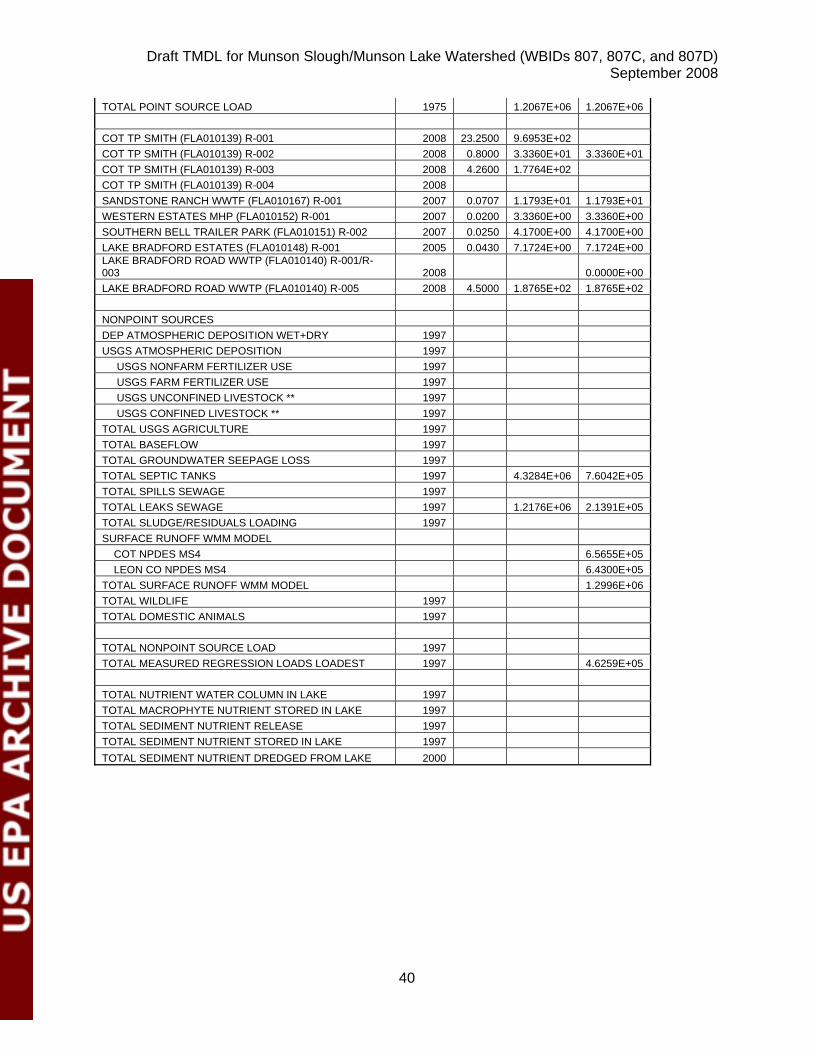
Draft TMDL for Munson Slough/Munson Lake Watershed (WBIDs 807, 807C, and 807D) September 2008
40
TOTAL POINT SOURCE LOAD 1975 1.2067E+06 1.2067E+06 COT TP SMITH (FLA010139) R-001 2008 23.2500 9.6953E+02 COT TP SMITH (FLA010139) R-002 2008 0.8000 3.3360E+01 3.3360E+01 COT TP SMITH (FLA010139) R-003 2008 4.2600 1.7764E+02 COT TP SMITH (FLA010139) R-004 2008 SANDSTONE RANCH WWTF (FLA010167) R-001 2007 0.0707 1.1793E+01 1.1793E+01 WESTERN ESTATES MHP (FLA010152) R-001 2007 0.0200 3.3360E+00 3.3360E+00 SOUTHERN BELL TRAILER PARK (FLA010151) R-002 2007 0.0250 4.1700E+00 4.1700E+00 LAKE BRADFORD ESTATES (FLA010148) R-001 2005 0.0430 7.1724E+00 7.1724E+00 LAKE BRADFORD ROAD WWTP (FLA010140) R-001/R-003 2008 0.0000E+00 LAKE BRADFORD ROAD WWTP (FLA010140) R-005 2008 4.5000 1.8765E+02 1.8765E+02 NONPOINT SOURCES DEP ATMOSPHERIC DEPOSITION WET+DRY 1997 USGS ATMOSPHERIC DEPOSITION 1997 USGS NONFARM FERTILIZER USE 1997 USGS FARM FERTILIZER USE 1997 USGS UNCONFINED LIVESTOCK ** 1997 USGS CONFINED LIVESTOCK ** 1997 TOTAL USGS AGRICULTURE 1997 TOTAL BASEFLOW 1997 TOTAL GROUNDWATER SEEPAGE LOSS 1997 TOTAL SEPTIC TANKS 1997 4.3284E+06 7.6042E+05 TOTAL SPILLS SEWAGE 1997 TOTAL LEAKS SEWAGE 1997 1.2176E+06 2.1391E+05 TOTAL SLUDGE/RESIDUALS LOADING 1997 SURFACE RUNOFF WMM MODEL COT NPDES MS4 6.5655E+05 LEON CO NPDES MS4 6.4300E+05 TOTAL SURFACE RUNOFF WMM MODEL 1.2996E+06 TOTAL WILDLIFE 1997 TOTAL DOMESTIC ANIMALS 1997 TOTAL NONPOINT SOURCE LOAD 1997 TOTAL MEASURED REGRESSION LOADS LOADEST 1997 4.6259E+05 TOTAL NUTRIENT WATER COLUMN IN LAKE 1997 TOTAL MACROPHYTE NUTRIENT STORED IN LAKE 1997 TOTAL SEDIMENT NUTRIENT RELEASE 1997 TOTAL SEDIMENT NUTRIENT STORED IN LAKE 1997 TOTAL SEDIMENT NUTRIENT DREDGED FROM LAKE 2000
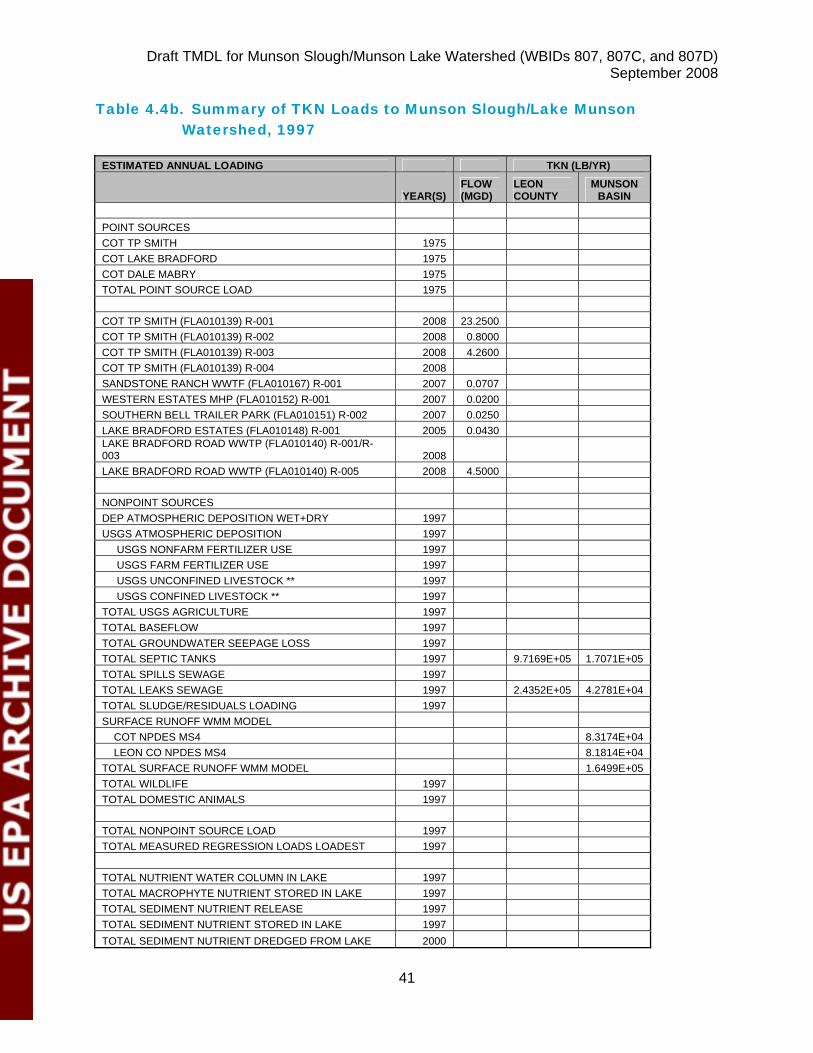
Draft TMDL for Munson Slough/Munson Lake Watershed (WBIDs 807, 807C, and 807D) September 2008
41
Table 4.4b. Summary of TKN Loads to Munson Slough/Lake Munson Watershed, 1997
ESTIMATED ANNUAL LOADING TKN (LB/YR)
YEAR(S) FLOW (MGD)
LEON COUNTY
MUNSON BASIN
POINT SOURCES COT TP SMITH 1975 COT LAKE BRADFORD 1975 COT DALE MABRY 1975 TOTAL POINT SOURCE LOAD 1975 COT TP SMITH (FLA010139) R-001 2008 23.2500 COT TP SMITH (FLA010139) R-002 2008 0.8000 COT TP SMITH (FLA010139) R-003 2008 4.2600 COT TP SMITH (FLA010139) R-004 2008 SANDSTONE RANCH WWTF (FLA010167) R-001 2007 0.0707 WESTERN ESTATES MHP (FLA010152) R-001 2007 0.0200 SOUTHERN BELL TRAILER PARK (FLA010151) R-002 2007 0.0250 LAKE BRADFORD ESTATES (FLA010148) R-001 2005 0.0430 LAKE BRADFORD ROAD WWTP (FLA010140) R-001/R-003 2008 LAKE BRADFORD ROAD WWTP (FLA010140) R-005 2008 4.5000 NONPOINT SOURCES DEP ATMOSPHERIC DEPOSITION WET+DRY 1997 USGS ATMOSPHERIC DEPOSITION 1997 USGS NONFARM FERTILIZER USE 1997 USGS FARM FERTILIZER USE 1997 USGS UNCONFINED LIVESTOCK ** 1997 USGS CONFINED LIVESTOCK ** 1997 TOTAL USGS AGRICULTURE 1997 TOTAL BASEFLOW 1997 TOTAL GROUNDWATER SEEPAGE LOSS 1997 TOTAL SEPTIC TANKS 1997 9.7169E+05 1.7071E+05 TOTAL SPILLS SEWAGE 1997 TOTAL LEAKS SEWAGE 1997 2.4352E+05 4.2781E+04 TOTAL SLUDGE/RESIDUALS LOADING 1997 SURFACE RUNOFF WMM MODEL COT NPDES MS4 8.3174E+04 LEON CO NPDES MS4 8.1814E+04 TOTAL SURFACE RUNOFF WMM MODEL 1.6499E+05 TOTAL WILDLIFE 1997 TOTAL DOMESTIC ANIMALS 1997 TOTAL NONPOINT SOURCE LOAD 1997 TOTAL MEASURED REGRESSION LOADS LOADEST 1997 TOTAL NUTRIENT WATER COLUMN IN LAKE 1997 TOTAL MACROPHYTE NUTRIENT STORED IN LAKE 1997 TOTAL SEDIMENT NUTRIENT RELEASE 1997 TOTAL SEDIMENT NUTRIENT STORED IN LAKE 1997 TOTAL SEDIMENT NUTRIENT DREDGED FROM LAKE 2000

Draft TMDL for Munson Slough/Munson Lake Watershed (WBIDs 807, 807C, and 807D) September 2008
42
Table 4.4c. Summary of TN Loads to Munson Slough/Lake Munson Watershed, 1997
ESTIMATED ANNUAL LOADING TN (LB/YR)
YEAR(S) FLOW (MGD)
LEON COUNTY
MUNSON BASIN
POINT SOURCES COT TP SMITH 1975 5.0188E+05 5.0188E+05 COT LAKE BRADFORD 1975 2.4966E+05 2.4966E+05 COT DALE MABRY 1975 8.7600E+03 8.7600E+03 TOTAL POINT SOURCE LOAD 1975 7.6030E+05 7.6030E+05 COT TP SMITH (FLA010139) R-001 2008 23.2500 5.8172E+02 COT TP SMITH (FLA010139) R-002 2008 0.8000 2.0016E+01 2.0016E+01 COT TP SMITH (FLA010139) R-003 2008 4.2600 1.0659E+02 COT TP SMITH (FLA010139) R-004 2008 SANDSTONE RANCH WWTF (FLA010167) R-001 2007 0.0707 2.3586E+00 2.3586E+00 WESTERN ESTATES MHP (FLA010152) R-001 2007 0.0200 6.6720E-01 6.6720E-01 SOUTHERN BELL TRAILER PARK (FLA010151) R-002 2007 0.0250 8.3400E-01 8.3400E-01 LAKE BRADFORD ESTATES (FLA010148) R-001 2005 0.0430 1.4345E+01 1.4345E+01 LAKE BRADFORD ROAD WWTP (FLA010140) R-001/R-003 2008 0.0000E+00 LAKE BRADFORD ROAD WWTP (FLA010140) R-005 2008 4.5000 1.1259E+02 1.1259E+02 NONPOINT SOURCES DEP ATMOSPHERIC DEPOSITION WET+DRY 1997 2.6676E+06 1.9428E+05 USGS ATMOSPHERIC DEPOSITION 1997 1.3313E+06 9.6956E+04 USGS NONFARM FERTILIZER USE 1997 9.3787E+05 1.4974E+03 USGS FARM FERTILIZER USE 1997 2.2947E+05 3.6637E+02 USGS UNCONFINED LIVESTOCK ** 1997 5.1036E+05 8.1485E+02 USGS CONFINED LIVESTOCK ** 1997 2.4140E+05 3.8543E+02 TOTAL USGS AGRICULTURE 1997 1.9191E+06 3.0641E+03 TOTAL BASEFLOW 1997 TOTAL GROUNDWATER SEEPAGE LOSS 1997 TOTAL SEPTIC TANKS 1997 9.9132E+05 1.7416E+05 TOTAL SPILLS SEWAGE 1997 TOTAL LEAKS SEWAGE 1997 2.4352E+05 4.2781E+04 TOTAL SLUDGE/RESIDUALS LOADING 1997 2.0000E+03 SURFACE RUNOFF WMM MODEL COT NPDES MS4 1.1323E+05 LEON CO NPDES MS4 1.1084E+05 TOTAL SURFACE RUNOFF WMM MODEL 2.2407E+05 TOTAL WILDLIFE 1997 1.5723E+05 TOTAL DOMESTIC ANIMALS 1997 2.0004E+05 TOTAL NONPOINT SOURCE LOAD 1997 TOTAL MEASURED REGRESSION LOADS LOADEST 1997 6.9938E+04 TOTAL NUTRIENT WATER COLUMN IN LAKE 1997 1.7064E+03 TOTAL MACROPHYTE NUTRIENT STORED IN LAKE 1997 4.8884E+03 TOTAL SEDIMENT NUTRIENT RELEASE 1997 1.2921E+04 TOTAL SEDIMENT NUTRIENT STORED IN LAKE 1997 TOTAL SEDIMENT NUTRIENT DREDGED FROM LAKE 2000 3.8714E+06
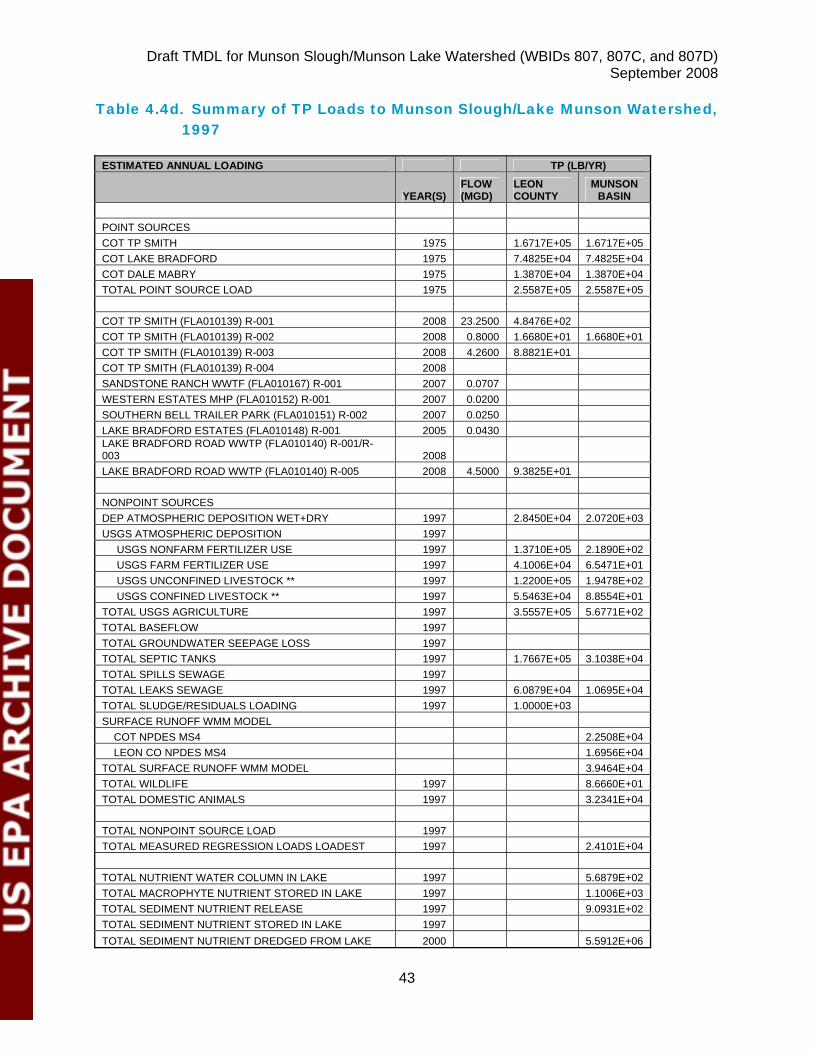
Draft TMDL for Munson Slough/Munson Lake Watershed (WBIDs 807, 807C, and 807D) September 2008
43
Table 4.4d. Summary of TP Loads to Munson Slough/Lake Munson Watershed, 1997
ESTIMATED ANNUAL LOADING TP (LB/YR)
YEAR(S) FLOW (MGD)
LEON COUNTY
MUNSON BASIN
POINT SOURCES COT TP SMITH 1975 1.6717E+05 1.6717E+05 COT LAKE BRADFORD 1975 7.4825E+04 7.4825E+04 COT DALE MABRY 1975 1.3870E+04 1.3870E+04 TOTAL POINT SOURCE LOAD 1975 2.5587E+05 2.5587E+05 COT TP SMITH (FLA010139) R-001 2008 23.2500 4.8476E+02 COT TP SMITH (FLA010139) R-002 2008 0.8000 1.6680E+01 1.6680E+01 COT TP SMITH (FLA010139) R-003 2008 4.2600 8.8821E+01 COT TP SMITH (FLA010139) R-004 2008 SANDSTONE RANCH WWTF (FLA010167) R-001 2007 0.0707 WESTERN ESTATES MHP (FLA010152) R-001 2007 0.0200 SOUTHERN BELL TRAILER PARK (FLA010151) R-002 2007 0.0250 LAKE BRADFORD ESTATES (FLA010148) R-001 2005 0.0430 LAKE BRADFORD ROAD WWTP (FLA010140) R-001/R-003 2008 LAKE BRADFORD ROAD WWTP (FLA010140) R-005 2008 4.5000 9.3825E+01 NONPOINT SOURCES DEP ATMOSPHERIC DEPOSITION WET+DRY 1997 2.8450E+04 2.0720E+03 USGS ATMOSPHERIC DEPOSITION 1997 USGS NONFARM FERTILIZER USE 1997 1.3710E+05 2.1890E+02 USGS FARM FERTILIZER USE 1997 4.1006E+04 6.5471E+01 USGS UNCONFINED LIVESTOCK ** 1997 1.2200E+05 1.9478E+02 USGS CONFINED LIVESTOCK ** 1997 5.5463E+04 8.8554E+01 TOTAL USGS AGRICULTURE 1997 3.5557E+05 5.6771E+02 TOTAL BASEFLOW 1997 TOTAL GROUNDWATER SEEPAGE LOSS 1997 TOTAL SEPTIC TANKS 1997 1.7667E+05 3.1038E+04 TOTAL SPILLS SEWAGE 1997 TOTAL LEAKS SEWAGE 1997 6.0879E+04 1.0695E+04 TOTAL SLUDGE/RESIDUALS LOADING 1997 1.0000E+03 SURFACE RUNOFF WMM MODEL COT NPDES MS4 2.2508E+04 LEON CO NPDES MS4 1.6956E+04 TOTAL SURFACE RUNOFF WMM MODEL 3.9464E+04 TOTAL WILDLIFE 1997 8.6660E+01 TOTAL DOMESTIC ANIMALS 1997 3.2341E+04 TOTAL NONPOINT SOURCE LOAD 1997 TOTAL MEASURED REGRESSION LOADS LOADEST 1997 2.4101E+04 TOTAL NUTRIENT WATER COLUMN IN LAKE 1997 5.6879E+02 TOTAL MACROPHYTE NUTRIENT STORED IN LAKE 1997 1.1006E+03 TOTAL SEDIMENT NUTRIENT RELEASE 1997 9.0931E+02 TOTAL SEDIMENT NUTRIENT STORED IN LAKE 1997 TOTAL SEDIMENT NUTRIENT DREDGED FROM LAKE 2000 5.5912E+06
Draft TMDL for Munson Slough/Munson Lake Watershed (WBIDs 807, 807C, and 807D) September 2008
44
4.4 Method Selected for Lake Munson TMDL (WBID 807C)
Surface Water Runoff
A watershed is the land area which catches rainfall and eventually drains or seeps into a receiving waterbody such as a stream, lake, or ground water (EPA, 1997). A watershed is often referred to as a drainage basin, and the boundaries between watersheds can be determined by ridges of higher ground based upon topographic elevations. The watershed, where appropriate, can be further divided into sub watersheds by drainage area for watershed modeling purposes. Land use pollution loading models have been often used to assess watershed impacts on water quality of a receiving waterbody when data limitation and time constraint preclude a complex watershed model. Such a simple model would be beneficial to estimate nutrients loads from potential sources in the watershed to predict algal responses in the receiving waterbody where the time scale of actual biological responses to nutrient loading from the watershed is at least equal to or less than that of the model prediction (EPA 1997). The Watershed Management Model (WMM), developed by Camp Dresser and McKee (CDM) for the Florida Department of Environmental Protection, is a land use pollution loading model to estimate annual or seasonal pollutant loading from pollution sources (i.e., nonpoint and point source) in a watershed or a sub basin (WMM User’s manual version 4.1, 1998). The loading estimation using the WMM can be executed based upon event mean concentrations of pollutants, land use, percent impervious, and annual rainfall. The model also can address watershed management needs for identified nonpoint source pollution as a part of Best Management Practices (BMPs). The WMM estimates annual pollution loads for each land use based upon event mean concentrations (EMC) for different pollutants and average annual surface runoff from land use. The EMCs used for this project are listed in Table 4.5. The pollution loading (ML in the unit of lbs/ac/yr) is then computed for each land use by the following equation:
(1) ML = EMCL * RL * K Where:
ML = loading factor for land use L (lbs/ac/yr); EMCL = event mean concentration of runoff from land use L (mg/L); EMC varies by land use and pollutant; RL = total average annual surface runoff from land use L (in/yr); and K = 0.2266, a unit conversion constant.
Annual runoff volumes for each sub basin can be estimated from constructing site-specific rainfall and runoff relationships. Runoff and rainfall relationships may vary depending on rainfall intensity and duration, sub basin characteristics (e.g., soil type, size, vegetation, and slope), percent imperviousness, and antecedent moisture conditions (Brezonik and Stadelmann, 2002). Without site-specific data for these variables, total average annual surface runoff from each land use type can be estimated as follows (WMM, 1998):
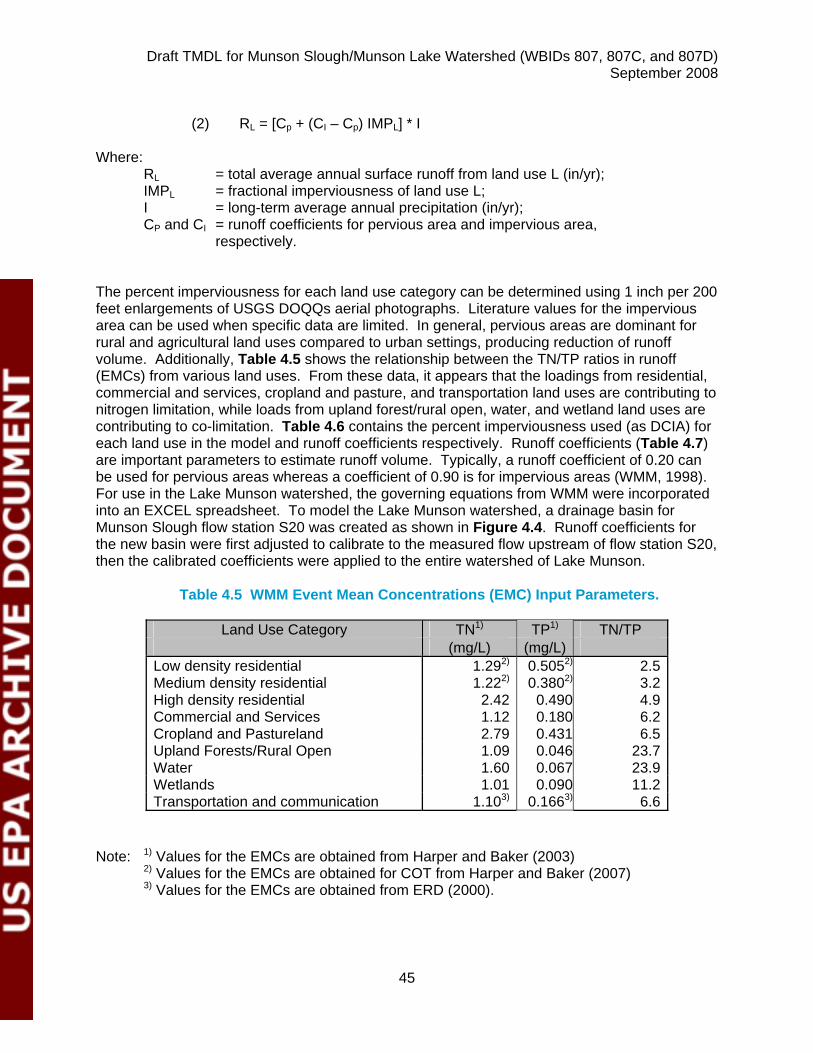
Draft TMDL for Munson Slough/Munson Lake Watershed (WBIDs 807, 807C, and 807D) September 2008
45
(2) RL = [Cp + (CI – Cp) IMPL] * I
Where: RL = total average annual surface runoff from land use L (in/yr);
IMPL = fractional imperviousness of land use L; I = long-term average annual precipitation (in/yr); CP and CI = runoff coefficients for pervious area and impervious area, respectively.
The percent imperviousness for each land use category can be determined using 1 inch per 200 feet enlargements of USGS DOQQs aerial photographs. Literature values for the impervious area can be used when specific data are limited. In general, pervious areas are dominant for rural and agricultural land uses compared to urban settings, producing reduction of runoff volume. Additionally, Table 4.5 shows the relationship between the TN/TP ratios in runoff (EMCs) from various land uses. From these data, it appears that the loadings from residential, commercial and services, cropland and pasture, and transportation land uses are contributing to nitrogen limitation, while loads from upland forest/rural open, water, and wetland land uses are contributing to co-limitation. Table 4.6 contains the percent imperviousness used (as DCIA) for each land use in the model and runoff coefficients respectively. Runoff coefficients (Table 4.7) are important parameters to estimate runoff volume. Typically, a runoff coefficient of 0.20 can be used for pervious areas whereas a coefficient of 0.90 is for impervious areas (WMM, 1998). For use in the Lake Munson watershed, the governing equations from WMM were incorporated into an EXCEL spreadsheet. To model the Lake Munson watershed, a drainage basin for Munson Slough flow station S20 was created as shown in Figure 4.4. Runoff coefficients for the new basin were first adjusted to calibrate to the measured flow upstream of flow station S20, then the calibrated coefficients were applied to the entire watershed of Lake Munson.
Table 4.5 WMM Event Mean Concentrations (EMC) Input Parameters.
Land Use Category TN1) TP1) TN/TP (mg/L) (mg/L) Low density residential 1.292) 0.5052) 2.5Medium density residential 1.222) 0.3802) 3.2High density residential 2.42 0.490 4.9Commercial and Services 1.12 0.180 6.2Cropland and Pastureland 2.79 0.431 6.5Upland Forests/Rural Open 1.09 0.046 23.7Water 1.60 0.067 23.9Wetlands 1.01 0.090 11.2Transportation and communication 1.103) 0.1663) 6.6
Note: 1) Values for the EMCs are obtained from Harper and Baker (2003) 2) Values for the EMCs are obtained for COT from Harper and Baker (2007) 3) Values for the EMCs are obtained from ERD (2000).
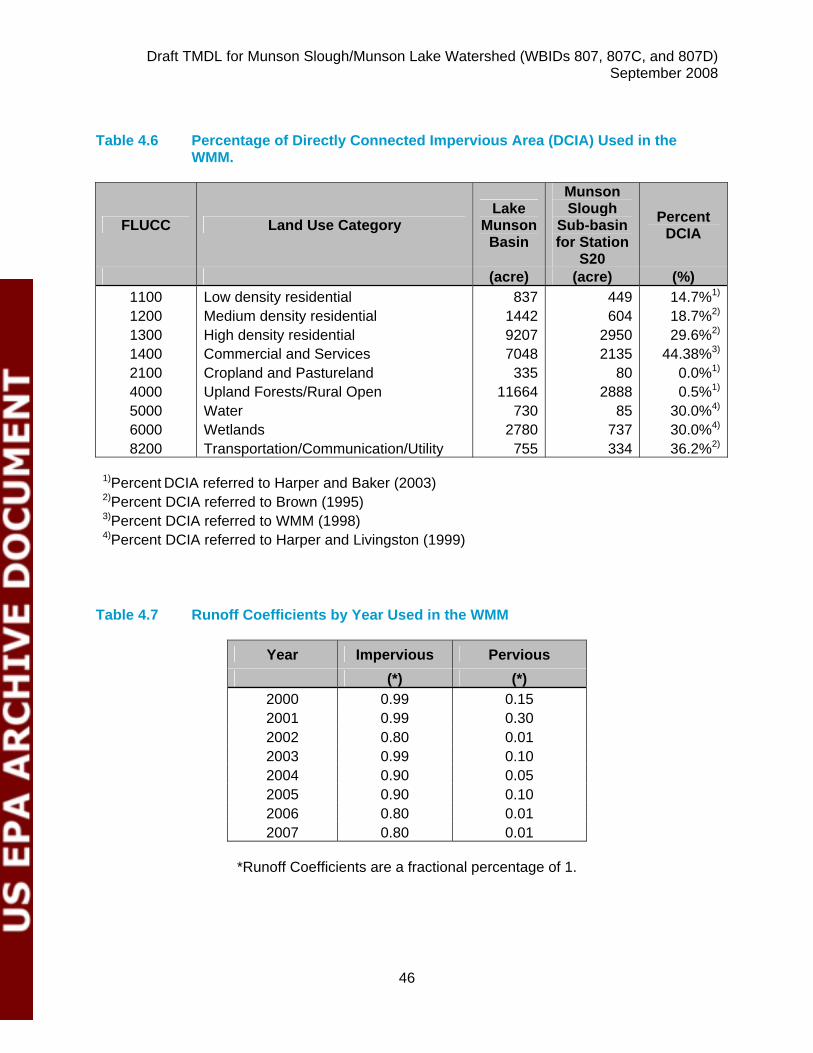
Draft TMDL for Munson Slough/Munson Lake Watershed (WBIDs 807, 807C, and 807D) September 2008
46
Table 4.6 Percentage of Directly Connected Impervious Area (DCIA) Used in the
WMM.
FLUCC Land Use Category Lake
Munson Basin
Munson Slough
Sub-basin for Station
S20
Percent DCIA
(acre) (acre) (%) 1100 Low density residential 837 449 14.7%1)
1200 Medium density residential 1442 604 18.7%2)
1300 High density residential 9207 2950 29.6%2)
1400 Commercial and Services 7048 2135 44.38%3)
2100 Cropland and Pastureland 335 80 0.0%1)
4000 Upland Forests/Rural Open 11664 2888 0.5%1)
5000 Water 730 85 30.0%4)
6000 Wetlands 2780 737 30.0%4)
8200 Transportation/Communication/Utility 755 334 36.2%2)
1)Percent DCIA referred to Harper and Baker (2003) 2)Percent DCIA referred to Brown (1995) 3)Percent DCIA referred to WMM (1998) 4)Percent DCIA referred to Harper and Livingston (1999)
Table 4.7 Runoff Coefficients by Year Used in the WMM
Year Impervious Pervious (*) (*)
2000 0.99 0.15 2001 0.99 0.30 2002 0.80 0.01 2003 0.99 0.10 2004 0.90 0.05 2005 0.90 0.10 2006 0.80 0.01 2007 0.80 0.01
*Runoff Coefficients are a fractional percentage of 1.
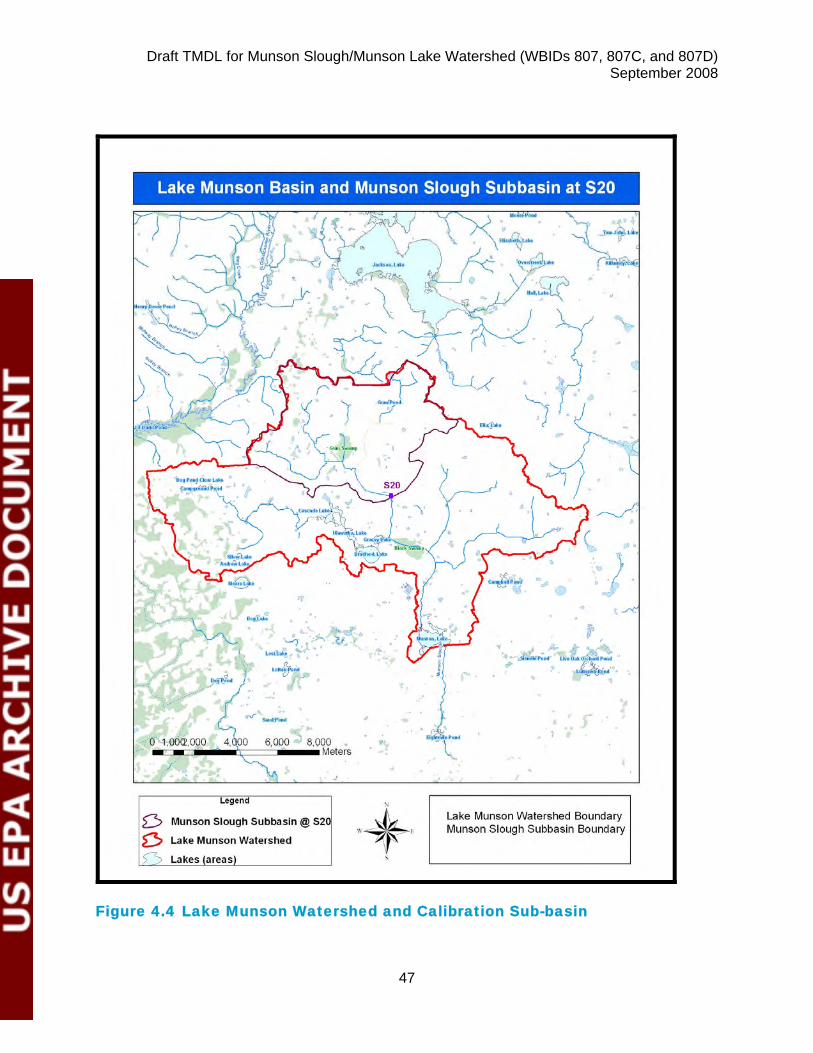
Draft TMDL for Munson Slough/Munson Lake Watershed (WBIDs 807, 807C, and 807D) September 2008
47
Figure 4.4 Lake Munson Watershed and Calibration Sub-basin
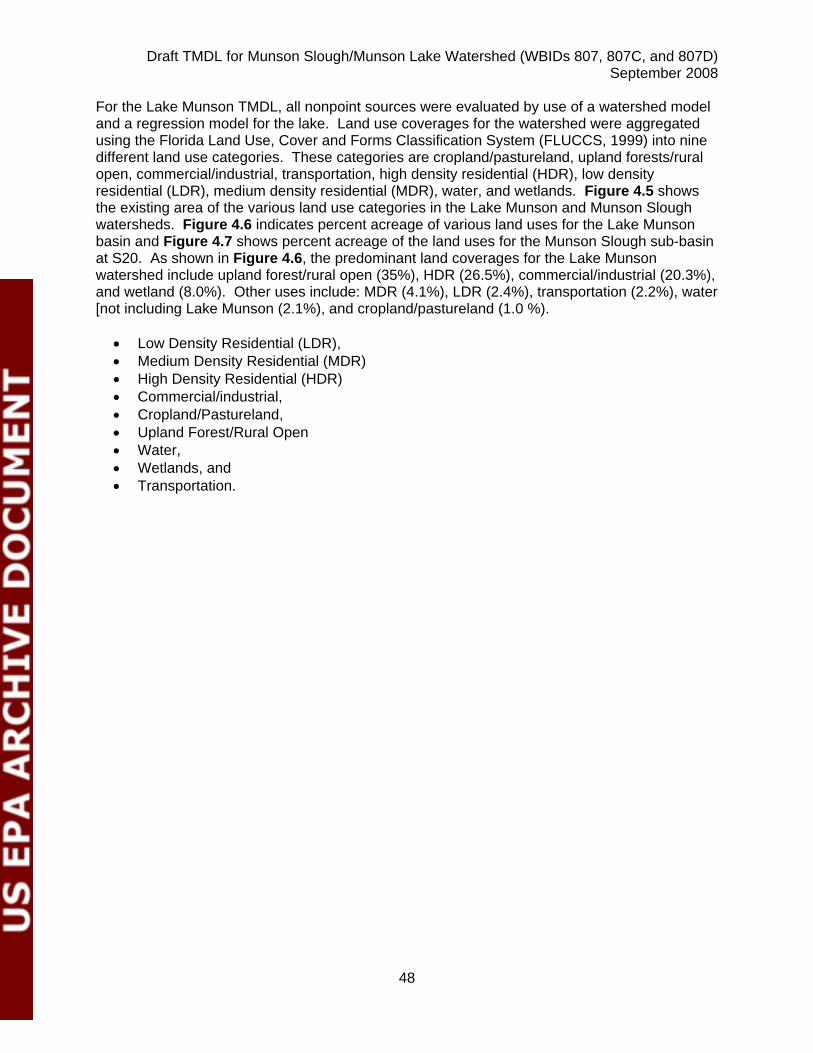
Draft TMDL for Munson Slough/Munson Lake Watershed (WBIDs 807, 807C, and 807D) September 2008
48
For the Lake Munson TMDL, all nonpoint sources were evaluated by use of a watershed model and a regression model for the lake. Land use coverages for the watershed were aggregated using the Florida Land Use, Cover and Forms Classification System (FLUCCS, 1999) into nine different land use categories. These categories are cropland/pastureland, upland forests/rural open, commercial/industrial, transportation, high density residential (HDR), low density residential (LDR), medium density residential (MDR), water, and wetlands. Figure 4.5 shows the existing area of the various land use categories in the Lake Munson and Munson Slough watersheds. Figure 4.6 indicates percent acreage of various land uses for the Lake Munson basin and Figure 4.7 shows percent acreage of the land uses for the Munson Slough sub-basin at S20. As shown in Figure 4.6, the predominant land coverages for the Lake Munson watershed include upland forest/rural open (35%), HDR (26.5%), commercial/industrial (20.3%), and wetland (8.0%). Other uses include: MDR (4.1%), LDR (2.4%), transportation (2.2%), water [not including Lake Munson (2.1%), and cropland/pastureland (1.0 %).
• Low Density Residential (LDR), • Medium Density Residential (MDR) • High Density Residential (HDR) • Commercial/industrial, • Cropland/Pastureland, • Upland Forest/Rural Open • Water, • Wetlands, and • Transportation.
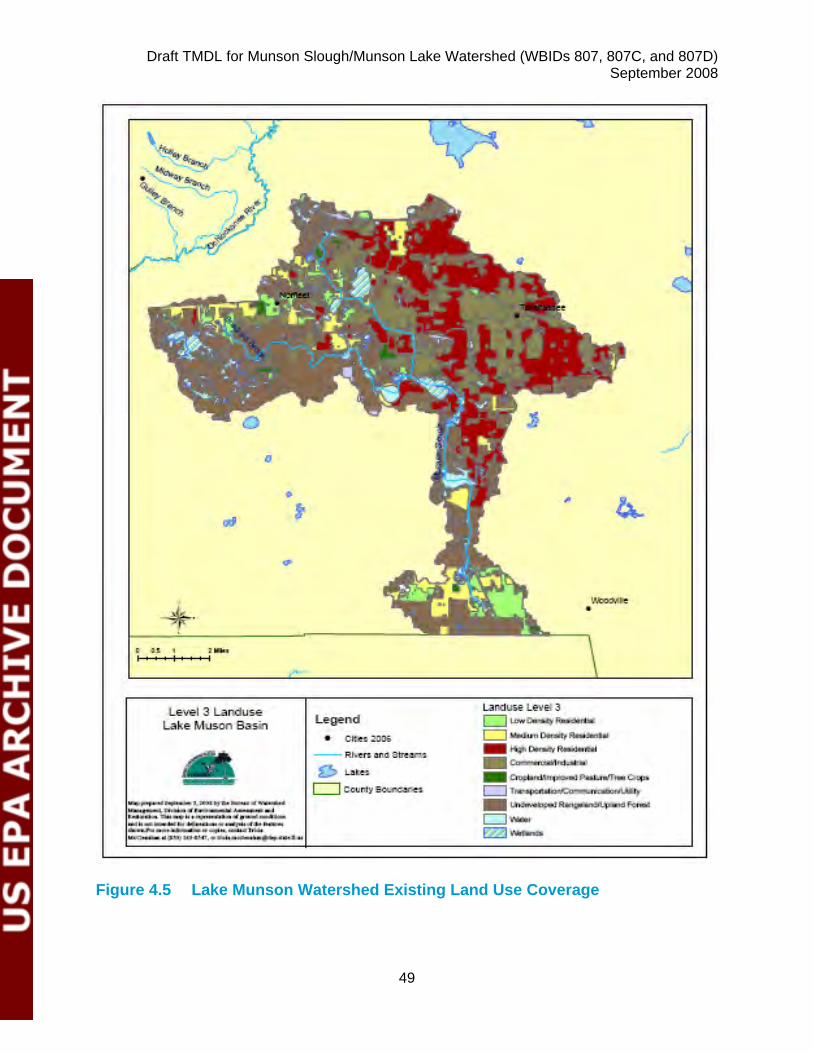
Draft TMDL for Munson Slough/Munson Lake Watershed (WBIDs 807, 807C, and 807D) September 2008
49
Figure 4.5 Lake Munson Watershed Existing Land Use Coverage
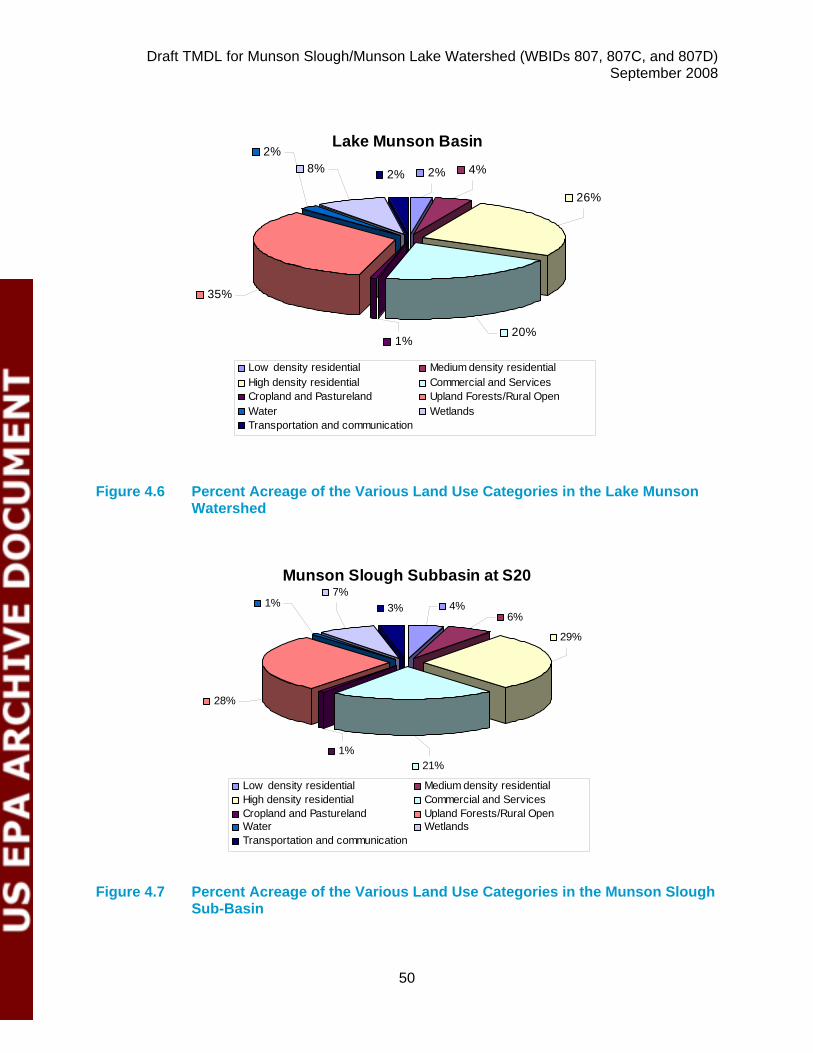
Draft TMDL for Munson Slough/Munson Lake Watershed (WBIDs 807, 807C, and 807D) September 2008
50
Lake Munson Basin4%8%
2%
35%
2%
20%
26%
1%
2%
Low density residential Medium density residential High density residential Commercial and ServicesCropland and Pastureland Upland Forests/Rural OpenWater WetlandsTransportation and communication
Figure 4.6 Percent Acreage of the Various Land Use Categories in the Lake Munson
Watershed
Munson Slough Subbasin at S20
6%
7%1%
28%
3%
21%
29%
1%
4%
Low density residential Medium density residential High density residential Commercial and ServicesCropland and Pastureland Upland Forests/Rural OpenWater WetlandsTransportation and communication
Figure 4.7 Percent Acreage of the Various Land Use Categories in the Munson Slough Sub-Basin
Draft TMDL for Munson Slough/Munson Lake Watershed (WBIDs 807, 807C, and 807D) September 2008
51
4.5 Estimating Point and Nonpoint Source Loadings to Lake Munson
Model Approach The equations from WMM were incorporated into an EXCEL spreadsheet and utilized to estimate the nutrient loads within the Lake Munson watershed as described previously. The results from the modeling are discussed in Chapter 5.
Draft TMDL for Munson Slough/Munson Lake Watershed (WBIDs 807, 807C, and 807D) September 2008
52
Chapter 5: DETERMINATION OF ASSIMILATIVE CAPACITY
5.1 Determination of Loading Capacity
Munson Slough DO depends on the loading of BOD5 and nutrients from the many tributary systems represented by Godby Ditch, St. Augustine Branch, Central Drainage Ditch, and East Drainage Ditch. The DO also is highly temperature, flow, and light-dependent. Figures 5.1a shows the sampling location over the Munson Slough/Lake Munson Watershed. While Figure 5.1b shows the sampling locations within Lake Munson, Table 5.1 lists the organizations that sample in the Munson Slough/Lake Munson Watershed. Tables 5.2a and 5.2b depict statistical annual averages for Lake Munson (WBID 807C). Table 5.2c shows statistical annual averages for Munson Slough above and below Lake Munson (WBIDs 807D and 807). Figures 5.2a-d shows annual average scatter plots for TN, TP, Chl-a, and TSI for Lake Munson. Tables 5.3a-c shows statistical summery for the Munson Slough/Lake Munson Watershed.
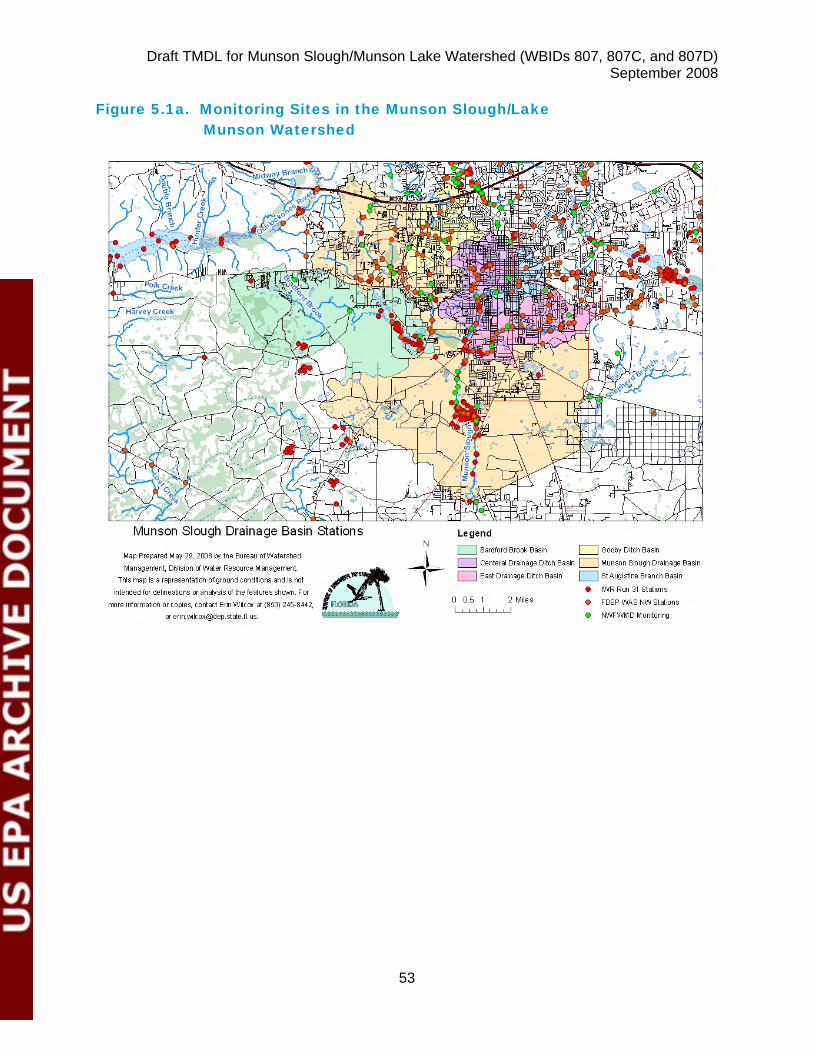
Draft TMDL for Munson Slough/Munson Lake Watershed (WBIDs 807, 807C, and 807D) September 2008
53
Figure 5.1a. Monitoring Sites in the Munson Slough/Lake Munson Watershed
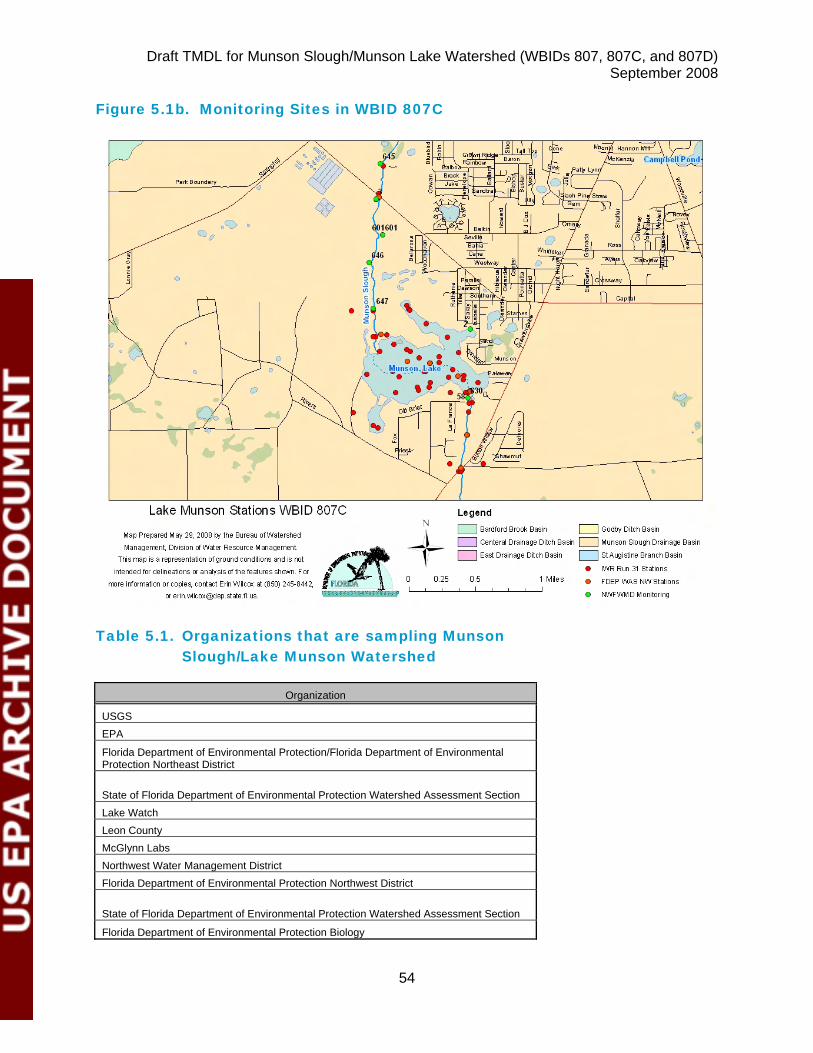
Draft TMDL for Munson Slough/Munson Lake Watershed (WBIDs 807, 807C, and 807D) September 2008
54
Figure 5.1b. Monitoring Sites in WBID 807C
Table 5.1. Organizations that are sampling Munson Slough/Lake Munson Watershed
Organization
USGS EPA
Florida Department of Environmental Protection/Florida Department of Environmental Protection Northeast District
State of Florida Department of Environmental Protection Watershed Assessment Section
Lake Watch Leon County McGlynn Labs Northwest Water Management District Florida Department of Environmental Protection Northwest District
State of Florida Department of Environmental Protection Watershed Assessment Section
Florida Department of Environmental Protection Biology
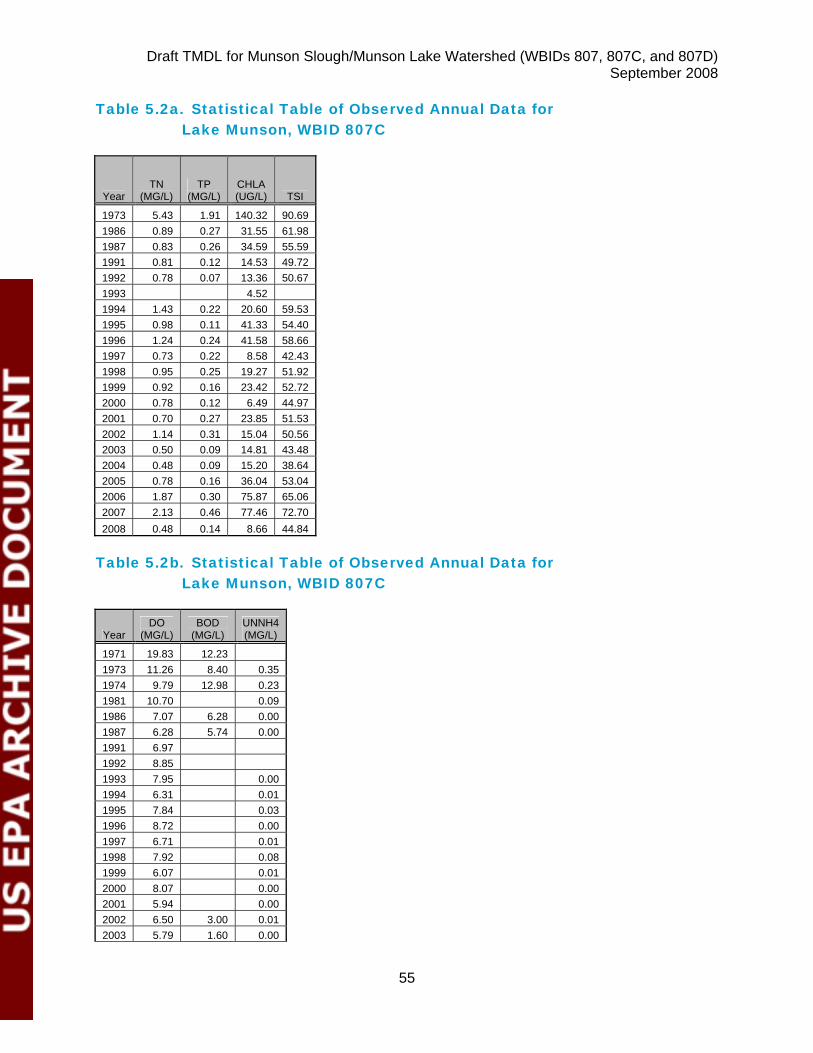
Draft TMDL for Munson Slough/Munson Lake Watershed (WBIDs 807, 807C, and 807D) September 2008
55
Table 5.2a. Statistical Table of Observed Annual Data for Lake Munson, WBID 807C
Year TN
(MG/L) TP
(MG/L) CHLA (UG/L) TSI
1973 5.43 1.91 140.32 90.69 1986 0.89 0.27 31.55 61.98 1987 0.83 0.26 34.59 55.59 1991 0.81 0.12 14.53 49.72 1992 0.78 0.07 13.36 50.67 1993 4.52 1994 1.43 0.22 20.60 59.53 1995 0.98 0.11 41.33 54.40 1996 1.24 0.24 41.58 58.66 1997 0.73 0.22 8.58 42.43 1998 0.95 0.25 19.27 51.92 1999 0.92 0.16 23.42 52.72 2000 0.78 0.12 6.49 44.97 2001 0.70 0.27 23.85 51.53 2002 1.14 0.31 15.04 50.56 2003 0.50 0.09 14.81 43.48 2004 0.48 0.09 15.20 38.64 2005 0.78 0.16 36.04 53.04 2006 1.87 0.30 75.87 65.06 2007 2.13 0.46 77.46 72.70 2008 0.48 0.14 8.66 44.84
Table 5.2b. Statistical Table of Observed Annual Data for
Lake Munson, WBID 807C
Year DO
(MG/L) BOD
(MG/L) UNNH4 (MG/L)
1971 19.83 12.23 1973 11.26 8.40 0.35 1974 9.79 12.98 0.23 1981 10.70 0.09 1986 7.07 6.28 0.00 1987 6.28 5.74 0.00 1991 6.97 1992 8.85 1993 7.95 0.00 1994 6.31 0.01 1995 7.84 0.03 1996 8.72 0.00 1997 6.71 0.01 1998 7.92 0.08 1999 6.07 0.01 2000 8.07 0.00 2001 5.94 0.00 2002 6.50 3.00 0.01 2003 5.79 1.60 0.00
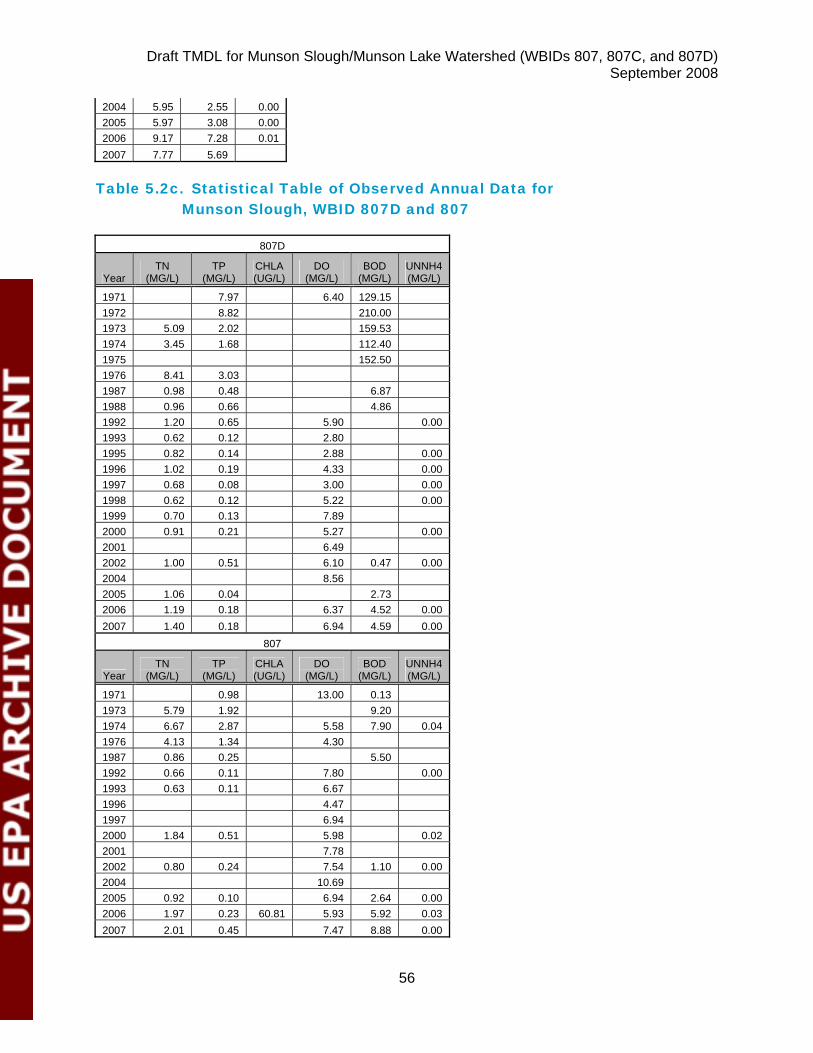
Draft TMDL for Munson Slough/Munson Lake Watershed (WBIDs 807, 807C, and 807D) September 2008
56
2004 5.95 2.55 0.00 2005 5.97 3.08 0.00 2006 9.17 7.28 0.01 2007 7.77 5.69
Table 5.2c. Statistical Table of Observed Annual Data for
Munson Slough, WBID 807D and 807
807D
Year TN
(MG/L) TP
(MG/L) CHLA (UG/L)
DO (MG/L)
BOD (MG/L)
UNNH4 (MG/L)
1971 7.97 6.40 129.15 1972 8.82 210.00 1973 5.09 2.02 159.53 1974 3.45 1.68 112.40 1975 152.50 1976 8.41 3.03 1987 0.98 0.48 6.87 1988 0.96 0.66 4.86 1992 1.20 0.65 5.90 0.00 1993 0.62 0.12 2.80 1995 0.82 0.14 2.88 0.00 1996 1.02 0.19 4.33 0.00 1997 0.68 0.08 3.00 0.00 1998 0.62 0.12 5.22 0.00 1999 0.70 0.13 7.89 2000 0.91 0.21 5.27 0.00 2001 6.49 2002 1.00 0.51 6.10 0.47 0.00 2004 8.56 2005 1.06 0.04 2.73 2006 1.19 0.18 6.37 4.52 0.00 2007 1.40 0.18 6.94 4.59 0.00
807
Year TN
(MG/L) TP
(MG/L) CHLA (UG/L)
DO (MG/L)
BOD (MG/L)
UNNH4 (MG/L)
1971 0.98 13.00 0.13 1973 5.79 1.92 9.20 1974 6.67 2.87 5.58 7.90 0.04 1976 4.13 1.34 4.30 1987 0.86 0.25 5.50 1992 0.66 0.11 7.80 0.00 1993 0.63 0.11 6.67 1996 4.47 1997 6.94 2000 1.84 0.51 5.98 0.02 2001 7.78 2002 0.80 0.24 7.54 1.10 0.00 2004 10.69 2005 0.92 0.10 6.94 2.64 0.00 2006 1.97 0.23 60.81 5.93 5.92 0.03 2007 2.01 0.45 7.47 8.88 0.00
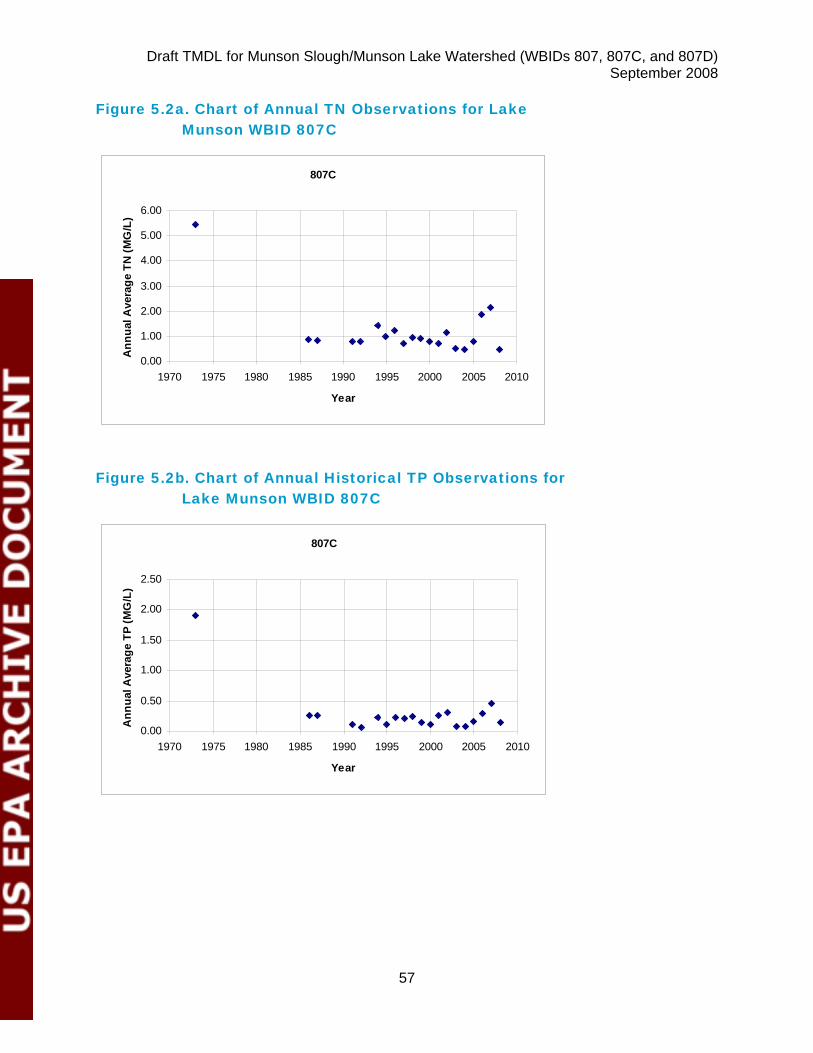
Draft TMDL for Munson Slough/Munson Lake Watershed (WBIDs 807, 807C, and 807D) September 2008
57
Figure 5.2a. Chart of Annual TN Observations for Lake Munson WBID 807C
807C
0.00
1.00
2.00
3.00
4.00
5.00
6.00
1970 1975 1980 1985 1990 1995 2000 2005 2010
Year
Ann
ual A
vera
ge T
N (M
G/L
)
Figure 5.2b. Chart of Annual Historical TP Observations for Lake Munson WBID 807C
807C
0.00
0.50
1.00
1.50
2.00
2.50
1970 1975 1980 1985 1990 1995 2000 2005 2010
Year
Ann
ual A
vera
ge T
P (M
G/L
)
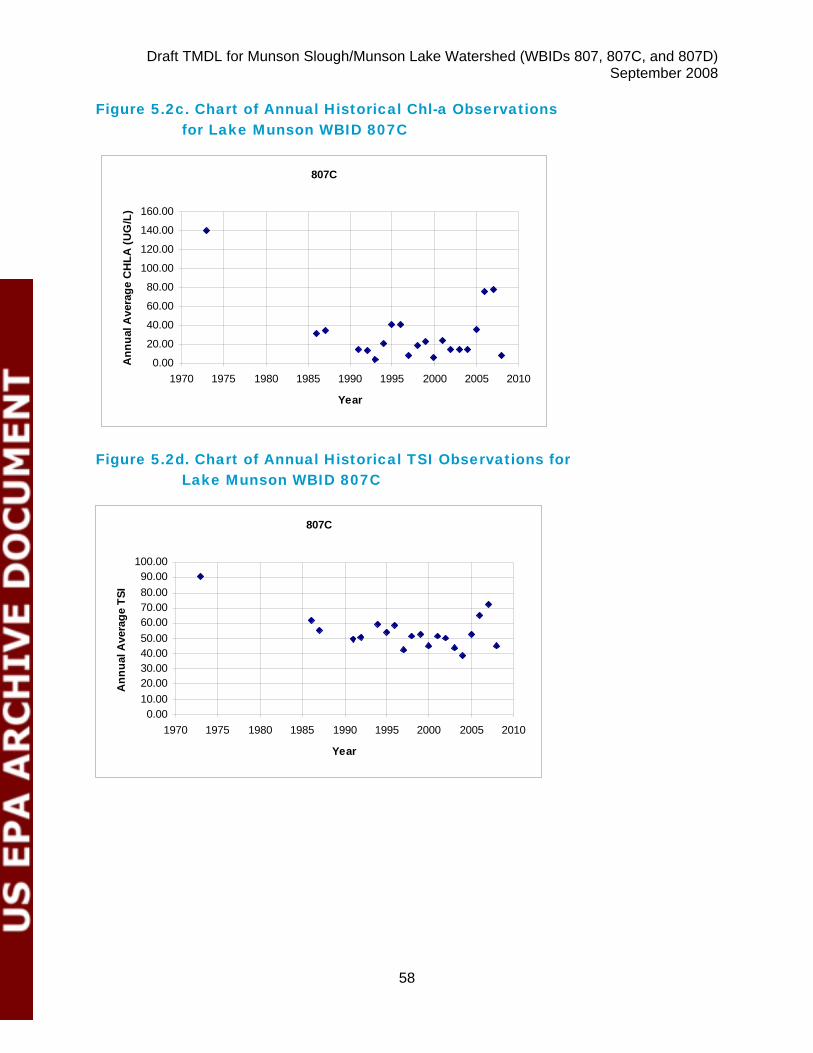
Draft TMDL for Munson Slough/Munson Lake Watershed (WBIDs 807, 807C, and 807D) September 2008
58
Figure 5.2c. Chart of Annual Historical Chl-a Observations for Lake Munson WBID 807C
807C
0.00
20.00
40.00
60.00
80.00
100.00
120.00
140.00
160.00
1970 1975 1980 1985 1990 1995 2000 2005 2010
Year
Ann
ual A
vera
ge C
HLA
(UG
/L)
Figure 5.2d. Chart of Annual Historical TSI Observations for Lake Munson WBID 807C
807C
0.0010.0020.0030.0040.0050.0060.0070.0080.0090.00
100.00
1970 1975 1980 1985 1990 1995 2000 2005 2010
Year
Ann
ual A
vera
ge T
SI
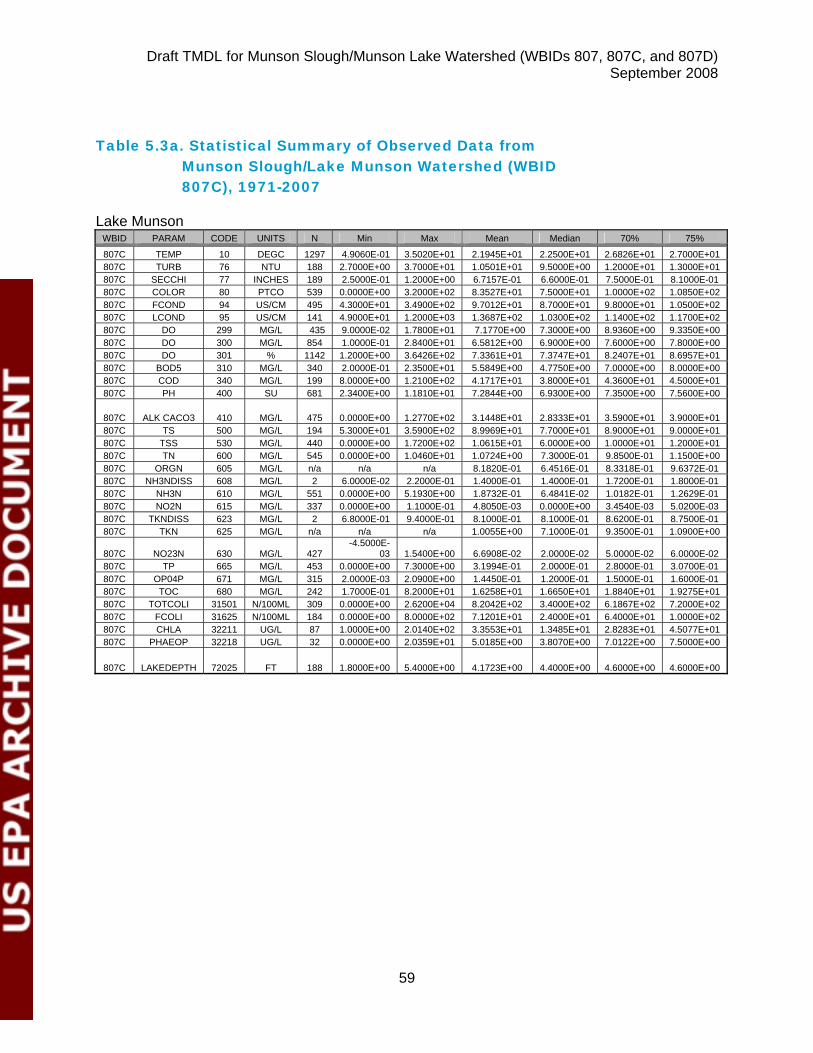
Draft TMDL for Munson Slough/Munson Lake Watershed (WBIDs 807, 807C, and 807D) September 2008
59
Table 5.3a. Statistical Summary of Observed Data from Munson Slough/Lake Munson Watershed (WBID 807C), 1971-2007
Lake Munson WBID PARAM CODE UNITS N Min Max Mean Median 70% 75%
807C TEMP 10 DEGC 1297 4.9060E-01 3.5020E+01 2.1945E+01 2.2500E+01 2.6826E+01 2.7000E+01 807C TURB 76 NTU 188 2.7000E+00 3.7000E+01 1.0501E+01 9.5000E+00 1.2000E+01 1.3000E+01 807C SECCHI 77 INCHES 189 2.5000E-01 1.2000E+00 6.7157E-01 6.6000E-01 7.5000E-01 8.1000E-01 807C COLOR 80 PTCO 539 0.0000E+00 3.2000E+02 8.3527E+01 7.5000E+01 1.0000E+02 1.0850E+02 807C FCOND 94 US/CM 495 4.3000E+01 3.4900E+02 9.7012E+01 8.7000E+01 9.8000E+01 1.0500E+02 807C LCOND 95 US/CM 141 4.9000E+01 1.2000E+03 1.3687E+02 1.0300E+02 1.1400E+02 1.1700E+02 807C DO 299 MG/L 435 9.0000E-02 1.7800E+01 7.1770E+00 7.3000E+00 8.9360E+00 9.3350E+00 807C DO 300 MG/L 854 1.0000E-01 2.8400E+01 6.5812E+00 6.9000E+00 7.6000E+00 7.8000E+00 807C DO 301 % 1142 1.2000E+00 3.6426E+02 7.3361E+01 7.3747E+01 8.2407E+01 8.6957E+01 807C BOD5 310 MG/L 340 2.0000E-01 2.3500E+01 5.5849E+00 4.7750E+00 7.0000E+00 8.0000E+00 807C COD 340 MG/L 199 8.0000E+00 1.2100E+02 4.1717E+01 3.8000E+01 4.3600E+01 4.5000E+01 807C PH 400 SU 681 2.3400E+00 1.1810E+01 7.2844E+00 6.9300E+00 7.3500E+00 7.5600E+00
807C ALK CACO3 410 MG/L 475 0.0000E+00 1.2770E+02 3.1448E+01 2.8333E+01 3.5900E+01 3.9000E+01 807C TS 500 MG/L 194 5.3000E+01 3.5900E+02 8.9969E+01 7.7000E+01 8.9000E+01 9.0000E+01 807C TSS 530 MG/L 440 0.0000E+00 1.7200E+02 1.0615E+01 6.0000E+00 1.0000E+01 1.2000E+01 807C TN 600 MG/L 545 0.0000E+00 1.0460E+01 1.0724E+00 7.3000E-01 9.8500E-01 1.1500E+00 807C ORGN 605 MG/L n/a n/a n/a 8.1820E-01 6.4516E-01 8.3318E-01 9.6372E-01 807C NH3NDISS 608 MG/L 2 6.0000E-02 2.2000E-01 1.4000E-01 1.4000E-01 1.7200E-01 1.8000E-01 807C NH3N 610 MG/L 551 0.0000E+00 5.1930E+00 1.8732E-01 6.4841E-02 1.0182E-01 1.2629E-01 807C NO2N 615 MG/L 337 0.0000E+00 1.1000E-01 4.8050E-03 0.0000E+00 3.4540E-03 5.0200E-03 807C TKNDISS 623 MG/L 2 6.8000E-01 9.4000E-01 8.1000E-01 8.1000E-01 8.6200E-01 8.7500E-01 807C TKN 625 MG/L n/a n/a n/a 1.0055E+00 7.1000E-01 9.3500E-01 1.0900E+00
807C NO23N 630 MG/L 427 -4.5000E-
03 1.5400E+00 6.6908E-02 2.0000E-02 5.0000E-02 6.0000E-02 807C TP 665 MG/L 453 0.0000E+00 7.3000E+00 3.1994E-01 2.0000E-01 2.8000E-01 3.0700E-01 807C OP04P 671 MG/L 315 2.0000E-03 2.0900E+00 1.4450E-01 1.2000E-01 1.5000E-01 1.6000E-01 807C TOC 680 MG/L 242 1.7000E-01 8.2000E+01 1.6258E+01 1.6650E+01 1.8840E+01 1.9275E+01 807C TOTCOLI 31501 N/100ML 309 0.0000E+00 2.6200E+04 8.2042E+02 3.4000E+02 6.1867E+02 7.2000E+02 807C FCOLI 31625 N/100ML 184 0.0000E+00 8.0000E+02 7.1201E+01 2.4000E+01 6.4000E+01 1.0000E+02 807C CHLA 32211 UG/L 87 1.0000E+00 2.0140E+02 3.3553E+01 1.3485E+01 2.8283E+01 4.5077E+01 807C PHAEOP 32218 UG/L 32 0.0000E+00 2.0359E+01 5.0185E+00 3.8070E+00 7.0122E+00 7.5000E+00
807C LAKEDEPTH 72025 FT 188 1.8000E+00 5.4000E+00 4.1723E+00 4.4000E+00 4.6000E+00 4.6000E+00
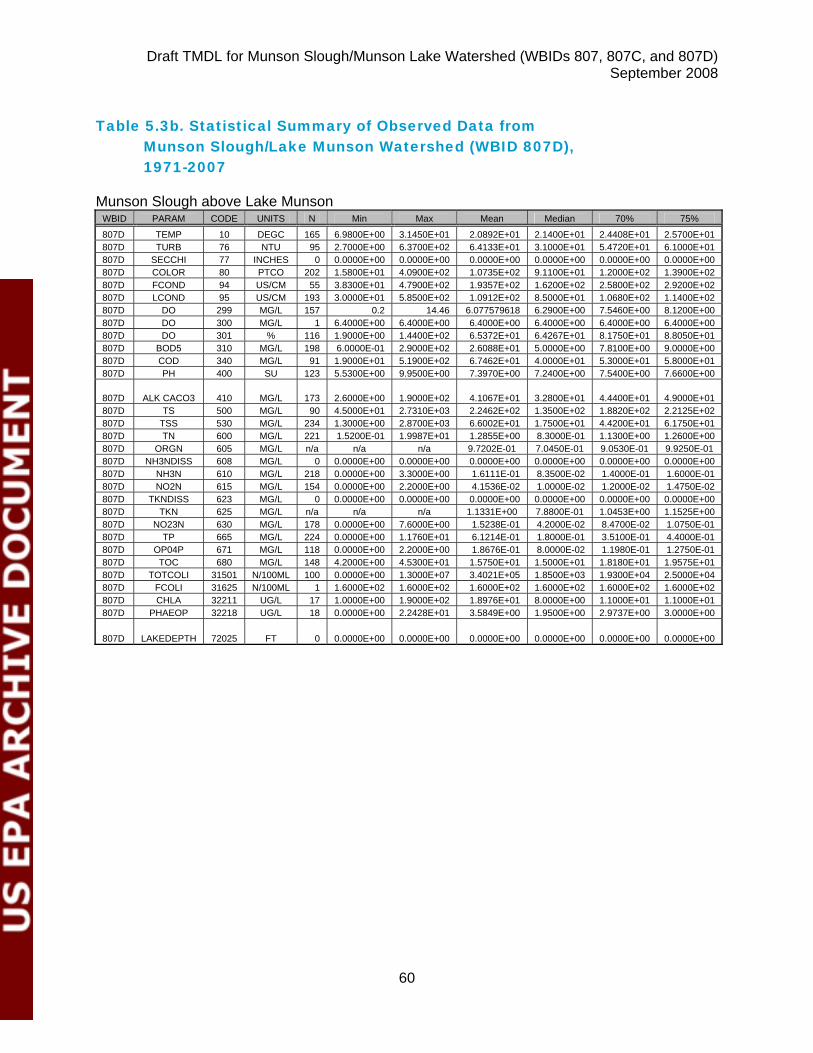
Draft TMDL for Munson Slough/Munson Lake Watershed (WBIDs 807, 807C, and 807D) September 2008
60
Table 5.3b. Statistical Summary of Observed Data from
Munson Slough/Lake Munson Watershed (WBID 807D), 1971-2007
Munson Slough above Lake Munson WBID PARAM CODE UNITS N Min Max Mean Median 70% 75%
807D TEMP 10 DEGC 165 6.9800E+00 3.1450E+01 2.0892E+01 2.1400E+01 2.4408E+01 2.5700E+01 807D TURB 76 NTU 95 2.7000E+00 6.3700E+02 6.4133E+01 3.1000E+01 5.4720E+01 6.1000E+01 807D SECCHI 77 INCHES 0 0.0000E+00 0.0000E+00 0.0000E+00 0.0000E+00 0.0000E+00 0.0000E+00 807D COLOR 80 PTCO 202 1.5800E+01 4.0900E+02 1.0735E+02 9.1100E+01 1.2000E+02 1.3900E+02 807D FCOND 94 US/CM 55 3.8300E+01 4.7900E+02 1.9357E+02 1.6200E+02 2.5800E+02 2.9200E+02 807D LCOND 95 US/CM 193 3.0000E+01 5.8500E+02 1.0912E+02 8.5000E+01 1.0680E+02 1.1400E+02 807D DO 299 MG/L 157 0.2 14.46 6.077579618 6.2900E+00 7.5460E+00 8.1200E+00 807D DO 300 MG/L 1 6.4000E+00 6.4000E+00 6.4000E+00 6.4000E+00 6.4000E+00 6.4000E+00 807D DO 301 % 116 1.9000E+00 1.4400E+02 6.5372E+01 6.4267E+01 8.1750E+01 8.8050E+01 807D BOD5 310 MG/L 198 6.0000E-01 2.9000E+02 2.6088E+01 5.0000E+00 7.8100E+00 9.0000E+00 807D COD 340 MG/L 91 1.9000E+01 5.1900E+02 6.7462E+01 4.0000E+01 5.3000E+01 5.8000E+01 807D PH 400 SU 123 5.5300E+00 9.9500E+00 7.3970E+00 7.2400E+00 7.5400E+00 7.6600E+00
807D ALK CACO3 410 MG/L 173 2.6000E+00 1.9000E+02 4.1067E+01 3.2800E+01 4.4400E+01 4.9000E+01 807D TS 500 MG/L 90 4.5000E+01 2.7310E+03 2.2462E+02 1.3500E+02 1.8820E+02 2.2125E+02 807D TSS 530 MG/L 234 1.3000E+00 2.8700E+03 6.6002E+01 1.7500E+01 4.4200E+01 6.1750E+01 807D TN 600 MG/L 221 1.5200E-01 1.9987E+01 1.2855E+00 8.3000E-01 1.1300E+00 1.2600E+00 807D ORGN 605 MG/L n/a n/a n/a 9.7202E-01 7.0450E-01 9.0530E-01 9.9250E-01 807D NH3NDISS 608 MG/L 0 0.0000E+00 0.0000E+00 0.0000E+00 0.0000E+00 0.0000E+00 0.0000E+00 807D NH3N 610 MG/L 218 0.0000E+00 3.3000E+00 1.6111E-01 8.3500E-02 1.4000E-01 1.6000E-01 807D NO2N 615 MG/L 154 0.0000E+00 2.2000E+00 4.1536E-02 1.0000E-02 1.2000E-02 1.4750E-02 807D TKNDISS 623 MG/L 0 0.0000E+00 0.0000E+00 0.0000E+00 0.0000E+00 0.0000E+00 0.0000E+00 807D TKN 625 MG/L n/a n/a n/a 1.1331E+00 7.8800E-01 1.0453E+00 1.1525E+00 807D NO23N 630 MG/L 178 0.0000E+00 7.6000E+00 1.5238E-01 4.2000E-02 8.4700E-02 1.0750E-01 807D TP 665 MG/L 224 0.0000E+00 1.1760E+01 6.1214E-01 1.8000E-01 3.5100E-01 4.4000E-01 807D OP04P 671 MG/L 118 0.0000E+00 2.2000E+00 1.8676E-01 8.0000E-02 1.1980E-01 1.2750E-01 807D TOC 680 MG/L 148 4.2000E+00 4.5300E+01 1.5750E+01 1.5000E+01 1.8180E+01 1.9575E+01 807D TOTCOLI 31501 N/100ML 100 0.0000E+00 1.3000E+07 3.4021E+05 1.8500E+03 1.9300E+04 2.5000E+04 807D FCOLI 31625 N/100ML 1 1.6000E+02 1.6000E+02 1.6000E+02 1.6000E+02 1.6000E+02 1.6000E+02 807D CHLA 32211 UG/L 17 1.0000E+00 1.9000E+02 1.8976E+01 8.0000E+00 1.1000E+01 1.1000E+01 807D PHAEOP 32218 UG/L 18 0.0000E+00 2.2428E+01 3.5849E+00 1.9500E+00 2.9737E+00 3.0000E+00
807D LAKEDEPTH 72025 FT 0 0.0000E+00 0.0000E+00 0.0000E+00 0.0000E+00 0.0000E+00 0.0000E+00
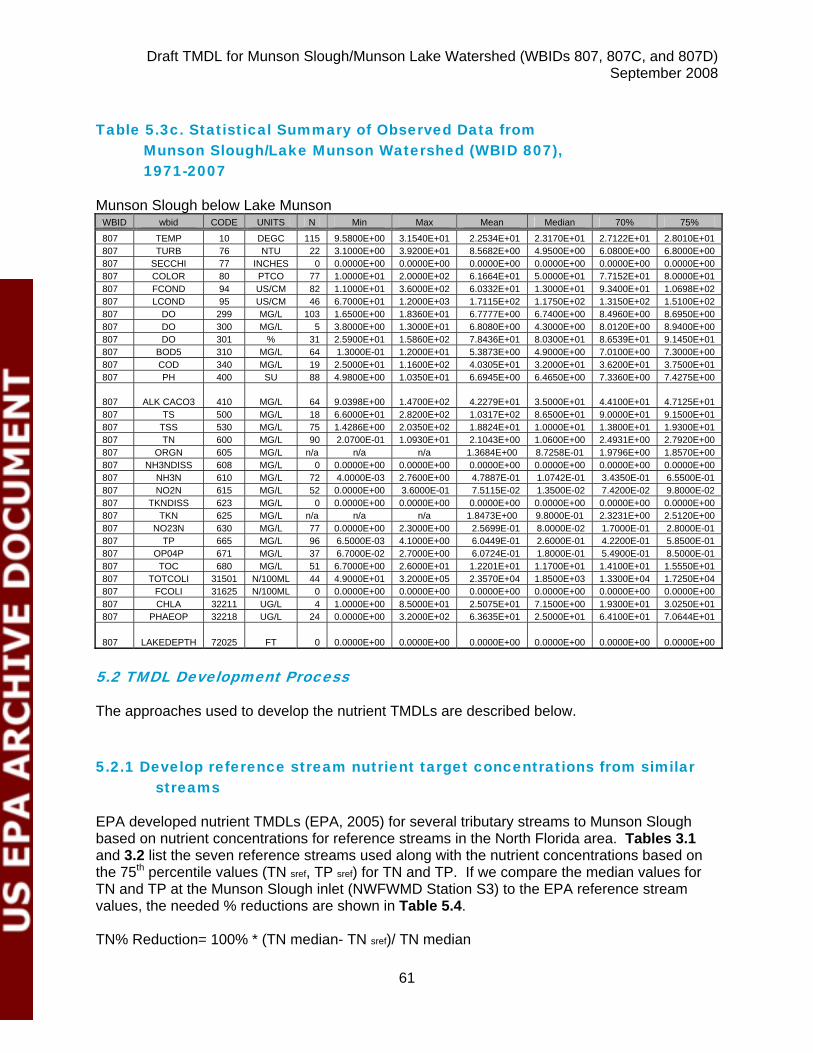
Draft TMDL for Munson Slough/Munson Lake Watershed (WBIDs 807, 807C, and 807D) September 2008
61
Table 5.3c. Statistical Summary of Observed Data from
Munson Slough/Lake Munson Watershed (WBID 807), 1971-2007
Munson Slough below Lake Munson WBID wbid CODE UNITS N Min Max Mean Median 70% 75%
807 TEMP 10 DEGC 115 9.5800E+00 3.1540E+01 2.2534E+01 2.3170E+01 2.7122E+01 2.8010E+01 807 TURB 76 NTU 22 3.1000E+00 3.9200E+01 8.5682E+00 4.9500E+00 6.0800E+00 6.8000E+00 807 SECCHI 77 INCHES 0 0.0000E+00 0.0000E+00 0.0000E+00 0.0000E+00 0.0000E+00 0.0000E+00 807 COLOR 80 PTCO 77 1.0000E+01 2.0000E+02 6.1664E+01 5.0000E+01 7.7152E+01 8.0000E+01 807 FCOND 94 US/CM 82 1.1000E+01 3.6000E+02 6.0332E+01 1.3000E+01 9.3400E+01 1.0698E+02 807 LCOND 95 US/CM 46 6.7000E+01 1.2000E+03 1.7115E+02 1.1750E+02 1.3150E+02 1.5100E+02 807 DO 299 MG/L 103 1.6500E+00 1.8360E+01 6.7777E+00 6.7400E+00 8.4960E+00 8.6950E+00 807 DO 300 MG/L 5 3.8000E+00 1.3000E+01 6.8080E+00 4.3000E+00 8.0120E+00 8.9400E+00 807 DO 301 % 31 2.5900E+01 1.5860E+02 7.8436E+01 8.0300E+01 8.6539E+01 9.1450E+01 807 BOD5 310 MG/L 64 1.3000E-01 1.2000E+01 5.3873E+00 4.9000E+00 7.0100E+00 7.3000E+00 807 COD 340 MG/L 19 2.5000E+01 1.1600E+02 4.0305E+01 3.2000E+01 3.6200E+01 3.7500E+01 807 PH 400 SU 88 4.9800E+00 1.0350E+01 6.6945E+00 6.4650E+00 7.3360E+00 7.4275E+00
807 ALK CACO3 410 MG/L 64 9.0398E+00 1.4700E+02 4.2279E+01 3.5000E+01 4.4100E+01 4.7125E+01 807 TS 500 MG/L 18 6.6000E+01 2.8200E+02 1.0317E+02 8.6500E+01 9.0000E+01 9.1500E+01 807 TSS 530 MG/L 75 1.4286E+00 2.0350E+02 1.8824E+01 1.0000E+01 1.3800E+01 1.9300E+01 807 TN 600 MG/L 90 2.0700E-01 1.0930E+01 2.1043E+00 1.0600E+00 2.4931E+00 2.7920E+00 807 ORGN 605 MG/L n/a n/a n/a 1.3684E+00 8.7258E-01 1.9796E+00 1.8570E+00 807 NH3NDISS 608 MG/L 0 0.0000E+00 0.0000E+00 0.0000E+00 0.0000E+00 0.0000E+00 0.0000E+00 807 NH3N 610 MG/L 72 4.0000E-03 2.7600E+00 4.7887E-01 1.0742E-01 3.4350E-01 6.5500E-01 807 NO2N 615 MG/L 52 0.0000E+00 3.6000E-01 7.5115E-02 1.3500E-02 7.4200E-02 9.8000E-02 807 TKNDISS 623 MG/L 0 0.0000E+00 0.0000E+00 0.0000E+00 0.0000E+00 0.0000E+00 0.0000E+00 807 TKN 625 MG/L n/a n/a n/a 1.8473E+00 9.8000E-01 2.3231E+00 2.5120E+00 807 NO23N 630 MG/L 77 0.0000E+00 2.3000E+00 2.5699E-01 8.0000E-02 1.7000E-01 2.8000E-01 807 TP 665 MG/L 96 6.5000E-03 4.1000E+00 6.0449E-01 2.6000E-01 4.2200E-01 5.8500E-01 807 OP04P 671 MG/L 37 6.7000E-02 2.7000E+00 6.0724E-01 1.8000E-01 5.4900E-01 8.5000E-01 807 TOC 680 MG/L 51 6.7000E+00 2.6000E+01 1.2201E+01 1.1700E+01 1.4100E+01 1.5550E+01 807 TOTCOLI 31501 N/100ML 44 4.9000E+01 3.2000E+05 2.3570E+04 1.8500E+03 1.3300E+04 1.7250E+04 807 FCOLI 31625 N/100ML 0 0.0000E+00 0.0000E+00 0.0000E+00 0.0000E+00 0.0000E+00 0.0000E+00 807 CHLA 32211 UG/L 4 1.0000E+00 8.5000E+01 2.5075E+01 7.1500E+00 1.9300E+01 3.0250E+01 807 PHAEOP 32218 UG/L 24 0.0000E+00 3.2000E+02 6.3635E+01 2.5000E+01 6.4100E+01 7.0644E+01
807 LAKEDEPTH 72025 FT 0 0.0000E+00 0.0000E+00 0.0000E+00 0.0000E+00 0.0000E+00 0.0000E+00
5.2 TMDL Development Process
The approaches used to develop the nutrient TMDLs are described below.
5.2.1 Develop reference stream nutrient target concentrations from similar streams
EPA developed nutrient TMDLs (EPA, 2005) for several tributary streams to Munson Slough based on nutrient concentrations for reference streams in the North Florida area. Tables 3.1 and 3.2 list the seven reference streams used along with the nutrient concentrations based on the 75th percentile values (TN sref, TP sref) for TN and TP. If we compare the median values for TN and TP at the Munson Slough inlet (NWFWMD Station S3) to the EPA reference stream values, the needed % reductions are shown in Table 5.4. TN% Reduction= 100% * (TN median- TN sref)/ TN median
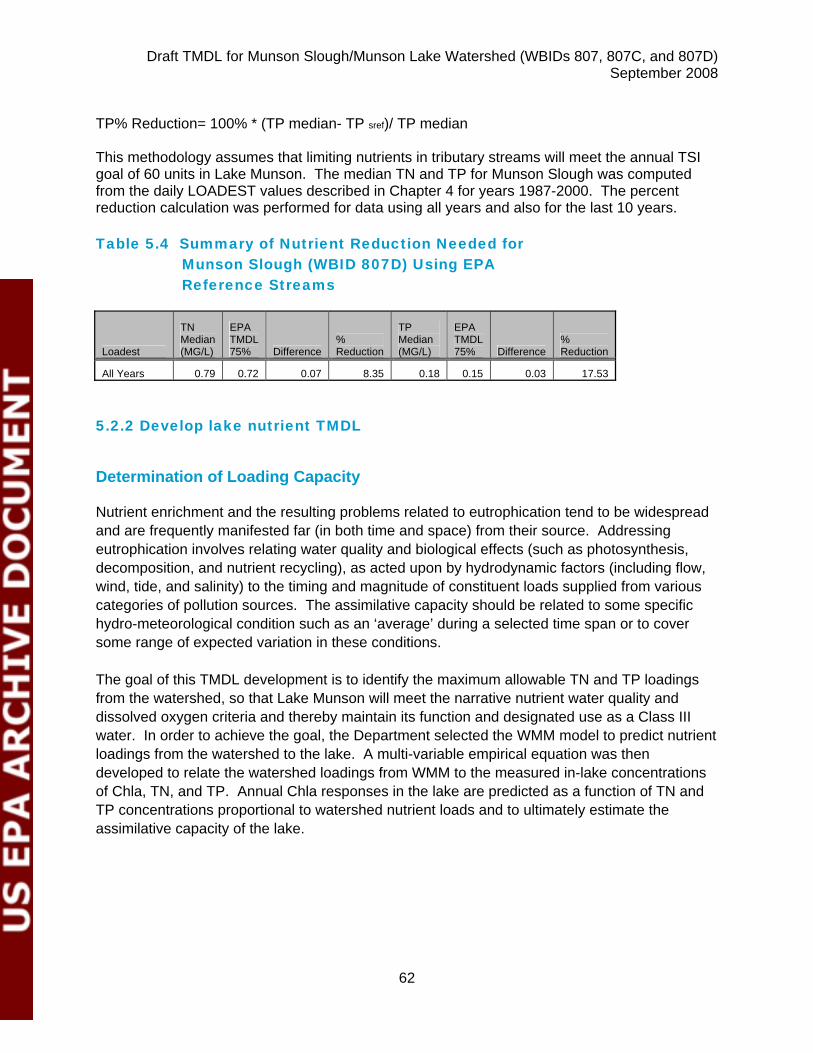
Draft TMDL for Munson Slough/Munson Lake Watershed (WBIDs 807, 807C, and 807D) September 2008
62
TP% Reduction= 100% * (TP median- TP sref)/ TP median This methodology assumes that limiting nutrients in tributary streams will meet the annual TSI goal of 60 units in Lake Munson. The median TN and TP for Munson Slough was computed from the daily LOADEST values described in Chapter 4 for years 1987-2000. The percent reduction calculation was performed for data using all years and also for the last 10 years. Table 5.4 Summary of Nutrient Reduction Needed for
Munson Slough (WBID 807D) Using EPA Reference Streams
Loadest
TN Median (MG/L)
EPA TMDL 75% Difference
% Reduction
TP Median (MG/L)
EPA TMDL 75% Difference
% Reduction
All Years 0.79 0.72 0.07 8.35 0.18 0.15 0.03 17.53 5.2.2 Develop lake nutrient TMDL
Determination of Loading Capacity
Nutrient enrichment and the resulting problems related to eutrophication tend to be widespread and are frequently manifested far (in both time and space) from their source. Addressing eutrophication involves relating water quality and biological effects (such as photosynthesis, decomposition, and nutrient recycling), as acted upon by hydrodynamic factors (including flow, wind, tide, and salinity) to the timing and magnitude of constituent loads supplied from various categories of pollution sources. The assimilative capacity should be related to some specific hydro-meteorological condition such as an ‘average’ during a selected time span or to cover some range of expected variation in these conditions. The goal of this TMDL development is to identify the maximum allowable TN and TP loadings from the watershed, so that Lake Munson will meet the narrative nutrient water quality and dissolved oxygen criteria and thereby maintain its function and designated use as a Class III water. In order to achieve the goal, the Department selected the WMM model to predict nutrient loadings from the watershed to the lake. A multi-variable empirical equation was then developed to relate the watershed loadings from WMM to the measured in-lake concentrations of Chla, TN, and TP. Annual Chla responses in the lake are predicted as a function of TN and TP concentrations proportional to watershed nutrient loads and to ultimately estimate the assimilative capacity of the lake.
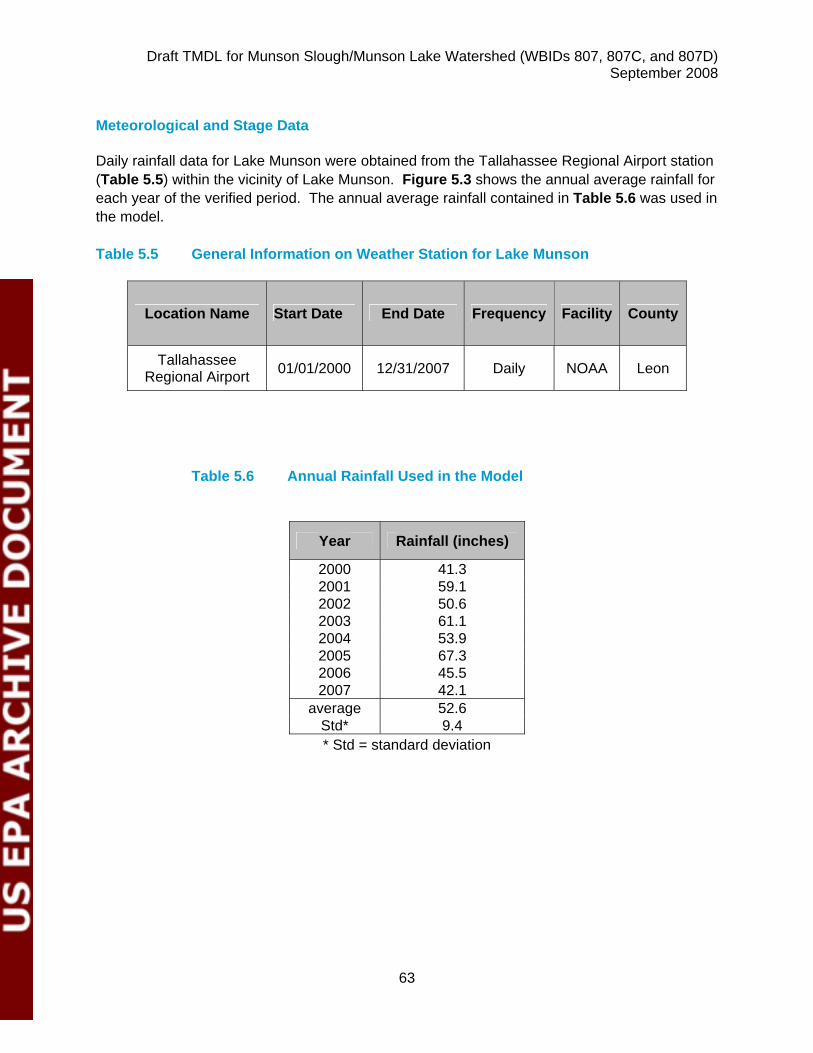
Draft TMDL for Munson Slough/Munson Lake Watershed (WBIDs 807, 807C, and 807D) September 2008
63
Meteorological and Stage Data Daily rainfall data for Lake Munson were obtained from the Tallahassee Regional Airport station (Table 5.5) within the vicinity of Lake Munson. Figure 5.3 shows the annual average rainfall for each year of the verified period. The annual average rainfall contained in Table 5.6 was used in the model. Table 5.5 General Information on Weather Station for Lake Munson
Location Name Start Date End Date Frequency Facility County
Tallahassee Regional Airport 01/01/2000 12/31/2007 Daily NOAA Leon
Table 5.6 Annual Rainfall Used in the Model
Year Rainfall (inches)
2000 41.3 2001 59.1 2002 50.6 2003 61.1 2004 53.9 2005 67.3 2006 45.5 2007 42.1
average 52.6 Std* 9.4 * Std = standard deviation
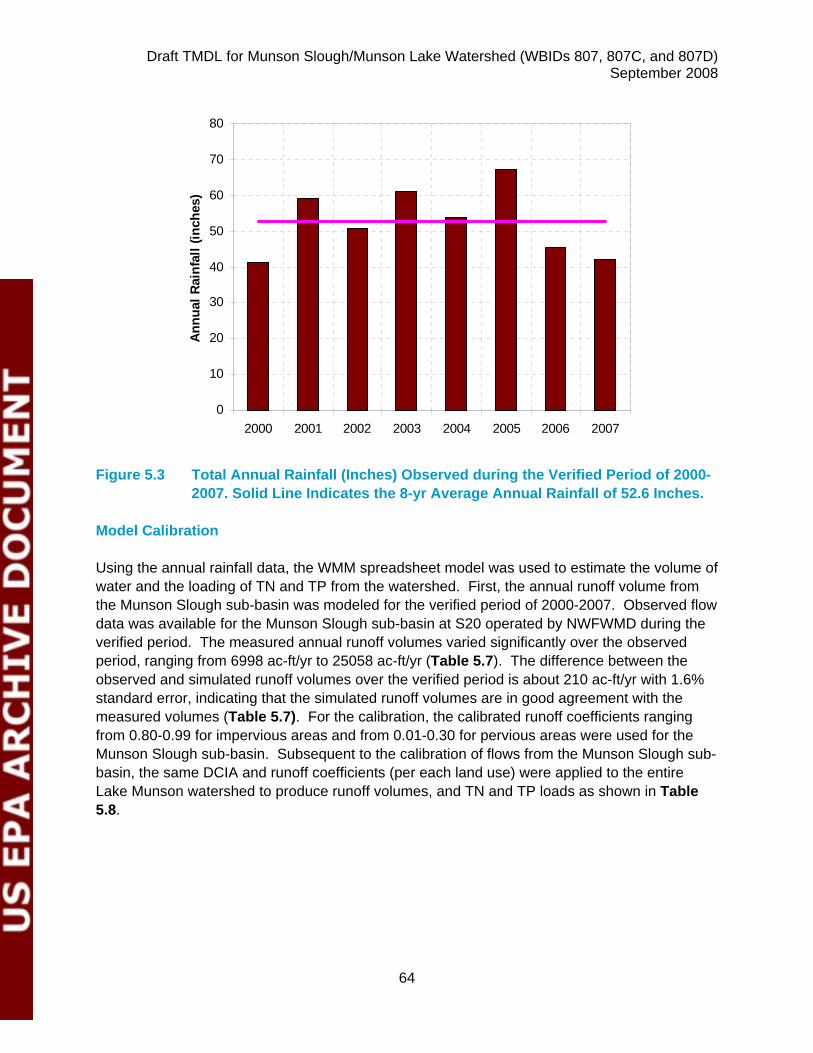
Draft TMDL for Munson Slough/Munson Lake Watershed (WBIDs 807, 807C, and 807D) September 2008
64
0
10
20
30
40
50
60
70
80
2000 2001 2002 2003 2004 2005 2006 2007
Annu
al R
ainf
all (
inch
es)
Figure 5.3 Total Annual Rainfall (Inches) Observed during the Verified Period of 2000-
2007. Solid Line Indicates the 8-yr Average Annual Rainfall of 52.6 Inches. Model Calibration Using the annual rainfall data, the WMM spreadsheet model was used to estimate the volume of water and the loading of TN and TP from the watershed. First, the annual runoff volume from the Munson Slough sub-basin was modeled for the verified period of 2000-2007. Observed flow data was available for the Munson Slough sub-basin at S20 operated by NWFWMD during the verified period. The measured annual runoff volumes varied significantly over the observed period, ranging from 6998 ac-ft/yr to 25058 ac-ft/yr (Table 5.7). The difference between the observed and simulated runoff volumes over the verified period is about 210 ac-ft/yr with 1.6% standard error, indicating that the simulated runoff volumes are in good agreement with the measured volumes (Table 5.7). For the calibration, the calibrated runoff coefficients ranging from 0.80-0.99 for impervious areas and from 0.01-0.30 for pervious areas were used for the Munson Slough sub-basin. Subsequent to the calibration of flows from the Munson Slough sub-basin, the same DCIA and runoff coefficients (per each land use) were applied to the entire Lake Munson watershed to produce runoff volumes, and TN and TP loads as shown in Table 5.8.
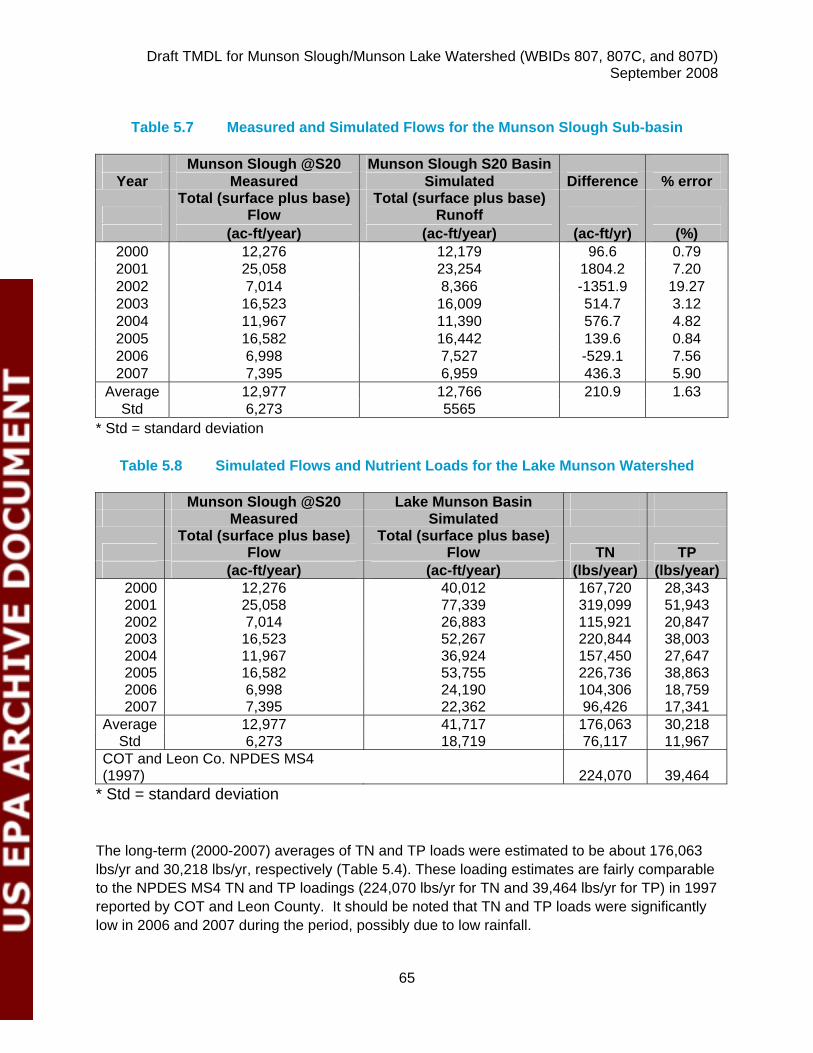
Draft TMDL for Munson Slough/Munson Lake Watershed (WBIDs 807, 807C, and 807D) September 2008
65
Table 5.7 Measured and Simulated Flows for the Munson Slough Sub-basin
Munson Slough @S20 Munson Slough S20 Basin
Year Measured Simulated Difference % error
Total (surface plus base)
Flow Total (surface plus base)
Runoff (ac-ft/year) (ac-ft/year) (ac-ft/yr) (%)
2000 12,276 12,179 96.6 0.79 2001 25,058 23,254 1804.2 7.20 2002 7,014 8,366 -1351.9 19.27 2003 16,523 16,009 514.7 3.12 2004 11,967 11,390 576.7 4.82 2005 16,582 16,442 139.6 0.84 2006 6,998 7,527 -529.1 7.56 2007 7,395 6,959 436.3 5.90
Average 12,977 12,766 210.9 1.63 Std 6,273 5565
* Std = standard deviation
Table 5.8 Simulated Flows and Nutrient Loads for the Lake Munson Watershed
Munson Slough @S20 Lake Munson Basin Measured Simulated
Total (surface plus base)
Flow Total (surface plus base)
Flow TN TP (ac-ft/year) (ac-ft/year) (lbs/year) (lbs/year)
2000 12,276 40,012 167,720 28,343 2001 25,058 77,339 319,099 51,943 2002 7,014 26,883 115,921 20,847 2003 16,523 52,267 220,844 38,003 2004 11,967 36,924 157,450 27,647 2005 16,582 53,755 226,736 38,863 2006 6,998 24,190 104,306 18,759 2007 7,395 22,362 96,426 17,341
Average 12,977 41,717 176,063 30,218 Std 6,273 18,719 76,117 11,967
COT and Leon Co. NPDES MS4 (1997) 224,070 39,464
* Std = standard deviation
The long-term (2000-2007) averages of TN and TP loads were estimated to be about 176,063 lbs/yr and 30,218 lbs/yr, respectively (Table 5.4). These loading estimates are fairly comparable to the NPDES MS4 TN and TP loadings (224,070 lbs/yr for TN and 39,464 lbs/yr for TP) in 1997 reported by COT and Leon County. It should be noted that TN and TP loads were significantly low in 2006 and 2007 during the period, possibly due to low rainfall.
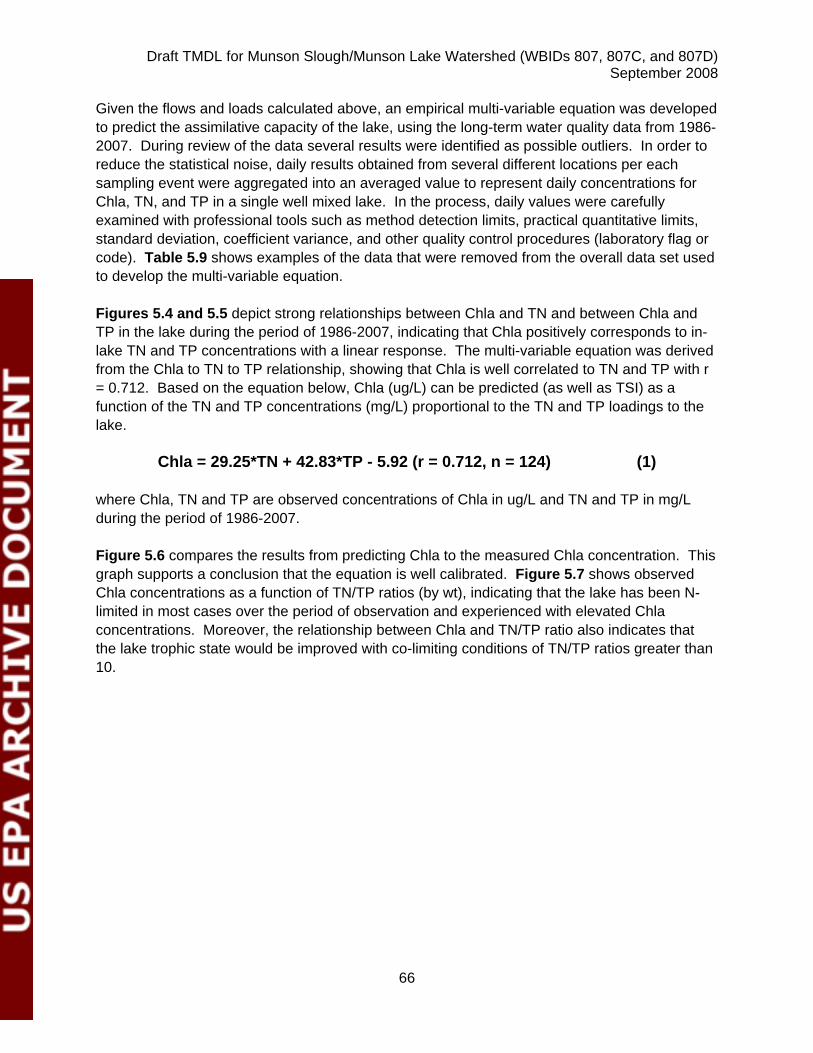
Draft TMDL for Munson Slough/Munson Lake Watershed (WBIDs 807, 807C, and 807D) September 2008
66
Given the flows and loads calculated above, an empirical multi-variable equation was developed to predict the assimilative capacity of the lake, using the long-term water quality data from 1986-2007. During review of the data several results were identified as possible outliers. In order to reduce the statistical noise, daily results obtained from several different locations per each sampling event were aggregated into an averaged value to represent daily concentrations for Chla, TN, and TP in a single well mixed lake. In the process, daily values were carefully examined with professional tools such as method detection limits, practical quantitative limits, standard deviation, coefficient variance, and other quality control procedures (laboratory flag or code). Table 5.9 shows examples of the data that were removed from the overall data set used to develop the multi-variable equation. Figures 5.4 and 5.5 depict strong relationships between Chla and TN and between Chla and TP in the lake during the period of 1986-2007, indicating that Chla positively corresponds to in-lake TN and TP concentrations with a linear response. The multi-variable equation was derived from the Chla to TN to TP relationship, showing that Chla is well correlated to TN and TP with r = 0.712. Based on the equation below, Chla (ug/L) can be predicted (as well as TSI) as a function of the TN and TP concentrations (mg/L) proportional to the TN and TP loadings to the lake.
Chla = 29.25*TN + 42.83*TP - 5.92 (r = 0.712, n = 124) (1) where Chla, TN and TP are observed concentrations of Chla in ug/L and TN and TP in mg/L during the period of 1986-2007. Figure 5.6 compares the results from predicting Chla to the measured Chla concentration. This graph supports a conclusion that the equation is well calibrated. Figure 5.7 shows observed Chla concentrations as a function of TN/TP ratios (by wt), indicating that the lake has been N-limited in most cases over the period of observation and experienced with elevated Chla concentrations. Moreover, the relationship between Chla and TN/TP ratio also indicates that the lake trophic state would be improved with co-limiting conditions of TN/TP ratios greater than 10.
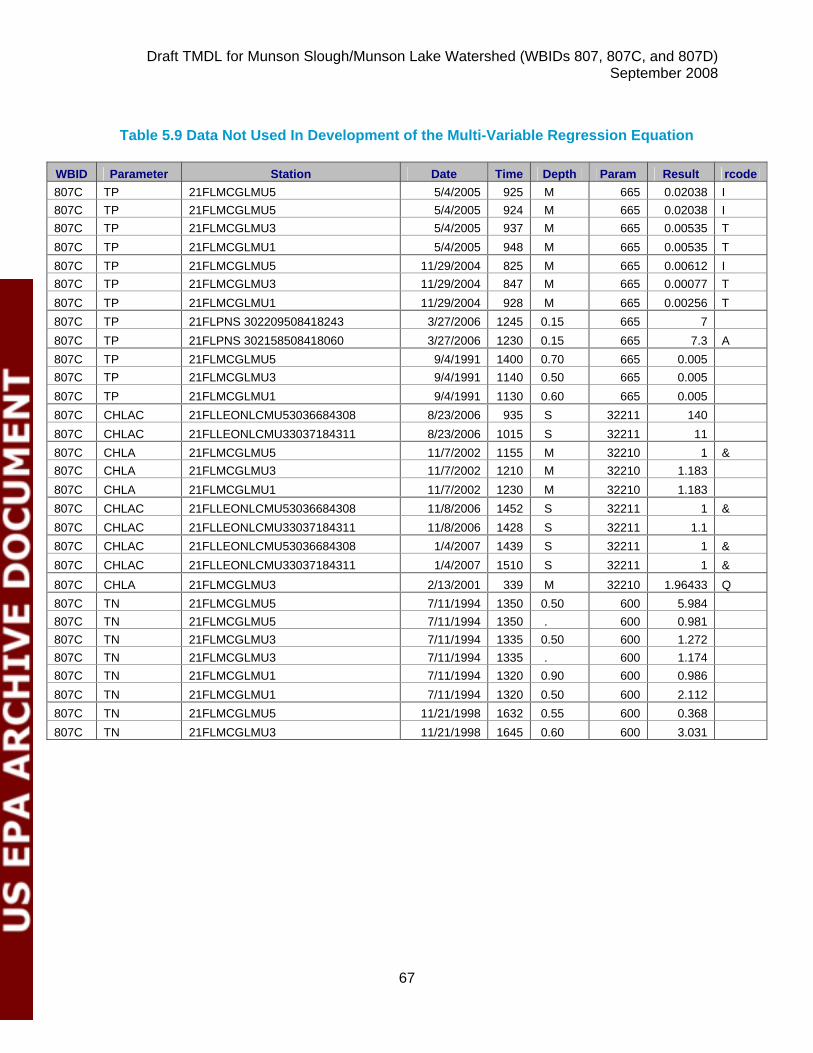
Draft TMDL for Munson Slough/Munson Lake Watershed (WBIDs 807, 807C, and 807D) September 2008
67
Table 5.9 Data Not Used In Development of the Multi-Variable Regression Equation
WBID Parameter Station Date Time Depth Param Result rcode 807C TP 21FLMCGLMU5 5/4/2005 925 M 665 0.02038 I 807C TP 21FLMCGLMU5 5/4/2005 924 M 665 0.02038 I 807C TP 21FLMCGLMU3 5/4/2005 937 M 665 0.00535 T 807C TP 21FLMCGLMU1 5/4/2005 948 M 665 0.00535 T 807C TP 21FLMCGLMU5 11/29/2004 825 M 665 0.00612 I 807C TP 21FLMCGLMU3 11/29/2004 847 M 665 0.00077 T 807C TP 21FLMCGLMU1 11/29/2004 928 M 665 0.00256 T 807C TP 21FLPNS 302209508418243 3/27/2006 1245 0.15 665 7 807C TP 21FLPNS 302158508418060 3/27/2006 1230 0.15 665 7.3 A 807C TP 21FLMCGLMU5 9/4/1991 1400 0.70 665 0.005 807C TP 21FLMCGLMU3 9/4/1991 1140 0.50 665 0.005 807C TP 21FLMCGLMU1 9/4/1991 1130 0.60 665 0.005 807C CHLAC 21FLLEONLCMU53036684308 8/23/2006 935 S 32211 140 807C CHLAC 21FLLEONLCMU33037184311 8/23/2006 1015 S 32211 11 807C CHLA 21FLMCGLMU5 11/7/2002 1155 M 32210 1 & 807C CHLA 21FLMCGLMU3 11/7/2002 1210 M 32210 1.183 807C CHLA 21FLMCGLMU1 11/7/2002 1230 M 32210 1.183 807C CHLAC 21FLLEONLCMU53036684308 11/8/2006 1452 S 32211 1 & 807C CHLAC 21FLLEONLCMU33037184311 11/8/2006 1428 S 32211 1.1 807C CHLAC 21FLLEONLCMU53036684308 1/4/2007 1439 S 32211 1 & 807C CHLAC 21FLLEONLCMU33037184311 1/4/2007 1510 S 32211 1 & 807C CHLA 21FLMCGLMU3 2/13/2001 339 M 32210 1.96433 Q 807C TN 21FLMCGLMU5 7/11/1994 1350 0.50 600 5.984 807C TN 21FLMCGLMU5 7/11/1994 1350 . 600 0.981 807C TN 21FLMCGLMU3 7/11/1994 1335 0.50 600 1.272 807C TN 21FLMCGLMU3 7/11/1994 1335 . 600 1.174 807C TN 21FLMCGLMU1 7/11/1994 1320 0.90 600 0.986 807C TN 21FLMCGLMU1 7/11/1994 1320 0.50 600 2.112 807C TN 21FLMCGLMU5 11/21/1998 1632 0.55 600 0.368 807C TN 21FLMCGLMU3 11/21/1998 1645 0.60 600 3.031
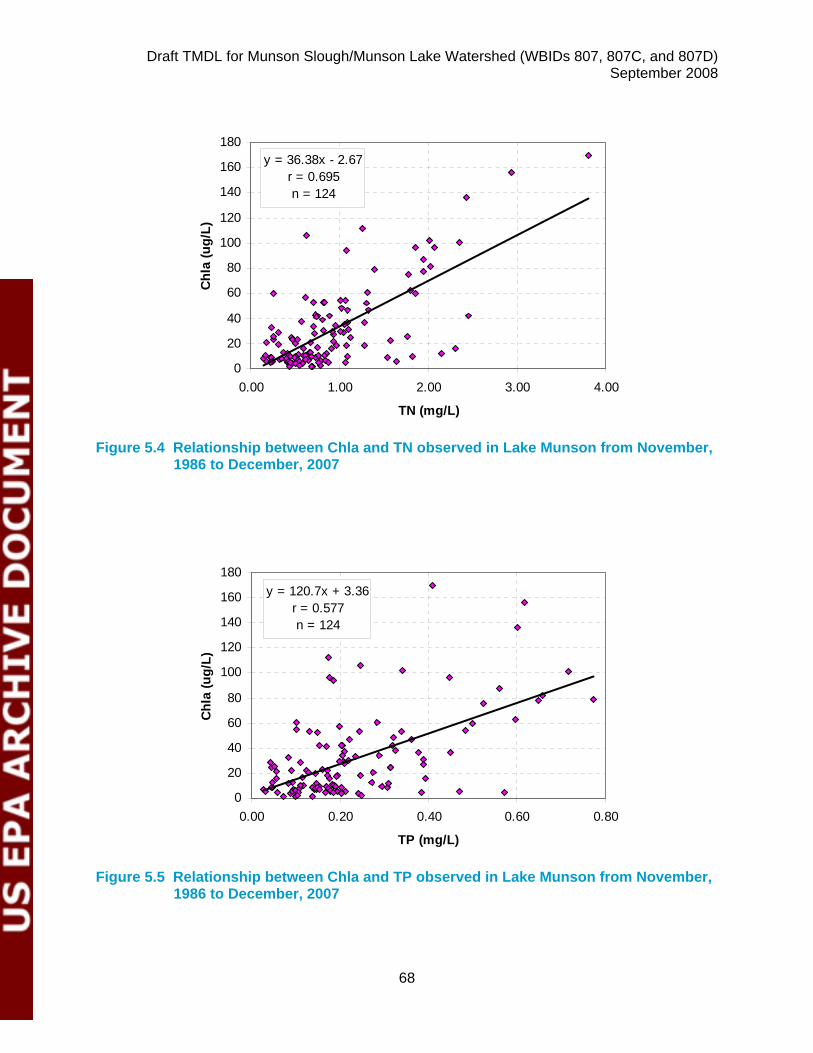
Draft TMDL for Munson Slough/Munson Lake Watershed (WBIDs 807, 807C, and 807D) September 2008
68
y = 36.38x - 2.67r = 0.695n = 124
0
20
40
60
80
100
120
140
160
180
0.00 1.00 2.00 3.00 4.00
TN (mg/L)
Chl
a (u
g/L)
Figure 5.4 Relationship between Chla and TN observed in Lake Munson from November,
1986 to December, 2007
y = 120.7x + 3.36r = 0.577n = 124
0
20
40
60
80
100
120
140
160
180
0.00 0.20 0.40 0.60 0.80
TP (mg/L)
Chl
a (u
g/L)
Figure 5.5 Relationship between Chla and TP observed in Lake Munson from November,
1986 to December, 2007
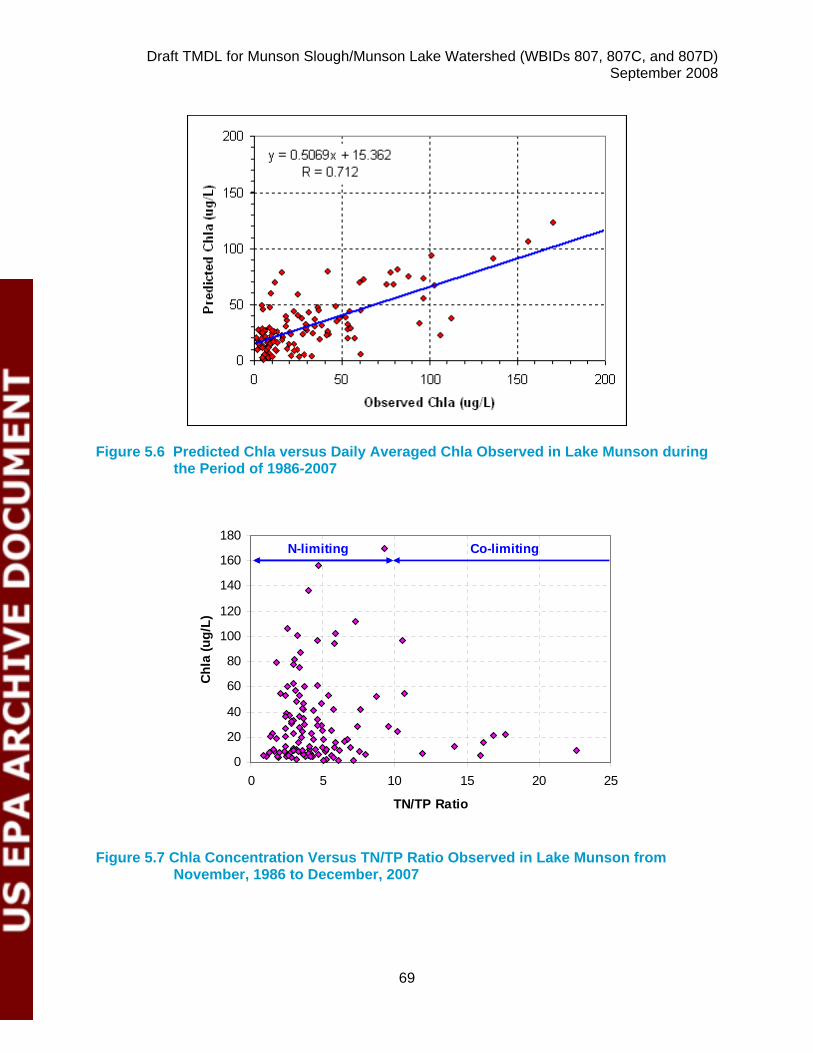
Draft TMDL for Munson Slough/Munson Lake Watershed (WBIDs 807, 807C, and 807D) September 2008
69
Figure 5.6 Predicted Chla versus Daily Averaged Chla Observed in Lake Munson during
the Period of 1986-2007
0
20
40
60
80
100
120
140
160
180
0 5 10 15 20 25
TN/TP Ratio
Chl
a (u
g/L)
N-limiting Co-limiting
Figure 5.7 Chla Concentration Versus TN/TP Ratio Observed in Lake Munson from November, 1986 to December, 2007
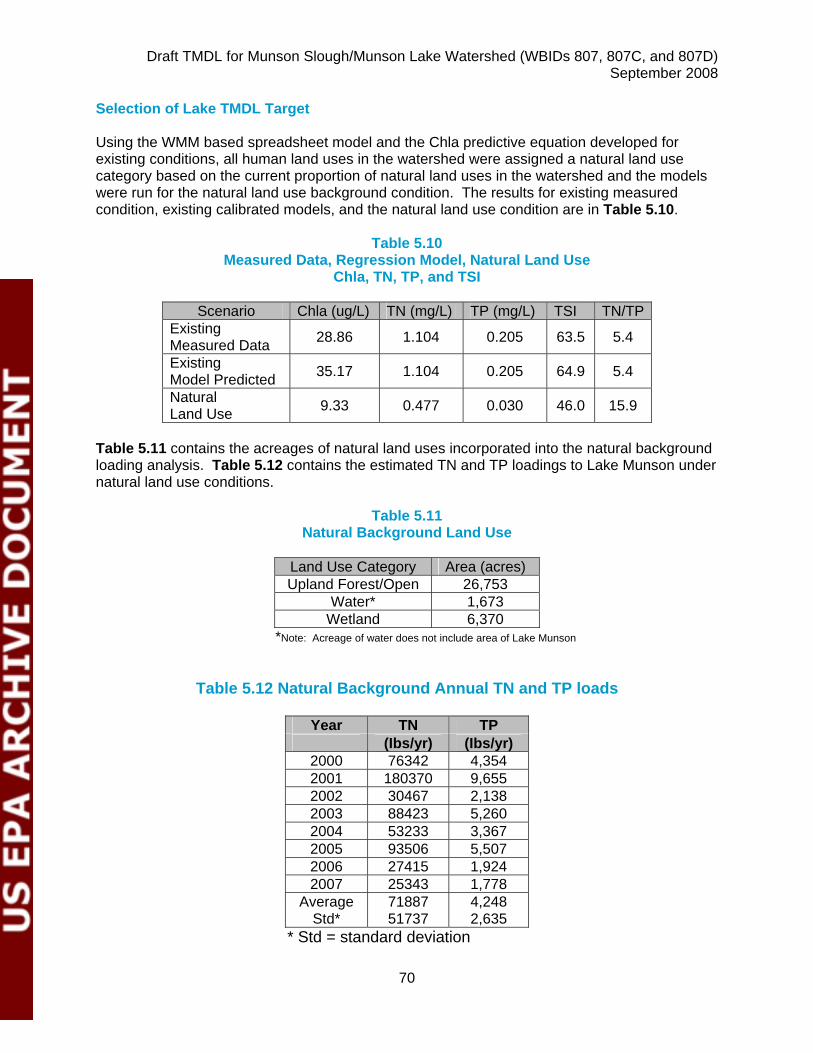
Draft TMDL for Munson Slough/Munson Lake Watershed (WBIDs 807, 807C, and 807D) September 2008
70
Selection of Lake TMDL Target Using the WMM based spreadsheet model and the Chla predictive equation developed for existing conditions, all human land uses in the watershed were assigned a natural land use category based on the current proportion of natural land uses in the watershed and the models were run for the natural land use background condition. The results for existing measured condition, existing calibrated models, and the natural land use condition are in Table 5.10.
Table 5.10 Measured Data, Regression Model, Natural Land Use
Chla, TN, TP, and TSI
Scenario Chla (ug/L) TN (mg/L) TP (mg/L) TSI TN/TP Existing Measured Data 28.86 1.104 0.205 63.5 5.4
Existing Model Predicted 35.17 1.104 0.205 64.9 5.4
Natural Land Use 9.33 0.477 0.030 46.0 15.9
Table 5.11 contains the acreages of natural land uses incorporated into the natural background loading analysis. Table 5.12 contains the estimated TN and TP loadings to Lake Munson under natural land use conditions.
Table 5.11
Natural Background Land Use
Land Use Category Area (acres) Upland Forest/Open 26,753
Water* 1,673 Wetland 6,370
*Note: Acreage of water does not include area of Lake Munson
Table 5.12 Natural Background Annual TN and TP loads
Year TN TP (Ibs/yr) (Ibs/yr)
2000 76342 4,354 2001 180370 9,655 2002 30467 2,138 2003 88423 5,260 2004 53233 3,367 2005 93506 5,507 2006 27415 1,924 2007 25343 1,778
Average 71887 4,248 Std* 51737 2,635
* Std = standard deviation
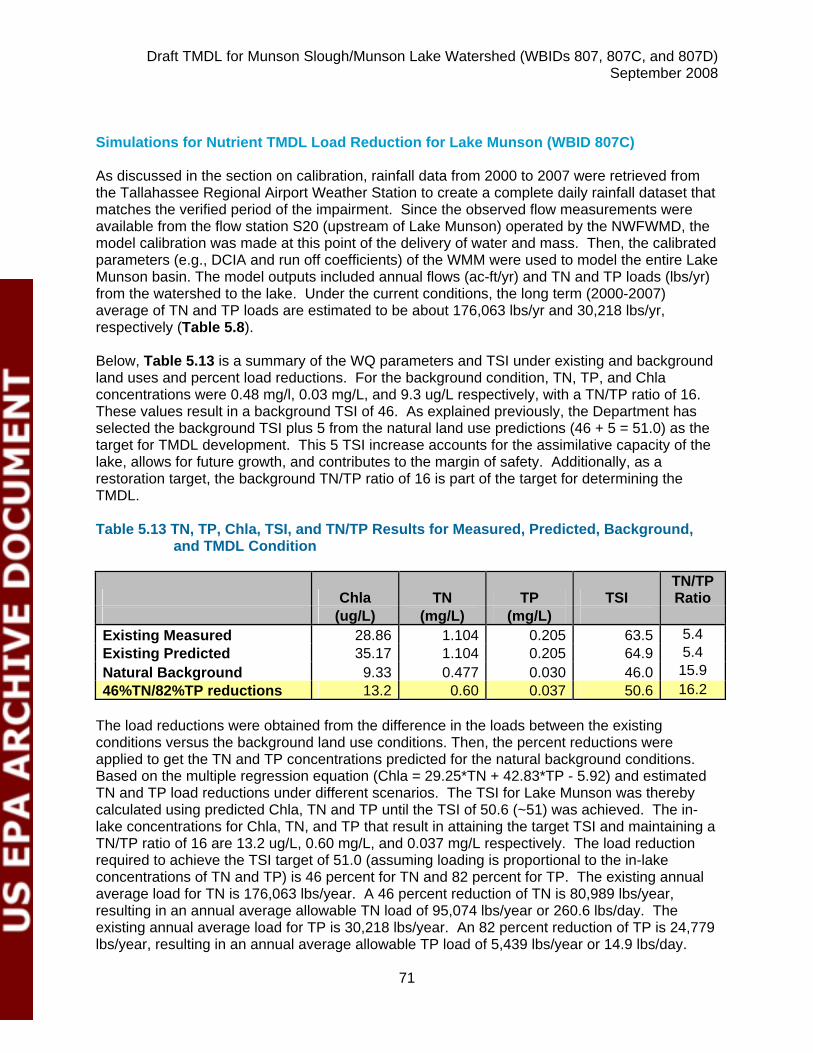
Draft TMDL for Munson Slough/Munson Lake Watershed (WBIDs 807, 807C, and 807D) September 2008
71
Simulations for Nutrient TMDL Load Reduction for Lake Munson (WBID 807C) As discussed in the section on calibration, rainfall data from 2000 to 2007 were retrieved from the Tallahassee Regional Airport Weather Station to create a complete daily rainfall dataset that matches the verified period of the impairment. Since the observed flow measurements were available from the flow station S20 (upstream of Lake Munson) operated by the NWFWMD, the model calibration was made at this point of the delivery of water and mass. Then, the calibrated parameters (e.g., DCIA and run off coefficients) of the WMM were used to model the entire Lake Munson basin. The model outputs included annual flows (ac-ft/yr) and TN and TP loads (lbs/yr) from the watershed to the lake. Under the current conditions, the long term (2000-2007) average of TN and TP loads are estimated to be about 176,063 lbs/yr and 30,218 lbs/yr, respectively (Table 5.8). Below, Table 5.13 is a summary of the WQ parameters and TSI under existing and background land uses and percent load reductions. For the background condition, TN, TP, and Chla concentrations were 0.48 mg/l, 0.03 mg/L, and 9.3 ug/L respectively, with a TN/TP ratio of 16. These values result in a background TSI of 46. As explained previously, the Department has selected the background TSI plus 5 from the natural land use predictions (46 + 5 = 51.0) as the target for TMDL development. This 5 TSI increase accounts for the assimilative capacity of the lake, allows for future growth, and contributes to the margin of safety. Additionally, as a restoration target, the background TN/TP ratio of 16 is part of the target for determining the TMDL. Table 5.13 TN, TP, Chla, TSI, and TN/TP Results for Measured, Predicted, Background,
and TMDL Condition
Chla TN TP TSI TN/TP Ratio
(ug/L) (mg/L) (mg/L) Existing Measured 28.86 1.104 0.205 63.5 5.4 Existing Predicted 35.17 1.104 0.205 64.9 5.4 Natural Background 9.33 0.477 0.030 46.0 15.9 46%TN/82%TP reductions 13.2 0.60 0.037 50.6 16.2
The load reductions were obtained from the difference in the loads between the existing conditions versus the background land use conditions. Then, the percent reductions were applied to get the TN and TP concentrations predicted for the natural background conditions. Based on the multiple regression equation (Chla = 29.25*TN + 42.83*TP - 5.92) and estimated TN and TP load reductions under different scenarios. The TSI for Lake Munson was thereby calculated using predicted Chla, TN and TP until the TSI of 50.6 (~51) was achieved. The in-lake concentrations for Chla, TN, and TP that result in attaining the target TSI and maintaining a TN/TP ratio of 16 are 13.2 ug/L, 0.60 mg/L, and 0.037 mg/L respectively. The load reduction required to achieve the TSI target of 51.0 (assuming loading is proportional to the in-lake concentrations of TN and TP) is 46 percent for TN and 82 percent for TP. The existing annual average load for TN is 176,063 lbs/year. A 46 percent reduction of TN is 80,989 lbs/year, resulting in an annual average allowable TN load of 95,074 lbs/year or 260.6 lbs/day. The existing annual average load for TP is 30,218 lbs/year. An 82 percent reduction of TP is 24,779 lbs/year, resulting in an annual average allowable TP load of 5,439 lbs/year or 14.9 lbs/day.
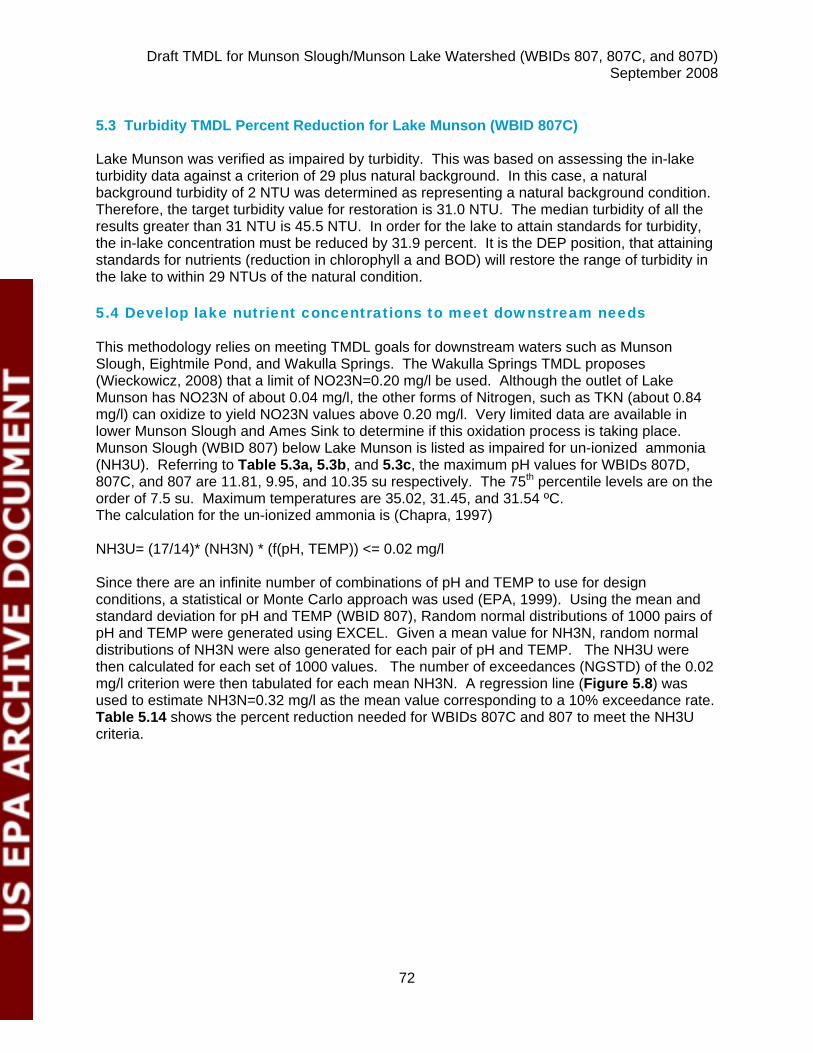
Draft TMDL for Munson Slough/Munson Lake Watershed (WBIDs 807, 807C, and 807D) September 2008
72
5.3 Turbidity TMDL Percent Reduction for Lake Munson (WBID 807C) Lake Munson was verified as impaired by turbidity. This was based on assessing the in-lake turbidity data against a criterion of 29 plus natural background. In this case, a natural background turbidity of 2 NTU was determined as representing a natural background condition. Therefore, the target turbidity value for restoration is 31.0 NTU. The median turbidity of all the results greater than 31 NTU is 45.5 NTU. In order for the lake to attain standards for turbidity, the in-lake concentration must be reduced by 31.9 percent. It is the DEP position, that attaining standards for nutrients (reduction in chlorophyll a and BOD) will restore the range of turbidity in the lake to within 29 NTUs of the natural condition. 5.4 Develop lake nutrient concentrations to meet downstream needs
This methodology relies on meeting TMDL goals for downstream waters such as Munson Slough, Eightmile Pond, and Wakulla Springs. The Wakulla Springs TMDL proposes (Wieckowicz, 2008) that a limit of NO23N=0.20 mg/l be used. Although the outlet of Lake Munson has NO23N of about 0.04 mg/l, the other forms of Nitrogen, such as TKN (about 0.84 mg/l) can oxidize to yield NO23N values above 0.20 mg/l. Very limited data are available in lower Munson Slough and Ames Sink to determine if this oxidation process is taking place. Munson Slough (WBID 807) below Lake Munson is listed as impaired for un-ionized ammonia (NH3U). Referring to Table 5.3a, 5.3b, and 5.3c, the maximum pH values for WBIDs 807D, 807C, and 807 are 11.81, 9.95, and 10.35 su respectively. The 75th percentile levels are on the order of 7.5 su. Maximum temperatures are 35.02, 31.45, and 31.54 ºC. The calculation for the un-ionized ammonia is (Chapra, 1997) NH3U= (17/14)* (NH3N) * (f(pH, TEMP)) <= 0.02 mg/l Since there are an infinite number of combinations of pH and TEMP to use for design conditions, a statistical or Monte Carlo approach was used (EPA, 1999). Using the mean and standard deviation for pH and TEMP (WBID 807), Random normal distributions of 1000 pairs of pH and TEMP were generated using EXCEL. Given a mean value for NH3N, random normal distributions of NH3N were also generated for each pair of pH and TEMP. The NH3U were then calculated for each set of 1000 values. The number of exceedances (NGSTD) of the 0.02 mg/l criterion were then tabulated for each mean NH3N. A regression line (Figure 5.8) was used to estimate NH3N=0.32 mg/l as the mean value corresponding to a 10% exceedance rate. Table 5.14 shows the percent reduction needed for WBIDs 807C and 807 to meet the NH3U criteria.
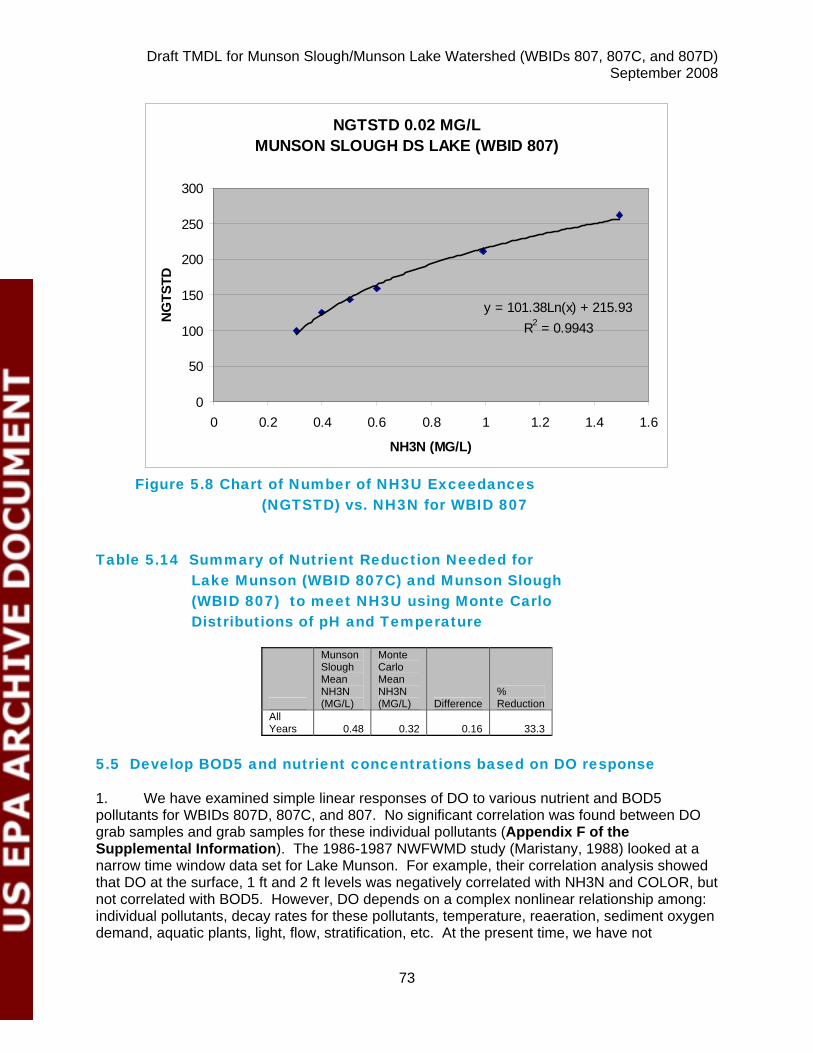
Draft TMDL for Munson Slough/Munson Lake Watershed (WBIDs 807, 807C, and 807D) September 2008
73
NGTSTD 0.02 MG/LMUNSON SLOUGH DS LAKE (WBID 807)
y = 101.38Ln(x) + 215.93R2 = 0.9943
0
50
100
150
200
250
300
0 0.2 0.4 0.6 0.8 1 1.2 1.4 1.6
NH3N (MG/L)
NG
TSTD
Figure 5.8 Chart of Number of NH3U Exceedances
(NGTSTD) vs. NH3N for WBID 807
Table 5.14 Summary of Nutrient Reduction Needed for
Lake Munson (WBID 807C) and Munson Slough (WBID 807) to meet NH3U using Monte Carlo Distributions of pH and Temperature
Munson Slough Mean NH3N (MG/L)
Monte Carlo Mean NH3N (MG/L) Difference
% Reduction
All Years 0.48 0.32 0.16 33.3
5.5 Develop BOD5 and nutrient concentrations based on DO response
1. We have examined simple linear responses of DO to various nutrient and BOD5 pollutants for WBIDs 807D, 807C, and 807. No significant correlation was found between DO grab samples and grab samples for these individual pollutants (Appendix F of the Supplemental Information). The 1986-1987 NWFWMD study (Maristany, 1988) looked at a narrow time window data set for Lake Munson. For example, their correlation analysis showed that DO at the surface, 1 ft and 2 ft levels was negatively correlated with NH3N and COLOR, but not correlated with BOD5. However, DO depends on a complex nonlinear relationship among: individual pollutants, decay rates for these pollutants, temperature, reaeration, sediment oxygen demand, aquatic plants, light, flow, stratification, etc. At the present time, we have not
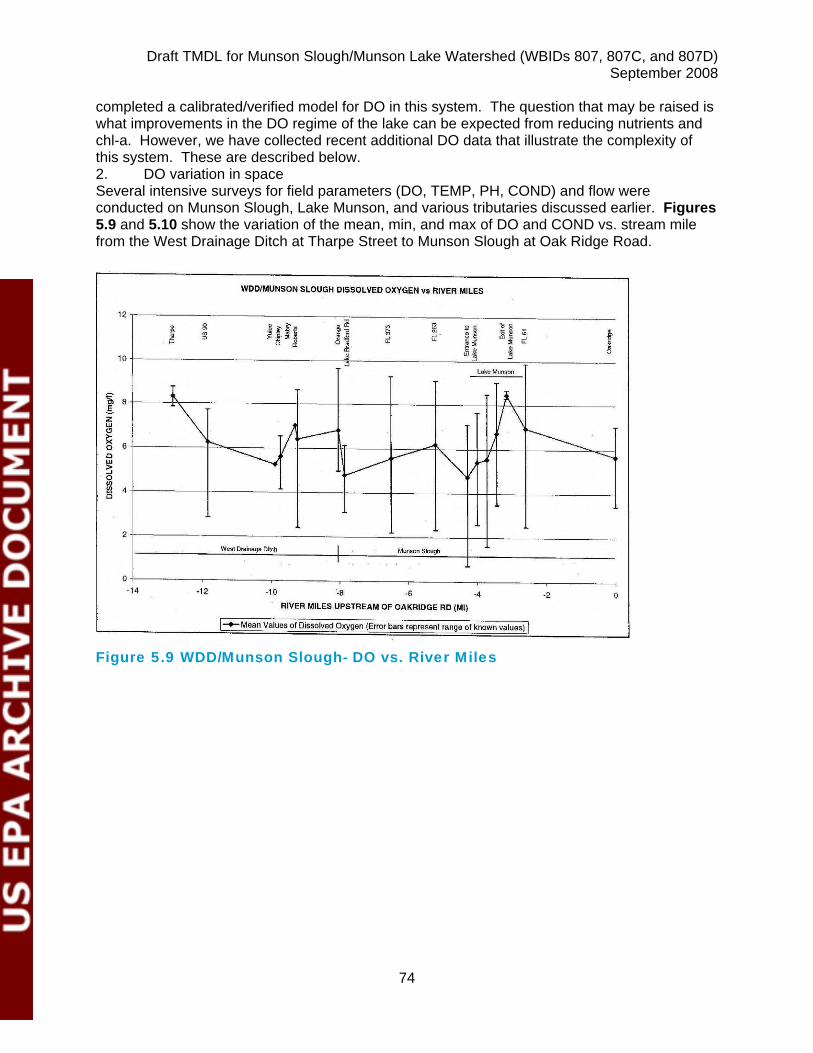
Draft TMDL for Munson Slough/Munson Lake Watershed (WBIDs 807, 807C, and 807D) September 2008
74
completed a calibrated/verified model for DO in this system. The question that may be raised is what improvements in the DO regime of the lake can be expected from reducing nutrients and chl-a. However, we have collected recent additional DO data that illustrate the complexity of this system. These are described below. 2. DO variation in space Several intensive surveys for field parameters (DO, TEMP, PH, COND) and flow were conducted on Munson Slough, Lake Munson, and various tributaries discussed earlier. Figures 5.9 and 5.10 show the variation of the mean, min, and max of DO and COND vs. stream mile from the West Drainage Ditch at Tharpe Street to Munson Slough at Oak Ridge Road.
Figure 5.9 WDD/Munson Slough- DO vs. River Miles
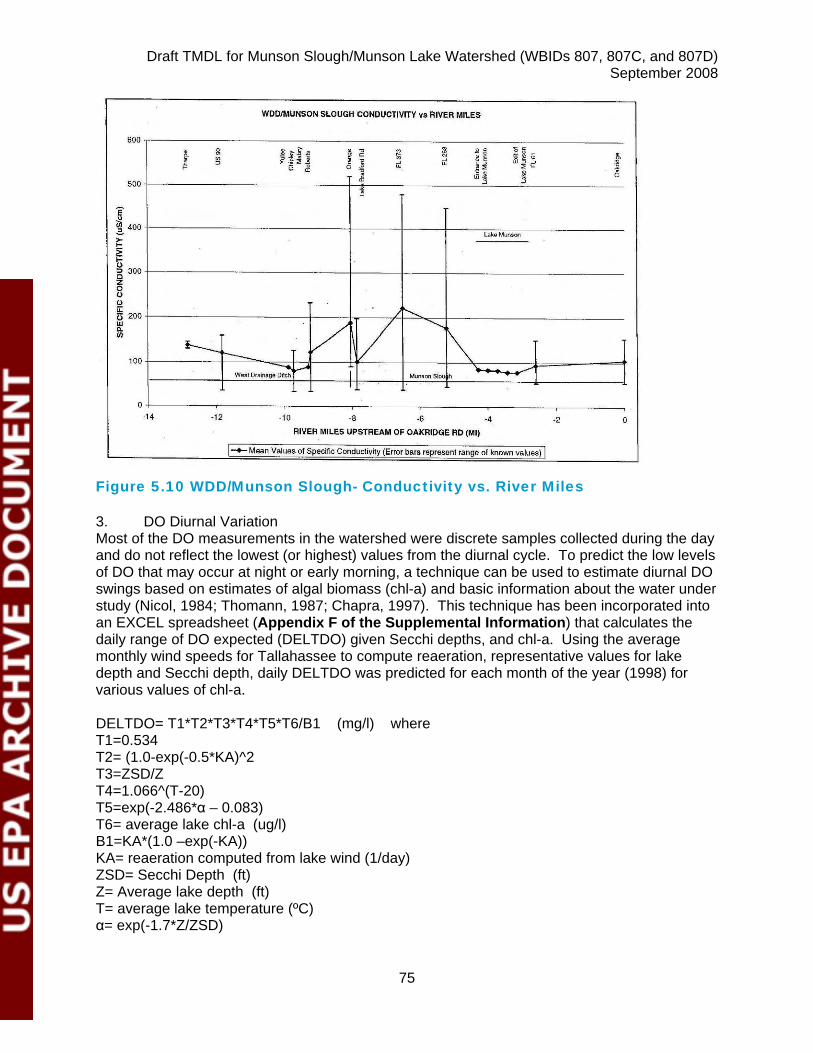
Draft TMDL for Munson Slough/Munson Lake Watershed (WBIDs 807, 807C, and 807D) September 2008
75
Figure 5.10 WDD/Munson Slough- Conductivity vs. River Miles 3. DO Diurnal Variation Most of the DO measurements in the watershed were discrete samples collected during the day and do not reflect the lowest (or highest) values from the diurnal cycle. To predict the low levels of DO that may occur at night or early morning, a technique can be used to estimate diurnal DO swings based on estimates of algal biomass (chl-a) and basic information about the water under study (Nicol, 1984; Thomann, 1987; Chapra, 1997). This technique has been incorporated into an EXCEL spreadsheet (Appendix F of the Supplemental Information) that calculates the daily range of DO expected (DELTDO) given Secchi depths, and chl-a. Using the average monthly wind speeds for Tallahassee to compute reaeration, representative values for lake depth and Secchi depth, daily DELTDO was predicted for each month of the year (1998) for various values of chl-a. DELTDO= T1*T2*T3*T4*T5*T6/B1 (mg/l) where T1=0.534 T2= (1.0-exp(-0.5*KA)^2 T3=ZSD/Z T4=1.066^(T-20) T5=exp(-2.486*α – 0.083) T6= average lake chl-a (ug/l) B1=KA*(1.0 –exp(-KA)) KA= reaeration computed from lake wind (1/day) ZSD= Secchi Depth (ft) Z= Average lake depth (ft) T= average lake temperature (ºC) α= exp(-1.7*Z/ZSD)
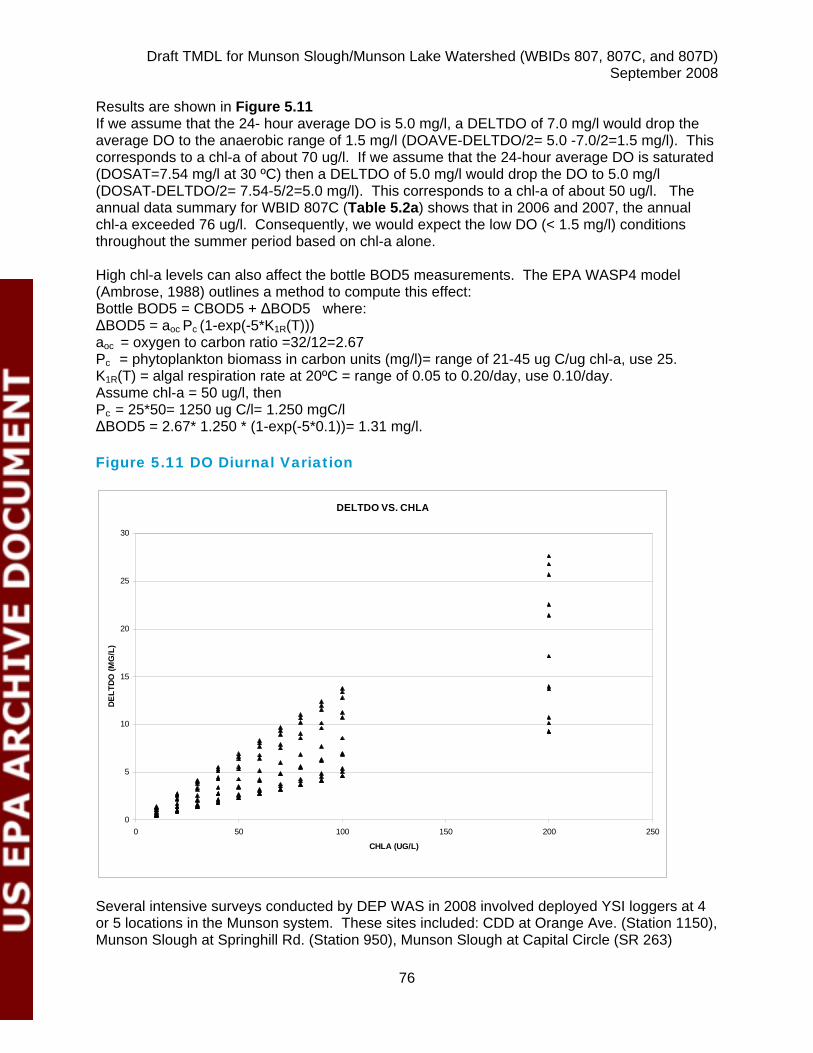
Draft TMDL for Munson Slough/Munson Lake Watershed (WBIDs 807, 807C, and 807D) September 2008
76
Results are shown in Figure 5.11 If we assume that the 24- hour average DO is 5.0 mg/l, a DELTDO of 7.0 mg/l would drop the average DO to the anaerobic range of 1.5 mg/l (DOAVE-DELTDO/2= 5.0 -7.0/2=1.5 mg/l). This corresponds to a chl-a of about 70 ug/l. If we assume that the 24-hour average DO is saturated (DOSAT=7.54 mg/l at 30 ºC) then a DELTDO of 5.0 mg/l would drop the DO to 5.0 mg/l (DOSAT-DELTDO/2= 7.54-5/2=5.0 mg/l). This corresponds to a chl-a of about 50 ug/l. The annual data summary for WBID 807C (Table 5.2a) shows that in 2006 and 2007, the annual chl-a exceeded 76 ug/l. Consequently, we would expect the low DO (< 1.5 mg/l) conditions throughout the summer period based on chl-a alone. High chl-a levels can also affect the bottle BOD5 measurements. The EPA WASP4 model (Ambrose, 1988) outlines a method to compute this effect: Bottle BOD5 = CBOD5 + ∆BOD5 where: ∆BOD5 = aoc Pc (1-exp(-5*K1R(T))) aoc = oxygen to carbon ratio =32/12=2.67 Pc = phytoplankton biomass in carbon units (mg/l)= range of 21-45 ug C/ug chl-a, use 25. K1R(T) = algal respiration rate at 20ºC = range of 0.05 to 0.20/day, use 0.10/day. Assume chl-a = 50 ug/l, then Pc = 25*50= 1250 ug C/l= 1.250 mgC/l ∆BOD5 = 2.67* 1.250 * (1-exp(-5*0.1))= 1.31 mg/l. Figure 5.11 DO Diurnal Variation
DELTDO VS. CHLA
0
5
10
15
20
25
30
0 50 100 150 200 250
CHLA (UG/L)
DELT
DO (M
G/L
)
Several intensive surveys conducted by DEP WAS in 2008 involved deployed YSI loggers at 4 or 5 locations in the Munson system. These sites included: CDD at Orange Ave. (Station 1150), Munson Slough at Springhill Rd. (Station 950), Munson Slough at Capital Circle (SR 263)
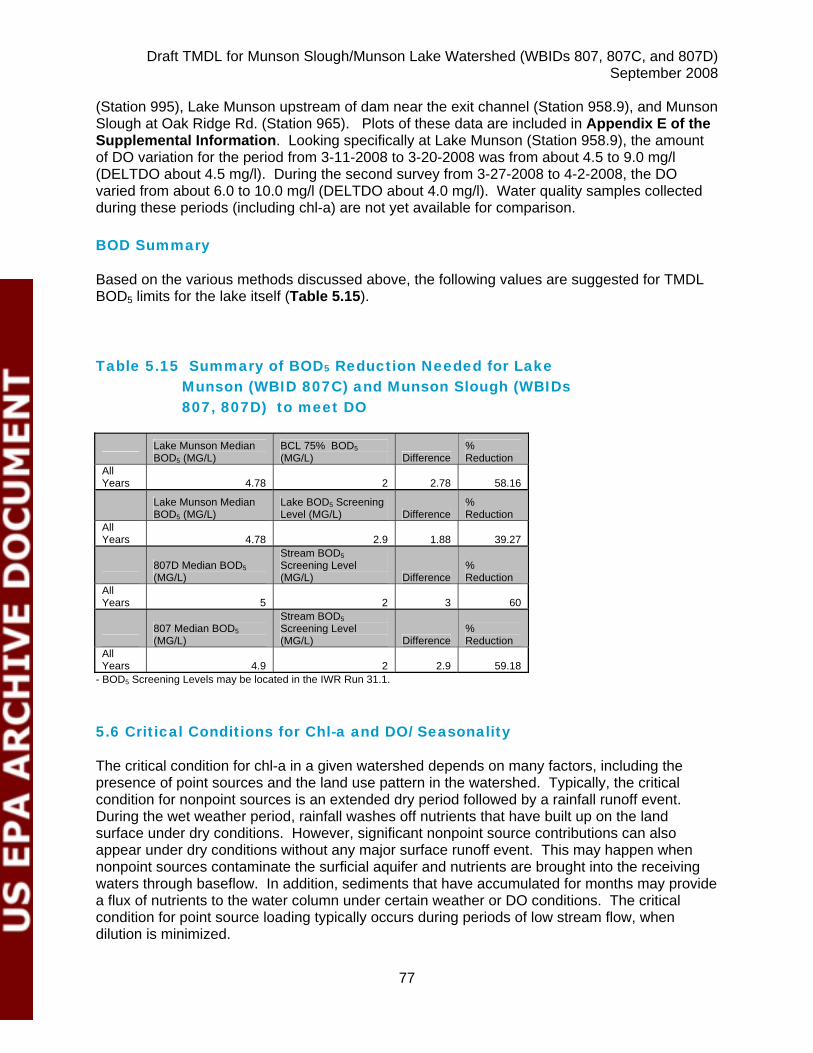
Draft TMDL for Munson Slough/Munson Lake Watershed (WBIDs 807, 807C, and 807D) September 2008
77
(Station 995), Lake Munson upstream of dam near the exit channel (Station 958.9), and Munson Slough at Oak Ridge Rd. (Station 965). Plots of these data are included in Appendix E of the Supplemental Information. Looking specifically at Lake Munson (Station 958.9), the amount of DO variation for the period from 3-11-2008 to 3-20-2008 was from about 4.5 to 9.0 mg/l (DELTDO about 4.5 mg/l). During the second survey from 3-27-2008 to 4-2-2008, the DO varied from about 6.0 to 10.0 mg/l (DELTDO about 4.0 mg/l). Water quality samples collected during these periods (including chl-a) are not yet available for comparison. BOD Summary
Based on the various methods discussed above, the following values are suggested for TMDL BOD5 limits for the lake itself (Table 5.15). Table 5.15 Summary of BOD5 Reduction Needed for Lake
Munson (WBID 807C) and Munson Slough (WBIDs 807, 807D) to meet DO
Lake Munson Median BOD5 (MG/L)
BCL 75% BOD5 (MG/L) Difference
% Reduction
All Years 4.78 2 2.78 58.16
Lake Munson Median BOD5 (MG/L)
Lake BOD5 Screening Level (MG/L) Difference
% Reduction
All Years 4.78 2.9 1.88 39.27
807D Median BOD5 (MG/L)
Stream BOD5 Screening Level (MG/L) Difference
% Reduction
All Years 5 2 3 60
807 Median BOD5 (MG/L)
Stream BOD5 Screening Level (MG/L) Difference
% Reduction
All Years 4.9 2 2.9 59.18
- BOD5 Screening Levels may be located in the IWR Run 31.1. 5.6 Critical Conditions for Chl-a and DO/ Seasonality
The critical condition for chl-a in a given watershed depends on many factors, including the presence of point sources and the land use pattern in the watershed. Typically, the critical condition for nonpoint sources is an extended dry period followed by a rainfall runoff event. During the wet weather period, rainfall washes off nutrients that have built up on the land surface under dry conditions. However, significant nonpoint source contributions can also appear under dry conditions without any major surface runoff event. This may happen when nonpoint sources contaminate the surficial aquifer and nutrients are brought into the receiving waters through baseflow. In addition, sediments that have accumulated for months may provide a flux of nutrients to the water column under certain weather or DO conditions. The critical condition for point source loading typically occurs during periods of low stream flow, when dilution is minimized.
Draft TMDL for Munson Slough/Munson Lake Watershed (WBIDs 807, 807C, and 807D) September 2008
78
We have examined both DO and TSI for Lake Munson, by quarter, from 1973-2007 as shown in Appendix F of the Supplemental Information. The data show that the DO was subject to extremes of anaerobic (<2.0 mg/l) and supersaturated conditions (>15.0 mg/l) for all seasons of the year. The TSI was very high (>60) in 1973 during the time effluent was discharged to Munson Slough. The most recent data, from 2006-2007 show quarterly TSI values above 60 for all seasons.
Draft TMDL for Munson Slough/Munson Lake Watershed (WBIDs 807, 807C, and 807D) September 2008
79
Chapter 6: DETERMINATION OF THE TMDL
6.1 Expression and Allocation of the TMDL
The objective of a TMDL is to provide a basis for allocating acceptable loads among all of the known pollutant sources in a watershed so that appropriate control measures can be implemented and water quality standards achieved. A TMDL is expressed as the sum of all point source loads (Waste Load Allocations, or WLAs), nonpoint source loads (Load Allocations, or LAs), and an appropriate margin of safety (MOS), which takes into account any uncertainty concerning the relationship between effluent limitations and water quality:
TMDL = ∑ WLAs + ∑ LAs + MOS
As discussed earlier, the WLA is broken out into separate subcategories for wastewater discharges and stormwater discharges regulated under the NPDES Program:
TMDL ≅ ∑ WLAswastewater + ∑ WLAsNPDES Stormwater + ∑ LAs + MOS
It should be noted that the various components of the revised TMDL equation may not sum up to the value of the TMDL because a) the WLA for NPDES stormwater is typically based on the percent reduction needed for nonpoint sources and is also accounted for within the LA, and b) TMDL components can be expressed in different terms (for example, the WLA for stormwater is typically expressed as a percent reduction, and the WLA for wastewater is typically expressed as mass per day). WLAs for stormwater discharges are typically expressed as “percent reduction” because it is very difficult to quantify the loads from MS4s (given the numerous discharge points) and to distinguish loads from MS4s from other nonpoint sources (given the nature of stormwater transport). The permitting of stormwater discharges also differs from the permitting of most wastewater point sources. Because stormwater discharges cannot be centrally collected, monitored, and treated, they are not subject to the same types of effluent limitations as wastewater facilities, and instead are required to meet a performance standard of providing treatment to the “maximum extent practical” through the implementation of BMPs. This approach is consistent with federal regulations (40 CFR § 130.2[I]), which state that TMDLs can be expressed in terms of mass per time (e.g., pounds per day), toxicity, or other appropriate measure. TMDLs for the Munson Slough/Lake Munson Watershed are expressed in terms of concentration of nutrients (Table 6.1a-d). Table 6.1a contains the percent reduction for the entire 807D WBID applicable for achieving water quality standards and the in-stream concentrations required to maintain standards for tributaries to Lake Munson. Table 6.1b contains the percent reductions required from the Lake Munson Watershed to achieve water quality standards within Lake Munson and the allowable nutrient loadings and in-lake concentrations required to maintain standards within the lake. Table 6.1c contains the percent reductions for BOD5 and turbidity required for Lake Munson (WBID 807C) to attain standards. Table 6.1d contains the percent reduction for WBID 807. The NH3N percent reduction will be implemented in WBID 807C. The Department believes that the Lake is the source for the NH3N violation and that restoring Lake Munson will result in attaining standards within WBID 807.
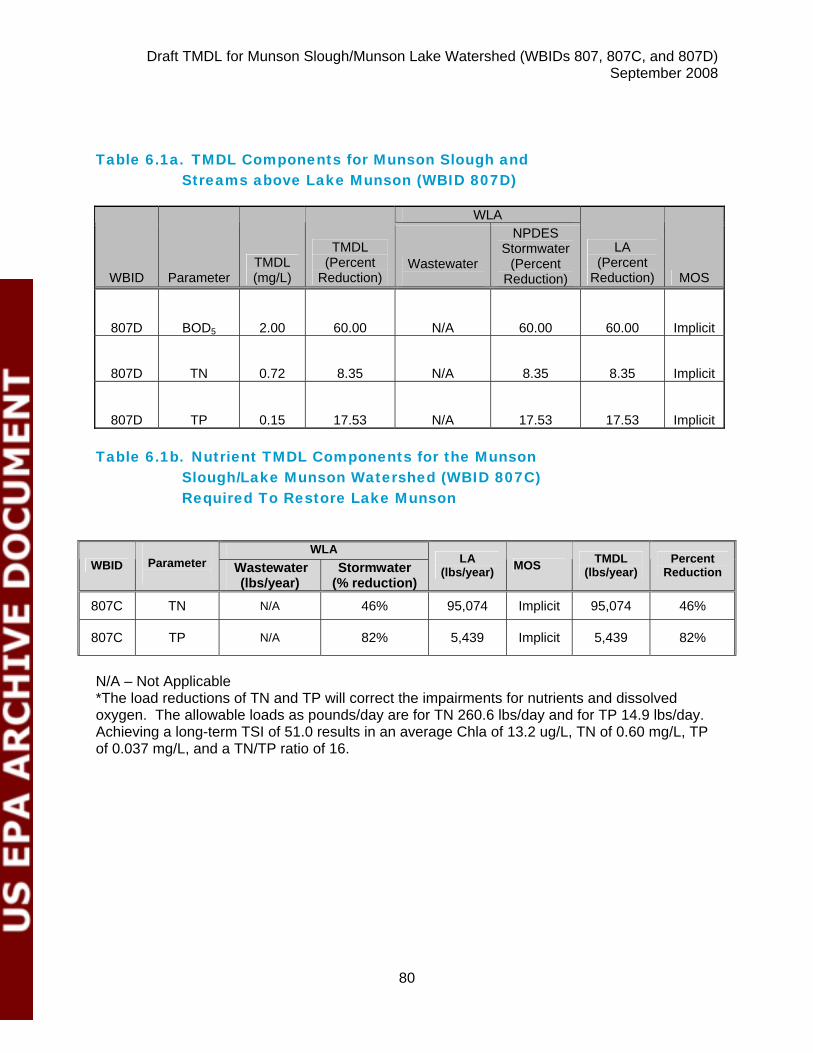
Draft TMDL for Munson Slough/Munson Lake Watershed (WBIDs 807, 807C, and 807D) September 2008
80
Table 6.1a. TMDL Components for Munson Slough and
Streams above Lake Munson (WBID 807D)
WLA
WBID Parameter TMDL (mg/L)
TMDL (Percent
Reduction) Wastewater
NPDES Stormwater
(Percent Reduction)
LA (Percent
Reduction) MOS
807D BOD5 2.00 60.00 N/A 60.00 60.00 Implicit
807D TN 0.72 8.35 N/A 8.35 8.35 Implicit
807D TP 0.15 17.53 N/A 17.53 17.53 Implicit
Table 6.1b. Nutrient TMDL Components for the Munson Slough/Lake Munson Watershed (WBID 807C) Required To Restore Lake Munson
WLA
WBID
Parameter Wastewater
(lbs/year) Stormwater
(% reduction)
LA (lbs/year) MOS TMDL
(lbs/year) Percent
Reduction
807C TN N/A 46% 95,074 Implicit 95,074 46%
807C TP N/A 82% 5,439 Implicit 5,439 82%
N/A – Not Applicable *The load reductions of TN and TP will correct the impairments for nutrients and dissolved oxygen. The allowable loads as pounds/day are for TN 260.6 lbs/day and for TP 14.9 lbs/day. Achieving a long-term TSI of 51.0 results in an average Chla of 13.2 ug/L, TN of 0.60 mg/L, TP of 0.037 mg/L, and a TN/TP ratio of 16.
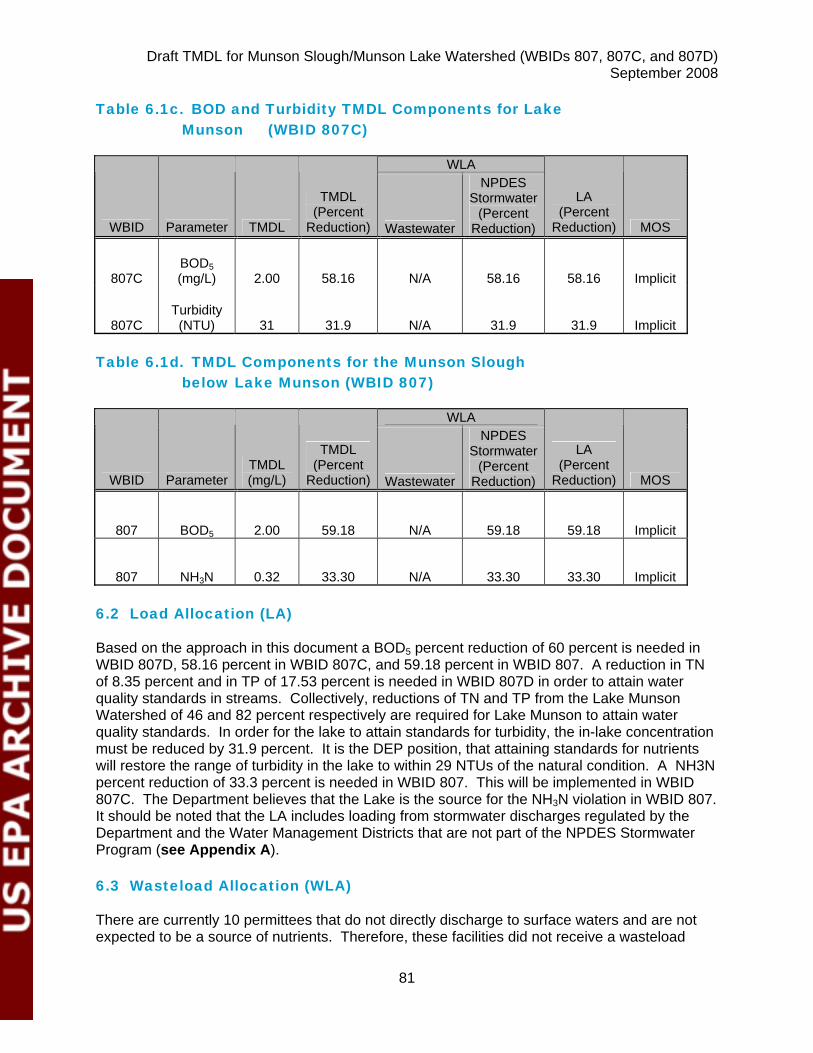
Draft TMDL for Munson Slough/Munson Lake Watershed (WBIDs 807, 807C, and 807D) September 2008
81
Table 6.1c. BOD and Turbidity TMDL Components for Lake Munson (WBID 807C)
WLA
WBID Parameter TMDL
TMDL (Percent
Reduction) Wastewater
NPDES Stormwater
(Percent Reduction)
LA (Percent
Reduction) MOS
807C BOD5 (mg/L) 2.00 58.16 N/A 58.16 58.16 Implicit
807C Turbidity (NTU) 31 31.9 N/A 31.9 31.9 Implicit
Table 6.1d. TMDL Components for the Munson Slough
below Lake Munson (WBID 807)
WLA
WBID Parameter TMDL (mg/L)
TMDL (Percent
Reduction) Wastewater
NPDES Stormwater
(Percent Reduction)
LA (Percent
Reduction) MOS
807 BOD5 2.00 59.18 N/A 59.18 59.18 Implicit
807 NH3N 0.32 33.30 N/A 33.30 33.30 Implicit 6.2 Load Allocation (LA)
Based on the approach in this document a BOD5 percent reduction of 60 percent is needed in WBID 807D, 58.16 percent in WBID 807C, and 59.18 percent in WBID 807. A reduction in TN of 8.35 percent and in TP of 17.53 percent is needed in WBID 807D in order to attain water quality standards in streams. Collectively, reductions of TN and TP from the Lake Munson Watershed of 46 and 82 percent respectively are required for Lake Munson to attain water quality standards. In order for the lake to attain standards for turbidity, the in-lake concentration must be reduced by 31.9 percent. It is the DEP position, that attaining standards for nutrients will restore the range of turbidity in the lake to within 29 NTUs of the natural condition. A NH3N percent reduction of 33.3 percent is needed in WBID 807. This will be implemented in WBID 807C. The Department believes that the Lake is the source for the NH3N violation in WBID 807. It should be noted that the LA includes loading from stormwater discharges regulated by the Department and the Water Management Districts that are not part of the NPDES Stormwater Program (see Appendix A).
6.3 Wasteload Allocation (WLA)
There are currently 10 permittees that do not directly discharge to surface waters and are not expected to be a source of nutrients. Therefore, these facilities did not receive a wasteload
Draft TMDL for Munson Slough/Munson Lake Watershed (WBIDs 807, 807C, and 807D) September 2008
82
allocation. The facilities are the following: Ready Mix USA- Mosely Street Plant (FLG11358), Florida Rock- Tallahassee (FLG110319), Trinity Materials Plant 32 (FLG110307), Lake Bradford Estates STP (FLA010148), Sandstone Ranch WWTF (FLA010167), National High Magnetic Field Laboratory- FSU (FLA01633), Southern Bell Trailer Park (FLA010151), Western Estates MHP (FLA010152), and T.P. Smith Water Reclamation Facility (FLA010139). Any new potential discharger would be expected to comply with the Class III criteria for DO with limits on BOD5, TN, TP, and NH3N consistent with the TMDL.
6.3.1 NPDES Wastewater Discharges
As mentioned previously, there are currently 10 permittees that are potential discharge sites in the Munson Slough Watershed. No specific allocations are assigned to NPDES wastewater facilities as part of this TMDL. Any new potential discharger would be expected to comply with the Class III criteria for DO with limits on BOD5, TN, TP, and NH3N consistent with the TMDL.
6.3.2 NPDES Stormwater Discharges
The Munson Slough Watershed, located in Leon County, falls under the Leon County & Co. App. – MS4 permit (FLS000033) and City of Tallahassee (MS4) permit (FLS000034) (Phase I MS4 permits) and Florida State University (FLR04E051), and Florida Agricultural and Mechanical University (FLR04E095) (Phase II NPDES MS4 permits). The wasteload allocation for these MS4 permits are a BOD5 reduction of 60 percent needed in WBID 807D, 58.16 percent in WBID 807C, and 59.18 percent in WBID 807. A reduction in TN of 8.35 percent and in TP of 17.53 percent is needed in WBID 807D in order to attain water quality standards in streams. Collectively, reductions of TN and TP from the Lake Munson Watershed of 46 and 82 percent respectively are required for Lake Munson to attain water quality standards. In order for the lake to attain standards for turbidity, the in-lake concentration must be reduced by 31.9 percent. It is the DEP position, that attaining standards for nutrients will restore the range of turbidity in the lake to within 29 NTUs of the natural condition. A NH3N percent reduction of 33.3 percent is needed in WBID 807. It should be noted that any MS4 permittee will only be responsible for reducing the loads associated with stormwater outfalls for which it owns or otherwise has responsible control, and is not responsible for reducing other nonpoint source loads within its jurisdiction. 6.4 Margin of Safety (MOS)
Consistent with the recommendations of the Allocation Technical Advisory Committee (FDEP, February 2001), an implicit margin of safety (MOS) was used in the development of this TMDL. An implicit MOS was provided by the conservative decisions associated with a number of modeling assumptions and the development of the assimilative capacity.
Draft TMDL for Munson Slough/Munson Lake Watershed (WBIDs 807, 807C, and 807D) September 2008
83
Chapter 7: NEXT STEPS: IMPLEMENTATION PLAN DEVELOPMENT AND BEYOND
7.1 Basin Management Action Plan
Following the adoption of this TMDL by rule, the next step in the TMDL process is to develop an implementation plan for the TMDL, which will be a component of the Basin Management Action Plan (BMAP) for the St. Marks/Wakulla River Basin. This document will be developed over the next year in cooperation with local stakeholders and will attempt to reach consensus on more detailed allocations and on how load reductions will be accomplished. The BMAP will include the following:
• Appropriate allocations among the affected parties,
• A description of the load reduction activities to be undertaken,
• Timetables for project implementation and completion,
• Funding mechanisms that may be utilized,
• Any applicable signed agreement,
• Local ordinances defining actions to be taken or prohibited,
• Local water quality standards, permits, or load limitation agreements, and
• Monitoring and follow-up measures.
The current NPDES MS 4 program in Leon County (see Appendix A) includes a listing of basins where BMP coverage of Dry and Wet stormwater ponds have been created. Additionally, nutrients stored in the lake sediments as a result of historical loadings from wastewater and stormwater discharges can be released (SNR) to the water column under a variety of conditions. Estimates of allowable external nutrient loadings under the TMDL for Lake Munson, will not necessary result in the lake attaining standards if the internal recycling of these historical nutrient loads is a significant source. Addressing the impact on the lake from these internally stored nutrients is not a part of this TMDL, but should be addressed as a part of implementation under the Basin Management Action Plan (BMAP).
Draft TMDL for Munson Slough/Munson Lake Watershed (WBIDs 807, 807C, and 807D) September 2008
84
References
Alexander, R.B. and R.A. Smith, 1990. County level estimates of nitrogen and phosphorus fertilizer use in the United States, 1945 to 1985. OFR 90-130.
Ambrose, R.B., T.A. Wool, J.P. Connolly, R.W.Schanz, 1988. WASP4, A Hydrodynamic and Water Quality Model-Model Theory, User’s Manual, and Programmer’s Guide, EPA/600/3-87/039.
Arnold, J.G., P.M.Allen, R. Muttiah, and G. Bernhardt, 1995. Automated base flow separation and recession analysis techniques. Ground Water 33(6): 1010-1018.
Arnold, J.G. and P.M.Allen, 1999. Automated methods for estimating baseflow and ground water recharge from streamflow records. Journal of the American Water Resources Association 35(2): 411-424.
Bartel, R.L. and F.B. Ard, 1992. U.S. Epa Clean Lakes Program, Phase I Diagnostic Feasibility Report for Lake Munson, NWFWMD Water Resources Special Report 92-4.
Bartel, R.L., R. Arteaga, N. Wooten, F.B. Ard, and A.T. Benoit, 1992a. City of Tallahassee and Leon County Stormwater Management Plan, Vol. II: Lake Munson Basin Management Plan, NWFWMD Water Resources Assessment 91-2, revised September 1992.
Battaglin, W.A., and D.A. Goolsby, 1995. Spatial data in geographic information system format on agricultural chemical use-Land use, and cropping practices in the United States. USGS WRI 95-4176. http://water.usgs.gov/pubs/wri/wri944176.
Blackburn, R.D., L.W. Weldon, R.R. Yeo, and T.M. Taylor, 1969. Identification and Distribution of Certain Similar-Appearing Submersed Aquatic Weeds in Florida, JAPM 8: 17-21.
Brezonik, P.L., C.D. Hendry, Jr., E.S. Edgerton, R.L. Schulze, and T.L. Crisman, 1983. Acidity, Nutrients, and Minerals in Atmospheric Precipitation over Florida: Deposition Patterns, Mechanisms, and Ecological Effects, EPA-600/3-83-004.
Brezonik, P. L. and Stadelmann, T. H. 2002. Analysis and predictive models of stormwater runoff volumes, loads, and pollutant concentrations from watersheds in the Twin Cities metropolitan area, Minnesota, USA. Water Research, 36: 1743-1757.
Brown, M. T. 1995. South Dade watershed project. University of Miami and the Southwest Florida Water Management District.
Brown, M., K.C. Reiss, M.J. Cohen, J.M. Evans, K.R. Reddy, P.W., Inglett, K.S. Inglett, T.K. Frazer, C.A. Jacoby, E.J. Phlips, R.L. Knight, S.K. Notestein, and K.A. Mckee, 2008. Summary and Synthesis of the Available Literature on the Effects of Nutrients on Spring Organisms and Systems, Univ. of Florida Institute April, 28, 2008. Available at FTP://FTP.DEP.STATE.FL.US/PUB/WATER/SPRINGS.
Draft TMDL for Munson Slough/Munson Lake Watershed (WBIDs 807, 807C, and 807D) September 2008
85
Canfield, D.E., Jr., K.A. Langeland, M.J.Maceina, 1983. Trophic State Classifications of Lakes with Aquatic Macrophytes, Can. J. Fish Aquatic Sci., 40:1713-1718.
CDM. September 1998. Rouge River National Wet Weather Demonstration Project, Wayne County, Michigan. Technical memorandum. User’s manual: Watershed management model version 4.0. RPO-NPS-TM27.01.
CDM. 1998. Rouge River National Wet Weather Demonstration Project, Wayne County, Michigan. User’s manual: Watershed management model, version 4.1. PRO-NPS-TM27.02.
Chapra, S. 1997. Surface water-quality modeling. McGraw Hill Science/Engineering/Math.
COT, 2007. A Water Quality and Biological Assessmentof Selected Lakes, City of Tallahassee Stormwater Management Division, September 2007.
Environmental Research & Design, Inc. 2000. “Winter Park Chain-of-Lakes Groundwater/sediment study.” Final Report prepared for the City of Winter Park, Winter Park, Fl.
Florida Administrative Code. Chapter 62-302, Surface water quality standards.
Florida Administrative Code. Chapter 62-303, Identification of impaired surface waters.
FDEP, 2008. Aquatic Plant Database.
FDER, 1988. Lake Munson, Leon County,
Florida Department of Transportation, 1999. Florida Land Use, Cover and Forms Classification System (FLUCCS). Florida Department of Transportation Thematic Mapping Section.
Gilbert D., Weikowicz R., Wilcox E., Kang WJ, Ralys B. 2008(b) “TMDL Supplemental Information for Munson Slough/Lake Munson Watershed WBIDs 807, 807C, and 807D.” FDEP.
Hand, J., 2007a. Personal communication, HAPI surveys.
Harper, H. H., and E. H. Livingston. 1999. Everything you always wanted to know about stormwater management practices but were afraid to ask. Biennial Stormwater Research Conference, Tampa, Florida.
Harper, H. H. and Baker, D. M. 2003. Evaluation of alternative Stormwater Regulations for
Southwest Florida. Report prepared by Environmental Research & Design, Inc for Water Enhancement & Restoration Coalition, Inc.
Harper, H. H. and Baker, D. M. 2007. Evaluation of Current Stormwater Design Criteria within
the State of Florida. Final Report prepared by Environmental Research & Design, Inc for Florida Department of Environmental Protection.
Draft TMDL for Munson Slough/Munson Lake Watershed (WBIDs 807, 807C, and 807D) September 2008
86
Heiker, T., 2008. Lake Munson Restoration Project, www.co.leon.fl.us/pubworks/munson/stormwat/stormain.htm.
Heiker, T., 2008. Final Report FY97 Section 319 Grant Program, DEP Contract WM682.
Irwin, G.A. and R.T. Kirkland, 1980. Chemical and Physical Characteristics of Precipitation at Selected Sites in Florida, USGS WRI 80-81.
Kumar, N., 1984. EPA Region IV, private communication.
Loper, D., W.M. Landing, C.D. Pollman, and A.B.C.Hilton, 2005. Degradation of Water Quality at Wakulla Sprigs, Florida: Assessment and Recommendations, Report of the Peer Review Committee on the Workshop “Solving Water Pollution Problems in the Wakulla Springshed of North Florida May 12-13, 2005 Tallahassee, Florida.
Maristany, A.E., R.L. Bartel, and D. Wiley, 1988. Water Quality Evaluation of Lake Munson, Florida, NWFWMD Water Resources Assessment 88-1.
Nicol, J.P. and S. McClelland, 1984. Automated Water Quality Analysis Report Development (AWQARD), DER Water Quality Technical Series Vol. 3, No. 13, February, 1984.
Northwest Florida Water Management District Web site. 2008. Available: http://www.nwfwmd.state.fl.us/.
Pollman, C.D. and S. Roy, 2003. Examination of Atmospheric Deposition Chemistry and its Potential Effects on the Lower St. Johns Estuary, Tasks 1 through 4 , Tetra Tech Final report submitted to St. Johns River Water Management District, Aug. 20, 2003.
Poor, N., R. Pribble, and H. Greening, 2001. Direct wet and dry deposition of ammonia, nitric acid, ammonium, and nitrate to Tampa bay Estuary, FL, USA. Atmos. Environ. 35:3947-3955.
Post, D.M., J.P.Taylor, J.F.Kitchell, M.H.Olson, D.E. Schindler, and B.R. Herwig, 1998. The role of migratory waterfowl as nutrient vectors in a managed wetland, Conservation Biology, Vol. 12, 910-920.
Potts, R.R., 1997. Characterization of Existing Sediments Environmentally Through a Literature Search, Lake Munson Sediments, Prepared for Camp Dresser & McKee, Inc., by Environmental and Geotechnical Specialist, Inc., April 25, 1997.
Pribble, R. and A. Janicki, 1999. Atmospheric deposition contributions to nitrogen and phosphorus loadings in Tampa Bay: Intensive wet and dry deposition data collection and analysis, August, 1996-July 1998. Interim data report. Tampa Bay Estuary Program Tech. Pub. #05-99.
Richardson, J., 2008. Lake Munson: Past, Present, and Future, Powerpoint presentation available at: http://www.leoncountyfl.gov./pubworks/Engineering/Stormwater Management/LakeData.asp.
Rogers, T., 2006. Nitrogen Oxides Emissions for Florida Counties 2002, private communication.
Draft TMDL for Munson Slough/Munson Lake Watershed (WBIDs 807, 807C, and 807D) September 2008
87
Ruddy, B.C., D.L. Lorenz, and D.K. Mueller, 2006. County-Level Estimates of Nutrient Inputs to the Land Surface of the Conterminous United States, 1982-2001. USGS SRI 2006-5012.
Runkel, R.L., C.G. Crawford, and T.A. Cohn, 2004. Load Estimator (LOADEST): A FORTRAN Program for Estimating Constituent Loads in Streams and Rivers, USGS Techniques and Methods Book 4, Chapter A5.
Schmitz, D.C., J.D. Schardt, A.J. Leslie, F.A. Dray, Jr., J.A. Osborne, and B.V. Nelson, 1991. The Ecological Impact and Management History of Three Invasive Alien Aquatic Plant Species in Florida, in Biological Pollution: The Control and Impact of Invasive Exotic Species, Proceedings of a Symposium held at the University Place Conference Center, Indiana Univ.-Purdue Univ. at Indianapolis on October 25 & 26, 1991, Indiana Academy of Science Indianapolis.
Thomann, R.V. and J.A. Mueller, 1987. Principles of Surface Water Quality Modeling and Control, Harper & Row, New York.
Thorpe, P., 1996. Evaluation of Alternatives for the Control of Invasive Exotic Plants in Lake Jackson, Florida, NWFWMD Water Resources Special Report 96-3, August 1996.
U. S. Census Bureau Web site. 2007. Available: http://www.census.gov/.
——–. 2003. Census data. Available: http://www.nass.usda.gov/census/census97/highlights/fl/.
U. S. Department of Agriculture. 2002. National Agricultural Statistics Service. Available: http://www.usda.gov/nass/.
U. S. Environmental Protection Agency, 1997. Compendium of Tools for Watershed Assessment and TMDL Development, USEPA, Office of Water, Washington, DC 20460, EPA841-B-97-006, May 1997. U.S. Environmental Protection Agency (EPA), 1999. Protocol for Developing Nutrient TMDLs
First Edition, EPA 841-B-99-007.
U.S. EPA, 2008. WASP7.2 Manual available at: www.epa.gov/athens/wwqtsc/html/wasp.html
U. S. Geological Survey Web site. 2005. Available: http://www.usgs.gov/.
U. S. Veterinary Association Web site. 2004. Available: http://www.avma.org.
Van Dyke, J., 1986. Letter to John Outland November 26, 1986 shown as Appendix III of Bartel, 1992.
Voss, D., 1975. “Hydrilla: Even Experts Aren’t Sure if the Mysterious Plant is Really Dangerous,” Tallahassee Democrat, August 31, 1975.
Wanielista, M.P. and Y.A. Yousef, 1993. Stormwater Management, John Wiley & Sons, Inc. New York.
Wellendorf, N., 2008. FDEP Biology private communication.
Draft TMDL for Munson Slough/Munson Lake Watershed (WBIDs 807, 807C, and 807D) September 2008
88
Wieckowicz, R., T. Sanders, and E. Wilcox, 2008. Hydrilla Summary Report.
Wieckowicz, R., E. Wilcox, and B. Ralys, 2008. Lake Bradford Listing Category 4C.
Ziegmont, C. 2007. FDEP permitting, personal communication regarding data sources for spills. Referred to web site http://www.eoconline.org.
Draft TMDL for Munson Slough/Munson Lake Watershed (WBIDs 807, 807C, and 807D) September 2008
89
Appendix A: Background Information on Federal and State Stormwater Programs-NPDES MS4 Data
In 1982, Florida became the first state in the country to implement statewide regulations to address the issue of nonpoint source pollution by requiring new development and redevelopment to treat stormwater before it is discharged. The Stormwater Rule, as authorized in Chapter 403, F.S., was established as a technology-based program that relies on the implementation of BMPs that are designed to achieve a specific level of treatment (i.e., performance standards) as set forth in Chapter 62-40, F.A.C. In 1994, the Department’s stormwater treatment requirements were integrated with the stormwater flood control requirements of the state’s water management districts, along with wetland protection requirements, into the Environmental Resource Permit regulations. Chapter 62-40, F.A.C., also requires the water management districts to establish stormwater pollutant load reduction goals (PLRGs) and adopt them as part of a SWIM plan, other watershed plan, or rule. Stormwater PLRGs are a major component of the load allocation part of a TMDL. To date, stormwater PLRGs have been established for Tampa Bay, Lake Thonotosassa, the Winter Haven Chain of Lakes, the Everglades, Lake Okeechobee, and Lake Apopka. No PLRG had been developed for Newnans Lake when this report was published. In 1987, the U.S. Congress established Section 402(p) as part of the federal Clean Water Act Reauthorization. This section of the law amended the scope of the federal NPDES permitting program to designate certain stormwater discharges as “point sources” of pollution. The EPA promulgated regulations and began implementing the Phase I NPDES stormwater program in 1990. These stormwater discharges include certain discharges that are associated with industrial activities designated by specific standard industrial classification (SIC) codes, construction sites disturbing 5 or more acres of land, and master drainage systems of local governments with a population above 100,000, which are better known as municipal separate storm sewer systems (MS4s). However, because the master drainage systems of most local governments in Florida are interconnected, the EPA implemented Phase I of the MS4 permitting program on a countywide basis, which brought in all cities (incorporated areas), Chapter 298 urban water control districts, and the Florida Department of Transportation throughout the 15 counties meeting the population criteria. The Department received authorization to implement the NPDES stormwater program in 2000. An important difference between the federal NPDES and the state’s stormwater/environmental resource permitting programs is that the NPDES Program covers both new and existing discharges, while the state’s program focuses on new discharges only. Additionally, Phase II of the NPDES Program, implemented in 2003, expands the need for these permits to construction sites between 1 and 5 acres, and to local governments with as few as 1,000 people. While these urban stormwater discharges are now technically referred to as “point sources” for the purpose of regulation, they are still diffuse sources of pollution that cannot be easily collected and treated by a central treatment facility, as are other point sources of pollution such as domestic and industrial wastewater discharges. It should be noted that all MS4 permits issued in Florida include a re-opener clause that allows permit revisions to implement TMDLs when the implementation plan is formally adopted.

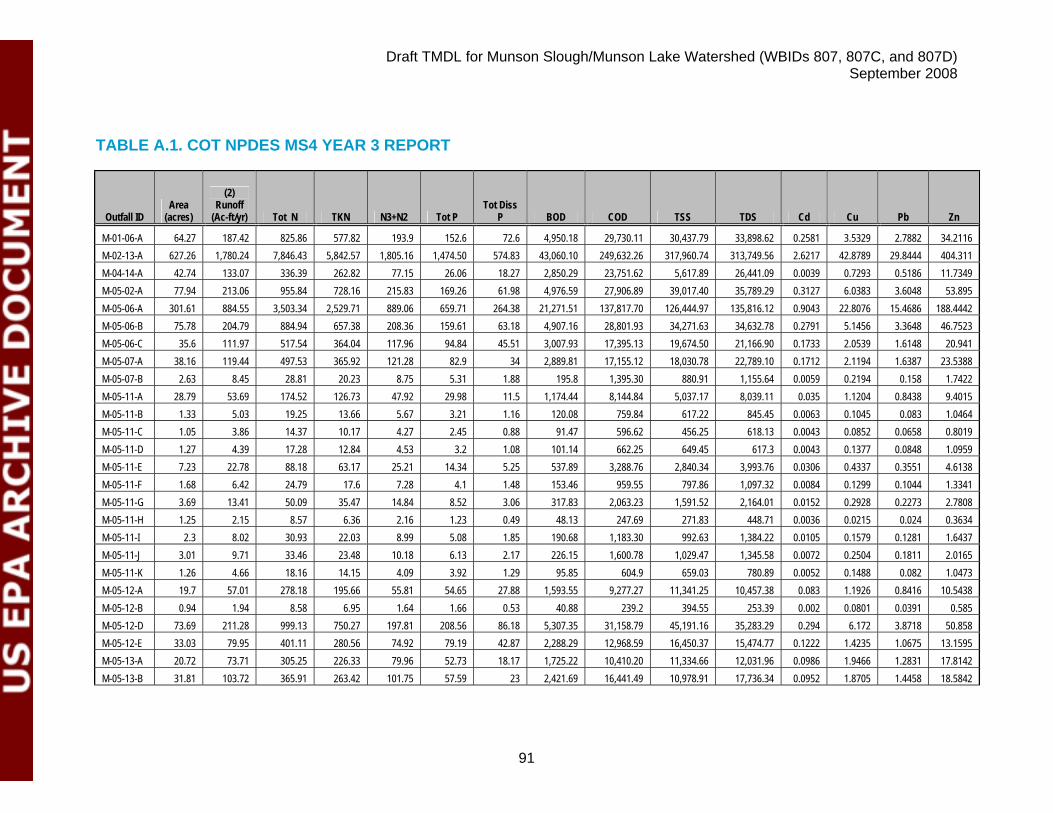
Draft TMDL for Munson Slough/Munson Lake Watershed (WBIDs 807, 807C, and 807D) September 2008
91
TABLE A.1. COT NPDES MS4 YEAR 3 REPORT
Outfall ID Area
(acres)
(2) Runoff
(Ac-ft/yr) Tot N TKN N3+N2 Tot P Tot Diss
P BOD COD TSS TDS Cd Cu Pb Zn
M-01-06-A 64.27 187.42 825.86 577.82 193.9 152.6 72.6 4,950.18 29,730.11 30,437.79 33,898.62 0.2581 3.5329 2.7882 34.2116 M-02-13-A 627.26 1,780.24 7,846.43 5,842.57 1,805.16 1,474.50 574.83 43,060.10 249,632.26 317,960.74 313,749.56 2.6217 42.8789 29.8444 404.311 M-04-14-A 42.74 133.07 336.39 262.82 77.15 26.06 18.27 2,850.29 23,751.62 5,617.89 26,441.09 0.0039 0.7293 0.5186 11.7349 M-05-02-A 77.94 213.06 955.84 728.16 215.83 169.26 61.98 4,976.59 27,906.89 39,017.40 35,789.29 0.3127 6.0383 3.6048 53.895 M-05-06-A 301.61 884.55 3,503.34 2,529.71 889.06 659.71 264.38 21,271.51 137,817.70 126,444.97 135,816.12 0.9043 22.8076 15.4686 188.4442 M-05-06-B 75.78 204.79 884.94 657.38 208.36 159.61 63.18 4,907.16 28,801.93 34,271.63 34,632.78 0.2791 5.1456 3.3648 46.7523 M-05-06-C 35.6 111.97 517.54 364.04 117.96 94.84 45.51 3,007.93 17,395.13 19,674.50 21,166.90 0.1733 2.0539 1.6148 20.941 M-05-07-A 38.16 119.44 497.53 365.92 121.28 82.9 34 2,889.81 17,155.12 18,030.78 22,789.10 0.1712 2.1194 1.6387 23.5388 M-05-07-B 2.63 8.45 28.81 20.23 8.75 5.31 1.88 195.8 1,395.30 880.91 1,155.64 0.0059 0.2194 0.158 1.7422 M-05-11-A 28.79 53.69 174.52 126.73 47.92 29.98 11.5 1,174.44 8,144.84 5,037.17 8,039.11 0.035 1.1204 0.8438 9.4015 M-05-11-B 1.33 5.03 19.25 13.66 5.67 3.21 1.16 120.08 759.84 617.22 845.45 0.0063 0.1045 0.083 1.0464 M-05-11-C 1.05 3.86 14.37 10.17 4.27 2.45 0.88 91.47 596.62 456.25 618.13 0.0043 0.0852 0.0658 0.8019 M-05-11-D 1.27 4.39 17.28 12.84 4.53 3.2 1.08 101.14 662.25 649.45 617.3 0.0043 0.1377 0.0848 1.0959 M-05-11-E 7.23 22.78 88.18 63.17 25.21 14.34 5.25 537.89 3,288.76 2,840.34 3,993.76 0.0306 0.4337 0.3551 4.6138 M-05-11-F 1.68 6.42 24.79 17.6 7.28 4.1 1.48 153.46 959.55 797.86 1,097.32 0.0084 0.1299 0.1044 1.3341 M-05-11-G 3.69 13.41 50.09 35.47 14.84 8.52 3.06 317.83 2,063.23 1,591.52 2,164.01 0.0152 0.2928 0.2273 2.7808 M-05-11-H 1.25 2.15 8.57 6.36 2.16 1.23 0.49 48.13 247.69 271.83 448.71 0.0036 0.0215 0.024 0.3634 M-05-11-I 2.3 8.02 30.93 22.03 8.99 5.08 1.85 190.68 1,183.30 992.63 1,384.22 0.0105 0.1579 0.1281 1.6437 M-05-11-J 3.01 9.71 33.46 23.48 10.18 6.13 2.17 226.15 1,600.78 1,029.47 1,345.58 0.0072 0.2504 0.1811 2.0165 M-05-11-K 1.26 4.66 18.16 14.15 4.09 3.92 1.29 95.85 604.9 659.03 780.89 0.0052 0.1488 0.082 1.0473 M-05-12-A 19.7 57.01 278.18 195.66 55.81 54.65 27.88 1,593.55 9,277.27 11,341.25 10,457.38 0.083 1.1926 0.8416 10.5438 M-05-12-B 0.94 1.94 8.58 6.95 1.64 1.66 0.53 40.88 239.2 394.55 253.39 0.002 0.0801 0.0391 0.585 M-05-12-D 73.69 211.28 999.13 750.27 197.81 208.56 86.18 5,307.35 31,158.79 45,191.16 35,283.29 0.294 6.172 3.8718 50.858 M-05-12-E 33.03 79.95 401.11 280.56 74.92 79.19 42.87 2,288.29 12,968.59 16,450.37 15,474.77 0.1222 1.4235 1.0675 13.1595 M-05-13-A 20.72 73.71 305.25 226.33 79.96 52.73 18.17 1,725.22 10,410.20 11,334.66 12,031.96 0.0986 1.9466 1.2831 17.8142 M-05-13-B 31.81 103.72 365.91 263.42 101.75 57.59 23 2,421.69 16,441.49 10,978.91 17,736.34 0.0952 1.8705 1.4458 18.5842
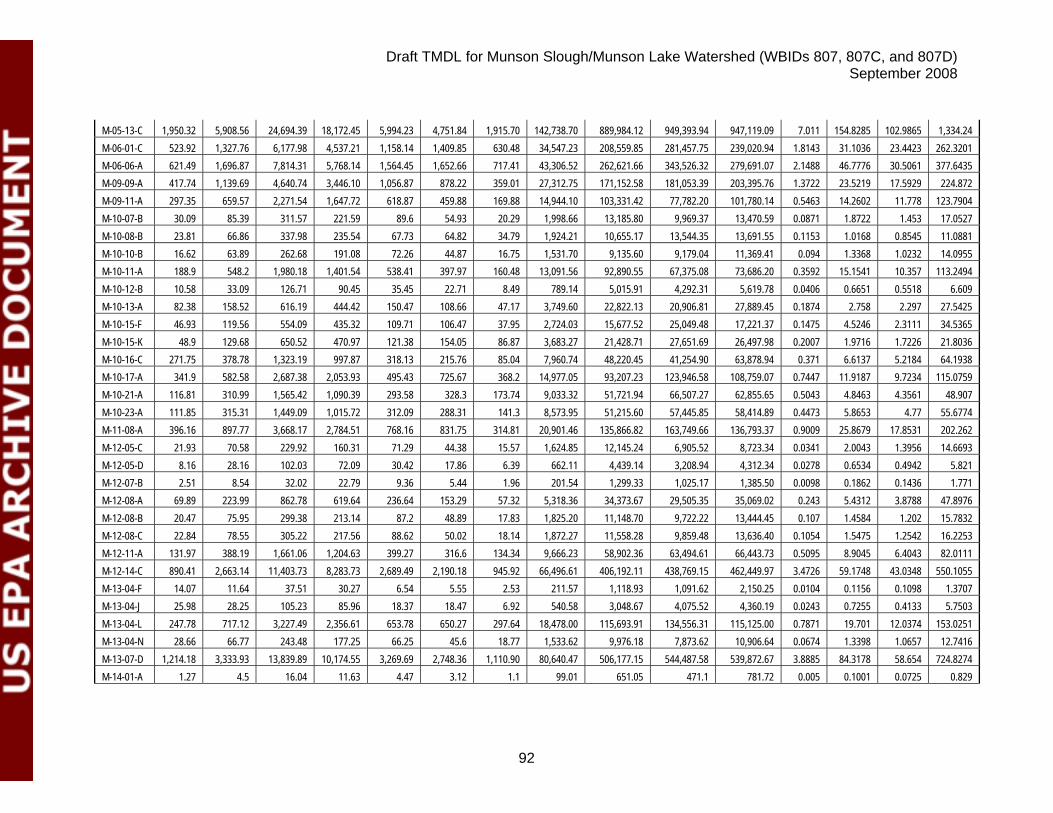
Draft TMDL for Munson Slough/Munson Lake Watershed (WBIDs 807, 807C, and 807D) September 2008
92
M-05-13-C 1,950.32 5,908.56 24,694.39 18,172.45 5,994.23 4,751.84 1,915.70 142,738.70 889,984.12 949,393.94 947,119.09 7.011 154.8285 102.9865 1,334.24 M-06-01-C 523.92 1,327.76 6,177.98 4,537.21 1,158.14 1,409.85 630.48 34,547.23 208,559.85 281,457.75 239,020.94 1.8143 31.1036 23.4423 262.3201 M-06-06-A 621.49 1,696.87 7,814.31 5,768.14 1,564.45 1,652.66 717.41 43,306.52 262,621.66 343,526.32 279,691.07 2.1488 46.7776 30.5061 377.6435 M-09-09-A 417.74 1,139.69 4,640.74 3,446.10 1,056.87 878.22 359.01 27,312.75 171,152.58 181,053.39 203,395.76 1.3722 23.5219 17.5929 224.872 M-09-11-A 297.35 659.57 2,271.54 1,647.72 618.87 459.88 169.88 14,944.10 103,331.42 77,782.20 101,780.14 0.5463 14.2602 11.778 123.7904 M-10-07-B 30.09 85.39 311.57 221.59 89.6 54.93 20.29 1,998.66 13,185.80 9,969.37 13,470.59 0.0871 1.8722 1.453 17.0527 M-10-08-B 23.81 66.86 337.98 235.54 67.73 64.82 34.79 1,924.21 10,655.17 13,544.35 13,691.55 0.1153 1.0168 0.8545 11.0881 M-10-10-B 16.62 63.89 262.68 191.08 72.26 44.87 16.75 1,531.70 9,135.60 9,179.04 11,369.41 0.094 1.3368 1.0232 14.0955 M-10-11-A 188.9 548.2 1,980.18 1,401.54 538.41 397.97 160.48 13,091.56 92,890.55 67,375.08 73,686.20 0.3592 15.1541 10.357 113.2494 M-10-12-B 10.58 33.09 126.71 90.45 35.45 22.71 8.49 789.14 5,015.91 4,292.31 5,619.78 0.0406 0.6651 0.5518 6.609 M-10-13-A 82.38 158.52 616.19 444.42 150.47 108.66 47.17 3,749.60 22,822.13 20,906.81 27,889.45 0.1874 2.758 2.297 27.5425 M-10-15-F 46.93 119.56 554.09 435.32 109.71 106.47 37.95 2,724.03 15,677.52 25,049.48 17,221.37 0.1475 4.5246 2.3111 34.5365 M-10-15-K 48.9 129.68 650.52 470.97 121.38 154.05 86.87 3,683.27 21,428.71 27,651.69 26,497.98 0.2007 1.9716 1.7226 21.8036 M-10-16-C 271.75 378.78 1,323.19 997.87 318.13 215.76 85.04 7,960.74 48,220.45 41,254.90 63,878.94 0.371 6.6137 5.2184 64.1938 M-10-17-A 341.9 582.58 2,687.38 2,053.93 495.43 725.67 368.2 14,977.05 93,207.23 123,946.58 108,759.07 0.7447 11.9187 9.7234 115.0759 M-10-21-A 116.81 310.99 1,565.42 1,090.39 293.58 328.3 173.74 9,033.32 51,721.94 66,507.27 62,855.65 0.5043 4.8463 4.3561 48.907 M-10-23-A 111.85 315.31 1,449.09 1,015.72 312.09 288.31 141.3 8,573.95 51,215.60 57,445.85 58,414.89 0.4473 5.8653 4.77 55.6774 M-11-08-A 396.16 897.77 3,668.17 2,784.51 768.16 831.75 314.81 20,901.46 135,866.82 163,749.66 136,793.37 0.9009 25.8679 17.8531 202.262 M-12-05-C 21.93 70.58 229.92 160.31 71.29 44.38 15.57 1,624.85 12,145.24 6,905.52 8,723.34 0.0341 2.0043 1.3956 14.6693 M-12-05-D 8.16 28.16 102.03 72.09 30.42 17.86 6.39 662.11 4,439.14 3,208.94 4,312.34 0.0278 0.6534 0.4942 5.821 M-12-07-B 2.51 8.54 32.02 22.79 9.36 5.44 1.96 201.54 1,299.33 1,025.17 1,385.50 0.0098 0.1862 0.1436 1.771 M-12-08-A 69.89 223.99 862.78 619.64 236.64 153.29 57.32 5,318.36 34,373.67 29,505.35 35,069.02 0.243 5.4312 3.8788 47.8976 M-12-08-B 20.47 75.95 299.38 213.14 87.2 48.89 17.83 1,825.20 11,148.70 9,722.22 13,444.45 0.107 1.4584 1.202 15.7832 M-12-08-C 22.84 78.55 305.22 217.56 88.62 50.02 18.14 1,872.27 11,558.28 9,859.48 13,636.40 0.1054 1.5475 1.2542 16.2253 M-12-11-A 131.97 388.19 1,661.06 1,204.63 399.27 316.6 134.34 9,666.23 58,902.36 63,494.61 66,443.73 0.5095 8.9045 6.4043 82.0111 M-12-14-C 890.41 2,663.14 11,403.73 8,283.73 2,689.49 2,190.18 945.92 66,496.61 406,192.11 438,769.15 462,449.97 3.4726 59.1748 43.0348 550.1055 M-13-04-F 14.07 11.64 37.51 30.27 6.54 5.55 2.53 211.57 1,118.93 1,091.62 2,150.25 0.0104 0.1156 0.1098 1.3707 M-13-04-J 25.98 28.25 105.23 85.96 18.37 18.47 6.92 540.58 3,048.67 4,075.52 4,360.19 0.0243 0.7255 0.4133 5.7503 M-13-04-L 247.78 717.12 3,227.49 2,356.61 653.78 650.27 297.64 18,478.00 115,693.91 134,556.31 115,125.00 0.7871 19.701 12.0374 153.0251 M-13-04-N 28.66 66.77 243.48 177.25 66.25 45.6 18.77 1,533.62 9,976.18 7,873.62 10,906.64 0.0674 1.3398 1.0657 12.7416 M-13-07-D 1,214.18 3,333.93 13,839.89 10,174.55 3,269.69 2,748.36 1,110.90 80,640.47 506,177.15 544,487.58 539,872.67 3.8885 84.3178 58.654 724.8274 M-14-01-A 1.27 4.5 16.04 11.63 4.47 3.12 1.1 99.01 651.05 471.1 781.72 0.005 0.1001 0.0725 0.829
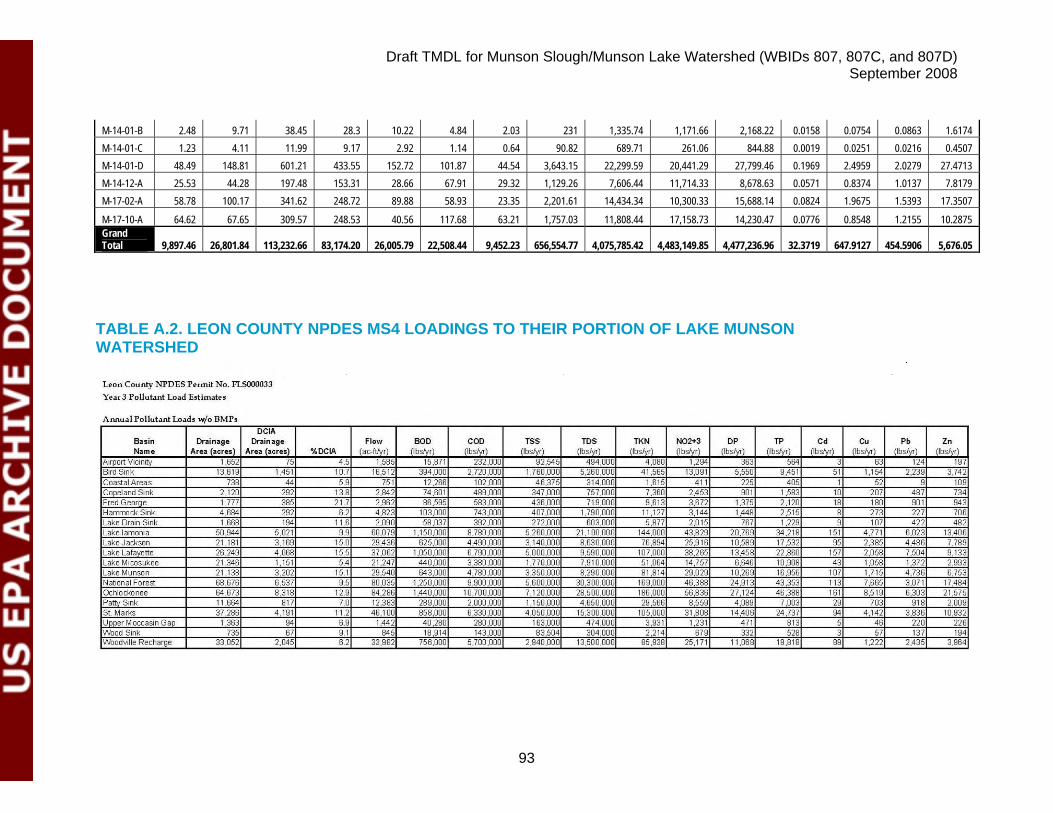
Draft TMDL for Munson Slough/Munson Lake Watershed (WBIDs 807, 807C, and 807D) September 2008
93
M-14-01-B 2.48 9.71 38.45 28.3 10.22 4.84 2.03 231 1,335.74 1,171.66 2,168.22 0.0158 0.0754 0.0863 1.6174 M-14-01-C 1.23 4.11 11.99 9.17 2.92 1.14 0.64 90.82 689.71 261.06 844.88 0.0019 0.0251 0.0216 0.4507 M-14-01-D 48.49 148.81 601.21 433.55 152.72 101.87 44.54 3,643.15 22,299.59 20,441.29 27,799.46 0.1969 2.4959 2.0279 27.4713 M-14-12-A 25.53 44.28 197.48 153.31 28.66 67.91 29.32 1,129.26 7,606.44 11,714.33 8,678.63 0.0571 0.8374 1.0137 7.8179 M-17-02-A 58.78 100.17 341.62 248.72 89.88 58.93 23.35 2,201.61 14,434.34 10,300.33 15,688.14 0.0824 1.9675 1.5393 17.3507
M-17-10-A 64.62 67.65 309.57 248.53 40.56 117.68 63.21 1,757.03 11,808.44 17,158.73 14,230.47 0.0776 0.8548 1.2155 10.2875 Grand Total 9,897.46 26,801.84 113,232.66 83,174.20 26,005.79 22,508.44 9,452.23 656,554.77 4,075,785.42 4,483,149.85 4,477,236.96 32.3719 647.9127 454.5906 5,676.05
TABLE A.2. LEON COUNTY NPDES MS4 LOADINGS TO THEIR PORTION OF LAKE MUNSON WATERSHED
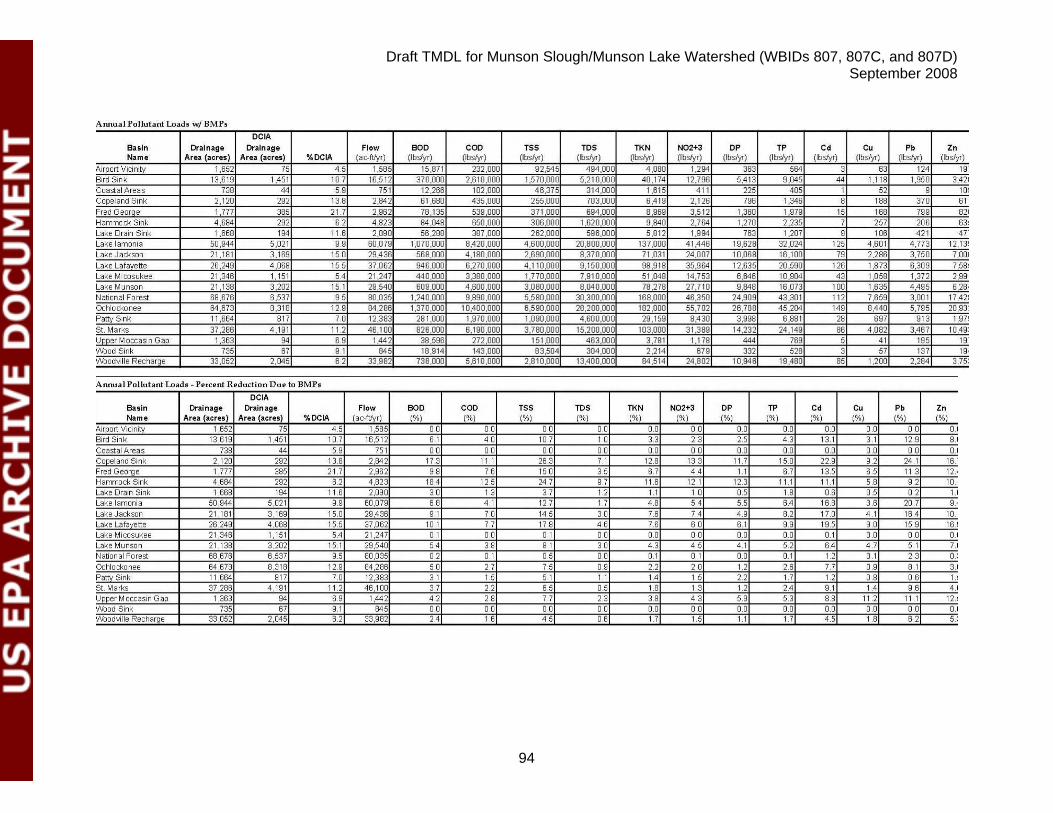
Draft TMDL for Munson Slough/Munson Lake Watershed (WBIDs 807, 807C, and 807D) September 2008
94
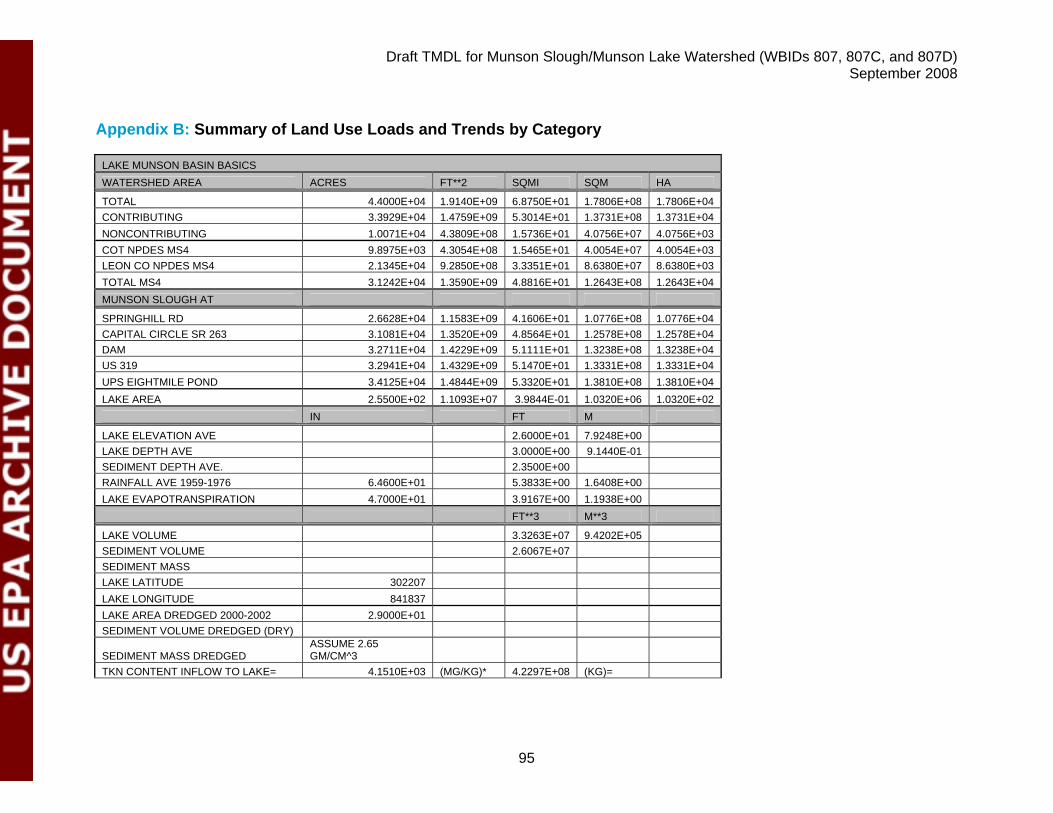
Draft TMDL for Munson Slough/Munson Lake Watershed (WBIDs 807, 807C, and 807D) September 2008
95
Appendix B: Summary of Land Use Loads and Trends by Category
LAKE MUNSON BASIN BASICS WATERSHED AREA ACRES FT**2 SQMI SQM HA
TOTAL 4.4000E+04 1.9140E+09 6.8750E+01 1.7806E+08 1.7806E+04 CONTRIBUTING 3.3929E+04 1.4759E+09 5.3014E+01 1.3731E+08 1.3731E+04 NONCONTRIBUTING 1.0071E+04 4.3809E+08 1.5736E+01 4.0756E+07 4.0756E+03 COT NPDES MS4 9.8975E+03 4.3054E+08 1.5465E+01 4.0054E+07 4.0054E+03 LEON CO NPDES MS4 2.1345E+04 9.2850E+08 3.3351E+01 8.6380E+07 8.6380E+03 TOTAL MS4 3.1242E+04 1.3590E+09 4.8816E+01 1.2643E+08 1.2643E+04 MUNSON SLOUGH AT
SPRINGHILL RD 2.6628E+04 1.1583E+09 4.1606E+01 1.0776E+08 1.0776E+04 CAPITAL CIRCLE SR 263 3.1081E+04 1.3520E+09 4.8564E+01 1.2578E+08 1.2578E+04 DAM 3.2711E+04 1.4229E+09 5.1111E+01 1.3238E+08 1.3238E+04 US 319 3.2941E+04 1.4329E+09 5.1470E+01 1.3331E+08 1.3331E+04 UPS EIGHTMILE POND 3.4125E+04 1.4844E+09 5.3320E+01 1.3810E+08 1.3810E+04 LAKE AREA 2.5500E+02 1.1093E+07 3.9844E-01 1.0320E+06 1.0320E+02 IN FT M
LAKE ELEVATION AVE 2.6000E+01 7.9248E+00 LAKE DEPTH AVE 3.0000E+00 9.1440E-01 SEDIMENT DEPTH AVE. 2.3500E+00 RAINFALL AVE 1959-1976 6.4600E+01 5.3833E+00 1.6408E+00 LAKE EVAPOTRANSPIRATION 4.7000E+01 3.9167E+00 1.1938E+00 FT**3 M**3
LAKE VOLUME 3.3263E+07 9.4202E+05 SEDIMENT VOLUME 2.6067E+07 SEDIMENT MASS LAKE LATITUDE 302207 LAKE LONGITUDE 841837 LAKE AREA DREDGED 2000-2002 2.9000E+01 SEDIMENT VOLUME DREDGED (DRY)
SEDIMENT MASS DREDGED ASSUME 2.65 GM/CM^3
TKN CONTENT INFLOW TO LAKE= 4.1510E+03 (MG/KG)* 4.2297E+08 (KG)=
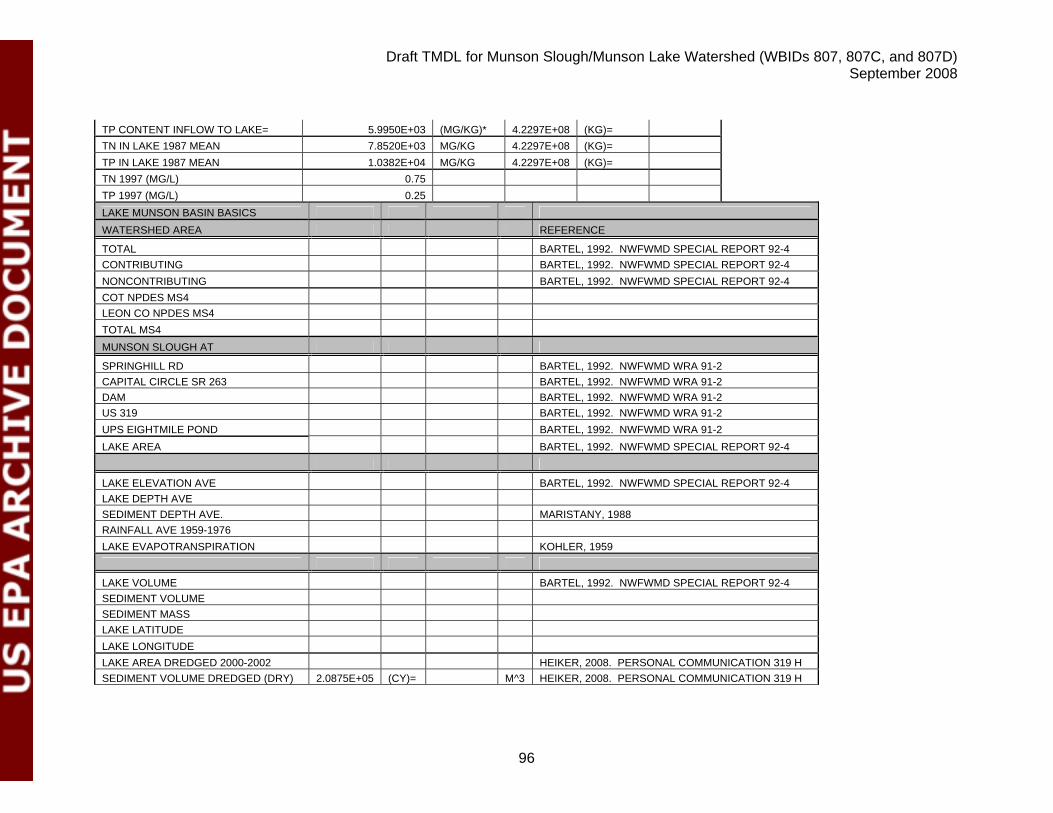
Draft TMDL for Munson Slough/Munson Lake Watershed (WBIDs 807, 807C, and 807D) September 2008
96
TP CONTENT INFLOW TO LAKE= 5.9950E+03 (MG/KG)* 4.2297E+08 (KG)= TN IN LAKE 1987 MEAN 7.8520E+03 MG/KG 4.2297E+08 (KG)= TP IN LAKE 1987 MEAN 1.0382E+04 MG/KG 4.2297E+08 (KG)= TN 1997 (MG/L) 0.75 TP 1997 (MG/L) 0.25 LAKE MUNSON BASIN BASICS WATERSHED AREA REFERENCE
TOTAL BARTEL, 1992. NWFWMD SPECIAL REPORT 92-4 CONTRIBUTING BARTEL, 1992. NWFWMD SPECIAL REPORT 92-4 NONCONTRIBUTING BARTEL, 1992. NWFWMD SPECIAL REPORT 92-4 COT NPDES MS4 LEON CO NPDES MS4 TOTAL MS4 MUNSON SLOUGH AT
SPRINGHILL RD BARTEL, 1992. NWFWMD WRA 91-2 CAPITAL CIRCLE SR 263 BARTEL, 1992. NWFWMD WRA 91-2 DAM BARTEL, 1992. NWFWMD WRA 91-2 US 319 BARTEL, 1992. NWFWMD WRA 91-2 UPS EIGHTMILE POND BARTEL, 1992. NWFWMD WRA 91-2 LAKE AREA BARTEL, 1992. NWFWMD SPECIAL REPORT 92-4
LAKE ELEVATION AVE BARTEL, 1992. NWFWMD SPECIAL REPORT 92-4 LAKE DEPTH AVE SEDIMENT DEPTH AVE. MARISTANY, 1988 RAINFALL AVE 1959-1976 LAKE EVAPOTRANSPIRATION KOHLER, 1959
LAKE VOLUME BARTEL, 1992. NWFWMD SPECIAL REPORT 92-4 SEDIMENT VOLUME SEDIMENT MASS LAKE LATITUDE LAKE LONGITUDE LAKE AREA DREDGED 2000-2002 HEIKER, 2008. PERSONAL COMMUNICATION 319 H SEDIMENT VOLUME DREDGED (DRY) 2.0875E+05 (CY)= M^3 HEIKER, 2008. PERSONAL COMMUNICATION 319 H
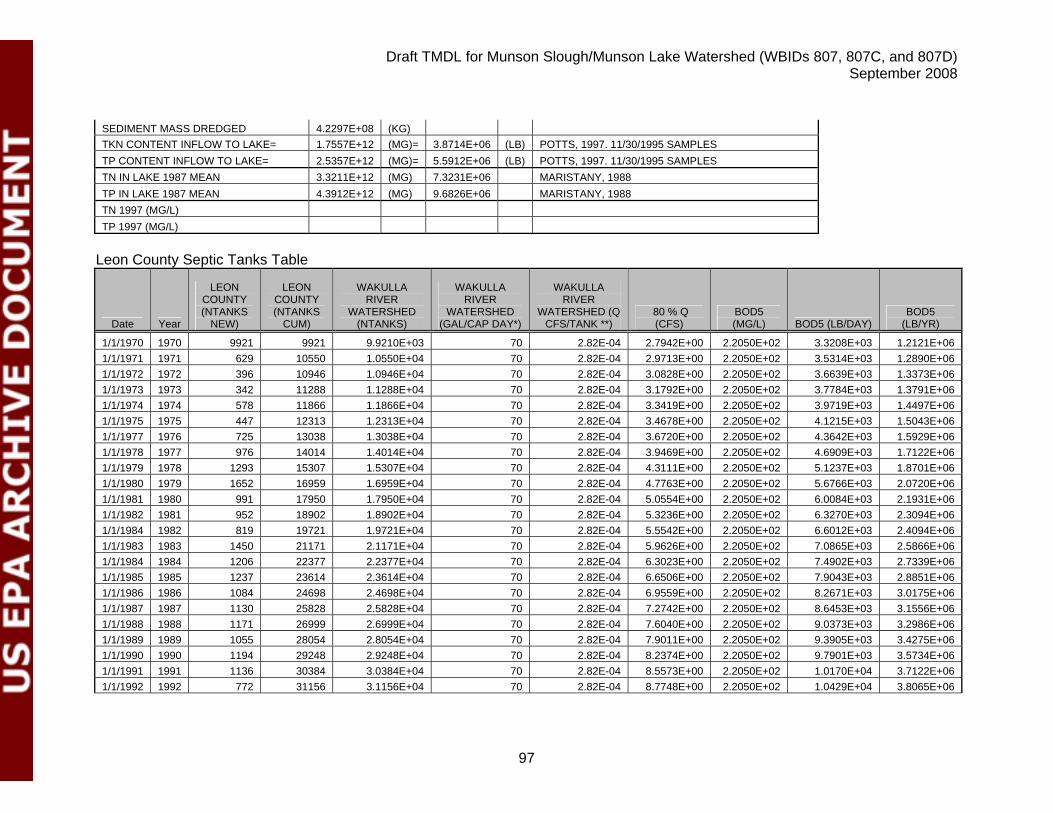
Draft TMDL for Munson Slough/Munson Lake Watershed (WBIDs 807, 807C, and 807D) September 2008
97
SEDIMENT MASS DREDGED 4.2297E+08 (KG) TKN CONTENT INFLOW TO LAKE= 1.7557E+12 (MG)= 3.8714E+06 (LB) POTTS, 1997. 11/30/1995 SAMPLES TP CONTENT INFLOW TO LAKE= 2.5357E+12 (MG)= 5.5912E+06 (LB) POTTS, 1997. 11/30/1995 SAMPLES TN IN LAKE 1987 MEAN 3.3211E+12 (MG) 7.3231E+06 MARISTANY, 1988 TP IN LAKE 1987 MEAN 4.3912E+12 (MG) 9.6826E+06 MARISTANY, 1988 TN 1997 (MG/L) TP 1997 (MG/L)
Leon County Septic Tanks Table
Date Year
LEON COUNTY (NTANKS
NEW)
LEON COUNTY (NTANKS
CUM)
WAKULLA RIVER
WATERSHED (NTANKS)
WAKULLA RIVER
WATERSHED (GAL/CAP DAY*)
WAKULLA RIVER
WATERSHED (Q CFS/TANK **)
80 % Q (CFS)
BOD5 (MG/L) BOD5 (LB/DAY)
BOD5 (LB/YR)
1/1/1970 1970 9921 9921 9.9210E+03 70 2.82E-04 2.7942E+00 2.2050E+02 3.3208E+03 1.2121E+06 1/1/1971 1971 629 10550 1.0550E+04 70 2.82E-04 2.9713E+00 2.2050E+02 3.5314E+03 1.2890E+06 1/1/1972 1972 396 10946 1.0946E+04 70 2.82E-04 3.0828E+00 2.2050E+02 3.6639E+03 1.3373E+06 1/1/1973 1973 342 11288 1.1288E+04 70 2.82E-04 3.1792E+00 2.2050E+02 3.7784E+03 1.3791E+06 1/1/1974 1974 578 11866 1.1866E+04 70 2.82E-04 3.3419E+00 2.2050E+02 3.9719E+03 1.4497E+06 1/1/1975 1975 447 12313 1.2313E+04 70 2.82E-04 3.4678E+00 2.2050E+02 4.1215E+03 1.5043E+06 1/1/1977 1976 725 13038 1.3038E+04 70 2.82E-04 3.6720E+00 2.2050E+02 4.3642E+03 1.5929E+06 1/1/1978 1977 976 14014 1.4014E+04 70 2.82E-04 3.9469E+00 2.2050E+02 4.6909E+03 1.7122E+06 1/1/1979 1978 1293 15307 1.5307E+04 70 2.82E-04 4.3111E+00 2.2050E+02 5.1237E+03 1.8701E+06 1/1/1980 1979 1652 16959 1.6959E+04 70 2.82E-04 4.7763E+00 2.2050E+02 5.6766E+03 2.0720E+06 1/1/1981 1980 991 17950 1.7950E+04 70 2.82E-04 5.0554E+00 2.2050E+02 6.0084E+03 2.1931E+06 1/1/1982 1981 952 18902 1.8902E+04 70 2.82E-04 5.3236E+00 2.2050E+02 6.3270E+03 2.3094E+06 1/1/1984 1982 819 19721 1.9721E+04 70 2.82E-04 5.5542E+00 2.2050E+02 6.6012E+03 2.4094E+06 1/1/1983 1983 1450 21171 2.1171E+04 70 2.82E-04 5.9626E+00 2.2050E+02 7.0865E+03 2.5866E+06 1/1/1984 1984 1206 22377 2.2377E+04 70 2.82E-04 6.3023E+00 2.2050E+02 7.4902E+03 2.7339E+06 1/1/1985 1985 1237 23614 2.3614E+04 70 2.82E-04 6.6506E+00 2.2050E+02 7.9043E+03 2.8851E+06 1/1/1986 1986 1084 24698 2.4698E+04 70 2.82E-04 6.9559E+00 2.2050E+02 8.2671E+03 3.0175E+06 1/1/1987 1987 1130 25828 2.5828E+04 70 2.82E-04 7.2742E+00 2.2050E+02 8.6453E+03 3.1556E+06 1/1/1988 1988 1171 26999 2.6999E+04 70 2.82E-04 7.6040E+00 2.2050E+02 9.0373E+03 3.2986E+06 1/1/1989 1989 1055 28054 2.8054E+04 70 2.82E-04 7.9011E+00 2.2050E+02 9.3905E+03 3.4275E+06 1/1/1990 1990 1194 29248 2.9248E+04 70 2.82E-04 8.2374E+00 2.2050E+02 9.7901E+03 3.5734E+06 1/1/1991 1991 1136 30384 3.0384E+04 70 2.82E-04 8.5573E+00 2.2050E+02 1.0170E+04 3.7122E+06 1/1/1992 1992 772 31156 3.1156E+04 70 2.82E-04 8.7748E+00 2.2050E+02 1.0429E+04 3.8065E+06
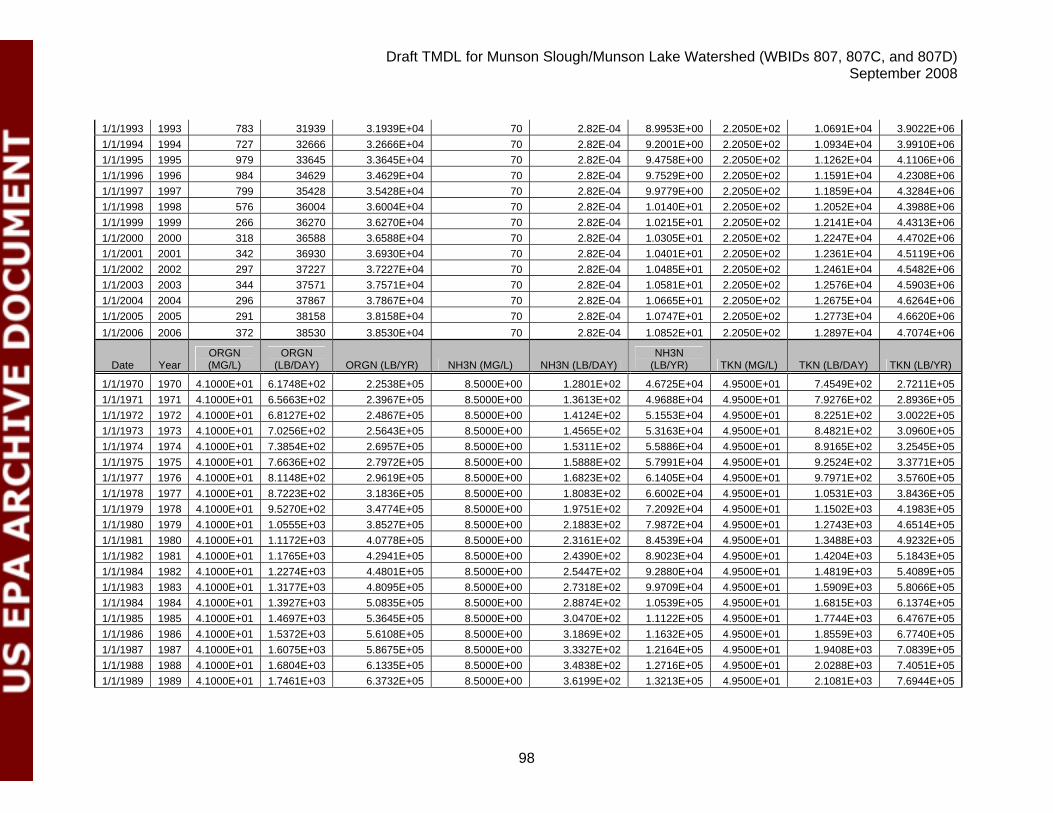
Draft TMDL for Munson Slough/Munson Lake Watershed (WBIDs 807, 807C, and 807D) September 2008
98
1/1/1993 1993 783 31939 3.1939E+04 70 2.82E-04 8.9953E+00 2.2050E+02 1.0691E+04 3.9022E+06 1/1/1994 1994 727 32666 3.2666E+04 70 2.82E-04 9.2001E+00 2.2050E+02 1.0934E+04 3.9910E+06 1/1/1995 1995 979 33645 3.3645E+04 70 2.82E-04 9.4758E+00 2.2050E+02 1.1262E+04 4.1106E+06 1/1/1996 1996 984 34629 3.4629E+04 70 2.82E-04 9.7529E+00 2.2050E+02 1.1591E+04 4.2308E+06 1/1/1997 1997 799 35428 3.5428E+04 70 2.82E-04 9.9779E+00 2.2050E+02 1.1859E+04 4.3284E+06 1/1/1998 1998 576 36004 3.6004E+04 70 2.82E-04 1.0140E+01 2.2050E+02 1.2052E+04 4.3988E+06 1/1/1999 1999 266 36270 3.6270E+04 70 2.82E-04 1.0215E+01 2.2050E+02 1.2141E+04 4.4313E+06 1/1/2000 2000 318 36588 3.6588E+04 70 2.82E-04 1.0305E+01 2.2050E+02 1.2247E+04 4.4702E+06 1/1/2001 2001 342 36930 3.6930E+04 70 2.82E-04 1.0401E+01 2.2050E+02 1.2361E+04 4.5119E+06 1/1/2002 2002 297 37227 3.7227E+04 70 2.82E-04 1.0485E+01 2.2050E+02 1.2461E+04 4.5482E+06 1/1/2003 2003 344 37571 3.7571E+04 70 2.82E-04 1.0581E+01 2.2050E+02 1.2576E+04 4.5903E+06 1/1/2004 2004 296 37867 3.7867E+04 70 2.82E-04 1.0665E+01 2.2050E+02 1.2675E+04 4.6264E+06 1/1/2005 2005 291 38158 3.8158E+04 70 2.82E-04 1.0747E+01 2.2050E+02 1.2773E+04 4.6620E+06 1/1/2006 2006 372 38530 3.8530E+04 70 2.82E-04 1.0852E+01 2.2050E+02 1.2897E+04 4.7074E+06
Date Year ORGN (MG/L)
ORGN (LB/DAY) ORGN (LB/YR) NH3N (MG/L) NH3N (LB/DAY)
NH3N (LB/YR) TKN (MG/L) TKN (LB/DAY) TKN (LB/YR)
1/1/1970 1970 4.1000E+01 6.1748E+02 2.2538E+05 8.5000E+00 1.2801E+02 4.6725E+04 4.9500E+01 7.4549E+02 2.7211E+05 1/1/1971 1971 4.1000E+01 6.5663E+02 2.3967E+05 8.5000E+00 1.3613E+02 4.9688E+04 4.9500E+01 7.9276E+02 2.8936E+05 1/1/1972 1972 4.1000E+01 6.8127E+02 2.4867E+05 8.5000E+00 1.4124E+02 5.1553E+04 4.9500E+01 8.2251E+02 3.0022E+05 1/1/1973 1973 4.1000E+01 7.0256E+02 2.5643E+05 8.5000E+00 1.4565E+02 5.3163E+04 4.9500E+01 8.4821E+02 3.0960E+05 1/1/1974 1974 4.1000E+01 7.3854E+02 2.6957E+05 8.5000E+00 1.5311E+02 5.5886E+04 4.9500E+01 8.9165E+02 3.2545E+05 1/1/1975 1975 4.1000E+01 7.6636E+02 2.7972E+05 8.5000E+00 1.5888E+02 5.7991E+04 4.9500E+01 9.2524E+02 3.3771E+05 1/1/1977 1976 4.1000E+01 8.1148E+02 2.9619E+05 8.5000E+00 1.6823E+02 6.1405E+04 4.9500E+01 9.7971E+02 3.5760E+05 1/1/1978 1977 4.1000E+01 8.7223E+02 3.1836E+05 8.5000E+00 1.8083E+02 6.6002E+04 4.9500E+01 1.0531E+03 3.8436E+05 1/1/1979 1978 4.1000E+01 9.5270E+02 3.4774E+05 8.5000E+00 1.9751E+02 7.2092E+04 4.9500E+01 1.1502E+03 4.1983E+05 1/1/1980 1979 4.1000E+01 1.0555E+03 3.8527E+05 8.5000E+00 2.1883E+02 7.9872E+04 4.9500E+01 1.2743E+03 4.6514E+05 1/1/1981 1980 4.1000E+01 1.1172E+03 4.0778E+05 8.5000E+00 2.3161E+02 8.4539E+04 4.9500E+01 1.3488E+03 4.9232E+05 1/1/1982 1981 4.1000E+01 1.1765E+03 4.2941E+05 8.5000E+00 2.4390E+02 8.9023E+04 4.9500E+01 1.4204E+03 5.1843E+05 1/1/1984 1982 4.1000E+01 1.2274E+03 4.4801E+05 8.5000E+00 2.5447E+02 9.2880E+04 4.9500E+01 1.4819E+03 5.4089E+05 1/1/1983 1983 4.1000E+01 1.3177E+03 4.8095E+05 8.5000E+00 2.7318E+02 9.9709E+04 4.9500E+01 1.5909E+03 5.8066E+05 1/1/1984 1984 4.1000E+01 1.3927E+03 5.0835E+05 8.5000E+00 2.8874E+02 1.0539E+05 4.9500E+01 1.6815E+03 6.1374E+05 1/1/1985 1985 4.1000E+01 1.4697E+03 5.3645E+05 8.5000E+00 3.0470E+02 1.1122E+05 4.9500E+01 1.7744E+03 6.4767E+05 1/1/1986 1986 4.1000E+01 1.5372E+03 5.6108E+05 8.5000E+00 3.1869E+02 1.1632E+05 4.9500E+01 1.8559E+03 6.7740E+05 1/1/1987 1987 4.1000E+01 1.6075E+03 5.8675E+05 8.5000E+00 3.3327E+02 1.2164E+05 4.9500E+01 1.9408E+03 7.0839E+05 1/1/1988 1988 4.1000E+01 1.6804E+03 6.1335E+05 8.5000E+00 3.4838E+02 1.2716E+05 4.9500E+01 2.0288E+03 7.4051E+05 1/1/1989 1989 4.1000E+01 1.7461E+03 6.3732E+05 8.5000E+00 3.6199E+02 1.3213E+05 4.9500E+01 2.1081E+03 7.6944E+05
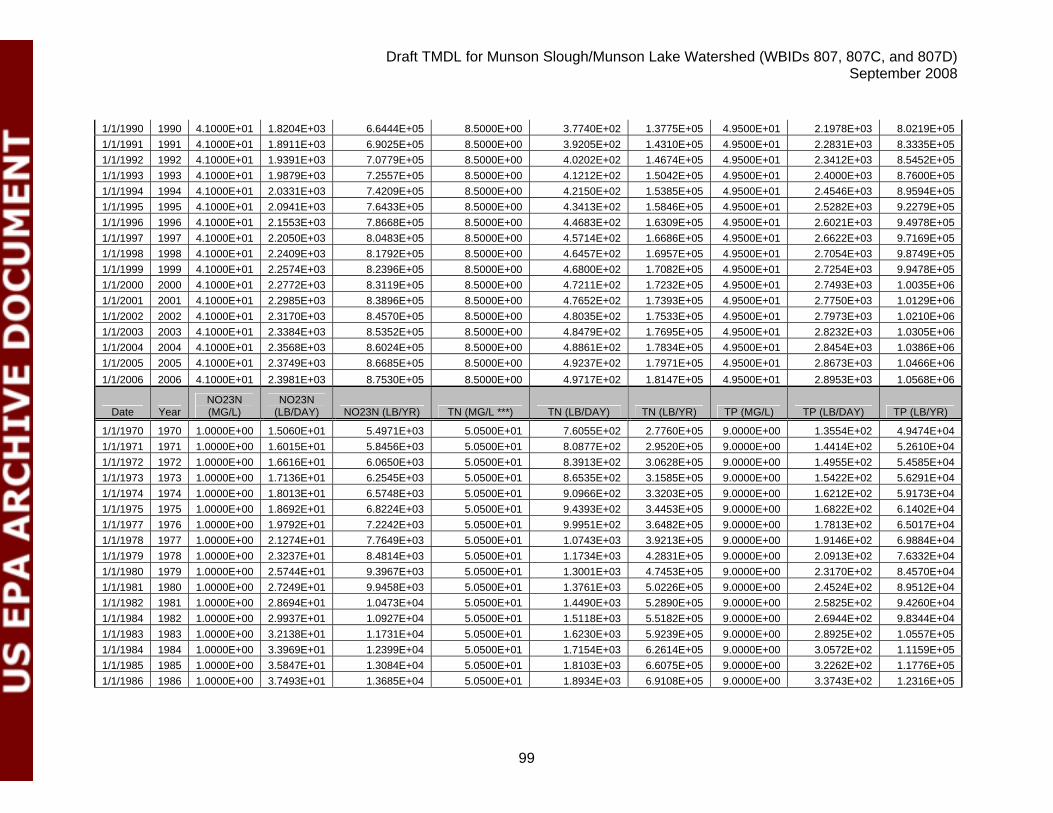
Draft TMDL for Munson Slough/Munson Lake Watershed (WBIDs 807, 807C, and 807D) September 2008
99
1/1/1990 1990 4.1000E+01 1.8204E+03 6.6444E+05 8.5000E+00 3.7740E+02 1.3775E+05 4.9500E+01 2.1978E+03 8.0219E+05 1/1/1991 1991 4.1000E+01 1.8911E+03 6.9025E+05 8.5000E+00 3.9205E+02 1.4310E+05 4.9500E+01 2.2831E+03 8.3335E+05 1/1/1992 1992 4.1000E+01 1.9391E+03 7.0779E+05 8.5000E+00 4.0202E+02 1.4674E+05 4.9500E+01 2.3412E+03 8.5452E+05 1/1/1993 1993 4.1000E+01 1.9879E+03 7.2557E+05 8.5000E+00 4.1212E+02 1.5042E+05 4.9500E+01 2.4000E+03 8.7600E+05 1/1/1994 1994 4.1000E+01 2.0331E+03 7.4209E+05 8.5000E+00 4.2150E+02 1.5385E+05 4.9500E+01 2.4546E+03 8.9594E+05 1/1/1995 1995 4.1000E+01 2.0941E+03 7.6433E+05 8.5000E+00 4.3413E+02 1.5846E+05 4.9500E+01 2.5282E+03 9.2279E+05 1/1/1996 1996 4.1000E+01 2.1553E+03 7.8668E+05 8.5000E+00 4.4683E+02 1.6309E+05 4.9500E+01 2.6021E+03 9.4978E+05 1/1/1997 1997 4.1000E+01 2.2050E+03 8.0483E+05 8.5000E+00 4.5714E+02 1.6686E+05 4.9500E+01 2.6622E+03 9.7169E+05 1/1/1998 1998 4.1000E+01 2.2409E+03 8.1792E+05 8.5000E+00 4.6457E+02 1.6957E+05 4.9500E+01 2.7054E+03 9.8749E+05 1/1/1999 1999 4.1000E+01 2.2574E+03 8.2396E+05 8.5000E+00 4.6800E+02 1.7082E+05 4.9500E+01 2.7254E+03 9.9478E+05 1/1/2000 2000 4.1000E+01 2.2772E+03 8.3119E+05 8.5000E+00 4.7211E+02 1.7232E+05 4.9500E+01 2.7493E+03 1.0035E+06 1/1/2001 2001 4.1000E+01 2.2985E+03 8.3896E+05 8.5000E+00 4.7652E+02 1.7393E+05 4.9500E+01 2.7750E+03 1.0129E+06 1/1/2002 2002 4.1000E+01 2.3170E+03 8.4570E+05 8.5000E+00 4.8035E+02 1.7533E+05 4.9500E+01 2.7973E+03 1.0210E+06 1/1/2003 2003 4.1000E+01 2.3384E+03 8.5352E+05 8.5000E+00 4.8479E+02 1.7695E+05 4.9500E+01 2.8232E+03 1.0305E+06 1/1/2004 2004 4.1000E+01 2.3568E+03 8.6024E+05 8.5000E+00 4.8861E+02 1.7834E+05 4.9500E+01 2.8454E+03 1.0386E+06 1/1/2005 2005 4.1000E+01 2.3749E+03 8.6685E+05 8.5000E+00 4.9237E+02 1.7971E+05 4.9500E+01 2.8673E+03 1.0466E+06 1/1/2006 2006 4.1000E+01 2.3981E+03 8.7530E+05 8.5000E+00 4.9717E+02 1.8147E+05 4.9500E+01 2.8953E+03 1.0568E+06
Date Year NO23N (MG/L)
NO23N (LB/DAY) NO23N (LB/YR) TN (MG/L ***) TN (LB/DAY) TN (LB/YR) TP (MG/L) TP (LB/DAY) TP (LB/YR)
1/1/1970 1970 1.0000E+00 1.5060E+01 5.4971E+03 5.0500E+01 7.6055E+02 2.7760E+05 9.0000E+00 1.3554E+02 4.9474E+04 1/1/1971 1971 1.0000E+00 1.6015E+01 5.8456E+03 5.0500E+01 8.0877E+02 2.9520E+05 9.0000E+00 1.4414E+02 5.2610E+04 1/1/1972 1972 1.0000E+00 1.6616E+01 6.0650E+03 5.0500E+01 8.3913E+02 3.0628E+05 9.0000E+00 1.4955E+02 5.4585E+04 1/1/1973 1973 1.0000E+00 1.7136E+01 6.2545E+03 5.0500E+01 8.6535E+02 3.1585E+05 9.0000E+00 1.5422E+02 5.6291E+04 1/1/1974 1974 1.0000E+00 1.8013E+01 6.5748E+03 5.0500E+01 9.0966E+02 3.3203E+05 9.0000E+00 1.6212E+02 5.9173E+04 1/1/1975 1975 1.0000E+00 1.8692E+01 6.8224E+03 5.0500E+01 9.4393E+02 3.4453E+05 9.0000E+00 1.6822E+02 6.1402E+04 1/1/1977 1976 1.0000E+00 1.9792E+01 7.2242E+03 5.0500E+01 9.9951E+02 3.6482E+05 9.0000E+00 1.7813E+02 6.5017E+04 1/1/1978 1977 1.0000E+00 2.1274E+01 7.7649E+03 5.0500E+01 1.0743E+03 3.9213E+05 9.0000E+00 1.9146E+02 6.9884E+04 1/1/1979 1978 1.0000E+00 2.3237E+01 8.4814E+03 5.0500E+01 1.1734E+03 4.2831E+05 9.0000E+00 2.0913E+02 7.6332E+04 1/1/1980 1979 1.0000E+00 2.5744E+01 9.3967E+03 5.0500E+01 1.3001E+03 4.7453E+05 9.0000E+00 2.3170E+02 8.4570E+04 1/1/1981 1980 1.0000E+00 2.7249E+01 9.9458E+03 5.0500E+01 1.3761E+03 5.0226E+05 9.0000E+00 2.4524E+02 8.9512E+04 1/1/1982 1981 1.0000E+00 2.8694E+01 1.0473E+04 5.0500E+01 1.4490E+03 5.2890E+05 9.0000E+00 2.5825E+02 9.4260E+04 1/1/1984 1982 1.0000E+00 2.9937E+01 1.0927E+04 5.0500E+01 1.5118E+03 5.5182E+05 9.0000E+00 2.6944E+02 9.8344E+04 1/1/1983 1983 1.0000E+00 3.2138E+01 1.1731E+04 5.0500E+01 1.6230E+03 5.9239E+05 9.0000E+00 2.8925E+02 1.0557E+05 1/1/1984 1984 1.0000E+00 3.3969E+01 1.2399E+04 5.0500E+01 1.7154E+03 6.2614E+05 9.0000E+00 3.0572E+02 1.1159E+05 1/1/1985 1985 1.0000E+00 3.5847E+01 1.3084E+04 5.0500E+01 1.8103E+03 6.6075E+05 9.0000E+00 3.2262E+02 1.1776E+05 1/1/1986 1986 1.0000E+00 3.7493E+01 1.3685E+04 5.0500E+01 1.8934E+03 6.9108E+05 9.0000E+00 3.3743E+02 1.2316E+05
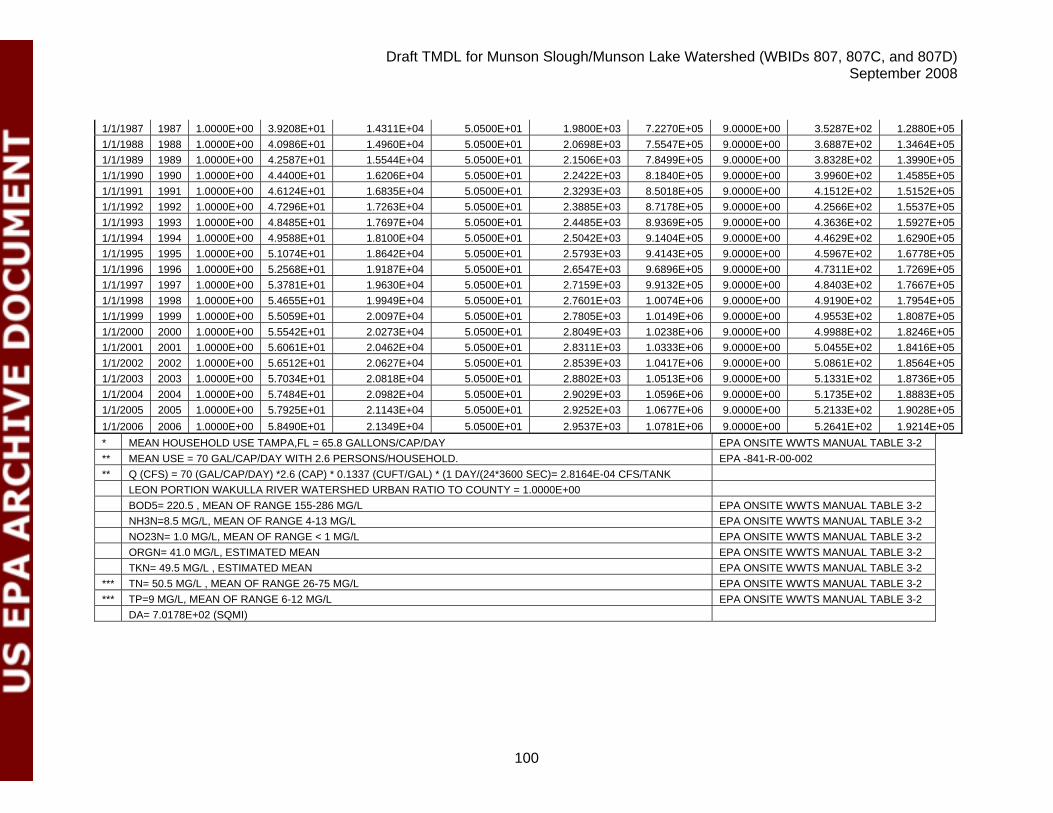
Draft TMDL for Munson Slough/Munson Lake Watershed (WBIDs 807, 807C, and 807D) September 2008
100
1/1/1987 1987 1.0000E+00 3.9208E+01 1.4311E+04 5.0500E+01 1.9800E+03 7.2270E+05 9.0000E+00 3.5287E+02 1.2880E+05 1/1/1988 1988 1.0000E+00 4.0986E+01 1.4960E+04 5.0500E+01 2.0698E+03 7.5547E+05 9.0000E+00 3.6887E+02 1.3464E+05 1/1/1989 1989 1.0000E+00 4.2587E+01 1.5544E+04 5.0500E+01 2.1506E+03 7.8499E+05 9.0000E+00 3.8328E+02 1.3990E+05 1/1/1990 1990 1.0000E+00 4.4400E+01 1.6206E+04 5.0500E+01 2.2422E+03 8.1840E+05 9.0000E+00 3.9960E+02 1.4585E+05 1/1/1991 1991 1.0000E+00 4.6124E+01 1.6835E+04 5.0500E+01 2.3293E+03 8.5018E+05 9.0000E+00 4.1512E+02 1.5152E+05 1/1/1992 1992 1.0000E+00 4.7296E+01 1.7263E+04 5.0500E+01 2.3885E+03 8.7178E+05 9.0000E+00 4.2566E+02 1.5537E+05 1/1/1993 1993 1.0000E+00 4.8485E+01 1.7697E+04 5.0500E+01 2.4485E+03 8.9369E+05 9.0000E+00 4.3636E+02 1.5927E+05 1/1/1994 1994 1.0000E+00 4.9588E+01 1.8100E+04 5.0500E+01 2.5042E+03 9.1404E+05 9.0000E+00 4.4629E+02 1.6290E+05 1/1/1995 1995 1.0000E+00 5.1074E+01 1.8642E+04 5.0500E+01 2.5793E+03 9.4143E+05 9.0000E+00 4.5967E+02 1.6778E+05 1/1/1996 1996 1.0000E+00 5.2568E+01 1.9187E+04 5.0500E+01 2.6547E+03 9.6896E+05 9.0000E+00 4.7311E+02 1.7269E+05 1/1/1997 1997 1.0000E+00 5.3781E+01 1.9630E+04 5.0500E+01 2.7159E+03 9.9132E+05 9.0000E+00 4.8403E+02 1.7667E+05 1/1/1998 1998 1.0000E+00 5.4655E+01 1.9949E+04 5.0500E+01 2.7601E+03 1.0074E+06 9.0000E+00 4.9190E+02 1.7954E+05 1/1/1999 1999 1.0000E+00 5.5059E+01 2.0097E+04 5.0500E+01 2.7805E+03 1.0149E+06 9.0000E+00 4.9553E+02 1.8087E+05 1/1/2000 2000 1.0000E+00 5.5542E+01 2.0273E+04 5.0500E+01 2.8049E+03 1.0238E+06 9.0000E+00 4.9988E+02 1.8246E+05 1/1/2001 2001 1.0000E+00 5.6061E+01 2.0462E+04 5.0500E+01 2.8311E+03 1.0333E+06 9.0000E+00 5.0455E+02 1.8416E+05 1/1/2002 2002 1.0000E+00 5.6512E+01 2.0627E+04 5.0500E+01 2.8539E+03 1.0417E+06 9.0000E+00 5.0861E+02 1.8564E+05 1/1/2003 2003 1.0000E+00 5.7034E+01 2.0818E+04 5.0500E+01 2.8802E+03 1.0513E+06 9.0000E+00 5.1331E+02 1.8736E+05 1/1/2004 2004 1.0000E+00 5.7484E+01 2.0982E+04 5.0500E+01 2.9029E+03 1.0596E+06 9.0000E+00 5.1735E+02 1.8883E+05 1/1/2005 2005 1.0000E+00 5.7925E+01 2.1143E+04 5.0500E+01 2.9252E+03 1.0677E+06 9.0000E+00 5.2133E+02 1.9028E+05 1/1/2006 2006 1.0000E+00 5.8490E+01 2.1349E+04 5.0500E+01 2.9537E+03 1.0781E+06 9.0000E+00 5.2641E+02 1.9214E+05 * MEAN HOUSEHOLD USE TAMPA,FL = 65.8 GALLONS/CAP/DAY EPA ONSITE WWTS MANUAL TABLE 3-2 ** MEAN USE = 70 GAL/CAP/DAY WITH 2.6 PERSONS/HOUSEHOLD. EPA -841-R-00-002 ** Q (CFS) = 70 (GAL/CAP/DAY) *2.6 (CAP) * 0.1337 (CUFT/GAL) * (1 DAY/(24*3600 SEC)= 2.8164E-04 CFS/TANK LEON PORTION WAKULLA RIVER WATERSHED URBAN RATIO TO COUNTY = 1.0000E+00 BOD5= 220.5 , MEAN OF RANGE 155-286 MG/L EPA ONSITE WWTS MANUAL TABLE 3-2 NH3N=8.5 MG/L, MEAN OF RANGE 4-13 MG/L EPA ONSITE WWTS MANUAL TABLE 3-2 NO23N= 1.0 MG/L, MEAN OF RANGE < 1 MG/L EPA ONSITE WWTS MANUAL TABLE 3-2 ORGN= 41.0 MG/L, ESTIMATED MEAN EPA ONSITE WWTS MANUAL TABLE 3-2 TKN= 49.5 MG/L , ESTIMATED MEAN EPA ONSITE WWTS MANUAL TABLE 3-2 *** TN= 50.5 MG/L , MEAN OF RANGE 26-75 MG/L EPA ONSITE WWTS MANUAL TABLE 3-2 *** TP=9 MG/L, MEAN OF RANGE 6-12 MG/L EPA ONSITE WWTS MANUAL TABLE 3-2 DA= 7.0178E+02 (SQMI)
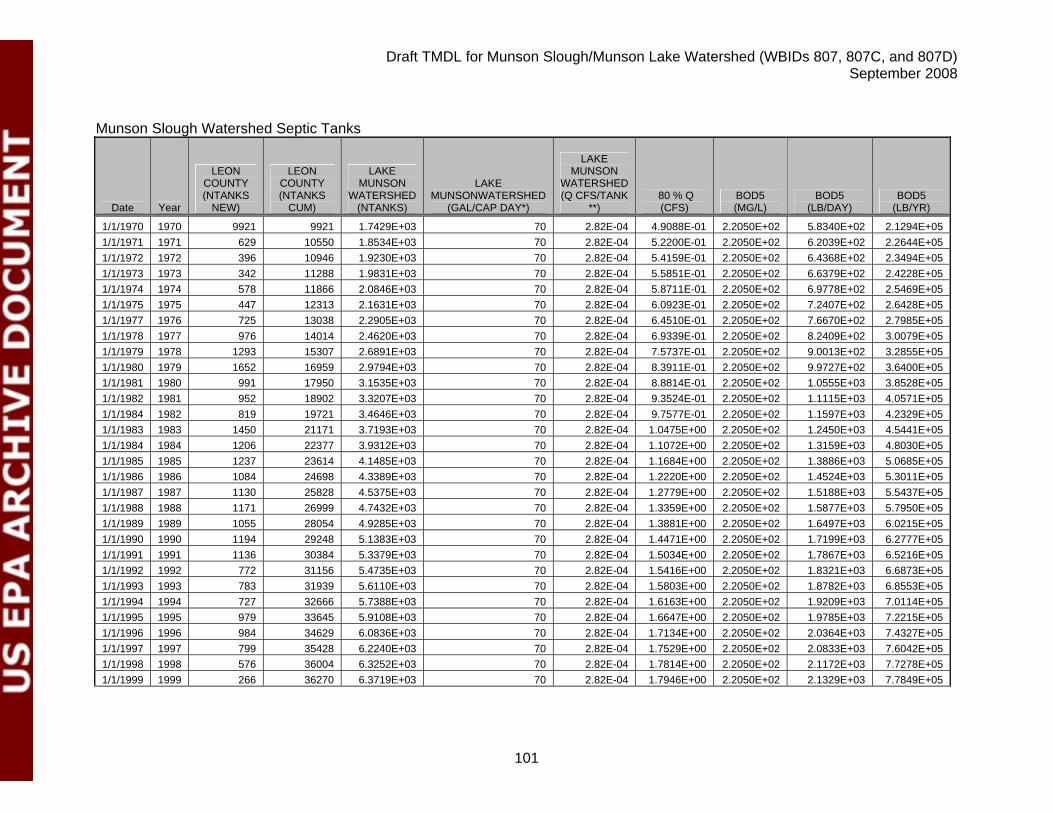
Draft TMDL for Munson Slough/Munson Lake Watershed (WBIDs 807, 807C, and 807D) September 2008
101
Munson Slough Watershed Septic Tanks
Date Year
LEON COUNTY (NTANKS
NEW)
LEON COUNTY (NTANKS
CUM)
LAKE MUNSON
WATERSHED (NTANKS)
LAKE MUNSONWATERSHED
(GAL/CAP DAY*)
LAKE MUNSON
WATERSHED (Q CFS/TANK
**) 80 % Q (CFS)
BOD5 (MG/L)
BOD5 (LB/DAY)
BOD5 (LB/YR)
1/1/1970 1970 9921 9921 1.7429E+03 70 2.82E-04 4.9088E-01 2.2050E+02 5.8340E+02 2.1294E+05 1/1/1971 1971 629 10550 1.8534E+03 70 2.82E-04 5.2200E-01 2.2050E+02 6.2039E+02 2.2644E+05 1/1/1972 1972 396 10946 1.9230E+03 70 2.82E-04 5.4159E-01 2.2050E+02 6.4368E+02 2.3494E+05 1/1/1973 1973 342 11288 1.9831E+03 70 2.82E-04 5.5851E-01 2.2050E+02 6.6379E+02 2.4228E+05 1/1/1974 1974 578 11866 2.0846E+03 70 2.82E-04 5.8711E-01 2.2050E+02 6.9778E+02 2.5469E+05 1/1/1975 1975 447 12313 2.1631E+03 70 2.82E-04 6.0923E-01 2.2050E+02 7.2407E+02 2.6428E+05 1/1/1977 1976 725 13038 2.2905E+03 70 2.82E-04 6.4510E-01 2.2050E+02 7.6670E+02 2.7985E+05 1/1/1978 1977 976 14014 2.4620E+03 70 2.82E-04 6.9339E-01 2.2050E+02 8.2409E+02 3.0079E+05 1/1/1979 1978 1293 15307 2.6891E+03 70 2.82E-04 7.5737E-01 2.2050E+02 9.0013E+02 3.2855E+05 1/1/1980 1979 1652 16959 2.9794E+03 70 2.82E-04 8.3911E-01 2.2050E+02 9.9727E+02 3.6400E+05 1/1/1981 1980 991 17950 3.1535E+03 70 2.82E-04 8.8814E-01 2.2050E+02 1.0555E+03 3.8528E+05 1/1/1982 1981 952 18902 3.3207E+03 70 2.82E-04 9.3524E-01 2.2050E+02 1.1115E+03 4.0571E+05 1/1/1984 1982 819 19721 3.4646E+03 70 2.82E-04 9.7577E-01 2.2050E+02 1.1597E+03 4.2329E+05 1/1/1983 1983 1450 21171 3.7193E+03 70 2.82E-04 1.0475E+00 2.2050E+02 1.2450E+03 4.5441E+05 1/1/1984 1984 1206 22377 3.9312E+03 70 2.82E-04 1.1072E+00 2.2050E+02 1.3159E+03 4.8030E+05 1/1/1985 1985 1237 23614 4.1485E+03 70 2.82E-04 1.1684E+00 2.2050E+02 1.3886E+03 5.0685E+05 1/1/1986 1986 1084 24698 4.3389E+03 70 2.82E-04 1.2220E+00 2.2050E+02 1.4524E+03 5.3011E+05 1/1/1987 1987 1130 25828 4.5375E+03 70 2.82E-04 1.2779E+00 2.2050E+02 1.5188E+03 5.5437E+05 1/1/1988 1988 1171 26999 4.7432E+03 70 2.82E-04 1.3359E+00 2.2050E+02 1.5877E+03 5.7950E+05 1/1/1989 1989 1055 28054 4.9285E+03 70 2.82E-04 1.3881E+00 2.2050E+02 1.6497E+03 6.0215E+05 1/1/1990 1990 1194 29248 5.1383E+03 70 2.82E-04 1.4471E+00 2.2050E+02 1.7199E+03 6.2777E+05 1/1/1991 1991 1136 30384 5.3379E+03 70 2.82E-04 1.5034E+00 2.2050E+02 1.7867E+03 6.5216E+05 1/1/1992 1992 772 31156 5.4735E+03 70 2.82E-04 1.5416E+00 2.2050E+02 1.8321E+03 6.6873E+05 1/1/1993 1993 783 31939 5.6110E+03 70 2.82E-04 1.5803E+00 2.2050E+02 1.8782E+03 6.8553E+05 1/1/1994 1994 727 32666 5.7388E+03 70 2.82E-04 1.6163E+00 2.2050E+02 1.9209E+03 7.0114E+05 1/1/1995 1995 979 33645 5.9108E+03 70 2.82E-04 1.6647E+00 2.2050E+02 1.9785E+03 7.2215E+05 1/1/1996 1996 984 34629 6.0836E+03 70 2.82E-04 1.7134E+00 2.2050E+02 2.0364E+03 7.4327E+05 1/1/1997 1997 799 35428 6.2240E+03 70 2.82E-04 1.7529E+00 2.2050E+02 2.0833E+03 7.6042E+05 1/1/1998 1998 576 36004 6.3252E+03 70 2.82E-04 1.7814E+00 2.2050E+02 2.1172E+03 7.7278E+05 1/1/1999 1999 266 36270 6.3719E+03 70 2.82E-04 1.7946E+00 2.2050E+02 2.1329E+03 7.7849E+05
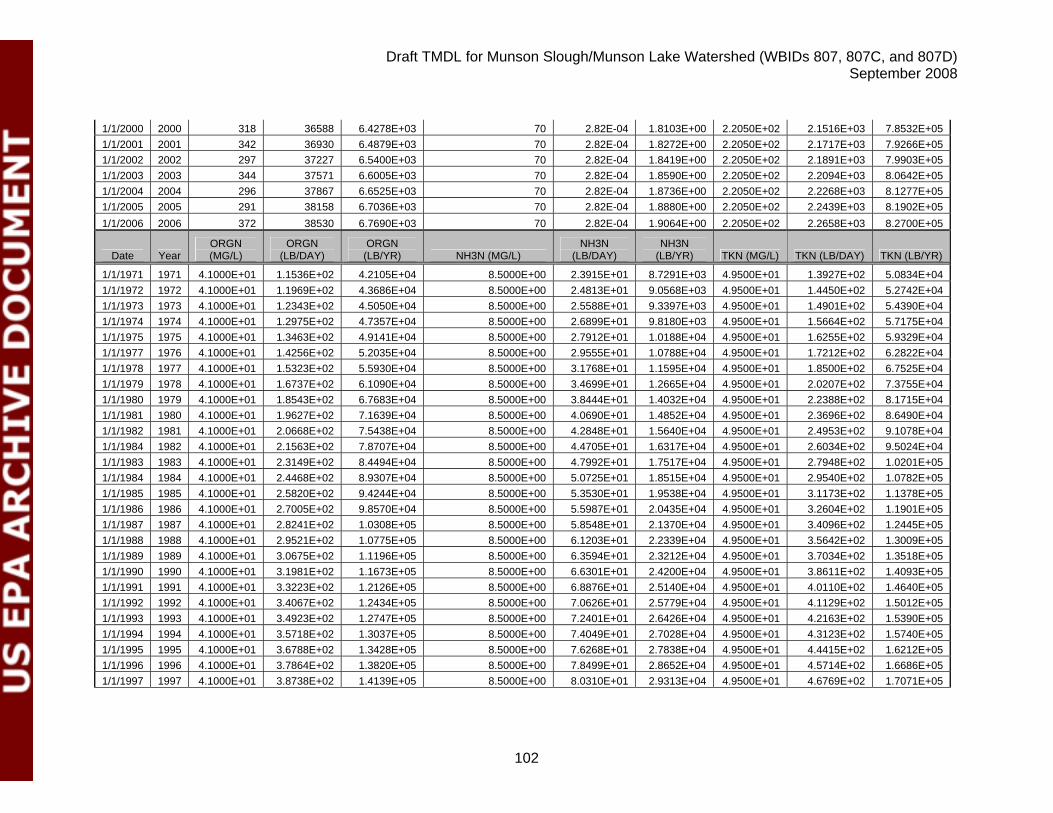
Draft TMDL for Munson Slough/Munson Lake Watershed (WBIDs 807, 807C, and 807D) September 2008
102
1/1/2000 2000 318 36588 6.4278E+03 70 2.82E-04 1.8103E+00 2.2050E+02 2.1516E+03 7.8532E+05 1/1/2001 2001 342 36930 6.4879E+03 70 2.82E-04 1.8272E+00 2.2050E+02 2.1717E+03 7.9266E+05 1/1/2002 2002 297 37227 6.5400E+03 70 2.82E-04 1.8419E+00 2.2050E+02 2.1891E+03 7.9903E+05 1/1/2003 2003 344 37571 6.6005E+03 70 2.82E-04 1.8590E+00 2.2050E+02 2.2094E+03 8.0642E+05 1/1/2004 2004 296 37867 6.6525E+03 70 2.82E-04 1.8736E+00 2.2050E+02 2.2268E+03 8.1277E+05 1/1/2005 2005 291 38158 6.7036E+03 70 2.82E-04 1.8880E+00 2.2050E+02 2.2439E+03 8.1902E+05 1/1/2006 2006 372 38530 6.7690E+03 70 2.82E-04 1.9064E+00 2.2050E+02 2.2658E+03 8.2700E+05
Date Year ORGN (MG/L)
ORGN (LB/DAY)
ORGN (LB/YR) NH3N (MG/L)
NH3N (LB/DAY)
NH3N (LB/YR) TKN (MG/L) TKN (LB/DAY) TKN (LB/YR)
1/1/1971 1971 4.1000E+01 1.1536E+02 4.2105E+04 8.5000E+00 2.3915E+01 8.7291E+03 4.9500E+01 1.3927E+02 5.0834E+04 1/1/1972 1972 4.1000E+01 1.1969E+02 4.3686E+04 8.5000E+00 2.4813E+01 9.0568E+03 4.9500E+01 1.4450E+02 5.2742E+04 1/1/1973 1973 4.1000E+01 1.2343E+02 4.5050E+04 8.5000E+00 2.5588E+01 9.3397E+03 4.9500E+01 1.4901E+02 5.4390E+04 1/1/1974 1974 4.1000E+01 1.2975E+02 4.7357E+04 8.5000E+00 2.6899E+01 9.8180E+03 4.9500E+01 1.5664E+02 5.7175E+04 1/1/1975 1975 4.1000E+01 1.3463E+02 4.9141E+04 8.5000E+00 2.7912E+01 1.0188E+04 4.9500E+01 1.6255E+02 5.9329E+04 1/1/1977 1976 4.1000E+01 1.4256E+02 5.2035E+04 8.5000E+00 2.9555E+01 1.0788E+04 4.9500E+01 1.7212E+02 6.2822E+04 1/1/1978 1977 4.1000E+01 1.5323E+02 5.5930E+04 8.5000E+00 3.1768E+01 1.1595E+04 4.9500E+01 1.8500E+02 6.7525E+04 1/1/1979 1978 4.1000E+01 1.6737E+02 6.1090E+04 8.5000E+00 3.4699E+01 1.2665E+04 4.9500E+01 2.0207E+02 7.3755E+04 1/1/1980 1979 4.1000E+01 1.8543E+02 6.7683E+04 8.5000E+00 3.8444E+01 1.4032E+04 4.9500E+01 2.2388E+02 8.1715E+04 1/1/1981 1980 4.1000E+01 1.9627E+02 7.1639E+04 8.5000E+00 4.0690E+01 1.4852E+04 4.9500E+01 2.3696E+02 8.6490E+04 1/1/1982 1981 4.1000E+01 2.0668E+02 7.5438E+04 8.5000E+00 4.2848E+01 1.5640E+04 4.9500E+01 2.4953E+02 9.1078E+04 1/1/1984 1982 4.1000E+01 2.1563E+02 7.8707E+04 8.5000E+00 4.4705E+01 1.6317E+04 4.9500E+01 2.6034E+02 9.5024E+04 1/1/1983 1983 4.1000E+01 2.3149E+02 8.4494E+04 8.5000E+00 4.7992E+01 1.7517E+04 4.9500E+01 2.7948E+02 1.0201E+05 1/1/1984 1984 4.1000E+01 2.4468E+02 8.9307E+04 8.5000E+00 5.0725E+01 1.8515E+04 4.9500E+01 2.9540E+02 1.0782E+05 1/1/1985 1985 4.1000E+01 2.5820E+02 9.4244E+04 8.5000E+00 5.3530E+01 1.9538E+04 4.9500E+01 3.1173E+02 1.1378E+05 1/1/1986 1986 4.1000E+01 2.7005E+02 9.8570E+04 8.5000E+00 5.5987E+01 2.0435E+04 4.9500E+01 3.2604E+02 1.1901E+05 1/1/1987 1987 4.1000E+01 2.8241E+02 1.0308E+05 8.5000E+00 5.8548E+01 2.1370E+04 4.9500E+01 3.4096E+02 1.2445E+05 1/1/1988 1988 4.1000E+01 2.9521E+02 1.0775E+05 8.5000E+00 6.1203E+01 2.2339E+04 4.9500E+01 3.5642E+02 1.3009E+05 1/1/1989 1989 4.1000E+01 3.0675E+02 1.1196E+05 8.5000E+00 6.3594E+01 2.3212E+04 4.9500E+01 3.7034E+02 1.3518E+05 1/1/1990 1990 4.1000E+01 3.1981E+02 1.1673E+05 8.5000E+00 6.6301E+01 2.4200E+04 4.9500E+01 3.8611E+02 1.4093E+05 1/1/1991 1991 4.1000E+01 3.3223E+02 1.2126E+05 8.5000E+00 6.8876E+01 2.5140E+04 4.9500E+01 4.0110E+02 1.4640E+05 1/1/1992 1992 4.1000E+01 3.4067E+02 1.2434E+05 8.5000E+00 7.0626E+01 2.5779E+04 4.9500E+01 4.1129E+02 1.5012E+05 1/1/1993 1993 4.1000E+01 3.4923E+02 1.2747E+05 8.5000E+00 7.2401E+01 2.6426E+04 4.9500E+01 4.2163E+02 1.5390E+05 1/1/1994 1994 4.1000E+01 3.5718E+02 1.3037E+05 8.5000E+00 7.4049E+01 2.7028E+04 4.9500E+01 4.3123E+02 1.5740E+05 1/1/1995 1995 4.1000E+01 3.6788E+02 1.3428E+05 8.5000E+00 7.6268E+01 2.7838E+04 4.9500E+01 4.4415E+02 1.6212E+05 1/1/1996 1996 4.1000E+01 3.7864E+02 1.3820E+05 8.5000E+00 7.8499E+01 2.8652E+04 4.9500E+01 4.5714E+02 1.6686E+05 1/1/1997 1997 4.1000E+01 3.8738E+02 1.4139E+05 8.5000E+00 8.0310E+01 2.9313E+04 4.9500E+01 4.6769E+02 1.7071E+05
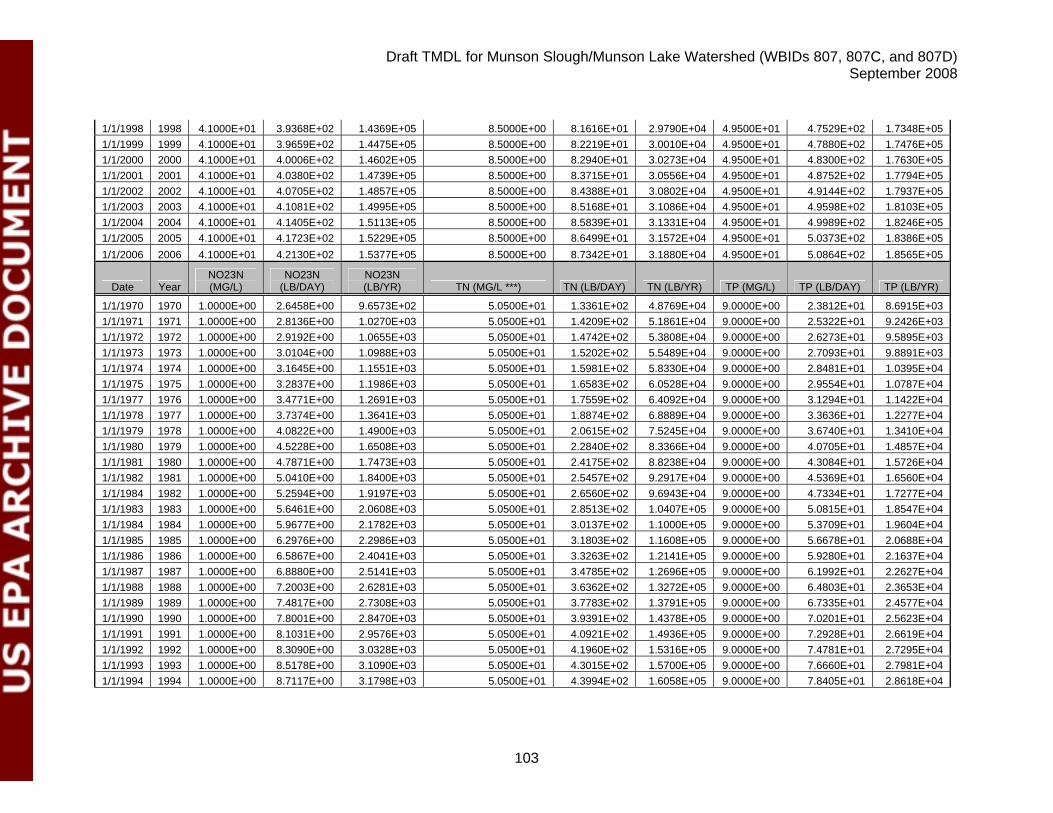
Draft TMDL for Munson Slough/Munson Lake Watershed (WBIDs 807, 807C, and 807D) September 2008
103
1/1/1998 1998 4.1000E+01 3.9368E+02 1.4369E+05 8.5000E+00 8.1616E+01 2.9790E+04 4.9500E+01 4.7529E+02 1.7348E+05 1/1/1999 1999 4.1000E+01 3.9659E+02 1.4475E+05 8.5000E+00 8.2219E+01 3.0010E+04 4.9500E+01 4.7880E+02 1.7476E+05 1/1/2000 2000 4.1000E+01 4.0006E+02 1.4602E+05 8.5000E+00 8.2940E+01 3.0273E+04 4.9500E+01 4.8300E+02 1.7630E+05 1/1/2001 2001 4.1000E+01 4.0380E+02 1.4739E+05 8.5000E+00 8.3715E+01 3.0556E+04 4.9500E+01 4.8752E+02 1.7794E+05 1/1/2002 2002 4.1000E+01 4.0705E+02 1.4857E+05 8.5000E+00 8.4388E+01 3.0802E+04 4.9500E+01 4.9144E+02 1.7937E+05 1/1/2003 2003 4.1000E+01 4.1081E+02 1.4995E+05 8.5000E+00 8.5168E+01 3.1086E+04 4.9500E+01 4.9598E+02 1.8103E+05 1/1/2004 2004 4.1000E+01 4.1405E+02 1.5113E+05 8.5000E+00 8.5839E+01 3.1331E+04 4.9500E+01 4.9989E+02 1.8246E+05 1/1/2005 2005 4.1000E+01 4.1723E+02 1.5229E+05 8.5000E+00 8.6499E+01 3.1572E+04 4.9500E+01 5.0373E+02 1.8386E+05 1/1/2006 2006 4.1000E+01 4.2130E+02 1.5377E+05 8.5000E+00 8.7342E+01 3.1880E+04 4.9500E+01 5.0864E+02 1.8565E+05
Date Year NO23N (MG/L)
NO23N (LB/DAY)
NO23N (LB/YR) TN (MG/L ***) TN (LB/DAY) TN (LB/YR) TP (MG/L) TP (LB/DAY) TP (LB/YR)
1/1/1970 1970 1.0000E+00 2.6458E+00 9.6573E+02 5.0500E+01 1.3361E+02 4.8769E+04 9.0000E+00 2.3812E+01 8.6915E+03 1/1/1971 1971 1.0000E+00 2.8136E+00 1.0270E+03 5.0500E+01 1.4209E+02 5.1861E+04 9.0000E+00 2.5322E+01 9.2426E+03 1/1/1972 1972 1.0000E+00 2.9192E+00 1.0655E+03 5.0500E+01 1.4742E+02 5.3808E+04 9.0000E+00 2.6273E+01 9.5895E+03 1/1/1973 1973 1.0000E+00 3.0104E+00 1.0988E+03 5.0500E+01 1.5202E+02 5.5489E+04 9.0000E+00 2.7093E+01 9.8891E+03 1/1/1974 1974 1.0000E+00 3.1645E+00 1.1551E+03 5.0500E+01 1.5981E+02 5.8330E+04 9.0000E+00 2.8481E+01 1.0395E+04 1/1/1975 1975 1.0000E+00 3.2837E+00 1.1986E+03 5.0500E+01 1.6583E+02 6.0528E+04 9.0000E+00 2.9554E+01 1.0787E+04 1/1/1977 1976 1.0000E+00 3.4771E+00 1.2691E+03 5.0500E+01 1.7559E+02 6.4092E+04 9.0000E+00 3.1294E+01 1.1422E+04 1/1/1978 1977 1.0000E+00 3.7374E+00 1.3641E+03 5.0500E+01 1.8874E+02 6.8889E+04 9.0000E+00 3.3636E+01 1.2277E+04 1/1/1979 1978 1.0000E+00 4.0822E+00 1.4900E+03 5.0500E+01 2.0615E+02 7.5245E+04 9.0000E+00 3.6740E+01 1.3410E+04 1/1/1980 1979 1.0000E+00 4.5228E+00 1.6508E+03 5.0500E+01 2.2840E+02 8.3366E+04 9.0000E+00 4.0705E+01 1.4857E+04 1/1/1981 1980 1.0000E+00 4.7871E+00 1.7473E+03 5.0500E+01 2.4175E+02 8.8238E+04 9.0000E+00 4.3084E+01 1.5726E+04 1/1/1982 1981 1.0000E+00 5.0410E+00 1.8400E+03 5.0500E+01 2.5457E+02 9.2917E+04 9.0000E+00 4.5369E+01 1.6560E+04 1/1/1984 1982 1.0000E+00 5.2594E+00 1.9197E+03 5.0500E+01 2.6560E+02 9.6943E+04 9.0000E+00 4.7334E+01 1.7277E+04 1/1/1983 1983 1.0000E+00 5.6461E+00 2.0608E+03 5.0500E+01 2.8513E+02 1.0407E+05 9.0000E+00 5.0815E+01 1.8547E+04 1/1/1984 1984 1.0000E+00 5.9677E+00 2.1782E+03 5.0500E+01 3.0137E+02 1.1000E+05 9.0000E+00 5.3709E+01 1.9604E+04 1/1/1985 1985 1.0000E+00 6.2976E+00 2.2986E+03 5.0500E+01 3.1803E+02 1.1608E+05 9.0000E+00 5.6678E+01 2.0688E+04 1/1/1986 1986 1.0000E+00 6.5867E+00 2.4041E+03 5.0500E+01 3.3263E+02 1.2141E+05 9.0000E+00 5.9280E+01 2.1637E+04 1/1/1987 1987 1.0000E+00 6.8880E+00 2.5141E+03 5.0500E+01 3.4785E+02 1.2696E+05 9.0000E+00 6.1992E+01 2.2627E+04 1/1/1988 1988 1.0000E+00 7.2003E+00 2.6281E+03 5.0500E+01 3.6362E+02 1.3272E+05 9.0000E+00 6.4803E+01 2.3653E+04 1/1/1989 1989 1.0000E+00 7.4817E+00 2.7308E+03 5.0500E+01 3.7783E+02 1.3791E+05 9.0000E+00 6.7335E+01 2.4577E+04 1/1/1990 1990 1.0000E+00 7.8001E+00 2.8470E+03 5.0500E+01 3.9391E+02 1.4378E+05 9.0000E+00 7.0201E+01 2.5623E+04 1/1/1991 1991 1.0000E+00 8.1031E+00 2.9576E+03 5.0500E+01 4.0921E+02 1.4936E+05 9.0000E+00 7.2928E+01 2.6619E+04 1/1/1992 1992 1.0000E+00 8.3090E+00 3.0328E+03 5.0500E+01 4.1960E+02 1.5316E+05 9.0000E+00 7.4781E+01 2.7295E+04 1/1/1993 1993 1.0000E+00 8.5178E+00 3.1090E+03 5.0500E+01 4.3015E+02 1.5700E+05 9.0000E+00 7.6660E+01 2.7981E+04 1/1/1994 1994 1.0000E+00 8.7117E+00 3.1798E+03 5.0500E+01 4.3994E+02 1.6058E+05 9.0000E+00 7.8405E+01 2.8618E+04
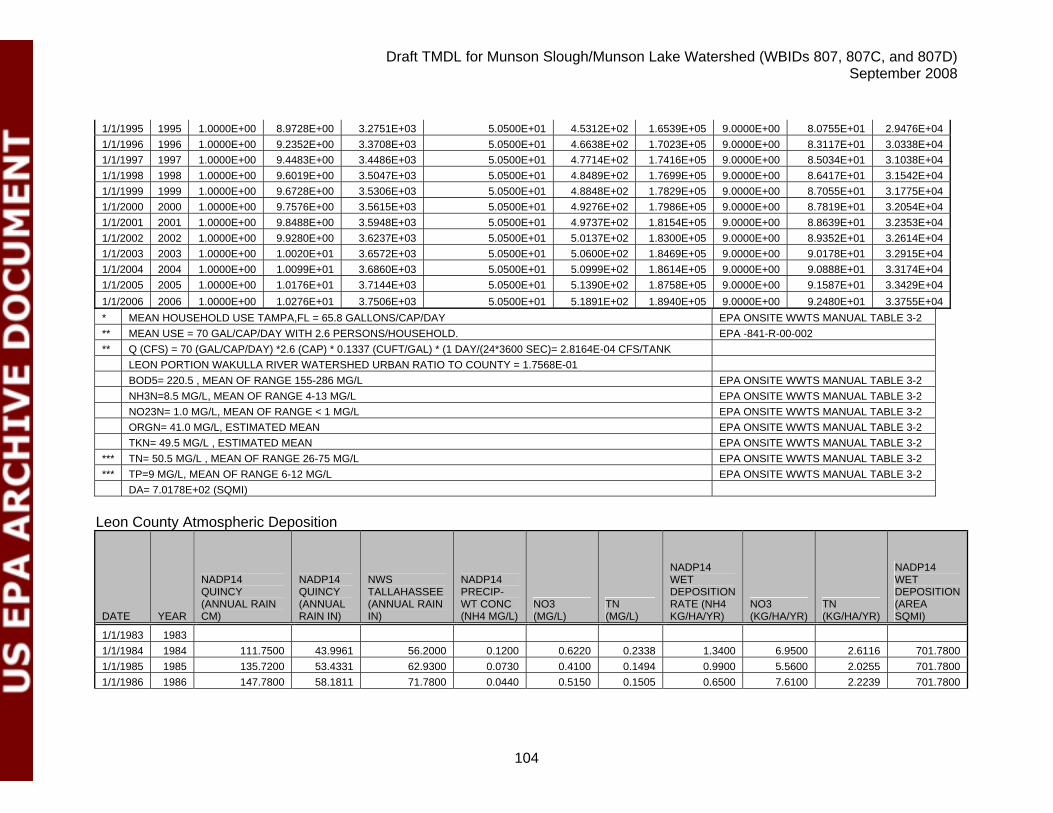
Draft TMDL for Munson Slough/Munson Lake Watershed (WBIDs 807, 807C, and 807D) September 2008
104
1/1/1995 1995 1.0000E+00 8.9728E+00 3.2751E+03 5.0500E+01 4.5312E+02 1.6539E+05 9.0000E+00 8.0755E+01 2.9476E+04 1/1/1996 1996 1.0000E+00 9.2352E+00 3.3708E+03 5.0500E+01 4.6638E+02 1.7023E+05 9.0000E+00 8.3117E+01 3.0338E+04 1/1/1997 1997 1.0000E+00 9.4483E+00 3.4486E+03 5.0500E+01 4.7714E+02 1.7416E+05 9.0000E+00 8.5034E+01 3.1038E+04 1/1/1998 1998 1.0000E+00 9.6019E+00 3.5047E+03 5.0500E+01 4.8489E+02 1.7699E+05 9.0000E+00 8.6417E+01 3.1542E+04 1/1/1999 1999 1.0000E+00 9.6728E+00 3.5306E+03 5.0500E+01 4.8848E+02 1.7829E+05 9.0000E+00 8.7055E+01 3.1775E+04 1/1/2000 2000 1.0000E+00 9.7576E+00 3.5615E+03 5.0500E+01 4.9276E+02 1.7986E+05 9.0000E+00 8.7819E+01 3.2054E+04 1/1/2001 2001 1.0000E+00 9.8488E+00 3.5948E+03 5.0500E+01 4.9737E+02 1.8154E+05 9.0000E+00 8.8639E+01 3.2353E+04 1/1/2002 2002 1.0000E+00 9.9280E+00 3.6237E+03 5.0500E+01 5.0137E+02 1.8300E+05 9.0000E+00 8.9352E+01 3.2614E+04 1/1/2003 2003 1.0000E+00 1.0020E+01 3.6572E+03 5.0500E+01 5.0600E+02 1.8469E+05 9.0000E+00 9.0178E+01 3.2915E+04 1/1/2004 2004 1.0000E+00 1.0099E+01 3.6860E+03 5.0500E+01 5.0999E+02 1.8614E+05 9.0000E+00 9.0888E+01 3.3174E+04 1/1/2005 2005 1.0000E+00 1.0176E+01 3.7144E+03 5.0500E+01 5.1390E+02 1.8758E+05 9.0000E+00 9.1587E+01 3.3429E+04 1/1/2006 2006 1.0000E+00 1.0276E+01 3.7506E+03 5.0500E+01 5.1891E+02 1.8940E+05 9.0000E+00 9.2480E+01 3.3755E+04 * MEAN HOUSEHOLD USE TAMPA,FL = 65.8 GALLONS/CAP/DAY EPA ONSITE WWTS MANUAL TABLE 3-2 ** MEAN USE = 70 GAL/CAP/DAY WITH 2.6 PERSONS/HOUSEHOLD. EPA -841-R-00-002 ** Q (CFS) = 70 (GAL/CAP/DAY) *2.6 (CAP) * 0.1337 (CUFT/GAL) * (1 DAY/(24*3600 SEC)= 2.8164E-04 CFS/TANK LEON PORTION WAKULLA RIVER WATERSHED URBAN RATIO TO COUNTY = 1.7568E-01 BOD5= 220.5 , MEAN OF RANGE 155-286 MG/L EPA ONSITE WWTS MANUAL TABLE 3-2 NH3N=8.5 MG/L, MEAN OF RANGE 4-13 MG/L EPA ONSITE WWTS MANUAL TABLE 3-2 NO23N= 1.0 MG/L, MEAN OF RANGE < 1 MG/L EPA ONSITE WWTS MANUAL TABLE 3-2 ORGN= 41.0 MG/L, ESTIMATED MEAN EPA ONSITE WWTS MANUAL TABLE 3-2 TKN= 49.5 MG/L , ESTIMATED MEAN EPA ONSITE WWTS MANUAL TABLE 3-2 *** TN= 50.5 MG/L , MEAN OF RANGE 26-75 MG/L EPA ONSITE WWTS MANUAL TABLE 3-2 *** TP=9 MG/L, MEAN OF RANGE 6-12 MG/L EPA ONSITE WWTS MANUAL TABLE 3-2 DA= 7.0178E+02 (SQMI)
Leon County Atmospheric Deposition
DATE YEAR
NADP14 QUINCY (ANNUAL RAIN CM)
NADP14 QUINCY (ANNUAL RAIN IN)
NWS TALLAHASSEE (ANNUAL RAIN IN)
NADP14 PRECIP-WT CONC (NH4 MG/L)
NO3 (MG/L)
TN (MG/L)
NADP14 WET DEPOSITION RATE (NH4 KG/HA/YR)
NO3 (KG/HA/YR)
TN (KG/HA/YR)
NADP14 WET DEPOSITION (AREA SQMI)
1/1/1983 1983 1/1/1984 1984 111.7500 43.9961 56.2000 0.1200 0.6220 0.2338 1.3400 6.9500 2.6116 701.7800 1/1/1985 1985 135.7200 53.4331 62.9300 0.0730 0.4100 0.1494 0.9900 5.5600 2.0255 701.7800 1/1/1986 1986 147.7800 58.1811 71.7800 0.0440 0.5150 0.1505 0.6500 7.6100 2.2239 701.7800
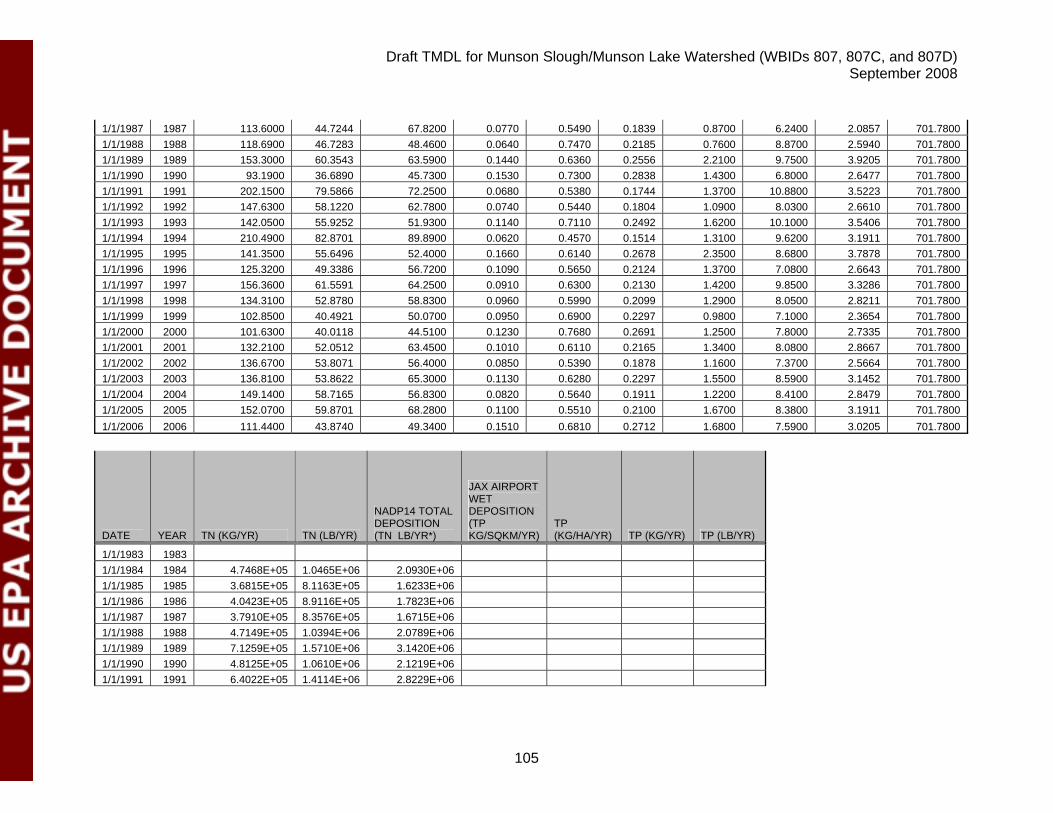
Draft TMDL for Munson Slough/Munson Lake Watershed (WBIDs 807, 807C, and 807D) September 2008
105
1/1/1987 1987 113.6000 44.7244 67.8200 0.0770 0.5490 0.1839 0.8700 6.2400 2.0857 701.7800 1/1/1988 1988 118.6900 46.7283 48.4600 0.0640 0.7470 0.2185 0.7600 8.8700 2.5940 701.7800 1/1/1989 1989 153.3000 60.3543 63.5900 0.1440 0.6360 0.2556 2.2100 9.7500 3.9205 701.7800 1/1/1990 1990 93.1900 36.6890 45.7300 0.1530 0.7300 0.2838 1.4300 6.8000 2.6477 701.7800 1/1/1991 1991 202.1500 79.5866 72.2500 0.0680 0.5380 0.1744 1.3700 10.8800 3.5223 701.7800 1/1/1992 1992 147.6300 58.1220 62.7800 0.0740 0.5440 0.1804 1.0900 8.0300 2.6610 701.7800 1/1/1993 1993 142.0500 55.9252 51.9300 0.1140 0.7110 0.2492 1.6200 10.1000 3.5406 701.7800 1/1/1994 1994 210.4900 82.8701 89.8900 0.0620 0.4570 0.1514 1.3100 9.6200 3.1911 701.7800 1/1/1995 1995 141.3500 55.6496 52.4000 0.1660 0.6140 0.2678 2.3500 8.6800 3.7878 701.7800 1/1/1996 1996 125.3200 49.3386 56.7200 0.1090 0.5650 0.2124 1.3700 7.0800 2.6643 701.7800 1/1/1997 1997 156.3600 61.5591 64.2500 0.0910 0.6300 0.2130 1.4200 9.8500 3.3286 701.7800 1/1/1998 1998 134.3100 52.8780 58.8300 0.0960 0.5990 0.2099 1.2900 8.0500 2.8211 701.7800 1/1/1999 1999 102.8500 40.4921 50.0700 0.0950 0.6900 0.2297 0.9800 7.1000 2.3654 701.7800 1/1/2000 2000 101.6300 40.0118 44.5100 0.1230 0.7680 0.2691 1.2500 7.8000 2.7335 701.7800 1/1/2001 2001 132.2100 52.0512 63.4500 0.1010 0.6110 0.2165 1.3400 8.0800 2.8667 701.7800 1/1/2002 2002 136.6700 53.8071 56.4000 0.0850 0.5390 0.1878 1.1600 7.3700 2.5664 701.7800 1/1/2003 2003 136.8100 53.8622 65.3000 0.1130 0.6280 0.2297 1.5500 8.5900 3.1452 701.7800 1/1/2004 2004 149.1400 58.7165 56.8300 0.0820 0.5640 0.1911 1.2200 8.4100 2.8479 701.7800 1/1/2005 2005 152.0700 59.8701 68.2800 0.1100 0.5510 0.2100 1.6700 8.3800 3.1911 701.7800 1/1/2006 2006 111.4400 43.8740 49.3400 0.1510 0.6810 0.2712 1.6800 7.5900 3.0205 701.7800
DATE YEAR TN (KG/YR) TN (LB/YR)
NADP14 TOTAL DEPOSITION (TN LB/YR*)
JAX AIRPORT WET DEPOSITION (TP KG/SQKM/YR)
TP (KG/HA/YR) TP (KG/YR) TP (LB/YR)
1/1/1983 1983 1/1/1984 1984 4.7468E+05 1.0465E+06 2.0930E+06 1/1/1985 1985 3.6815E+05 8.1163E+05 1.6233E+06 1/1/1986 1986 4.0423E+05 8.9116E+05 1.7823E+06 1/1/1987 1987 3.7910E+05 8.3576E+05 1.6715E+06 1/1/1988 1988 4.7149E+05 1.0394E+06 2.0789E+06 1/1/1989 1989 7.1259E+05 1.5710E+06 3.1420E+06 1/1/1990 1990 4.8125E+05 1.0610E+06 2.1219E+06 1/1/1991 1991 6.4022E+05 1.4114E+06 2.8229E+06
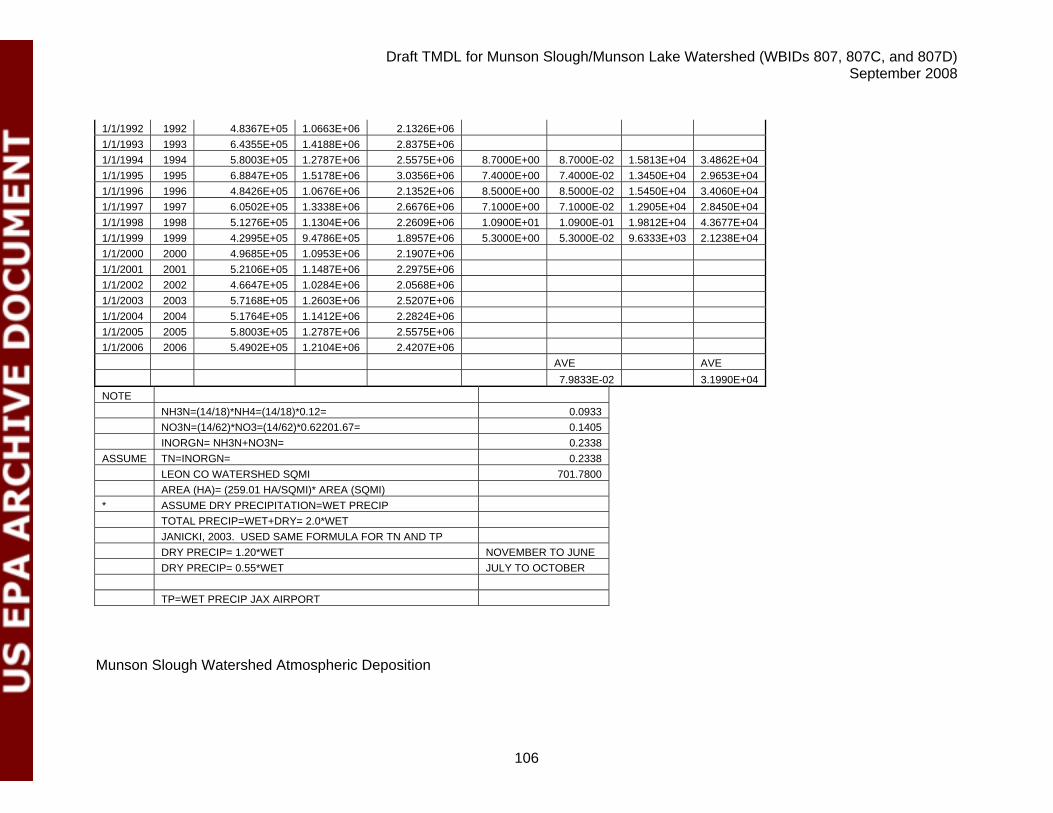
Draft TMDL for Munson Slough/Munson Lake Watershed (WBIDs 807, 807C, and 807D) September 2008
106
1/1/1992 1992 4.8367E+05 1.0663E+06 2.1326E+06 1/1/1993 1993 6.4355E+05 1.4188E+06 2.8375E+06 1/1/1994 1994 5.8003E+05 1.2787E+06 2.5575E+06 8.7000E+00 8.7000E-02 1.5813E+04 3.4862E+04 1/1/1995 1995 6.8847E+05 1.5178E+06 3.0356E+06 7.4000E+00 7.4000E-02 1.3450E+04 2.9653E+04 1/1/1996 1996 4.8426E+05 1.0676E+06 2.1352E+06 8.5000E+00 8.5000E-02 1.5450E+04 3.4060E+04 1/1/1997 1997 6.0502E+05 1.3338E+06 2.6676E+06 7.1000E+00 7.1000E-02 1.2905E+04 2.8450E+04 1/1/1998 1998 5.1276E+05 1.1304E+06 2.2609E+06 1.0900E+01 1.0900E-01 1.9812E+04 4.3677E+04 1/1/1999 1999 4.2995E+05 9.4786E+05 1.8957E+06 5.3000E+00 5.3000E-02 9.6333E+03 2.1238E+04 1/1/2000 2000 4.9685E+05 1.0953E+06 2.1907E+06 1/1/2001 2001 5.2106E+05 1.1487E+06 2.2975E+06 1/1/2002 2002 4.6647E+05 1.0284E+06 2.0568E+06 1/1/2003 2003 5.7168E+05 1.2603E+06 2.5207E+06 1/1/2004 2004 5.1764E+05 1.1412E+06 2.2824E+06 1/1/2005 2005 5.8003E+05 1.2787E+06 2.5575E+06 1/1/2006 2006 5.4902E+05 1.2104E+06 2.4207E+06 AVE AVE 7.9833E-02 3.1990E+04 NOTE NH3N=(14/18)*NH4=(14/18)*0.12= 0.0933 NO3N=(14/62)*NO3=(14/62)*0.62201.67= 0.1405 INORGN= NH3N+NO3N= 0.2338 ASSUME TN=INORGN= 0.2338 LEON CO WATERSHED SQMI 701.7800 AREA (HA)= (259.01 HA/SQMI)* AREA (SQMI) * ASSUME DRY PRECIPITATION=WET PRECIP TOTAL PRECIP=WET+DRY= 2.0*WET JANICKI, 2003. USED SAME FORMULA FOR TN AND TP DRY PRECIP= 1.20*WET NOVEMBER TO JUNE DRY PRECIP= 0.55*WET JULY TO OCTOBER TP=WET PRECIP JAX AIRPORT
Munson Slough Watershed Atmospheric Deposition
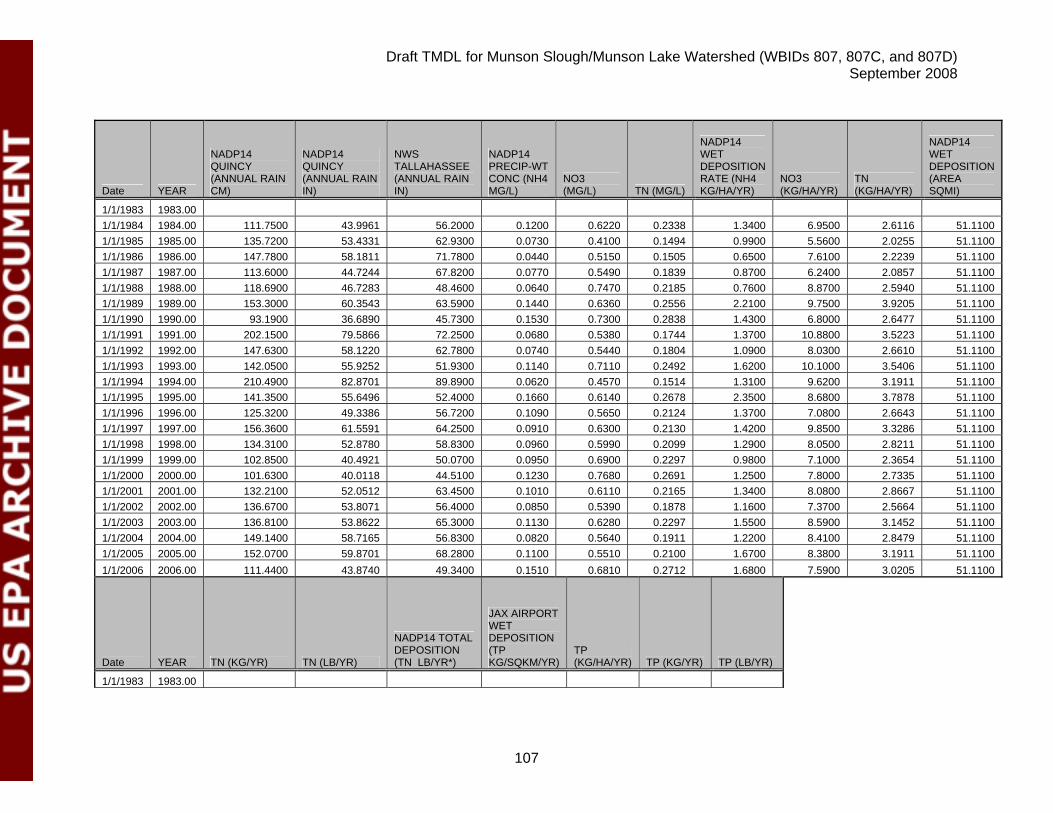
Draft TMDL for Munson Slough/Munson Lake Watershed (WBIDs 807, 807C, and 807D) September 2008
107
Date YEAR
NADP14 QUINCY (ANNUAL RAIN CM)
NADP14 QUINCY (ANNUAL RAIN IN)
NWS TALLAHASSEE (ANNUAL RAIN IN)
NADP14 PRECIP-WT CONC (NH4 MG/L)
NO3 (MG/L) TN (MG/L)
NADP14 WET DEPOSITION RATE (NH4 KG/HA/YR)
NO3 (KG/HA/YR)
TN (KG/HA/YR)
NADP14 WET DEPOSITION (AREA SQMI)
1/1/1983 1983.00 1/1/1984 1984.00 111.7500 43.9961 56.2000 0.1200 0.6220 0.2338 1.3400 6.9500 2.6116 51.1100 1/1/1985 1985.00 135.7200 53.4331 62.9300 0.0730 0.4100 0.1494 0.9900 5.5600 2.0255 51.1100 1/1/1986 1986.00 147.7800 58.1811 71.7800 0.0440 0.5150 0.1505 0.6500 7.6100 2.2239 51.1100 1/1/1987 1987.00 113.6000 44.7244 67.8200 0.0770 0.5490 0.1839 0.8700 6.2400 2.0857 51.1100 1/1/1988 1988.00 118.6900 46.7283 48.4600 0.0640 0.7470 0.2185 0.7600 8.8700 2.5940 51.1100 1/1/1989 1989.00 153.3000 60.3543 63.5900 0.1440 0.6360 0.2556 2.2100 9.7500 3.9205 51.1100 1/1/1990 1990.00 93.1900 36.6890 45.7300 0.1530 0.7300 0.2838 1.4300 6.8000 2.6477 51.1100 1/1/1991 1991.00 202.1500 79.5866 72.2500 0.0680 0.5380 0.1744 1.3700 10.8800 3.5223 51.1100 1/1/1992 1992.00 147.6300 58.1220 62.7800 0.0740 0.5440 0.1804 1.0900 8.0300 2.6610 51.1100 1/1/1993 1993.00 142.0500 55.9252 51.9300 0.1140 0.7110 0.2492 1.6200 10.1000 3.5406 51.1100 1/1/1994 1994.00 210.4900 82.8701 89.8900 0.0620 0.4570 0.1514 1.3100 9.6200 3.1911 51.1100 1/1/1995 1995.00 141.3500 55.6496 52.4000 0.1660 0.6140 0.2678 2.3500 8.6800 3.7878 51.1100 1/1/1996 1996.00 125.3200 49.3386 56.7200 0.1090 0.5650 0.2124 1.3700 7.0800 2.6643 51.1100 1/1/1997 1997.00 156.3600 61.5591 64.2500 0.0910 0.6300 0.2130 1.4200 9.8500 3.3286 51.1100 1/1/1998 1998.00 134.3100 52.8780 58.8300 0.0960 0.5990 0.2099 1.2900 8.0500 2.8211 51.1100 1/1/1999 1999.00 102.8500 40.4921 50.0700 0.0950 0.6900 0.2297 0.9800 7.1000 2.3654 51.1100 1/1/2000 2000.00 101.6300 40.0118 44.5100 0.1230 0.7680 0.2691 1.2500 7.8000 2.7335 51.1100 1/1/2001 2001.00 132.2100 52.0512 63.4500 0.1010 0.6110 0.2165 1.3400 8.0800 2.8667 51.1100 1/1/2002 2002.00 136.6700 53.8071 56.4000 0.0850 0.5390 0.1878 1.1600 7.3700 2.5664 51.1100 1/1/2003 2003.00 136.8100 53.8622 65.3000 0.1130 0.6280 0.2297 1.5500 8.5900 3.1452 51.1100 1/1/2004 2004.00 149.1400 58.7165 56.8300 0.0820 0.5640 0.1911 1.2200 8.4100 2.8479 51.1100 1/1/2005 2005.00 152.0700 59.8701 68.2800 0.1100 0.5510 0.2100 1.6700 8.3800 3.1911 51.1100 1/1/2006 2006.00 111.4400 43.8740 49.3400 0.1510 0.6810 0.2712 1.6800 7.5900 3.0205 51.1100
Date YEAR TN (KG/YR) TN (LB/YR)
NADP14 TOTAL DEPOSITION (TN LB/YR*)
JAX AIRPORT WET DEPOSITION (TP KG/SQKM/YR)
TP (KG/HA/YR) TP (KG/YR) TP (LB/YR)
1/1/1983 1983.00
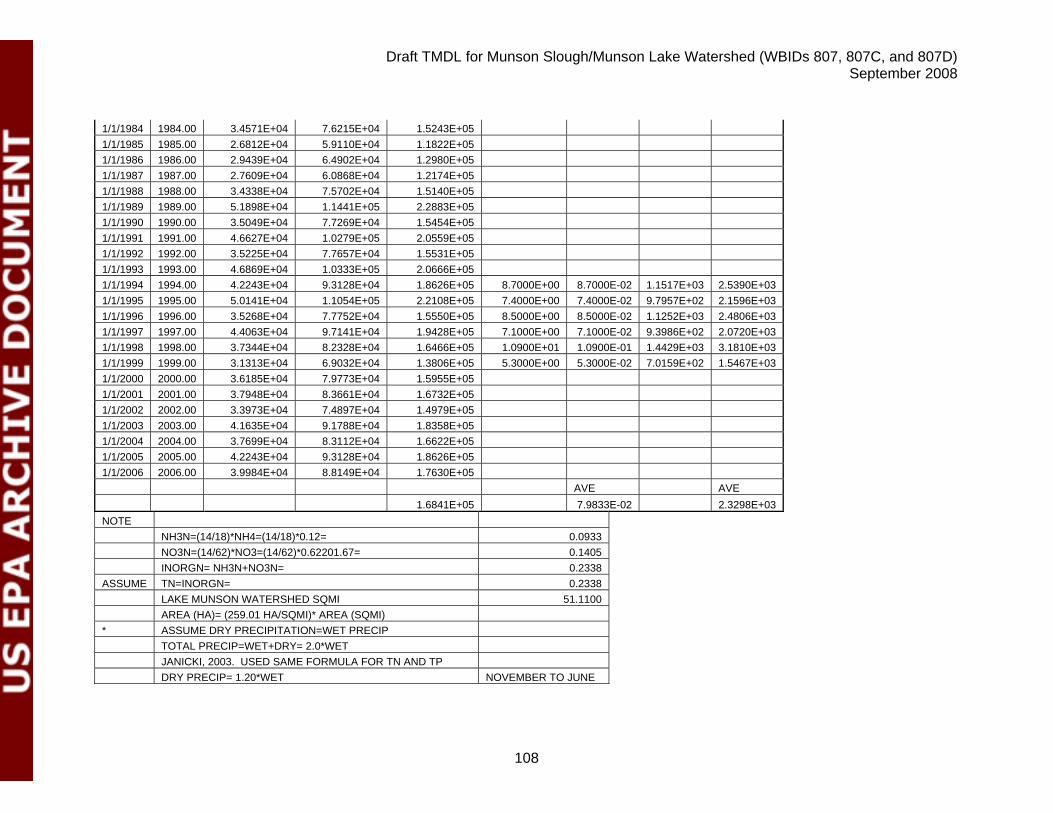
Draft TMDL for Munson Slough/Munson Lake Watershed (WBIDs 807, 807C, and 807D) September 2008
108
1/1/1984 1984.00 3.4571E+04 7.6215E+04 1.5243E+05 1/1/1985 1985.00 2.6812E+04 5.9110E+04 1.1822E+05 1/1/1986 1986.00 2.9439E+04 6.4902E+04 1.2980E+05 1/1/1987 1987.00 2.7609E+04 6.0868E+04 1.2174E+05 1/1/1988 1988.00 3.4338E+04 7.5702E+04 1.5140E+05 1/1/1989 1989.00 5.1898E+04 1.1441E+05 2.2883E+05 1/1/1990 1990.00 3.5049E+04 7.7269E+04 1.5454E+05 1/1/1991 1991.00 4.6627E+04 1.0279E+05 2.0559E+05 1/1/1992 1992.00 3.5225E+04 7.7657E+04 1.5531E+05 1/1/1993 1993.00 4.6869E+04 1.0333E+05 2.0666E+05 1/1/1994 1994.00 4.2243E+04 9.3128E+04 1.8626E+05 8.7000E+00 8.7000E-02 1.1517E+03 2.5390E+03 1/1/1995 1995.00 5.0141E+04 1.1054E+05 2.2108E+05 7.4000E+00 7.4000E-02 9.7957E+02 2.1596E+03 1/1/1996 1996.00 3.5268E+04 7.7752E+04 1.5550E+05 8.5000E+00 8.5000E-02 1.1252E+03 2.4806E+03 1/1/1997 1997.00 4.4063E+04 9.7141E+04 1.9428E+05 7.1000E+00 7.1000E-02 9.3986E+02 2.0720E+03 1/1/1998 1998.00 3.7344E+04 8.2328E+04 1.6466E+05 1.0900E+01 1.0900E-01 1.4429E+03 3.1810E+03 1/1/1999 1999.00 3.1313E+04 6.9032E+04 1.3806E+05 5.3000E+00 5.3000E-02 7.0159E+02 1.5467E+03 1/1/2000 2000.00 3.6185E+04 7.9773E+04 1.5955E+05 1/1/2001 2001.00 3.7948E+04 8.3661E+04 1.6732E+05 1/1/2002 2002.00 3.3973E+04 7.4897E+04 1.4979E+05 1/1/2003 2003.00 4.1635E+04 9.1788E+04 1.8358E+05 1/1/2004 2004.00 3.7699E+04 8.3112E+04 1.6622E+05 1/1/2005 2005.00 4.2243E+04 9.3128E+04 1.8626E+05 1/1/2006 2006.00 3.9984E+04 8.8149E+04 1.7630E+05 AVE AVE 1.6841E+05 7.9833E-02 2.3298E+03 NOTE NH3N=(14/18)*NH4=(14/18)*0.12= 0.0933 NO3N=(14/62)*NO3=(14/62)*0.62201.67= 0.1405 INORGN= NH3N+NO3N= 0.2338 ASSUME TN=INORGN= 0.2338 LAKE MUNSON WATERSHED SQMI 51.1100 AREA (HA)= (259.01 HA/SQMI)* AREA (SQMI) * ASSUME DRY PRECIPITATION=WET PRECIP TOTAL PRECIP=WET+DRY= 2.0*WET JANICKI, 2003. USED SAME FORMULA FOR TN AND TP DRY PRECIP= 1.20*WET NOVEMBER TO JUNE
Draft TMDL for Munson Slough/Munson Lake Watershed (WBIDs 807, 807C, and 807D) September 2008
109
DRY PRECIP= 0.55*WET JULY TO OCTOBER TP=WET PRECIP JAX AIRPORT
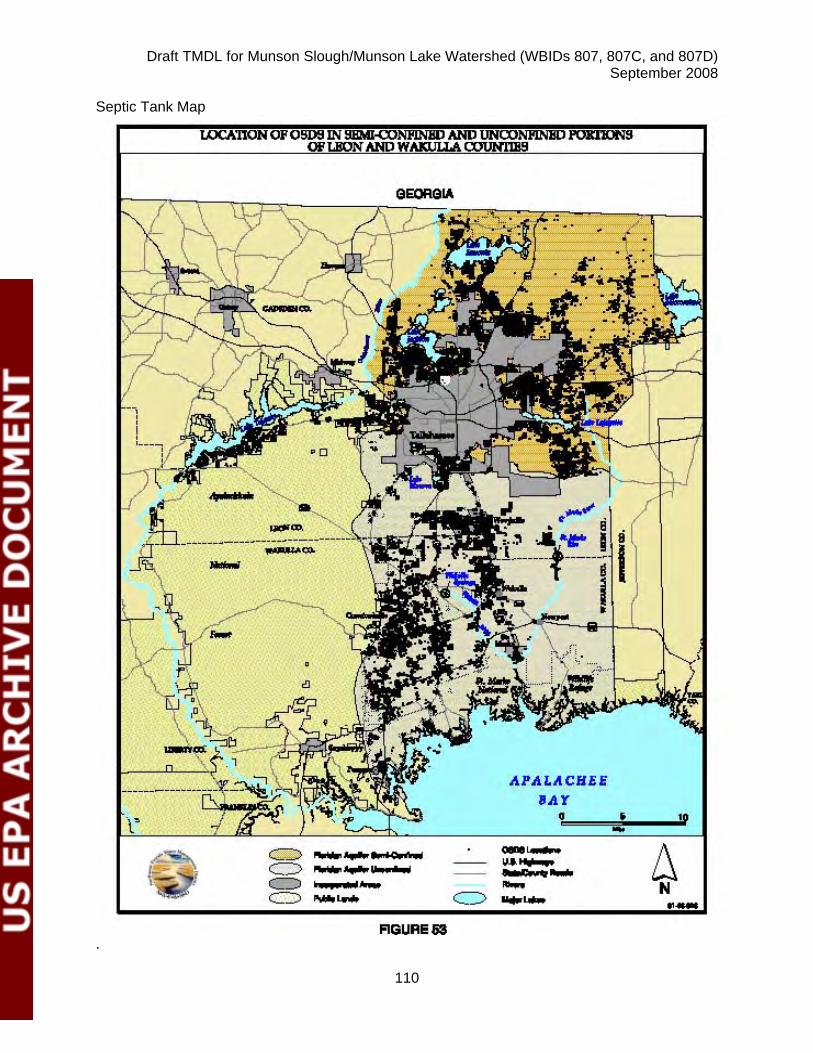
Draft TMDL for Munson Slough/Munson Lake Watershed (WBIDs 807, 807C, and 807D) September 2008
110
Septic Tank Map
.
Related Documents