Presented to: Erin O’Connor Minto Communities Inc. 180 Kent Street, Suite 200 Ottawa, Ontario K1P 0B6 August 17, 2012 Proposed Residential Development 352 Aquaview Drive Transportation Impact Brief

Welcome message from author
This document is posted to help you gain knowledge. Please leave a comment to let me know what you think about it! Share it to your friends and learn new things together.
Transcript

Presented to:
Erin O’Connor Minto Communities Inc.
180 Kent Street, Suite 200
Ottawa, Ontario
K1P 0B6
August 17, 2012
Proposed Residential Development
352 Aquaview Drive
Transportation Impact Brief

CASTLEGLENN CONSULTANTS LTD.
THIRD PARTY DISCLAIMER
This study has been prepared by CastleGlenn Consultants Inc. (“CGI”) for the
benefit of the Client to whom it is addressed. The information and data contained
herein represents CGI’s best professional judgment in light of the knowledge and
information available to CGI at the time of preparation. Except as required by law,
this study and the information and data contained herein are to be treated as
confidential and may be used and relied upon only by the Client, its officers and
employees. CGI denies any liability whatsoever to other parties who may obtain
access to this study for any injury, loss or damage suffered by such parties arising
from their use of, or reliance upon, this study or any of its contents without the
express written consent of CGI and the Client.

Proposed Residential Development – 352 Aquaview Drive Page i Transportation Impact Brief August, 2012
TABLE OF CONTENTS
1.0 INTRODUCTION...................................................................................................................................... 1
2.0 THE PROPOSED DEVELOPMENT........................................................................................................ 1
2.1 SITE ACCESS ...................................................................................................................................... 1
3.0 EXISTING CONDITIONS ........................................................................................................................ 3
3.1 GENERAL STUDY AREA ...................................................................................................................... 3 3.2 ROADWAY CONFIGURATION ............................................................................................................... 3 3.3 EXISTING TRAFFIC VOLUMES.............................................................................................................. 6 3.4 EXISTING LEVELS OF SERVICE ............................................................................................................ 7 3.5 CURRENT TRANSIT ACTIVITY.............................................................................................................. 9 3.6 CYCLING NETWORK ......................................................................................................................... 11 3.7 PEDESTRIAN ACTIVITY ..................................................................................................................... 12
4.0 FORECAST IMPACT OF DEVELOPMENT ........................................................................................ 13
4.1 SITE GENERATED TRIPS .................................................................................................................... 13 4.2 ANALYSIS AND EVALUATION ............................................................................................................ 14
5.0 TRANSPORTATION DEMAND MANAGEMENT (TDM) .................................................................. 16
6.0 FINDINGS ............................................................................................................................................... 16
6.1 HOW MUCH TRAFFIC WILL THE PROPOSED SITE GENERATE?.............................................................. 17 6.2 WHEN WILL THE PROPOSED SITE BE COMPLETED? ............................................................................. 17 6.3 WHAT ARE THE IMPACTS OF THE PROPOSED SITE? ............................................................................. 17 6.4 CONCLUSIONS & RECOMMENDATIONS .............................................................................................. 18
7.0 STUDY SIGN-OFF .................................................................................................................................. 18
APPENDIX MATERIAL
APPENDIX “A”: SITE PLAN AND TIB CHECKLIST ............................................................................................. A-1
APPENDIX “B”: CURRENT SIGNAL TIMING ...................................................................................................... B-1
APPENDIX “C”: INTERSECTION CAPACITY ANALYSIS (EXISTING 2012) ........................................................... C-1
APPENDIX “D”: CITY OF OTTAWA TRAFFIC COUNTS ....................................................................................... D-1
APPENDIX “E”: SITE GENERATED TRAFFIC VOLUMES .................................................................................... E-1
Proposed Residential Development – 352 Aquaview Drive Page -1-
Transportation Impact Brief August, 2012
1.0 INTRODUCTION
The purpose of this Transportation Impact Brief (TIB) is to investigate the traffic impacts
associated with a proposed residential development consisting of 12 apartment buildings
containing a total of 204 dwelling units to be located at 352 Aquaview Drive. The
proposed development is located along the east side of the Aquaview Drive corridor
immediately north of the Aquaview Drive/Brian Coburn Boulevard intersection. This
document is intended to comply with the City of Ottawa’s “Transportation Impact
Assessment Guidelines” (October 2006).
2.0 THE PROPOSED DEVELOPMENT
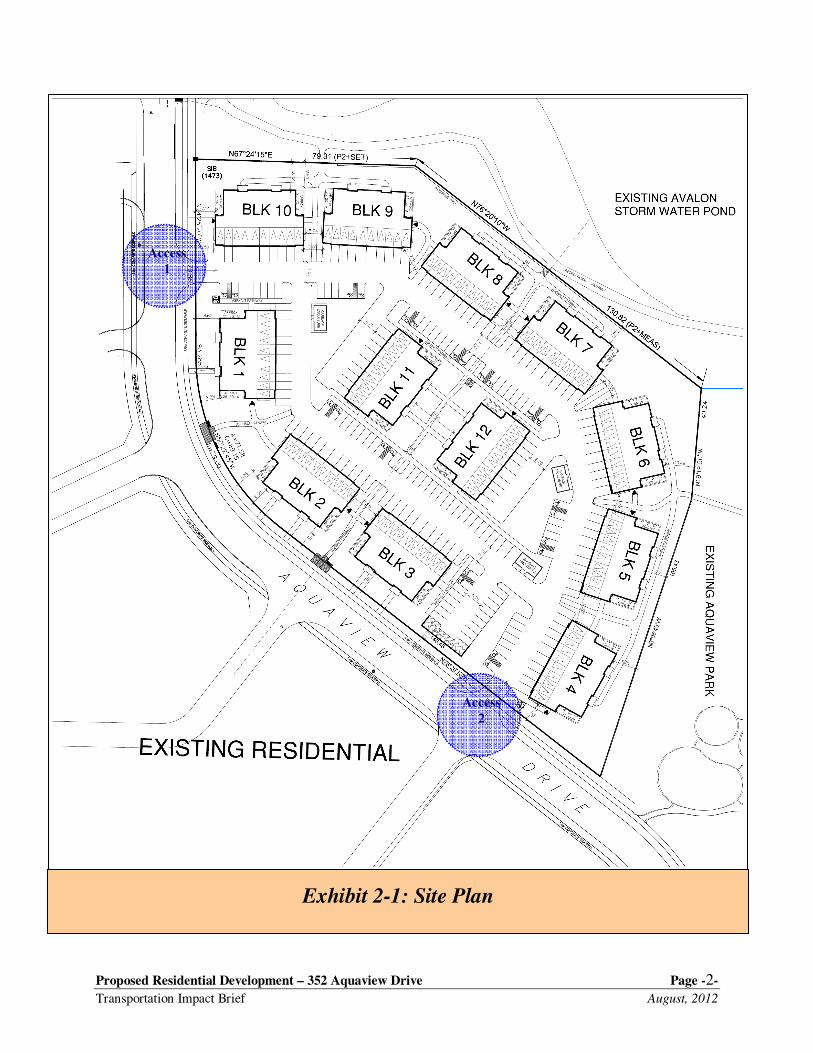
Exhibit 2-1 (See Appendix “A” for unedited site plan) contains the proposed site plan received by
CastleGlenn Consultants on August 16th, 2012. The site plan depicts:
• 12 ‘Gallery Suite’ apartment buildings containing 204 dwelling units. Each of the 12
buildings contains 17 dwelling units.
• A total of 346 parking stalls, consisting of:
• 240 at-grade tandem parking stalls (inclusive of 120 covered spaces) fronting each of the
12 buildings (20 per building assigned to 10 units in each building);
• 89 at-grade parking stalls (approx. 7-to-8 per building) assigned to 7 dwelling units in each
building;
• 17 at-grade visitor parking stalls; and
• 102 bicycle parking stalls are provided at a rate of 0.5 stalls-per-dwelling unit in
accordance with the Zoning By-Law.
It is the understanding of CastleGlenn that the proposed residential development is
anticipated for completion by the 2015 horizon year. The site is currently defined within
the City of Ottawa Zoning By-law as “DR” or Development Reserve Zone (Part 14 – City of
Ottawa Residential Zones sections 237-238).
2.1 SITE ACCESS
The site plan illustrates the access arrangement of the proposed development, which
would include two new accesses that would connect directly to Aquaview Drive.
• Access 1 is a two-way access located approximately 60 m south of Lakepointe
Drive; and
• Access 2 is a two-way access located opposite the southern limit of Louis Toscano
Drive.
Proposed Residential Development – 352 Aquaview Drive Page -2-
Transportation Impact Brief August, 2012
Exhibit 2-1: Site Plan
Access
1
Access
2

Proposed Residential Development – 352 Aquaview Drive Page -3-
Transportation Impact Brief August, 2012
3.0 EXISTING CONDITIONS
A site visit was undertaken on Wednesday March 7th, 2012 to record the current roadway
geometrics (roadway lane configuration, roadway width, driveway configuration, etc) within the
vicinity of the proposed site.
3.1 GENERAL STUDY AREA
Exhibit 3-1 depicts the general study area and the proposed site location. The study
area in general is characterized by residential land uses consisting largely of attached
townhouse type dwelling units. Other land uses within the vicinity of the study area
include:
• Shopper’s Drugmart: is located on the northeast quadrant of the Tenth Line Road/
Brian Coburn Boulevard intersection; and
• Aquaview Community Centre: is located on the east side of Aquaview Drive
immediately southeast of the proposed development.
Future Development Initiatives
A review of available information on existing development applications within the
study area would indicate the following proposed development initiatives…
• Future Ultramar Gas Station: is a commercial development to be located on the
northwest quadrant of the Tenth Line Road / Brian Coburn Boulevard
intersection. This development consists of a gas station with 10 fuelling
positions, a car wash and convenience store (drive through service included). This
development is described within the “Ultramar Tenth Line Road: Transportation
Impact Brief” (April 2010) obtained from the City of Ottawa website.
• Future Residential Development (2168 Tenth Line Rd): is to be located on the
west side of the Tenth Line Road corridor (See Exhibit 3-1) with access off of the
future west leg of the Tenth Line Road / Lakepointe Drive intersection. This
development consists of 449 townhouse/multi-unit residential dwellings as
described within the “Avalon West Stage-1 2168 Tenth Line Road Transportation
Impact Study” (August 16, 2010) obtained from the City of Ottawa’s website.
3.2 ROADWAY CONFIGURATION
Study Area Roadways
The City of Ottawa’s “Transportation Master Plan” (November 2008) outlines the
roadway classifications and operational characteristics of the supporting roadway
network. The following provides an overview of current study area roadways:

Proposed Residential Development – 352 Aquaview Drive Page -4-
Transportation Impact Brief August, 2012
Exhibit 3-1: Study Area
All-Way STOP-Control
Traffic Signal Control
Proposed Development
Shopper’s
Drugmart
Aquaview Community
Centre
Aquaview
Pond
Future Gas Station
Future Residential

Proposed Residential Development – 352 Aquaview Drive Page -5-
Transportation Impact Brief August, 2012
• Tenth Line Road is a north-south four-lane divided roadway (two lanes per-direction of
travel) and defined as an arterial roadway within the City of Ottawa’s
“Transportation Master Plan” (November 2008)1. Sidewalks, as well as delineated
bike lanes, exist along both the east and west sides of the corridor through the study
area. The posted speed limit on Tenth Line Road is 60 km/hr within the study area.
• Brian Coburn Boulevard is a two-lane (one-lane-per-direction-of travel) east-west local
roadway with a posted speed limit of 60 km/hr within the vicinity of Tenth Line
Road and 50 km/hr east of the Shopper’s Drugmart. The corridor currently extends
between Trim Road to the west and to just east of Tenth Line Road. This roadway is
proposed as an arterial corridor in the future when the corridor will extend from
Navan Road to Frank Kenny Road.
• Aquaview Drive is a two-lane (one-lane-per-direction-of-travel) north-south local
roadway between Lakepointe Drive and Brian Coburn Boulevard and a collector
roadway between Lakepointe Drive and Portobello Boulevard that provides access
to the residential community to the east of Tenth Line Road.
• Lakepointe Drive is a two-lane (one-lane-per-direction-of-travel) divided east-west
collector roadway that provides access to the residential community to the east of
Tenth Line Road.
Study Area Intersections
The following provides a summary of the current configurations/controls of
intersections within the study area:
• Tenth Line Road / Lakepointe Drive: This traffic signal controlled intersection is
characterized by the following lane configuration:
• Northbound Approach: Two dedicated through lanes, one left-turn lane (approx.
60 m storage, currently not in use) and a dedicated right-turn lane (storage lane = 60 m);
• Southbound Approach: Two dedicated through lanes, one left-turn lane (storage
lane = 60 m), one right-turn lane (storage lane = 80 m, currently not in use);
• Eastbound Approach: Currently not in use, however, will assume (for the
purposes of this analysis) one left-turn lane (storage lane = 80 m), one through lane and
one right-turn lane (storage lane = 50 m); and
• Westbound Approach: Currently there exists one right-turn lane and one left-
turn lane (storage = 50 m). However, upon the future completion of the Avalon
West Stage 1 development, a westbound through lane and a westbound right
turn lane will replace the current dedicated westbound right-turn lane.
• Tenth Line Road / Brian Coburn Boulevard: This traffic signal controlled
intersection is characterized by the following lane configuration:
• Northbound Approach: One dedicated through lane, one shared through/right-
turn lane and one left-turn lane (storage lane = 110 m);
• Southbound Approach: One dedicated through lane, one shared through/right-
turn lane and one left-turn lane (storage lane = 110 m);
1 “City of Ottawa Transportation Master Plan (Nov. 2008)”, Map 6

Proposed Residential Development – 352 Aquaview Drive Page -6-
Transportation Impact Brief August, 2012
• Eastbound Approach: One left-turn lane (storage lane = 50 m) and one shared
through/right-turn lane; and
• Westbound Approach: One left-turn lane (storage lane = 50 m), one through lane
and one channelized right-turn lane (storage lane = 50 m).
• Aquaview Drive / Lakepointe Drive: This intersection operates as a three-way
STOP-controlled “T-intersection”. The intersection is characterized by the
following lane configuration:
• Northbound Approach: One shared through/left-turn lane;
• Southbound Approach: One shared through/right-turn lane; and
• Eastbound Approach: One shared left/right-turn lane.
• Aquaview Drive / Brian Coburn Boulevard: This intersection operates as a four-
way STOP-controlled intersection. The intersection is characterized by the
following lane configuration:
• Northbound Approach: One shared left/through/right-turn lane;
• Southbound Approach: One shared left/through/right-turn lane;
• Eastbound Approach: One shared left/through/right-turn lane; and
• Westbound Approach: One shared left/through/right-turn lane.
Future Arterial Roadway Improvement Initiative
A review of the City of Ottawa’s Transportation Master Plan (Nov. 2008) indicates the
following proposed future infrastructure improvements within the greater study area:
• Brian Coburn Boulevard Extension: As part of the Mer Bleue community
development, the Brian Coburn Boulevard corridor is intended to be extended west
to Mer Bleue Road and east to Frank Kenny Road. Discussions with City of Ottawa
staff would indicate that this project is aimed for completion by the 2014 horizon
year, with Brian Coburn Boulevard configured initially as a 2-lane roadway then,
when warranted, widened to a 4-lane roadway at an unspecified time horizon.
• Bus Rapid Transit Corridor – East/West (Navan Road to Trim Road): As part of the
City of Ottawa’s Transportation Master Plan (Nov. 2008) an east-west bus rapid
transit corridor is intended to be constructed between Navan Road and Trim Road,
which crosses Tenth Line Road approximately 300 m north of Lakepointe Drive.
This BRT is planned for Phase 1 of the transit improvement schedule.
3.3 EXISTING TRAFFIC VOLUMES
A combination of traffic counts obtained from the City of Ottawa and traffic counts
undertaken by CastleGlenn staff within the vicinity of the proposed site were used
to establish balanced existing travel demand conditions within the study area.
The following is a list of the traffic counts obtained from the City of Ottawa:
• Tenth Line Road / Aquaview Drive (July 12th, 2011); and
• Tenth Line Road / Brian Coburn Boulevard (August 14th, 2009).

Proposed Residential Development – 352 Aquaview Drive Page -7-
Transportation Impact Brief August, 2012
The following is a list of traffic counts conducted by CastleGlenn Consultants
during morning (6:30 - 9:30 am) and afternoon (3:30 - 6:30 pm) peak periods of travel
demand:
• Tenth Line Road / Brian Coburn Boulevard (March 7th, 2012);
• Aquaview Drive / Brian Coburn Boulevard (February 29th, 2012); and
• Aquaview Drive / Lakepointe Drive (February 28th, 2012).
Exhibit 3-2 illustrates the resulting balanced existing (2012) traffic volumes within the
study area (A 2 % average annual growth rate was applied to the Tenth Line Road corridor to update
the City of Ottawa Traffic counts to 2012). A review of Exhibit 3-2 indicates that:
• The dominant direction of travel along Tenth Line Road was northbound during the
morning peak hour and southbound during the afternoon peak hour;
• Peak hour two-way traffic on Tenth Line Road Drive (immediately north of Lakepointe
Dr) is approximately 1,270 vph (900 vph NB/370 vph SB) during the morning peak hour
and 1,800 vph (750 vph NB/1050 vph SB) during the afternoon peak hour; and
• Peak hour two-way traffic on all other study area roadways (Brian Coburn Blvd,
Aquaview Drive, Lakepointe Drive) remain at less than 440 vph per direction during
either the morning or afternoon peak hours of travel demand.
3.4 EXISTING LEVELS OF SERVICE
Intersection capacity analysis was performed using Synchro 6TM
traffic analysis software
to determine the existing (2012) operational characteristics of intersections within the
study area. This analysis assumed the current roadway network configuration within the
study area as well as current signal timing (See Appendix “B”) obtained from the City of
Ottawa. According to City of Ottawa’s TIA guidelines, a v/c ratio of 0.90 or higher can
be considered unsatisfactory.
Table 3-1 contains a summary of the results of the Synchro 6TM
analysis (See Appendix
“C”) of existing (2012) travel demand conditions within the study area.

Proposed Residential Development – 352 Aquaview Drive Page -8-
Transportation Impact Brief August, 2012
Proposed Residential Development – 352 Aquaview Drive Page -9-
Transportation Impact Brief August, 2012
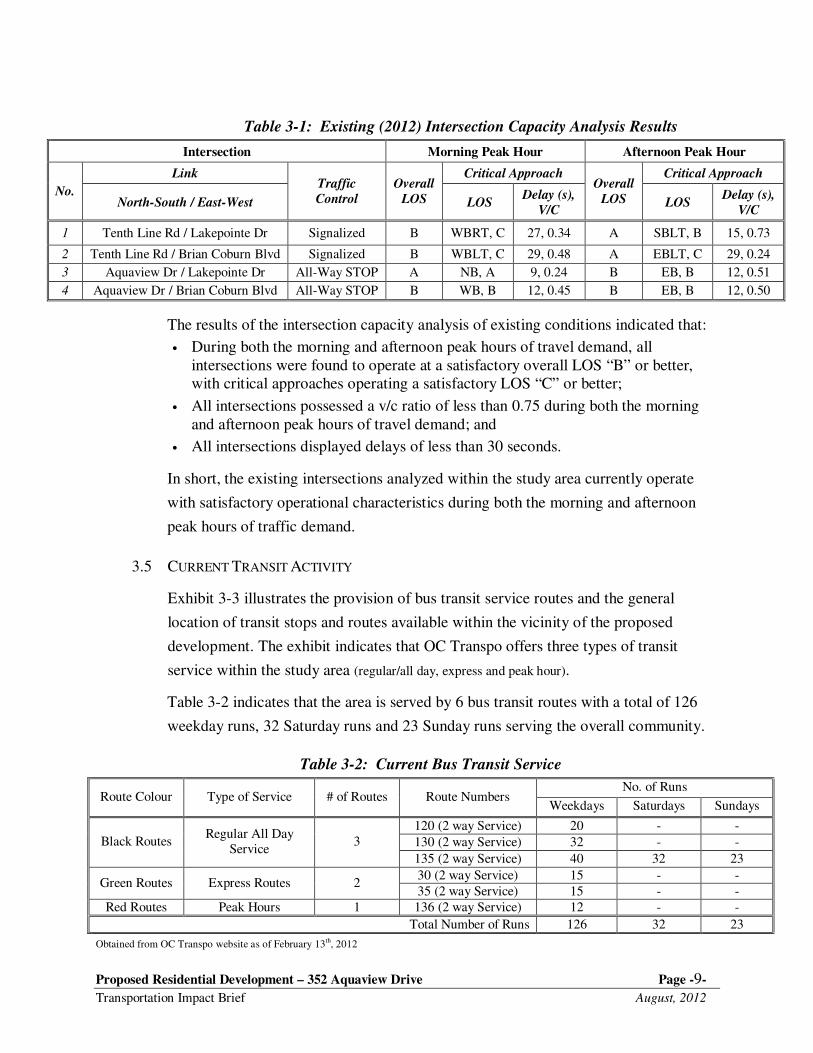
The results of the intersection capacity analysis of existing conditions indicated that:
• During both the morning and afternoon peak hours of travel demand, all
intersections were found to operate at a satisfactory overall LOS “B” or better,
with critical approaches operating a satisfactory LOS “C” or better;
• All intersections possessed a v/c ratio of less than 0.75 during both the morning
and afternoon peak hours of travel demand; and
• All intersections displayed delays of less than 30 seconds.
In short, the existing intersections analyzed within the study area currently operate
with satisfactory operational characteristics during both the morning and afternoon
peak hours of traffic demand.
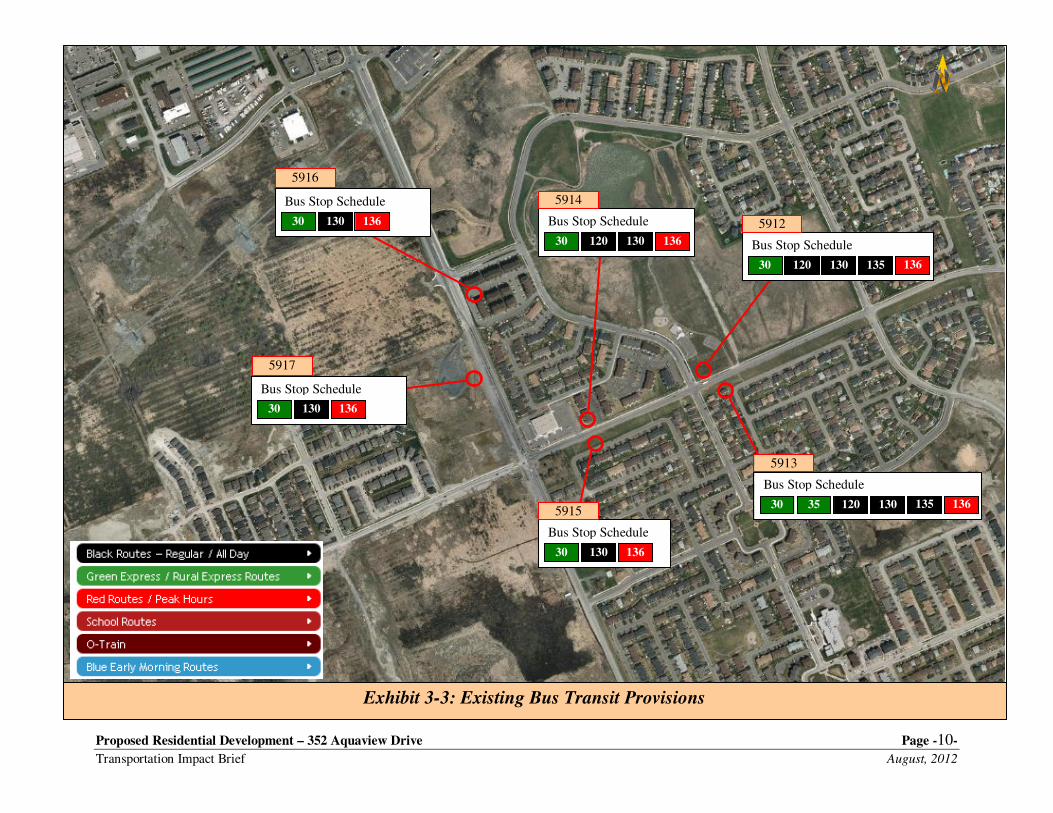
3.5 CURRENT TRANSIT ACTIVITY
Exhibit 3-3 illustrates the provision of bus transit service routes and the general
location of transit stops and routes available within the vicinity of the proposed
development. The exhibit indicates that OC Transpo offers three types of transit
service within the study area (regular/all day, express and peak hour).
Table 3-2 indicates that the area is served by 6 bus transit routes with a total of 126
weekday runs, 32 Saturday runs and 23 Sunday runs serving the overall community.
Table 3-2: Current Bus Transit Service
No. of Runs Route Colour Type of Service # of Routes Route Numbers
Weekdays Saturdays Sundays
120 (2 way Service) 20 - -
130 (2 way Service) 32 - - Black Routes Regular All Day
Service 3
135 (2 way Service) 40 32 23
30 (2 way Service) 15 - - Green Routes Express Routes 2
35 (2 way Service) 15 - -
Red Routes Peak Hours 1 136 (2 way Service) 12 - -
Total Number of Runs 126 32 23
Obtained from OC Transpo website as of February 13th, 2012
Table 3-1: Existing (2012) Intersection Capacity Analysis Results
Intersection Morning Peak Hour Afternoon Peak Hour
Link Critical Approach Critical Approach
No. North-South / East-West
Traffic
Control
Overall
LOS LOS Delay (s),
V/C
Overall
LOS LOS Delay (s),
V/C
1 Tenth Line Rd / Lakepointe Dr Signalized B WBRT, C 27, 0.34 A SBLT, B 15, 0.73
2 Tenth Line Rd / Brian Coburn Blvd Signalized B WBLT, C 29, 0.48 A EBLT, C 29, 0.24
3 Aquaview Dr / Lakepointe Dr All-Way STOP A NB, A 9, 0.24 B EB, B 12, 0.51
4 Aquaview Dr / Brian Coburn Blvd All-Way STOP B WB, B 12, 0.45 B EB, B 12, 0.50
Proposed Residential Development – 352 Aquaview Drive Page -10-
Transportation Impact Brief August, 2012
Exhibit 3-3: Existing Bus Transit Provisions
Bus Stop Schedule
5914
30 120 130 136
Bus Stop Schedule
5915
30 130 136
Bus Stop Schedule
5916
30 130 136
Bus Stop Schedule
5912
30 120 130 135 136
Bus Stop Schedule
5913
30 35 120 130 136 135
Bus Stop Schedule
30 130 136
5917
Proposed Residential Development – 352 Aquaview Drive Page -11-
Transportation Impact Brief August, 2012
Future Transit Network
As mentioned in Section 3.2 above, a review of the City of Ottawa’s Transportation
Master Plan (Nov. 2008) indicated the implementation of Bus Rapid Transit (BRT)
which will eventually cross the Tenth Line Road corridor approximately 300 m north
of Lakepointe Drive. This east-west transit improvement could serve to encourage
usage of the transit network within the study area as transit patrons could either walk
to or utilize adjacent bus transit provisions to reach the proposed BRT network.
3.6 CYCLING NETWORK
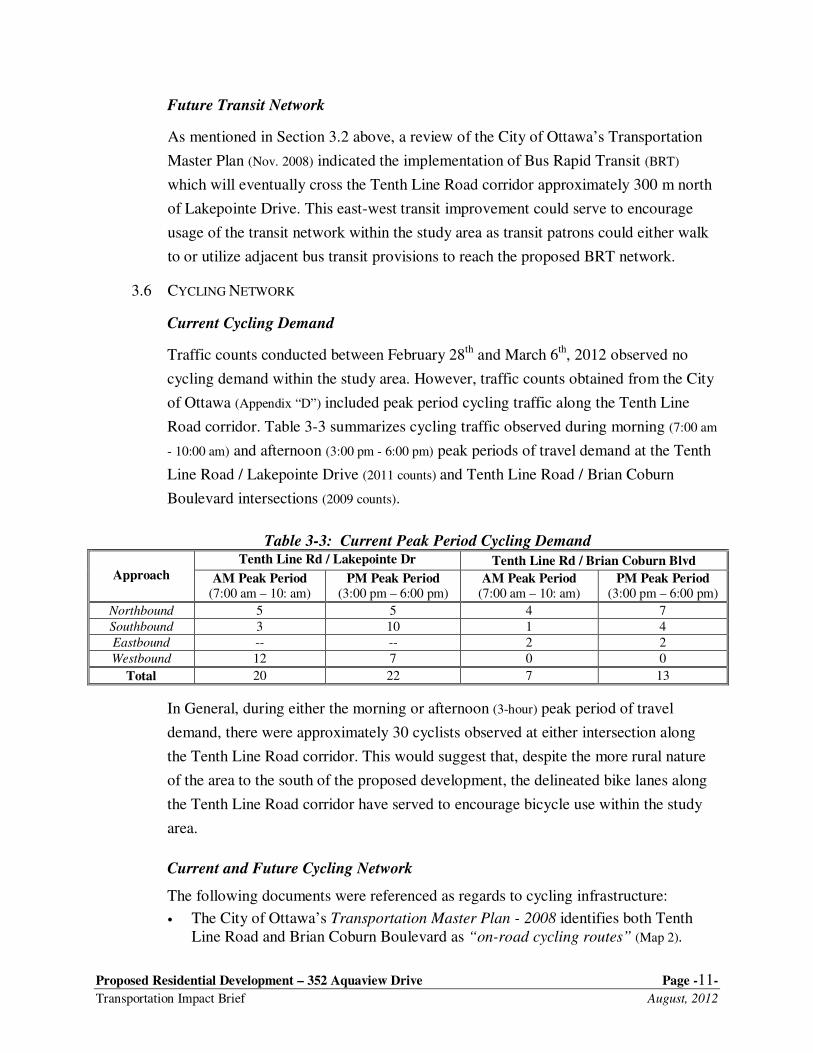
Current Cycling Demand
Traffic counts conducted between February 28th
and March 6th, 2012 observed no
cycling demand within the study area. However, traffic counts obtained from the City
of Ottawa (Appendix “D”) included peak period cycling traffic along the Tenth Line
Road corridor. Table 3-3 summarizes cycling traffic observed during morning (7:00 am
- 10:00 am) and afternoon (3:00 pm - 6:00 pm) peak periods of travel demand at the Tenth
Line Road / Lakepointe Drive (2011 counts) and Tenth Line Road / Brian Coburn
Boulevard intersections (2009 counts).
Table 3-3: Current Peak Period Cycling Demand Tenth Line Rd / Lakepointe Dr Tenth Line Rd / Brian Coburn Blvd
Approach AM Peak Period (7:00 am – 10: am)
PM Peak Period (3:00 pm – 6:00 pm)
AM Peak Period (7:00 am – 10: am)
PM Peak Period (3:00 pm – 6:00 pm)
Northbound 5 5 4 7
Southbound 3 10 1 4
Eastbound -- -- 2 2
Westbound 12 7 0 0
Total 20 22 7 13
In General, during either the morning or afternoon (3-hour) peak period of travel
demand, there were approximately 30 cyclists observed at either intersection along
the Tenth Line Road corridor. This would suggest that, despite the more rural nature
of the area to the south of the proposed development, the delineated bike lanes along
the Tenth Line Road corridor have served to encourage bicycle use within the study
area.
Current and Future Cycling Network
The following documents were referenced as regards to cycling infrastructure:
• The City of Ottawa’s Transportation Master Plan - 2008 identifies both Tenth
Line Road and Brian Coburn Boulevard as “on-road cycling routes” (Map 2).

Proposed Residential Development – 352 Aquaview Drive Page -12-
Transportation Impact Brief August, 2012
• The City of Ottawa’s on-line e-map identifies Tenth Line Road (Innes to Lakepointe
Drive) as possessing “Bike Lanes”. This was confirmed during the March 7th, 2012
site visit, however it should be reiterated that the delineated bike lanes now
continue south of the study area.
In general, the study area is well served by cycling infrastructure.
3.7 PEDESTRIAN ACTIVITY
Pedestrian traffic counts were conducted at each of the study area intersections during
the morning and afternoon peak periods in parallel with vehicle traffic counts (See
Section 3.3). Table 3-3 summarizes the morning and afternoon peak hour pedestrian
travel demand within the study area.
Table 3-3 indicates that no more than 20 pedestrians traversed across a single leg of
any intersection within the study area during either the morning or afternoon peak
hours of travel demand. As such, the pedestrian traffic observed at intersections
within the study area was considered minor.
In terms of anticipated future pedestrian activity as a result of the completion of the
proposed development, the site was determined to result in approximately 60
pedestrians during peak periods of travel demand (204 dwelling units x 1.2 occupants-per-
unit x 25% peak period transit patrons/pedestrians = 61 pedestrians). These 60 transit
patrons/pedestrians would be distributed throughout the study area during the
morning and afternoon peak periods (typically 6:30 to 9:30 am and 3:30 to 6:30 pm) and
would not necessarily cross study area intersections due to the location of the bus
stop on the north side of Brian Coburn Boulevard, directly adjacent to the
development. This was felt to be an acceptable increase to current pedestrian
demand within the study area.
Table 3-3: Existing Pedestrian Volumes
Intersections Peak Hour North Leg South Leg East Leg West Leg
AM 2 2 8 -- Tenth Line Rd / Lakepointe Dr
PM 0 4 3 --
AM 5 0 6 0 Tenth Line Rd / Brian Coburn Blvd
PM 1 0 0 1
AM 0 1 -- 5 Aquaview Dr / Lakepointe Dr
PM 1 3 -- 5
AM 5 1 18 4 Aquaview Dr / Brian Coburn Blvd
PM 6 2 10 1

Proposed Residential Development – 352 Aquaview Drive Page -13-
Transportation Impact Brief August, 2012
4.0 FORECAST IMPACT OF DEVELOPMENT
The City of Ottawa’s “Transportation Impact Assessment Guidelines” (Oct. 2006) requires
that “a qualitative assessment of impacts upon capacity” as a result of the completion of
the proposed development is conducted. The following sections serve to document the
impacts to study area vehicle traffic volumes as a result of the proposed residential
development.
4.1 SITE GENERATED TRIPS
Traffic generated by the proposed 352 Aquaview Drive residential development
was determined by referencing “ITE: Trip Generation Manual” (Institute of
Transportation Engineers, 8th Edition).
Table 4-1 contains the traffic generation rates assumed for the purpose of this study.
Table 4-2 contains the site generated traffic resulting from the application of the trip
generation rates contained within Table 4-1 to the proposed 352 Aquaview Drive
development.
Table 4-1: Trip Generation Rates of the Proposed Site
Morning Peak Hour Afternoon Peak Hour Land Use Type Land Use #
VPH/Unit % IN % OUT VPH/Unit % IN % OUT
Residential Condominium/Townhouse 230 0.45 17% 83% 0.53 67% 33%
Table 4-2: Trip Generation of the Proposed Site
Traffic Generation Rates ITE Land Use
Morning Peak Hour (vph) Afternoon Peak Hour (vph)
Land Use # Units Total IN OUT Total IN OUT
Residential Condominium/Townhouse 91 16 76 108 72 36
25% Transit Reduction -- 25% 25% -- 25% 25%
Residential Condominium/Townhouse
204
68 12 57 81 54 27
The impact of the proposed residential development upon the surrounding roadway
network was determined to result in less than 90 vehicles-per-hour (vph) for either
the morning or afternoon peak hours of travel demand.
Exhibit E-1, Appendix “E” depicts the resulting site generated traffic volumes
distributed upon the study area roadway network. After a review of existing travel
patterns within the study area, the site generated traffic volumes were distributed
based upon the following assumptions:
• 40% of site generated traffic is destined to north of the study area;
Proposed Residential Development – 352 Aquaview Drive Page -14-
Transportation Impact Brief August, 2012
• 30% of site generated traffic is destined west of the study area (via Innes Road);
• 20% of site generated traffic is destined south of the study area; and
• 10% of site generated traffic is destined east of the study area.
A review of Exhibit E-1 would indicate that less than 40 vph-per-direction of site
generated traffic volumes is added to any roadway link within the study area.
Given the satisfactory operational characteristics currently exhibited by existing
study area intersections, this increase was found to be acceptable.
4.2 ANALYSIS AND EVALUATION
Despite the satisfactory operations and low levels of delay exhibited by all study area
intersections under 2012 travel demand conditions, an assessment of left-turn lane
queuing capacity at study area intersections was conducted to determine the impact to
any existing queues at the signalized intersections along Tenth Line Road.
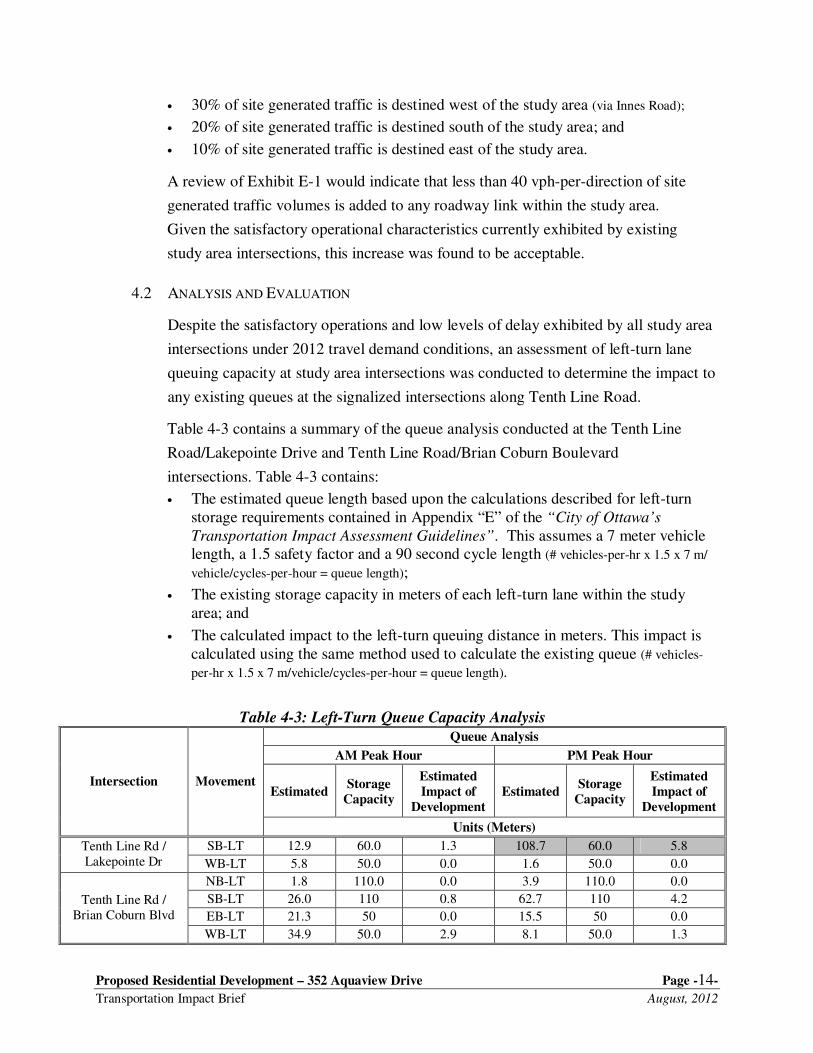
Table 4-3 contains a summary of the queue analysis conducted at the Tenth Line
Road/Lakepointe Drive and Tenth Line Road/Brian Coburn Boulevard
intersections. Table 4-3 contains:
• The estimated queue length based upon the calculations described for left-turn
storage requirements contained in Appendix “E” of the “City of Ottawa’s
Transportation Impact Assessment Guidelines”. This assumes a 7 meter vehicle
length, a 1.5 safety factor and a 90 second cycle length (# vehicles-per-hr x 1.5 x 7 m/
vehicle/cycles-per-hour = queue length);
• The existing storage capacity in meters of each left-turn lane within the study
area; and
• The calculated impact to the left-turn queuing distance in meters. This impact is
calculated using the same method used to calculate the existing queue (# vehicles-
per-hr x 1.5 x 7 m/vehicle/cycles-per-hour = queue length).
Table 4-3: Left-Turn Queue Capacity Analysis
Queue Analysis
AM Peak Hour PM Peak Hour
Estimated Storage
Capacity
Estimated
Impact of
Development
Estimated Storage
Capacity
Estimated
Impact of
Development
Intersection Movement
Units (Meters)
SB-LT 12.9 60.0 1.3 108.7 60.0 5.8 Tenth Line Rd /
Lakepointe Dr WB-LT 5.8 50.0 0.0 1.6 50.0 0.0
NB-LT 1.8 110.0 0.0 3.9 110.0 0.0
SB-LT 26.0 110 0.8 62.7 110 4.2
EB-LT 21.3 50 0.0 15.5 50 0.0
Tenth Line Rd /
Brian Coburn Blvd
WB-LT 34.9 50.0 2.9 8.1 50.0 1.3

Proposed Residential Development – 352 Aquaview Drive Page -15-
Transportation Impact Brief August, 2012
All left-turn lanes within the study area possess sufficient capacity to accommodate
the site generated traffic volumes resulting from the completion of the proposed
development with the exception of the southbound left-turn storage lane at the
Tenth Line Rd/Lakepointe Dr Intersection (PM Only) which extends approximately
110 meters (available storage = 60 m).
Regarding the southbound left-turn storage lane at the Tenth Line Rd/Lakepointe
Dr Intersection, it is worth noting that…
• While no significant queues on this movement were observed during the site visit,
this deficiency remains an existing condition due to the current 414 vehicles
making the southbound left-turn during the afternoon peak hour of travel demand.
• Dispite stacking beyond the available southbound left-turn storage lane during the
PM, this queue would not interfere with any adjacent intersection, existing or
anticipated.
• The additional 20 vph added to the southbound left-turn lane are estimated to
increase the theoretical queue length by only 6 m during the PM peak hour. This
increase of a single additional queued vehicle was deemed negligible.
• The anticipated improvements to bus rapid transit to the immediate north of the
study area could serve to diminish PM peak hour traffic volumes approaching the
study area because more people may choose to use transit.
• The implementation of the proposed future extension of the Brian Coburn Drive
corridor westward to Navan Road is intended to provide an alternative east-west
corridor to the Innes Road corridor, which is currently the only method of
accessing the study area. This could serve to divert much of the 414 vph accessing
Lakepointe Drive from the north via Innes Road onto the Brian Coburn Boulevard
corridor, where additional storage capacity exists for the eastbound through
movement at the Tenth Line Road/Brian Coburn Drive intersection (as was the
intended impact of the Brian Coburn Boulevard extension project).
In short, the impact of the proposed developments upon left-turn storage capacity
within the study area was deemed acceptable.
The site generated traffic of the proposed future developments located on the west
side of the Tenth Line Rd corridor described in Section 3.1 (future gas station and future
residential) would impact turning movements which are independent of the site
generated traffic associated with the proposed 352 Aquaview Drive. As such, the
impacts of adjacent proposed future developments would not affect the results of
the queue analysis documented above.

Proposed Residential Development – 352 Aquaview Drive Page -16-
Transportation Impact Brief August, 2012
5.0 TRANSPORTATION DEMAND MANAGEMENT (TDM)
The purpose of the City of Ottawa’s Transportation Demand Management is “to reduce the
number of trips they make, to travel more often by non-driving alternatives, to travel
outside peak periods, and to reduce the length of their trips. A key goal of TDM is to
minimize peak hour automobile travel and reduce the need for new or wider roads”2.
The following study area features serve the principles of TDM:
• Current cycling infrastructure within the study area was found to encourage bicycle use
as a viable alternative mode of transportation for local residents (See Section 3.6); and
• Current access to transit remains frequent along study area corridors, most bus routes
arriving approximately every 10-to-30 minutes during the morning and afternoon peak
periods of travel demand.
The residents of the proposed site currently have convenient access to the cycling and
transit networks within the study area, which serve to satisfy the principles of TDM.
6.0 FINDINGS
The following provides a summary of the existing conditions within the study area:
• Existing Land Use: The study area is currently comprised of single detached and multi-
unit residential dwellings with some commercial/retail development (current and future)
within the immediate vicinity of the proposed development.
• Roadway Network: Tenth Line Road provides the main north-south access to/from the
community. Innes Road currently remains the most convenient east-west corridor for
accessing areas west of the study area.
• Current Traffic Volumes: Peak hour two-way traffic on Tenth Line Road Drive
(immediately north of Lakepointe Dr) is approximately 1,270 vph (900 vph NB/370 vph SB)
during the morning peak hour and 1,800 vph (750 vph NB/1050 vph SB) during the
afternoon peak hour. Peak hour two-way traffic on all other study area roadways
(Brian Coburn Boulevard, Aquaview Drive, Lakepointe Drive) remain at less than 440 vph per
direction during either the morning or afternoon peak hours of travel demand.
• Existing Service Levels: During both the morning and afternoon peak hours of travel
demand, all intersections were found to operate at a satisfactory overall LOS “B” or
better. All intersection critical approaches operated at a satisfactory LOS “C” or
better and a v/c ratio of less than 0.75 during both morning and afternoon peak hours
of travel demand.
• Pedestrian Activity: Current pedestrian counts indicated that no more than 20
pedestrians traversed across a single leg of any intersection within the study area during
either the morning or afternoon peak hours of travel demand. As such, the pedestrian
traffic observed at intersections within the study area was considered minor.
2 Transportation Master Transportation Plan, November 2008 Publication 19-82, page 29
Proposed Residential Development – 352 Aquaview Drive Page -17-
Transportation Impact Brief August, 2012
• Transit Service: The study area is served by six bus transit routes with a total of over
126 weekday transit runs, 32 Saturday runs and 23 Sunday runs serving the overall
community.
6.1 HOW MUCH TRAFFIC WILL THE PROPOSED SITE GENERATE?
The addition of 204 dwelling units to the development site was determined to result
in 68 vph (12 vph inbound/57 vph outbound) during the morning peak hour and 81 vph
(54 vph inbound/27 vph outbound) during the afternoon peak hour of site generated
traffic accessing the study area roadway network. This is inclusive of a 25% transit
reduction factor due to the anticipated completion of an east-west transit corridor
situated approximately 300 m north of the Lakepointe Drive corridor.
6.2 WHEN WILL THE PROPOSED SITE BE COMPLETED?
The advent of the proposed site, for the purposes of this TIB document was
assumed to be built-out by the 2015 horizon year.
6.3 WHAT ARE THE IMPACTS OF THE PROPOSED SITE?
A review of site generated traffic volumes distributed over the study area would
indicate that less than 40 vph-per-direction of site generated traffic volumes is
added to any roadway link within the study area. Given the satisfactory operational
characteristics currently exhibited by existing study area intersections, this increase
was found to be acceptable. In addition, the impact of the proposed developments
upon left-turn storage capacity within the study area was also deemed acceptable.
Current storage deficiencies which were identified at the Tenth Line Road/
Lakepointe Drive intersection during the PM peak hour are anticipated to be
mitigated by the completion of the proposed Brian Coburn Boulevard extension
west of the study area.
The proposed development is anticipated to result in minimal impact to the surrounding
community as the majority of motorists would be attempting to access the Tenth Line
Road corridor (or the future Brian Coburn Boulevard extension). Hence, the surrounding local
roadways within the study area would continue to serve only the surrounding community
and are not useful as cut-through routes for site generated traffic volumes resulting from
the completion of the proposed 352 Aquaview Drive development.

Proposed Residential Development – 352 Aquaview Drive Page -18-
Transportation Impact Brief August, 2012
6.4 CONCLUSIONS & RECOMMENDATIONS
As per the documentation and analysis contained within this report, it can be concluded
that:
• The current (2012) operational characteristics, as indicated by the Synchro 6™
intersection capacity analysis, of all study area intersections remain acceptable (v/c
ratio of less than 0.75); and
• Impacts to current operational conditions at study area intersections as a result of
the proposed 352 Aquaview Drive development are anticipated to be acceptable.
The results indicate that the City of Ottawa should be encouraged to assemble the
appropriate conditions for development approval that would permit the development
application to proceed.
7.0 STUDY SIGN-OFF
CastleGlenn Consultants Inc. is pleased to submit this document in accordance with the
requirements of the City of Ottawa’s Transportation Impact Assessment Guidelines (Oct
2006). The signature below indicates that the “Proposed Residential Development – 352
Aquaview Drive: Traffic Impact Brief” has been signed-off by the project manager who is
a licensed and registered professional engineer with experience in the field of
transportation planning and traffic operations.
Arthur E. Gordon B.A., P. Eng.
Related Documents