PROPOSED FINAL APRIL 2012 Southern California Association of Governments TRANSIT APPENDIX

Welcome message from author
This document is posted to help you gain knowledge. Please leave a comment to let me know what you think about it! Share it to your friends and learn new things together.
Transcript

PROPOSED FINAL APRIL 2012
Southern California Association of Governments
TRANSIT APPENDIX

TRANSIT
Overview and Description 1Transit Modes in the SCAG Region 1
The State of the System 2
Availability Analysis 4The Great Recession 7
Transit and Sustainable Communities 19
Needs Assessment and Transit Challenges 20
Economics and Funding 20
Coordinated Planning 21
Constrained Plan 22Baseline Transit Investments and Policies 22
Planned Investments 23Vehicle Miles Traveled (VMT) Reduction 31
Strategies and Recommendations 32Operational Strategies 32
Accessibility Strategies 32
Strategic Plan: Looking Ahead – Beyond the Horizon 33
Overview and DescriptionThe transit system in our six-county region is comprised of an extensive network of services provided by dozens of operators. The network includes fixed-route local bus, community circulators, express bus, bus rapid transit (BRT), demand response, commuter rail, heavy rail, and light rail. The operators include well established agencies in mature service areas as well as smaller municipal operators whose services are developing smartly in their respective parts of the region. Ridership in our region continues to grow, and significant progress is being made in making transit more available and attractive by virtue of a burgeoning rail network, transit oriented development (TOD) and other service improvements. However, this progress has been slowed by recent cutbacks in funding and decreases in revenue.
As of FY2009, our region’s transit system represents approximately 8,700 miles of bus routes, 70 miles of heavy and light rail, and 512 miles of commuter rail service. Almost 5 percent of commuters in the SCAG region used transit to reach their place of employ-ment as of 2009. However, this is significantly below the percentage of commuters using transit in other large metropolitan areas such as Chicago or the Bay Area. As of FY2009, transit agencies in the SCAG Region reported 747.3 million boardings. This represents a net growth of nearly 20 percent between 2000 and 2010; however, there has been only a 4 percent growth in per capita trips, meaning that most of the growth in boardings could be explained by population growth.
While Southern California has a national reputation for auto-centricity, our region has an extensive transit network. According to APTA’s Public Transportation Fact Book, the Los Angeles-Long Beach-Santa Ana Urbanized Statistical Area (UZA) ranked number two nationally in several important measures. Only the New York-Newark UZA reported more Vehicles Operated Maximum Service, Vehicles Available for Maximum Service, Vehicle Revenue Miles, Vehicle Revenue Hours, and Unlinked Passenger Trips. Los Angeles-Long Beach-Santa Ana ranked third in Passenger Miles Travelled, behind the New York-Newark and Chicago UZAs. LA Metro is the fifth largest operator nationally, when ranked in terms of service hours. Eight other properties, The City of Santa Monica’s Big Blue Bus, Orange County Transportation Authority (OCTA), Access Services Incorporated (ASI), Foothill
Transit, City of Los Angeles Department of Transportation (LADOT), Riverside Transit Agency (RTA), Omnitrans, and Long Beach Transit (LBT) rank among the 100 largest properties nationally.
Our region is planning and constructing an ambitious level of transit capital projects, including new rail lines and bus priority facilities such as bus lanes and bus signal priority (BSP). In November 2008, Los Angeles County voters approved a third county sales tax increase, Measure R, funding new capital projects and providing additional operating funds for county transit providers. The Los Angeles County Metropolitan Transportation Authority (Metro) already administers Proposition A and C funds (a half cent each), and will use 35 percent of the revenues from Measure R to develop a series of major transit capital projects for bus improvements and to expand the rail network. Imperial, Orange, Riverside and San Bernardino counties also have local sales tax programs in place, deliv-ering similar mixes of operational and capital project improvements.
Along with the recent and future improvements to our region’s transit system are land use developments around transit centers and stations along transit corridors that encourage transit usage. Many residential and commercial developments have been built or are in the pipeline alongside transit facilities that offer residents and employees an opportunity to make a trip by transit, bicycling, or walking, instead of an auto trip.
These positive developments have been significantly impacted however by recent revenue declines and cutbacks in funding. The Great Recession and its anemic recovery have led to serious fiscal challenges for our transit operators. Since FY2008, transit provid-ers within the SCAG region have seen a decrease in State Transit Account (STA) funds of approximately $759 million. Local Transportation Fund (LTF) allocations in FY 2010 were 21 percent lower than FY 2007. By February of 2011, half of the agencies that provide service between local cities in our region had cut service by between 2 percent and 20 percent. Of those, four agencies had cut service by more than 10 percent. During this same period, 14 out of 25 of these operators had seen their boardings fall between 2 per-cent and 27 percent. Of those, four agencies had boardings fall by more than 15 percent. To offset this large revenue decline, almost all operators have raised fares. While this has increased fare revenues in the region, it does not provide an incentive for increased pas-senger boardings.
Transit 1
Transit Modes in the SCAG RegionTransit service in the SCAG region is composed of five modes of service:
� Fixed Route Bus Service, referred to as Motor Bus in the National Transit Database and defined as “a transit mode comprised of rubber tired vehicles operating on fixed routes and schedules over roadways.”
� Demand Response, defined as “a transit mode comprised of pas-senger cars, vans, or small buses operating in response to calls from passengers or their agents to the transit operator, who then dispatches a vehicle to pick up the passengers and transport them to their destinations.”
� Light Rail, defined as “a transit mode that typically is an electric railway with a light volume traffic capacity compared to heavy rail (HR). It is characterized by passenger rail cars operating on fixed rails in shared or exclusive right-of-way (ROW) and vehicle power drawn from an overhead electric line via a trolley or a pantograph.”
� Heavy Rail, defined as “a transit mode that is an electric railway with the capacity for a heavy volume of traffic. It is characterized by sepa-rate ROWs from which all other vehicular and foot traffic are excluded and high speed and rapid acceleration passenger rail cars operating singly or in multi-car trains on fixed rails.”
� Commuter Rail (CR), defined as “a transit mode that is an electric or diesel propelled railway for urban passenger train service consist-ing of local short distance travel operating between a central city and adjacent suburbs. Service must be operated on a regular basis by or under contract with a transit operator for the purpose of transport-ing passengers within urbanized areas (UZAs), or between urbanized areas and outlying areas.” Discussion of this mode is included in the Passenger Rail Appendix.
Coupled with the revenue setbacks, costs for transit providers are heading in the opposite direction by rising faster than inflation. Each mode has shown cost per passenger mile traveled (PMT) increase over the past decade: bus service by 24 percent, Metro Rail by 41 percent, and Metrolink by 48 percent. Transit providers’ fare revenue, or “farebox recovery,” has decreased from 32 percent of the cost of providing service to just 27 percent since 2000.
These cost and revenue trends weaken the long term stability of transit services in the SCAG Region. Unless transit operators in our region find ways to improve the fare revenue to cost ratio, transit services will require much greater subsidies or services will continue to be cut. This conflict will grow as new operational funds will need to be applied towards new capital projects currently in development once they are ready for revenue service.
The State of the SystemA detailed analysis was completed to gauge the state of SCAG’s transit system. The analysis studied the 25 inter-jurisdictional operators in our region over the last ten years. The goals of the analysis were to:
� Assess the region’s ability to attract and retain new transit riders
� Assess the region’s utilization of transit resources
� Show transit availability and connectivity to smart growth/TOD
� Show the effects of the recession
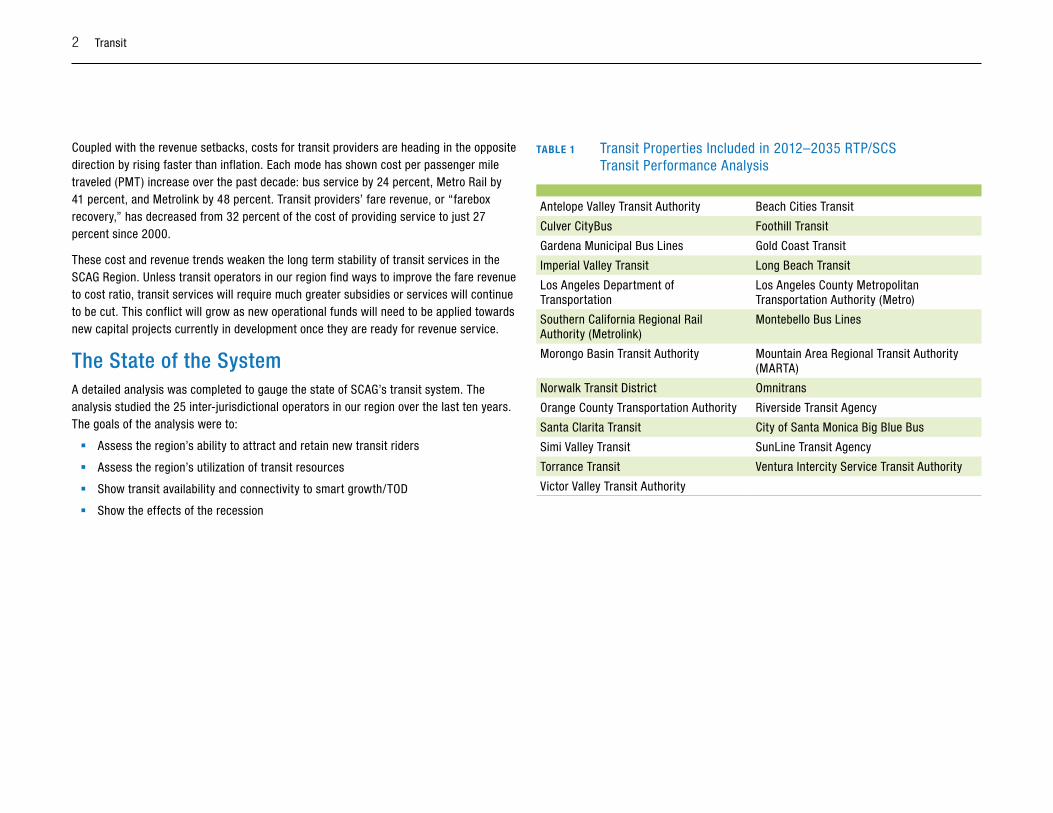
TABLe 1 Transit Properties Included in 2012–2035 RTP/SCS Transit Performance Analysis
Antelope Valley Transit Authority Beach Cities Transit
Culver CityBus Foothill Transit
Gardena Municipal Bus Lines Gold Coast Transit
Imperial Valley Transit Long Beach Transit
Los Angeles Department of Transportation
Los Angeles County Metropolitan Transportation Authority (Metro)
Southern California Regional Rail Authority (Metrolink)
Montebello Bus Lines
Morongo Basin Transit Authority Mountain Area Regional Transit Authority (MARTA)
Norwalk Transit District Omnitrans
Orange County Transportation Authority Riverside Transit Agency
Santa Clarita Transit City of Santa Monica Big Blue Bus
Simi Valley Transit SunLine Transit Agency
Torrance Transit Ventura Intercity Service Transit Authority
Victor Valley Transit Authority
2 Transit

The analysis shows that transit usage continues to grow in our region. This is especially true when fixed guideway projects such as rail and BRT are implemented and result in new riders to transit. As of FY2009, transit agencies in the SCAG Region reported 747.3 million boardings. This represents growth of nearly 20 percent in the ten years between 2000 and 2010, but only 4 percent growth in per capita trips due to population growth. Metrolink and Metro Rail (L.A. County) have seen ridership growth of 6 percent to 8 percent a year, while traditional local bus has grown 1.5 percent a year. This rate is well below the region’s rate of population growth, meaning that bus transit is actually losing ground in the SCAG Region, even though local buses carry 86 percent of our region’s transit riders. Bus transit’s per capita ridership loss is troubling, given that this mode forms the backbone of the SCAG Region’s transit network. This loss also demonstrates the importance of introducing “premium” transit services, such as rail, BRT, limited-stop and point-to-point express services, to our region.
Transit ridership growth is important, but so is the availability of transit: frequency, span-of-service, and the location of stops and services affect residents’ ability to travel by transit. The provision of transit service in the SCAG region is growing faster than the growth in boardings. In the past ten years, total transit service hours are up 26 percent, while boardings are up only 20 percent. This trend results in slightly lower productivity, or boardings per hour, meaning transit resources are being used slightly less efficiently.
As our region becomes more and more congested, transit speed is also important. The analysis shows that over the last ten years, transit modal speeds have remained relatively constant. Metrolink’s average speed is about 40 mph, Metro Rail about 23 mph, and local bus about 13 mph. Auto speeds remain very competitive with transit. Freeway speeds are about 40 mph, and 26 mph for major arterials. Metrolink speeds are competitive with highway speeds, but overall travel times for Metrolink passengers are likely longer due to the time needed to travel to and from the Metrolink stations on each end of the trip.
Transit costs and revenues are not fairing as well over the last decade. Farebox recovery is down significantly, from 32 percent to 27 percent. Even more concerning, each transit mode has seen costs per passenger mile traveled increase: bus service 24 percent, Metro Rail 41 percent and Metrolink 48 percent, in constant dollars.
FIguRe 1 Per Capita Transit Trips 2000–2009
33
34
35
36
37
38
39
40
41
1 2 3 4 5 6 7 8 9 10
Transit 3
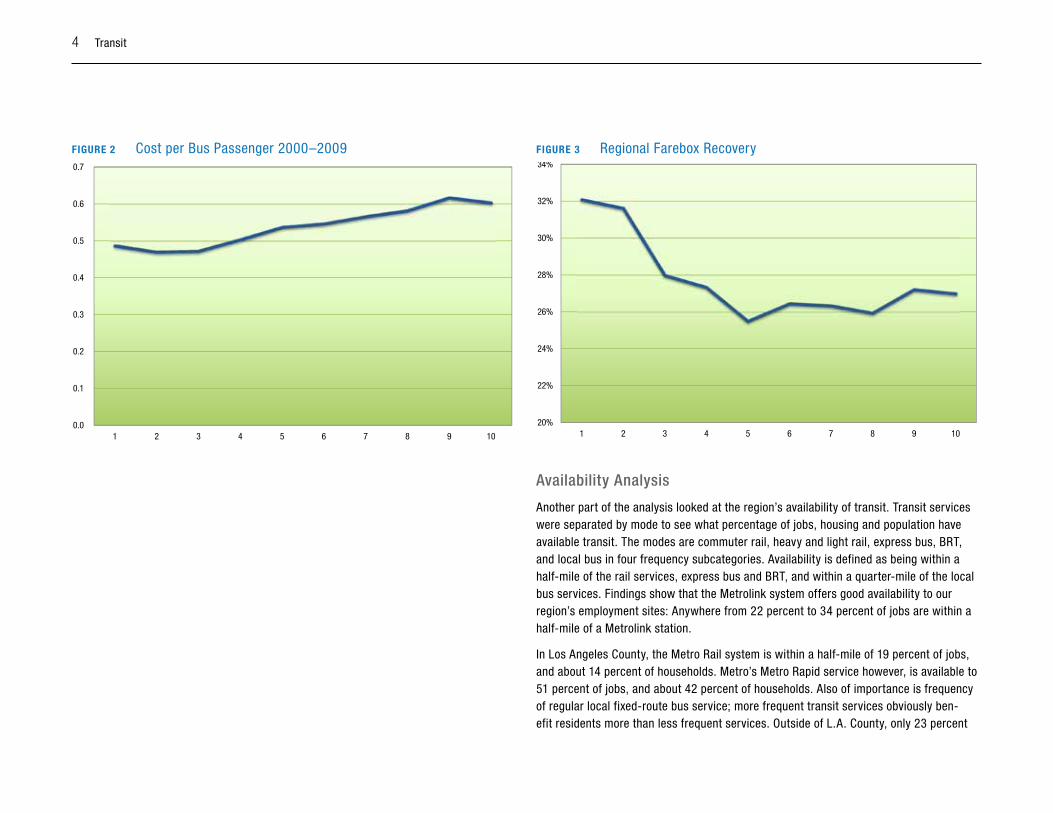
FIguRe 2 Cost per Bus Passenger 2000–2009
0.0
0.1
0.2
0.3
0.4
0.5
0.6
0.7
1 2 3 4 5 6 7 8 9 10
FIguRe 3 Regional Farebox Recovery
20%
22%
24%
26%
28%
30%
32%
34%
1 2 3 4 5 6 7 8 9 10
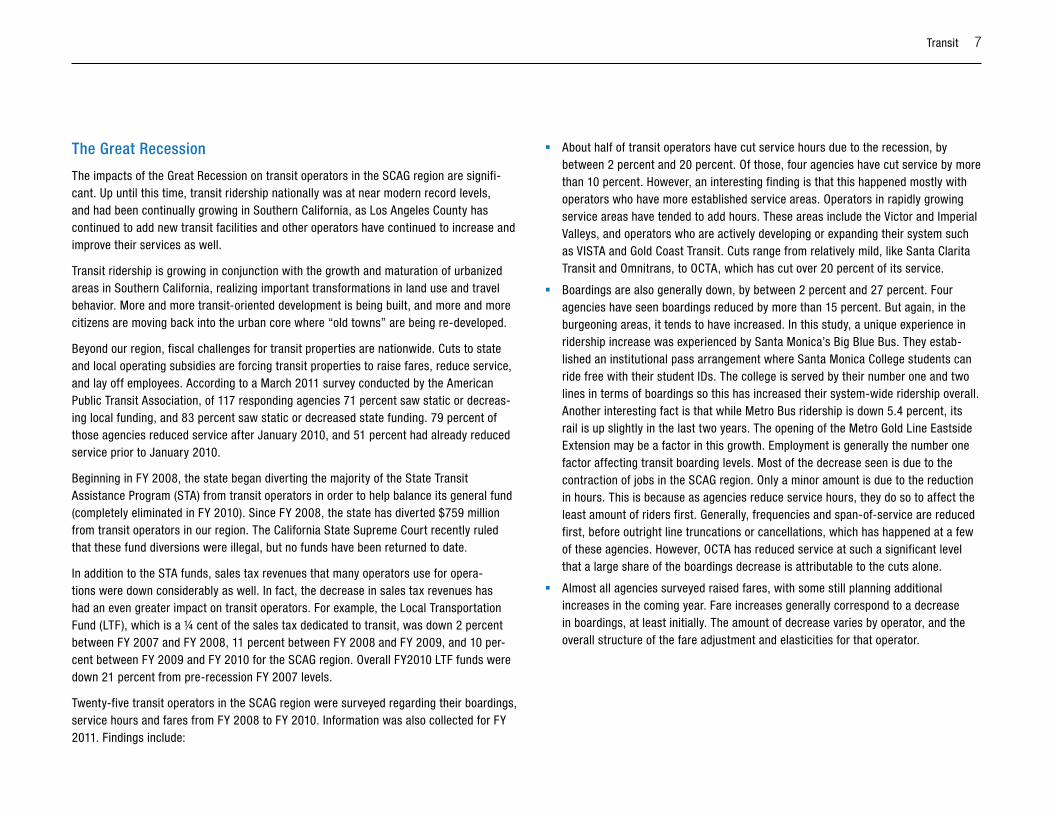
Availability Analysis
Another part of the analysis looked at the region’s availability of transit. Transit services were separated by mode to see what percentage of jobs, housing and population have available transit. The modes are commuter rail, heavy and light rail, express bus, BRT, and local bus in four frequency subcategories. Availability is defined as being within a half-mile of the rail services, express bus and BRT, and within a quarter-mile of the local bus services. Findings show that the Metrolink system offers good availability to our region’s employment sites: Anywhere from 22 percent to 34 percent of jobs are within a half-mile of a Metrolink station.
In Los Angeles County, the Metro Rail system is within a half-mile of 19 percent of jobs, and about 14 percent of households. Metro’s Metro Rapid service however, is available to 51 percent of jobs, and about 42 percent of households. Also of importance is frequency of regular local fixed-route bus service; more frequent transit services obviously ben-efit residents more than less frequent services. Outside of L.A. County, only 23 percent
4 Transit

of Orange County residents have access to transit service with 15 minutes or better frequency, only 11 percent of Riverside and San Bernardino county residents have this access, and no residents in Imperial or Ventura counties have such access. This analysis
shows the need to introduce rail and BRT services in our region outside of Los Angeles County and also to improve the frequency of local bus service.
TABLe 2 Modal Availability
County Los Angeles Orange Riverside San Bernardino Ventura Imperial
Total employment 4,335,967 1,624,508 663,948 700,603 347,720 61,504
Commuter Rail Employment 970,302 450,561 166,454 169,166 118,625 0
Availability 22.38% 27.74% 25.07% 24.15% 34.12% 0.00%
Heavy/Light Rail Employment 816,450 0 0 0 0 0
Availability 18.83% 0.00% 0.00% 0.00% 0.00% 0.00%
BRT Employment 2,204,346 0 0 0 0 0
Availability 50.84% 0.00% 0.00% 0.00% 0.00% 0.00%
Express Bus Employment 3,402,872 631,829 203,174 127,940 176,539 19,414
Availability 78.48% 38.89% 30.60% 18.26% 50.77% 31.57%
<15 Min Local Bus Employment 2,231,969 377,098 72,555 77,816 0 0
Availability 51.48% 23.21% 10.93% 11.11% 0.00% 0.00%
16 to 30 Min Local Bus Employment 3,940,937 1,526,306 250,960 405,293 159,941 0
Availability 90.89% 93.95% 37.80% 57.85% 46.00% 0.00%
31 to 60 Min Local Bus Employment 3,838,088 1,381,993 514,882 470,597 208,814 0
Availability 88.52% 85.07% 77.55% 67.17% 60.05% 0.00%
>60 Min Local Bus Employment 3,531,079 1,301,926 441,147 379,301 239,361 48,540
Availability 81.44% 80.14% 66.44% 54.14% 68.84% 78.92%
Total Population 10,343,450 3,123,318 2,090,251 2,052,926 831,787 177,454
Commuter Rail Population 1,666,935 619,254 285,310 344,078 178,771 0
Availability 16.12% 19.83% 13.65% 16.76% 21.49% 0.00%
Heavy/Light Rail Population 1,434,325 0 0 0 0 0
Availability 13.87% 0.00% 0.00% 0.00% 0.00% 0.00%
BRT Population 4,476,785 0 0 0 0 0
Availability 43.28% 0.00% 0.00% 0.00% 0.00% 0.00%
Transit 5

County Los Angeles Orange Riverside San Bernardino Ventura Imperial
Express Bus Population 7,006,824 787,031 427,241 266,887 281,556 75,006
Availability 67.74% 25.20% 20.44% 13.00% 33.85% 42.27%
<15 Min Local Bus Population 4,620,479 641,781 139,197 125,069 0 0
Availability 44.67% 20.55% 6.66% 6.09% 0.00% 0.00%
16 to 30 Min Local Bus Population 8,902,591 2,740,960 498,647 1,068,186 185,937 0
Availability 86.07% 87.76% 23.86% 52.03% 22.35% 0.00%
31 to 60 Min Local Bus Population 8,463,355 2,381,944 1,374,927 1,147,388 431,145 0
Availability 81.82% 76.26% 65.78% 55.89% 51.83% 0.00%
>60 Min Local Bus Population 7,227,064 2,165,566 1,290,987 871,362 399,027 142,361
Availability 69.87% 69.34% 61.76% 42.44% 47.97% 80.22%
Total Households 3,268,083 999,527 675,472 608,023 267,740 49,785
Commuter Rail Households 464,998 187,385 87,679 93,975 53,945 0
Availability 14.23% 18.75% 12.98% 15.46% 20.15% 0.00%
Heavy/Light Rail Households 446,395 0 0 0 0 0
Availability 13.66% 0.00% 0.00% 0.00% 0.00% 0.00%
BRT Households 1,447,131 0 0 0 0 0
Availability 44.28% 0.00% 0.00% 0.00% 0.00% 0.00%
Express Bus Households 2,280,031 246,988 132,539 79,125 98,239 20,849
Availability 69.77% 24.71% 19.62% 13.01% 36.69% 41.88%
<15 Min Local Bus Households 1,476,478 174,422 42,571 31,708 0 0
Availability 45.18% 17.45% 6.30% 5.21% 0.00% 0.00%
16 to 30 Min Local Bus Households 2,833,606 870,606 159,922 298,123 63,296 0
Availability 86.71% 87.10% 23.68% 49.03% 23.64% 0.00%
31 to 60 Min Local Bus Households 2,683,939 760,625 439,872 340,934 133,417 0
Availability 82.13% 76.10% 65.12% 56.07% 49.83% 0.00%
>60 Min Local Bus Households 2,319,526 687,402 401,481 257,071 132,616 41,634
Availability 70.98% 68.77% 59.44% 42.28% 49.53% 83.63%
6 Transit
The Great Recession
The impacts of the Great Recession on transit operators in the SCAG region are signifi-cant. Up until this time, transit ridership nationally was at near modern record levels, and had been continually growing in Southern California, as Los Angeles County has continued to add new transit facilities and other operators have continued to increase and improve their services as well.
Transit ridership is growing in conjunction with the growth and maturation of urbanized areas in Southern California, realizing important transformations in land use and travel behavior. More and more transit-oriented development is being built, and more and more citizens are moving back into the urban core where “old towns” are being re-developed.
Beyond our region, fiscal challenges for transit properties are nationwide. Cuts to state and local operating subsidies are forcing transit properties to raise fares, reduce service, and lay off employees. According to a March 2011 survey conducted by the American Public Transit Association, of 117 responding agencies 71 percent saw static or decreas-ing local funding, and 83 percent saw static or decreased state funding. 79 percent of those agencies reduced service after January 2010, and 51 percent had already reduced service prior to January 2010.
Beginning in FY 2008, the state began diverting the majority of the State Transit Assistance Program (STA) from transit operators in order to help balance its general fund (completely eliminated in FY 2010). Since FY 2008, the state has diverted $759 million from transit operators in our region. The California State Supreme Court recently ruled that these fund diversions were illegal, but no funds have been returned to date.
In addition to the STA funds, sales tax revenues that many operators use for opera-tions were down considerably as well. In fact, the decrease in sales tax revenues has had an even greater impact on transit operators. For example, the Local Transportation Fund (LTF), which is a ¼ cent of the sales tax dedicated to transit, was down 2 percent between FY 2007 and FY 2008, 11 percent between FY 2008 and FY 2009, and 10 per-cent between FY 2009 and FY 2010 for the SCAG region. Overall FY2010 LTF funds were down 21 percent from pre-recession FY 2007 levels.
Twenty-five transit operators in the SCAG region were surveyed regarding their boardings, service hours and fares from FY 2008 to FY 2010. Information was also collected for FY 2011. Findings include:
� About half of transit operators have cut service hours due to the recession, by between 2 percent and 20 percent. Of those, four agencies have cut service by more than 10 percent. However, an interesting finding is that this happened mostly with operators who have more established service areas. Operators in rapidly growing service areas have tended to add hours. These areas include the Victor and Imperial Valleys, and operators who are actively developing or expanding their system such as VISTA and Gold Coast Transit. Cuts range from relatively mild, like Santa Clarita Transit and Omnitrans, to OCTA, which has cut over 20 percent of its service.
� Boardings are also generally down, by between 2 percent and 27 percent. Four agencies have seen boardings reduced by more than 15 percent. But again, in the burgeoning areas, it tends to have increased. In this study, a unique experience in ridership increase was experienced by Santa Monica’s Big Blue Bus. They estab-lished an institutional pass arrangement where Santa Monica College students can ride free with their student IDs. The college is served by their number one and two lines in terms of boardings so this has increased their system-wide ridership overall. Another interesting fact is that while Metro Bus ridership is down 5.4 percent, its rail is up slightly in the last two years. The opening of the Metro Gold Line Eastside Extension may be a factor in this growth. Employment is generally the number one factor affecting transit boarding levels. Most of the decrease seen is due to the contraction of jobs in the SCAG region. Only a minor amount is due to the reduction in hours. This is because as agencies reduce service hours, they do so to affect the least amount of riders first. Generally, frequencies and span-of-service are reduced first, before outright line truncations or cancellations, which has happened at a few of these agencies. However, OCTA has reduced service at such a significant level that a large share of the boardings decrease is attributable to the cuts alone.
� Almost all agencies surveyed raised fares, with some still planning additional increases in the coming year. Fare increases generally correspond to a decrease in boardings, at least initially. The amount of decrease varies by operator, and the overall structure of the fare adjustment and elasticities for that operator.
Transit 7

SySTEM PERFORMANCE: BENChMARkING TO PEER REGIONS
Analysis of the region’s transit network’s performance via Key Performance Indicators (KPIs) revealed a worrying trend: the growth in costs of transit provision is growing far faster than inflation, and far faster than the rate of growth in consumption. This analy-sis focused on twenty-five transit properties from throughout the region that a) provide service between jurisdictions, and b) report performance data to the National Transit Database (NTD). The report included a section focused on transit KPIs including ridership, productivity, mobility, and cost.
Analysis of the findings of the KPI exercise led to the comparison of our regional transit system’s performance to those other regions. Doing so establishes a frame of reference for the cost effectiveness of current operations, and identifies areas where other regions are providing service at a lower cost. Further, doing so will allow regional stakeholders to identify areas of possible improvement, and to identify peer regions and peer agencies who might provide best practices examples.
Performance benchmarking through peer comparison is relatively new in transit--peer comparison exercises by public agencies are more commonly performed in the education and public safety fields. Increasingly though, transit properties are using the availability of NTD data to measure agency performance in comparison to peer agencies. It is also an emerging practice at the regional level.
Over the past ten years, several performance benchmarking exercises have been performed at the system level by regional bodies. Beginning in 2003, The Metropolitan Council of Minneapolis has added a benchmarking component to its quadrennial transit system performance audit. The Atlanta Regional Council (ARC) performed similar analysis in 2005, focusing on peer regions with similar populations, growth rates, density, and travel characteristics. The State of Illinois Department of Transportation’s Performance Audit of Mass Transit Agencies in Northeastern Illinois: RTA, CTA, Metro and Pace, included comparison of each mode in the region with five peer services.
Methodology
In order to perform the analysis, staff began by constructing a peer regions group. Previously, SCAG has performed performance benchmarking activities in the context of the State of the Region Report, where our region’s performance was measured and com-pared along a broad axis of multi-sectoral indicators. Historically, the peer group in this analysis has been regions with populations over 5 million.
For the purposes of this exercise, that peer group metric has been retained. Using US Census 2009 estimates, a cohort of 10 Consolidated Statistical Areas (CSAs) and one Metropolitan Statistical Area (MSA) with more than 5 million residents was built (the Miami Fort Lauderdale Pompano Beach MSA in not part of a CSA).
TABLe 3 Peer Regions Comparison Group
CSA / MSA Designation2009 estimated
Population, uS Census
New York-Newark-Bridgeport, NY-NJ-CT-PA CSA 22,232,494
SCAG REGION 17,987,767
Chicago-Naperville-Michigan City, IL-IN-WI CSA 9,804,845
Washington-Baltimore-Northern Virginia, DC-MD-VA-WV CSA
8,440,617
Boston-Worcester-Manchester, MA-RI-NH CSA 7,609,358
San Jose-San Francisco-Oakland CA CSA 7,427,757
Dallas-Fort Worth, TX CSA 6,805,275
Philadelphia-Camden-Vineland, PA-NJ-DE-MD CSA 6,398,896
Houston-Baytown-Huntsville, TX CSA 5,968,586
Atlanta-Sandy Springs-Gainesville, GA-AL CSA 5,831,778
Miami-Fort Lauderdale-Pompano Beach, FL MSA 5,564,635
Detroit-Warren-Flint, MI CSA 5,327,764
8 Transit

The peer regions group contains 109 million residents as of the 2009 Census estimates, roughly one-third of the national population. The peer group also represents a significant portion of the nation’s transit investment, service, and ridership. There are 192 separate agencies reporting data within the peer regions comparison group, across a variety of transit modes. To contextualize, the table below presents the amount of service and productivity of various modes in the peer regions comparison group.
For rail modes, the small number of agencies allows direct comparisons. As such, rider-ship and cost performance data were compared evenly by agency across the regions. For the purposes of fixed route bus analysis, the SCAG Region’s transit properties were tiered and compared to a series of peer region comparison group performance over time. In order to capture data at the system level, and represent each of the included transit agencies, analysis was conducted through unweighted averages. This is helpful for understanding performance at the operator level, but does not reflect total volume or consumption of service. To give more a comparative perspective, different data years were employed, allowing comparisons of national trends to regional trends.
Our region is very competitive in service consumption. Southern California ranks fourth in per capita unlinked bus trips, behind New York-Newark, San Jose-San Francisco-Oakland, and Chicago–Naperville Michigan CSAs. Southern California’s heavy and light rail network is not as competitive. Of ten regions with heavy or light rail systems, the SCAG Region ranks 8th in per capita urban rail trips. One reason for this may be the limited extent of the network. Southern California operates 0.78 directional route miles of rail for every 100,000 residents, which ranks 9th out of ten nationally.
FIguRe 4 Motor Bus Cost per Passenger Mile, Large Tier Agencies, 2010 NTD
$0.00
$0.10
$0.20
$0.30
$0.40
$0.50
$0.60
$0.70
$0.80
$0.90
$1.00
1991 PeerRegions
1991 SCAGRegion
2008 PeerRegions
2008 SCAGRegion
2010 PeerRegions
2010 SCAGRegion
Transit 9

FIguRe 5 Motor Bus Cost per Passenger Mile, Medium Tier Agencies, 2010 NTD
$0.00
$0.10
$0.20
$0.30
$0.40
$0.50
$0.60
$0.70
$0.80
$0.90
$1.00
1991 PeerRegions
1991 SCAGRegion
2008 PeerRegions
2008 SCAGRegion
2010 PeerRegions
2010 SCAGRegion
FIguRe 6 Motor Bus Cost per Passenger Mile, Smaller Tier Agencies, 2010 NTD
$0.00
$0.20
$0.40
$0.60
$0.80
$1.00
$1.20
$1.40
$1.60
1991 PeerRegions
1991 SCAGRegion
2008 PeerRegions
2008 SCAGRegion
2010 PeerRegions
2010 SCAGRegion
10 Transit

FIguRe 7 Light Rail Cost per Passenger Mile, Peer Regions Comparison Group, 2008 NTD
$0.00
$0.20
$0.40
$0.60
$0.80
$1.00
$1.20
$1.40
NJ Transit LA Metro SEPTA DART MBTA MarylandMTA
HoutonMetro
VTA MUNI
FIguRe 8 Heavy Rail Cost per Passenger Mile, Peer Regions Comparison Group, 2008 NTD
$0.00
$0.10
$0.20
$0.30
$0.40
$0.50
$0.60
$0.70
$0.80
$0.90
Transit 11

12 Transit
FIguRe 9 Motor Bus Passengers per Hour, Large Tier Agencies, 2010 NTD
0
5
10
15
20
25
30
35
40
1991 PeerRegions
1991 SCAGRegion
2008 PeerRegions
2008 SCAGRegion
2010 PeerRegions
2010 SCAGRegion
FIguRe 10 Motor Bus Passengers per Hour, Medium Tier Agencies, 2010 NTD
0
5
10
15
20
25
30
35
1991 PeerRegions
1991 SCAGRegion
2008 PeerRegions
2008 SCAGRegion
2010 PeerRegions
2010 SCAGRegion

Transit 13
FIguRe 11 Motor Bus Passengers per Hour, Smaller Tier Agencies, 2010 NTD
0
5
10
15
20
25
30
1991 PeerRegions
1991 SCAGRegion
2008 PeerRegions
2008 SCAGRegion
2010 PeerRegions
2010 SCAGRegion
FIguRe 12 Light Rail Passengers per Hour, Peer Regions Comparison Group, 2008 NTD
0
20
40
60
80
100
120
140
160
180
NJ Transit LA Metro SEPTA DART MBTA MarylandMTA
HoutonMetro
VTA MUNI
14 Transit
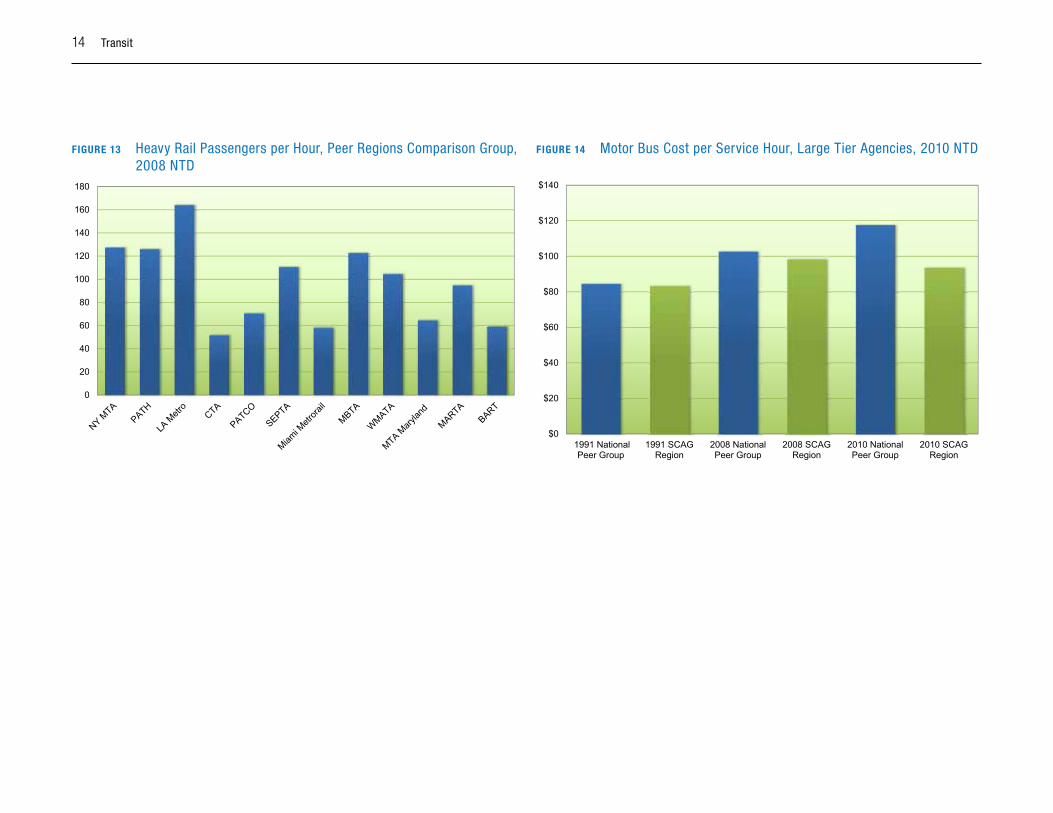
FIguRe 13 Heavy Rail Passengers per Hour, Peer Regions Comparison Group, 2008 NTD
0
20
40
60
80
100
120
140
160
180
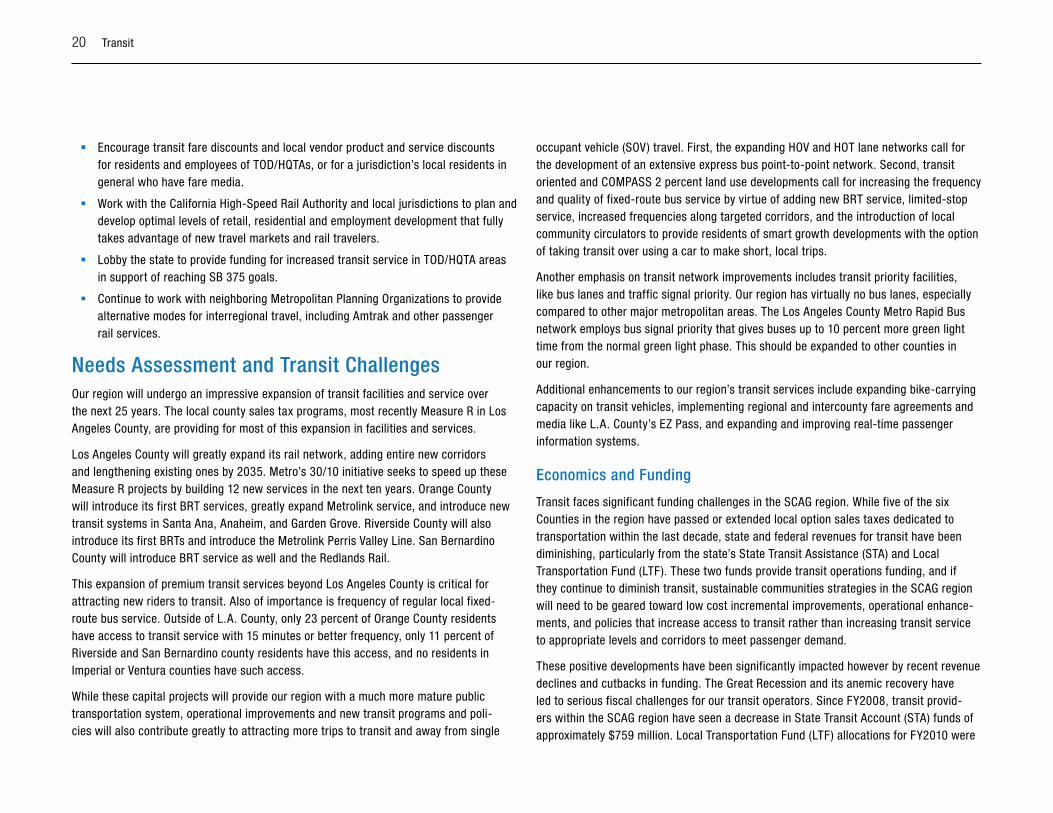
FIguRe 14 Motor Bus Cost per Service Hour, Large Tier Agencies, 2010 NTD
$0
$20
$40
$60
$80
$100
$120
$140
1991 NationalPeer Group
1991 SCAGRegion
2008 NationalPeer Group
2008 SCAGRegion
2010 NationalPeer Group
2010 SCAGRegion

Transit 15
FIguRe 15 Motor Bus Cost per Service Hour, Medium Tier Agencies, 2010 NTD
$78
$80
$82
$84
$86
$88
$90
$92
$94
$96
1991 NationalPeer Group
1991 SCAGRegion
2008 NationalPeer Group
2008 SCAGRegion
2010 NationalPeer Group
2010 SCAGRegion
FIguRe 16 Motor Bus Cost per Service Hour, Smaller Tier Agencies, 2010 NTD
0
5
10
15
20
25
30
1991 PeerRegions
1991 SCAGRegion
2008 PeerRegions
2008 SCAGRegion
2010 PeerRegions
2010 SCAGRegion

16 Transit
FIguRe 17 Light Rail Cost per Service Hour, Peer Regions Comparison Group, 2008 NTD
$0
$50
$100
$150
$200
$250
$300
$350
$400
$450
NJ Transit LA Metro SEPTA DART MBTA MarylandMTA
HoutonMetro
VTA MUNI
FIguRe 18 Heavy Rail Cost per Service Hour, Peer Regions Comparison Group, 2008 NTD
$0
$50
$100
$150
$200
$250
$300
$350
$400
The SCAG Region is performing relatively well compared to other regions. LA Metro’s heavy rail system is the most productive in the country, but this is partially a product of providing a relatively small number of service hours. Metro recorded 265,149 service hours in FY2008, slightly more than the total at the Maryland Transit Administration (214,285) and slightly less than Miami Dade Transit’s 318,765. In contrast, two of the three most productive systems after Metro offer vastly more service. New York’s MTA delivered over 19 million service hours in FY2008, and Boston’s MBTA provided 1.2 mil-lion. PATH Transit, which connects New York City and New Jersey, provided only 146,102. Other less productive services, including SEPTA, MARTA, BART, and WMATA, offered over 500,000 service hours. These data present a strong argument for service expansion of Metro’s existing Purple and Red lines, and suggest that Metro’s “More trains, More Often” pilot program may be very successful.
LA Metro’s Light Rail Service is the third most productive of the national peer group. Houston Metro carries 167 passengers an hour, MBTA 122, and LA Metro 115. DART is

Transit 17
the next most productive at 80 per hour, nearly double the service on a system that is 42 percent of LA Metro’s total route miles. LA Metro’s existing light rail system is actually the largest of any in the peer region’s group; NJ Transit, the second largest, offers on 84 percent of LA Metro’s total route miles. DART, SEPTA, MUNI, and Santa Clara VAT all operate systems at roughly 66 percent to 80 percent of the route miles of the LA Metro system. The SCAG Region is somewhat unique among large metropolitan areas in using light rail technology over large geographic areas, as opposed to more highly concentrated areas such as San Francisco, San Jose, or Boston. That the system can do so at such high comparative productivity levels is an achievement.
Small bus properties in the SCAG Region are also more productive than their national counterparts. FIguRe 11 displays the productivity performance of bus services providing less than 100,000 service hours in FY1991, FY2008, and FY2010. While in 1991 perfor-mance was roughly similar at the national and regional levels, by 2008 the SCAG region was outperforming the unweighted national average by roughly 30 percent. This remained true in 2010. However, these data points represent a drop of 41 percent for the national group, and 28 percent for the SCAG Region. Our region’s productivity is simply declining much more slowly than that of the national peer group.
FIguRe 12 displays the unweighted average productivity of operators offering between 100,000 and 200,000 hours of service. Both the national peer group and the SCAG region are declining. While service in this tier has grown 49 percent nationally between 1991 and 2010, in the SCAG Region the hours provided by medium tier operators have grown by 160 percent. This growth significantly outpaces the diminishing productivity, and suggests that properties in this tier should be working to target service expansions to the most productive corridors.
The vast bulk of fixed route bus service in the SCAG Region is provided by a handful of very large operators. As displayed in FIguRe 9, in FY 1991, those services were 16 per-cent less productive than their national counterparts; by FY 2008 they were 12 percent more productive. This trend continued into FY 2010. It should also be noted here that while productivity diminished between 1991 and 2008 at the national level, it grew by 27.5 percent over the same period in the SCAG Region.
FIguRe 6 displays the cost per passenger mile for small tier bus properties. In FY1991, cost per passenger mile were almost exactly the same. Cost growth is significant for both the peer group and the regional operators, but much more pronounced at the national
level. Adjusted for inflation, costs grew 55 percent for the peer group between FY 1991 and FY 2008, but only 35 percent for the SCAG Region. Between FY 2008 and FY 2010, costs in the SCAG Region actually declined by 5 percent. However, 30–35 percent in inflation adjusted growth is still deeply problematic.
In FY 1991, the SCAG Region was significantly outperforming the peer group, but by FY 2008 the performance was almost exactly even ($0.8820/mile vs. $0 8801/mile). In FY 2010, the region and the peer group performance remained similar. However, this indi-cates that costs in the SCAG Region are growing at a much faster rate; our region’s costs grew by 69 percent versus the national average of 40 percent. As displayed in FIguRe 2 , these costs are growing at a troubling rate.
Costs per passenger mile are also growing rapidly for properties delivering large amounts of service.
TABLe 4 Findings of Peer Comparison Benchmarking Exercise
Measure Outperforming National Peer
group
underperforming National Peer
group
Roughly even
Cost per PMT, Large Bus Properties, 1991
X
Cost per PMT, Large Bus Properties, 2008
X
Cost per PMT, Large Bus Properties, 2010
X
Cost per PMT, Medium Bus Properties, 1991
X
Cost per PMT, Medium Bus Properties, 2008
X
Cost per PMT, Medium Bus Properties, 2010
X
Cost per PMT, Small Bus Properties, 1991
X
Cost per PMT, Small Bus Properties, 2008
X

18 Transit
Measure Outperforming National Peer
group
underperforming National Peer
group
Roughly even
Cost per PMT, Small Bus Properties, 2010
X
Cost per Service Hour, Large Bus Properties, 1991
X
Cost per Service Hour, Large Bus Properties, 2008
X
Cost per Service Hour, Large Bus Properties, 2010
X
Cost per Service Hour, Medium Bus Properties, 1991
X
Cost per Service Hour, Medium Bus Properties, 2008
X
Cost per Service Hour, Medium Bus Properties, 2010
X
Cost per Service Hour, Small Bus Properties, 1991
X
Cost per Service Hour, Small Bus Properties, 2008
X
Cost per Service Hour, Small Bus Properties, 2010
X
System Productivity, Large Bus Properties, 1991
X
System Productivity, Large Bus Properties, 2008
X
System Productivity, Large Bus Properties, 2010
X
System Productivity, Medium Bus Properties, 1991
X
Measure Outperforming National Peer
group
underperforming National Peer
group
Roughly even
System Productivity, Medium Bus Properties, 2008
X
System Productivity, Medium Bus Properties, 2010
X
System Productivity, Small Bus Properties, 1991
X
System Productivity, Small Bus Properties, 2008
X
System Productivity, Small Bus Properties, 2010
X
Cost per PMT, Heavy Rail, 2008
X
Cost per Service Hour, Heavy Rail, 2008
X
System Productivity, Heavy Rail, 2008
X
Cost per PMT, Light Rail, 2008
X
Cost per Service Hour, Light Rail, 2008
X
System Productivity, Light Rail, 2008
X
Of thirty-three measures surveyed in the peer comparisons exercise, The SCAG Region outperformed the national peer group in seventeen, and was roughly even with the peer group in six. In ten measures of unweighted average performance, the peer comparison group outperformed our region; however, of those measures, four were historical data points from 1991. Moreover, our system is very competitive where the bulk of the service is; nine of the measures where the SCAG Region is outperforming the peer group are rail or large bus providers.

Transit 19
At the agency level, the SCAG Region’s transit system is very high performing compared to other peer regions. Our costs and our productivity are in no way atypical of large met-ropolitan regions; rising operations costs are typical nationally. However, rising operations costs will continue to pose a challenge to our ability to provide transit service, to meet air quality conformity targets, and to comply with laws such as SB 375. In subsequent regional transportation plans, cost containment strategies will need to be an important piece of the overall transit strategy.
Transit and Sustainable CommunitiesTransit availability and attractiveness are crucial elements of sustainable communities. The ability of our region to continue to attract new riders in greater numbers calls for implementing strategies and policies to meet this goal.
While these new facilities are mostly in Los Angeles County, other counties in our region have BRT and rail projects in the planning phases. Most of these corridors will serve new transit oriented development (TOD) offering residents the availability of transit trips, or bicycling or walking, over auto trips. High Quality Transit Areas (HQTAs) are an element of SB 375 that are designed to align regional transportation, land use, housing and greenhouse gas emissions planning through the SCS. A HQTA is an area within a ½-mile of a rail stop or a bus corridor that provides or will provide at least 15-minute frequency service during peak hours by the year 2035.
Strategic and cooperative planning among various levels of government will result in a greater level of Greenhouse Gas (GHG) reductions. Following is a discussion of strategies and policies to further improve the public transit and land use nexus.
SB 375
In addition to connecting regional planning processes, SB 375 was also designed to make it easier for communities to expand housing and transportation choices. A key element of SB 375 is the option for regions and their local governments to provide significant CEQA regulatory streamlining incentives for Transit Priority Projects (TPPs). TPPs are housing or mixed-use projects with 20 dwelling units per acre or more that are located within a HQTA. CEQA streamlining can provide certainty, cost and speed benefits needed by infill and TOD.
Transit agencies and local governments should take full advantage of these opportunities to plan transit service to serve these new development opportunities. In addition to the 15-minute frequency defined by SB 375, SCAG’s SCS emphasizes this transit/land use nexus to transit corridors where 30-minute of better service is or will be provided.
While many of these strategies would be implemented by transit agencies in their service areas, local cities can add to these opportunities by adding or adjusting local circulators within their jurisdiction to serve TOD and increase transit mode share.
hIGh-SPEED RAIL
In 2008 California voters passed Proposition 1A authorizing nearly $10 billion in bonds to build the California High-Speed Train (HST) system between San Francisco through Los Angeles and continuing to Anaheim. Once completed, the project will attract a significant amount of travelers who now travel by airline or auto. This could significantly reduce GHGs. CA HST stations will provide new or enhanced nodes for real estate development, approximating the growth and uses currently seen at small to medium sized airports. In addition, the proper planning of feeder bus and rail systems to these stations should increase passenger trips for all carriers involved. Following are some general and specific recommendations for the region:
� Encourage the development of new transit modes in our subregions such as BRT, rail, limited-stop service, and point-to-point express services utilizing the HOV and HOT lane networks.
� Encourage transit providers to increase frequency and span-of-service in TOD/HQTA areas and along targeted corridors where there is latent demand for transit usage.
� Encourage regional and local transit providers to develop rail interface services at Metrolink, Amtrak and HST stations.
� Collaborate with local jurisdictions to plan and develop residential and employment development around current and planned transit stations.
� Collaborate with local jurisdictions to provide a network of local community cir-culators that serve new TOD and HQTAs, providing an incentive for residents and employees to make trips on transit.
� Develop first-mile/last-mile strategies on a local level to provide an incentive for making trips by transit, bicycling or walking.
20 Transit
� Encourage transit fare discounts and local vendor product and service discounts for residents and employees of TOD/HQTAs, or for a jurisdiction’s local residents in general who have fare media.
� Work with the California High-Speed Rail Authority and local jurisdictions to plan and develop optimal levels of retail, residential and employment development that fully takes advantage of new travel markets and rail travelers.
� Lobby the state to provide funding for increased transit service in TOD/HQTA areas in support of reaching SB 375 goals.
� Continue to work with neighboring Metropolitan Planning Organizations to provide alternative modes for interregional travel, including Amtrak and other passenger rail services.
Needs Assessment and Transit ChallengesOur region will undergo an impressive expansion of transit facilities and service over the next 25 years. The local county sales tax programs, most recently Measure R in Los Angeles County, are providing for most of this expansion in facilities and services.
Los Angeles County will greatly expand its rail network, adding entire new corridors and lengthening existing ones by 2035. Metro’s 30/10 initiative seeks to speed up these Measure R projects by building 12 new services in the next ten years. Orange County will introduce its first BRT services, greatly expand Metrolink service, and introduce new transit systems in Santa Ana, Anaheim, and Garden Grove. Riverside County will also introduce its first BRTs and introduce the Metrolink Perris Valley Line. San Bernardino County will introduce BRT service as well and the Redlands Rail.
This expansion of premium transit services beyond Los Angeles County is critical for attracting new riders to transit. Also of importance is frequency of regular local fixed-route bus service. Outside of L.A. County, only 23 percent of Orange County residents have access to transit service with 15 minutes or better frequency, only 11 percent of Riverside and San Bernardino county residents have this access, and no residents in Imperial or Ventura counties have such access.
While these capital projects will provide our region with a much more mature public transportation system, operational improvements and new transit programs and poli-cies will also contribute greatly to attracting more trips to transit and away from single
occupant vehicle (SOV) travel. First, the expanding HOV and HOT lane networks call for the development of an extensive express bus point-to-point network. Second, transit oriented and COMPASS 2 percent land use developments call for increasing the frequency and quality of fixed-route bus service by virtue of adding new BRT service, limited-stop service, increased frequencies along targeted corridors, and the introduction of local community circulators to provide residents of smart growth developments with the option of taking transit over using a car to make short, local trips.
Another emphasis on transit network improvements includes transit priority facilities, like bus lanes and traffic signal priority. Our region has virtually no bus lanes, especially compared to other major metropolitan areas. The Los Angeles County Metro Rapid Bus network employs bus signal priority that gives buses up to 10 percent more green light time from the normal green light phase. This should be expanded to other counties in our region.
Additional enhancements to our region’s transit services include expanding bike-carrying capacity on transit vehicles, implementing regional and intercounty fare agreements and media like L.A. County’s EZ Pass, and expanding and improving real-time passenger information systems.
Economics and Funding
Transit faces significant funding challenges in the SCAG region. While five of the six Counties in the region have passed or extended local option sales taxes dedicated to transportation within the last decade, state and federal revenues for transit have been diminishing, particularly from the state’s State Transit Assistance (STA) and Local Transportation Fund (LTF). These two funds provide transit operations funding, and if they continue to diminish transit, sustainable communities strategies in the SCAG region will need to be geared toward low cost incremental improvements, operational enhance-ments, and policies that increase access to transit rather than increasing transit service to appropriate levels and corridors to meet passenger demand.
These positive developments have been significantly impacted however by recent revenue declines and cutbacks in funding. The Great Recession and its anemic recovery have led to serious fiscal challenges for our transit operators. Since FY2008, transit provid-ers within the SCAG region have seen a decrease in State Transit Account (STA) funds of approximately $759 million. Local Transportation Fund (LTF) allocations for FY2010 were

Transit 21
21 percent lower than FY2007. By February of 2011, half of the surveyed agencies had cut service by between 2 percent and 20 percent. Of those, four agencies had cut service by more than 10 percent. During this same period, 14 out of 25 of these operators had seen their boardings fall between 2 percent and 27 percent. Of those, four agencies had boardings fall by more than 15 percent. To offset this large revenue decline, almost all operators have raised fares. While this has increased fare revenues in the region, it does not provide an incentive for increased passenger boardings.
Coupled with the revenue setbacks, costs for transit providers are heading in the opposite direction by rising faster than inflation. Each mode has shown cost per passenger mile traveled (PMT) increase over the past decade: bus service by 24 percent, Metro Rail by 41 percent, and Metrolink by 48 percent. Transit providers’ fare revenue has decreased from 32 percent of the cost of providing service to just 27 percent since 2000.
These cost and revenue trends weaken the long term stability of transit services in the SCAG Region. Unless transit operators in our region find ways to improve the fare revenue to cost ratio, transit services will require much greater subsidies or services will continue to be cut. This conflict will grow as new operational funds will need to be applied towards new capital projects currently in development once they are ready for revenue service.
Coordinated PlanningAs per 49 U.S.C. Sections 5302, 5303, 5310, 5311, 5314, 5316, and 5317; SAFETEA-LU Section 3046, metropolitan regions or component parts of metropolitan regions are required to produce a Coordinated Human Services Transportation Plan. Projects receiv-ing Federal Transit Administration funds in the 5310 Transportation for Elderly Persons and Persons with Disabilities, some 5311 Formula Grants for Other than Urbanized Areas, 5316 Jobs Access Reverse Commute, and 5317 New Freedoms Programs must be con-sistent with that plan.
In the SCAG region, Consolidated Transportation Service Agencies (CTSAs) are respon-sible for producing Coordinated Plans. These agencies, often incorporated within County Transportation Commisions, operate at the county level, and since the passage of SAFETEA-LU have produced coordinated plans at that level.
Coordinated Human Services Plans in effect in the SCAG Region include:
� The Human Service Transportation and Transit Service Coordination Study, Approved by the VCTC in 2007
� The Imperial County Coordinated Human Services Transportation Plan, approved by the Imperial Valley Association of Governments in 2008
� The Public Transit – Human Services Transportation Coordination Plan for Orange County, adopted by OCTA in 2008
� The Public Transit-Human Services Transportation Coordination Plan For San Bernardino County, adopted by SANBAG in 2007
� Action Plan: A Locally Developed, Coordinated Public Transit Human Services Transportation Plan for Los Angeles County, adopted by Access Services Incorporated in 2007
� The Public Transit – Human Services Transportation Coordination Plan for Riverside County, adopted by RCTC in 2008

22 Transit
Constrained Plan
Baseline Transit Investments and PoliciesPublic transportation in Southern California is highly varied. As the geographically largest metropolitan region in the country, the SCAG Region has a diverse set of transportation needs across the six county area. Transportation providers within that area use a diverse set of strategies and services to meet those needs.
Since the 2008 RTP, Los Angeles, San Bernardino, and Riverside Counties have increas-ingly seen capital project development as a strategy to meet transit needs within their respective counties.
In November 2008, the voters of Los Angeles County approved a third Local Option Sales Tax to fund both capital and operations within Los Angeles County. The Los Angeles County Metropolitan Transportation Authority (Metro), which already administers Proposition A and C funds, will use 35 percent of Measure R revenues to develop a series of major transit capital projects.
TABLe 5 Major Transit Capital Projects Funded with Measure R Revenues
Major Transit Capital Projects Funded with Measure R Revenues
Exposition Transit Corridor, Phase 2 South Bay Metro Green Line Extension
Regional Connector Transit Corridor Sepulveda Pass Transit Corridor
Crenshaw LAX Transit Corridor (includes project acceleration)
San Fernando Valley (East) North South Rapidways
Eastside Transit Corridor Phase 2Metro Orange Line Extension (includes project acceleration)
Gold Line Foothill Extension, Phase 2aPacific Electric Right of Way / West Santa Ana Branch Corridor
Metro Green Line to LAX Westside Subway Extension1
1 Measure R Expenidute Plan Adopted by Metro Board of Directors July 24, 2008 (http:/www.metro.net/measurer/images/expenditure_plan.pdf)
Since the 2008 RTP was released, Metro completed construction and began operations of the Edward R. Roybal Metro Gold Line Eastside Extension, which extended Gold Line service to Boyle Heights and East Los Angeles. Metro and the Exposition Construction Authority staff also plan to begin revenue service between downtown L.A. and Culver City in early 2012.
Additionally, the San Bernardino Associated Governments (SANBAG) is working with local transit properties to provide more travel options in the San Bernardino Valley. Two capital projects of note include the E street sbX BRT Corridor, and the Downtown San Bernardino Passenger Rail Project, which will extend Metrolink service into Downtown San Bernardino.
Similarly, the Riverside County Transportation Commission continues to develop the Perris Valley Line, a 24 mile extension of Metrolink’s 91 Line service to South Perris. RCTC also continues to evaluate further extensions of Metrolink service.
In Ventura, Orange, and Imperial counties, transit planning has recently been more focused on operational changes. The Imperial County Transportation Commission is cur-rently initiating a Comprehensive Operational Analysis for Imperial Valley Transit, which will seek to assess whether existing transit service can be altered to more efficiently and effectively meet existing travel demand. Given that Imperial County has had approximately 33 percent growth over the past ten years, this project is especially timely.
In Orange County, while bus service has been significantly cut due to local and state operational funding shortfalls, OCTA is moving forward with three transit initiatives. One is the Orange County Metrolink Service Expansion which is funded by Measure M, Orange County’s half cent transportation Local Option Sales Tax. This $382.5 million program expands Metrolink service between Fullerton and Laguna Nigel / Mission Viejo, funds capital improvements to facilitate increased train traffic, and builds a new Metrolink sta-tion in the City of Placentia.
OCTA is developing strategies to complement these service expansions through the Measure M-funded Go Local Program. After measure M was renewed in 2006, OCTA partnered with each of the 34 cities in Orange County to study alternatives for local circulators to connect with Metrolink stations. As a result of these studies, OCTA is part-nering with the Cities of Anaheim and Santa Ana to develop two local circulator projects,

Transit 23
the Anaheim Rapid Connection and the Santa Ana-Garden Grove Fixed Guideway. These projects will provide onward connectivity from the Anaheim Regional Transportation Intermodal Center and the Santa Ana Regional Transportation Center.
As a response to the financial pressures which have forced service cuts, OCTA has also been investigating service realignment. OCTA’s Transit System Study seeks to find financially sustainable service delivery strategies, and to more closely tie bus and rail services to passenger demand. A final plan will be issued in the fall of 2011 and its guid-ing principles will be to:
1. Invest in high performing services,
2. Replace lower performing services with lower cost services,
3. Integrate city shuttles to connect Metrolink service and community circulators with the fixed route network,
4. Match service products to markets, and
5. Improve service efficiency and speeds in an integrated network.
Planned Investments
The 2035 RTP includes significant investment in public transit across all transit modes. There is a $56.6 billion dollar investment in transit capital, a $47.7 billion dollar invest-ment in Passenger Rail, and a $139.3 billion investment in transit operations and maintenance. Transit represents 64 percent of total operations and maintenance in the 2012 RTP, and 20 percent of capital investments. Passenger rail, including Phase I of the California HST program, accounts for another 18 percent of total capital investment in the 2012 RTP. Many major capital projects that were part of county level sales tax expendi-ture plans have been amended into the 2008 RTP. These include Los Angeles County’s Measure R projects, and Orange County’s Measure M projects.
TABLe 6 Investment in Transit and Passenger Rail
Investment in Transit and Passenger Rail
Mode Total Investment in Nominal Billions
BRT $ 4.6
Bus $20.9
Commuter Rail $ 3.9
Light Rail $13.1
Heavy Rail $11.1
High Speed Rail $47.7
TABLe 7 Major Transit Capital Projects in the 2012 RTP
Major Transit Capital Projects in the 2012 RTP
Exposition Transit Corridor-Phase 2 to Santa Monica
Green Line South Bay Extension
Regional Connector Transit Corridor Sepulveda Pass Transit Corridor (funded outside the outside the planning horizon of the 2012 RTP)
Crenshaw/LAX Transit Corridor San Fernando Valley (East) North/South Rapidways
Eastside Transit Corridor-Phase 2 Orange Line Canoga Extension
Gold Line Extension to Glendora West Santa Ana Branch Corridor
Green Line LAX Extension Westside Subway Extension (to Westwood)
Redlands Passenger Rail Project E Street BRT (sbX)
OCTA Bravo BRTs Perris Valley Line Metrolink Extension
OCTA Metrolink Service Expansion Program
Anaheim Rapid Connection
Santa Ana/Garden Grove Fixed Guideway Fixed Guideway Gap Closures

24 Transit
The 2012 RTP includes major capital projects that extend the scope and reach of “pre-mium” transit throughout the SCAG Region. By 2035, the projects detailed in this plan will begin to provide an integrated network of transit options for travellers in the region. This plan calls for a drastic expansion of heavy rail, light rail, rapid bus and BRT service throughout the region. Especially in Los Angeles and Orange Counties, travellers will have greatly increased ability to access the transit network, and the ability to connect onward to high speed, intercity, and commuter rail.
TABLe 8 Total Tier 2 Travel Analysis Zones Served by Transit in 2035
Tier 2 TAZs with more than 150
Residents or 50 Jobs per
acre
Tier 2 TAZs with more
than 50 Residents or Jobs per acre
Tier 2 TAZs with more
than 30 Residents or Jobs per acre
Tier 2 TAZs with more
than 15 Residents or Jobs per acre
Total 2035 Transit Network
100% 100% 99.6% 99.4%
Premium Transit Services
88.8% 77.6% 67.3% 53.6%
Rapid Transit Services
63.7% 77.6% 41.5% 29.9%
The 2035 total transit network represents a large step for connectivity and the ability of transit riders to access both the system and their destinations. The 2035 network does an excellent job of serving the densest areas of the region. As seen in TABLe 8, 100 per-cent of Traffic Analysis zones with over 150 residents or 50 jobs will have access to tran-sit within a quarter mile radius; 88.8 percent of those zones will have access to premium transit services including Rapid buses, Express buses, BRT, Urban Rail, or Commuter Rail. A further 63.7 percent of TAZs will have all or part of their area within a half mile buffer of Rapid Transit Services, including BRT, Urban rail and Commuter Rail.
Areas of compact development, including those TAZs with more than 50 jobs or residents, are similarly well served. All zones have transit access, and 77.6 percent have access to both premium and rapid transit. Slightly less dense TAZs, with more than 30 jobs or residents, are also well served by the 2035 regional transit network. Only .04 percent will
have no transit access, and two thirds will have access to premium transit. Slightly over 40 percent are located within a half-mile of rapid transit.
Almost all TAZs with more than 15 jobs or residents are served by some form of transit in 2035 (99.4percent); however only half are served by premium transit and less than a third are served by rapid transit. Sparser zones tend to be less productive for transit agencies, leading to more limited services.
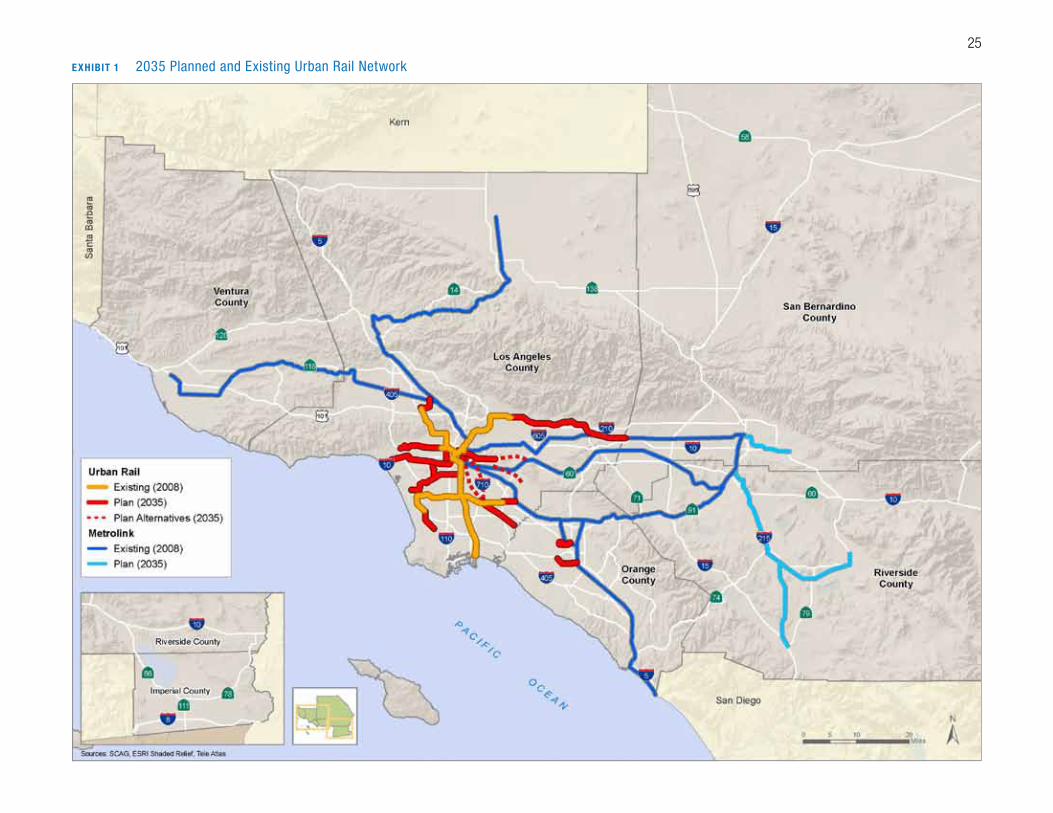
Several sets of projects will provide a massive expansion of mobility in our region. Three mega-projects, the Westside Subway extension, the Regional Connector Transit Corridor, and the Exposition Transit Corridor have the potential to connect residents to employment centers in the highly congested central Los Angeles area and the similarly congested Westside Subregion, providing important alternatives to car travel. These three projects also represent a large increase in the SCAG Region’s capacity to move passengers. The Regional Connector will also radically change the operational environment for rail transit in Los Angeles County. Light rail vehicles will use the Regional Connector tracks to connect between now unconnected Blue, Gold, and Exposition rail corridors. Upon completion, passengers boarding a rail vehicle in Pasadena or Azusa will be able to travel to Long Beach without transferring; similarly, passengers boarding at the termi-nus of the Metro Gold Line Phase 2 will be able to travel to Culver City or Santa Monica without transferring.
Other Measure R projects will extend the reach of the Metro Rail system to a large portion of Los Angeles County. The South Bay Metro Green Line extension will extend rail transit much deeper into the South Bay Subregion, and connect residents of the South Bay cities to an important jobs center in El Segundo. Similarly, the Foothill and Eastside Gold Line Extensions will increase the ability of residents of eastern Los Angeles County to access the Metro Rail System, and travel to important regional centers.
The Pacific Electric Right Of Way / West Santa Ana Branch Corridor represents an enor-mous opportunity for the SCAG region. While final modal and alignment decisions remain to be made, this corridor will be an important step forward for regional mobility. It will serve a currently underserved market in the Northeastern and Central Gateway Cities area, and provide important links to the Metro Green Line and a variety of transit options in downtown Los Angeles. Many corridor area residents are in low income households and have limited vehicle access; the corridor serves them by connecting it to important recreational and shopping opportunities, in addition to employment centers.
25
exHIBIT 1 2035 Planned and Existing Urban Rail Network
26
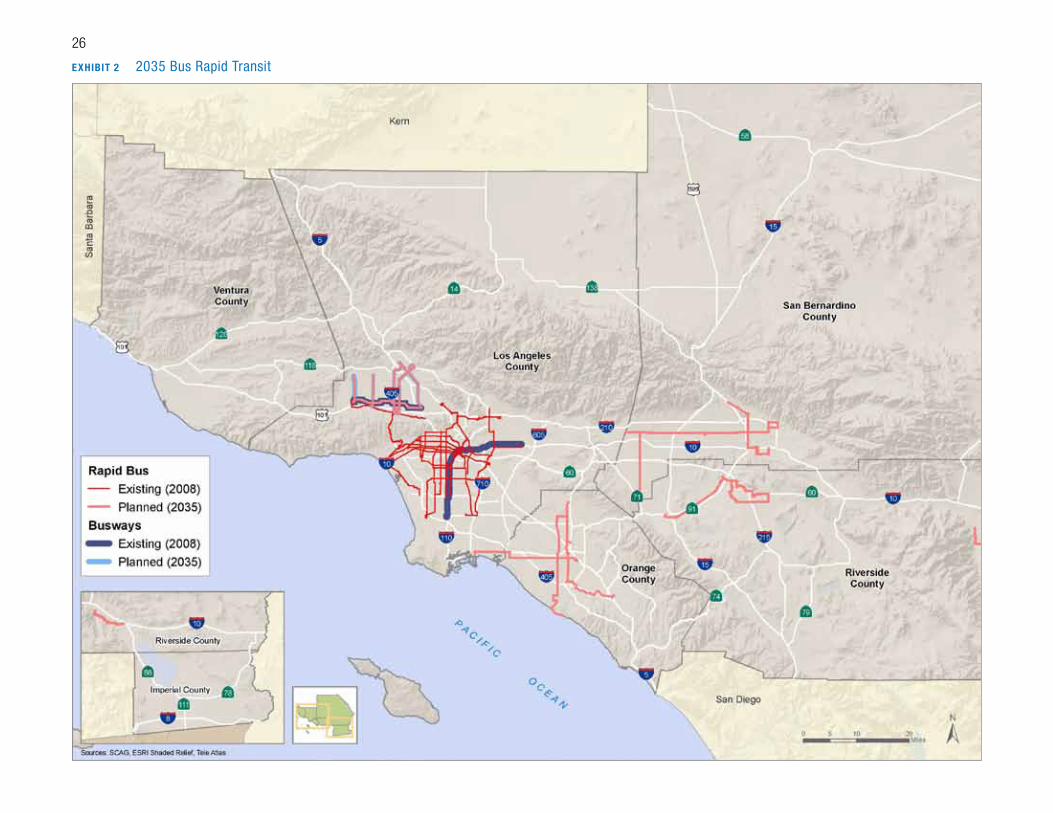
exHIBIT 2 2035 Bus Rapid Transit

27
exHIBIT 3 Local and Express Bus Network

28 Transit
Orange County’s Measure M investments will also greatly expand access to rapid transit. Orange County will initiate BRT on three initial corridors. Westminster, Harbor, and Bristol and State College boulevards will be the site of these initial investments. These corridors will connect into Priority High Frequency Corridors, where local bus bus service operating at high frequencies will provide heightened mobility for travelers.
Two additional Measure M investments will also connect to the growing BRT network. The Go Local program will offer connectivity between the existing Metrolink network and important regional destinations. The Anaheim Rapid Connection (ARC) will offer onward connectivity to the Anaheim Resort from the planned Anaheim Regional Transportation Intermodal Center (ARTIC). Travelers on ARC will be able to transfer to the Harbor Blvd BRT line, Metrolink, Amtrak’s Pacific Surfliner, and High-Speed Rail at ARTIC. Similarly, the Santa Ana Garden Grove Fixed Guideway will connect the central business district of Santa Ana to the Santa Ana Regional Transportation Center, allowing transfers to Metrolink and the Pacific Surfliner. The other terminus of the Santa Ana Garden Grove Fixed Guideway, at Harbor Blvd, will also offer connectivity to two separate BRT routes.
In the Inland Empire, new projects will also increase transit mobility. New BRT services in San Bernardino will complement the soon-to-open E street sBX BRT line, connecting to multiple Metrolink stations and extending the reach of our region’s commuter rail net-work. Furthermore, the Redlands Rail project will extend Metrolink’s service area deeper into the eastern San Bernardino Valley, and provide access to one of San Bernardino County’s major universities.
In order to further develop the integrated transit passenger rail networks, SCAG staff developed a list of fixed guideway gap closures for the 2012 RTP. These projects were developed by reviewing performance data from county transportation commission strategic planning documents, and were analyzed from a list of over 32 potential projects developed in these plans and studies. The resulting projects were analyzed on the basis of several factors:
1. Did the project close a gap in the existing rapid transit network?
2. Did the projects serve comparatively dense areas?
3. Did the projects provide intermodal connectivity?
4. Did the projects serve important regional or subregional centers for housing or employment?
5. Using locally generated performance data, what was the capital cost per out-year boarding?
Five projects were selected using this analysis. These projects, collectively titled the “fixed guideway gap closures,” will provide important links in our 2035 transit net-work. All but one of the five projects serve a minimum of 20 tier 2 Travel Analysis Zones (TAZ) projected to contain over 15 jobs or residents in 2035. All five projects connect a minimum of two other fixed guideway transit corridors, leverage those connections in to additional transit mobility, and produce at least a million annual boardings by the 2035 forecast year.
TABLe 10 Number of TAZs Served by Fixed Guideway Gap Closure Projects
Tier 2 TAZs with more than 150
Residents or 50 Jobs per
acre
Tier 2 TAZs with more
than 50 Residents
or Jobs per acre
Tier 2 TAZs with more
than 30 Residents
or Jobs per acre
Tier 2 TAZs with more
than 15 Residents
or Jobs per acre
Metro Red Line Extension
0 2 13 21
Vermont Short Corridor
7 39 60 66
Slauson Light Rail 0 10 39 77
Metro Green Line Norwalk Extension Extension
0 0 0 23
Metro Foothill Goldline Extension Phase 2b
0 0 0 14
The fixed guideway gap closure projects leverage existing investments in rail transit technology to expand the connectivity of the rail travel network, creating a system of seamless transferability throughout the network.

29
exHIBIT 4 2035 Transit Network

30 Transit
The Vermont Short Corridor is a 3 mile southward extension of the Metro Red Line serving one of the most important transit markets in Southern California. Vermont Avenue has long been Metro’s second most productive bus corridor, and its ridership is often com-petitive with the entirety of the Metrolink system. On the north end, the Vermont Corridor will allow transferability to the completed Metro Westside Subway extension, allowing access to important employment, residential, and cultural centers on the Westside. On the southern end, the short corridor will allow onward transfers to the Metro Exposition Line, allowing passengers to travel to Culver City, Santa Monica, or to transfer to the Crenshaw Corridor and travel to South Los Angeles, Inglewood, or LAX.
Important regional destinations including the University of Southern California, Pico Union, and Koreatown are directly served by the Vermont Short Corridor. Similarly, the corridor has a high proportion of low income transit dependent residents; the corridor will allow them greater ability to access job centers on the Westside, in the South Bay, and in downtown Los Angeles.
The Northward extension of the Metro Red line to the California High-Speed Rail Authority’s planned Burbank station will similarly allow greater access to intermodal transportation. The likely Burbank station for Phase I of the HST project is at Bob Hope Burbank Airport, which is also served by Metrolink and Amtrak. By using tunnels and people mover technology in the new Red Line station, the station could serve all three
transportation facilities. This extension will allow users to access intercity rail, commuter rail, high speed rail, and air travel facilities.
Together, these two projects form a new vision for the Metro Red Line, allowing “one–seat” travel between the Burbank HST station and University of Southern California, or any point in between.
Similarly the Norwalk Green Line Extension will increase the ability of travellers in the South Bay and Gateway Cities to access the proposed California HST station in Norwalk. This station, which is already served by Metrolink and the occasional Surfliner train, also provides good connectivity to bus transit via the Norwalk Transit System.
The Slauson Light Rail would connect the Crenshaw Corridor with the Metro Blue line, and provide important mobility improvements in a dense corridor with a high percentage of transit dependent residents. As noted in Chapter 6 of the Harbor Subdivision Alternatives Analysis, the corridor is currently underserved by transit and would provide many stops within close distance to dense population and employment nodes.
Phase 2b of the Metro Gold Line Foothill Extension will extend the reach of the Metro Gold Line an additional 12.6 miles in to the San Gabriel Valley, adding stations in Glendora, San Dimas, La Verne, Pomona, Claremont, and Montclair along a former Atchison Topeka Santa Fe right-of-way.
TABLe 9 Fixed Guideway Gap Closures Initial Performance Analysis
Corridor Boundaries Length (miles) Cost
Locally estimated
Annual Boardings
Rail Transit Connections
Vermont Short Corridor Wilshire/Vermont to Exposition and Vermont 3.0 $1,177.9 3,709,332 Metro Purple Line, Metro Red Line, Metro Exposition Line
Slauson Light Rail Crenshaw Corridor to Metro Blue Line Slauson Station 5.4 $ 554.0 5,213,808 Metro Crenshaw Corridor, Metro Blue Line
Metro Red Line Extension From North Hollywood Station to Burbank Airport Metrolink 2.4 $ 933.3 5,350,818 Metro Red Line, California High Speed Rail, Amtrak Pacific Surfliner, Metrolink
Metro Green Line Norwalk Extension
Norwalk Transit Center to Norwalk Metrolink (aerial option) 2.3 $ 480.2 1,495,006 Amtrak Pacific Surfliner, California High Speed Rail, Metro Green Line, Metrolink
Metro Gold Line Foothill Extension Phase 2b
Sierra Madre Villa Station to Montclair Metrolink station 13.1 $ 998.4 3,023,603 Metro Gold Line, Metrolink,

Transit 31
TABLe 11 SCAG Regional Annual Transit Ridership
2001 2005 2008 2009 2035 Plan*
Metro Rail 61,802,000 74,243,000 86,707,000 92,919,000 150,000,000
Commuter Rail
7,398,000 10,693,000 12,681,000 12,242,000 25,000,000
Bus 548,728,000 609,795,000 622,286,000 625,082,000 806,000,000
Total 617,928,000 694,731,000 721,674,000 730,243,000 981,000,000
Source: National Transit Database (NTD) for past years and SCAG model estimates for 2035 based on the 2012–2035 RTP/SCS
TABLe 12 SCAG Region Annual Passenger Miles Traveled
2001 2005 2008 2009 2035 Plan*
Metro Rail 339,800,000 442,916,000 524,813,000 554,998,000 1,428,409,000
Commuter Rail
274,625,000 359,938,000 436,565,000 419,885,000 871,495,000
Bus 2,206,840,000 2,375,502,000 2,461,654,000 2,546,884,000 3,255,693,000
Total 2,821,266,000 3,178,357,000 3,423,033,000 3,521,767,000 5,555,597,000
Source: National Transit Database (NTD) for past years and SCAG model estimates for 2035 based on the 2012–2035 RTP/SCS
TABLe 13 SCAG Region Annual Per Capita Transit Trips
2001 2005 2008 2009 2035 Plan*
Metro Rail 3.67 4.41 5.15 5.52 8.91
Commuter Rail
0.44 0.64 0.75 0.73 1.49
Bus 32.61 36.24 36.98 37.15 47.90
Total 36.73 41.29 42.89 43.40 58.30
Source: National Transit Database (NTD) for past years and SCAG model estimates for 2035 based on the 2012–2035 RTP/SCS
Plan Performance
Our region’s investment in transit and passenger rail, coupled with its commitment to attaining sustainable communities, pays heavy dividends. In 2035, we will have realized a 36 percent increase in transit and rail boardings. This includes a 30 percent increase for bus, a 73 percent increase for light and heavy rail, and an almost doubling of 97 per-cent for Metrolink. Passenger miles are also up significantly, for all types of bus service including BRT and Local, and especially for rail, reflecting a higher percentage of transit trips on to rail due to the new rail facilities being built between now and 2035.
On a per capita level, growth in transit ridership is also fairly aggressive. The region will see 23.8 percent population growth, 21.9 percent employment growth, and 26 percent more households by 2035. The rate of growth for per capita transit trips is much higher. Between 2008 and 2035, per capita Metro Rail trips will grow by 73 percent, and per capita Metrolink and Amtrak trips will grow by 97 percent. Bus trips will grow by 30 per-cent, meaning that the overall growth in per capita transit ridership will be 30 percent.1
Vehicle Miles Traveled (VMT) Reduction
The host of new investments in transit facilities, from new rail on fixed guideways to smaller capital projects for BRT, such as bus signal priority and bus lanes, will produce a large reduction in vehicle miles traveled (VMT) as these new services garner new riders to transit and reduce SOV commuting.
Some of this plans’s transit initiatives and strategies that are not capital-intensive will also reduce VMT. These include the expansion and improvement of real-time passenger information systems on our region’s transit systems, the expansion of bicycle carrying capacity on our region’s transit and rail vehicles, and the implementation of regional fare media consolidation and agreements. The improvement of real-time passenger infor-mation systems makes taking transit more appealing and convenient to non-regular or new users. This plan estimates a 2 percent increase in transit boardings by 2020, and 5percent increase by 2035 due to these improvements. This corresponds to a reduction of 1 million vehicle miles by 2020, and 2.6 million by 2035. The regional (intercounty) fare
1 RTP/SCS, population estimates from SCAG and California Department of Finance

32 Transit
consolidation and agreements and the expansion of bicycle carrying capacity strategies also will encourage new and more frequent riders to transit. The plan estimates the effect on boardings for both at an additional 1 percent by 2020 and an additional 3 percent by 2035. This corresponds to a reduction of 500,000 vehicle miles by 2020, and 1.6 million by 2035.
Strategies and RecommendationsMuch progress is being made in our region. The many new transit facilities and services programmed through 2035 will certainly increase the transit modal share as they serve the developing sustainable communities, jobs/housing balance and population increases. But aside from capital projects, there are many improvements that can be made in transit accessibility and operations. Our transit strategy calls for a number of transit initiatives including:
Operational Strategies � Implement and Expand Transit Priority Systems. Transit priority systems include
traffic signal priority, queue jumpers and bus lanes. Signal priority is a highly effective treatment that has proven to speed up bus service and attract new transit riders. Metro’s Metro Rapid program has increased speeds by over 20 percent com-pared to the local service on the same street. It also has brought new riders to its system. Bus lanes are even more effective at increasing speeds, yet, in our region, there is a dearth of such lanes. Transit agencies should heavily lobby local jurisdic-tions in which they operate to implement them, at least for peak-period operation.
� Implement Regional and Intercounty Fare Agreements and Media. Implementing additional inter-jurisdictional fare agreements and media like L.A. County’s EZ Pass will make transit more attractive and available. A pass that would cover all transit services in L.A. and Orange counties, or the whole SCAG region, is an example. The Pacific Surfliner also has fare agreements with some local transit operators along its corridor where an Amtrak ticket is good for connecting transit fare. This could be expanded to all operators along its corridor.
� Implement new BRT and limited-stop bus service. As noted above, BRT service is a good 20 percent faster than traditional local bus service. It is viewed as a “pre-mium” service, and has proven to attract new riders to transit. BRT implementation
does require a capital outlay, so in an environment of scare funding, offering limited-stop service is an excellent alternative. Limited-stop service has been shown to be about 15 percent faster than traditional local service, yet very few transit agencies in our region offer it.
� Implement increased frequencies in targeted corridors. With additional fund-ing, there are many corridors in our region that would benefit from an increased frequency of service. In many of our subregions outside of L.A. County, frequencies are seldom 15-minutes or better, and often 30, 45, or even 60-minutes on primary arterials. Orange County shaved their frequencies generally across the board due to their financial crisis. Increasing frequencies in targeted corridors where there is TOD/TPP developments, along with latent demand due to low frequencies, can increase transit mode share.
Accessibility Strategies � Increasing bicycle carrying capacity on bus and rail vehicles. Bicycling for commute
or other trip purposes is taking off in our region. The implementation of bike facili-ties is only starting to catch up. Most transit systems have two-bike racks on their buses, some have three. Metro and Metrolink have recently adjusted their bike-on-railcar guidelines to allow more bicycles. Allowing more bikes on transit vehicles, to a reasonable point, will increase transit ridership.
� Expanding and improving real-time passenger information systems. Most medium to large size transit agencies have implemented real-time passenger information systems. These have shown to attract and keep new transit riders. Knowing exactly when a bus will arrive provides an incentive to the potential transit user. Continuing to implement and expand these systems will increase transit modal share.
� Implementing First Mile/Last Mile strategies to extend the effective reach of transit. This is an area of study with recent focus. Making transit available for that first mile to a transit station, or from a transit station, or both, will encourage more transit usage, and also reduce GHGs. More than 90 percent of Metrolink riders drive to their origin station.
� Implementing new point-to-point express bus service in key corridors in the region’s HOV and HOT lane network. Our region’s HOV network is being transferred from a patchwork to a complete system of freeway-to-freeway connectivity. In addition,

Transit 33
HOT lanes are scheduled to begin on the Harbor Transitway at the end of 2012, and the El Monte Busway in early 2013. Yet, these facilities are currently underserved by express bus services. Implementing new express point-to-point services, at least in the peak-periods, will prove an attractive option to the SOV commuter.
� Implementing Local Circulators. Many local cities already have impressive networks of local community circulators and fixed-route systems. As more TOD/HQTA is built, and as the jobs/housing balance improves, more of these services should be imple-mented or expanded to encourage residents of these developments to not use their auto to make short, local trips.
Strategic Plan: Looking Ahead – Beyond the horizonThe RTP strategies discussed in Chapter 2: Transportation Investments, represent the region’s collective vision for addressing our transportation needs within the constraints of committed, available, or reasonably available revenue sources. Despite the substantial commitments of over $500 billion contained in the RTP and the associated benefits dis-cussed in Chapter 5: Measuring Up, this level of investment does not meet the full needs identified through the RTP development process. If we truly want to address all the needs set forth in this RTP, we must look toward additional strategies and investments to get us there. Often this will entail controversial and difficult choices that will push the envelope and test the boundaries of what is politically acceptable. For now, these elements are contained in the Strategic Plan with the recognition that they merit further study and that, over time and with further consensus-building, these programs and policies may move forward into the constrained RTP.
The concept of a Strategic Plan was first incorporated into the 2008 RTP. It was envi-sioned that the 2012 and subsequent RTPs would draw from the projects contained in the Strategic Plan. This has in fact occurred. The 2012–2035 RTP/SCS investments discussed in Chapter 2 attest to the success of the 2008 Strategic Plan, since several of its projects and strategies have now moved to the constrained portion of the 2012–2035 RTP/SCS. These include:
Preservation investments – The 2008 Strategic Plan called for a higher level of invest-ment to preserve the region’s multi-modal system. The 2012–2035 RTP/SCS includes $65 billion in additional preservation funding.
Operations investments (TSM) – The 2008 Strategic Plan recommended increasing funding to the cost-effective transportation system management strategies that increase the productivity of the existing system. The 2012–2035 RTP/SCS allocates $5 billion to TSM.
Dedicated Lanes for Clean-Technology Trucks on the East West Corridor – The 2008 Strategic Plan called for more detailed study of the different east west corridors and rec-ommending one for inclusion in the RTP. The 2012–2035 RTP/SCS includes the recom-mended East West Freight Corridor and provides full funding for it.

34 Transit
Metrolink and LOSSAN Rail Improvements – The 2008 Strategic Plan included unfunded improvements to Metrolink and the LOSSAN Rail corridor. The 2012–2035 RTP/SCS fully funds these improvements, partially using newly available federal and state funds.
The Westside Purple Line Extension – The 2008 Strategic Plan included the unfunded Purple Line Extension to Westwood. The 2012–2035 RTP/SCS now fully funds this exten-sion, relying on the recently adopted Measure R in Los Angeles.
The 2008 Strategic Plan strongly influenced the 2012 Constrained Plan as originally intended. Moving forward, it is again envisioned that future updates to the 2012–2035 RTP/SCS would draw from the projects contained in this Strategic Plan; exceptions would be handled on a case-by-case basis.
TABLe 11 Strategic Plan
County Category Route Name
Los Angeles BRT Metro Orange Line
Los Angeles Light Rail Metro Blue Line
Los Angeles Light Rail Metro Gold Line
Los Angeles Light Rail Metro Green Line
Los Angeles Light Rail Metro Gold Line
Los Angeles High-Speed Rail Orangeline
Los Angeles High-Speed Rail Orangeline
Los Angeles Heavy Rail Metro Purple Line
Orange Bus Systemwide Local Bus Service Expansion
Orange BRT Service Increase to Express Bus Routes in Central County
Orange BRT New Express Bus Service from Industry to Anaheim
Orange BRT New Express Bus Service from Anaheim to Laguna Hills
Orange BRT New Express Bus Service from Orange to Long Beach
County Category Route Name
Orange BRT New Express Bus Service from South Coast Metro to Long Beach
Orange BRT New Express Bus Service from Irvine to Norwalk
Orange BRT New Express Bus Service from Riverside to Brea
Orange BRT New Express Bus Service from Riverside to Anaheim
Orange BRT New Express Bus Service from Riverside to Irvine
Orange BRT New Express Bus Service from Rancho Santa Margarita to Irvine
Orange BRT New Express Bus Service from Laguna Niguel/Aliso Viejo to Irvine
Orange BRT New Express Bus Service from San Clemente to South Coast Metro
Orange BRT New Express Bus Service from Anaheim to Laguna Hills
Orange BRT Katella Avenue BRT
Orange BRT Edinger Avenue BRT
Orange BRT Beach Boulevard BRT
Orange BRT La Palma Avenue BRT
Orange BRT South County BRT
Orange BRT Enhance BRT Routes
Orange Commuter Rail Metrolink Service Expansion Program
Orange High-Speed Rail California-Nevada Super Speed Train
Orange Commuter Rail LOSSAN Capacity Increase to San Diego Border
San Bernardino Commuter Rail Redlands Rail Phase III
Riverside Intercity Rail Coachella Valley Rail Service
DesertXpress High-Speed Rail DesertXpress


Regional officesImperial County1405 North Imperial AvenueSuite 1 El Centro, CA 92243 Phone: (760) 353-7800 Fax: (760) 353-1877
Orange CountyOCTA Building 600 South Main StreetSuite 906 Orange, CA 92863 Phone: (714) 542-3687 Fax: (714) 560-5089
Riverside County3403 10th StreetSuite 805 Riverside, CA 92501 Phone: (951) 784-1513 Fax: (951) 784-3925
San Bernardino CountySanta Fe Depot 1170 West 3rd StreetSuite 140 San Bernardino, CA 92410 Phone: (909) 806-3556 Fax: (909) 806-3572
Ventura County950 County Square DriveSuite 101 Ventura, CA 93003 Phone: (805) 642-2800 Fax: (805) 642-2260
818 West 7th Street, 12th Floor Los Angeles, CA 90017 Phone: (213) 236-1800 Fax: (213) 236-1825www.scag.ca.gov
please recycle 2347 2012.03.26
Related Documents