Propensity Score Matching: A Primer for Educational Researchers Forrest Lane, Ph.D. Department of Educational Studies & Research

Propensity Score Matching: A Primer for Educational Researchers Forrest Lane, Ph.D. Department of Educational Studies & Research.
Dec 25, 2015
Welcome message from author
This document is posted to help you gain knowledge. Please leave a comment to let me know what you think about it! Share it to your friends and learn new things together.
Transcript

Propensity Score Matching: A Primer for Educational Researchers
Forrest Lane, Ph.D.Department of Educational Studies & Research

Aims• Recognize the implications for self-
selection and non-randomization in quasi-experimental research,
• Understand key terms and theory behind the propensity score matching,
• Identify strategies and resources for implementing propensity score matching into research.

Overview• Theoretical Framework• Propensity Score Matching Process• Implications & Practical Guidance

IntroductionExperimental design has historically been considered the “gold standard” for causal inference (West, 2009).

IntroductionThe problem is that experimental design may not be possible in practice
There are many ethical, political, or financial arguments against them (Cook, 2002). Some suggest experimental designs:
– Can rarely be mounted in schools
– Sacrifice internal for external validity
– Creates a rational
– decision-making model that does not describe how schools actually make decisions

Introduction“Interventions conducted under laboratory conditions with selective participant criteria do not necessarily generalized well in real world of human services” (Levant & Hasan, 2008, p. 658).

Quasi-Experiment Alternative
Allow for group comparisons but do not allow for causal inferences
Groups may systematically differ from one another based on number of covariates and therefore cannot be directly compared. – Non-randomized studies may lead to effect
size bias when interpreting treatment effects.

ProblemIncreasing calls for evidence of a program’s or intervention’s effectiveness.
– Psychology: Bauer (2007); Collins, Leffingwell, & Belar (2007); Levant & Hasan (2008)
– Education: Rudd & Johnson (2008); Slavin (2002)
Quasi-experiments may not meet this aim

Experimental
• Better estimates of treatment effects with limited generalizability
Quasi-Experimental
• Biased estimates of treatment effects with greater generalizability

Counterfactuals• Is a conceptual framework for
investigating causality.
• Two well-known frameworks include the approaches taken by Campbell (1957) and Rubin (1974; 2005)

*Table taken from West and Thoemmes (2010)
DIMENSION CAMPBELL RUBIN
Domain Psychology, Education
Medicine, Economics
Outcome Definition Constructs Operations
Key Feature Threats to Validity Precise Assumptions
Approach Inductive, Scientific Deductive, Mathematical
Primary Methods Prevention of Threat Assumption Checking, Sensitivity Analysis
Causal Effect Estimate
Direction Only Exact Magnitude
Role of Measurement
Strong Emphasis Less Emphasis

Propensity Score Matching• Propensity score matching (PSM) is a
statistical technique that aims to controls for self-selection bias and thus extend causal inference into non-randomized or quasi-experimental studies (Rosenbaum & Rubin, 1983).
• Grounded in the Rubin (1794; 2005) counterfactual framework.

Propensity Score Matching• The method uses statistical techniques to
reduce differences in the likelihood of group assignment by matching participants on their likelihood of group assignment.
• PSM assumes, once groups are well matched, systematic differences between groups have been removed and causal inference can be extended.

Propensity Score Matching“For more than two decades, advanced statistical methods known as propensity score (PS) techniques, have been available to aid in the evaluation of cause-effect hypotheses in observational studies. None the less, PS techniques have not yet been used widely in psychological research” (Harder, Stuart, & Anthony, 2010).

Articles Using PSM
Figure taken from Thoemmes & Kim (2011)

PSM in the Literature• Grunwald & Mayhew (2008) examined the development
of moral reasoning in young adults and demonstrated a significant reduction is the overestimation of effects.
• Morgan (2001) used propensity score matching and demonstrated the effect of private school education on math and reading achievement is actually larger than findings in non-matched samples.
• Other similar studies have been demonstrated in economics (Dehejia & Wahba, 2002), medicine (Schafer & Kang, 2008), and sociology (Morgan & Harding, 2006).

Defining a Propensity Score• Defined as the conditional probability of
assignment to a particular treatment or control given a set of covariates (Rosenbaum & Rubin, 1983).

Propensity Scores• Propensity scores incorporate covariates
into a singular scalar variable ranging from 0 to 1 which can then be used to match participants in treatment groups.
• Once matched, treatments effects should be more reflective of the true effect and analogous to interpretation of randomized designs

Propensity Score Matching Process
Estimation/ Modeling Strategy
Conditioning Strategy
Balance Evaluation
Estimation of
Treatment Effects
Evaluation of Hidden
Bias
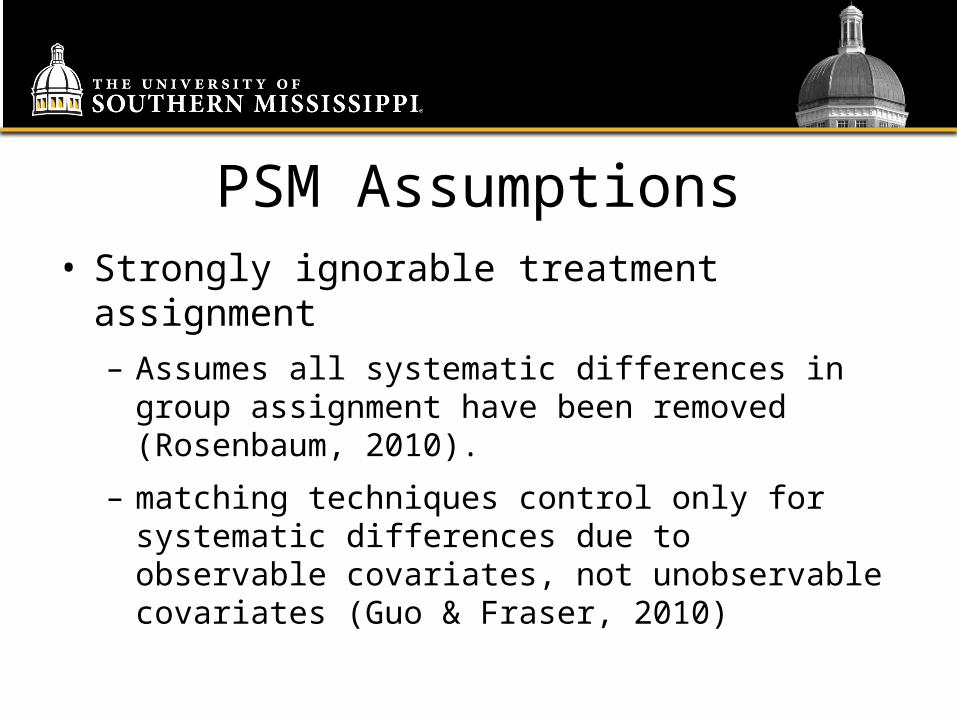
PSM Assumptions• Strongly ignorable treatment assignment– Assumes all systematic differences in group
assignment have been removed (Rosenbaum, 2010).
– matching techniques control only for systematic differences due to observable covariates, not unobservable covariates (Guo & Fraser, 2010)

Random Assignment• To apply the Rubin counterfactual model,
the assumption of strongly ignorable treatment assignment must be met.
• In other words, conditional on a set of covariates, the outcome for a participant must be independent of treatment assignment (Guo & Fraser, 2010)

Propensity Score Matching Process
Estimation/ Modeling Strategy
Conditioning Strategy
Balance Evaluation
Evaluation of
Treatment Effects
Post-hoc Test for Hidden
Bias

Propensity Score Estimation
• The most commonly used method is logistic regression (Thoemmes & Kim, 2011).
• Other methods include probit regression, classification trees or ensemble methods such as bagging, boosted regression trees, and random forest (Shadish, Luellen, & Clark, 2006).

Modeling Strategy• Non-Parsimonious– All theoretically related variables included in
PS estimation
• Parsimonious– Some variables can be ignored as a source of
potential bias• Hierarchical Regression• Stepwise Regression

Conditioning Strategy• Matching– One-to-one, One-to-many, Caliper
• Stratification
– stratification across quintiles may reduce approximately 90% of bias due to covariates (Shadish, Luellen, & Clark, 2005)
• Regression Adjustment
– The PS may be used as a covariate in ANCOVA but must meet assumptions of the analysis.

Balance Evaluation• The standardized difference in the mean
propensity score in the two groups should be near zero (d < .20)
• The ratio of the variance of the propensity score and continuous covariates in the two groups should be near one, preferably between 0.80 and 1.25

Balance Evaluation• Multivariate Measures
– Hansen and Bowers (2008) provide one test that assesses simultaneously whether any variable or linear combination of variables was significantly unbalanced after matching” using a distribution (Thoemmes, 2012, p. 9).
– A measure , may also be used which assesses the balance of all covariates including interaction effects (Iacus, King, & Porro, 2011)

Estimating Treatment Effects
• Treatment effects can be estimated on the outcome variable(s) by testing in newly matched sample through a t-test or appropriate multi-group equivalent analysis.
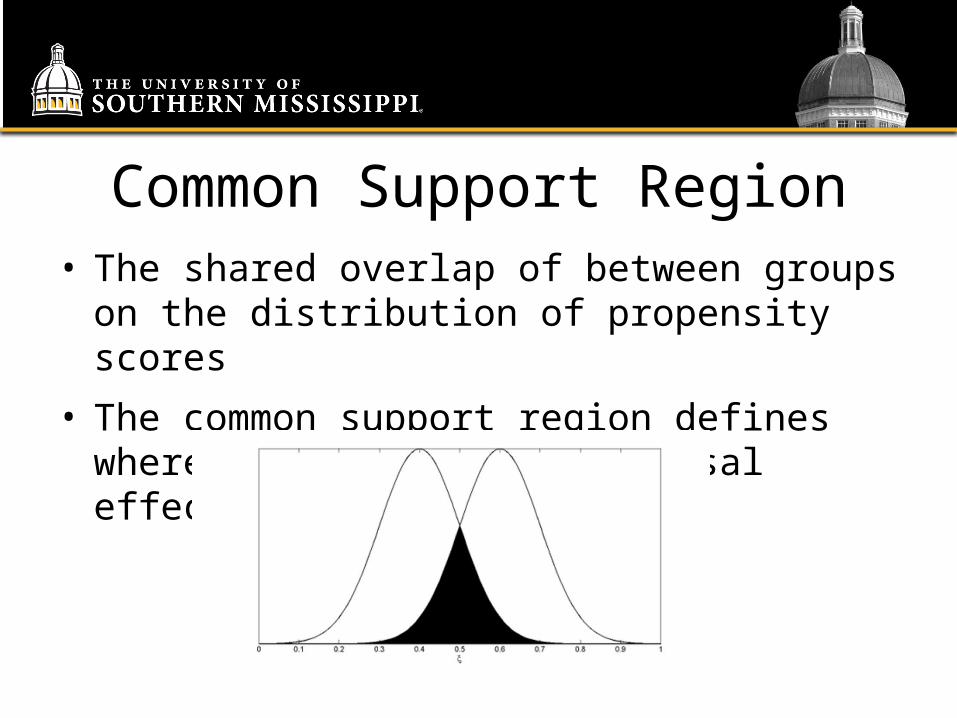
Common Support Region• The shared overlap of between groups on
the distribution of propensity scores
• The common support region defines where the estimation of causal effects may be inferred.

Hidden Bias• Two participants measured on the same
covariates (x), should have the same probability (P) of group assignment. – When true, the ratio of the probability for
group assignment relative to non-group assignment should be close to one.
– If false, probability of group assignment differs by a multiplier or factor of Γ

Hidden Bias• Rosenbaum (2010) suggested a Wilcoxon
signed rank test may be used to statistically test the impact of various levels of on the interpretation of the treatment effect (i.e., sensitivity analysis).

Heuristic Scenario• The content area reading strategies program
(CARS) was implement within Florida schools to improve basic reading levels skills.
• Students were taught three animal science lessons from the state approved curriculum and included anatomy and physiology, nutrition, and reproduction. – The lessons were taught over the course of 23 school
days, or nearly 1600 minutes of instruction” (Park & Osborne, 2007, p. 57).

Heuristic Scenario• The problem is that students could not be
randomly assigned to treatment and comparison groups.
• Park and Osborne (2007) also suggested student pre-test scores, grade level, grade point average, gender, ethnicity, and standardized reading levels were statistically significant predictors of agricultural posttest scores ( = .67).

Arguments Against ANCOVA
• ANCOVA is inappropriate when differences between groups on covariates are large (Hinkle, Wiersma, & Jurs, 2003).
• The outcome variable in ACOVA is an adjusted score which makes interpretation difficult
• Potential mismatch between the research question and analytic technique or Type IV error (Fraas, Newman, & Pool, 2007).

Arguments Against ANCOVA
• The use of ANCOVA and propensity score matching may result in a different interpretation of the treatment effect (Fraas, Newman, & Pool, 2007).

Method• Logistic regression was used to estimate
propensity scores
• One-to-one matching was the conducted using a caliper width of 0.25 standard deviations of the logit transformation of the propensity score (Stuart & Rubin, 2007). – Matched pairs exceeding the caliper width were
discarded from the analysis.
• Balanced was then examined on continuous variables using NHST and effect sizes.
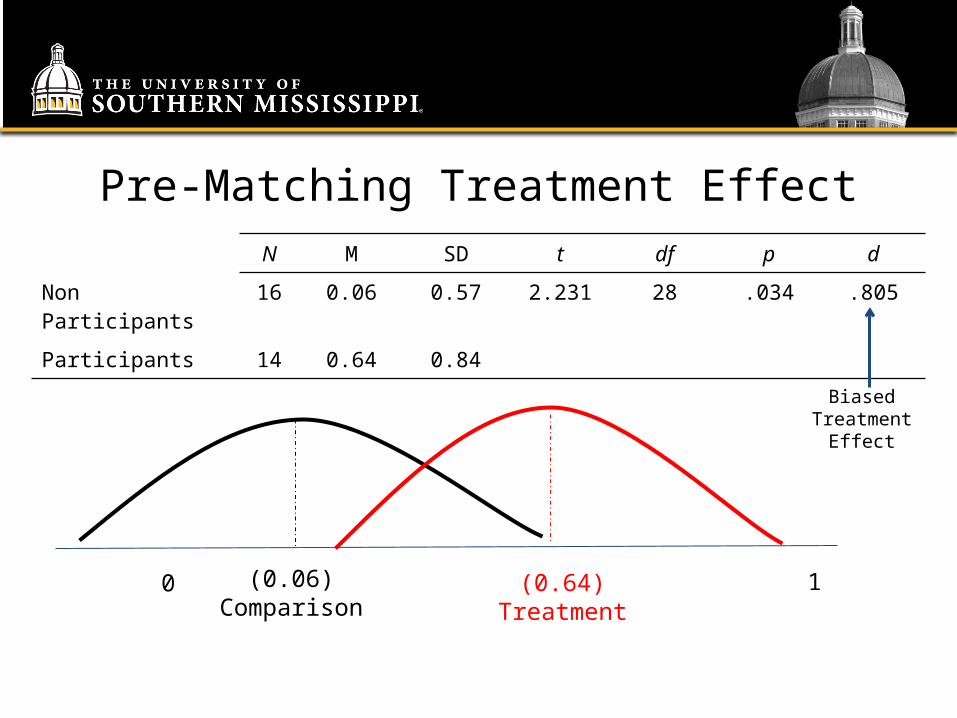
Pre-Matching Treatment EffectN M SD t df p d
Non Participants 16 0.06 0.57 2.231 28 .034 .805
Participants 14 0.64 0.84
(0.06)Comparison
(0.64)Treatment
0 1
Biased Treatment
Effect

Likelihood of Receiving TreatmentN M SD t df p d
Non Participants 16 .33 .32 2.989 28 .006 1.12
Participants 14 .62 .24
(.36)Comparison
(.59)Treatment
0 1
Unlikely to be in treatment group
Likely to be in the treatment
group
Amount of Bias

Matching Algorithms• R
– MatchIt in R (Ho, Imai, King, and Stuart, 2007) – Matching (Sekhon, 2011)
• Stata– PSMATCH2 (Leuven & Sianesi, 2004)– Pscore (Becker & Ichino, 2002)
• SAS– SUGI 214-26 “GREEDY” (D’Agostino, 1998),
• SPSS – PSM Matching_2.spd (Thoemmes, 2012)

ControlID
Propensity Score
Logit Score
Treatment ID
Propensity Score
Logit Score d (Caliper)
2 .453 -0.190 26 .450 -0.200 -0.010
9 .201 -1.380 19 .195 -1.420 -0.030
12 .564 0.260 24 .575 0.300 0.040
11 .497 -0.010 29 .456 -0.180 -0.140
16 .081 -2.430 28 .111 -2.080 0.300
8 .533 0.130 23 .631 0.530 0.340
5 .817 1.500 18 .662 0.670 -0.700
10 .500 0.000 27 .730 0.990 0.850
6 .395 -0.430 21 .750 1.100 1.300

Assessing Balance• The standardized difference in the mean
propensity score in the two groups should be near zero (d < .20)
• The ratio of the variance of the propensity score in the two groups should be near one, preferably between 0.80 and 1.25 (Rubin, 2001).

Pre-Matching Group DifferencesN M SD t df p d
Non Participants 16 .36 .22 2.989 28 .006 1.12
Participants 14 .59 .22
(.36)Comparison
(.59)Treatment
0 1
Unlikely to be in treatment group
Likely to be in the treatment
group
Amount of Bias

Post-Matching Group DifferencesN M SD t df p d
Non Participants 7 .44 .24 0.930 12 .930 .05
Participants 7 .46 .25
(.44)(.46)0 1
Unlikely to be in treatment group
Likely to be in the treatment
group
Amount of Bias

Pre-Matching Treatment EffectN M SD t df p d
Non Participants 16 0.06 0.57 2.231 28 .034 .805
Participants 14 0.64 0.84
(0.06)Comparison
(0.64)Treatment
0 1
Biased Treatment
Effect

Post-Matching Treatment EffectN M SD t df p d
Non Participants 7 0.14 0.69 0.630 12 .539 .338
Participants 7 0.43 0.98
(0.14) (0.43)
UnbiasedTreatment
Effect
0 1

Practical Guidance• Some participants will be discarded as a
result of poor matching.
• As a result, larger samples are generally needed for PSM (Luellen, Shadish, & Clark, 2005; Yanovitzky, Zanutto, & Hornik, 2005).– How many participants are needed is unclear
(Luellen et al., 2005, p. 548).
– N >100 may be too small (Akers, 2010), particularly as prediction of group assignment improves (Lane, 2011).

Practical Guidance• Examine improvement in prediction relative
to the null as there is some evidence to suggest this reduces model sensitivity to hidden bias (Lane, 2011). – Pearson goodness of fit, Hosmer-Lemeshow
goodness-of-fit test and pseudo have also been suggested for use in evaluating propensity scores (Guo & Fraser, 2010)
– I index (Huberty & Holmes, 1983; Huberty & Lowman, 2000) may also provide a measure of effect size.

Practical Guidance• Other methods beyond logistic regression
are available when estimating propensity scores including classification trees, bagging, and boosted regression trees(Austin, 2008; Shadish et al., 2006).
• Each of these estimation methods were created to help better inform covariate selection.

Practical Guidance• Matching strategies seem to vary greatly
in the literature.
• However, other strategies exist (e.g., one-to-many matching) that may retain more participants, improving statistical power and perhaps generalizability of treatment results.

Useful Literature• Caliendo and Kopeinig (2008) and Stuart
(2010) provide a thorough discussion on the implementation of different matching methods.
• Thoemmes and Kim (2011) present a systematic review of the various strategies employed by social science researchers using PSM.
• Guo and Fraser (2010) provide an entire text dedicated to propensity score matching.

ReferencesAkers, A. (2010). Determination of the optimal number of strata for bias
reduction in propensity score matching (Doctoral dissertation, University of North Texas). ProQuest, AAT 3417726.
Bauer, R. M. (2007). Evidence-based practice in psychology: Implications for research and research training. Journal of Clinical Psychology, 63, 685-694.
Becker, S. O., & Ichino, A. (2002). Estimation of average treatment effects based on propensity scores. The stata Journal, 2, 358-377.
Caliendo, M., & Kopeinig, S. (2008). Some practical guidance for the implementation of propensity score matching. Journal of Economic Surveys, 22, 31-72.
Campbell, D. T. (1957). Factors relevant to the validity of experiments in social settings. Psychological Bulletin, 54, 297-312.

ReferencesCollins, F. L., Leffingwell, T. R., Belar, C. D. (2007). Teaching evidence-based
practice: Implications for psychology. Journal of Clinical Psychology, 63, 657-670.
Cook, T. D. (2002). Randomized experiments in educational policy research: A critical examination of the reasons the educational evaluation community has offered for not doing them. Educational Evaluation and Policy Analysis, 24, 175-199.
D’Agostino, R. B. (1998). Tutorial in biostatistics: Propensity score methods for bias reduction in the comparison of treatment to a non-randomized control group. Statistics in Medicine, 17, 2265-2281.
Dehejia, R. H., & Wahba, S. (2002). Propensity score-matching methods for nonexperimental causal studies. Review of Economics and Statistics, 84, 151-161.
Fraas, J. W., Newman, I., & Pool, S. (2007). The use of propensity score analysis to address isues associated with the use of adjusted means produced by analysis of covariance. Multiple Linear Regression Viewpoints, 33, 23-31.

ReferencesGuo, S., & Frasher, M. W. (2010). Propensity score analysis: Statistical
methods and applications. Thousand Oaks, CA: Sage Publications.
Grunwald, H.E. & Mayhew, M.J. (2008). The use of propensity scores in identifying a comparison group in a quasi-experimental design: Moral reasoning development as an outcome. Research in Higher Education, 49(8), 758-775.
Hansen, B., & Bowers., J. (2008). Covariate balance in simple, stratified and clustered comparative studies. Statistical Science, 23, 219-236.
Harder, V. S., Stuart, E. A., & Anthony, J. C. (2010). Propensity score techniques and the assessment of measured covariate balance to test causal associations in psychological research. Psychological Methods, 15, 234-249.
Ho D., Imai, K., King, G.,& Stuart, E. (2007). Matching as nonparametric preprocessing for reducing model dependence in parametric causal inference. Political Analysis, 15, 199-236.

ReferencesHuberty, C. J, & Holmes, S. E. (1983). Two-group comparisons and univariate
classification. Educational and Psychological Measurement, 43, 15-26.
Huberty, C. J., & Lowman, L .L. (2000). Group overlap as a basis for effect size. Educational and Psychological Measurement, 60, 543-563.
Iacus, S. M., King, G., & Porro, G. (2011). Causal inference without balance checking: Coarsened exacted matching. Political Analysis, 20, 1-24.
Lane, F., C. (2011). The use of effect size estimates to evaluate covariate selection, group separation, and sensitivity to hidden bias in propensity score matching (University of North Texas). ProQuest Dissertations and Theses, 115. (1041249363).
Leuven, E., & Sianesi, B. (2004). PSMATCH2: Stata module to perform full Mahalanobis and propensity score matching, common support graphing, and covariate imbalance testing, Statistical Software Components S432001, Boston College Department of Economics.
Levant, R. F., & Hasan, N. T. (2008). Evidence-based practice in psychology. Professional Psychology: Research and Practice, 39, 658-662.

ReferencesMorgan, S. L. (2001). Counterfactuals, causal effect heterogeneity, and the
Catholic school effect on learning. Sociology of Education, 74, 341–374.
Morgan, S., & Harding, D. (2006).Matching estimators of causal effects: Prospects and pitfalls in theory and practice. Sociological Methods & Research, 35(1), 3-60. DOI: 10.1177/0049124106289164.
Painter, J. (2009). Jordan institute for families: Virtual research community. Retrieved from http://ssw.unc.edu/VRC/Lectures/index.htm.
Park, T. D., & Osborne, E. (2007). Reading strategy instruction in secondary agricultural science courses: An initial perspective. Career and Technical Education Research, 32, 45-75.
Rosenbaum, P. R., & Rubin, D. B. (1983b). The central role of the propensity score in observational studies for causal effects. Biometrika, 70, 41-55.

ReferencesRosenbaum, P. R., & Rubin, D. B. (1984). Reducing bias in observational
studies using subclassification on the propensity score. Journal of the American Statistical Association, 79(387), 516-524
Rosenbaum, P. R. (2010). Design of observational studies. New York: Springer.
Rubin, D. B. (1974). Estimating causal effects of treatments in randomized and nonrandomized studies. Journal of Educational Psychology, 66, 688-701.
Rubin, D. B. (2001). Using propensity scores to help design observational studies: application to the tobacco litigation. Health Services & Outcomes Research Methodology 2, 169–188.
Rubin, D. B. (2005). Causal inference using potential outcomes: Design, modeling, decisions. Journal of the American Statistical Association, 100, 322-331.
Rudd, A. & Johnson, R. B. (2008). Lessons learned from the use of randomized and quasi-experimental field designs for the evaluation of educational programs. Studies in Educational Evaluation, 34, 180-188.

ReferencesSchafer, J. L., & Kang, J. (2008). Average causal effects from nonrandomized
studies: A practical guide and simulated example. Psychological Methods, 13(4), 279-313.
Schneider, B., Carnoy, M., Kilpatrick, J., Schmidt, W. H., & Shavelson, R. J. (2007). Estimating causal effects using experimental and observational designs (report from the Governing Board of the American Educational Research Association Grants Program). Washington, DC: American Educational Research Association.
Sekhon, J. S. (2011). Multivariate and propensity score matching software with automated balance optimization: The matching package for R. Journal of Statistical Software, 42, 1-52.
Shadish W. R., Luellen J. K., & Clark M. H. (2005). Propensity scores: An introduction and experimental test. Evaluation Review, 29(6), 530-558.

ReferencesShadish W. R., Luellen J. K., & Clark M. H. (2006). Propensity scores and
quasi-experiments: A testimony to the practical side of Lee Sechrest. In: Bootzin R.R., McKnight P.E. (Eds.), Strengthening research methodology: Psychological measurement and evaluation. American Psychological Association: Washington, DC, 143–157.
Slavin, R. E. (2002). Evidence-based education policies: Transforming educational practice and research. Educational Researcher, 31, 15-21.
Stuart, E. A. (2010). Matching methods for causal inference: A review and a look forward. Statistical Science, 25, 1-21.
Thoemmes, F. J., & Kim, E. S. (2011). A systematic review of propensity score methods in the social sciences. Multivariate Behavioral Research, 46, 90-118. doi:10.1080/00273171.2011.540475

ReferencesThoemmes, F., (2012). Propensity score matching in SPSS. Available at
http://arxiv.org/ftp/arxiv/papers/1201/1201.6385.pdf.
West, S.G. (2009). Alternatives to randomized experiments. Current Directions in Psychological Science, 18, 299-304.
Yanovitzky, T., Zanutto, E., & Hornik, R. (2005). Estimating causal effects of public health education campaigns using propensity score methodology. Evaluation and Program Planning, 28(2), 209-220. doi: 10.1016/j.evalprogplan.2005.01.004
Related Documents