Hindawi Publishing Corporation EURASIP Journal on Wireless Communications and Networking Volume 2009, Article ID 784905, 13 pages doi:10.1155/2009/784905 Research Article Propagation Measurements and Comparison with EM Techniques for In-Cabin Wireless Networks Nektarios Moraitis, 1 Philip Constantinou, 1 Fernando Perez Fontan, 2 and Pavel Valtr 2 1 Mobile Radiocommunications Laboratory, National Technical University of Athens, 9 Heroon Polytechniou str., Zografou, 15773, Athens, Greece 2 Department of Signal Theory and Communications, ETSI Telecommunicacion, University of Vigo, 36200, Vigo, Spain Correspondence should be addressed to Fernando Perez Fontan, [email protected] Received 2 September 2008; Revised 20 January 2009; Accepted 16 March 2009 Recommended by Claude Oestges This paper presents results of a narrowband measurement campaign conducted inside a Boeing 737–400 aircraft, the objective being the development of a propagation prediction model which can be used in the deployment of in-cabin wireless networks. The measurements were conducted at three different frequency bands: 1.8, 2.1, and 2.45 GHz, representative of several wireless services. Both a simple, empirical, inverse distance power law and a deterministic, site-specific model were investigated. Parameters for the empirical model were extracted from the measurements at different locations inside the cabin: aisle and seats. Additionally, a statistical characterization of the multipath scenario created by the transmitted signal and the various cabin elements is presented. The deterministic model, based on Physical Optics (PO) techniques, provides a reasonable match with the empirical results. Finally, measurements and modeling results are provided for the penetration loss into the cabin (or out of the cabin), representative of interference scenarios. Copyright © 2009 Nektarios Moraitis et al. This is an open access article distributed under the Creative Commons Attribution License, which permits unrestricted use, distribution, and reproduction in any medium, provided the original work is properly cited. 1. Introduction Airplanes seem to be the last remaining frontier where wireless communications and Internet access are still not available [1]. Airlines are increasingly interested in providing passengers with in-flight wireless services allowing a similar entertainment or business experience as their terrestrial counterparts [2]. The so-called “in-cabin wireless networks” will allow the passengers to use their own personal equip- ment such as mobile phones, laptops, or PDAs while the air- craft is en-route. The typical onboard infrastructure contains an in-cabin wireless access point, a service integrator/server and an aircraft-to-satellite link, in order to connect the in- cabin network to the terrestrial backbone network through a satellite, as shown in Figure 1. To succeed in the implementation of such wireless communication systems inside aircraft, and to assess their expected performance, it is necessary to have at our disposal an in-depth and thorough characterization of the in-cabin channel. Furthermore, to avoid interference from outside networks, or interfering with external networks, it is essential to assess and limit the attenuation introduced by the body of the aircraft. Up to now, only few measurement campaigns have been conducted in this type of scenarios, for example, [2] and [3], at very specific frequency bands. Scarce deterministic prediction and capacity planning studies [4–8] have been carried out. Simple empirical, regression-based models have been developed in [9]. As for deterministic models, they have been mainly based on (Uniform Theory of Diffraction) UTD techniques [6]. Some of the references also provide presence of passenger effects [10] and wideband measurements, that is, delays spread, not considered in this paper. Some of these studies have been performed in relation to the use of Ultra- wideband (UWB) systems [10, 11], a technique likely to be used in Wireless Personal Area Networks (WPAN) for linking computers and peripherals at very short distances. A major concern in the use of wireless passenger-carried electronic devices (PEDs) aboard aircraft is their electromag- netic compatibility (EMC) with aircraft electronic systems.

Welcome message from author
This document is posted to help you gain knowledge. Please leave a comment to let me know what you think about it! Share it to your friends and learn new things together.
Transcript

Hindawi Publishing CorporationEURASIP Journal on Wireless Communications and NetworkingVolume 2009, Article ID 784905, 13 pagesdoi:10.1155/2009/784905
Research Article
Propagation Measurements and Comparison withEM Techniques for In-Cabin Wireless Networks
Nektarios Moraitis,1 Philip Constantinou,1 Fernando Perez Fontan,2 and Pavel Valtr2
1 Mobile Radiocommunications Laboratory, National Technical University of Athens, 9 Heroon Polytechniou str.,Zografou, 15773, Athens, Greece
2 Department of Signal Theory and Communications, ETSI Telecommunicacion, University of Vigo, 36200, Vigo, Spain
Correspondence should be addressed to Fernando Perez Fontan, [email protected]
Received 2 September 2008; Revised 20 January 2009; Accepted 16 March 2009
Recommended by Claude Oestges
This paper presents results of a narrowband measurement campaign conducted inside a Boeing 737–400 aircraft, the objectivebeing the development of a propagation prediction model which can be used in the deployment of in-cabin wireless networks. Themeasurements were conducted at three different frequency bands: 1.8, 2.1, and 2.45 GHz, representative of several wireless services.Both a simple, empirical, inverse distance power law and a deterministic, site-specific model were investigated. Parameters for theempirical model were extracted from the measurements at different locations inside the cabin: aisle and seats. Additionally, astatistical characterization of the multipath scenario created by the transmitted signal and the various cabin elements is presented.The deterministic model, based on Physical Optics (PO) techniques, provides a reasonable match with the empirical results. Finally,measurements and modeling results are provided for the penetration loss into the cabin (or out of the cabin), representative ofinterference scenarios.
Copyright © 2009 Nektarios Moraitis et al. This is an open access article distributed under the Creative Commons AttributionLicense, which permits unrestricted use, distribution, and reproduction in any medium, provided the original work is properlycited.
1. Introduction
Airplanes seem to be the last remaining frontier wherewireless communications and Internet access are still notavailable [1]. Airlines are increasingly interested in providingpassengers with in-flight wireless services allowing a similarentertainment or business experience as their terrestrialcounterparts [2]. The so-called “in-cabin wireless networks”will allow the passengers to use their own personal equip-ment such as mobile phones, laptops, or PDAs while the air-craft is en-route. The typical onboard infrastructure containsan in-cabin wireless access point, a service integrator/serverand an aircraft-to-satellite link, in order to connect the in-cabin network to the terrestrial backbone network through asatellite, as shown in Figure 1.
To succeed in the implementation of such wirelesscommunication systems inside aircraft, and to assess theirexpected performance, it is necessary to have at our disposalan in-depth and thorough characterization of the in-cabinchannel. Furthermore, to avoid interference from outside
networks, or interfering with external networks, it is essentialto assess and limit the attenuation introduced by the body ofthe aircraft.
Up to now, only few measurement campaigns have beenconducted in this type of scenarios, for example, [2] and[3], at very specific frequency bands. Scarce deterministicprediction and capacity planning studies [4–8] have beencarried out. Simple empirical, regression-based models havebeen developed in [9]. As for deterministic models, they havebeen mainly based on (Uniform Theory of Diffraction) UTDtechniques [6]. Some of the references also provide presenceof passenger effects [10] and wideband measurements, thatis, delays spread, not considered in this paper. Some of thesestudies have been performed in relation to the use of Ultra-wideband (UWB) systems [10, 11], a technique likely to beused in Wireless Personal Area Networks (WPAN) for linkingcomputers and peripherals at very short distances.
A major concern in the use of wireless passenger-carriedelectronic devices (PEDs) aboard aircraft is their electromag-netic compatibility (EMC) with aircraft electronic systems.
2 EURASIP Journal on Wireless Communications and Networking
Satellite
Backbone network
-On-board server-Service integrator
Mobilephone
PortablePC
PDA
Wireless accesspoint
In-cabinWireless network
GSMUMTSWLAN
BluetoothTM
Aircraft-to-satelliteantenna
Satellite dish
Router
Space segment Ground segment
Figure 1: In-cabin wireless network infrastructure.
Intentional PED emitters are protected by frequency sep-aration regulated by the International TelecommunicationUnion (ITU). Therefore, any intentional emission from anarbitrary PED is out of band for any aircraft NAV/COM sys-tem today [1]. Due to frequency separation WLAN 802.11bshould not be a candidate to interfere with sensitive aircraftnavigation and communication systems. WLAN is out ofband to any current aircraft navigation or communicationsystem. Consequently, Bluetooth, for example, currently isexempt from restrictions on wireless emitters inside thecabin [12]. Intentional emitters can be allowed aboardaircraft according to RTCA/DO233 recommendations if theirsafe use is demonstrated [13]. For A340-600 the safe useand compatibility of WLAN has been demonstrated in theaircraft environment at a power level artificially increased250 times. Bluetooth has been investigated by Intel [14].Lufthansa already provides a certified wireless service inthe cabin in combination with portable electronic devices.During tests conducted thus far, even nonessential systemssuch as in-flight entertainment that are qualified to lowsusceptibility levels have not been observed to be disturbed[1]. From a technical point of view there is no generalobjection to the use of these services.
The first goal of this paper is to describe the narrowbandmeasurement campaign performed and provide an adequatechannel characterization of the in-cabin environment forpersonal wireless communications at GSM, UMTS, and ISMbands. This paper provides an empirical in-cabin path lossmodel together with a statistical characterization of themultipath environment, that is, the spatial distribution ofthe received signal, that is, a standing wave, complementingthe results provided in the aforementioned papers. Ourresults refer to the aisle as well as the passenger seats. Theinsertion loss caused by the seat backrests is also definedand quantified. Additionally, entry loss measurements wereconducted to evaluate the outdoor-to-indoor attenuation
introduced by the body of the aircraft at different seats alongits length.
The reported measurements were performed inside aBoeing 737–400 aircraft at three different frequency bands:
(i) 1.8 GHz representative of GSM services,
(ii) 2.1 GHz for UMTS networks,
(iii) 2.45 GHz for WLAN and Bluetooth links.
The measurements have been performed using standardantennas. An alternative to providing in-cabin coverage isusing radiating cables, also called leaky feeders, laid along theroof of the cabin [3].
The second target was to develop a simple, site-specificmodel for in-cabin and outdoor-indoor propagation basedon Physical Optics (PO) techniques. The approach followed,and the comparisons between predictions and measure-ments are presented in some detail. The main purpose ofdeveloping an EM based, site-specific tool is the need toextend the modeling to all possible types of aircraft. Thereported measurements have been performed in a medium-sized plane. Consequently, the empirical models derived forthis aircraft will not be usable in much larger airplanes, with amuch larger size, and different configuration: distribution ofseats, and so forth. However, once an EM model is properlyvalidated and fine-tuned, it will be possible to use it inany new aircraft configuration, and especially, at differentfrequency bands that need analysis. Thus, the contributionmade in this paper is expected to be of immediate practicalinterest.
The remainder of this paper is organized as follows.Section 2 presents the experimental setup for the in-cabinand outdoor-to-cabin measurements, a detailed descriptionof the aircraft, and the measurement procedure are discussed.In Section 3, we show the empirical path loss model andcorresponding extracted parameters from the measurement
EURASIP Journal on Wireless Communications and Networking 3
Fron
t BackTx Rx
1 m 1 m 1 m
21 m . . .
Row number: 1 2 3 54 6 7 8 9 10 1211 13 14 15 1716 18 19 21 22 2423 25 2620
A
ALA B
CC
CGDEF
Rx position duringseat measurements
3.54
m
A: AttendantC: ClosetG: GalleyL: Lavatory
AL
L A
A
G
Figure 2: Ground plan of the measurement environment.
data, moreover, the fading statistics of the in-cabin radiochannel are given. Additionally, the entry losses into thecabin for different locations along the length of the aircrafthave also been extracted. Section 4, discusses the physical,PO-based model developed together with implementationdetails. A comparison between measurements and predic-tions is presented both for the in-cabin and penetrationcases. Finally, Section 5 is devoted to summarizing the workpresented in the preceding sections.
2. Experimental Setup
2.1. Measurement Environment. The Boeing 737–400 [15]is a short-haul aircraft with a seating capacity of 156passengers, all in economy class configuration, arranged in26 rows. The aircraft dimensions are overall aircraft length38.4 m, height 11.15 m, maximum cabin width and height3.54 m and 2.2 m, respectively, and length of the passengersarea 22 m. Seats are called A, B, and C from window to aisleon the left side of the aisle facing the direction of flight,and D, E, and F from aisle to window on the right side ofthe aisle. The aisle width is 0.5 m. The seat height is 1.15 mabove the floor and the distance between the seat centersis 43 cm. The distance between rows is 81 cm. The seatshave textile covers. The passenger luggage compartments arelocated 1.68 m above the floor, 1.16 m apart, and 45 cm overthe passenger heads. The ground plan of the measurementenvironment is shown in Figure 2.
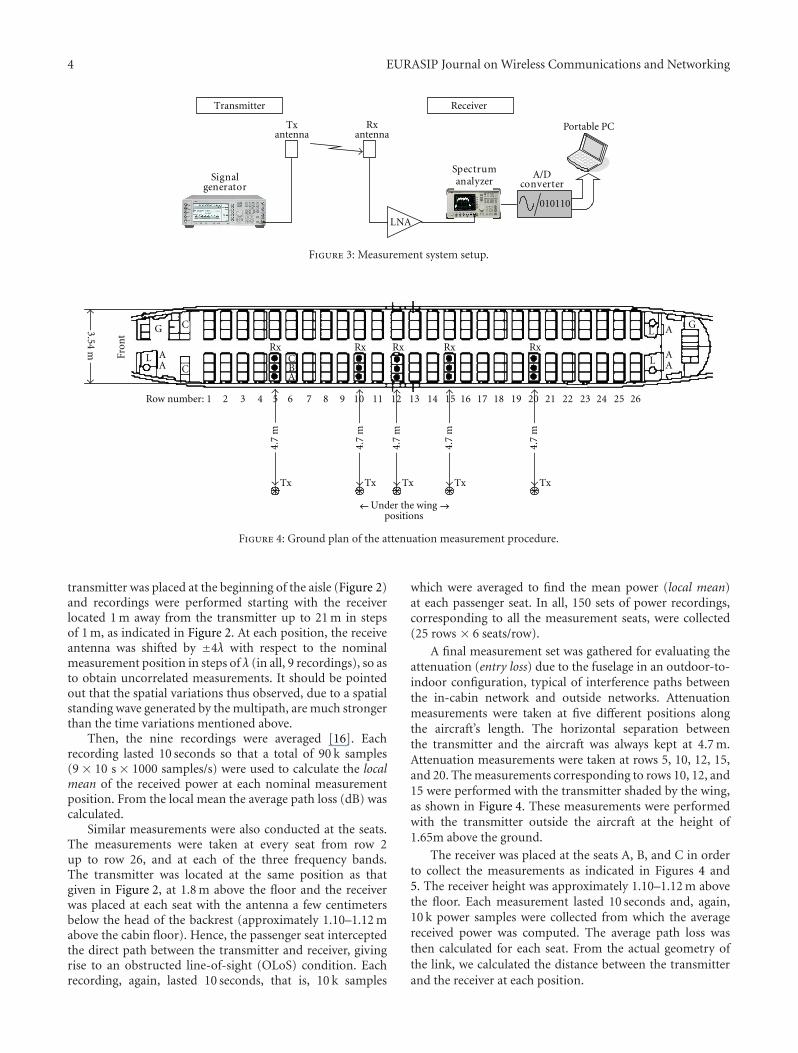
2.2. Measurment Setup. The measurements were made bytransmitting a continuous wave (CW) signal, at the threeaforementioned frequency bands, from a fixed transmitter toa fixed receiver, and recording the signal level. The measure-ment setup is sketched in Figure 3. The transmitter outputpower was 0 dBm and antenna utilized at 1.8 GHz was avertically polarized patch with a 7.5 dBi gain. The vertical andhorizontal 3-dB beamwidths were 70◦ and 75◦, respectively.For the measurements at 2.1 and 2.45 GHz a discone antennawith a semispherical gain of 0 dBi was used. The receivehardware was placed on a trolley, which was stationary ateach measurement position. After amplification, the receivedsignal was fed to a spectrum analyzer which was used as
Table 1: Transmitter and receiver characteristics.
Transmitter
Frequency 1.8 GHz 2.1 GHz 2.45 GHz
Power output 0 dBm
Antenna gain 7.5 dBi 0 dBi 0 dBi
EIRP 7.5 dBm 0 dBm 0 dBm
Receiver
Receiver sensitivity −90 dBm
Antenna gain 1.64 dBi 1.63 dBi 0.75 dBi
LNA gain 26.3 dB 28.1 dB 26.2 dB
Total loss 3.7 dB 4.7 dB 5.3 dB
Total measurable path loss 122 dB 115 dB 112 dB
a receiver using the zero-span setting. The auxiliary videooutput of the spectrum analyzer was then sampled at 1 kHzand the values were stored to a portable PC. At the receiveside, a vertically polarized omnidirectional antenna was usedhaving a gain of between 0.75 and 1.64 dBi, depending onthe frequency. The transmitter and receiver characteristicsare summarized in Table 1.
2.3. Measurement Procedure. Different sets of measurementswere conducted inside the aircraft. In the first, the receivedpower was measured at different points along the aisle as wellas at the passenger seats in order to identify the decay rateof the average received power with increasing distances fromthe transmitter. Additionally, a statistical characterization ofthe multipath scenario, that is, its spatial variations, was alsoperformed. Finally, the measurements have been comparedwith predictions carried out with a deterministic model.
During the measurements, the aircraft was in parkedposition and the cabin had no passengers. Under theseconditions, the channel can be regarded as stationary or, atleast, quasistationary. Small time variations were observedbarely exceeding a standard deviation of one dB, due to thepresence of the people involved in the measurements.
While performing the measurements along the aisle, thetransmit and receive antennas were at 1.8 and 1.7 m above thefloor, respectively, and were always aligned to point at eachother, thus preserving the line-of-sight (LoS) condition. The
4 EURASIP Journal on Wireless Communications and Networking
Transmitter
Signalgenerator
Receiver
LNA
Spectrumanalyzer
A/Dconverter
010110
Tx Rx Portable PCantenna antenna
Figure 3: Measurement system setup.
Fron
t
3.54 m
4.7
m
4.7
m
4.7
m
4.7
m
4.7
m
ABC
Tx
Rx
2 3 54 6 7 8 9 10 1211 13 14 15 1716 18 19 21 22 2423 25 2620
Tx Tx TxTx
Under the wingpositions
Rx Rx Rx RxALA C
CG
AL
L A
A
G
Row number: 1
Figure 4: Ground plan of the attenuation measurement procedure.
transmitter was placed at the beginning of the aisle (Figure 2)and recordings were performed starting with the receiverlocated 1 m away from the transmitter up to 21 m in stepsof 1 m, as indicated in Figure 2. At each position, the receiveantenna was shifted by ±4λ with respect to the nominalmeasurement position in steps of λ (in all, 9 recordings), so asto obtain uncorrelated measurements. It should be pointedout that the spatial variations thus observed, due to a spatialstanding wave generated by the multipath, are much strongerthan the time variations mentioned above.
Then, the nine recordings were averaged [16]. Eachrecording lasted 10 seconds so that a total of 90 k samples(9 × 10 s × 1000 samples/s) were used to calculate the localmean of the received power at each nominal measurementposition. From the local mean the average path loss (dB) wascalculated.
Similar measurements were also conducted at the seats.The measurements were taken at every seat from row 2up to row 26, and at each of the three frequency bands.The transmitter was located at the same position as thatgiven in Figure 2, at 1.8 m above the floor and the receiverwas placed at each seat with the antenna a few centimetersbelow the head of the backrest (approximately 1.10–1.12 mabove the cabin floor). Hence, the passenger seat interceptedthe direct path between the transmitter and receiver, givingrise to an obstructed line-of-sight (OLoS) condition. Eachrecording, again, lasted 10 seconds, that is, 10 k samples
which were averaged to find the mean power (local mean)at each passenger seat. In all, 150 sets of power recordings,corresponding to all the measurement seats, were collected(25 rows × 6 seats/row).
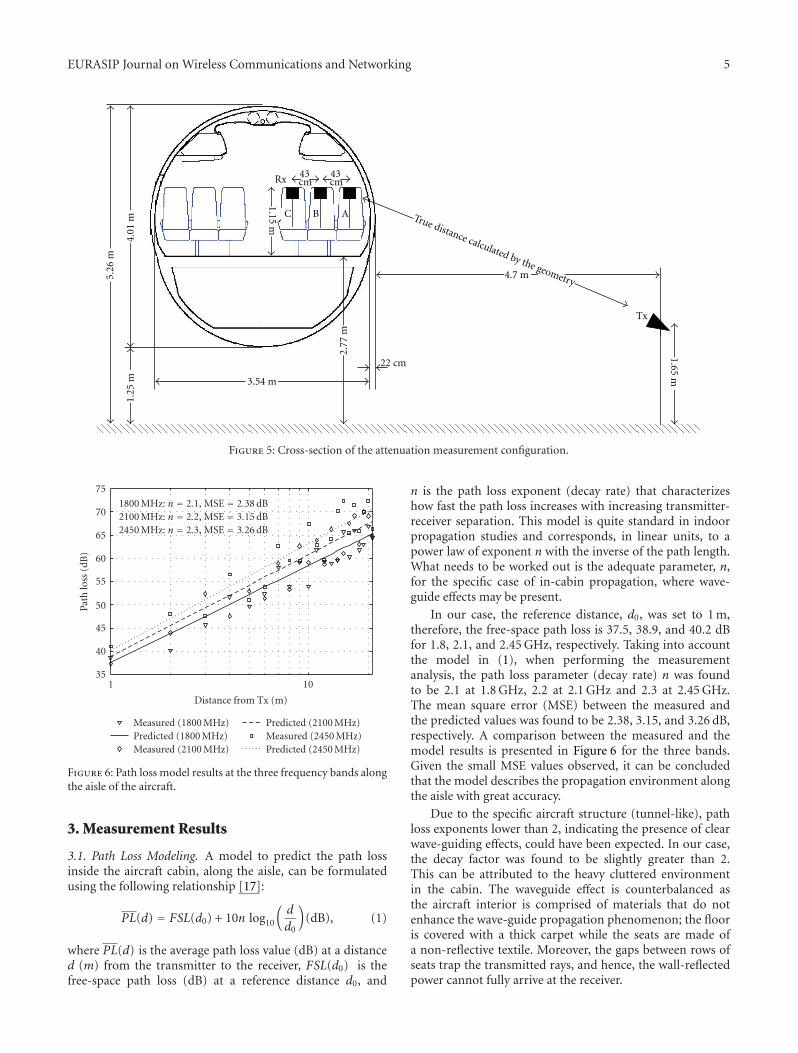
A final measurement set was gathered for evaluating theattenuation (entry loss) due to the fuselage in an outdoor-to-indoor configuration, typical of interference paths betweenthe in-cabin network and outside networks. Attenuationmeasurements were taken at five different positions alongthe aircraft’s length. The horizontal separation betweenthe transmitter and the aircraft was always kept at 4.7 m.Attenuation measurements were taken at rows 5, 10, 12, 15,and 20. The measurements corresponding to rows 10, 12, and15 were performed with the transmitter shaded by the wing,as shown in Figure 4. These measurements were performedwith the transmitter outside the aircraft at the height of1.65m above the ground.
The receiver was placed at the seats A, B, and C in orderto collect the measurements as indicated in Figures 4 and5. The receiver height was approximately 1.10–1.12 m abovethe floor. Each measurement lasted 10 seconds and, again,10 k power samples were collected from which the averagereceived power was computed. The average path loss wasthen calculated for each seat. From the actual geometry ofthe link, we calculated the distance between the transmitterand the receiver at each position.
EURASIP Journal on Wireless Communications and Networking 5
43 cm
43 cm
ABC
3.54 m
1.15 m
4.7 m
1.65 m4.
01 m
5.26
m
1.25
m
2.77
m
22 cm
Tx
Rx
True distance calculated by the geometry
Figure 5: Cross-section of the attenuation measurement configuration.
35
40
45
50
55
60
65
70
75
Path
loss
(dB
)
1 10
Distance from Tx (m)
Measured (1800 MHz)Predicted (1800 MHz)Measured (2100 MHz)
Predicted (2100 MHz)Measured (2450 MHz)Predicted (2450 MHz)
1800 MHz: n = 2.1, MSE = 2.38 dB2100 MHz: n = 2.2, MSE = 3.15 dB2450 MHz: n = 2.3, MSE = 3.26 dB
Figure 6: Path loss model results at the three frequency bands alongthe aisle of the aircraft.
3. Measurement Results
3.1. Path Loss Modeling. A model to predict the path lossinside the aircraft cabin, along the aisle, can be formulatedusing the following relationship [17]:
PL(d) = FSL(d0) + 10n log10
(d
d0
)(dB), (1)
where PL(d) is the average path loss value (dB) at a distanced (m) from the transmitter to the receiver, FSL(d0) is thefree-space path loss (dB) at a reference distance d0, and
n is the path loss exponent (decay rate) that characterizeshow fast the path loss increases with increasing transmitter-receiver separation. This model is quite standard in indoorpropagation studies and corresponds, in linear units, to apower law of exponent n with the inverse of the path length.What needs to be worked out is the adequate parameter, n,for the specific case of in-cabin propagation, where wave-guide effects may be present.
In our case, the reference distance, d0, was set to 1 m,therefore, the free-space path loss is 37.5, 38.9, and 40.2 dBfor 1.8, 2.1, and 2.45 GHz, respectively. Taking into accountthe model in (1), when performing the measurementanalysis, the path loss parameter (decay rate) n was foundto be 2.1 at 1.8 GHz, 2.2 at 2.1 GHz and 2.3 at 2.45 GHz.The mean square error (MSE) between the measured andthe predicted values was found to be 2.38, 3.15, and 3.26 dB,respectively. A comparison between the measured and themodel results is presented in Figure 6 for the three bands.Given the small MSE values observed, it can be concludedthat the model describes the propagation environment alongthe aisle with great accuracy.
Due to the specific aircraft structure (tunnel-like), pathloss exponents lower than 2, indicating the presence of clearwave-guiding effects, could have been expected. In our case,the decay factor was found to be slightly greater than 2.This can be attributed to the heavy cluttered environmentin the cabin. The waveguide effect is counterbalanced asthe aircraft interior is comprised of materials that do notenhance the wave-guide propagation phenomenon; the flooris covered with a thick carpet while the seats are made ofa non-reflective textile. Moreover, the gaps between rows ofseats trap the transmitted rays, and hence, the wall-reflectedpower cannot fully arrive at the receiver.
6 EURASIP Journal on Wireless Communications and Networking
40
45
50
55
60
65
70
75
80
85Pa
thlo
ss(d
B)
1 10Distance from Tx (m)
Measured seats (A)Measured seats (B)Measured seats (C)Measured seats (D)
Measured seats (E)Measured seats (F)Prediction (n = 2.6,σ = 4.8 dB)
(a)
40
45
50
55
60
65
70
75
80
85
90
Path
loss
(dB
)
1 10Distance from Tx (m)
Measured seats (A)Measured seats (B)Measured seats (C)Measured seats (D)
Measured seats (E)Measured seats (F)Prediction (n = 3.1,σ = 5.6 dB)
(b)
40
45
50
55
60
65
70
75
80
85
90
Path
loss
(dB
)
1 10
Distance from Tx (m)
Measured seats (A)Measured seats (B)Measured seats (C)Measured seats (D)
Measured seats (E)Measured seats (F)Prediction (n = 3.2,σ = 5 dB)
(c)
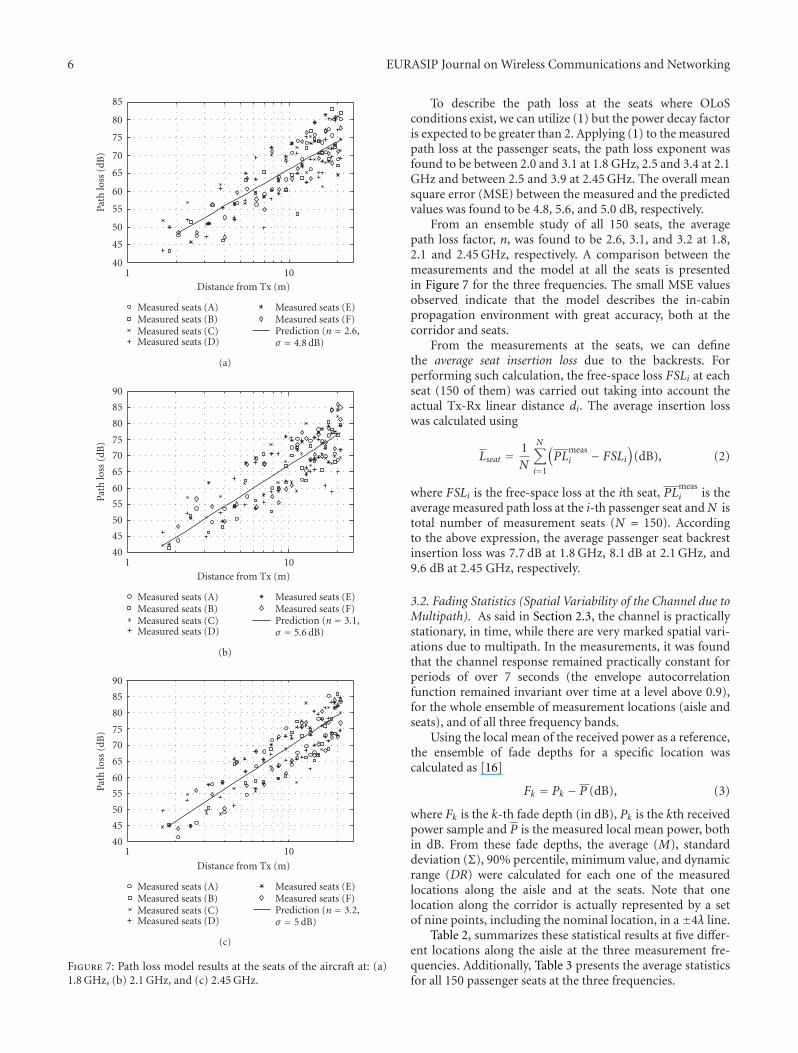
Figure 7: Path loss model results at the seats of the aircraft at: (a)1.8 GHz, (b) 2.1 GHz, and (c) 2.45 GHz.
To describe the path loss at the seats where OLoSconditions exist, we can utilize (1) but the power decay factoris expected to be greater than 2. Applying (1) to the measuredpath loss at the passenger seats, the path loss exponent wasfound to be between 2.0 and 3.1 at 1.8 GHz, 2.5 and 3.4 at 2.1GHz and between 2.5 and 3.9 at 2.45 GHz. The overall meansquare error (MSE) between the measured and the predictedvalues was found to be 4.8, 5.6, and 5.0 dB, respectively.
From an ensemble study of all 150 seats, the averagepath loss factor, n, was found to be 2.6, 3.1, and 3.2 at 1.8,2.1 and 2.45 GHz, respectively. A comparison between themeasurements and the model at all the seats is presentedin Figure 7 for the three frequencies. The small MSE valuesobserved indicate that the model describes the in-cabinpropagation environment with great accuracy, both at thecorridor and seats.
From the measurements at the seats, we can definethe average seat insertion loss due to the backrests. Forperforming such calculation, the free-space loss FSLi at eachseat (150 of them) was carried out taking into account theactual Tx-Rx linear distance di. The average insertion losswas calculated using
Lseat = 1N
N∑i=1
(PL
measi − FSLi
)(dB), (2)
where FSLi is the free-space loss at the ith seat, PLmeasi is the
average measured path loss at the i-th passenger seat andN istotal number of measurement seats (N = 150). Accordingto the above expression, the average passenger seat backrestinsertion loss was 7.7 dB at 1.8 GHz, 8.1 dB at 2.1 GHz, and9.6 dB at 2.45 GHz, respectively.
3.2. Fading Statistics (Spatial Variability of the Channel due toMultipath). As said in Section 2.3, the channel is practicallystationary, in time, while there are very marked spatial vari-ations due to multipath. In the measurements, it was foundthat the channel response remained practically constant forperiods of over 7 seconds (the envelope autocorrelationfunction remained invariant over time at a level above 0.9),for the whole ensemble of measurement locations (aisle andseats), and of all three frequency bands.
Using the local mean of the received power as a reference,the ensemble of fade depths for a specific location wascalculated as [16]
Fk = Pk − P (dB), (3)
where Fk is the k-th fade depth (in dB), Pk is the kth receivedpower sample and P is the measured local mean power, bothin dB. From these fade depths, the average (M), standarddeviation (Σ), 90% percentile, minimum value, and dynamicrange (DR) were calculated for each one of the measuredlocations along the aisle and at the seats. Note that onelocation along the corridor is actually represented by a setof nine points, including the nominal location, in a ±4λ line.
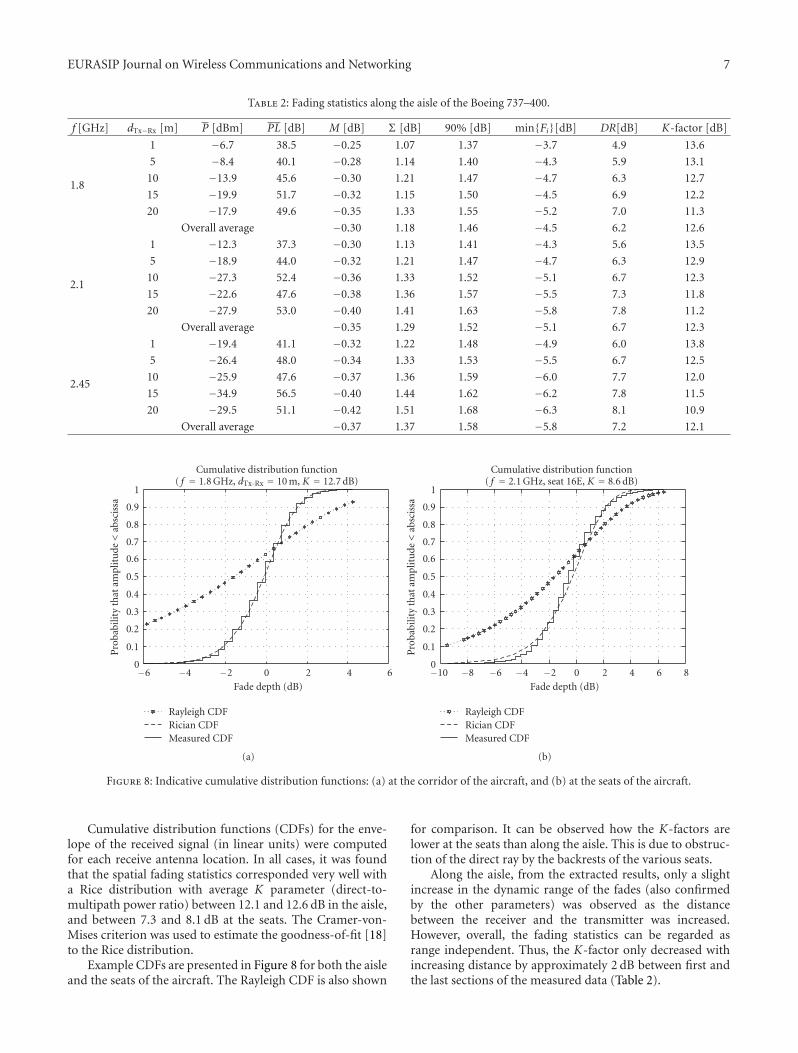
Table 2, summarizes these statistical results at five differ-ent locations along the aisle at the three measurement fre-quencies. Additionally, Table 3 presents the average statisticsfor all 150 passenger seats at the three frequencies.
EURASIP Journal on Wireless Communications and Networking 7
Table 2: Fading statistics along the aisle of the Boeing 737–400.
f [GHz] dTx−Rx [m] P [dBm] PL [dB] M [dB] Σ [dB] 90% [dB] min{Fi}[dB] DR[dB] K-factor [dB]
1.8
1 −6.7 38.5 −0.25 1.07 1.37 −3.7 4.9 13.6
5 −8.4 40.1 −0.28 1.14 1.40 −4.3 5.9 13.1
10 −13.9 45.6 −0.30 1.21 1.47 −4.7 6.3 12.7
15 −19.9 51.7 −0.32 1.15 1.50 −4.5 6.9 12.2
20 −17.9 49.6 −0.35 1.33 1.55 −5.2 7.0 11.3
Overall average −0.30 1.18 1.46 −4.5 6.2 12.6
2.1
1 −12.3 37.3 −0.30 1.13 1.41 −4.3 5.6 13.5
5 −18.9 44.0 −0.32 1.21 1.47 −4.7 6.3 12.9
10 −27.3 52.4 −0.36 1.33 1.52 −5.1 6.7 12.3
15 −22.6 47.6 −0.38 1.36 1.57 −5.5 7.3 11.8
20 −27.9 53.0 −0.40 1.41 1.63 −5.8 7.8 11.2
Overall average −0.35 1.29 1.52 −5.1 6.7 12.3
2.45
1 −19.4 41.1 −0.32 1.22 1.48 −4.9 6.0 13.8
5 −26.4 48.0 −0.34 1.33 1.53 −5.5 6.7 12.5
10 −25.9 47.6 −0.37 1.36 1.59 −6.0 7.7 12.0
15 −34.9 56.5 −0.40 1.44 1.62 −6.2 7.8 11.5
20 −29.5 51.1 −0.42 1.51 1.68 −6.3 8.1 10.9
Overall average −0.37 1.37 1.58 −5.8 7.2 12.1
0
0.1
0.2
0.3
0.4
0.5
0.6
0.7
0.8
0.9
1
Pro
babi
lity
that
ampl
itu
de<
absc
issa
−6 −4 −2 0 2 4 6Fade depth (dB)
Rayleigh CDFRician CDFMeasured CDF
Cumulative distribution function( f = 1.8 GHz, dTx-Rx = 10 m, K = 12.7 dB)
(a)
0
0.1
0.2
0.3
0.4
0.5
0.6
0.7
0.8
0.9
1
Pro
babi
lity
that
ampl
itu
de<
absc
issa
−10 −8 −6 −4 −2 0 2 4 6 8Fade depth (dB)
Rayleigh CDFRician CDFMeasured CDF
Cumulative distribution function( f = 2.1 GHz, seat 16E, K = 8.6 dB)
(b)
Figure 8: Indicative cumulative distribution functions: (a) at the corridor of the aircraft, and (b) at the seats of the aircraft.
Cumulative distribution functions (CDFs) for the enve-lope of the received signal (in linear units) were computedfor each receive antenna location. In all cases, it was foundthat the spatial fading statistics corresponded very well witha Rice distribution with average K parameter (direct-to-multipath power ratio) between 12.1 and 12.6 dB in the aisle,and between 7.3 and 8.1 dB at the seats. The Cramer-von-Mises criterion was used to estimate the goodness-of-fit [18]to the Rice distribution.
Example CDFs are presented in Figure 8 for both the aisleand the seats of the aircraft. The Rayleigh CDF is also shown
for comparison. It can be observed how the K-factors arelower at the seats than along the aisle. This is due to obstruc-tion of the direct ray by the backrests of the various seats.
Along the aisle, from the extracted results, only a slightincrease in the dynamic range of the fades (also confirmedby the other parameters) was observed as the distancebetween the receiver and the transmitter was increased.However, overall, the fading statistics can be regarded asrange independent. Thus, the K-factor only decreased withincreasing distance by approximately 2 dB between first andthe last sections of the measured data (Table 2).
8 EURASIP Journal on Wireless Communications and Networking
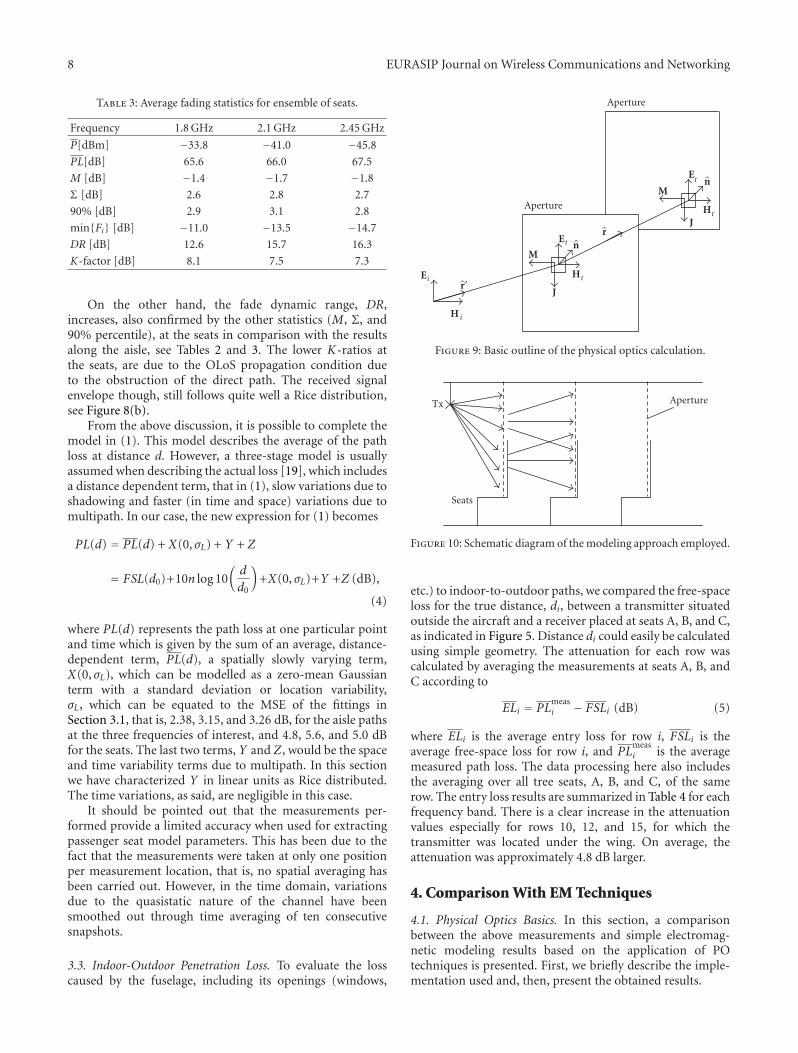
Table 3: Average fading statistics for ensemble of seats.
Frequency 1.8 GHz 2.1 GHz 2.45 GHz
P[dBm] −33.8 −41.0 −45.8
PL[dB] 65.6 66.0 67.5
M [dB] −1.4 −1.7 −1.8
Σ [dB] 2.6 2.8 2.7
90% [dB] 2.9 3.1 2.8
min{Fi} [dB] −11.0 −13.5 −14.7
DR [dB] 12.6 15.7 16.3
K-factor [dB] 8.1 7.5 7.3
On the other hand, the fade dynamic range, DR,increases, also confirmed by the other statistics (M, Σ, and90% percentile), at the seats in comparison with the resultsalong the aisle, see Tables 2 and 3. The lower K-ratios atthe seats, are due to the OLoS propagation condition dueto the obstruction of the direct path. The received signalenvelope though, still follows quite well a Rice distribution,see Figure 8(b).
From the above discussion, it is possible to complete themodel in (1). This model describes the average of the pathloss at distance d. However, a three-stage model is usuallyassumed when describing the actual loss [19], which includesa distance dependent term, that in (1), slow variations due toshadowing and faster (in time and space) variations due tomultipath. In our case, the new expression for (1) becomes
PL(d) = PL(d) + X(0, σL) + Y + Z
= FSL(d0)+10n log 10(d
d0
)+X(0, σL)+Y +Z (dB),
(4)
where PL(d) represents the path loss at one particular pointand time which is given by the sum of an average, distance-dependent term, PL(d), a spatially slowly varying term,X(0, σL), which can be modelled as a zero-mean Gaussianterm with a standard deviation or location variability,σL, which can be equated to the MSE of the fittings inSection 3.1, that is, 2.38, 3.15, and 3.26 dB, for the aisle pathsat the three frequencies of interest, and 4.8, 5.6, and 5.0 dBfor the seats. The last two terms, Y and Z, would be the spaceand time variability terms due to multipath. In this sectionwe have characterized Y in linear units as Rice distributed.The time variations, as said, are negligible in this case.
It should be pointed out that the measurements per-formed provide a limited accuracy when used for extractingpassenger seat model parameters. This has been due to thefact that the measurements were taken at only one positionper measurement location, that is, no spatial averaging hasbeen carried out. However, in the time domain, variationsdue to the quasistatic nature of the channel have beensmoothed out through time averaging of ten consecutivesnapshots.
3.3. Indoor-Outdoor Penetration Loss. To evaluate the losscaused by the fuselage, including its openings (windows,
Et
Ht
H i
Ei
J
M
Aperture
Aperture
Et
HtJ
M
r′
n
n
r
Figure 9: Basic outline of the physical optics calculation.
Tx Aperture
Seats
Figure 10: Schematic diagram of the modeling approach employed.
etc.) to indoor-to-outdoor paths, we compared the free-spaceloss for the true distance, di, between a transmitter situatedoutside the aircraft and a receiver placed at seats A, B, and C,as indicated in Figure 5. Distance di could easily be calculatedusing simple geometry. The attenuation for each row wascalculated by averaging the measurements at seats A, B, andC according to
ELi = PLmeasi − FSLi (dB) (5)
where ELi is the average entry loss for row i, FSLi is theaverage free-space loss for row i, and PL
measi is the average
measured path loss. The data processing here also includesthe averaging over all tree seats, A, B, and C, of the samerow. The entry loss results are summarized in Table 4 for eachfrequency band. There is a clear increase in the attenuationvalues especially for rows 10, 12, and 15, for which thetransmitter was located under the wing. On average, theattenuation was approximately 4.8 dB larger.
4. Comparison With EM Techniques
4.1. Physical Optics Basics. In this section, a comparisonbetween the above measurements and simple electromag-netic modeling results based on the application of POtechniques is presented. First, we briefly describe the imple-mentation used and, then, present the obtained results.
EURASIP Journal on Wireless Communications and Networking 9
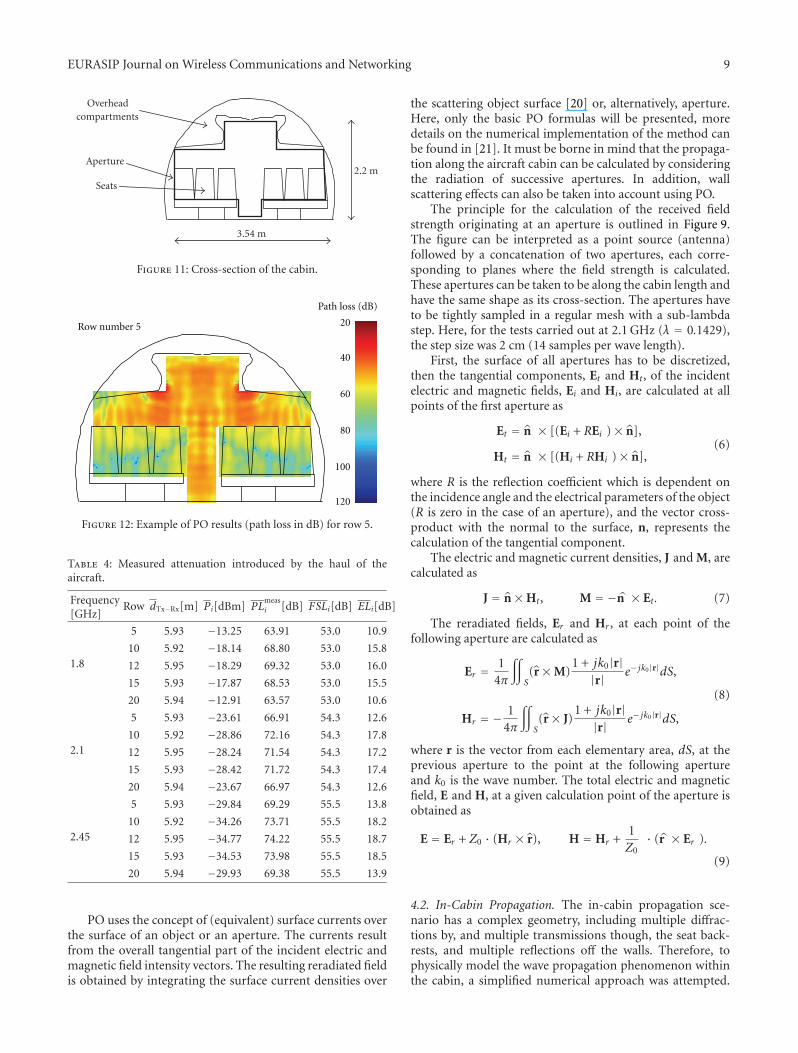
Overheadcompartments
Aperture
Seats
3.54 m
2.2 m
Figure 11: Cross-section of the cabin.
Row number 5
Path loss (dB)
20
40
60
80
100
120
Figure 12: Example of PO results (path loss in dB) for row 5.
Table 4: Measured attenuation introduced by the haul of theaircraft.
Frequency[GHz]
Row dTx−Rx[m] Pi[dBm] PLmeasi [dB] FSLi[dB] ELi[dB]
1.8
5 5.93 −13.25 63.91 53.0 10.9
10 5.92 −18.14 68.80 53.0 15.8
12 5.95 −18.29 69.32 53.0 16.0
15 5.93 −17.87 68.53 53.0 15.5
20 5.94 −12.91 63.57 53.0 10.6
2.1
5 5.93 −23.61 66.91 54.3 12.6
10 5.92 −28.86 72.16 54.3 17.8
12 5.95 −28.24 71.54 54.3 17.2
15 5.93 −28.42 71.72 54.3 17.4
20 5.94 −23.67 66.97 54.3 12.6
2.45
5 5.93 −29.84 69.29 55.5 13.8
10 5.92 −34.26 73.71 55.5 18.2
12 5.95 −34.77 74.22 55.5 18.7
15 5.93 −34.53 73.98 55.5 18.5
20 5.94 −29.93 69.38 55.5 13.9
PO uses the concept of (equivalent) surface currents overthe surface of an object or an aperture. The currents resultfrom the overall tangential part of the incident electric andmagnetic field intensity vectors. The resulting reradiated fieldis obtained by integrating the surface current densities over
the scattering object surface [20] or, alternatively, aperture.Here, only the basic PO formulas will be presented, moredetails on the numerical implementation of the method canbe found in [21]. It must be borne in mind that the propaga-tion along the aircraft cabin can be calculated by consideringthe radiation of successive apertures. In addition, wallscattering effects can also be taken into account using PO.
The principle for the calculation of the received fieldstrength originating at an aperture is outlined in Figure 9.The figure can be interpreted as a point source (antenna)followed by a concatenation of two apertures, each corre-sponding to planes where the field strength is calculated.These apertures can be taken to be along the cabin length andhave the same shape as its cross-section. The apertures haveto be tightly sampled in a regular mesh with a sub-lambdastep. Here, for the tests carried out at 2.1 GHz (λ = 0.1429),the step size was 2 cm (14 samples per wave length).
First, the surface of all apertures has to be discretized,then the tangential components, Et and Ht, of the incidentelectric and magnetic fields, Ei and Hi, are calculated at allpoints of the first aperture as
Et = n × [(Ei + REi )× n],
Ht = n × [(Hi + RHi )× n],(6)
where R is the reflection coefficient which is dependent onthe incidence angle and the electrical parameters of the object(R is zero in the case of an aperture), and the vector cross-product with the normal to the surface, n, represents thecalculation of the tangential component.
The electric and magnetic current densities, J and M, arecalculated as
J = n×Ht, M = −n × Et . (7)
The reradiated fields, Er and Hr , at each point of thefollowing aperture are calculated as
Er = 14π
∫∫S(r×M)
1 + jk0|r||r| e− jk0|r|dS,
Hr = − 14π
∫∫S(r× J)
1 + jk0|r||r| e− jk0|r|dS,
(8)
where r is the vector from each elementary area, dS, at theprevious aperture to the point at the following apertureand k0 is the wave number. The total electric and magneticfield, E and H, at a given calculation point of the aperture isobtained as
E = Er + Z0 · (Hr × r), H = Hr +1Z0
· (r × Er ).
(9)
4.2. In-Cabin Propagation. The in-cabin propagation sce-nario has a complex geometry, including multiple diffrac-tions by, and multiple transmissions though, the seat back-rests, and multiple reflections off the walls. Therefore, tophysically model the wave propagation phenomenon withinthe cabin, a simplified numerical approach was attempted.
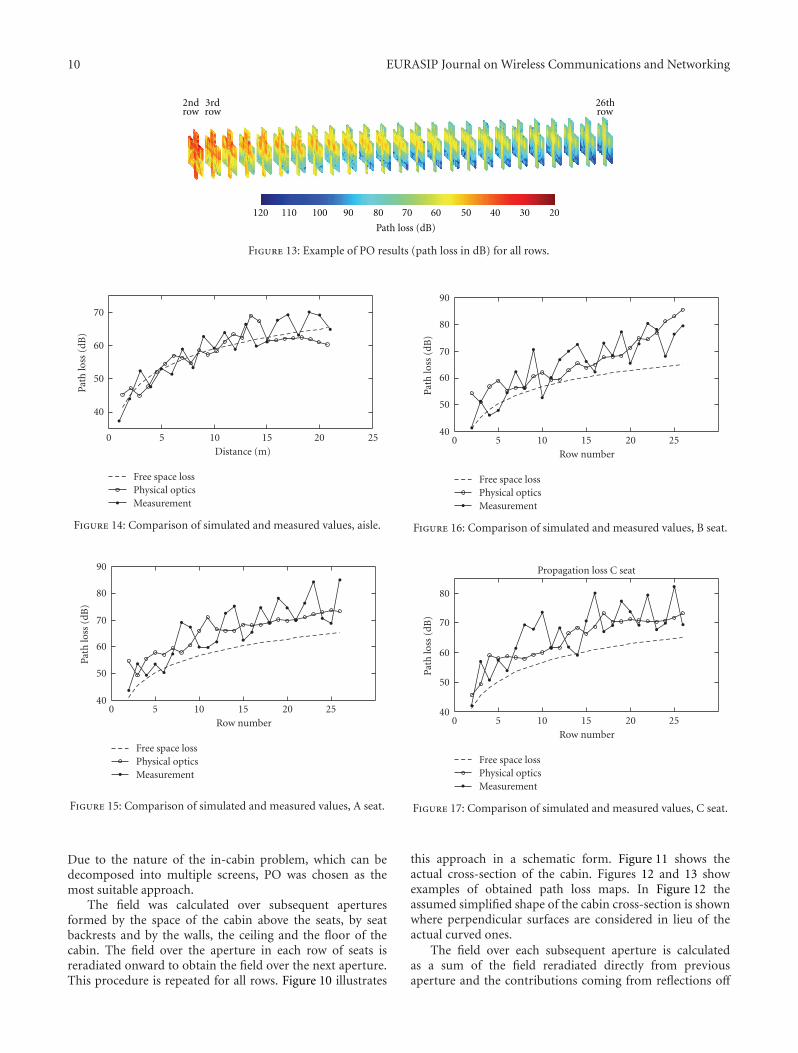
10 EURASIP Journal on Wireless Communications and Networking
2ndrow
3rdrow
26throw
120 110 100 90 80 70 60 50 40 30 20
Path loss (dB)
Figure 13: Example of PO results (path loss in dB) for all rows.
40
50
60
70
Path
loss
(dB
)
0 5 10 15 20 25Distance (m)
Free space lossPhysical opticsMeasurement
Figure 14: Comparison of simulated and measured values, aisle.
40
50
60
70
80
90
Path
loss
(dB
)
0 5 10 15 20 25Row number
Free space lossPhysical opticsMeasurement
Figure 15: Comparison of simulated and measured values, A seat.
Due to the nature of the in-cabin problem, which can bedecomposed into multiple screens, PO was chosen as themost suitable approach.
The field was calculated over subsequent aperturesformed by the space of the cabin above the seats, by seatbackrests and by the walls, the ceiling and the floor of thecabin. The field over the aperture in each row of seats isreradiated onward to obtain the field over the next aperture.This procedure is repeated for all rows. Figure 10 illustrates
40
50
60
70
80
90
Path
loss
(dB
)0 5 10 15 20 25
Row number
Free space lossPhysical opticsMeasurement
Figure 16: Comparison of simulated and measured values, B seat.
40
50
60
70
80
Path
loss
(dB
)
0 5 10 15 20 25Row number
Free space lossPhysical opticsMeasurement
Propagation loss C seat
Figure 17: Comparison of simulated and measured values, C seat.
this approach in a schematic form. Figure 11 shows theactual cross-section of the cabin. Figures 12 and 13 showexamples of obtained path loss maps. In Figure 12 theassumed simplified shape of the cabin cross-section is shownwhere perpendicular surfaces are considered in lieu of theactual curved ones.
The field over each subsequent aperture is calculatedas a sum of the field reradiated directly from previousaperture and the contributions coming from reflections off
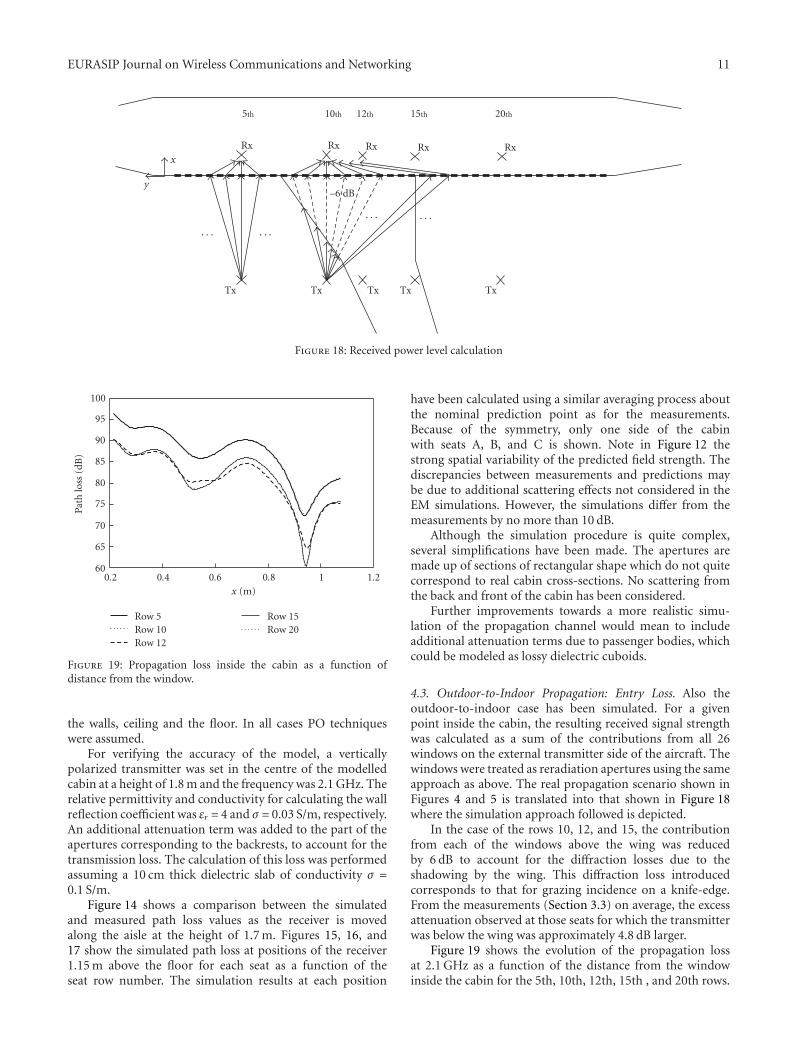
EURASIP Journal on Wireless Communications and Networking 11
Tx Tx Tx Tx Tx
Rx
. . .. . .
. . . . . .
Rx Rx Rx
5th 10th 15th
Rx
12th 20th
–6 dB
x
y
Figure 18: Received power level calculation
60
65
70
75
80
85
90
95
100
Path
loss
(dB
)
0.2 0.4 0.6 0.8 1 1.2x (m)
Row 5Row 10Row 12
Row 15Row 20
Figure 19: Propagation loss inside the cabin as a function ofdistance from the window.
the walls, ceiling and the floor. In all cases PO techniqueswere assumed.
For verifying the accuracy of the model, a verticallypolarized transmitter was set in the centre of the modelledcabin at a height of 1.8 m and the frequency was 2.1 GHz. Therelative permittivity and conductivity for calculating the wallreflection coefficient was εr = 4 and σ = 0.03 S/m, respectively.An additional attenuation term was added to the part of theapertures corresponding to the backrests, to account for thetransmission loss. The calculation of this loss was performedassuming a 10 cm thick dielectric slab of conductivity σ =0.1 S/m.
Figure 14 shows a comparison between the simulatedand measured path loss values as the receiver is movedalong the aisle at the height of 1.7 m. Figures 15, 16, and17 show the simulated path loss at positions of the receiver1.15 m above the floor for each seat as a function of theseat row number. The simulation results at each position
have been calculated using a similar averaging process aboutthe nominal prediction point as for the measurements.Because of the symmetry, only one side of the cabinwith seats A, B, and C is shown. Note in Figure 12 thestrong spatial variability of the predicted field strength. Thediscrepancies between measurements and predictions maybe due to additional scattering effects not considered in theEM simulations. However, the simulations differ from themeasurements by no more than 10 dB.
Although the simulation procedure is quite complex,several simplifications have been made. The apertures aremade up of sections of rectangular shape which do not quitecorrespond to real cabin cross-sections. No scattering fromthe back and front of the cabin has been considered.
Further improvements towards a more realistic simu-lation of the propagation channel would mean to includeadditional attenuation terms due to passenger bodies, whichcould be modeled as lossy dielectric cuboids.
4.3. Outdoor-to-Indoor Propagation: Entry Loss. Also theoutdoor-to-indoor case has been simulated. For a givenpoint inside the cabin, the resulting received signal strengthwas calculated as a sum of the contributions from all 26windows on the external transmitter side of the aircraft. Thewindows were treated as reradiation apertures using the sameapproach as above. The real propagation scenario shown inFigures 4 and 5 is translated into that shown in Figure 18where the simulation approach followed is depicted.
In the case of the rows 10, 12, and 15, the contributionfrom each of the windows above the wing was reducedby 6 dB to account for the diffraction losses due to theshadowing by the wing. This diffraction loss introducedcorresponds to that for grazing incidence on a knife-edge.From the measurements (Section 3.3) on average, the excessattenuation observed at those seats for which the transmitterwas below the wing was approximately 4.8 dB larger.
Figure 19 shows the evolution of the propagation lossat 2.1 GHz as a function of the distance from the windowinside the cabin for the 5th, 10th, 12th, 15th , and 20th rows.
12 EURASIP Journal on Wireless Communications and Networking
The measured propagation losses in Table 4 are within therange of the simulated values, although the simulations showhigher propagation loss as the distance from the windowincreases.
5. Conclusion
This paper presented propagation measurements and chan-nel characterization conducted inside a Boeing 737–400. Theobjective was to understand the propagation mechanismsinvolved in the setting up of in-cabin wireless networks.The measurements were conducted in the aisle as well asat the seats at three different frequency bands (1.8, 2.1, and2.45 GHz) representative of various different services. It hasbeen shown how the path loss is distance dependent withadditional random variations due to shadowing and multi-path. Furthermore, it has been shown how the propagationexponent for aisle paths barely exceeds a value of two, closeto the free-space law. This means that the expected waveguideeffect which would lead to exponents below two is attenuateddue to the seat rests and to the materials used that preventthe generation of strong multipath. For the seat paths, theattenuation law may be larger than three, in some cases. Thespatial variations have been split into slow and fast. The slowvariations can be characterized by their standard deviations,which are in the order of 3 dB for aisle paths while, for seatpaths are larger, in the order of 5 dB. The faster variationshave been quantified and characterized by means of Ricedistributions. For interference paths between in-cabin andexternal networks, the excess loss with respect to free-spacehas been quantified, being in the order of approximately 10to 14 dB, increasing with frequency.
The disadvantage of empirically derived models is thatthey are not suitable for aircraft very different from thosewhere the measurements have been performed. The needfor a generalization of results has led us to study a physical,site-specific approach. A model based on Physical (PO) tech-niques has been presented. Comparisons between measure-ment and predictions have shown a fairly good agreement.The slow received signal variations in the measurementsseem to be slightly larger than in the predictions. Thin canbe attributed to propagation mechanisms not consideredin the modeling. Still, EM, site-specific models can providea flexible way of producing acceptably accurate perditionsfor all possible aircraft configurations without the need toperform new measurements.
Acknowledgments
The authors would like to thank the Olympic AirlinesTechnical Base in Athens International Airport EleftheriosVenizelos. This research has been partly carried out in theframework of the European Network of Excellence SatNEx 2.
References
[1] A. Jahn, M. Holzbock, J. Muller, et al., “Evolution of aeronau-tical communications for personal and multimedia services,”IEEE Communications Magazine, vol. 41, no. 7, pp. 36–43,2003.
[2] N. R. Dıaz and J. E. J. Esquitino, “Wideband channelcharacterization for wireless communications inside a shorthaul aircraft,” in Proceedings of the IEEE Vehicular TechnologyConference (VTC ’04), vol. 1, pp. 223–228, Milan, Italy, May2004.
[3] N. R. Dıaz, “Narrowband measurements in an airbus A319for in-cabin wireless personal communications via satellite,”in Proceedings of the Advanced Satellite Mobile Systems (ASMS’03), pp. 226–233, Frascati, Italy, July 2003.
[4] G. Hankins, L. Vahala, and J. H. Beggs, “Propagation predic-tion inside a B767 in the 2.4 GHz and 5 GHz radio bands,” inProceedings of the IEEE International Symposium on Antennasand Propagation Society, vol. 1A, pp. 791–794, Chicago, Ill,USA, July 2005.
[5] G. Hankins, L. Vahala, and J. H. Beggs, “Electromagnetic prop-agation prediction inside aircraft cabins,” in Proceedings of theIEEE International Symposium on Antennas and PropagationSociety, vol. 3, pp. 2227–2230, Monterey, Calif, USA, June2004.
[6] N. R. Dıaz, B. S. Perez, and F. P. Fontan, “Deterministicpropagation modelling inside aircraft cabins,” in Proceedingsof the 5th International Conference on ITS Telecommunications(ITST ’05), Brest, France, June 2005.
[7] C. P. Niebla, “Topology and capacity planning for wirelessheterogenous networks in aircraft cabins,” in Proceedings of the16th IEEE International Symposium on Personal, Indoor andMobile Radio Communications (PIMRC ’05), pp. 2088–2092,Berlin, Germany, September 2005.
[8] C. P. Niebla, “Coverage and capacity planning for aircraftin-cabin wireless heterogeneous networks,” in Proceedings ofthe 58th IEEE Vehicular Technology Conference (VTC ’03), pp.1658–1662, Orlando, Fla, USA, October 2003.
[9] A. Kaouris, M. Zaras, M. Revithi, N. Moraitis, and P. Con-stantinou, “Propagation measurements inside a B737 aircraftfor in-cabin wireless networks,” in Proceedings of the IEEEVehicular Technology Conference (VTC ’08), pp. 2932–2936,Singapore, May 2008.
[10] J. Chuang, N. Xin, H. Huang, S. Chiu, and D. G. Michelson,“UWB radiowave propagation within the passenger cabinof a Boeing 737-200 aircraft,” in Proceedings of the IEEEVehicular Technology Conference (VTC ’07), pp. 496–500,Dublin, Ireland, April 2007.
[11] I. Schmidt, J. Jemai, R. Piesiewicz, et al., “UWB propagationchannels within an aircraft and an office building environ-ment,” in Proceedings of the IEEE International Symposium onAntennas and Propagation and USNC/URSI National RadioScience Meeting (APSURSI ’08), pp. 1–4, San Diego, Calif,USA, July 2008.
[12] RTCA/DO233, “Portable Electronic Devices Carried on BoardAircraft,” August 1996.
[13] J. L. Schiffer and A. E. Waltho, “Intel Safety Evaluation ofBluetooth Class ISM Band Transmitters on Board CommercialAircraft,” Revision 2, December 2000.
[14] JAA TGL Leaflet No. 29, “Guidance concerning the use ofportable electronic devices on board aircraft,” October 2001.
[15] The Boeing, 2007, http://www.boeing.com.[16] R. A. Valenzuela, O. Landron, and D. L. Jacobs, “Estimating
local mean signal strength of indoor multipath propagation,”IEEE Transactions on Vehicular Technology, vol. 46, no. 1, pp.203–212, 1997.
[17] T. S. Rappaport, Wireless Communications: Principles andPractice, Prentice-Hall, Englewood Cliffs, NJ, USA, 1996.
EURASIP Journal on Wireless Communications and Networking 13
[18] L. Dossi, G. Tartara, and F. Tallone, “Statistical analysis ofmeasured impulse response functions of 2.0 GHz indoor radiochannels,” IEEE Journal on Selected Areas in Communications,vol. 14, no. 3, pp. 405–410, 1996.
[19] W. C. Y. Lee, Mobile Communications Design Fundamentals,Wiley Series in Telecommunications and Signal Processing,John Wiley & Sons, Chichester, UK, 1993.
[20] C. A. Balanis, Advanced Engineering Electromagnetics, JohnWiley & Sons, New York, NY, USA, 1989.
[21] L. Diaz and T. Milligan, Antenna Engineering Using PhysicalOptics: Practical CAD Techniques and Software, Artech House,Boston, Mass, USA, 1996.

Photograph © Turisme de Barcelona / J. Trullàs
Preliminary call for papers
The 2011 European Signal Processing Conference (EUSIPCO 2011) is thenineteenth in a series of conferences promoted by the European Association forSignal Processing (EURASIP, www.eurasip.org). This year edition will take placein Barcelona, capital city of Catalonia (Spain), and will be jointly organized by theCentre Tecnològic de Telecomunicacions de Catalunya (CTTC) and theUniversitat Politècnica de Catalunya (UPC).EUSIPCO 2011 will focus on key aspects of signal processing theory and
li ti li t d b l A t f b i i ill b b d lit
Organizing Committee
Honorary ChairMiguel A. Lagunas (CTTC)
General ChairAna I. Pérez Neira (UPC)
General Vice ChairCarles Antón Haro (CTTC)
Technical Program ChairXavier Mestre (CTTC)
Technical Program Co Chairsapplications as listed below. Acceptance of submissions will be based on quality,relevance and originality. Accepted papers will be published in the EUSIPCOproceedings and presented during the conference. Paper submissions, proposalsfor tutorials and proposals for special sessions are invited in, but not limited to,the following areas of interest.
Areas of Interest
• Audio and electro acoustics.• Design, implementation, and applications of signal processing systems.
l d l d d
Technical Program Co ChairsJavier Hernando (UPC)Montserrat Pardàs (UPC)
Plenary TalksFerran Marqués (UPC)Yonina Eldar (Technion)
Special SessionsIgnacio Santamaría (Unversidadde Cantabria)Mats Bengtsson (KTH)
FinancesMontserrat Nájar (UPC)• Multimedia signal processing and coding.
• Image and multidimensional signal processing.• Signal detection and estimation.• Sensor array and multi channel signal processing.• Sensor fusion in networked systems.• Signal processing for communications.• Medical imaging and image analysis.• Non stationary, non linear and non Gaussian signal processing.
Submissions
Montserrat Nájar (UPC)
TutorialsDaniel P. Palomar(Hong Kong UST)Beatrice Pesquet Popescu (ENST)
PublicityStephan Pfletschinger (CTTC)Mònica Navarro (CTTC)
PublicationsAntonio Pascual (UPC)Carles Fernández (CTTC)
I d i l Li i & E hibiSubmissions
Procedures to submit a paper and proposals for special sessions and tutorials willbe detailed at www.eusipco2011.org. Submitted papers must be camera ready, nomore than 5 pages long, and conforming to the standard specified on theEUSIPCO 2011 web site. First authors who are registered students can participatein the best student paper competition.
Important Deadlines:
P l f i l i 15 D 2010
Industrial Liaison & ExhibitsAngeliki Alexiou(University of Piraeus)Albert Sitjà (CTTC)
International LiaisonJu Liu (Shandong University China)Jinhong Yuan (UNSW Australia)Tamas Sziranyi (SZTAKI Hungary)Rich Stern (CMU USA)Ricardo L. de Queiroz (UNB Brazil)
Webpage: www.eusipco2011.org
Proposals for special sessions 15 Dec 2010Proposals for tutorials 18 Feb 2011Electronic submission of full papers 21 Feb 2011Notification of acceptance 23 May 2011Submission of camera ready papers 6 Jun 2011
Related Documents