Propagation, Detection and Containment of Mobile Malware by Abhijit Bose A dissertation submitted in partial fulfillment of the requirements for the degree of Doctor of Philosophy (Computer Science and Engineering) in The University of Michigan 2008 Doctoral Committee: Professor Kang G. Shin, Chair Professor Atul Prakash Professor Dawn Tilbury Assistant Professor Zhuoqing Morley Mao

Welcome message from author
This document is posted to help you gain knowledge. Please leave a comment to let me know what you think about it! Share it to your friends and learn new things together.
Transcript
Propagation, Detection and Containment of Mobile
Malware
by
Abhijit Bose
A dissertation submitted in partial fulfillmentof the requirements for the degree of
Doctor of Philosophy(Computer Science and Engineering)
in The University of Michigan2008
Doctoral Committee:Professor Kang G. Shin, ChairProfessor Atul PrakashProfessor Dawn TilburyAssistant Professor Zhuoqing Morley Mao

c° Abhijit Bose 2008All Rights Reserved

To my family.
ii
ACKNOWLEDGEMENTS
I would like to express my deep appreciation and gratitude to my advisor, Professor
Kang Shin, for his unwavering support and encouragement during all these years. This
dissertation would not have been possible without his guidance and continuing support. I
have benefited tremendously from his advice and his commitment to all his present and
past RTCL students.
I thank Professors Atul Prakash, Dawn Tilbury and Morley Mao for serving on my
dissertation committee, and for their many valuable feedback and suggestions.
I am also very fortunate to have a loving and supportive family. The demands of a
full-time job while writing several chapters of this dissertation meant very little family
time for me, even during weekends. My wife, Papiya, has been very supportive and patient
throughout this entire journey. I very much appreciate the love, encouragement, and support
that my parents, brother, sister-in-law and niece have provided me over the years.
I would like to thank Mohamed El Gendy, a fellow RTCL alum, for being such a won-
derful friend. We collaborated on several projects and supported each other during our
doctoral studies. Haining Wang, another RTCL alum, has also been my good friend and
collaborator over the years. I wish both Mohamed and Haining the very best in their career
and life.
I had a wonderful experience while working at the Center for Advanced Computing
(CAC) on campus. Special thanks goes to Tom Hacker whose ”hands-on” approach to
building large Linux clusters, helped me transition from a “computational scientist” to a
hands-on “computer scientist”! I would also like to thank my other colleagues at CAC:
Rodney Mach, Matthew Britt, Randy Crawford and David Woodcock for their help and
friendship — I learnt a lot about large-scale system administration and problem diagnostics
iii
from them. During my stay, the CAC received national recognition for its work in grid and
high-performance computing under the leadership of our Director, Professor Bill Martin. I
am indebted to Bill for providing me with all the flexibility so that I could take courses and
work on my dissertation. I have also benefited greatly from Bill’s advice and support over
the years.
Special thanks go to several past and present colleagues at RTCL: John Reumann, Hani
Jamjoom, Hai Huang, Taejoon Park, Pradeep Padala, Xin Hu, Wei Sun, Kyu-Han Kim,
Dan Kiskis, Wee-Seng Soh, for their friendship and collaboration during the course of my
study and beyond. I wish them the very best in their life and career.
Since the day I joined RTCL, BJ Monahgan helped me with everything from finding
an office space to preparing grant proposals. I would like to express my deep appreciation
to BJ for always lending me a helping hand. I would also like to thank several RTCL and
EECS staff members: Kirsten Knecht, Dawn Freysinger, Karen Liska and Stephen Reger,
for helping me with many administrative and graduate program requirements.
Last but not the least, I would like to thank a number of colleagues who helped me
collect network traces, malware samples and access to supercomputers for analyzing large
volumes of data: Paul Killey, Daniel Maletta, Amadi Nwankpa and Jeffrey Richardson
of CAEN (University of Michigan), Xiaoqiao Meng and Vidyut Samanta (UCLA), Amit
Majumdar and Nancy Wilkins-Diehr (San Diego Supercomputer Center), Giri Chukkapalli
(Sun Microsystems), and Jay Boisseau (Texas Advanced Computing Center). Their assis-
tance is very much appreciated.
iv
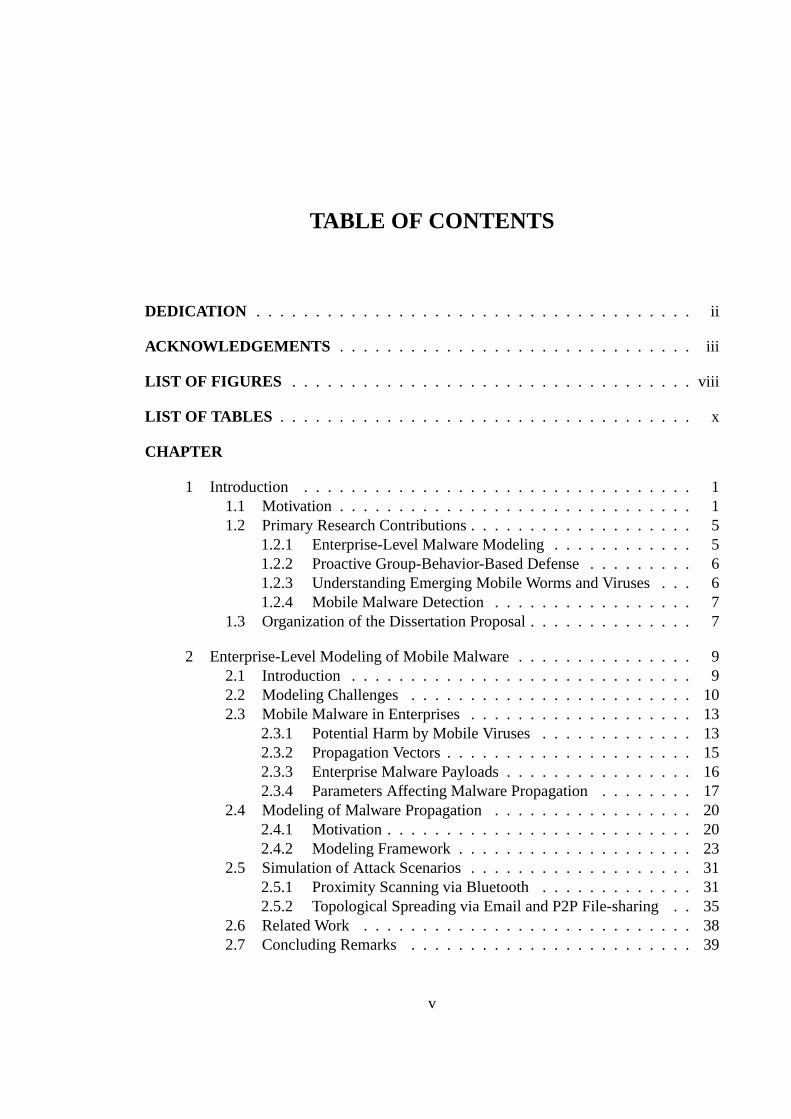
TABLE OF CONTENTS
DEDICATION . . . . . . . . . . . . . . . . . . . . . . . . . . . . . . . . . . . . . ii
ACKNOWLEDGEMENTS . . . . . . . . . . . . . . . . . . . . . . . . . . . . . . iii
LIST OF FIGURES . . . . . . . . . . . . . . . . . . . . . . . . . . . . . . . . . . viii
LIST OF TABLES . . . . . . . . . . . . . . . . . . . . . . . . . . . . . . . . . . . x
CHAPTER
1 Introduction . . . . . . . . . . . . . . . . . . . . . . . . . . . . . . . . . 11.1 Motivation . . . . . . . . . . . . . . . . . . . . . . . . . . . . . . 11.2 Primary Research Contributions . . . . . . . . . . . . . . . . . . . 5
1.2.1 Enterprise-Level Malware Modeling . . . . . . . . . . . . 51.2.2 Proactive Group-Behavior-Based Defense . . . . . . . . . 61.2.3 Understanding Emerging Mobile Worms and Viruses . . . 61.2.4 Mobile Malware Detection . . . . . . . . . . . . . . . . . 7
1.3 Organization of the Dissertation Proposal . . . . . . . . . . . . . . 7
2 Enterprise-Level Modeling of Mobile Malware . . . . . . . . . . . . . . . 92.1 Introduction . . . . . . . . . . . . . . . . . . . . . . . . . . . . . 92.2 Modeling Challenges . . . . . . . . . . . . . . . . . . . . . . . . 102.3 Mobile Malware in Enterprises . . . . . . . . . . . . . . . . . . . 13
2.3.1 Potential Harm by Mobile Viruses . . . . . . . . . . . . . 132.3.2 Propagation Vectors . . . . . . . . . . . . . . . . . . . . . 152.3.3 Enterprise Malware Payloads . . . . . . . . . . . . . . . . 162.3.4 Parameters Affecting Malware Propagation . . . . . . . . 17
2.4 Modeling of Malware Propagation . . . . . . . . . . . . . . . . . 202.4.1 Motivation . . . . . . . . . . . . . . . . . . . . . . . . . . 202.4.2 Modeling Framework . . . . . . . . . . . . . . . . . . . . 23
2.5 Simulation of Attack Scenarios . . . . . . . . . . . . . . . . . . . 312.5.1 Proximity Scanning via Bluetooth . . . . . . . . . . . . . 312.5.2 Topological Spreading via Email and P2P File-sharing . . 35
2.6 Related Work . . . . . . . . . . . . . . . . . . . . . . . . . . . . 382.7 Concluding Remarks . . . . . . . . . . . . . . . . . . . . . . . . 39
v
3 Proactive Defense in Enterprise Networks . . . . . . . . . . . . . . . . . . 403.1 Introduction . . . . . . . . . . . . . . . . . . . . . . . . . . . . . 403.2 Motivation: Finding Vulnerable Clients . . . . . . . . . . . . . . . 443.3 Finding Vulnerability By Association . . . . . . . . . . . . . . . . 46
3.3.1 Step I: Behavior Vectors . . . . . . . . . . . . . . . . . . 473.3.2 Step II: Service-Behavior Graphs . . . . . . . . . . . . . . 483.3.3 Step III. Short-term Forecasting of Behavior Vectors . . . 493.3.4 Step IV. Behavior Clustering . . . . . . . . . . . . . . . . 49
3.4 Proactive Containment Methods . . . . . . . . . . . . . . . . . . 523.4.1 Rate-limiting . . . . . . . . . . . . . . . . . . . . . . . . 523.4.2 Quarantine . . . . . . . . . . . . . . . . . . . . . . . . . . 543.4.3 Proactive Group Behavior Containment . . . . . . . . . . 55
3.5 Evaluation of Proactive Defense in a SMS network . . . . . . . . 563.5.1 PGBC and Agent-Based Malware Modeling . . . . . . . . 563.5.2 SMS Messaging Logs . . . . . . . . . . . . . . . . . . . . 573.5.3 Performance of PGBC . . . . . . . . . . . . . . . . . . . 58
3.6 Related Work . . . . . . . . . . . . . . . . . . . . . . . . . . . . 653.7 Concluding Remarks . . . . . . . . . . . . . . . . . . . . . . . . 67
4 Mobile Malware Exploiting Messaging and Bluetooth . . . . . . . . . . . 694.1 Introduction . . . . . . . . . . . . . . . . . . . . . . . . . . . . . 694.2 Analysis of Mobile Viruses . . . . . . . . . . . . . . . . . . . . . 70
4.2.1 Crossover Malware . . . . . . . . . . . . . . . . . . . . . 734.2.2 Mobile Virus Behavior Vectors . . . . . . . . . . . . . . . 744.2.3 Model of a Generic Mobile Virus . . . . . . . . . . . . . . 76
4.3 Bluetooth Vulnerabilities . . . . . . . . . . . . . . . . . . . . . . 784.3.1 Bluetooth Security Model . . . . . . . . . . . . . . . . . . 794.3.2 Bluetooth Exploits for Mobile Malware . . . . . . . . . . 80
4.4 SMS/MMS Vulnerabilities . . . . . . . . . . . . . . . . . . . . . 834.5 AMM for SMS and Bluetooth Threats . . . . . . . . . . . . . . . 854.6 Simulation of a Mobile Virus . . . . . . . . . . . . . . . . . . . . 864.7 Concluding Remarks . . . . . . . . . . . . . . . . . . . . . . . . 89
5 Behavioral Detection of Mobile Malware . . . . . . . . . . . . . . . . . . 925.1 Introduction . . . . . . . . . . . . . . . . . . . . . . . . . . . . . 925.2 Malicious Behavior Signatures . . . . . . . . . . . . . . . . . . . 96
5.2.1 Temporal patterns . . . . . . . . . . . . . . . . . . . . . . 965.2.2 Temporal Logic of Malicious Behavior . . . . . . . . . . . 985.2.3 Example: The Commwarrior worm . . . . . . . . . . . . . 1005.2.4 Generalized Behavior Signatures . . . . . . . . . . . . . . 103
5.3 Run-Time Construction of Behavior Signatures . . . . . . . . . . 1075.3.1 Monitoring of API calls via Proxy DLL . . . . . . . . . . 1085.3.2 Stage I: Generation of Dependency Graph . . . . . . . . . 1105.3.3 Stage II: Graph Pruning and Aggregation . . . . . . . . . 112
5.4 Behavior Classification by Machine Learning Algorithm . . . . . . 113
vi
5.4.1 Support Vector Machines . . . . . . . . . . . . . . . . . . 1155.5 Possible Evasion & Limitations, and Their Countermeasures . . . 1185.6 Evaluation and Results . . . . . . . . . . . . . . . . . . . . . . . 121
5.6.1 Methodology . . . . . . . . . . . . . . . . . . . . . . . . 1215.6.2 Accuracy of SVC . . . . . . . . . . . . . . . . . . . . . . 1225.6.3 Generality of Behavior Signatures . . . . . . . . . . . . . 1225.6.4 Evaluation with Real-world Mobile Worms . . . . . . . . 1235.6.5 Overhead of Proxy DLL . . . . . . . . . . . . . . . . . . 1245.6.6 Summary and Discussion of Evaluation Results . . . . . . 125
5.7 Related Literature . . . . . . . . . . . . . . . . . . . . . . . . . . 1255.8 Conclusion . . . . . . . . . . . . . . . . . . . . . . . . . . . . . 129
6 Conclusions and Future Work . . . . . . . . . . . . . . . . . . . . . . . . 133
APPENDIX . . . . . . . . . . . . . . . . . . . . . . . . . . . . . . . . . . . . . . . 136
BIBLIOGRAPHY . . . . . . . . . . . . . . . . . . . . . . . . . . . . . . . . . . . 142
vii
LIST OF FIGURES
Figure2.1 Betweenness Centrality (BC) of email and P2P topologies . . . . . . . . . 132.2 Enterprise malware propagation vectors . . . . . . . . . . . . . . . . . . . 152.3 Parameters affecting domain-specific malware propagation . . . . . . . . . 172.4 Flowchart of AMM prototype . . . . . . . . . . . . . . . . . . . . . . . . . 222.5 Agent attributes and functions . . . . . . . . . . . . . . . . . . . . . . . . 242.6 Model of an infection targeting a service . . . . . . . . . . . . . . . . . . . 262.7 Service-infection models and their parameters . . . . . . . . . . . . . . . . 282.8 Effect of node velocity on Cabir propagation . . . . . . . . . . . . . . . . . 332.9 Effect of channel models on Cabir propagation . . . . . . . . . . . . . . . 342.10 Effect of vulnerability ratio on Cabir propagation . . . . . . . . . . . . . . 352.11 Effect of pause time on Cabir propagation . . . . . . . . . . . . . . . . . . 362.12 Propagation of single-vector and hybrid topological worms . . . . . . . . . 372.13 Effect of end-host diversity on hybrid worm propagation (N(0) = 10) . . . 373.1 (a) Clustering of common behavior, (b) Microscopic view . . . . . . . . . . 453.2 Generating behavior clusters from message logs . . . . . . . . . . . . . . . 473.3 Behavior clustering of an IM network(k = 4) . . . . . . . . . . . . . . . . 503.4 k-means clustering of an IM network(k = 4) . . . . . . . . . . . . . . . . 503.5 Virus throttling algorithm by Williamson [11] . . . . . . . . . . . . . . . . 533.6 Proactive rate-limiting and quarantine for a behavior cluster . . . . . . . . . 553.7 Overall performance of PGBC and WRL . . . . . . . . . . . . . . . . . . . 583.8 Percentage of clients rate-limited (WRL) and proactively contained (PGBC) 593.9 Effect of PGBC backoff timer (βk = βth = 8, r = 30s) . . . . . . . . . . . 603.10 Number of proactive clients for different PGBC backoff timer values (βk =
βth = 8, r = 30s) . . . . . . . . . . . . . . . . . . . . . . . . . . . . . . . 613.11 Number of infections for different PGBC alert levels (T = 60s,r = 60s) . . 623.12 Number of infections for different PGBC alert levels (T = 60s,r = 20s) . . 623.13 Comparison of reactive and PGBC defense approaches . . . . . . . . . . . 633.14 E(P(t)) and E(F(t)) rates for different PGBC backoff timer values (βk =
βth = 8, r = 30s) . . . . . . . . . . . . . . . . . . . . . . . . . . . . . . . 643.15 False-positive detection rates for different PGBC alert levels (T = 60s,r =
20s) . . . . . . . . . . . . . . . . . . . . . . . . . . . . . . . . . . . . . . 65
viii
4.1 Common behavior vectors of existing mobile viruses . . . . . . . . . . . . 744.2 State diagram of a mobile virus in AMM . . . . . . . . . . . . . . . . . . . 774.3 Vulnerabilities and exploits in Bluetooth (BT) . . . . . . . . . . . . . . . . 814.4 Total messages exchanged in the SMS network . . . . . . . . . . . . . . . 874.5 Topological structure of the SMS network . . . . . . . . . . . . . . . . . . 894.6 CDF of message service times (seconds) . . . . . . . . . . . . . . . . . . . 904.7 Average number of infections for SMS and hybrid (SMS, Bluetooth) virus
propagation . . . . . . . . . . . . . . . . . . . . . . . . . . . . . . . . . . 914.8 Effect of vulnerability ratio on mobile virus propagation . . . . . . . . . . 915.1 Symbian filesystem directories targeted by malware (OS v8 and earlier) . . 1005.2 Behavior signature for Commwarrior worm . . . . . . . . . . . . . . . . . 1025.3 Proxy DLL to capture API call arguments . . . . . . . . . . . . . . . . . . 1095.4 Major components of the monitoring system . . . . . . . . . . . . . . . . . 1105.5 Dependency graphs for constructing atomic propositional variables . . . . . 1125.6 State-transition diagram for signature FindDevice . . . . . . . . . . . . . . 114
ix
LIST OF TABLES
Table2.1 Parameters for proximity-based propagation . . . . . . . . . . . . . . . . . 322.2 Trace properties . . . . . . . . . . . . . . . . . . . . . . . . . . . . . . . . 354.1 Mapping of behavior vectors to existing mobile viruses . . . . . . . . . . . 764.2 Parameters for Bluetooth channel and mobility models . . . . . . . . . . . 885.1 Classification accuracy. . . . . . . . . . . . . . . . . . . . . . . . . . . . . 1315.2 Detection accuracy (%) for unknown worms . . . . . . . . . . . . . . . . . 132A.Time-Series Modeling Techniques for Behavior Vectors. . . . . . . . . . . . . . . . . . . . . . . . . . . . . . . . . . . . . . . . 111
x
CHAPTER 1
Introduction
1.1 Motivation
The landscape of malicious code attacks has changed considerably from large-scale In-
ternet worm and virus incidents to more directed attacks against enterprise resources. While
the primary damage from traditional worms and viruses such as Code Red [91], Nimda [42]
and Slammer [92] has been clogged networks and caused expensive clean-up operations,
the new generation of malware is designed to steal confidential information, control remote
systems for malicious purposes, and disrupt mission-critical services. These malicious
“agents” often deploy worm-like behavior as a spreading mechanism, and exploit multi-
ple vectors for propagation — their intended purpose is to install spyware on enterprise
systems customized to collect information (e.g., keystroke loggers), and install backdoors
or trojans. Examples of such malware are bot networks (“botnets”) [88], and topological
worms [85, 121, 154, 158] that spread via file-sharing, instant messaging (IM), IRC chat
and email networks. While there has been considerable progress in halting the spread of
scanning worms and viruses, there have been few studies on understanding malware spread
within a heterogeneous enterprise network, especially when such malware exploits multiple
propagation and infection vectors. In general, epidemic models for malware propagation
can be developed along two different but correlated time scales: propagation within an en-
terprise and large-scale propagation on the Internet. The latter usually relies on assumptions
of homogeneity and aggregated behavior. To the best of our knowledge, there does not ex-
1
ist any study that considers the heterogeneity and complexity of an enterprise environment
at a sufficient detail when modeling malware dynamics. In particular, three key aspects
of malware propagation have not received adequate attention in existing models: (i) enter-
prise environments exhibit diverse network structures at many scales, e.g., wireless LANs,
wired segments, and the core corporate network, with different bandwidth and latency lim-
its, (ii) service interactions among hosts at these scales are crucial parameters affecting
propagation, especially topological and mobile viruses, and (iii) mobile users with laptops,
personal digital assistants (PDAs) and cell phones can potentially compromise perimeter
security such as firewalls, by seeding and accelerating the spread of mobile viruses. In
Chapter 2, we address these issues and present a fine-grained agent-based framework for
modeling malware propagation in enterprise networks.
Proactive vs. Reactive Defense
As pointed out in [96], the interval between the announcement of a software vulnera-
bility and the emergence of a malware exploiting it is also getting shorter and shorter. For
instance, Code Red [91] and Nimda [42] appeared within only 30 and 45 days, respec-
tively, of the corresponding vulnerability announcements. With the increasing speed and
sophistication of today’s malware agents, it is critical that automated malware detection
and containment systems are developed to identify and isolate an attack in the very early
stages of its spread.
This motivates the design of an automated malware containment system. The traditional
signature-based anti-virus tools offer protection againstknownmalware only. “Zero Day”
attacks [118] based on previously-unknown attack signatures and vulnerabilities can be
difficult to contain with signature-based tools. When a previously-unknown virus or worm
is first detected, it currently takes24 hours or more to develop and distribute an effective
patch. Therefore, several studies have investigated automated worm detection and contain-
ment systems. For scanning worms, rate limiting techniques [148, 149] have been found
to be promising in slowing down a worm during its initial propagation, allowing machines
to be patched with appropriate anti-virus signatures. Other studies [49] have investigated
behavior signatures an alternative to signature-based methods to detect general classes of
worms. Malicious agents that exploitlocal information(e.g., topological, metaserver and
2
contagion worms [144]) are difficult to detect and contain since they may take advantage
of multiple services to spread. Further, topological worms do not use random scanning of
IP addresses to find victims since the IP addresses they target can be obtained from a com-
promised host. Therefore, rate limiting methods that use failed TCP connection attempts,
may not be effective against them. Current threat mitigation technologies are mostly “re-
active”, i.e. the majority of these tools generate alerts whenever a worm or virus signature
is detected at a host or in the network traffic. By the time, alerts from multiple hosts and
network segments are correlated, the malware agent may have spread to other hosts and
subnetworks in the enterprise. As a result, the traditional patching and anti-virus tools are
used primarily for cleanup, and not for attack containment. Our primary focus in this thesis
is how to provide aproactiveresponse in the time windowbetweenthe time an anom-
aly is detected (i.e., an alert is generated) either at a host or in the network, and the time
at which the infection rate has reached that of a persistent epidemic. Chapter 3 presents
such a proactive containment framework that applies selective service rate-limiting and
quarantine to hosts within the enterprise by looking at their service interactions. Our re-
sults indicate thatproactive group-behavior containmentresults in an order-of-magnitude
stronger defense against a wide variety of worms and viruses than traditional reactive and
rate-limiting defenses.
Mobile Devices and Malware
Mobile handsets are increasingly used to access services such as messaging, video/music
sharing, and e-commerce transactions that have been previously available on PCs and
servers only. However, with this new capability of handsets, there comes an increased risk
and exposure to malicious programs (e.g., spyware, Trojans, mobile viruses and worms) [122,
123] seeking to compromise data confidentiality, integrity and availability of handset ser-
vices. Malware targeting mobile devices use traditional social-engineering techniques
(email and P2P file-sharing), as well as vectors unique to mobile devices such as Bluetooth
and SMS (Short Messaging Service) messages described below. The past three years alone
have witnessed an exponential rise in the number of distinct mobile malware families to
over 30, and their variants to more than 170. These malware can spread via Bluetooth and
SMS/MMS messages, enable remote control of a device, modify critical system files, dam-
3
age existing applications including anti-virus programs, and block MMC memory cards, to
name a few. Studying such viruses — their capabilities, infection models and vulnerabil-
ities they typically exploit — is therefore an important area of research. In Chapter 4, we
provide an in-depth review of currently known mobile worms and viruses.
The mobile viruses discovered so far have caused little damage as they require explicit
user interaction for installation and activation. However, potential harm from future mali-
cious agents can be more severe in the form of handset downtime, service disruption due
to Denial-of-Service (DoS) attacks, physical damage to device hardware, and theft of sen-
sitive data on the device. Similar to email viruses, these agents may also target SMS/MMS
services for distributing spam and phishing messages. There are several factors that make
mobile devices particularly vulnerable to future mobile viruses. First, recognizing cus-
tomer demand for data-rich cellular services, carriers around the world have been deploy-
ing 3G (third generation cellular) systems at a rapid pace. Currently, there are more than
130 3G networks [66] (WCDMA and CDMA2000 1X EV-DO) worldwide. Many of these
networks offer real-world data rates of 1.4Mbps and 128 Kbps for download and upload,
respectively. The download data rates are expected to rise to 7.3 Mbps in early 2008 and
10.2 Mbps in 2009. At these rates, mobile users will be able to run many feature-rich appli-
cations on their mobile devices that traditionally require access to a high-speed enterprise
network. The processing power (CPU speed and storage capacity) of handheld devices is
also increasing rapidly. Many smart phones [12] already contain a full-fledged OS like
Symbian, Windows Mobile and Palm OS, allowing users to download a wide variety of
applications. Almost all of these OSs support services such as email, SMS/MMS, and ap-
plication development in C++ and Java. Consequently, the malware writers increasingly
find it easier to generate device-generic but vulnerability-specific malware for mobile de-
vices. As a result, the current count of known mobile malware stands at 100, up from only
10 in previous years combined. Chapter 4 presents our study of mobile malware propaga-
tion in enterprise environments.
While there are a number of approaches to containing Internet worms and viruses, there
are only a handful of solutions developed for mobile devices. These are limited to perform-
ing light-weight signature-based scanning of handset filesystem against a limited set of at-
4
tack signatures. Although such an approach is acceptable today due to the limited number
of mobile viruses discovered to date, signature-based solutions are clearly not memory-
efficient and do not scale well when dealing with a large number of malware signatures and
their variations. Another serious problem to scalability is that a mobile device may receive
malware with payloads targeting both wired and wireless devices, e.g., the ”crossover”
malware described in Chapter 4. This means that messages or data on handsets must be
scanned for both mobile as well as regular malware — this will require searching against a
very large database of known signatures. Due to limited CPU power, storage and memory,
installing large signature databases is not an option for mobile devices. Therefore, there is
a tremendous need for detecting malicious agents on handsets using alternative means. We
investigate one such approach, calledbehavioral detection, in Chapter 5, based on the idea
of behavior vectors for mobile viruses discussed in Chapter 4.
1.2 Primary Research Contributions
1.2.1 Enterprise-Level Malware Modeling
We have studied three parameters crucial to describing malware propagation in enter-
prise environments:service interactions among hosts, local network structure, anduser
mobility. The majority of the parameters in our study are derived from real-life network
traces collected from a large enterprise network, and therefore, represent realistic malware
propagation and infection scenarios. We propose a general-purpose agent-based malware
modeling framework targeted to enterprise environments. We examine two likely scenar-
ios: (i) a malicious virus such as Cabir spreading among the subscribers of a cellular net-
work using Bluetooth, and (ii) a hybrid worm that exploit email and P2P file-sharing to
infect users of an enterprise network. In both cases, we identify the parameters crucial to
the spread of the epidemic based upon our extensive simulation results.
5
1.2.2 Proactive Group-Behavior-Based Defense
While previous research in worm defense identified the need forproactive containment
for combating topological worms, there appears to be very little published work on al-
gorithms for proactive containment and its comparison with traditional defense methods.
We evaluate two key algorithms:proactive rate-limitingandproactive quarantineagainst
topological worms. These algorithms are studied using traffic traces collected from a large
enterprise network and a fine-grained agent-based malware modeling tool. We then pro-
pose aproactive group behavior-based worm containment algorithm in which vulnerable
hosts proactively enter into a group-defense mode based on their interactions with other
infected and suspicious hosts. This is motivated by the fact that topological worms exploit
the social networking aspects of email, P2P, IM and SMS networks, rather than the physical
layout of an enterprise network. We automate the calculation of group behaviors by first
constructing aservice-behaviortopology of the enterprise from its service-level traces, and
then finding clusters ofsimilar behaviorin the topology. We compare the effectiveness of
individual and group proactive containment. Our results show that proactive containment
can significantly slow down a fast-spreading worm in the early stage of the epidemic.
1.2.3 Understanding Emerging Mobile Worms and Viruses
We investigate the propagation of mobile worms and viruses that spread primarily via
SMS/MMS messages and short-range radio interfaces such as Bluetooth. First, we study
these vulnerabilities in-depth and derive the infection vectors based on a survey of current-
generation mobile viruses. We then build an infection state machine of mobile worms on
handheld devices and use it to build specific instance of a recent worm such as Commwar-
rior. Next, we simulate its propagation in a cellular network using data from a real-life
SMS customer network. The simulator models each handheld device as an autonomous
mobile agent capable of sending SMS messages to others (via an SMS Center), and is
equipped with Bluetooth. We incorporate a shadow-fading model for Bluetooth to account
for terrain and environment effects. Since mobile malware targets specific mobile OSs, we
consider diversity of deployed software stacks in the network. Our results reveal that hy-
6
brid worms that use SMS/MMS and proximity scanning (via Bluetooth) can spread rapidly
locally within a cellular network, making them potential threats in public meeting places
such as sports stadiums, train stations, and airports.
1.2.4 Mobile Malware Detection
Current-generation mobile anti-virus solutions are primitive when compared to their
desktop counterparts, and may not be scalable given the small footprint of mobile devices
as new families of cross-platform malware continue to appear. We propose a novel be-
havioral detection framework to capture mobile worms, viruses and Trojans, instead of
the signature-based solutions currently available for mobile devices. First, we generate
a database of malicious behavior signatures by studying over 25 distinct families of mo-
bile viruses and worms targeting the Symbian OS, including their 140 variants, reported to
date. Next, we describe a two-stage mapping technique that constructs these signatures at
run-time from monitoring the system events and API calls in Symbian OS. We discriminate
malicious behavior of malware from normal behavior of applications by training a classifier
based on Support Vector Machines (SVMs). Our evaluation results indicate that behavioral
detection can identify current mobile viruses and worms with over 96% accuracy. We
also find that the time and resource overheads of constructing the behavior signatures from
low-level API calls are acceptably low for practical deployment. Most mobile device man-
ufacturers and mobile service providers can implement our proposed framework without
any major modification of the handset operating environment.
1.3 Organization of the Dissertation Proposal
The dissertation proposal is organized as follows: Chapter 2 describes our work on
enterprise-level malware modeling considering heterogeneity of nodes, services and user
mobility. In Chapter 3, we present and evaluate a hybrid group-behavior-based defense for
proactive containment of malware spreading within an enterprise network exploiting com-
mon enterprise services such as email, IM, P2P etc. Chapter 4 presents a comprehensive
7
survey of common exploits and vulnerabilities in SMS/MMS messaging and Bluetooth that
are increasingly the target of mobile virus writers. We also simulate the propagation of a
virus similar to Mabir in a cellular SMS network to study its potential spread. Chapter 5
presents the behavioral detection approach for mobile malware. We conclude in Chapter 6
with a discussion of several aspects of this problem where future work can be pursued.
8
CHAPTER 2
Enterprise-Level Modeling of Mobile Malware
2.1 Introduction
In this chapter, we develop realistic models of hybrid topological worms and mobile
viruses at the time-scale and network structure of an enterprise environment, addressing
the three requirements listed in Chapter 1. Most of the parameters in our epidemic mod-
els are derived explicitly from traces collected from the large Class-B IP network of an
enterprise and a large cellular provider of SMS/MMS messages. Although our simula-
tion results show the epidemic spreading within these target enterprise environments, our
modeling approach is general and can be applied to any enterprise. We make three pri-
mary contributions. First, we demonstrate that the current epidemic models fail to capture
services, bandwidth, user mobility and connectivity structure of an integrated enterprise
environment consisting of wired, wireless and cellular segments. Second, we present a
general-purpose simulation framework for understanding malware epidemics in suchin-
tegratedenvironments. Our framework, calledAgent-based Malware Modeling(AMM),
explicitly incorporates non-homogeneous service interactions, host connectivities, network
bandwidth, channel models of short-range radio devices and user mobility within an enter-
prise. The basis of AMM are autonomous agents that incorporate realistic models of ser-
vices and mobility. The agents are arranged hierarchically in much the same way as how
an enterprise network is designed. For example, in our implementation of AMM,“base
station agents”can monitor and collect aggregated statistics of activities of“mobile device
9
agents” in their respective WLANs. Third, based on our extensive simulation results, we
suggest a number of mitigation strategies that can be implemented in an enterprise. This is
a complex task given the different types of network interfaces available for users in such
environments. In Chapter 3, we describe an overlapping defensive system model combin-
ing quarantine and rate-limiting at access points and critical servers. This is motivated by
the fact that mutually supportive multi-dimensional defenses will be necessary to combat
future malware targeting the enterprise environment. A major benefit of our framework is
that it can be used by enterprises to assess the vulnerability of their network from emerging
malicious worms and viruses, and to decide where to place defensive measures before such
attacks take place.
The chapter is organized as follows. We discuss the primary challenges in enterprise-
level modeling of malicious agents in Section 2.2. Next, we discuss the most significant
propagation vectors and likely attack scenarios in enterprise environments in Section 2.3.
Section 2.4 describes our agent-based modeling and simulation framework in detail, in-
cluding infection models for services commonly targeted by malware, and user mobility
models as implemented in the framework. In Section 2.5, we simulate two likely attack
scenarios presented earlier to understand the factors affecting the spreading rate of an epi-
demic. Section 2.6 briefly reviews existing literature on malware modeling. We provide
concluding remarks in Section 2.7.
2.2 Modeling Challenges
There are three major challenges in accurate modeling of an epidemic within an enter-
prise setting. To the best of our knowledge, there does not exist any model of topological
and mobile malware that takes into account all three aspects of an enterprise environment.
Service diversity Enterprise environments consist of networked hosts with a variety of
OSs, applications and services running on them. Even when a set of hosts are running
similar services, not all of them are equally vulnerable to the same exploits due to delays
in patching and different versions of client software. The epidemic models [91, 92] devel-
10
oped for wide-area networks, such as the Internet, do not consider such heterogeneity at the
level of individual hosts and services. However, diversity is important when we consider
enterprise-scale epidemics where the homogeneity assumption is no longer valid. A naive
application of the popular Kephart-White epidemic model [72] to describe a mobile virus
spreading in a cellular network does not produce the correct epidemic spread. To incorpo-
rate heterogeneity in epidemic models, many previous studies (e.g., [154]) have assumed a
vulnerability ratio for the population. However, it is not clear how one can come up with a
vulnerability ratio for hybrid worms that exploit multiple services as in the case of Nimda
and Fizzer. The present epidemic modeling framework explicitly captures message-level
service interactions among the hosts of an enterprise, and captures the diversity of services
and the host environment (OS, application, transport protocols, etc.). The service interac-
tions from malicious agents are superimposed on the normal background traffic calculated
from collected traces, and therefore, represent a more realistic environment.
Network structure The shortcomings of the uniform-mixing assumption have led to de-
velopment of epidemic models that capture the effects of contact patterns between indi-
viduals, instead of the mean-field theory. In uniform-mixing models, an infected host has
the same probability of infecting any vulnerable host in the population — this assumption
is clearly not valid for topological worms that exploit the local network structure. There-
fore, several recent studies have investigated the effects of local network connectivity on
epidemic spreading. We refer to [97] and the references therein as the relevant litera-
ture, particularly on complex networks, small-world effects, models of network growth,
and power-law degree distribution. The various models can be divided into two broad
categories based on whether the contact network structure is either “small-world” [25] or
“scale-free” [76]. The scale-free nature of technological networks and epidemic spread-
ing in such networks have also been studied, for example, in [45] and [101], respectively.
However, these studies derive only the steady-state outcome of the epidemic in the limit of
long times, and do not provide the time evolution of the infection process which is crucial
in understanding how an epidemic spreads in its initial stages. The propagation dynamics
of malicious codes in various models of scale-free networks have been studied by a number
11
of researchers [24, 31]. In majority of these studies, topologies are generated with power-
law degree distributions via either the Barabasi and Albert (BA) [25] or the Klemm and
Eguiluz (KE) [76] algorithm for a specified number of nodes and a given power-law index.
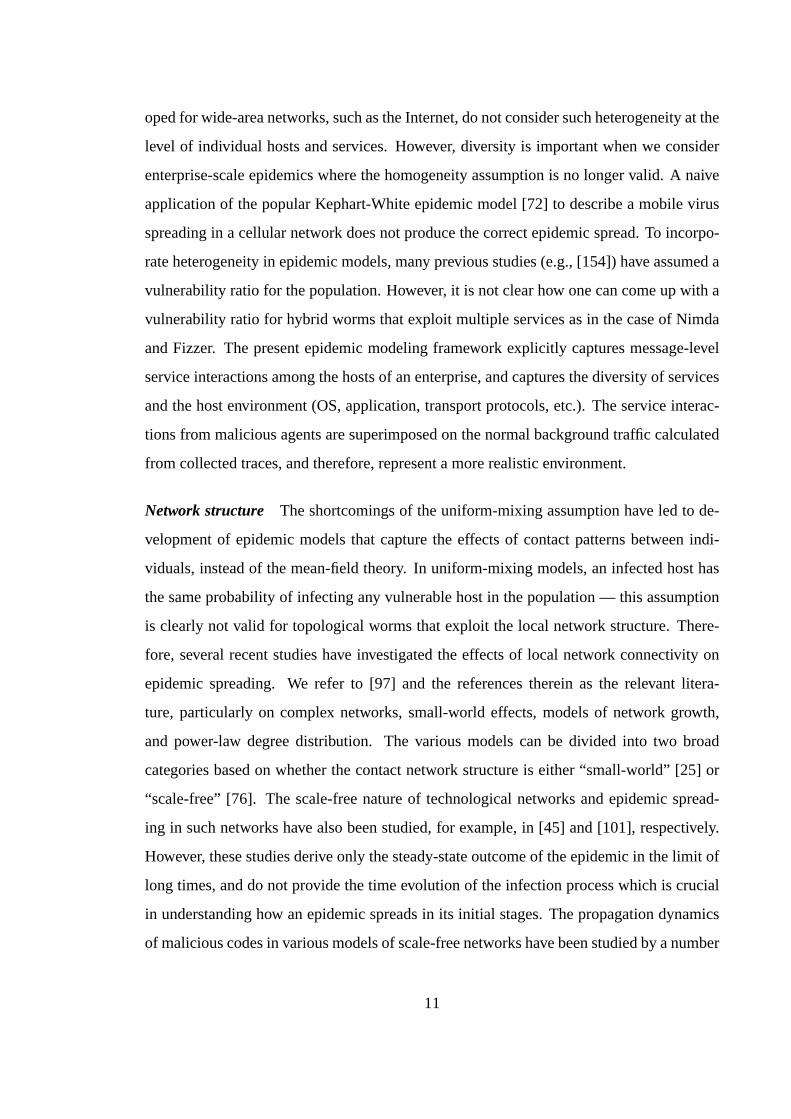
For example, Figure 2.1 plots a typical distribution of the computed “betweenness central-
ity” (BC) of P2P, email and overlapping (hosts having email and P2P services) topologies
from our traces collected from a large class-B IP network. The BC at a vertexk is com-
puted as follows. LetCk(i; j) denote the set of the shortest pathways between a pair of
verticesi and j through the vertexk. The fractiongk(i; j) = Ck(i; j)∑Ck(i; j) indicates the impor-
tance of the vertexk between two verticesi and j. The BC of vertexk is then defined as
gk = ∑i 6= j gk(i; j). Figure 2.1 confirms the scale-free nature of the service topologies in a
real-life enterprise environment. However, replacing an enterprise service topology with
a corresponding power-law network model still does not account for the true propagation
dynamics. Since malicious agents exploit specific vulnerabilities in sequence of messages
and in popular applications, the service interactions constitute an important criteria for in-
fection. This is best captured when service topologies are constructed explicitly from traces
collected from the target enterprise network.
Mobile users The mobile communications devices introduce new propagation vectors
such as Bluetooth, SMS/MMS messaging and object transfers in the enterprise environ-
ment. User mobility changes the service topology as devices move around the physical
environment of the enterprise. The problems with the Kephart-White infection model ap-
plied to model epidemics that spread via short-range RF such as Bluetooth have been iden-
tified in a recent study [89]. The standard epidemic models fail because they ignore node
velocity and the non-homogeneous connectivity distributions among the nodes. In addi-
tion, the location-specific density distribution of mobile devices can potentially affect the
spread of an epidemic. Further, the spread of an epidemic has not been studied in an en-
terprise environment that consists of overlapping mobile wireless and wired segments with
users switching to different network resources in different locations of an enterprise. Our
framework addresses this by incorporating user mobility models along with the services
and device diversity mentioned above.
12
1e-05
0.0001
0.001
0.01
0.1
1
1 10 100 1000
Bet
wee
nnes
s C
entr
ality
(B
C)
Vertices, N
BC (P2P, email)BC (P2P)BC (email)
Figure 2.1: Betweenness Centrality (BC) of email and P2P topologies
Next, we discuss emerging mobile malicious agents in more detail since they represent
a growing threat to enterprise security.
2.3 Mobile Malware in Enterprises
2.3.1 Potential Harm by Mobile Viruses
The mobile viruses discovered so far have caused little damage as they require explicit
user interaction for installation and activation. However, potential harm from future ma-
licious agents can be severer in the form of terminal downtime, service disruption due to
Denial-of-Service (DoS) attacks, physical damage to device hardware, and theft of sensitive
data on the device. Similar to email viruses, these agents may also target SMS/MMS ser-
vices for distributing spam and phishing messages. We discuss below four primary factors
that make enterprise networks particularly vulnerable to mobile viruses.
1. Processing power: The processing power (CPU speed and storage capacity) of
handheld devices is increasing rapidly. Many smart phones [12] already contain
13
a full-fledged OS like Symbian, Windows Mobile and Palm OS, allowing users to
download a wide variety of applications. Almost all of these OSs support services
such as email, SMS/MMS, and application development in C++ and Java. Conse-
quently, the malware writers increasingly find it easier to generate device-generic but
vulnerability-specific malware for mobile devices. For example, the current count of
known mobile malware stands at 170, up from only 10 in previous years combined.
2. Increased connectivity: There is now widespread availability of 802.11b WLANs
(“hotspots”) and high-speed wireless broadband data services in major metropolitan
areas. These services allow many mobile enterprise users to stay connected to their
email, messaging and ERP (enterprise resource planning) applications from outside
their corporate LANs. Increased availability, however, facilitates mobile viruses to
cross over from wireless to wired network segments of an enterprise. More advanced
crossover viruses than Cardtrap.A [61], designed for transfer between mobile devices
and desktop PCs, may be developed to exploit this increased connectivity. There are
also DoS attacks possible in connected WLANs [26] and SMS messaging networks
[52] — such attacks can be launched by handsets compromised by mobile malware.
3. Standardization: Mobile devices are increasingly developed on a small number
of OS platforms. The three most popular mobile OSs — Symbian, Windows (CE
and Mobile) and PalmSource — share 62.8%, 15.9% and 9.5% of the global smart
phone market, respectively [12]. The development environment is also increasingly
consistent across devices. For example, the Java 2 Platform, Micro Edition (J2ME) is
deployed on millions of consumer and embedded devices. Such standardization will
allow virus writers to develop malware targeting both mobile and non-mobile hosts.
4. Integration with enterprise applications: Core enterprise applications such as cus-
tomer relationship management (CRM) and enterprise resource planning (ERP) in-
creasingly allow integration of third-party email and messaging services. These ap-
plications allow SMS gateway plug-ins providing a two-way interactive communi-
cation platform among the CRM and ERP application users. Since CRM and ERP
applications are extremely popular among mobile users, any vulnerability in SMS
14
Enterprise Malware
Propagation Vectors
Scanning
Physical layer Network layer
(Bluetooth, other RF) (Local IP scanning)
IM IRC SMS/MMS
Lovsan/MSBlast
Blaster
Mabir
Skulls
CommWarrior
Doomboot
Lasco
Cabir
Locknut
Drever
Minuka
Timofonica
(HotSync,Parasite) Palm Phage
Vapor
Liberty
WinCE/Dtus
Topological
Sequential Proximity Random Messaging P2P Email VoIP Apps Direct Attach
(cookies, Apache logs,
temp files, ssh files..)
Fizzer
Morbex
Code Red II
Kelvir
Alcra Bagle.AH
NetSky.C
MyDoom
Sobig
BugBear
Saros
Spybot
Gibe
Kickin
Darby CoolNow
Velkbot/
SDbot
LovHart
MyLife
Zezer
Bropia
Surnova
Sapphire
Figure 2.2: Enterprise malware propagation vectors
clients can be exploited within these applications by mobile malicious agents.
2.3.2 Propagation Vectors
Recent worms and viruses are shown to exploit multiple propagation vectors, such
as email, file-sharing, and messaging in addition to IP address scanning. Bots such as
Spybot.IVQ [124] even target enterprise applications (e.g., Microsoft SQL and MySQL
servers with weak password protection) for propagation. In this subsection, we first con-
sider spreading mechanisms of hybrid topological worms and mobile viruses. We then
develop a set of most likely attack scenarios for an enterprise network. Finally, we model
these scenarios in an emulated enterprise environment to study the epidemic spread and to
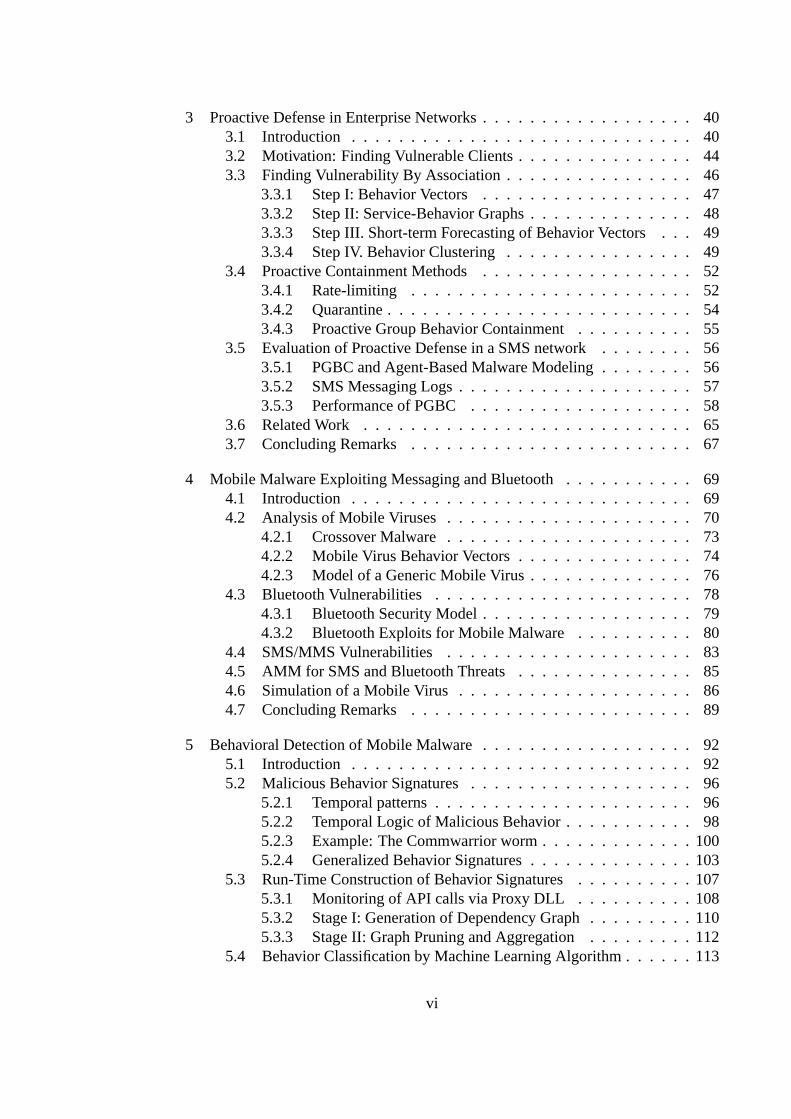
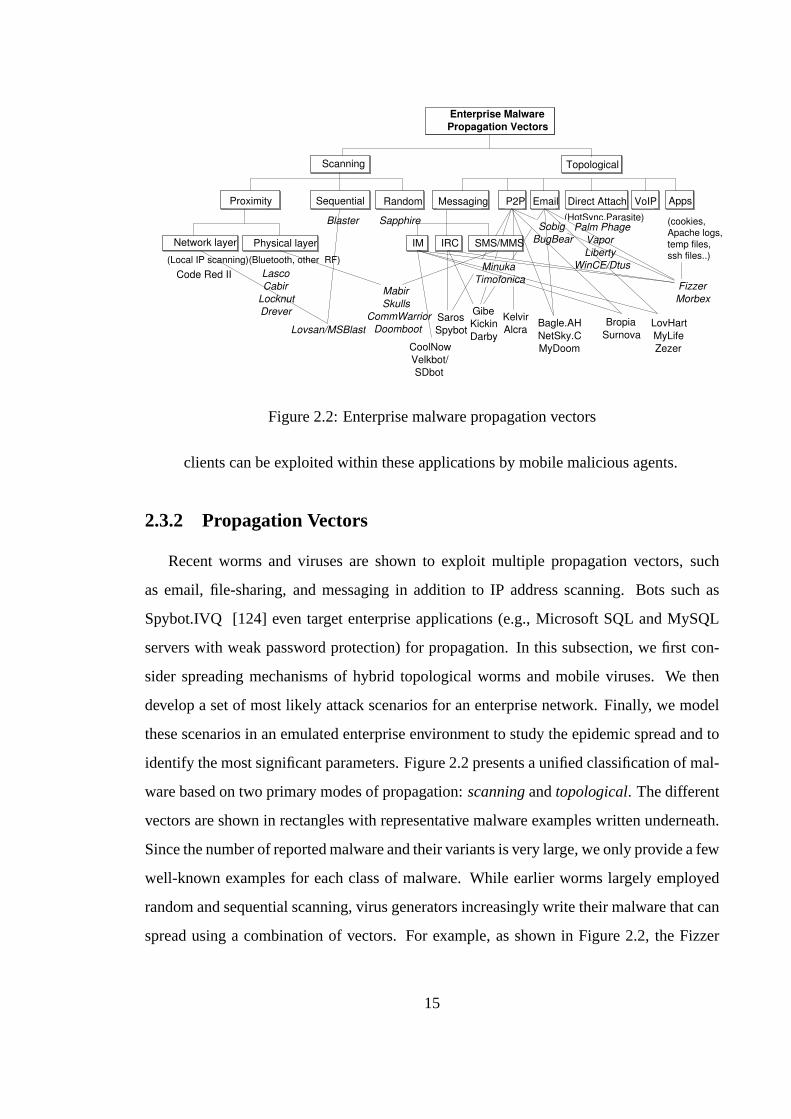
identify the most significant parameters. Figure 2.2 presents a unified classification of mal-
ware based on two primary modes of propagation:scanningandtopological. The different
vectors are shown in rectangles with representative malware examples written underneath.
Since the number of reported malware and their variants is very large, we only provide a few
well-known examples for each class of malware. While earlier worms largely employed
random and sequential scanning, virus generators increasingly write their malware that can
spread using a combination of vectors. For example, as shown in Figure 2.2, the Fizzer
15
worm [121] exploits IM, IRC, e-mail and file-sharing networks, whereas Mabir [123] can
spread via both proximity scanning using Bluetooth and SMS messages on cell phones. We
discuss the current generation mobile malware in-depth in Chapter 4.
2.3.3 Enterprise Malware Payloads
Some of the common payloads found in enterprise environments are adware, phishing,
keystroke loggers, unauthorized remote administration tools, browser-helper objects, dis-
tributed attack (e.g., DDoS) tools, tracking cookies and P2P software. Instead of specific
examples, we give a common form of exploit that most spyware typically uses. The spy-
ware injects a process into Internet Explorer (IE) which then logs keystrokes corresponding
to certain key words into a text file. It may also monitor and log data in MS Windows clip-
board as well as the protected storage area of IE. The protective storage area is used by the
AutoCompletefeature of IE for storing personal information such as addresses, social se-
curity numbers, credit cards, login and passwords to be filled out automatically on HTML
forms. When the log file reaches a certain size, the spyware program sends a notification
message with the key stroke information, TCP ports and the victim IP address to a web site
controlled by the attacker. It periodically listens on these TCP ports for instructions from
the remote attacker. Some spyware also disables anti-virus vendor web sites by adding
them to the hosts file of Windows.
While email-based phishing [23] is a widespread problem in the Internet, SMS mes-
sages have also been exploited recently for this purpose [111]. The attacker sends out an
SMS message to an unsuspecting cell phone user with a message that’s designed to lure the
user into dialing a number masquerading as a credit card company or a bank. Similarly, the
potential for sending spam (both text as well as graphical/video messages) to many cellular
subscribers using SMS and MMS gateways on the Internet is also very high. The virus
definitions available on security vendor websites explain many other payloads commonly
observed with hybrid and mobile malware.
16
Object Components and Parameters Source (T / M)
Wired
Wireless
Cellular
Number of hosts, N h
Network Topology (array), G(E h , N
h )
IP Addresses (array), IP(N h )
Background Traffic Matrix (array), T b (G)
T
T
T
T
Number of WLANs, N l
Access Point Locations (array), x w
Number of hosts in WLANs (array), N wl
Mobility Models, M wl
Background Traffic Matrix, T b (W)
T
T
T
M
T/M
Number of Base stations, N s
Cell Locations (array), x c
Number of devices in Cells (array), N cs
Mobility Models, M cs
Service Gateway Locations (array), x g
T
T
T
M
T
Service Infection Models
List of vulnerable segments, S
Service Topology (array), G(S)
Infection Parameters (see Section 4)
Vulnerability Ratio, v
T
T
T/M
T/M
T: Trace, M: Emperical Models, T/M: Some parameters are derived from traces
Figure 2.3: Parameters affecting domain-specific malware propagation
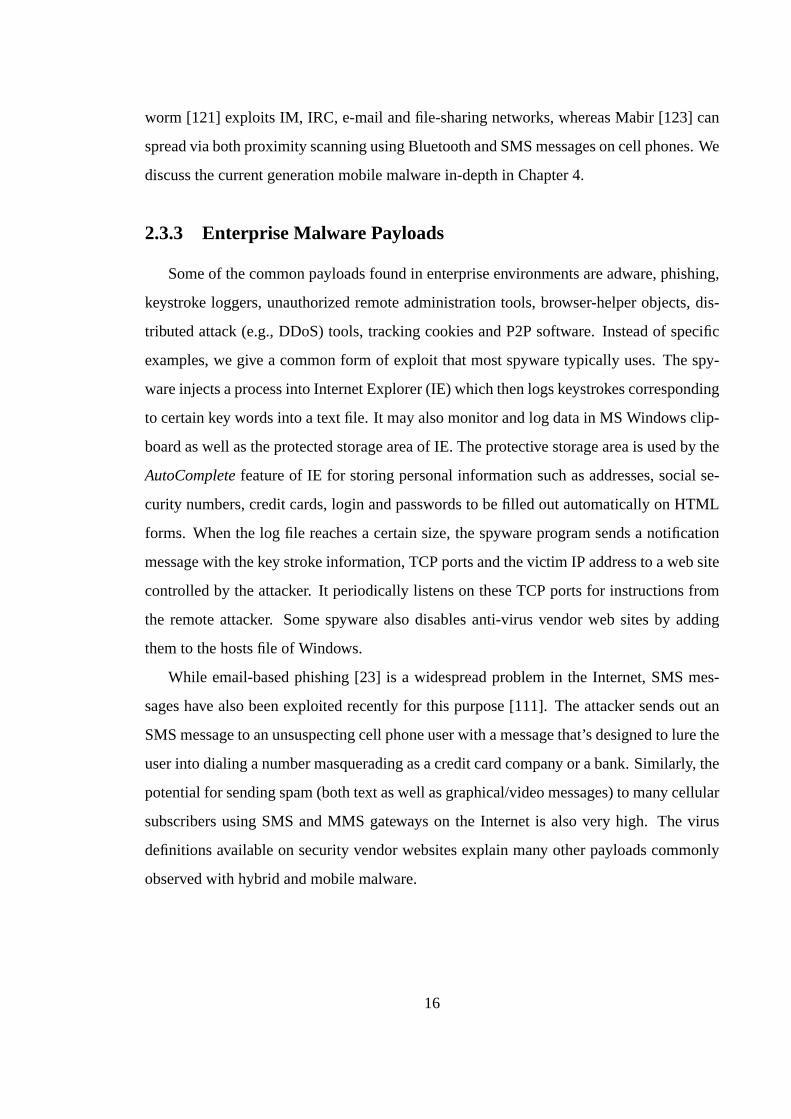
2.3.4 Parameters Affecting Malware Propagation
Enterprise networks consist of a combination of wired and wireless LANs, along with
an overlapping cellular data/voice segment to facilitate the mobile workers across geo-
graphical locations. Not all of these network segments are equally vulnerable to a malicious
worm or virus epidemic. The spreading rate of an epidemic within a segment is determined
by a number of factors such as presence of vulnerable services, available bandwidth, den-
sity of vulnerable hosts/IP addresses, and user mobility patterns. These factors, along with
a model of the service-infection process, constitute a high-fidelity model of the malicious
agent. Figure 2.3 lists the parameters we have used for network segments in our malware
modeling framework. We also show the data source of each parameter, indicating whether
the data can be derived from enterprise traces (T), empirical models (M) and a combination
of both (T/M). Note that for wireless and cellular segments, we need suitable models of
17
user mobility to reflect how services and service topologies change as users move around
the enterprise network. The service gateways and access points play an important role in
forwarding messages among the wired and wireless/cellular segments of an enterprise, and
therefore, represents important mitigation points where detection and containment of ma-
licious agents can be performed. Therefore, we have incorporated access points and base
stations in our modeling framework. As Figure 2.3 shows, the service-infection models
have a set of general parameters such as list of vulnerable segments over which the ser-
vice exists, the topology of service interactions, and the ratio of vulnerable hosts (with the
service targeted by the malware) to total number of hosts in the enterprise. The infection
parameters are highly dependent on the type of service a malware targets. For example, in
case of a mobile worm targeting Bluetooth, the range of the Bluetooth radio signal is an im-
portant parameter. On the other hand, an email virus requires user interaction to spread, so
the probability of opening an infected email may constitute an important parameter to con-
sider when modeling an email worm. We discuss our implementation of service-specific
infection models in Section 2.4.
We now focus on several possible ways a malicious agent can spread in an enterprise
exploiting the diversity of its network segments and devices. The goal is to model these
scenarios explicitly and understand the vulnerability of our target enterprise to malware
targeting popular services. Our target is the enterprise where we collected our traces from
and derived the above infection parameters. The methodology can be applied to any enter-
prise network as long as one can collect a reasonable amount of traces, enough to derive
the above parameters.
(1) Scenario 1 (mobile devices):This is the most immediate threat that exists today. Even
if the core enterprise network is protected from outside attacks via firewalls and perimeter
intrusion detection systems (IDSs), mobile devices such as laptops, PDAs and cell phones
can get infected while outside the corporate firewall, and bring the malicious agent inside
the enterprise perimeter by synchronizing with an internal desktop or a server. One possi-
ble way to contain such agents is to install anti-virus software on the mobile device itself.
Several vendors have recently announced such software for mobile devices. However, most
mobile systems are designed to make a tradeoff between energy consumption, processing
18
power and storage. Therefore, security schemes such as VPNs (processing-intensive) and
signature-based detection may not be appropriate for cell phones and PDAs as more and
more mobile viruses appear. Further, unlike desktops within the corporate network, users
of mobile devices are often allowed to download or disable any application on their devices,
further complicating the security requirements.
(2) Scenario 2 (vectoring):This refers to a form of attack in which a set of hosts are ini-
tially compromised and then used to launch attacks against more valuable systems within
an organization. Such attacks can be targeted against specific access points or base stations,
and can even take the form of a DDoS attack. Consider a busy airport in which passengers
can download flight arrival/departure information or reserve seats via their wireless PDAs.1
Virus writers may develop a malicious agent that can discover other nearby mobile devices
via proximity scanning (explained later), and then send a large number of requests to the
nearest base station, causing a DoS attack on a target service. Vectoring is not limited to
mobile devices. It can potentially be used to spread cross-domain (i.e., wired to wireless
or vice versa) malicious agents, for example, by piggybacking on email or IM and SMS
messages.
(3) Scenario 3 (multi-scanning techniques):A future malicious agent may be capable of
deploying multiple scanning techniques to spread widely in a given network. The limiting
factors to its growth will be only available bandwidth and vulnerable/unpatched services.
Current-generation worms already use a combination of scanning methods. The various
scanning methods a malicious agent can deploy within an enterprise network are: (i)prox-
imity scanningvia the Bluetooth or IrDA interface in which nearby devices are discovered
within the short-range radio distance, (ii)history scanningin which a malicious applica-
tion, once embedded, can monitor recently-dialed phone numbers and incoming messages
to create a hitlist, (iii)topological scanningin which the agent discovers vulnerable hosts
via address books, URLs, buddy lists, application data caches, etc., (iv)localized, sequen-
tial and subnet scanningin which a set of local and sequential IP addresses are scanned for
vulnerabilities rather than choosing IP addresses at random. Note thatrandom scanning
of vulnerable IP addresses, while effective in the large Internet, is not the best spreading
1Such facilities have already been available in a number of airports across the world.
19
strategy in the context of an enterprise network. Therefore, we focus on combinations of
strategies (i)–(iv) that yield a highly effective epidemic spread.
Next, we detail our agent-based malware modeling framework.
2.4 Modeling of Malware Propagation
2.4.1 Motivation
We argue that the standard epidemic models of malware propagation are not adequate
to model an enterprise environment consisting of wired, cellular and wireless segments.
The agent-based malware modeling (AMM) is viable and more accurate in this case.
Deterministic methods [91, 92] developed for modeling the previous generations of
worms, such as Code Red, Sapphire and variants thereof, are well-suited to characterize
the spread of an epidemic in large populations such as the Internet. However, they are not
accurate for modeling small populations such as an enterprise environment. These models
unrealistically assume perfect-mixing and homogeneity within the population. Malicious
codes that propagate by exploiting local node connectivity can hardly be modeled by the
homogeneity assumption. The homogeneity assumption fails to hold on both host attributes
(i.e., diversity of OSs, services, and mobility) as well as the network structure among the
hosts. The diversity of host attributes is an important consideration for realistic modeling
because not all hosts are equally vulnerable within an enterprise from a given malicious
code attack.
The homogeneity assumption also doesn’t hold when interactions are highly correlated
with network structure. Topological worms [24, 154] spread by targeting specific services
such as IM, P2P and email — the topology of these service-interaction networks2 may
lead to significant deviations from the results of the differential equation-based models.
Similarly, in case of mobile nodes, the connectivity patterns change depending on how
users roam around the network as well as their speed and pause times. An agent-based
modeling approach can relax the homogeneity and perfect-mixing assumptions by (i) in-
2The term “contact networks” is also used in the epidemiology literature.
20
corporating heterogeneity in agent attributes, (ii) modeling the state transitions of an agent
as an explicit stochastic process and (iii) allowing highly-structured topologies of service
interactions among the agents. The service-interaction topologies can be generated from
traffic traces collected from an enterprise network, and input to the agent-based model.
Note that AMM provides a natural description of an enterprise. It can easily incorpo-
rate changes in individual user mobility patterns and messaging patterns among the hosts
(i.e., service interactions). This makes the model closer to reality than aggregated equation-
based methods. As discussed in [29], agent-based modeling makes it possible to realize the
full potential of the data an enterprise may have to describe the dynamics of a physical
phenomenon. For example, mobility patterns and service interactions among the hosts can
be extracted from traces and session logs. An accurate representation of an enterprise en-
vironment is important when one needs to assess vulnerability from malicious code attacks
targeted to agivenenterprise. Furthermore, the individual behavior of hosts can be com-
plex given the many different applications and services running on a host. The complexity
of differential equation-based approaches will have to increase exponentially to account for
hosts running multiple services. On the other hand, AMM models activities at the host (i.e.,
at the agent level), and sources of randomness are applied to these activities and the under-
lying service queues as opposed to arbitrarily adding noise terms to an aggregate epidemic
model.
While AMM can readily incorporate host diversity and interaction topologies, the com-
putations required to perform a full sensitivity analysis can be expensive due to the large
number of parameters in a typical agent-based model. Clearly, such an approach is not
feasible for modeling malware propagation over the entire Internet. However, our studies
show that enterprise-level modeling with AMM is feasible and offers a much richer sim-
ulation approach to mobile malware modeling. Due to the stochastic nature of AMM, it
is possible that in some cases, either no epidemic is observed or the epidemic ends early
even when the basic reproduction number (R0 > 1) indicates otherwise. We investigate this
further in our evaluation (Section 2.5), and show that the local network structure greatly
influences the probability of an infection spreading through an enterprise.
21
Packet
Traces T
race C
ollecti
on
Serv
ice-M
od
el
Extr
acti
on
Service Model (P2P,
IM, Email, Bluetooth,
etc.)
Service Topology
Ag
en
t-B
ased
Malicio
us C
od
e S
imu
lati
on
Initialize Domain, Segments, Agents
Update Topology, Locations
Process Messages
Yes
No
Infection
Models
Loop o
ver
tim
este
ps
Loop o
ver
sim
ula
tion r
uns
Infection? Activate
Defense
Collect Infection Statistics
Averaged Infection Statistics
Detection Models
Figure 2.4: Flowchart of AMM prototype
22
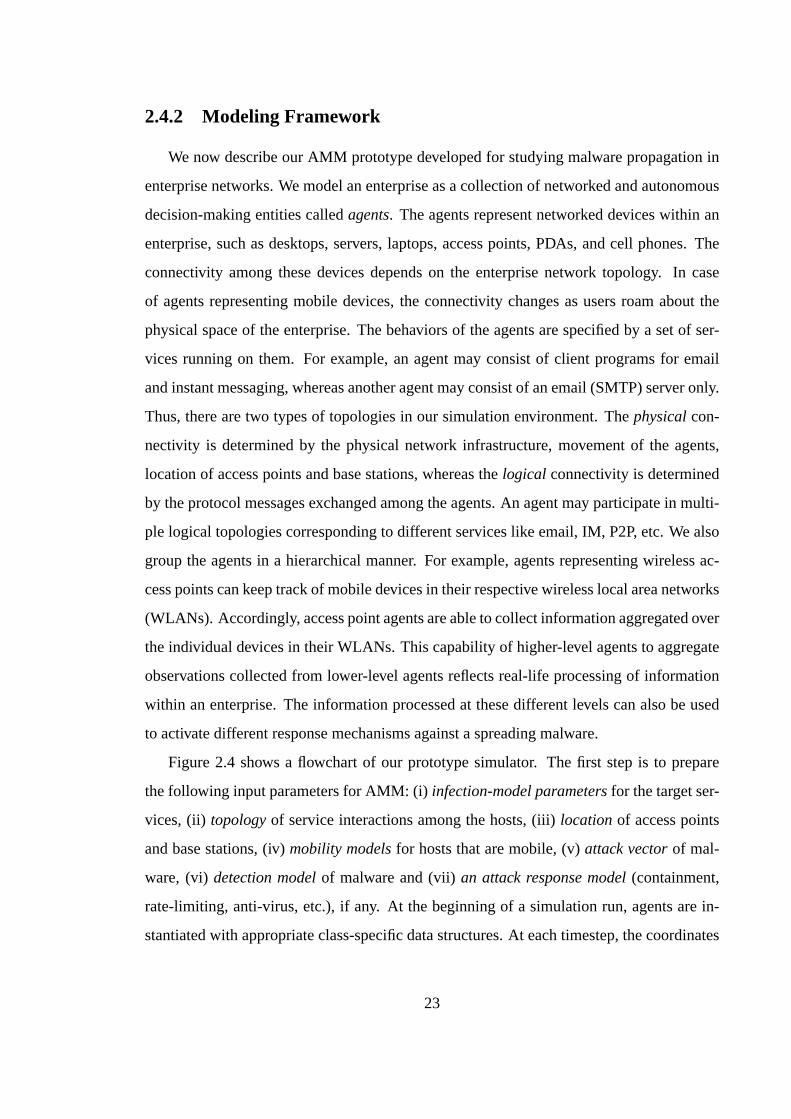
2.4.2 Modeling Framework
We now describe our AMM prototype developed for studying malware propagation in
enterprise networks. We model an enterprise as a collection of networked and autonomous
decision-making entities calledagents. The agents represent networked devices within an
enterprise, such as desktops, servers, laptops, access points, PDAs, and cell phones. The
connectivity among these devices depends on the enterprise network topology. In case
of agents representing mobile devices, the connectivity changes as users roam about the
physical space of the enterprise. The behaviors of the agents are specified by a set of ser-
vices running on them. For example, an agent may consist of client programs for email
and instant messaging, whereas another agent may consist of an email (SMTP) server only.
Thus, there are two types of topologies in our simulation environment. Thephysicalcon-
nectivity is determined by the physical network infrastructure, movement of the agents,
location of access points and base stations, whereas thelogical connectivity is determined
by the protocol messages exchanged among the agents. An agent may participate in multi-
ple logical topologies corresponding to different services like email, IM, P2P, etc. We also
group the agents in a hierarchical manner. For example, agents representing wireless ac-
cess points can keep track of mobile devices in their respective wireless local area networks
(WLANs). Accordingly, access point agents are able to collect information aggregated over
the individual devices in their WLANs. This capability of higher-level agents to aggregate
observations collected from lower-level agents reflects real-life processing of information
within an enterprise. The information processed at these different levels can also be used
to activate different response mechanisms against a spreading malware.
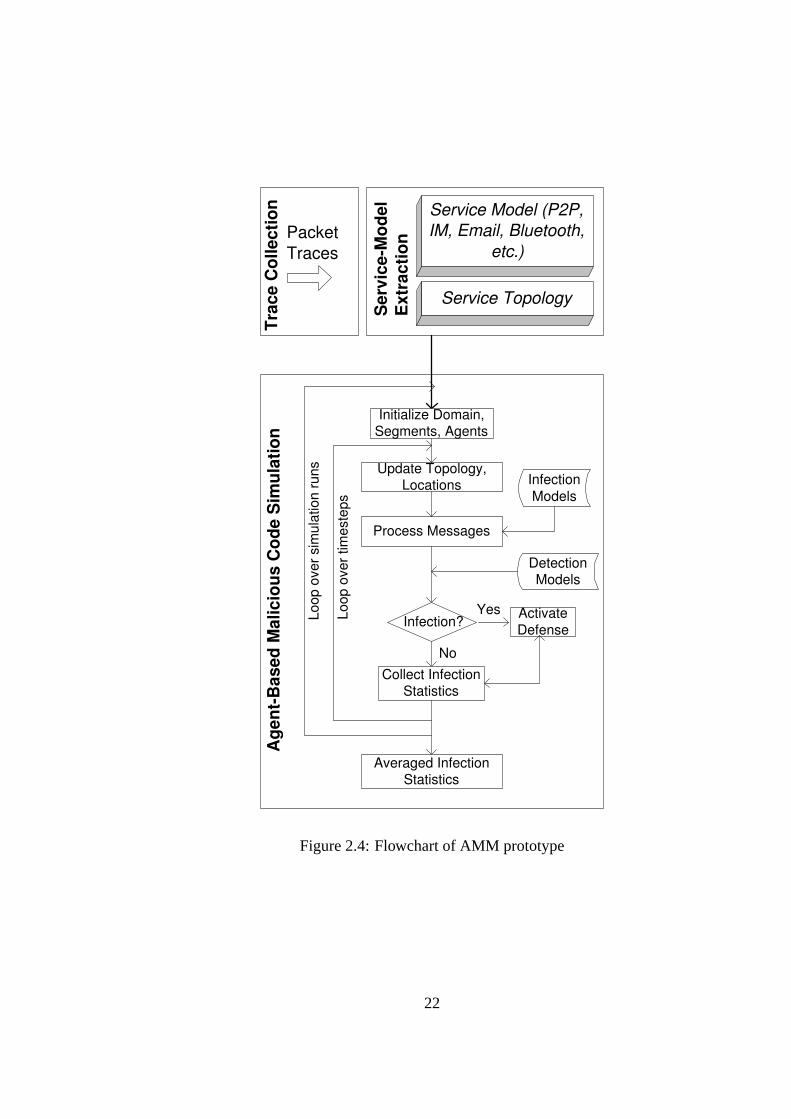
Figure 2.4 shows a flowchart of our prototype simulator. The first step is to prepare
the following input parameters for AMM: (i)infection-model parametersfor the target ser-
vices, (ii) topologyof service interactions among the hosts, (iii)locationof access points
and base stations, (iv)mobility modelsfor hosts that are mobile, (v)attack vectorof mal-
ware, (vi) detection modelof malware and (vii)an attack response model(containment,
rate-limiting, anti-virus, etc.), if any. At the beginning of a simulation run, agents are in-
stantiated with appropriate class-specific data structures. At each timestep, the coordinates
23
Domain
Segments
Segment Maps
Attack Target Vector
Simulation Input
Create Segments
Perform Timestep
Modify Segment Links
Infection
Collect Aggregate Stats
1
* Segment
Devices
Defense Agents
Physical Links
Logical Links
Mobility Model
State
Layout Devices
Layout Links
UpdateTopology
Infection
Sync Time Steps
Validate Links
Activate Defense Agents
Collect Segment Stats
ho
lds
Cellular
Se
gm
en
t-ty
pe
thread
ho
lds
1
*
BaseStation
Check Phys Link
Queue Msgs
Activate Defense
Service Queues
Defense Agent
Process Messages
Defense Actions
Infection
Service
Service Parameters
Service Neighbors
Message Queues
Infection Model
State
holds
1 *
Device
Services
Location
Logical Links
Physical Links
Mobility Model
Defense Agents
State
Perform Services
Defense Actions
Modify State
Query Connectivity
Modify Connectivity
Mobility Model
Channel Model
Logical Links
Physical Links
holds
1 1
holds
1 1
WLAN
Mobility Model
Channel Model
Logical Links
Physical Links
Move Devices
Move Devices
Wired
Logical Links
Physical Links
Access Point
Check Phys Link
Queue Msgs
Activate Defense
Service Queues
Defense Agent
Check Phys Link
Queue Msgs
Activate Defense
Figure 2.5: Agent attributes and functions
24
of mobile agents are updated based on their mobility models resulting in new connectivity
graphs. Next, each agent exchanges messages with other agents according to the service
model — the probability of any of these messages being infected is calculated from the
service-infection model. The time steps are repeated over a user-specified number of trials
so that the results can be averaged over these trials. The simulator is general enough to ex-
periment with different algorithms for malware detection and containment. The detection
algorithm can be implemented at various levels of hierarchy, e.g., at individual devices, ac-
cess points or networks segments, depending on the granularity of the detection algorithm.
Similarly, when an infection is detected, containment steps can be activated at various lev-
els.
The infection-model parameters and service topologies can be extracted from traces
collected from an enterprise network. The infection-model of a service consists of para-
meters that affect the propagation of a malware targeting a specific service. We describe
infection-model parameters for email, P2P, IM and Bluetooth in Section 2.4.2. The model
parameters are ideally fitted to data from a set of network traces collected from the tar-
get enterprise environment as shown in Figure 2.4. However, data from existing literature
are often sufficient for incorporating an infection model exploiting a given service. Exam-
ples of possible services that may be targeted by emerging malware are SMS/MMS, web
services and VoIP. Reliable infection models for these services are not yet available. How-
ever, using our simulator, various possible infection models can be studied — this is where
the trace-driven AMM can be very attractive and promising. The inclusion of a service-
infection model results in a more realistic epidemic spreading in AMM. An alternative is
to simply input the topology of a particular service like email, and consider all nodes in
the graph equally vulnerable to an email worm. The spread of the epidemic in this case
solely depends on a constant infection probability and the topology of the email network.
While most modeling literature on malware spreading that exploits services follows this
methodology, this simulates only the worst-case attack scenario and may not represent the
true spreading of the epidemic within an enterprise.
25
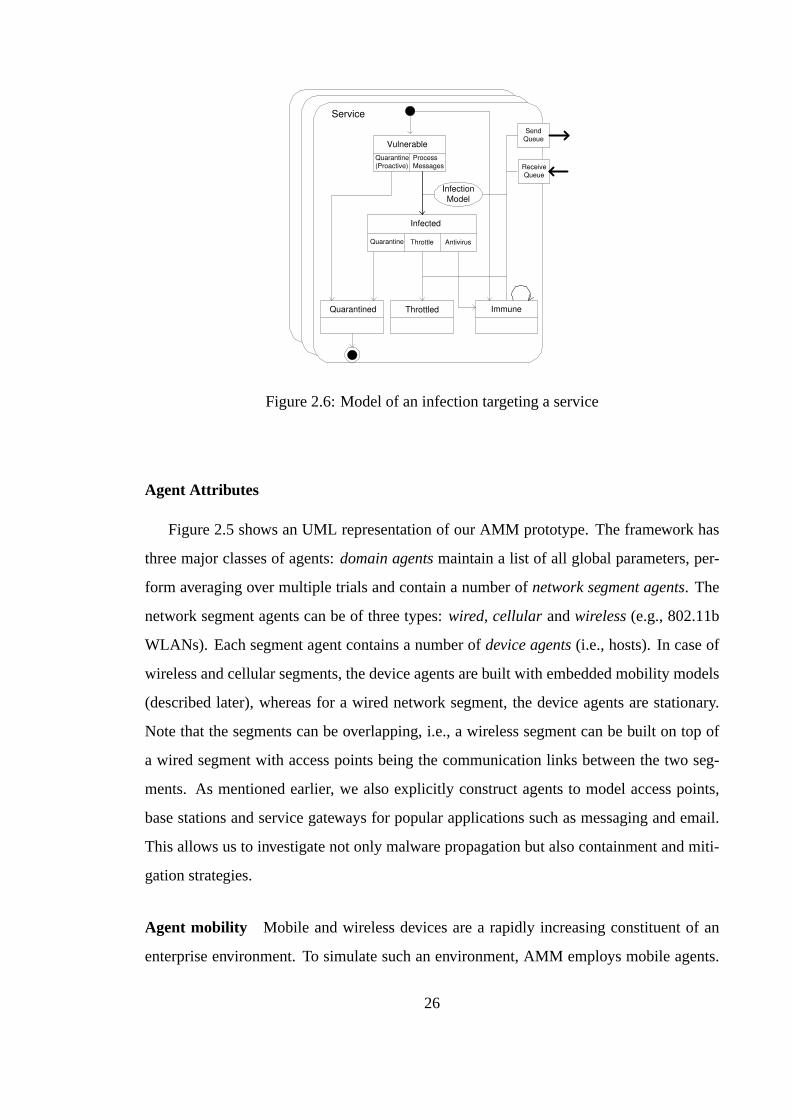
Service
Vulnerable
Process Messages
Infection
Model
Send Queue
Receive Queue
Quarantine (Proactive)
Infected
Quarantine
Immune
Antivirus
Quarantined Throttled
Throttle
Figure 2.6: Model of an infection targeting a service
Agent Attributes
Figure 2.5 shows an UML representation of our AMM prototype. The framework has
three major classes of agents:domain agentsmaintain a list of all global parameters, per-
form averaging over multiple trials and contain a number ofnetwork segment agents. The
network segment agents can be of three types:wired, cellularandwireless(e.g., 802.11b
WLANs). Each segment agent contains a number ofdevice agents(i.e., hosts). In case of
wireless and cellular segments, the device agents are built with embedded mobility models
(described later), whereas for a wired network segment, the device agents are stationary.
Note that the segments can be overlapping, i.e., a wireless segment can be built on top of
a wired segment with access points being the communication links between the two seg-
ments. As mentioned earlier, we also explicitly construct agents to model access points,
base stations and service gateways for popular applications such as messaging and email.
This allows us to investigate not only malware propagation but also containment and miti-
gation strategies.
Agent mobility Mobile and wireless devices are a rapidly increasing constituent of an
enterprise environment. To simulate such an environment, AMM employs mobile agents.
26
There are a variety of mobility models available to simulate different cellular and ad hoc
wireless environments. We refer to [28, 33] for a discussion of these models. We have
implemented two commonly-used models proposed for ad hoc wireless and cellular envi-
ronments, namely, Random Waypoint (RWP) and Gauss-Markov (GM) mobility models,
respectively.
In the RWP model, a node randomly chooses a destination in the simulation area and
moves at a speedv chosen randomly from the uniform distribution[vmin;vmax] along a
straight path towards the destination. Then, the node pauses for a constant timetpause
before it chooses a new destination randomly. A node in the RWP model is, therefore,
characterized by its current coordinates, current speed, current destination point and pause
time. Following [95], we avoid the initial high variability in average neighbor numbers by
discarding the results of the initial 1000 seconds of simulation time and then saving the
mobile positions as the initial starting locations of our simulation.
The GM mobility model uses a Markov process in updating both speed and direction
of a mobile node. Originally proposed for simulation of PCS networks [82], GM allows
adaptation to different levels of randomness via a tunable parameter. In GM, each node
updates its speed (st) and direction (dt) at timet based on their values at timet ¡1 as:
st = αst¡1 +(1¡ α)s+q
(1¡ α2)sxt¡1 (2.1)
dt = αdt¡1 +(1¡ α)d+q
(1¡ α2)dxt¡1 (2.2)
where0 • α • 1 is the tuning parameter,s andd are the mean value of speed and direc-
tion asn ! ∞, respectively.sxt¡1 anddxt¡1 are random variables drawn from a Gaussian
distribution.
Service-Infection Models
In AMM, a device agent can be set up to run a set of services. Following the worm
taxonomy model of Ellis [48], we denote the service availability as a mapping of services
to ports and write it as a set of tuplesf(s1; port1);(s1; port1); ¢ ¢ ¢ ;(sn; portn)g. Some of
these services constitute the set of exploits for a spreading malware. Figure 2.6 shows
the state machine of a generic service running on an agent. The set of states of a service
27
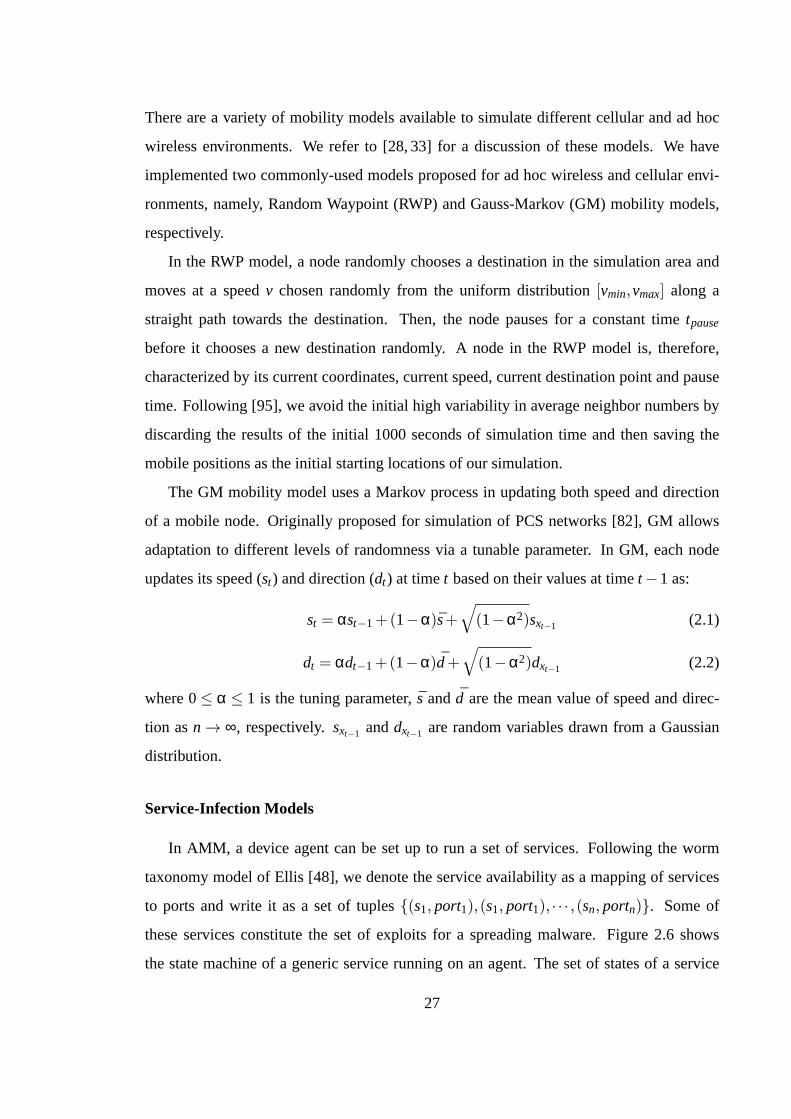
Infection
Model Model Parameters Source
SMS
Bluetooth
message sending rate, n s (N
cs )
message receiving rate, n r (N
cs )
cdf of user-to-user message size, B
SMS user topology, G(N cs
, E cs
) cdf of message service time, T
s sms
malicious agent messaging rate, m s (I
cs )
message reading probability, P r sms
T
T T
T T
M M
T: Trace, M: Emperical Model, E: Calibration Experiement
path loss component, standard deviation for fading model, threshold radius, r
0
transmit power, p t
threshold receive power, p r,th
E E
M E
E
IM message sending rate, n s (N)
file transfer rate per user, n f (N)
cdf of message service time, T s im
malicious agent messaging rate, m s (I
cs )
message reading probability, P r im
T T
T
M M
P2P file query rate, n q (N
p )
cdf of session duration, S cdf of peer uptime, T
up
file opening probability, P f p
T
T T
M
Email email checking time interval, T(~N( T , 2
T ))
email opening probability, P m
M
M
Figure 2.7: Service-infection models and their parameters
arefImmune, Vulnerable, Infected,fQuarantined, Throttledgg. fQuarantined, Throttledgrepresents fine-grained states denoting the defensive action taken when an infection is de-
tected. This allows one to simulate different defensive measures and compare their effec-
tiveness. For known attacks, an anti-virus patch can also be applied to a service, thereby
transitioning the state of the service fromInfectedto Immune. A device can attain any of
the three final statesfQuarantined, Throttled, Immuneg.
A device agent sends and receives messages from other agents corresponding to each
service tuple(s; port). The service class data structure achieves this via separate send and
receive message queues for each service. Each service also has an infection model of a
malware exploiting the specific vulnerability. The state transition fromVulnerableto In-
fectedis determined by this infection model. The infection model is service-specific and
consists of a set of parameters with their values given either as data ranges or probabil-
ity density functions. Figure 2.7 lists the service-infection model parameters for SMS,
Bluetooth, IM, P2P and Email, that we have implemented in AMM. The sources of these
28
parameters are traces collected from an enterprise (T), emperical models of user behav-
iors (M) and calibration experiments (E). When the state of any service isInfected, the
outgoing messages from an agent are tagged asInfectedbased on runtime values of these
parameters. Similarly, when an infected message is received from another host, the in-
fection model determines whether the service state should be changed fromVulnerableto
Infected. Next, we detail service-infection models for SMS, Bluetooth, IM, P2P and Email.
Bluetooth RF model: The connectivity of an ad hoc wireless network such as those formed
by Bluetooth and other short-range RF devices strongly influences the effectiveness of mal-
ware spreading via proximity scanning. To determine if two Bluetooth-enabled devices are
neighbors, one can simply use a threshold distance (r0). For example, in case of class-
2 Bluetooth devices,r0 = 10m. However, one should consider a more realistic wireless
channel model by considering shadowing effects that are induced by the presence of obsta-
cles. This means that the connectivity between two devices is now a stochastic parameter.
Following Bettstetter and Hartmann [28], we adopt a log-normal shadow fading model to
determine if an infected device can send a message to a nearby device using an existing vul-
nerability in the Bluetooth stack. In a shadow fading environment, the signal attenuation,
β(u;v) between a pair of nodesu andv is expressed as the sum of (i) a deterministic geo-
metric componentβ1 based on the relative distancer(u;v) and (ii) a stochastic component
β2 where
β1(u;v) = α:10:log10:(r(u;v)
1m)dB (2.3)
andβ2 is chosen from a log-normal probability density function:
fβ2(β2) =
1p2πσ
:exp(¡ β22
2σ2) (2.4)
whereα is the path-loss component (2 • α • 5) andσ is the standard deviation (j σ j•10dB). For a given transmit powerpt and a threshold receive powerpr;th, two devices
u andv are neighbors if the attenuation between them satisfies:β(u;v) • βth where the
threshold attenuationβth is given by:
βth = 10:log10:(pt
pr;th)dB (2.5)
29
Eqs. (2.3) and (2.5) along with the mobility models give us a propagation model of a mal-
ware that exploits Bluetooth vulnerability and spreads to different areas of an enterprise as
the users move about the physical space.
IM model: We refer to [85] for a dicussion of IM worms, client vulnerabilities and pro-
posed defensive measures. The epidemic modeling of IM worms available to date does not
consider realistic network topologies and IM user behavior. Further, user-behavior data for
major IM networks such as MSN, YIM and AIM are not readily available. Our model for
IM worm propagation consists of: message sending rate (ns(N)), file transfer rate (nf (N)),
message service time (T ims ), malicious agent messaging rate (ms(Ics)) and message (i.e.,
attachment or link) opening probability (Pimr ), whereN andIcs represent the total number
of IM users and the set of infected IM users, respectively. Of these,ns(N), nf (N) andT ims
can be derived from IM server logs within an enterprise.
P2P model:The authors of [154] present an epidemic simulator that takes as input Gnutella
topology graphs and the probability of a node being a guardian node. They denote a
guardian node as a member of the P2P network that can detect a worm and forward alerts to
its neighbors. Although they consider the effect of node diversity by having a fraction of the
nodes as initially immune to the attack, they did not consider the peer-level diversity. The
propagation of a file-sharing worm is influenced by such factors as peer uptime (Tupi ), peer
query activity (Qi), and session duration (Si). If peers tend to be unavailable frequently, a
file-sharing worm will not spread quickly. This is because the degree of replication nec-
essary to ensure that the file content is consistently accessible is low for peers with small
up-times. Similarly, peer activity levels and how peers issue and respond to queries, influ-
ence the probability of an infected file to be downloaded. We adopt the distribution func-
tions for peer up-time, query activity and session duration described in [108, 110] based on
experimental observations of common P2P networks. Similar to mass-mailing worms, a
downloaded file must be opened by the user for the file-sharing worm code to be activated.
Therefore, we add a file opening probability (Pfi ) for each peer.
30
Email model: We adopt the model developed by Zouet al. [158] based on human be-
haviors affecting email worms. Their model is based on two key parameters: an email
checking time interval (Ti) which is the time interval between checking two consecutive
emails at hosti, and an opening probability (Pmi ) which is the probability of a user on
hosti opening an email with a worm-infected payload or attachment. As in [158], we as-
sume that the mean ofTi andPi are generated from Gaussian-distributed random variables
T(» N(µT ;σ2T)) andP(» N(µP;σ2
P)), respectively. The parameters used forT andP are:
µT = 40;σT = 20;µP = 0:5;σP = 0:3.
Although there have been recent studies on the modeling of malware propagation using
IM, P2P and Email, our work has important differences from these studies. The usage of
real-life traces to construct the service-infection models creates realistic enterprise environ-
ments. In our framework, services can be composed for any given host in the network, and
therefore, hybrid worms using IM and P2P (e.g., Bropia) can be easily simulated. These
simulations generate realistic traffic corresponding to IM and P2P messages in topologies
that are constructed directly from the enterprise traces. As an example of hybrid worms,
we will later study a Mabir-like virus that spreads via both Bluetooth and SMS messages
among the subscribers of a cellular network.
2.5 Simulation of Attack Scenarios
In this section, we investigate two likely attack scenarios using the AMM framework.
First, we study the potential spread of a Bluetooth-based virus such as Cabir in a multi-cell
cellular network. Next, we investigate the spreading rate of a hybrid topological worm that
can spread via both Email and P2P file-sharing networks.
2.5.1 Proximity Scanning via Bluetooth
This attack scenario considers mobile subscribers of a cellular data and voice provider.
We assume that a fraction of the subscribers have unprotected Class-2 Bluetooth-enabled
31
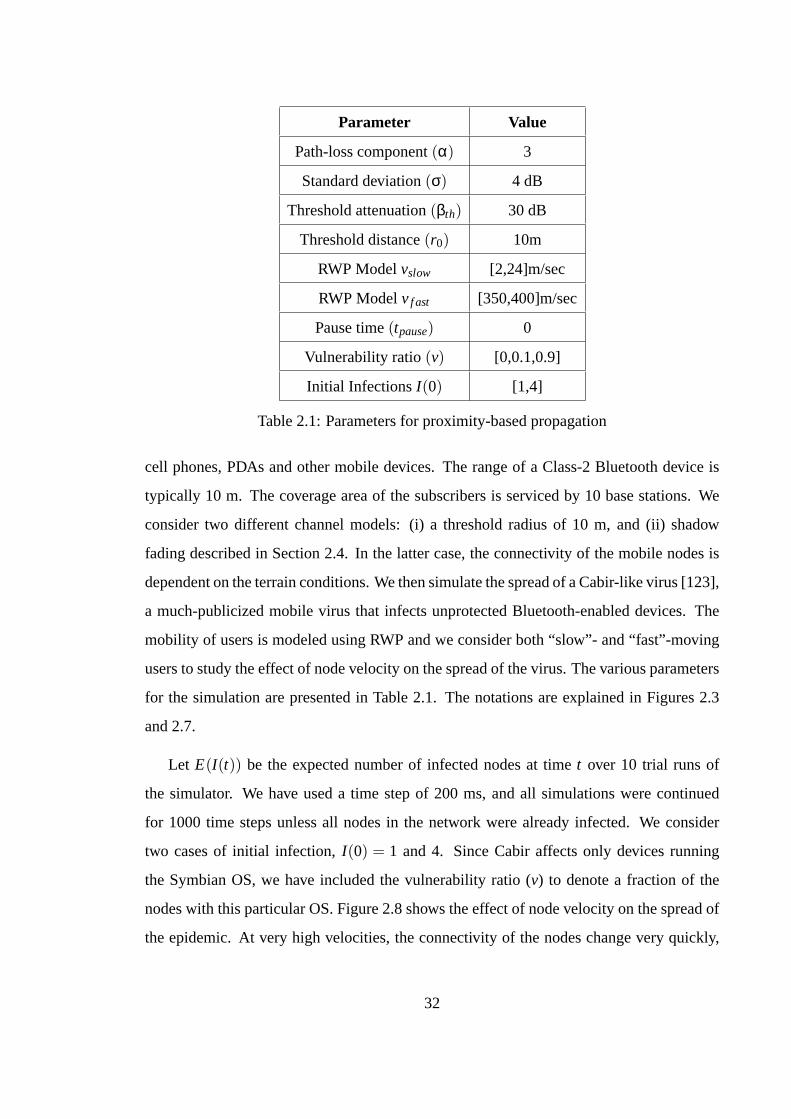
Parameter Value
Path-loss component(α) 3
Standard deviation(σ) 4 dB
Threshold attenuation(βth) 30 dB
Threshold distance(r0) 10m
RWP Modelvslow [2,24]m/sec
RWP Modelvf ast [350,400]m/sec
Pause time(tpause) 0
Vulnerability ratio(v) [0,0.1,0.9]
Initial InfectionsI(0) [1,4]
Table 2.1: Parameters for proximity-based propagation
cell phones, PDAs and other mobile devices. The range of a Class-2 Bluetooth device is
typically 10 m. The coverage area of the subscribers is serviced by 10 base stations. We
consider two different channel models: (i) a threshold radius of 10 m, and (ii) shadow
fading described in Section 2.4. In the latter case, the connectivity of the mobile nodes is
dependent on the terrain conditions. We then simulate the spread of a Cabir-like virus [123],
a much-publicized mobile virus that infects unprotected Bluetooth-enabled devices. The
mobility of users is modeled using RWP and we consider both “slow”- and “fast”-moving
users to study the effect of node velocity on the spread of the virus. The various parameters
for the simulation are presented in Table 2.1. The notations are explained in Figures 2.3
and 2.7.
Let E(I(t)) be the expected number of infected nodes at timet over 10 trial runs of
the simulator. We have used a time step of200 ms, and all simulations were continued
for 1000time steps unless all nodes in the network were already infected. We consider
two cases of initial infection,I(0) = 1 and4. Since Cabir affects only devices running
the Symbian OS, we have included the vulnerability ratio (v) to denote a fraction of the
nodes with this particular OS. Figure 2.8 shows the effect of node velocity on the spread of
the epidemic. At very high velocities, the connectivity of the nodes change very quickly,
32
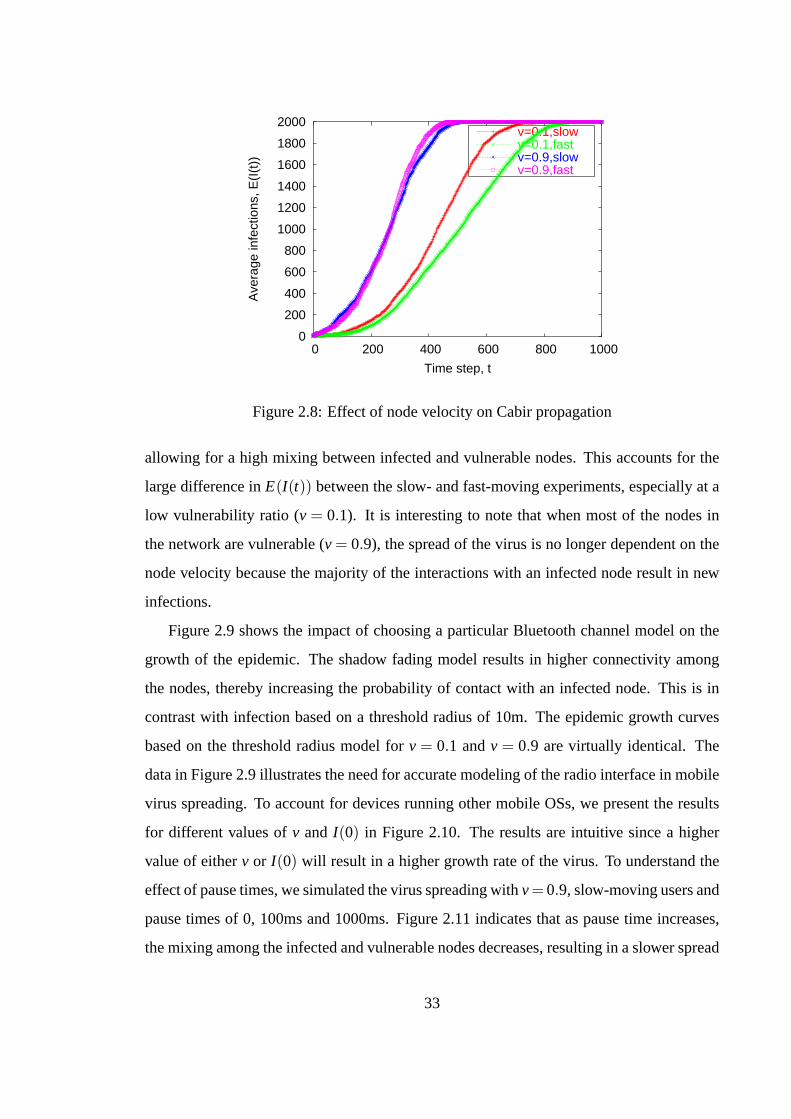
0
200
400
600
800
1000
1200
1400
1600
1800
2000
0 200 400 600 800 1000
Ave
rage
infe
ctio
ns, E
(I(t
))
Time step, t
v=0.1,slowv=0.1,fastv=0.9,slowv=0.9,fast
Figure 2.8: Effect of node velocity on Cabir propagation
allowing for a high mixing between infected and vulnerable nodes. This accounts for the
large difference inE(I(t)) between the slow- and fast-moving experiments, especially at a
low vulnerability ratio (v = 0:1). It is interesting to note that when most of the nodes in
the network are vulnerable (v = 0:9), the spread of the virus is no longer dependent on the
node velocity because the majority of the interactions with an infected node result in new
infections.
Figure 2.9 shows the impact of choosing a particular Bluetooth channel model on the
growth of the epidemic. The shadow fading model results in higher connectivity among
the nodes, thereby increasing the probability of contact with an infected node. This is in
contrast with infection based on a threshold radius of 10m. The epidemic growth curves
based on the threshold radius model forv = 0:1 andv = 0:9 are virtually identical. The
data in Figure 2.9 illustrates the need for accurate modeling of the radio interface in mobile
virus spreading. To account for devices running other mobile OSs, we present the results
for different values ofv and I(0) in Figure 2.10. The results are intuitive since a higher
value of eitherv or I(0) will result in a higher growth rate of the virus. To understand the
effect of pause times, we simulated the virus spreading withv= 0:9, slow-moving users and
pause times of 0, 100ms and 1000ms. Figure 2.11 indicates that as pause time increases,
the mixing among the infected and vulnerable nodes decreases, resulting in a slower spread
33
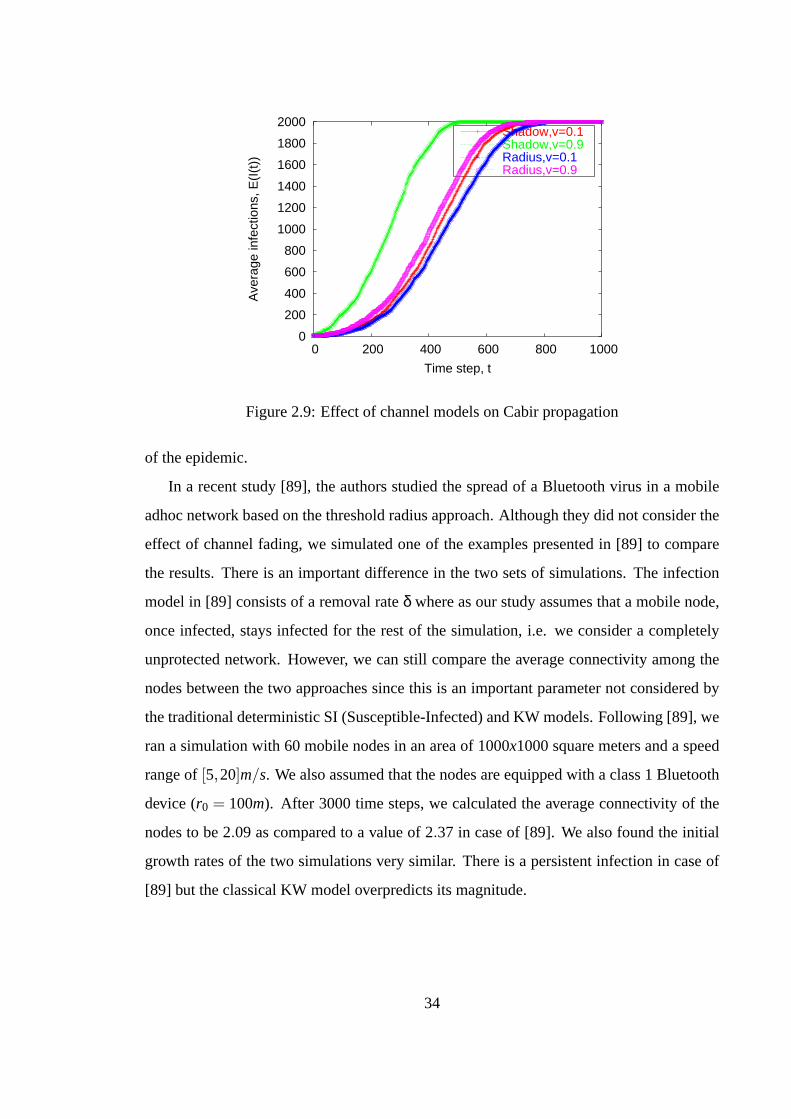
0
200
400
600
800
1000
1200
1400
1600
1800
2000
0 200 400 600 800 1000
Ave
rage
infe
ctio
ns, E
(I(t
))
Time step, t
Shadow,v=0.1Shadow,v=0.9Radius,v=0.1Radius,v=0.9
Figure 2.9: Effect of channel models on Cabir propagation
of the epidemic.
In a recent study [89], the authors studied the spread of a Bluetooth virus in a mobile
adhoc network based on the threshold radius approach. Although they did not consider the
effect of channel fading, we simulated one of the examples presented in [89] to compare
the results. There is an important difference in the two sets of simulations. The infection
model in [89] consists of a removal rateδ where as our study assumes that a mobile node,
once infected, stays infected for the rest of the simulation, i.e. we consider a completely
unprotected network. However, we can still compare the average connectivity among the
nodes between the two approaches since this is an important parameter not considered by
the traditional deterministic SI (Susceptible-Infected) and KW models. Following [89], we
ran a simulation with60 mobile nodes in an area of1000x1000square meters and a speed
range of[5;20]m=s. We also assumed that the nodes are equipped with a class 1 Bluetooth
device (r0 = 100m). After 3000time steps, we calculated the average connectivity of the
nodes to be2:09 as compared to a value of2:37 in case of [89]. We also found the initial
growth rates of the two simulations very similar. There is a persistent infection in case of
[89] but the classical KW model overpredicts its magnitude.
34
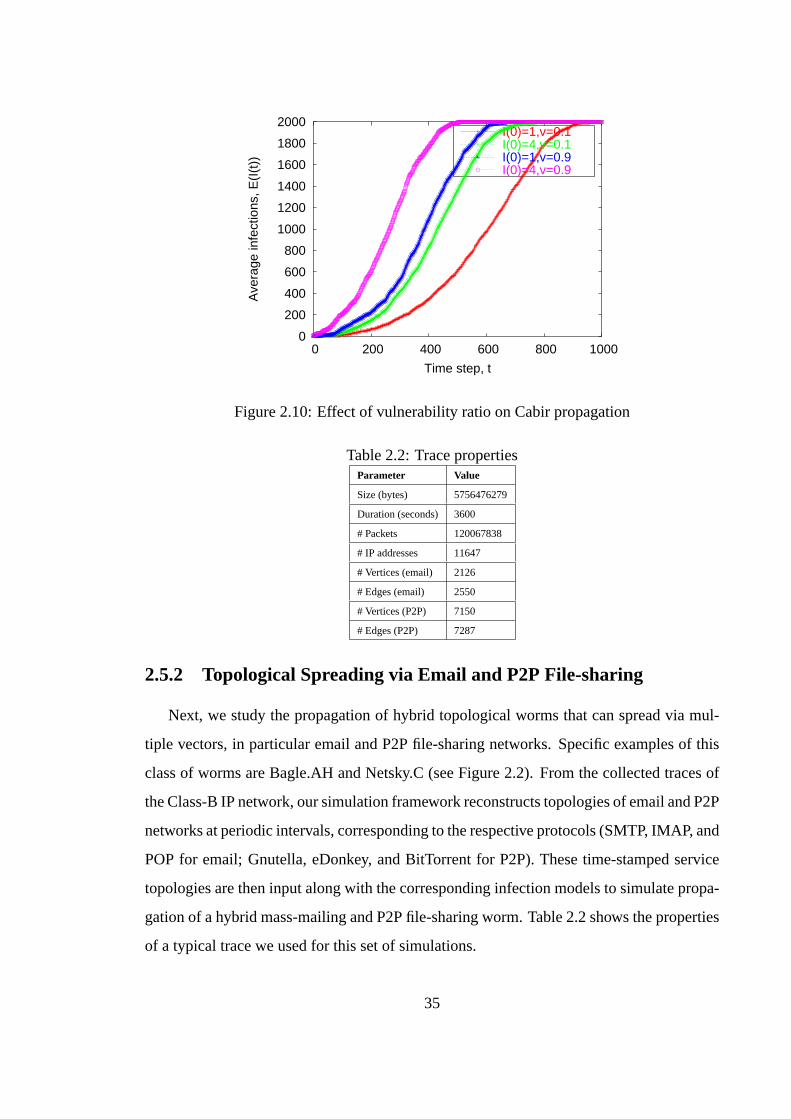
0
200
400
600
800
1000
1200
1400
1600
1800
2000
0 200 400 600 800 1000
Ave
rage
infe
ctio
ns, E
(I(t
))
Time step, t
I(0)=1,v=0.1I(0)=4,v=0.1I(0)=1,v=0.9I(0)=4,v=0.9
Figure 2.10: Effect of vulnerability ratio on Cabir propagation
Table 2.2: Trace propertiesParameter Value
Size (bytes) 5756476279
Duration (seconds) 3600
# Packets 120067838
# IP addresses 11647
# Vertices (email) 2126
# Edges (email) 2550
# Vertices (P2P) 7150
# Edges (P2P) 7287
2.5.2 Topological Spreading via Email and P2P File-sharing
Next, we study the propagation of hybrid topological worms that can spread via mul-
tiple vectors, in particular email and P2P file-sharing networks. Specific examples of this
class of worms are Bagle.AH and Netsky.C (see Figure 2.2). From the collected traces of
the Class-B IP network, our simulation framework reconstructs topologies of email and P2P
networks at periodic intervals, corresponding to the respective protocols (SMTP, IMAP, and
POP for email; Gnutella, eDonkey, and BitTorrent for P2P). These time-stamped service
topologies are then input along with the corresponding infection models to simulate propa-
gation of a hybrid mass-mailing and P2P file-sharing worm. Table 2.2 shows the properties
of a typical trace we used for this set of simulations.
35
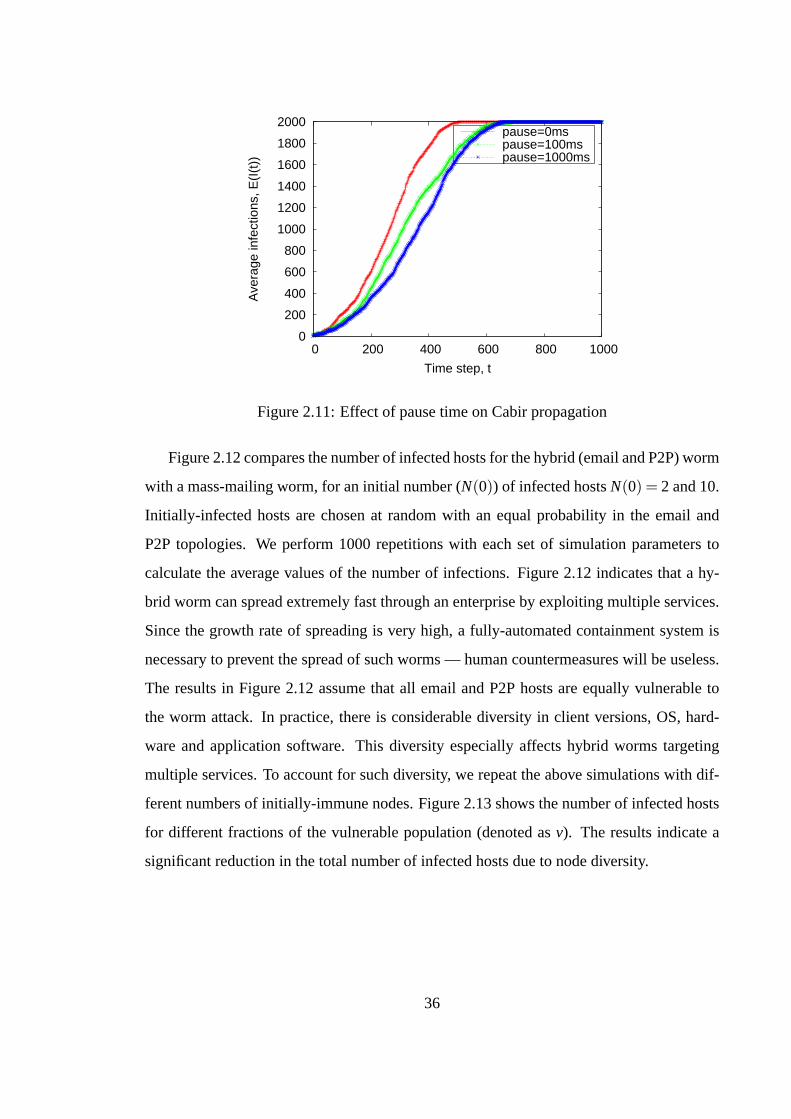
0
200
400
600
800
1000
1200
1400
1600
1800
2000
0 200 400 600 800 1000
Ave
rage
infe
ctio
ns, E
(I(t
))
Time step, t
pause=0mspause=100mspause=1000ms
Figure 2.11: Effect of pause time on Cabir propagation
Figure 2.12 compares the number of infected hosts for the hybrid (email and P2P) worm
with a mass-mailing worm, for an initial number (N(0)) of infected hostsN(0) = 2 and10.
Initially-infected hosts are chosen at random with an equal probability in the email and
P2P topologies. We perform 1000 repetitions with each set of simulation parameters to
calculate the average values of the number of infections. Figure 2.12 indicates that a hy-
brid worm can spread extremely fast through an enterprise by exploiting multiple services.
Since the growth rate of spreading is very high, a fully-automated containment system is
necessary to prevent the spread of such worms — human countermeasures will be useless.
The results in Figure 2.12 assume that all email and P2P hosts are equally vulnerable to
the worm attack. In practice, there is considerable diversity in client versions, OS, hard-
ware and application software. This diversity especially affects hybrid worms targeting
multiple services. To account for such diversity, we repeat the above simulations with dif-
ferent numbers of initially-immune nodes. Figure 2.13 shows the number of infected hosts
for different fractions of the vulnerable population (denoted asv). The results indicate a
significant reduction in the total number of infected hosts due to node diversity.
36
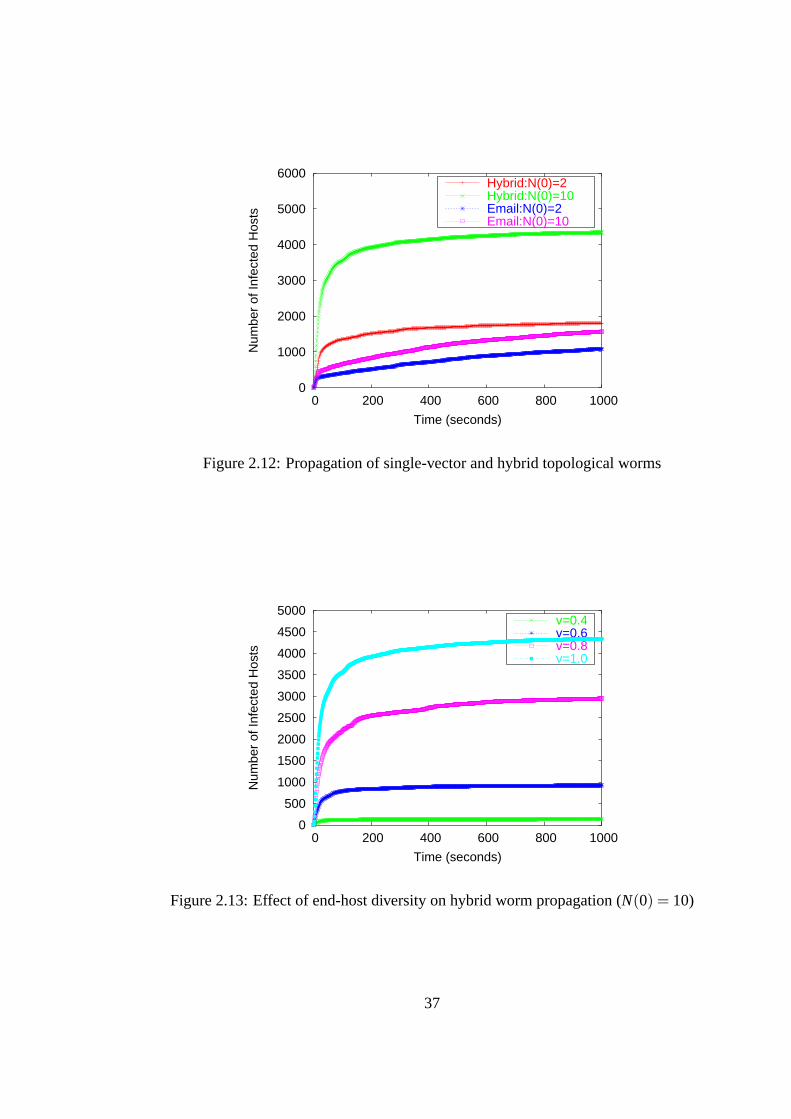
0
1000
2000
3000
4000
5000
6000
0 200 400 600 800 1000
Num
ber
of In
fect
ed H
osts
Time (seconds)
Hybrid:N(0)=2Hybrid:N(0)=10Email:N(0)=2Email:N(0)=10
Figure 2.12: Propagation of single-vector and hybrid topological worms
0
500
1000
1500
2000
2500
3000
3500
4000
4500
5000
0 200 400 600 800 1000
Num
ber
of In
fect
ed H
osts
Time (seconds)
v=0.4v=0.6v=0.8v=1.0
Figure 2.13: Effect of end-host diversity on hybrid worm propagation (N(0) = 10)
37
2.6 Related Work
The most relevant literature are malware simulators such as [83, 103, 137]. However,
these simulators assume a simplified model of Internet connectivity and employ a mathe-
matical model for the worm traffic. They do not consider anintegratedenterprise network
that may contain wired, wireless and cellular segments. As a result, any change in topol-
ogy due to user mobility is not reflected in the simulations, thus limiting these simulators
to consider traditional worms and viruses that affect only wired hosts. To simulate epi-
demics in very large networks with millions of hosts (i.e., Internet-scale epidemics such
as Code Red and Melissa), several researchers have developed distributed worm simula-
tors. For example, the authors of [145] presented PAWS, a distributed simulator running
on the Emulab testbed. The authors derived inter-AS (Autonomous Systems) bandwidth
data from existing literature to simulate the major Internet ASes, and developed congestion
models from worm traffic. They simulated scanning worms (Code Red v2 and Slammer)
and showed excellent agreement with the experimental data from the real world. While
very powerful for studying Internet-scale epidemics, PAWS may not be suitable for study-
ing the heterogeneous environment of an enterprise network as well as topological worms.
A number of simulators have attempted to recreate the AS topology of the Internet. Our
approach is to generate topologies specific to the vulnerable services directly from the en-
terprise traces. Note that this is not possible for Internet-scale simulators. However, for
enterprise-level modeling and vulnerability assessment, trace-based simulations provide a
detailed and more realistic method. Another excellent distributed simulation framework for
the Internet is presented in [103]. The authors used GTNetS and PDNS (a parallel version
of NS-2) simulators to generate packet-level traces of worm traffic. Due to the large compu-
tational overhead, these simulators are typically run on powerful clusters (often deploying
100 CPUs or more).
There are many epidemiological models of worm spread reported in the literature. The
deterministic models use simplified assumptions of homogeneous topologies and aggre-
gated behavior. We have mentioned the relevant literature in Sections 2.3 and 2.4. The
bulk of our simulation studies involve topological worms and mobile viruses. Section 2.4.2
38
refers to the existing literature for models of worms that spread via email, P2P and IM
networks.
2.7 Concluding Remarks
The traditional epidemic models of malicious agent propagation do not capture several
unique properties of a mobile enterprise network. Service interactions among the nodes
at different time-scales create different vulnerable service topologies, rather than an aver-
age degree of connectivity among the nodes, as assumed by many epidemiological models.
Mobile users with laptops, PDAs and cell phones not only contribute to these time-varying
service topologies, but also introduce new vulnerabilities as well, e.g., Mabir-type viruses
that can spread via SMS/MMS messages and Bluetooth connections. Further, today’s en-
terprise networks consist of diverse network segments with different levels of bandwidth,
services and latencies. All of these factors affect the growth rate of an epidemic. Our
agent-based modeling framework captures these factors by using traffic traces collected
from enterprise networks. Using this framework, an enterprise can perform a realistic vul-
nerability assessment of its popular services, such as SMS, Bluetooth, email, P2P and IM.
These services are often targeted by virus writers and increasingly, new malware are de-
signed to exploit multiple of these services simultaneously. Our extensive simulations show
that combining these services increases the initial growth rate of the epidemic almost expo-
nentially and therefore, human countermeasures will be useless. The simulation study of
Cabir also points out the potential vulnerability from unprotected Bluetooth interfaces in a
cellular network.
39
CHAPTER 3
Proactive Defense in Enterprise Networks
3.1 Introduction
In recent years, the landscape of malicious software attacks has changed considerably
from large-scale network perimeter attacks to more targeted attacks on enterprise clients
and resources. While the primary damage from traditional worms and viruses such as
Code Red, Nimda and Slammer has been clogged networks and required expensive clean-
up operations, the new generation of malware are designed to steal confidential information,
control remote systems for malicious purposes, and disrupt mission-critical services. Their
intended purpose is to distribute spam, install spyware on enterprise systems customized to
collect information (e.g., keystroke loggers), and install backdoors or trojans. Examples of
such malware are bot networks (“botnets”) [88], viruses and worms [85, 123, 158] targeting
various enterprise messaging systems such as email, IM and SMS.
The exponential growth of messaging in both home and enterprise environments has
made it a potent vector for the spread of malicious code [125]. Social engineering tech-
niques are very effective in spreading malware in these networks since infected messages
appear to come from addresses in personal contact lists, address and phone books. The
problem is compounded further by the increasing convergence of various messaging plat-
forms. For example, users can now send IM messages from mobile phones, and SMS mes-
sages to mobile phones via SMS gateways on the Internet. Given the extremely large vol-
40
ume of messages in public IM and SMS networks,1 the potential for damage from rapidly
propagating malicious software is very high in messaging networks. This has not escaped
the attention of malicious code writers. According to [125], self-propagating worms repre-
sented 91% of malicious code in large public IM networks in the second half of 2005 — a
number that has been steadily rising. Similarly, there are now a growing number of mali-
cious codes written for mobile handsets that exploit SMS/MMS to proliferate, as we will
present in Chapter 4. It is clear that if a response can be taken in the early stages of an epi-
demic in these networks, the spread can be limited to a small number of clients. Therefore,
developingproactive securityframeworks in mobile messaging networks is an important
area of research. However, most mobile network operators and messaging providers have
not implemented proactive security for the following reasons.
A key aspect of proactive security is to take stepsbeforea client is compromised or
at the earliest indication of a virus or worm activity in the network. Therefore, finding
vulnerable clients to a given malicious software is a key first step to any proactive security
strategy. Note that this step must be entirely automated or the window of opportunity will
be lost. Given the large number and distributed nature of messaging networks, it is not
possible to place monitors everywhere in such networks. However, the messaging server
— the Short Messaging Service Center (SMSC) in case of SMS/MMS messages, and the
IM server — provides a natural way to identify such clients as we explain later.
It may be argued that the time window between detection and proactive containment
can be very small and no proactive action can stop a fast-spreading malicious code. For
example, it is theoretically possible to have “Flash Worms” [116, 118] that can infect most
of the vulnerable hosts of an enterprise within seconds. While such attacks are possible,
there has been a noticeable decrease in malicious agents that spread very fast via random
scanning and simply clog corporate networks. However, there has been a steady increase
in stealthy Trojans, and malicious agents that install adware and spam relays, exploit en-
terprise applications such as database servers, and host malicious websites. For example,
Win32.Opanki.d [135] arrives as a link via the AOL IM network and when executed, it
1More than 1000 billion SMS messages were sent in 2005, and according to [125], the three largest IMproviders—AOL, MSN, and Yahoo!—each accounted for over 1 billion IM messages sent per day.
41
opens a backdoor via an IRC channel. For these emerging threats, discoveringgroup as-
sociationswith an already-infected or suspected client in near real-time will lead to better
proactive containment and it is an important focus of our work.
Finally, any proactive response must address the potential loss of service and delays
in the messaging network due to preemptive shutdown or policing of clients. Since it is
common for anomaly detection systems to generate many false positives, a straightforward
quarantine of clients based on alerts may result in unacceptable levels of message loss and
delay. Therefore, one must design proactive strategies that increase the level of counter-
measure with increasing alert correlation.
Most of the published studies on modeling and containment of malicious software have
focused on scanning- and email-worms due to their prevalence and several successful large-
scale attacks on the Internet. On the contrary, there appears to be very little published
work on proactive security of messaging networks. This is the primary motivation of our
work. In the present study, we would like to achieve three primary goals: (i) automated
compilation of the list of messaging clients that are vulnerable to a spreading virus or worm
attack, (ii) development of a group-behavior based proactive response framework using
client interactions in a messaging network, and (iii) compare the effectiveness of proactive
response with traditional reactive mechanisms (e.g. anti-virus tools). The starting point
of our study are observed interactions among clients comprising the “service-behavior”
topology of the messaging network. The containment itself is implemented in the form
of client rate-limiting [148] (also known as “throttling”) andclient quarantine. However,
instead of a straightforward application of these mechanisms, we build a behavioral alert-
based system that progressively mounts a stronger response with increasing alerts, and
backs off when alert levels decrease with time.
The framework is implemented typically at the messaging service center (i.e., SMSC
in case of SMS/MMS and IM servers) where logs of client communication are available.
These logs can be analyzed to generate a service-behavior graph for the messaging net-
work. It is then further processed to generate behavior clusters, i.e., groups of clients whose
behavior patterns are similar with respect to a set of metrics:interaction frequency, attach-
ment and message size distributions, number of messages, number of outgoing connections
42
to other clientsand list of traced contacts. When the number of alerts in a particular be-
havior cluster reaches a threshold, the messages belonging to that behavior cluster are first
rate-limited to slow down a potential malicious worm or virus. The effect of repeated
similar alerts and false positives is kept below a threshold during this initial containment
step. When the alerts reach a second threshold, the containment algorithm applies proactive
quarantine, i.e., it blocks messages from suspicious clients of these behavior clusters. This
step essentially enables the behavior clusters to enter into a group defense mode against
the spreading malware. This combined approach of rate-limiting and quarantine with in-
creasing response to alerts in the network provides a graceful service degradation, yet a
very powerful defense as our evaluation will show. From our discussion with several large
enterprise IT departments, such a gradual approach is more desirable than either shutting
down messaging completely, or chasing down the malicious software as it spreads from
one client to another.
This study makes three primary contributions. First, it presents a method for automated
identification of vulnerable clients in a messaging network. Second, it provides a practical
solution for improving security in these networks based on an adaptive group-behavior-
based proactive approach. Third, it demonstrates that proactive security can offer an order-
of-magnitude improvement in containing malicious software in messaging networks, over
existing “detect-and-block” approaches.
The rest of this Chapter is organized as follows. Section 3.2 presents motivations behind
the behavior-clustering approach. Section 3.3 describes how behavior clustering can find
vulnerable clients for proactive response. Section 3.4 describes the proactive rate-limiting
and quarantine algorithms, and their group-behavior-based implementation. Section 3.5
evaluates proactive security in a messaging network using data from a large real-life SMS
customer network. Section 3.6 reviews recent literature on malware targeting messaging
networks, and malware containment. We describe future work and concluding remarks in
Section 3.7.
43
3.2 Motivation: Finding Vulnerable Clients
The most common form of proactive defense isgetting there first, for example, to patch
a client to protect against an existing vulnerability, or to remove capabilities from the client,
making it more secure. However, a central problem of proactive defense is to decide which
clients are the most vulnerable when a malicious activity is identified in the network, be
it an intrusion, a virus or worm. This is fundamentally different from reactive or “detect-
and-block” defense which is activated only when a client is in the process of being com-
promised. Generating a list of vulnerable clients on-demand in near real time is, therefore,
a fundamental problem to study in proactive defense. The more accurate the list of vul-
nerable clients, the faster the attack can be suppressed with less interruption to the users.
Our motivation in studying group-behavior of clients is to generate this list by analyzing
Charging Data Records (CDRs) [22] and message headers that are logged at the centralized
store-and-forward messaging servers.
Before discussing our approach, we first need a brief discussion of the SMS messaging
system. When a mobile user sends a message from a handset (i.e., Mobile Originated or
MO) or a web-based gateway to another phone, the message is received by the Base Station
System (BSS) of the service provider. The BSS then forwards the message to the Mobile
Switching Center (MSC). Upon receiving a MO message, the MSC sends the end-user
information to the Visitor Location Register (VLR) of the cell and checks the message for
any violation. It then forwards the message to the provider’s SMSC. The SMSC stores
the messages in a queue, records the transaction in the network billing system and sends a
confirmation back to the MSC. The status of the message is changed from MO to Mobile
Terminated (MT) at this point. Through a series of steps, the message is then forwarded
by SMSC to the receiving user’s MSC. The MSC receives the subscriber information from
the VLR and finally forwards the message to the receiving handset. The store-and-forward
nature of SMS/MMS networks makes it possible to collect client interaction patterns from
the time-stamped logs. A similar observation can be made for IM servers as well, although
the procedure to store and forward messages is much simpler. Most IM messages between
users are mediated by the IM server. In some networks, file-transfer request and response
44
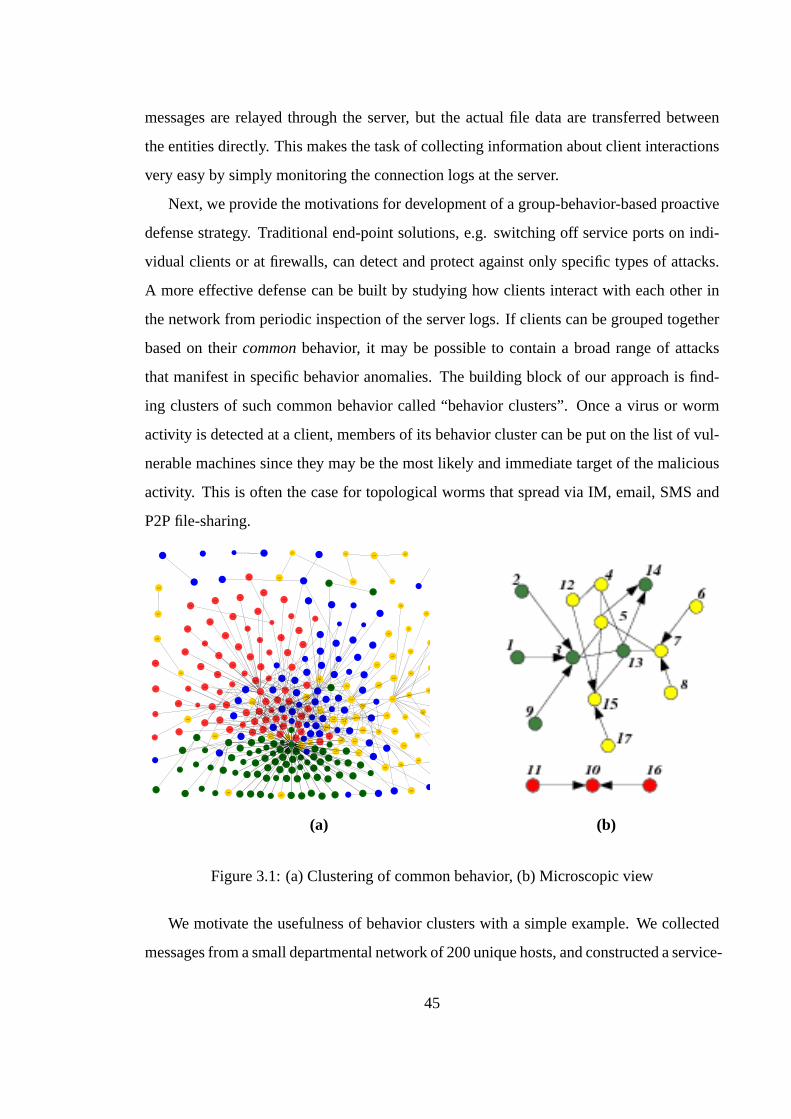
messages are relayed through the server, but the actual file data are transferred between
the entities directly. This makes the task of collecting information about client interactions
very easy by simply monitoring the connection logs at the server.
Next, we provide the motivations for development of a group-behavior-based proactive
defense strategy. Traditional end-point solutions, e.g. switching off service ports on indi-
vidual clients or at firewalls, can detect and protect against only specific types of attacks.
A more effective defense can be built by studying how clients interact with each other in
the network from periodic inspection of the server logs. If clients can be grouped together
based on theircommonbehavior, it may be possible to contain a broad range of attacks
that manifest in specific behavior anomalies. The building block of our approach is find-
ing clusters of such common behavior called “behavior clusters”. Once a virus or worm
activity is detected at a client, members of its behavior cluster can be put on the list of vul-
nerable machines since they may be the most likely and immediate target of the malicious
activity. This is often the case for topological worms that spread via IM, email, SMS and
P2P file-sharing.
n1
n240
n245
n269
n241
n3
n242
n281
n4 n243
n7
n8 n244
n257
n265
n9n10
n154
n251
n12
n14
n19
n31
n36
n41
n44
n45
n48n51
n56
n58
n59
n60
n63
n64
n65
n70
n71
n74
n77
n79
n83
n84
n85
n91
n96
n97n98
n103
n104
n105
n106
n109
n111
n118
n125
n127
n128 n129
n131
n132
n133
n134
n135n136
n138n139
n140
n142
n144
n145n148
n149
n153
n156
n159
n163
n164
n166
n171
n172
n173
n174
n175
n177
n179
n180
n182
n190
n191
n194
n197
n202
n203
n204
n206
n210
n212
n213
n215
n216
n217
n218
n220
n221n222
n223 n224
n225
n226
n228
n230
n231
n232
n233
n235
n239
n303
n13n270
n272
n15
n17
n18
n178
n261
n264
n273
n274
n287
n20
n21
n22
n27
n24
n26
n28
n30
n32n247
n285
n293
n34
n249
n277
n35
n250
n37
n252
n282
n38
n49
n253
n39
n254
n40
n256
n263
n42
n258
n43
n259
n260
n278
n284
n290
n46
n262
n267
n268
n289
n50
n52
n266
n53
n54
n271
n55
n57
n275
n276
n279
n280
n61n62
n66
n295
n67
n68
n283
n286
n69
n72
n73
n75
n76
n288
n80
n81
n82
n170
n86
n87
n88
n89
n90
n291
n92
n93
n94
n95
n292
n99
n100
n101
n294
n102
n107
n108
n110
n112
n113
n114
n115
n116
n117
n120
n121
n297
n122
n124
n126
n130
n301
n299
n137n141
n143
n146
n147
n150
n151
n152
n155 n157
n158
n160
n300
n161
n162
n165
n167
n168
n169
n176
n181
n183
n184
n302
n185
n186
n187
n188
n189
n192
n193
n195
n196
n198
n199
n200
n201
n205
n207
n208
n209
n211
n214
n219
n227
n229
n234
n236
n237
(a) (b)
Figure 3.1: (a) Clustering of common behavior, (b) Microscopic view
We motivate the usefulness of behavior clusters with a simple example. We collected
messages from a small departmental network of 200 unique hosts, and constructed a service-
45
behavior topology based on open client and server port bindings among the hosts (Fig-
ure 3.1(a)). Figure 3.1(b) shows the service-behavior graph for a small subset of nodes at
a given time—the actual number of nodes (504, including nodes external to the network)
and edges (230) are too large to display in both figures. We show a 4-color (blue, green,
red and yellow) clustering of this subset of nodes. The arrows in Figure 3.1(b) indicate
the directionality of messages as inferred from the traces. The nodes without any arrows
denote bidirectional messages. To generate the clusters, we considered a simple metric of
number of neighbors, and minimized the overlap among the four clusters. Note that nodes
10, 11 and 16 form a disjoint group from the rest of the nodes and have no interactions with
the rest of the network, other than their internal dependencies. These nodes can be grouped
into a single behavior cluster (denoted in red). Upon detection of a malicious software on
any one of these three hosts, one can proactively quarantine the other two nodes without
affecting messaging in the other clusters. On the other hand, if one quarantines the green
cluster completely from the rest of the network, the total cost of quarantine will be the sum
of messages exchanged along overlapping edgese3;5;e4;13;e7;13;e13;15, ande5;14. Note that
the three clusters form a logical partition of the network. Each cluster provides a list of
vulnerable clients any time a client inside the cluster raises an intrusion or malware alert.
We give a more formal treatment of the behavior clustering and partitioning problem in
Section 3.3.2.
3.3 Finding Vulnerability By Association
We mentioned in Section 3.2 that the first step in applying any proactive mechanism is
to find a set of vulnerable clients in near real time, i.e., as soon as an attack is detected.
In this section, we propose an approach calledbehavior clusteringto generate this list.
The underlying principle of behavior clustering is to find vulnerability by association. It
assumes that the vulnerability index of a client is increased sharply if it has come incontact
with an infected client in recent past. Bycontact, we mean messages exchanged between
the two clients, e.g., a text or multimedia message. Whether a client is infected by the
way of such communication with an infected client depends on whether it shares the same
46
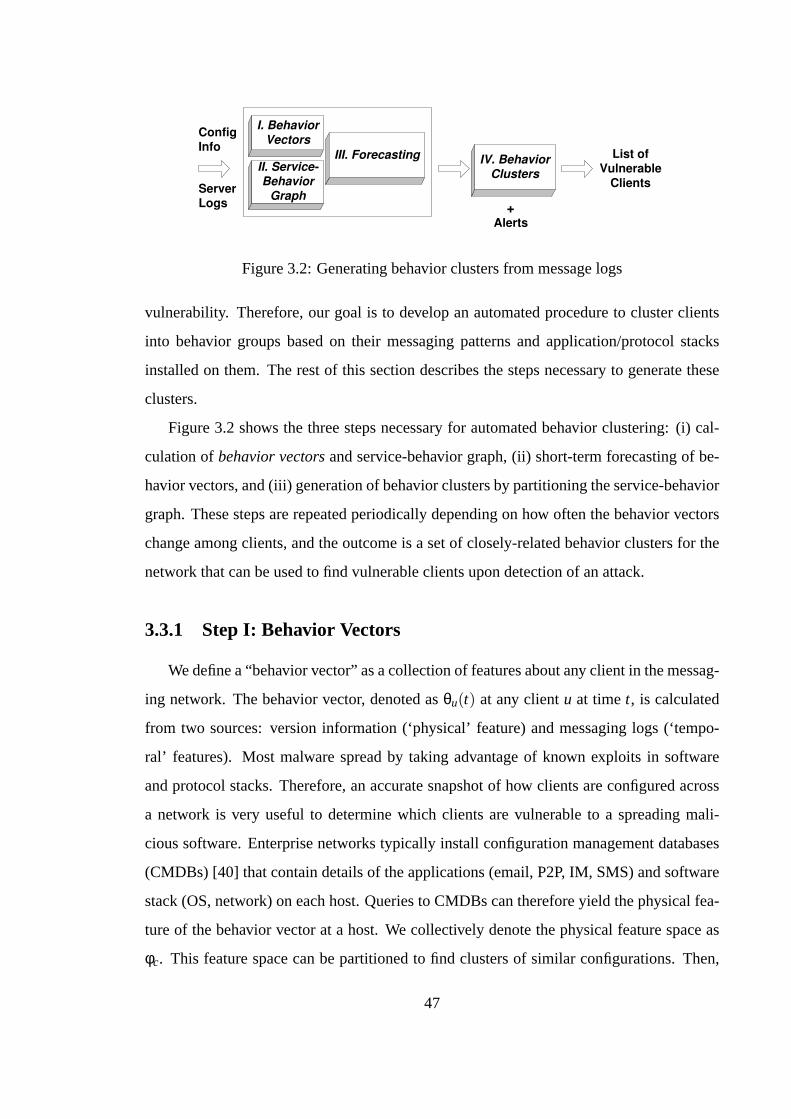
Config Info
I. Behavior
Vectors
III. Forecasting II. Service-
Behavior Graph
IV. Behavior Clusters
Server Logs
List of Vulnerable
Clients
Alerts +
Figure 3.2: Generating behavior clusters from message logs
vulnerability. Therefore, our goal is to develop an automated procedure to cluster clients
into behavior groups based on their messaging patterns and application/protocol stacks
installed on them. The rest of this section describes the steps necessary to generate these
clusters.
Figure 3.2 shows the three steps necessary for automated behavior clustering: (i) cal-
culation ofbehavior vectorsand service-behavior graph, (ii) short-term forecasting of be-
havior vectors, and (iii) generation of behavior clusters by partitioning the service-behavior
graph. These steps are repeated periodically depending on how often the behavior vectors
change among clients, and the outcome is a set of closely-related behavior clusters for the
network that can be used to find vulnerable clients upon detection of an attack.
3.3.1 Step I: Behavior Vectors
We define a “behavior vector” as a collection of features about any client in the messag-
ing network. The behavior vector, denoted asθu(t) at any clientu at timet, is calculated
from two sources: version information (‘physical’ feature) and messaging logs (‘tempo-
ral’ features). Most malware spread by taking advantage of known exploits in software
and protocol stacks. Therefore, an accurate snapshot of how clients are configured across
a network is very useful to determine which clients are vulnerable to a spreading mali-
cious software. Enterprise networks typically install configuration management databases
(CMDBs) [40] that contain details of the applications (email, P2P, IM, SMS) and software
stack (OS, network) on each host. Queries to CMDBs can therefore yield the physical fea-
ture of the behavior vector at a host. We collectively denote the physical feature space as
φc. This feature space can be partitioned to find clusters of similar configurations. Then,
47
whenever a virus or worm is discovered targeting a specific application client or software
exploit, one can readily find the most vulnerable clusters where a proactive action is needed.
In public IM or SMS networks, it is not possible to access client OS and application stack
information. However, most messaging clients transmit client version information and a
few additional details about the client environment (e.g., Windows or UNIX) during the
connection setup. This information can be extracted from the server logs where access to
enterprise-level CMDBs is not possible.
The second component of a behavior vector is calculated by analyzing messages ex-
changed among the clients, and therefore, it is a temporal feature. The generic parameters
that we have implemented are: CDF (cumulative density function) of neighbor interactions
(nm) (“how often a client exchanges messages with another client”), number of outgoing
connections to unique user IDs (ng) (“importance of a client”), and mean and maximum of
message inter-arrival times (tmean; tmaxm).
In summary, the vulnerability index of a client in the messaging network depends on
its physical and temporal features, or, in short, its behavior vector. The components of the
behavior vector at a clientu at timet are given as:
θu(t) = [fφcg;fnm;ng; tmean; tmaxmg].
This vector is updated whenever their values change based on filters placed on the server.
3.3.2 Step II: Service-Behavior Graphs
While behavior vectors represent client-level observations as logged by the server, they
do not describe interactions among the clients. This is captured by creating a service-
behavior graph for the network. We represent the service interactions with adirected graph,
G(Vd;Ed), in whichVd is the set of vertices (i.e., unique participants or client IP addresses)
in the network andEd is the set of edges.G(Vd;Ed) is generated by applying the following
simple rules.
R1. A pair of vertices(u;v) 2 Vd are assigned adirected edgeeuv 2 Ed if and only if there
exists a non-zero contribution to their respective behavior vectors viaeuv.
R2. IP addresses that are external to the networks are labeled with an additional flag. The
48
edges belonging to these hosts represent “outside” connections to the network and
therefore, should be quarantined during an attack. Examples are http links embedded
in messages.
3.3.3 Step III. Short-term Forecasting of Behavior Vectors
Since behavior vectors of clients change frequently in most messaging networks, logs
collected at different time intervals may indicate different behavioral patterns. Therefore,
the service-behavior graph, generated at fixed time intervals, may differ from the actual
behavioral patterns of the network when the list of vulnerable machines need to be gen-
erated. Therefore, a proactive action based on a straightforward application of behavior
vectors computed in the last analysis period may not be the most effective. Since behavior
vectors have a strong temporal component, we apply a short-term forecasting algorithm to
the parameters such that a prediction can be made from the observed values in recent past.
This is currently achieved by applying the standard exponential smoothing procedure [90].
3.3.4 Step IV. Behavior Clustering
The final step is to group the vertices inG(Vd;Ed) into a number of clusters based on
their behavior vectors, where clients in the same cluster are similar in terms of their physical
and temporal patterns. There are a number of techniques for classification and clustering
in the literature. We adopt a hierarchical graph partitioning approach as presented below,
although other approaches can also be used.
The partitioning problem can be formulated as a multi-constraint, connected and bounded
k-way graph partitioning problem as follows. Givenan undirected graph of service inter-
actions,G(Vd;Ed) with scalar edge weightswe : Ed ! N, each vertexv 2 Vd having an
n-dimensional behavior vectorθ(n)v of sizen (∑8v2Vd
θ(i)v = 1:0 for i = 1;2; ¢ ¢ ¢ ;n), and an
integerb 2 f2;3; ¢ ¢ ¢ ;kVdkg, partitionVd into k clusters,V1d ;V2
d ; ¢ ¢ ¢ ;Vkd , such that
† Gi = (V id;Ei
d) induced inG by thei-th cluster is connected;
† 8i 2 f1;2; ¢ ¢ ¢ ;kg: 1 • kV idk • b;
49
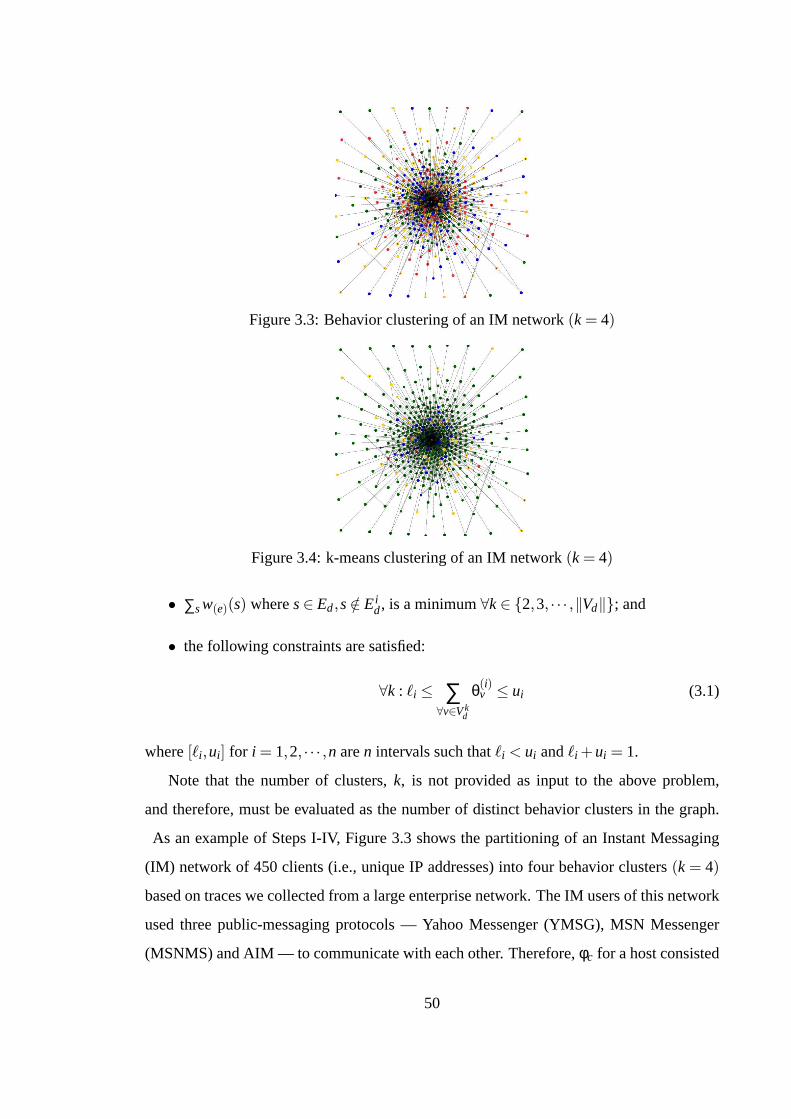
Figure 3.3: Behavior clustering of an IM network(k = 4)
Figure 3.4: k-means clustering of an IM network(k = 4)
† ∑sw(e)(s) wheres2 Ed;s =2 Eid, is a minimum8k 2 f2;3; ¢ ¢ ¢ ;kVdkg; and
† the following constraints are satisfied:
8k : ‘i • ∑8v2Vk
d
θ(i)v • ui (3.1)
where[‘i ;ui ] for i = 1;2; ¢ ¢ ¢ ;n aren intervals such that‘i < ui and‘i +ui = 1.
Note that the number of clusters,k, is not provided as input to the above problem,
and therefore, must be evaluated as the number of distinct behavior clusters in the graph.
As an example of Steps I-IV, Figure 3.3 shows the partitioning of an Instant Messaging
(IM) network of 450 clients (i.e., unique IP addresses) into four behavior clusters(k = 4)
based on traces we collected from a large enterprise network. The IM users of this network
used three public-messaging protocols — Yahoo Messenger (YMSG), MSN Messenger
(MSNMS) and AIM — to communicate with each other. Therefore,φc for a host consisted
50
of one or more elements offYMSG, MSNMS, AIMg, depending on which IM proto-
cols were used from that host. The rest of the behavior vector parameters were calculated
directly from the traces. To compare our results, we calculate the standardk-means cluster-
ing of the same behavior vectors and present the result in Figure 3.4. Note that the present
behavior clustering algorithm results in more balanced partitions of the service-behavior
graph by selectively weighting on vertices. In fact, this approach to behavior clustering
offers several benefits when a proactive response is taken in the network.
(1) Connectedness among the vertices within a cluster:This property guarantees that
any two vertices within a cluster be closer to each other in terms of their features and
connectivity than vertices in another cluster. This is important for localizing messages
within a cluster while other clusters are proactively contained, so that direct peer-to-peer
file transfers between clients are always available.
(2) Minimization of service-edge costs:The cost of the cut (called “edge-cut”) determines
the quality of the clusters, and is, therefore, the primary partitioning objective. There are
many possible choices for the partitioning objective function. For the containment problem,
we minimize the sum of the weights of the edges that span multiple clusters. The goal is
to minimize the number of messages exchanged between different clusters. Then, any
proactive quarantine or rate-limiting of a cluster will cause minimal message interruption
to other clusters.
(3) Satisfaction of vertex constraints within the clusters:Thek-way partitioning algorithm
takes into account the relative weights of the vertices as well as those of the corresponding
edges. The constraints as shown in Eq. (3.1) can be used to balance the partitions in terms
of the vertex constraints, e.g., for including the clients’ geographic domains.
An important deployment question is how often the service-behavior graph should be
updated. We can apply thetriggered updatesconcept implemented in many intrusion de-
tection systems, e.g. GrIDS [117]. Using triggered updates, the service-behavior graph
is updated whenever (i) new vertices and edges are added (or subtracted) to (or from) the
last computed graph, and (ii) the parameters of the behavior vectors change by a certain
threshold over previous values. This is part of our ongoing work in which we are studying
logs collected from a real-world messaging server to understand the temporal aspects of
51
service-behavior graphs.
The overall complexity of the partitioning phase isO(kEdk), and therefore, is deter-
mined by the size of messaging network,G. In reality, this step is extremely fast. For
example, the time required to generate behavior clusters for a service-behavior graph with
Vd = 9269hosts andEd = 9836edges ranges from 0.04 second (2 clusters) to 0.16 second
(32 clusters) on a dual-CPU (1.5GHz) AMD Opteron 240 platform.
3.4 Proactive Containment Methods
In this section, we explain the basic rate-limiting and quarantine mechanisms that serve
as the building blocks of our proactive response framework. While scan detection-based
methods [69, 143] protect an enterprise from incoming infections, rate-liming and quaran-
tine seek to contain outbound infected messages. These methods can be applied on both
individual as well as a group of clients. When these are applied on a group of clients as
in the case of proactive defense, the first step is to obtain a list of vulnerable clients most
relevant to the generated alerts. We assume that this list can be obtained on-demand via the
behavior clustering algorithm described in Section 3.3.
3.4.1 Rate-limiting
The rate-limiting (also known as “virus throttling”[147–149]) is a general class of re-
sponse techniques that seek to limit the spread of a worm or virus once it is detected on a
host. For example, it has been applied to contain IM worms in [147]. It is based on the
observation that normal or acceptable behavior of many Internet protocols such as TCP/IP,
email and IM differs significantly from the corresponding worm-like behavior. Most users
of email, SMS and IM interact with a slowly-varying subset of other users as compared to
malicious codes that attempt to send messages to all contacts in a victim’s address book or
buddy list. The original virus throttling algorithm proposed by Williamson [148] limits the
rate of outgoing connections to new machines that a host is able to make in a given time
interval. Figure 3.5 explains the basic rate-limiting mechanism. Aworking setof speci-
52
a f
h
d c b
g
e
Queue
Length Detector
Rate Timer clock
Process
Working Set
n = 4
Request
new
add
update
not-new
Delay
Queue
Figure 3.5: Virus throttling algorithm by Williamson [11]
fied length (n = 4 in Figure 3.5) is maintained for each user that keeps track ofn recent
addresses that the user has interacted with. When the user attempts to send a message to
a new contact, the recipient’s address (”h” in Figure 3.5) is compared with those in the
working set. If the address is in the working set, the message is allowed to pass through.
Otherwise, the message is placed on adelay queuefor sending at a later time. At periodic
intervals, the delay queue messages are processed as follows: the destination address of the
message at the head of the queue is added to the working set replacing the oldest address
in the working set (using a least-recently used or LRU algorithm). Then, all messages in
the delay queue destined for the newly admitted address are removed from the queue and
sent to the recipient address. When the length of the delay queue exceeds a pre-determined
threshold, all new contact attempts from the client can be blocked, e.g. by reducing the size
of the working set to zero, and the user may be asked to validate the messages in the queue.
The rate-limiting mechanism is implemented at the server since it initiates or processes all
requests made by the clients. Further, when implemented at the server, users are not able to
modify the rate-limiting configuration parameters. Therefore, rate-limiting can be imple-
mented easily for email, IM, SMS and centralized P2P file-sharing (e.g. Napster). The most
important advantage of rate-limiting is its ability to enforce containment in a gentle man-
ner, as opposed to quarantine which results in complete shut-down of the client. Therefore,
rate-limiting mechanisms are generally preferred by enterprise networks over quarantine.
53
We should note that several variants of rate-limiting have been proposed to date. Recently,
Wong et. al. [149] have presented an excellent empirical study of these schemes as well as
a new DNS-based rate-limiting algorithm for general worm containment.
For our implementation of proactive rate-limiting, we chose to implement the Williamson
throttling algorithm as the basic per-client rate-limiting mechanism, with an important dif-
ference. We implement rate-limiting only for messaging services, and not the other ports
on the host. This prevents the excessive delays and blockage of all legitimate applications
on the host in case of an infection, as reported in [149]. Note that the messaging worm
propagation doesn’t result in large volumes of failed connections or data in the network.
But, the rate at which an infected client sends messages to other clients in the network
may deviate significantly from its normal sending rate. This can be detected efficiently
by the Williamson virus throttling algorithm although the algorithm is prone to high false
positive rates when a client has been infected. We deal with this problem by applying a
group-behavior based approach that effectively reduces the false positive rates.
3.4.2 Quarantine
In contrast with rate-limiting, quarantine-based systems prevent a suspicious or infected
client from sending or receiving messages. This can be implemented at the messaging
server so that any connection attempt by the user on an infected client is refused. Re-
cent industry initiatives such as Network Admission Control (NAC) [127] and Network
VirusWall [132] are intended to enforce established security policies to endpoint devices as
they enter a protected network. The Cisco NAC allows non-compliant devices to be denied
access and placed in a quarantined local network, or given restricted access to resources.
However, such systems are in very early stages of development for SMS/MMS networks.
In our implementation of quarantine, we simply reduce the size of the working set to
zero in the rate-limiting module on a client and let the delay queue grow without triggering
any new malicious software alert. This is enforcedafter an alert has already been issued
from the client and a malicious activity has been detected. This effectively quarantines the
client from sending any more messages.
54
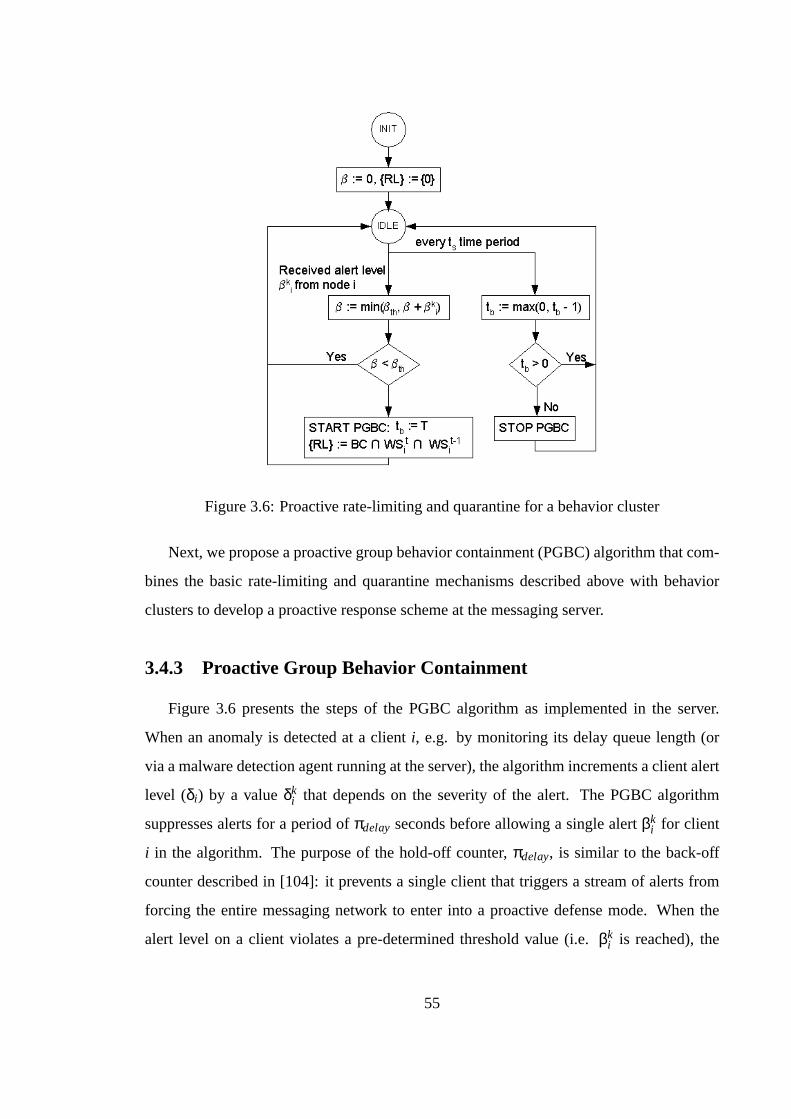
Figure 3.6: Proactive rate-limiting and quarantine for a behavior cluster
Next, we propose a proactive group behavior containment (PGBC) algorithm that com-
bines the basic rate-limiting and quarantine mechanisms described above with behavior
clusters to develop a proactive response scheme at the messaging server.
3.4.3 Proactive Group Behavior Containment
Figure 3.6 presents the steps of the PGBC algorithm as implemented in the server.
When an anomaly is detected at a clienti, e.g. by monitoring its delay queue length (or
via a malware detection agent running at the server), the algorithm increments a client alert
level (δi) by a valueδki that depends on the severity of the alert. The PGBC algorithm
suppresses alerts for a period ofπdelay seconds before allowing a single alertβki for client
i in the algorithm. The purpose of the hold-off counter,πdelay, is similar to the back-off
counter described in [104]: it prevents a single client that triggers a stream of alerts from
forcing the entire messaging network to enter into a proactive defense mode. When the
alert level on a client violates a pre-determined threshold value (i.e.βki is reached), the
55
server activates a rate-limiting for messages sent by the client, i.e. the size of its working
set is reduced and outgoing messages from the client are queued at the server. A separate
process decrements the alert level at every time step until it reaches zero, at which point,
the rate-limiting is stopped for messages sent by the client.
The messaging server generates behavior clusters at periodic intervals from the mes-
sages exchanged among the clients, using the clustering algorithm described in Section 3.3.
Whenever an alert levelβki is generated for a client, the algorithm updates the total alert
levelβ of the corresponding behavior cluster. When the behavior cluster alert level reaches
a threshold value (βth), the server activates a rate-limiting on the most vulnerable clients
of the behavior cluster, namely the nodes that have exchanged messages with the infected
client. This list is computed via a setintersectionof the client in the behavior cluster and
the working sets of the infected client at current and previous time steps. This step of the
algorithm also enforces a quarantine of all messages from the infected client (i.e. it is no
longer rate-limited but is blocked from messaging). A separate process decrements a back-
off timer (tb) from the value ofT assigned at the beginning of the group defense mode, and
transitions the behavior cluster from the proactive defense mode back to the normal mode
when either (i) there are no more alert messages or (ii)tb becomes0.
Note that PGBC gradually slows down outgoing messages from a group of clients and
brings them back to the normal mode when no alerts are received for a period. This is in
contrast with the traditional detect-and-block schemes that cause sudden message loss and
delay in the network.
3.5 Evaluation of Proactive Defense in a SMS network
3.5.1 PGBC and Agent-Based Malware Modeling
As discussed in Chapter 2, in AMM, we model a mobile network as a collection of
autonomous decision-making entities calledagents. The agents represent clients within the
network such as PDAs, mobile phones, service centers(e.g., SMS Center) and gateways. In
case of agents representing mobile devices, the connectivity changes as users roam about
56
the physical space of the network. For evaluation of PGBC, we consider mobile users
exchanging SMS messages. An agent may consist of client applications for email and
SMS/MMS messaging, whereas the SMS Center (SMSC) agent may consist of a store-and-
forward server only. Thus, there are two types of topologies in our simulation environment.
Thephysicalconnectivity is determined by the physical network infrastructure, movement
of the agents, location of access points and base stations, whereas thelogical connectivity
is determined by the messages exchanged among the agents.
The first step is to prepare the following input parameters: (i)infection-model para-
metersfor a malware targeting SMS, (ii)topologyof SMS messaging patterns among
the users, (iii)location of base stations,(iv)mobility modelsfor agents that are mobile,
(v)infection and replication state machine(i.e., “attack vector”) of the malicious software,
(vi) detection modeland (vii) an attack response model. We have implemented PGBC,
Williamson rate-limiting (WRL) and reactive (i.e. “detect-and-block”) responses to com-
pare their effectiveness. At each time step, the coordinates of mobile agents are updated
based on their mobility models resulting in new connectivity graphs. Next, each agent ex-
changes messages with other agents according to the SMS service model— the probability
of any of these messages being infected is calculated from the service-infection model.
The time steps are repeated over a user-specified number of trials so that the results can be
averaged over these trials. The simulator is general enough to experiment with different
algorithms for malware detection and containment.
3.5.2 SMS Messaging Logs
The topology of a messaging network can be extracted from CDRs collected from a
real-world cellular network, and the relevant parameters are then input to AMM. To the best
of our knowledge, there does not exist any malware propagation model using SMS/MMS
services in a cellular network. A recent study [107] of SMS usage characterization collected
call data records and SS7traces over a three-week period from a large cellular carrier with10
million mobile users. The data allowed us to reconstruct a realistic SMS messaging network
with the following parameters: message sending rates, message receiving rates, cumulative
57
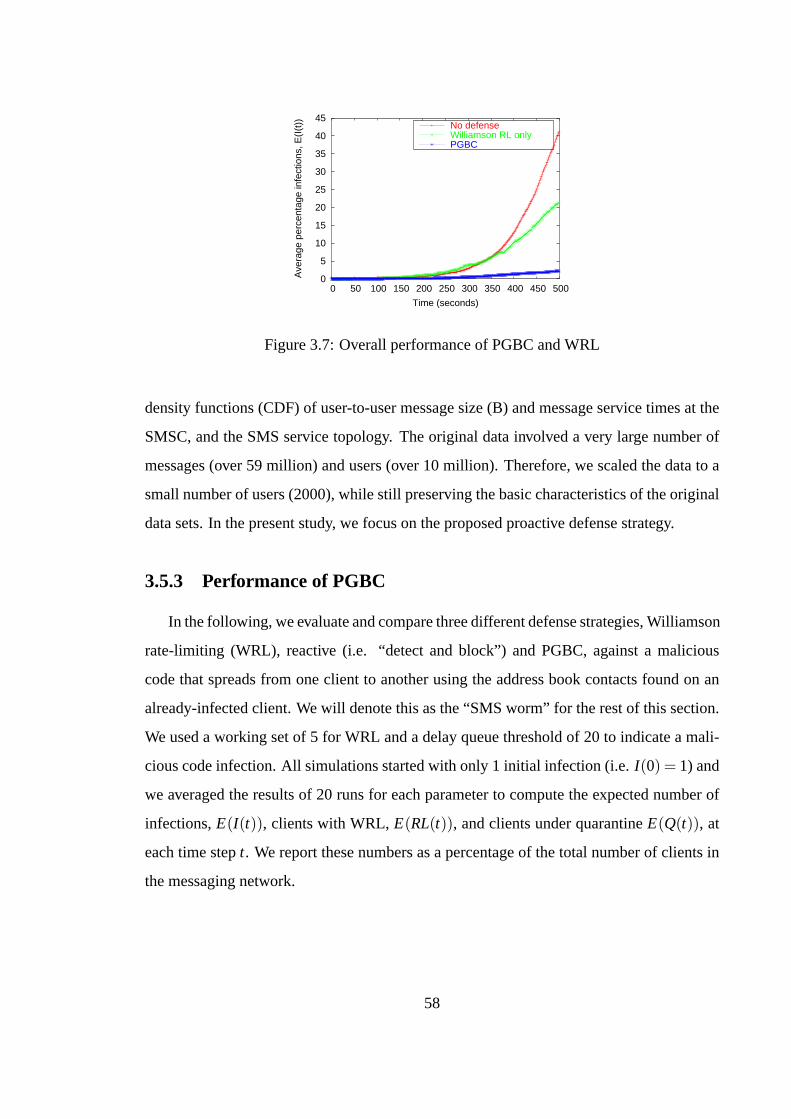
0
5
10
15
20
25
30
35
40
45
0 50 100 150 200 250 300 350 400 450 500A
vera
ge p
erce
ntag
e in
fect
ions
, E(I
(t))
Time (seconds)
No defenseWilliamson RL onlyPGBC
Figure 3.7: Overall performance of PGBC and WRL
density functions (CDF) of user-to-user message size (B) and message service times at the
SMSC, and the SMS service topology. The original data involved a very large number of
messages (over 59 million) and users (over 10 million). Therefore, we scaled the data to a
small number of users (2000), while still preserving the basic characteristics of the original
data sets. In the present study, we focus on the proposed proactive defense strategy.
3.5.3 Performance of PGBC
In the following, we evaluate and compare three different defense strategies, Williamson
rate-limiting (WRL), reactive (i.e. “detect and block”) and PGBC, against a malicious
code that spreads from one client to another using the address book contacts found on an
already-infected client. We will denote this as the “SMS worm” for the rest of this section.
We used a working set of5 for WRL and a delay queue threshold of20 to indicate a mali-
cious code infection. All simulations started with only1 initial infection (i.e.I(0) = 1) and
we averaged the results of20 runs for each parameter to compute the expected number of
infections,E(I(t)), clients with WRL,E(RL(t)), and clients under quarantineE(Q(t)), at
each time stept. We report these numbers as a percentage of the total number of clients in
the messaging network.
58
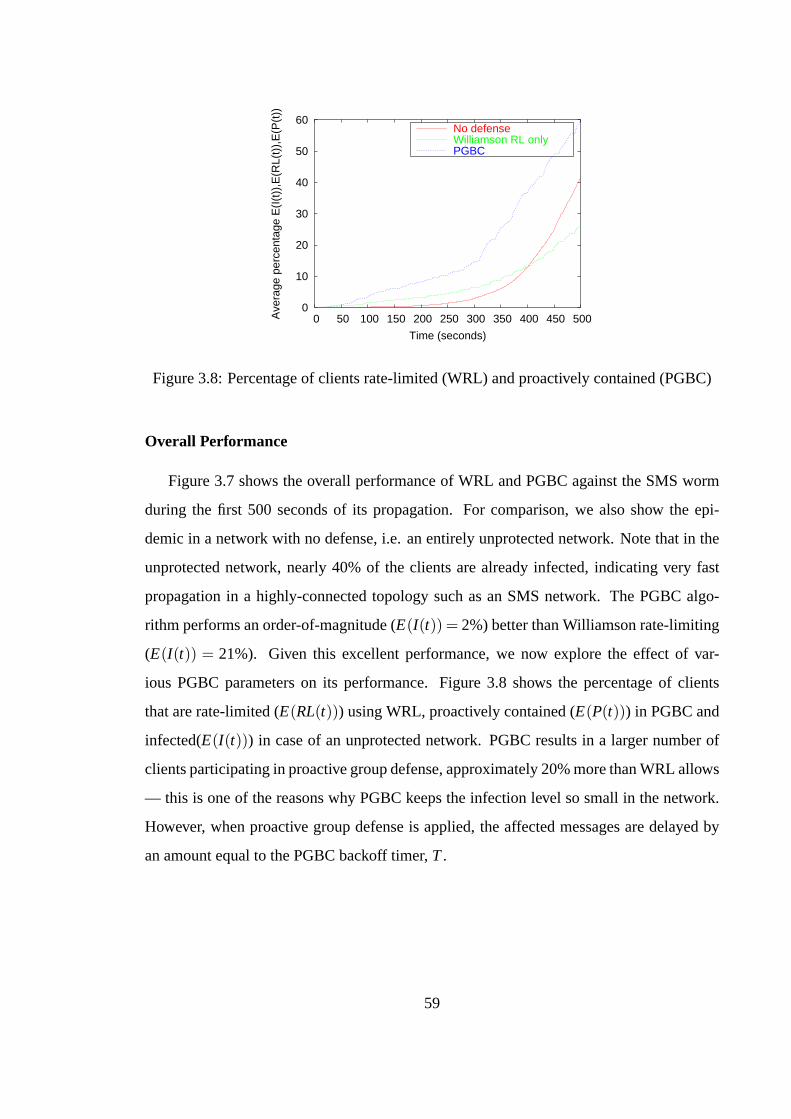
0
10
20
30
40
50
60
0 50 100 150 200 250 300 350 400 450 500Ave
rage
per
cent
age
E(I
(t))
,E(R
L(t)
),E
(P(t
))
Time (seconds)
No defenseWilliamson RL onlyPGBC
Figure 3.8: Percentage of clients rate-limited (WRL) and proactively contained (PGBC)
Overall Performance
Figure 3.7 shows the overall performance of WRL and PGBC against the SMS worm
during the first 500 seconds of its propagation. For comparison, we also show the epi-
demic in a network with no defense, i.e. an entirely unprotected network. Note that in the
unprotected network, nearly40% of the clients are already infected, indicating very fast
propagation in a highly-connected topology such as an SMS network. The PGBC algo-
rithm performs an order-of-magnitude (E(I(t)) = 2%) better than Williamson rate-limiting
(E(I(t)) = 21%). Given this excellent performance, we now explore the effect of var-
ious PGBC parameters on its performance. Figure 3.8 shows the percentage of clients
that are rate-limited (E(RL(t))) using WRL, proactively contained (E(P(t))) in PGBC and
infected(E(I(t))) in case of an unprotected network. PGBC results in a larger number of
clients participating in proactive group defense, approximately20%more than WRL allows
— this is one of the reasons why PGBC keeps the infection level so small in the network.
However, when proactive group defense is applied, the affected messages are delayed by
an amount equal to the PGBC backoff timer,T.
59
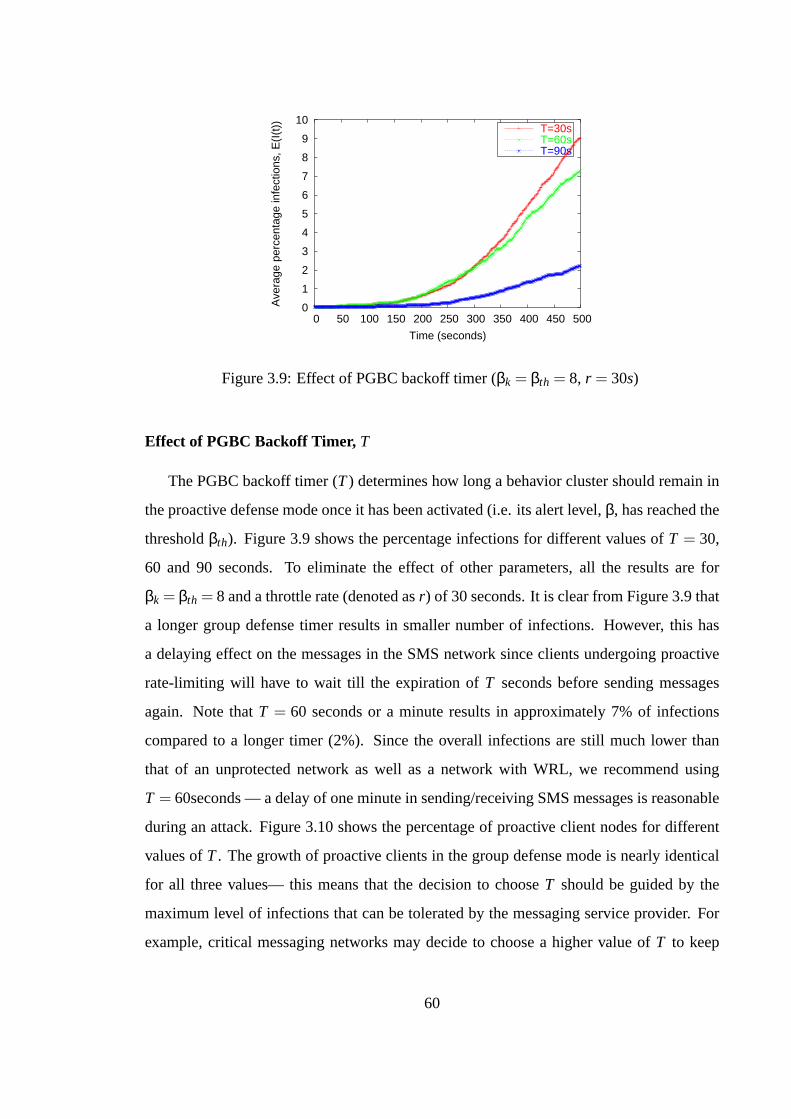
0
1
2
3
4
5
6
7
8
9
10
0 50 100 150 200 250 300 350 400 450 500
Ave
rage
per
cent
age
infe
ctio
ns, E
(I(t
))
Time (seconds)
T=30sT=60sT=90s
Figure 3.9: Effect of PGBC backoff timer (βk = βth = 8, r = 30s)
Effect of PGBC Backoff Timer, T
The PGBC backoff timer (T) determines how long a behavior cluster should remain in
the proactive defense mode once it has been activated (i.e. its alert level,β, has reached the
thresholdβth). Figure 3.9 shows the percentage infections for different values ofT = 30,
60 and 90 seconds. To eliminate the effect of other parameters, all the results are for
βk = βth = 8 and a throttle rate (denoted asr) of 30seconds. It is clear from Figure 3.9 that
a longer group defense timer results in smaller number of infections. However, this has
a delaying effect on the messages in the SMS network since clients undergoing proactive
rate-limiting will have to wait till the expiration ofT seconds before sending messages
again. Note thatT = 60 seconds or a minute results in approximately7% of infections
compared to a longer timer (2%). Since the overall infections are still much lower than
that of an unprotected network as well as a network with WRL, we recommend using
T = 60seconds — a delay of one minute in sending/receiving SMS messages is reasonable
during an attack. Figure 3.10 shows the percentage of proactive client nodes for different
values ofT. The growth of proactive clients in the group defense mode is nearly identical
for all three values— this means that the decision to chooseT should be guided by the
maximum level of infections that can be tolerated by the messaging service provider. For
example, critical messaging networks may decide to choose a higher value ofT to keep
60
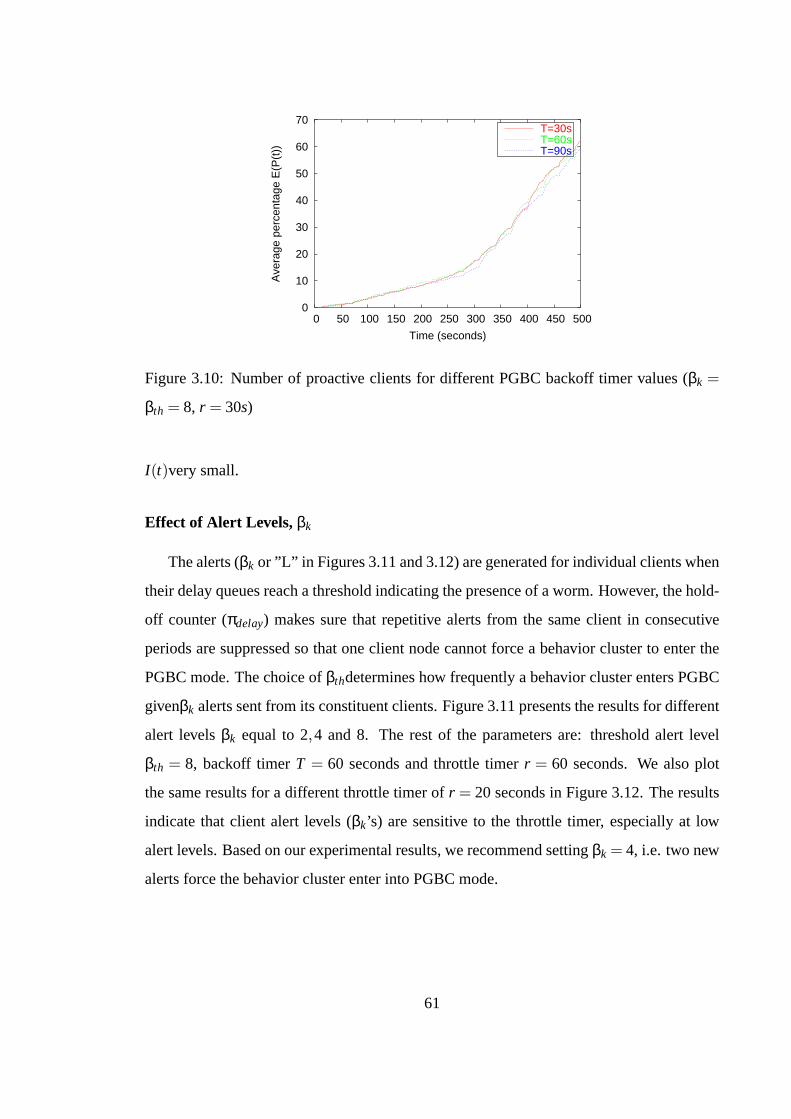
0
10
20
30
40
50
60
70
0 50 100 150 200 250 300 350 400 450 500
Ave
rage
per
cent
age
E(P
(t))
Time (seconds)
T=30sT=60sT=90s
Figure 3.10: Number of proactive clients for different PGBC backoff timer values (βk =
βth = 8, r = 30s)
I(t)very small.
Effect of Alert Levels, βk
The alerts (βk or ”L” in Figures 3.11 and 3.12) are generated for individual clients when
their delay queues reach a threshold indicating the presence of a worm. However, the hold-
off counter (πdelay) makes sure that repetitive alerts from the same client in consecutive
periods are suppressed so that one client node cannot force a behavior cluster to enter the
PGBC mode. The choice ofβthdetermines how frequently a behavior cluster enters PGBC
givenβk alerts sent from its constituent clients. Figure 3.11 presents the results for different
alert levelsβk equal to2;4 and8. The rest of the parameters are: threshold alert level
βth = 8, backoff timerT = 60 seconds and throttle timerr = 60 seconds. We also plot
the same results for a different throttle timer ofr = 20 seconds in Figure 3.12. The results
indicate that client alert levels (βk’s) are sensitive to the throttle timer, especially at low
alert levels. Based on our experimental results, we recommend settingβk = 4, i.e. two new
alerts force the behavior cluster enter into PGBC mode.
61
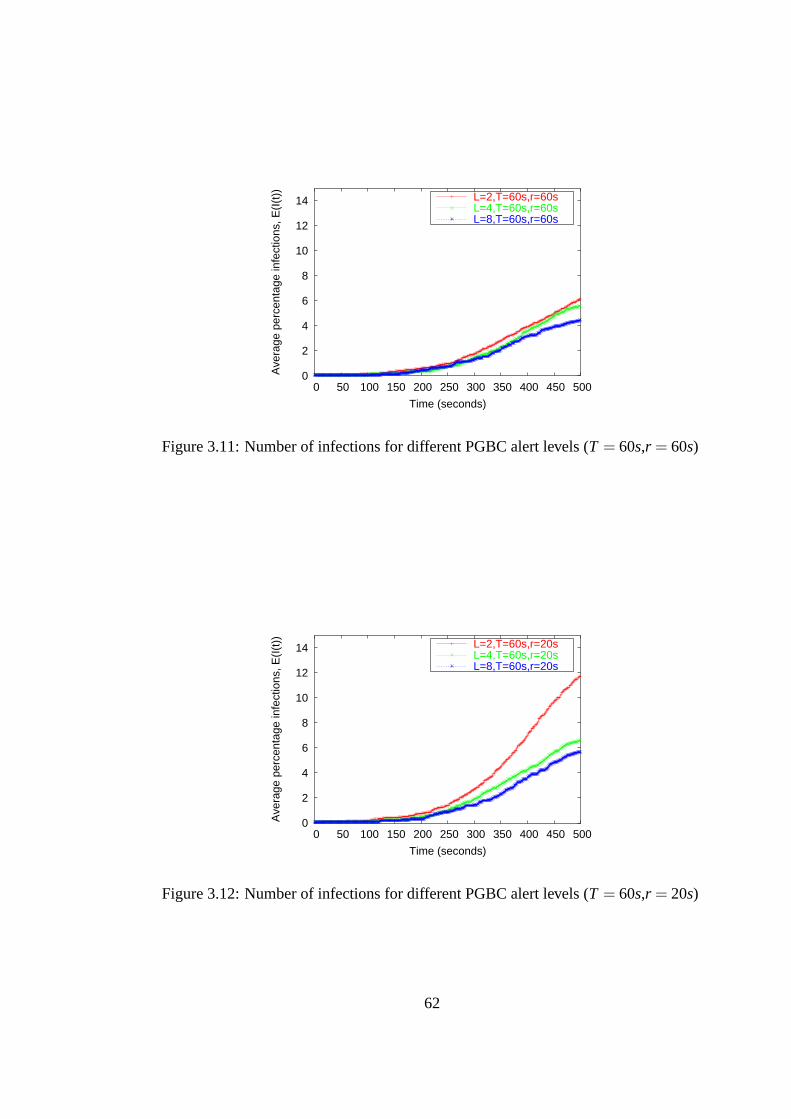
0
2
4
6
8
10
12
14
0 50 100 150 200 250 300 350 400 450 500
Ave
rage
per
cent
age
infe
ctio
ns, E
(I(t
))
Time (seconds)
L=2,T=60s,r=60sL=4,T=60s,r=60sL=8,T=60s,r=60s
Figure 3.11: Number of infections for different PGBC alert levels (T = 60s,r = 60s)
0
2
4
6
8
10
12
14
0 50 100 150 200 250 300 350 400 450 500
Ave
rage
per
cent
age
infe
ctio
ns, E
(I(t
))
Time (seconds)
L=2,T=60s,r=20sL=4,T=60s,r=20sL=8,T=60s,r=20s
Figure 3.12: Number of infections for different PGBC alert levels (T = 60s,r = 20s)
62
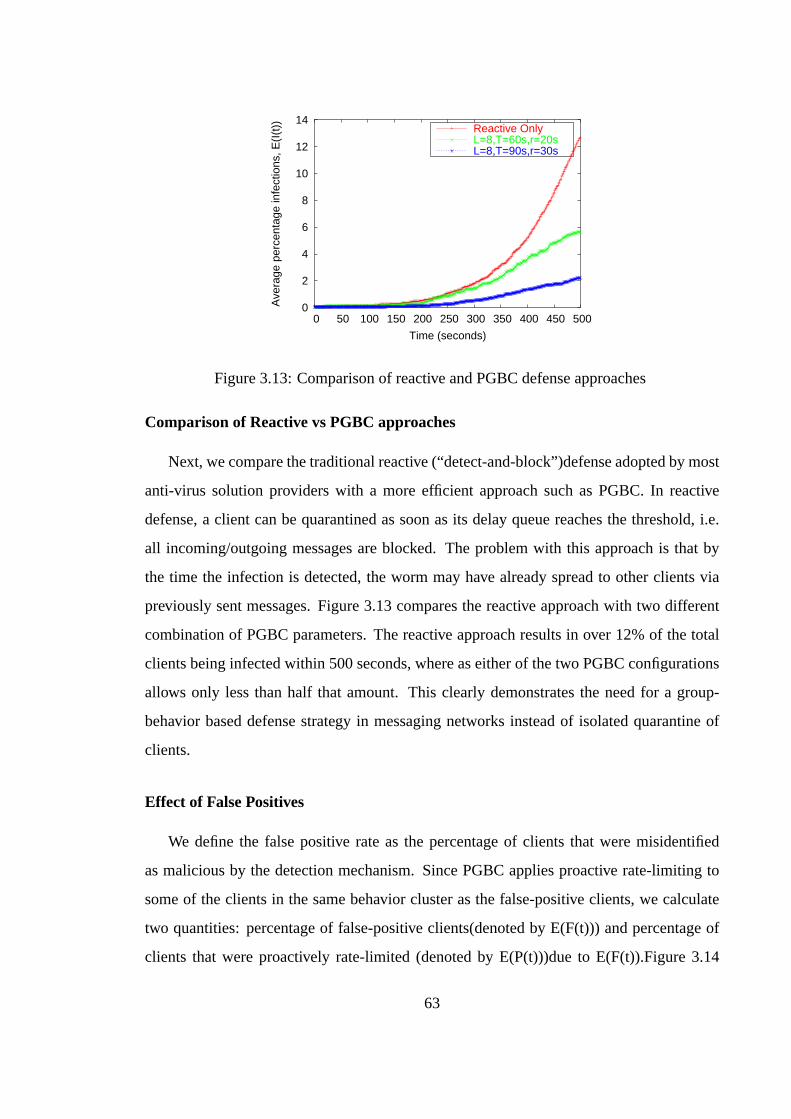
0
2
4
6
8
10
12
14
0 50 100 150 200 250 300 350 400 450 500
Ave
rage
per
cent
age
infe
ctio
ns, E
(I(t
))
Time (seconds)
Reactive OnlyL=8,T=60s,r=20sL=8,T=90s,r=30s
Figure 3.13: Comparison of reactive and PGBC defense approaches
Comparison of Reactive vs PGBC approaches
Next, we compare the traditional reactive (“detect-and-block”)defense adopted by most
anti-virus solution providers with a more efficient approach such as PGBC. In reactive
defense, a client can be quarantined as soon as its delay queue reaches the threshold, i.e.
all incoming/outgoing messages are blocked. The problem with this approach is that by
the time the infection is detected, the worm may have already spread to other clients via
previously sent messages. Figure 3.13 compares the reactive approach with two different
combination of PGBC parameters. The reactive approach results in over12%of the total
clients being infected within500seconds, where as either of the two PGBC configurations
allows only less than half that amount. This clearly demonstrates the need for a group-
behavior based defense strategy in messaging networks instead of isolated quarantine of
clients.
Effect of False Positives
We define the false positive rate as the percentage of clients that were misidentified
as malicious by the detection mechanism. Since PGBC applies proactive rate-limiting to
some of the clients in the same behavior cluster as the false-positive clients, we calculate
two quantities: percentage of false-positive clients(denoted by E(F(t))) and percentage of
clients that were proactively rate-limited (denoted by E(P(t)))due to E(F(t)).Figure 3.14
63
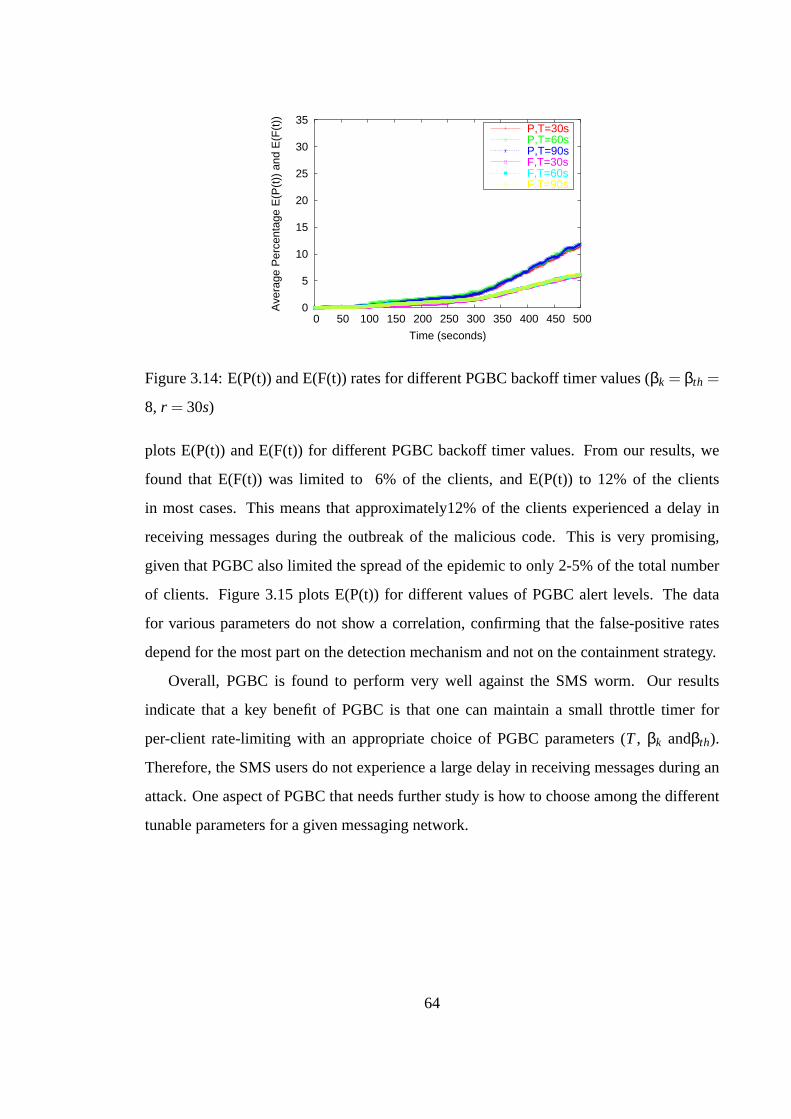
0
5
10
15
20
25
30
35
0 50 100 150 200 250 300 350 400 450 500
Ave
rage
Per
cent
age
E(P
(t))
and
E(F
(t))
Time (seconds)
P,T=30sP,T=60sP,T=90sF,T=30sF,T=60sF,T=90s
Figure 3.14: E(P(t)) and E(F(t)) rates for different PGBC backoff timer values (βk = βth =
8, r = 30s)
plots E(P(t)) and E(F(t)) for different PGBC backoff timer values. From our results, we
found that E(F(t)) was limited to 6% of the clients, and E(P(t)) to 12% of the clients
in most cases. This means that approximately12% of the clients experienced a delay in
receiving messages during the outbreak of the malicious code. This is very promising,
given that PGBC also limited the spread of the epidemic to only 2-5% of the total number
of clients. Figure 3.15 plots E(P(t)) for different values of PGBC alert levels. The data
for various parameters do not show a correlation, confirming that the false-positive rates
depend for the most part on the detection mechanism and not on the containment strategy.
Overall, PGBC is found to perform very well against the SMS worm. Our results
indicate that a key benefit of PGBC is that one can maintain a small throttle timer for
per-client rate-limiting with an appropriate choice of PGBC parameters (T, βk andβth).
Therefore, the SMS users do not experience a large delay in receiving messages during an
attack. One aspect of PGBC that needs further study is how to choose among the different
tunable parameters for a given messaging network.
64
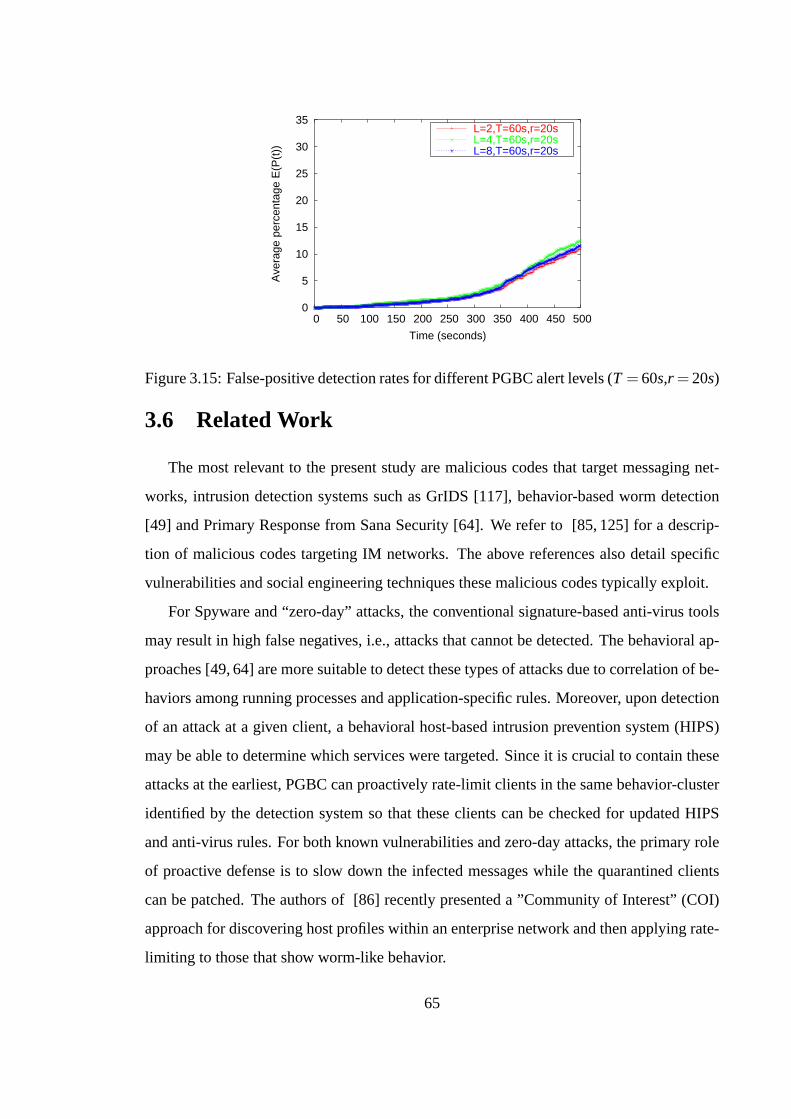
0
5
10
15
20
25
30
35
0 50 100 150 200 250 300 350 400 450 500
Ave
rage
per
cent
age
E(P
(t))
Time (seconds)
L=2,T=60s,r=20sL=4,T=60s,r=20sL=8,T=60s,r=20s
Figure 3.15: False-positive detection rates for different PGBC alert levels (T = 60s,r = 20s)
3.6 Related Work
The most relevant to the present study are malicious codes that target messaging net-
works, intrusion detection systems such as GrIDS [117], behavior-based worm detection
[49] and Primary Response from Sana Security [64]. We refer to [85, 125] for a descrip-
tion of malicious codes targeting IM networks. The above references also detail specific
vulnerabilities and social engineering techniques these malicious codes typically exploit.
For Spyware and “zero-day” attacks, the conventional signature-based anti-virus tools
may result in high false negatives, i.e., attacks that cannot be detected. The behavioral ap-
proaches [49, 64] are more suitable to detect these types of attacks due to correlation of be-
haviors among running processes and application-specific rules. Moreover, upon detection
of an attack at a given client, a behavioral host-based intrusion prevention system (HIPS)
may be able to determine which services were targeted. Since it is crucial to contain these
attacks at the earliest, PGBC can proactively rate-limit clients in the same behavior-cluster
identified by the detection system so that these clients can be checked for updated HIPS
and anti-virus rules. For both known vulnerabilities and zero-day attacks, the primary role
of proactive defense is to slow down the infected messages while the quarantined clients
can be patched. The authors of [86] recently presented a ”Community of Interest” (COI)
approach for discovering host profiles within an enterprise network and then applying rate-
limiting to those that show worm-like behavior.
65
GrIDS [117] is a hierarchical intrusion detection system (IDS) that aggregates host and
network information as activity graphs representing the causal structure of network activity.
GrIDS organizes the hierarchy in terms of departments within an organization. The edges
represent network traffic and attributes between the departments. Each department collects
information from its child nodes and passes summary information to its parent. GrIDS uses
multiple rule sets to determine how graphs are built and alerts generated. In contrast, the
hierarchy in PGBC is based on messaging patterns, not the physical network infrastructure.
The rule sets for generating service-behavior graphs are very simple to implement since
they can be derived from server logs.
Ellis et al. [49] presented a novel approach to automatic detection of worms using be-
havioral signatures. These signatures are generated from temporal and characteristic pat-
terns of worm behaviors in network traffic, e.g., during transfer of infected payloads to
other hosts, tree-like propagation and reconnaissance and changing a server into a client.
Although not considered, the behavioral signatures can be the basis for quarantining indi-
vidual clients or groups of clients in their abstract communications network (ACN). The
Primary Response from Sana Security [64] is another host-based behavioral approach that
monitors running applications and employs multiple behavioral heuristics (e.g., writing to
registry, calls to keylogging procedures, process hijacking, etc.) to identify a malicious
application. It also correlates actions of multiple running applications to decide whether an
application is Spyware. The current detection mechanism in PGBC monitors the length of
delay queues to identify worm-like behavior. However, any of the above detection mech-
anisms can be implemented in PGBC, resulting in more robust and reliable detection of
messaging worms.
The “Firewall Network System” described in [156] places firewalls on physical seg-
ments of an enterprise network. The firewalls specify access policies to allow only pre-
defined service requests. This approach requires accurate specification of all service re-
quests and firewall access rules for the entire enterprise network. The “dynamic quaran-
tine” method in [155] is based on a preemptive quarantine approach that quarantines a host
whenever its behavior is considered suspicious by blocking traffic on the suspicious port.
The authors of [142] discuss the possibility of deploying automated responses to malicious
66
code, e.g., by proactively mapping the local network traffic components and topology using
nmap-like tools. Upon receipt of an alert with concrete information about the underlying
vulnerability, the corresponding traffic may be blocked before it can reach other parts of
the network. The basic premise of our approach is similar but based on a systematic study
of messaging patterns among the clients.
3.7 Concluding Remarks
We have presented a novel framework calledProactive Group Behavior Containment
(PGBC) to contain malicious software spreading in messaging networks such as IM and
SMS/MMS. The exponential growth of malicious software targeting these networks in re-
cent years requires development of proactive security approaches such as PGBC. Since all
the information needed to build PGBC can be obtained from server logs, it can be easily
deployed in store-and-forward networks such as SMS/MMS and server-initiated networks
such as IM. The primary component of PGBC are service-behavior graphs generated from
client messaging patterns and behavior clusters that partition the service-behavior graph
into clusters of similar behavior. PGBC uses a combination of message rate-limiting and
quarantine with increasing reaction to alerts in the network. In our evaluation results for a
SMS network, PGBC is found to be several orders-of-magnitude more effective than tra-
ditional defenses such as “detect-and-block”and individual client rate-limiting. From our
simulation results, it is evident that proactive defense is key to slowing down malicious
codes during the early stages of its spreading. This is critical because there is only a small
time window between the time an infection is detected and the time the cumulative infec-
tions reach an epidemic threshold. PGBC makes most of this time window by proactively
quarantining and rate-limiting vulnerable clients in the network. There are several aspects
of PGBC that are part of our ongoing study. The time scale at which a service-behavior
graph should be updated for a given messaging network needs further investigation. The
scalability of PGBC to very large messaging networks, perhaps with millions of clients,is
yet to be investigated. Finally, the effect of false negatives(i.e. infected clients that were
not detected by the detection mechanism) on overall infection rates should be studied as
67

well.
68
CHAPTER 4
Mobile Malware Exploiting Messaging and Bluetooth
4.1 Introduction
The majority of the published studies on modeling and containment of malware have
focused on scanning- and email-worms due to their prevalence and several successful large-
scale attacks on the Internet. On the contrary, there appears to be very little published work
on mobile viruses and worms. This is the primary motivation of our work. We study the
mobile viruses discovered to date and the various target discovery, infection and replication
mechanisms they deploy to spread to other devices. We then create a table of common
behavior vectors of these viruses so that appropriate detection and containment strategies
can be developed in near future. Since the majority of these viruses have so far exploited
Bluetooth and SMS/MMS services on cellular handsets, we investigate vulnerabilities in
these two vectors in-depth. We then develop an infection state machine of a generic mobile
virus exploiting Bluetooth and SMS, and incorporate the model in a fine-grained agent-
based malware simulator that we develop for studying mobile worms. Using data from
a real-world SMS network, we emulate the propagation of this virus in a small mobile
network representative of a public meeting place such as a stadium or airport.
Our study makes two primary contributions. First, it provides a detailed analysis of
vulnerability from mobile viruses and develops their common behavior vectors. Second,
it proposes a new emulation framework for studying propagation models and containment
strategies of viruses in mobile environments.
69
The chapter is organized as follows. In Section 4.2, we provide an overview of mo-
bile viruses and vulnerabilities. We map the replication and infection mechanisms of
these viruses into a set of common behavior vectors. We then present a generic mobile
virus model that can be used for modeling propagation and containment strategies in Sec-
tion 4.2.3. The vulnerabilities associated with Bluetooth and SMS/MMS messaging ser-
vices are discussed in Sections 4.3 and 4.4, respectively. Next, we discuss briefly our
agent-based simulation framework in Section 4.5. Section 4.6 presents the results of our
simulation studies using data from a real-world SMS network. Finally, we provide con-
cluding remarks in Section 4.7.
4.2 Analysis of Mobile Viruses
Malicious agents that specifically target mobile phones and handheld devices are on the
rise. The earliest versions of these were considered harmless since these were not written
to spread from one device to another. The most recent mobile viruses, however, are capable
of spreading to nearby devices via Bluetooth, and, therefore, pose a more serious threat to
enterprise networks. In what follows, we list the most common spreading mechanisms,
target platforms, and client vulnerabilities of mobile viruses discovered to date. Further
details on them are available on a number of security-vendor web sites.
† One of the earliest viruses written for handheld devices (Palm PDAs), the PalmOS
Liberty.A virus (2001), had to be manually installed and executed for it to become
active. The virus deleted all applications and databases on a Palm OS-compatible
device. The Liberty virus and other similar Trojans by their design are not likely
to spread quickly due to their manual infection process and therefore, represent a
relatively low threat.
† A virus for Palm OS, called Phage [120] (2000) was conceived mostly as a demon-
stration — it could spread from one PDA to another if infected files were shared
via infrared beaming or a docking station. This was an improvement from manual
infection.
70
† The Spanish Timophonica [105] worm (2000) was programmed to send SMS mes-
sages to random GSM phone numbers via a specific SMS gateway. Only reported
in Spain, this worm represented the beginning of more advanced mobile viruses to
come, since it modified MS Outlook settings and the device registry of an infected
phone. If the accompanied Trojan code was successfully installed, it also deleted
CMOS memory and Master Boot Records of the device. It could propagate via the
Outlook email client using stored address book entries. Worms such as Timophonica
are early examples of hybrid mobile malware since they can spread via both wireless
and wired networks.
† The Japanese 110 worm (2000) took advantage of a vulnerability in the NTT Do-
CoMo i-mode mobile phones. This phone has a capability similar to “mailto:” avail-
able in html — users can automatically dial a number by clicking on the linked
number contained in an email or web page. Therefore, individual phone numbers in
the address book can become victims of DoS attacks.
More recent mobile viruses have targeted Nokia series 60 cell phones running Symbian OS
due primarily to their popularity and advanced features, such as Bluetooth and SMS/MMS
services. These viruses can search for nearby Bluetooth-enabled devices usingproximity
scanning. Note that proximity scanning requires physical proximity (e.g., up to 10 meters
for Bluetooth Class 2 devices) between an infected device and a target device, whereas
SMS or MMS requires only a network connection between an infected device and the
service gateway for sending messages and worm payload to other devices. Similar to email
viruses, the mobile viruses use social engineering techniques to entice unsuspecting users
to click on infected audio, video or picture attachments. Some examples are:
† The Mabir (2004) worm spreads by selecting addresses of newly-received MMS mes-
sages. The primary damage from Mabir is the transmission of MMS messages.
† Cabir (2004-2005) and its variants replicate over Bluetooth connections, and install
the worm payload as a Symbian System Installation (SSI) file. Cabir drains the power
of the infected phone as it continually scans for other Bluetooth devices nearby.
71
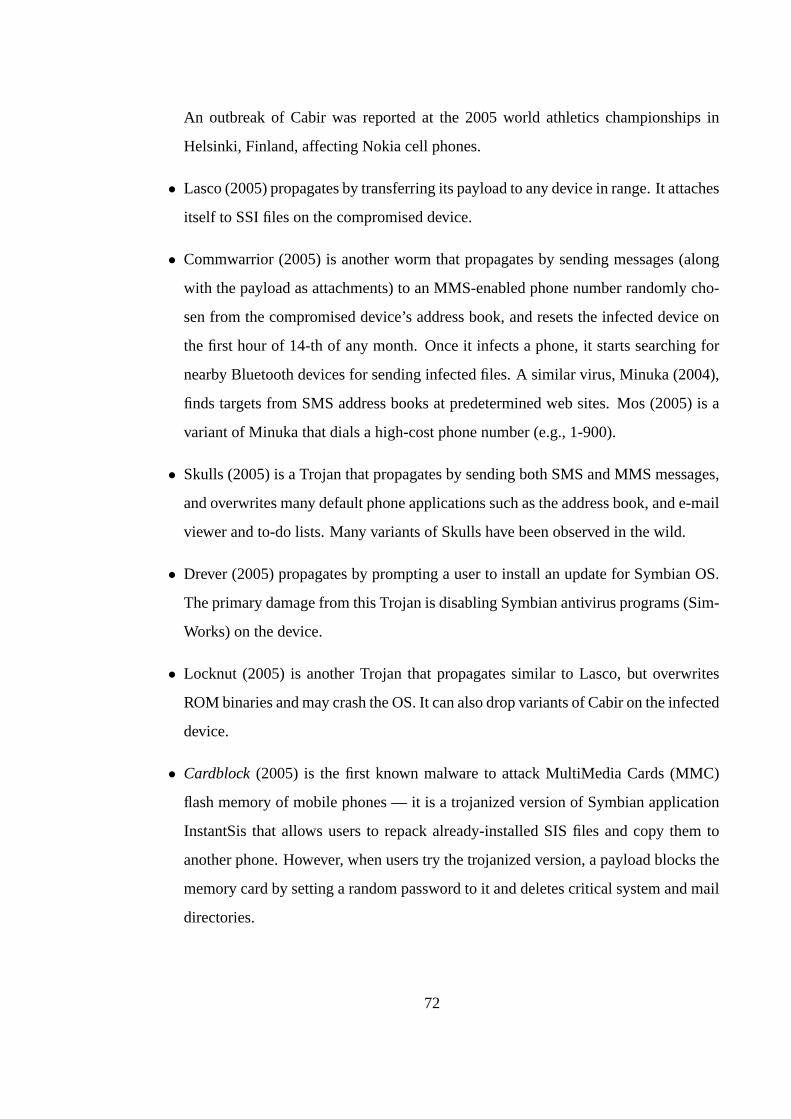
An outbreak of Cabir was reported at the 2005 world athletics championships in
Helsinki, Finland, affecting Nokia cell phones.
† Lasco (2005) propagates by transferring its payload to any device in range. It attaches
itself to SSI files on the compromised device.
† Commwarrior (2005) is another worm that propagates by sending messages (along
with the payload as attachments) to an MMS-enabled phone number randomly cho-
sen from the compromised device’s address book, and resets the infected device on
the first hour of 14-th of any month. Once it infects a phone, it starts searching for
nearby Bluetooth devices for sending infected files. A similar virus, Minuka (2004),
finds targets from SMS address books at predetermined web sites. Mos (2005) is a
variant of Minuka that dials a high-cost phone number (e.g., 1-900).
† Skulls (2005) is a Trojan that propagates by sending both SMS and MMS messages,
and overwrites many default phone applications such as the address book, and e-mail
viewer and to-do lists. Many variants of Skulls have been observed in the wild.
† Drever (2005) propagates by prompting a user to install an update for Symbian OS.
The primary damage from this Trojan is disabling Symbian antivirus programs (Sim-
Works) on the device.
† Locknut (2005) is another Trojan that propagates similar to Lasco, but overwrites
ROM binaries and may crash the OS. It can also drop variants of Cabir on the infected
device.
† Cardblock(2005) is the first known malware to attack MultiMedia Cards (MMC)
flash memory of mobile phones — it is a trojanized version of Symbian application
InstantSis that allows users to repack already-installed SIS files and copy them to
another phone. However, when users try the trojanized version, a payload blocks the
memory card by setting a random password to it and deletes critical system and mail
directories.
72
† The RedbrowserTrojan (2006) is the first malware targeting J2ME (Java 2 Mobile
Edition) phones and represents a major evolution in mobile viruses. Instead of focus-
ing on high-end smart phones running on Symbian or Pocket PC, it works on many
low-end phones with J2ME support. Redbrowser pretends to be a WAP browser
offering free WAP browsing and SMS messages — the purpose is to use a social
engineering technique to fool the user into sending SMS messages. However, it ac-
tually sends a flood of SMS messages to a specific number and therefore, can cause
financial damage to the user.
The example of Redbrowser shows that the emergence of mobile viruses is not unique to
Symbian OS. Another malware, WinCE.Duts (2005) is the first proof-of-concept Windows
CE (Pocket PC) virus infecting only ARM-based devices. It simply appends itself to exe-
cutable files (*.EXE) in the root folder of the device and modifies the program execution
header so that the payload runs first. The virus takes advantage of a vulnerability in the
“coredll” API of Windows CE for appending itself to executables.
4.2.1 Crossover Malware
Before we discuss common behavior vectors of these viruses, we must mention an
emerging class of malware called “crossover” infectors that can spread from mobile devices
to desktop PCs, or vice versa. For example, Cardtrap.A (2005) is a Symbian SIS file
Trojan that disables a number of applications on Nokia series 60 cell phones in addition
to installing variants of skulls and Cabir. However, the most significant characteristics of
Cardtrap is that it also installs three Windows worms (Win32.Rays, Win32.Padobot.Z and
Win32.Cydog.B) onto the device’s memory card. Once the card is inserted into the PC,
Padobot.Z will attempt to start automatically on machines running Windows OS via the
“autorun.ini” file. However, since Windows does not generally support autorun from a
memory card, the current version depends on user interaction to be launched.
Conversely, a recent virus called Crossover (2006) spreads from Windows desktop PCs
to mobile devices running on Windows Mobile Pocket PC. Once it is installed on a Win-
dows PC, the virus makes a copy of itself and adds a registry entry pointing to the new
73
Vulnerability Behavior Vectors Probe Location
Bluetooth B1. Scanning for Bluetooth devices (cached, pre-known, active discovery modes)
B2. Transmission of file over Bluetooth using OBEX of type .sis, .pkg, etc.
F1. Creating a subdirectory under system folder (C:\SYSTEM in Symbian, My Device in
Windows CE)
F2. Overwriting files in system folder with corrupted/damaged/other language files (e.g.
replacing svchost.exe in Windows CE with a similarly named executable)
F3. Installing files in existing Antivirus directory (e.g. \system\apps\AntiVirus in Symbian) in
unsupervised mode
F4. Replacement of system font files
F5. Replacing application icon files
F6. Replacing File Manager Utilities
Filesystem
Modifications
File Infection/ Code Injection
I1. Insert code into executables ( file type, location and size )
I2. Program execution pointer changed
Bluetooth Stack
Filesystem ,
Fonts, Icons, Applications
Filesystem, OS
S1. Accessing critical dynamic-link library modules (e.g. coredll.dll in Windows CE)
S2. Modifying program execution pointer
S3. Running a system process from non-system directory
S4. Installing new application in autostart/ezboot via a module (Symbian)
OS
Networking N1. Opening unregistered (backdoor) TCP ports (e.g. port 2989 in case of Brador)
SMS/MMS M1. Sending of messages to telephone numbers embedded in an executable
M2. Sending of messages to all addresses/telephone numbers in the address book consecutively
Messaging
Network Stack
Operating
System
Figure 4.1: Common behavior vectors of existing mobile viruses
file so that the payload is activated each time the machine is rebooted. It then waits for an
ActiveSync1 connection with the PC. When a connection is detected, it copies itself over
to the Pocket PC device, deletes all files in theMy Documentsdirectory, copies itself to
the system directory and places a link to itself in the startup directory. Current-generation
crossover viruses such as Cardtrap and Crossover are not powerful enough to cause con-
cern at the present time. Nonetheless, these viruses demonstrate the future possibility of
an attacker using a Bluetooth- or SMS/MMS-capable handset to transfer a malicious agent
designed to spread to millions of desktop PCs on the Internet.
4.2.2 Mobile Virus Behavior Vectors
We study the mobile viruses mentioned in Section 4.2 and extract a set of common
behavior patterns of these viruses in terms of their infection and replication actions. Fig-
ure 4.1 presents these behavior vectors along with the appropriate location of any probe that
may capture a given behavior. These probes can collectively monitor the message buffers,
filesystem, service requests, Bluetooth and other network interfaces, for detection of po-
1ActiveSync is an application for synchronizing Pocket PC devices with Windows desktop PCs.
74
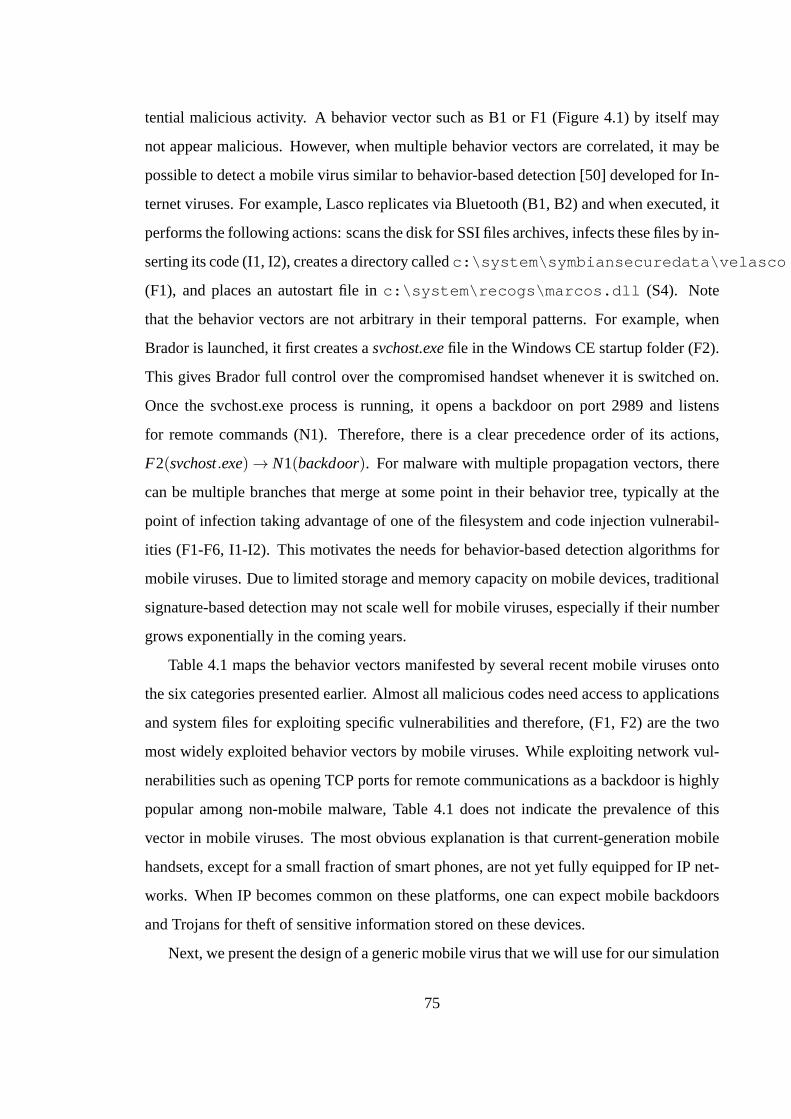
tential malicious activity. A behavior vector such as B1 or F1 (Figure 4.1) by itself may
not appear malicious. However, when multiple behavior vectors are correlated, it may be
possible to detect a mobile virus similar to behavior-based detection [50] developed for In-
ternet viruses. For example, Lasco replicates via Bluetooth (B1, B2) and when executed, it
performs the following actions: scans the disk for SSI files archives, infects these files by in-
serting its code (I1, I2), creates a directory calledc:\system\symbiansecuredata\velasco
(F1), and places an autostart file inc:\system\recogs\marcos.dll (S4). Note
that the behavior vectors are not arbitrary in their temporal patterns. For example, when
Brador is launched, it first creates asvchost.exefile in the Windows CE startup folder (F2).
This gives Brador full control over the compromised handset whenever it is switched on.
Once the svchost.exe process is running, it opens a backdoor on port 2989 and listens
for remote commands (N1). Therefore, there is a clear precedence order of its actions,
F2(svchost:exe) ! N1(backdoor). For malware with multiple propagation vectors, there
can be multiple branches that merge at some point in their behavior tree, typically at the
point of infection taking advantage of one of the filesystem and code injection vulnerabil-
ities (F1-F6, I1-I2). This motivates the needs for behavior-based detection algorithms for
mobile viruses. Due to limited storage and memory capacity on mobile devices, traditional
signature-based detection may not scale well for mobile viruses, especially if their number
grows exponentially in the coming years.
Table 4.1 maps the behavior vectors manifested by several recent mobile viruses onto
the six categories presented earlier. Almost all malicious codes need access to applications
and system files for exploiting specific vulnerabilities and therefore, (F1, F2) are the two
most widely exploited behavior vectors by mobile viruses. While exploiting network vul-
nerabilities such as opening TCP ports for remote communications as a backdoor is highly
popular among non-mobile malware, Table 4.1 does not indicate the prevalence of this
vector in mobile viruses. The most obvious explanation is that current-generation mobile
handsets, except for a small fraction of smart phones, are not yet fully equipped for IP net-
works. When IP becomes common on these platforms, one can expect mobile backdoors
and Trojans for theft of sensitive information stored on these devices.
Next, we present the design of a generic mobile virus that we will use for our simulation
75
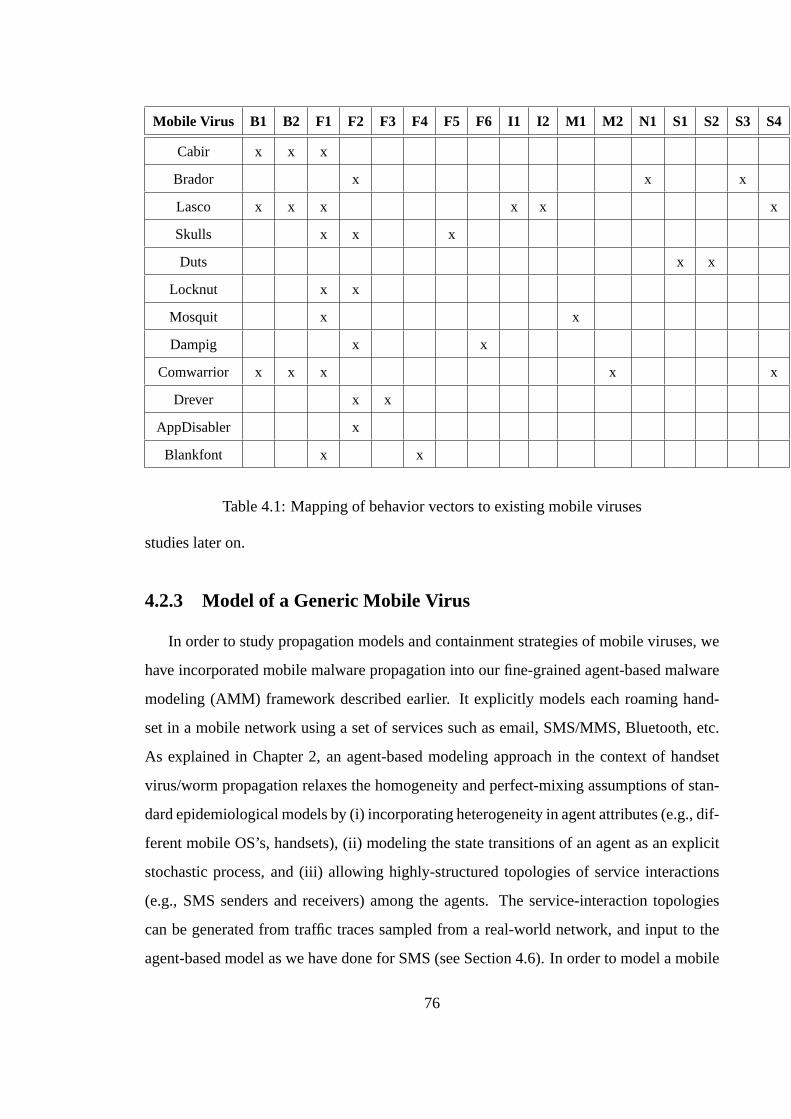
Mobile Virus B1 B2 F1 F2 F3 F4 F5 F6 I1 I2 M1 M2 N1 S1 S2 S3 S4
Cabir x x x
Brador x x x
Lasco x x x x x x
Skulls x x x
Duts x x
Locknut x x
Mosquit x x
Dampig x x
Comwarrior x x x x x
Drever x x
AppDisabler x
Blankfont x x
Table 4.1: Mapping of behavior vectors to existing mobile viruses
studies later on.
4.2.3 Model of a Generic Mobile Virus
In order to study propagation models and containment strategies of mobile viruses, we
have incorporated mobile malware propagation into our fine-grained agent-based malware
modeling (AMM) framework described earlier. It explicitly models each roaming hand-
set in a mobile network using a set of services such as email, SMS/MMS, Bluetooth, etc.
As explained in Chapter 2, an agent-based modeling approach in the context of handset
virus/worm propagation relaxes the homogeneity and perfect-mixing assumptions of stan-
dard epidemiological models by (i) incorporating heterogeneity in agent attributes (e.g., dif-
ferent mobile OS’s, handsets), (ii) modeling the state transitions of an agent as an explicit
stochastic process, and (iii) allowing highly-structured topologies of service interactions
(e.g., SMS senders and receivers) among the agents. The service-interaction topologies
can be generated from traffic traces sampled from a real-world network, and input to the
agent-based model as we have done for SMS (see Section 4.6). In order to model a mobile
76
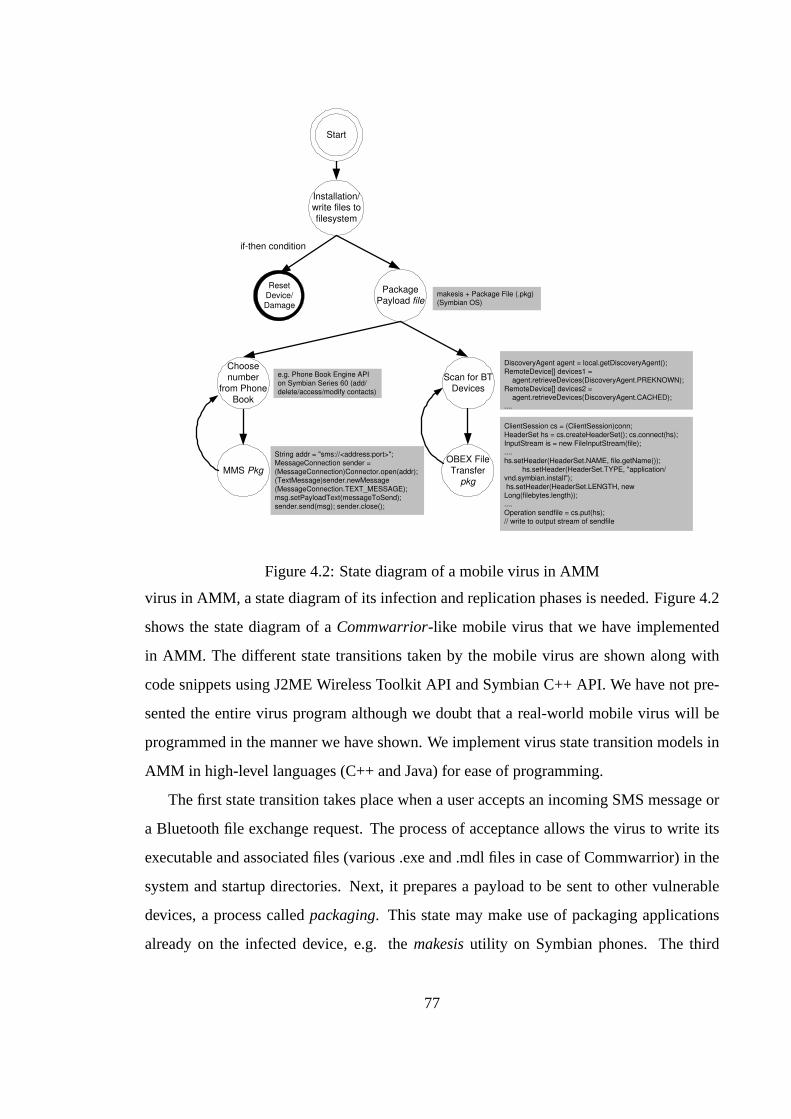
Start
Installation/ write files to
filesystem
Package
Payload file
Scan for BT
Devices
OBEX File
Transfer pkg
Choose number
from Phone Book
MMS Pkg
Reset
Device/
Damage
DiscoveryAgent agent = local.getDiscoveryAgent(); RemoteDevice[] devices1 =
agent.retrieveDevices(DiscoveryAgent.PREKNOWN);
RemoteDevice[] devices2 = agent.retrieveDevices(DiscoveryAgent.CACHED);
....
ClientSession cs = (ClientSession)conn;
HeaderSet hs = cs.createHeaderSet(); cs.connect(hs);
InputStream is = new FileInputStream(file); ....
hs.setHeader(HeaderSet.NAME, file.getName());
hs.setHeader(HeaderSet.TYPE, "application/
vnd.symbian.install"); hs.setHeader(HeaderSet.LENGTH, new
Long(filebytes.length));
.... Operation sendfile = cs.put(hs);
// write to output stream of sendfile
if-then condition
String addr = "sms://<address:port>";
MessageConnection sender =
(MessageConnection)Connector.open(addr); (TextMessage)sender.newMessage
(MessageConnection.TEXT_MESSAGE);
msg.setPayloadText(messageToSend);
sender.send(msg); sender.close();
makesis + Package File (.pkg)
(Symbian OS)
e.g. Phone Book Engine API
on Symbian Series 60 (add/
delete/access/modify contacts)
Figure 4.2: State diagram of a mobile virus in AMM
virus in AMM, a state diagram of its infection and replication phases is needed. Figure 4.2
shows the state diagram of aCommwarrior-like mobile virus that we have implemented
in AMM. The different state transitions taken by the mobile virus are shown along with
code snippets using J2ME Wireless Toolkit API and Symbian C++ API. We have not pre-
sented the entire virus program although we doubt that a real-world mobile virus will be
programmed in the manner we have shown. We implement virus state transition models in
AMM in high-level languages (C++ and Java) for ease of programming.
The first state transition takes place when a user accepts an incoming SMS message or
a Bluetooth file exchange request. The process of acceptance allows the virus to write its
executable and associated files (various .exe and .mdl files in case of Commwarrior) in the
system and startup directories. Next, it prepares a payload to be sent to other vulnerable
devices, a process calledpackaging. This state may make use of packaging applications
already on the infected device, e.g. themakesisutility on Symbian phones. The third
77
transition advances the virus to thetarget acquisition statein which it may use several
propagation vectors, e.g., searching for a nearby Bluetooth device (“Scan for BT devices”)
or finding a contact address from the phone book on the device (“Choose number from
Phone Book”). In case of Bluetooth, it may exploit device addresses already cached or
pre-known (via the pairing process described in Section 4.3) in addition to discovering
nearby device addresses and their available service profiles. Access to the Phone Book can
similarly be made via APIs provided by the device manufacturer or the OS (e.g., Symbian
Series 60 Phone Book Engine API). The next state,payload transfer, comprises the actual
process of sending the payload either via SMS/MMS or Bluetooth (e.g., using the Object
Exchange or OBEX protocol). The target acquisition and payload transfer states can loop
for ever. Note that there is a second transition before the packaging state. Some viruses
may test a condition, most commonly the current time and date, and cause damage to the
handset. For example, Commwarrior.A (the initial version) resets the device if it is the first
hour of the 14-th of any month.
The state diagram in Figure 4.2 and its implementation in AMM provide us with a real-
istic reconstruction of a real-world mobile virus exploiting Bluetooth and SMS, and study
its propagation via simulation. In what follows, we focus on vulnerabilities of Bluetooth
and SMS, before presenting our simulation results in Section 4.6.
4.3 Bluetooth Vulnerabilities
Bluetooth is a short-range radio technology, providing wireless connectivity in ranges
from 10 m (Class 2) to 100 m (Class 1), with throughput up to 723.2 Kbps, or 2.1Mbps
(with enhanced data rates introduced in 2005) using the globally available 2.4GHz radio
band. Each device can simultaneously communicate with up to seven other devices to form
a piconet. Since the Bluetooth Special Interest Group (SIG) [14] was founded in 1998, a
number of enhancements, such as synchronous modes for voice, piconet formation and en-
hanced data rates, have been made to the original standard, making it a popular choice for
interconnecting mobile and handheld devices. One industry research report estimates that
nearly 300 million devices were shipped with Bluetooth enabled in 2005. A recent study
78
from IDC estimates that there will be over 922 million Bluetooth-enabled devices world-
wide by 2008. The primary application area of Bluetooth to date has been in mobile and
wireless consumer products such as mobile phones (nearly 60% of the market), headsets,
mobile printing, hands-free control (e.g. in cars), computer peripherals (e.g., keyboard and
mouse), and for synchronization of handheld devices. With the recent adoption of ultra
wideband (UWB) radio [21] by the Bluetooth SIG, Bluetooth devices will soon be able to
transmit data at a rate similar to USB and firewire, and will allow transmission of high-
definition video to other mobile devices and files for digital music players.
A number of potential vulnerabilities and exploits have been identified with Bluetooth
devices. The authors of [89] proposed an analytical model called probabilistic queuing for
modeling malware spreading in an ad-hoc Bluetooth environment. Although their model
does not consider fading effects and Bluetooth software stack issues, such a model can
be useful to estimate the final size of an epidemic involving a mobile Bluetooth virus.
The Common Vulnerabilities and Exploits (CVE) [15] and National Vulnerability Data-
base [17] have recorded a sharp increase in reported vulnerabilities for several popular
Bluetooth software stacks. The majority of the resulting exploits are due to programming
flaws and incorrect implementation of Bluetooth protocols for pairing, data transfer and
device discovery. We first provide a brief description of the Bluetooth link-layer security
model, and then review the major vulnerabilities.
4.3.1 Bluetooth Security Model
The simplest security mechanism provided by Bluetooth is adevice discoverymode in
which the device is either “discoverable” (i.e., visible to other nearby devices) or “non-
discoverable.” When a mobile virus or worm uses proximity scanning to search for nearby
devices, a “non-discoverable” device hastheoreticalprotection against a Bluetooth-based
attack. It is theoretical because there are techniques to search for devices that are in non-
discoverable mode, as we will describe shortly. Even a non-discoverable device is still
visible to previously-paired devices and users who are familiar with its Bluetooth MAC
address. The device discovery mode with current-generation Bluetooth devices has several
79
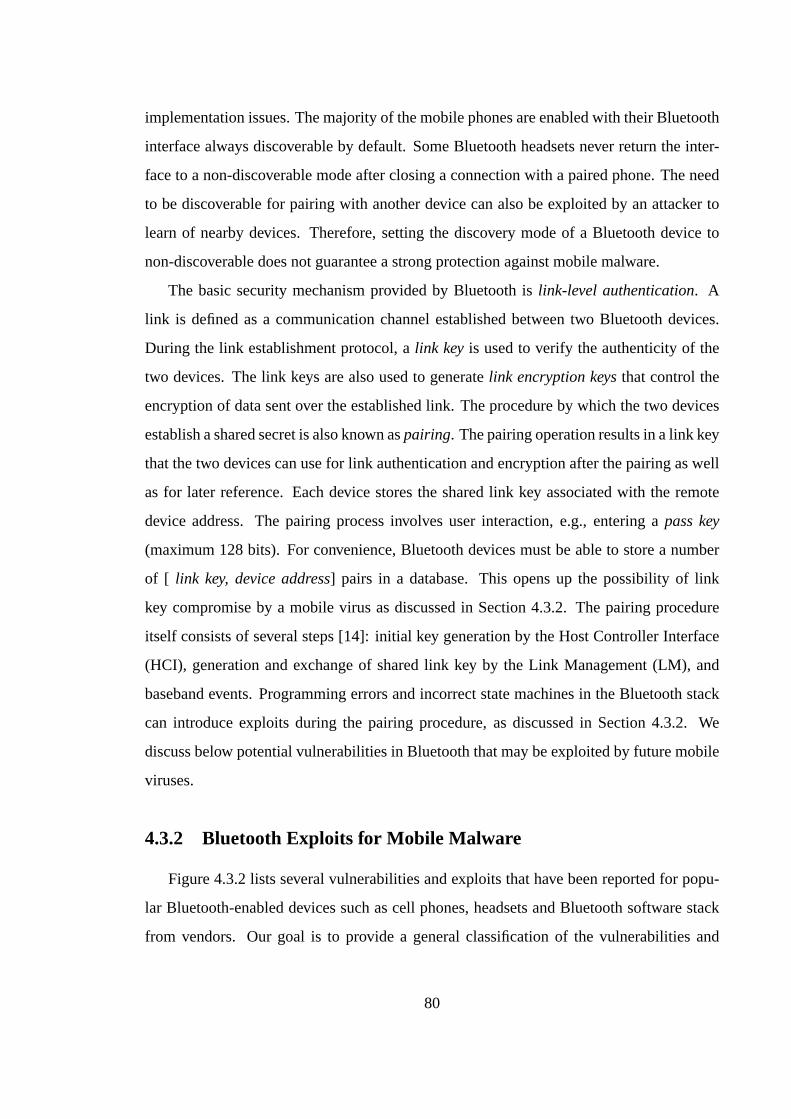
implementation issues. The majority of the mobile phones are enabled with their Bluetooth
interface always discoverable by default. Some Bluetooth headsets never return the inter-
face to a non-discoverable mode after closing a connection with a paired phone. The need
to be discoverable for pairing with another device can also be exploited by an attacker to
learn of nearby devices. Therefore, setting the discovery mode of a Bluetooth device to
non-discoverable does not guarantee a strong protection against mobile malware.
The basic security mechanism provided by Bluetooth islink-level authentication. A
link is defined as a communication channel established between two Bluetooth devices.
During the link establishment protocol, alink key is used to verify the authenticity of the
two devices. The link keys are also used to generatelink encryption keysthat control the
encryption of data sent over the established link. The procedure by which the two devices
establish a shared secret is also known aspairing. The pairing operation results in a link key
that the two devices can use for link authentication and encryption after the pairing as well
as for later reference. Each device stores the shared link key associated with the remote
device address. The pairing process involves user interaction, e.g., entering apass key
(maximum 128 bits). For convenience, Bluetooth devices must be able to store a number
of [ link key, device address] pairs in a database. This opens up the possibility of link
key compromise by a mobile virus as discussed in Section 4.3.2. The pairing procedure
itself consists of several steps [14]: initial key generation by the Host Controller Interface
(HCI), generation and exchange of shared link key by the Link Management (LM), and
baseband events. Programming errors and incorrect state machines in the Bluetooth stack
can introduce exploits during the pairing procedure, as discussed in Section 4.3.2. We
discuss below potential vulnerabilities in Bluetooth that may be exploited by future mobile
viruses.
4.3.2 Bluetooth Exploits for Mobile Malware
Figure 4.3.2 lists several vulnerabilities and exploits that have been reported for popu-
lar Bluetooth-enabled devices such as cell phones, headsets and Bluetooth software stack
from vendors. Our goal is to provide a general classification of the vulnerabilities and
80
Vulnerability Exploit OS/BT Stack Damages
''Blueline'' attack Buffer overflow BT OBEX setpath() Crashes cellular handset
Attacker can access phone book entries, SMS and other personal
information via AT commands
Comments
Pre-attack pairing is required [11]
Pairing not needed for using a BT
service profile
Users can be enticed to grant connection via social
engineering exploits [11]
Malformed user interface when responding to "0x0d" or newline
character
BT Voice Gateway user interface
"Helo Moto" attack on port 8
Incorrect state of "trusted device"
BT OBEX Push Profile and vcard
Attacker can take control of victim device via AT commands
Combination of BlueSnarf and BlueBug attacks [19]
Denial of service (DoS) attack
(device slows down and freezes after a short time).
L2CAP DoS Attack Affects phones from multiple
vendors [ 20,21] Send multiple malformed
(short) L2CAP packets to target device
BT L2CAP layer
(l2cap.c in most BT implementations)
Crashes device (memory stack is corrupted), remote code
execution is possible via
suitably formed packet
OBEX Object Push
buffer overflow
OBEX File Share buffer overflow
Affects devices deploying BT
stack from selected vendor [22,23,24]
Send a long filename
(longer than 256 Bytes) in either ASCII or Unicode
OBEX Object Push
application (Blue Neighbors.EXE)
BT FTP client
Can place trojans in startup and system folders (e.g. worm/virus
payload)
OBEX Object Push directory traversal
Requires victim to grant connection, no filename or
path is presented at the time
of connection request [11]
Can place a file anywhere on victim device regardless of
user-specified path
ussp-push executable
Allows attacker to remotely
inject audio into a victim's speakers, as well as remotely
monitor audio via the
microphone
Remote audio
eavesdropping
Requires special-purpose
software to exploit the vulnerability [16]
Null authentication and
authorization values in Windows registry entries for
BT headset and audio gateway
BT stack/driverfrom
vendor
Denial of service (DoS) attack
(device restarts when it discovers the remote nickname)
Failure to handle exceptions
No known patches, affects a
specific combination of Symbian and Nokia phones
[18]
BT stack in Mobile OS (Symbian)
Malformed BT nickname in remote device
Allows attacker to send any
command string in place of device name, can take
control of victim
Failure to verify
input string
Affected multiple Linux
distributions [17] HCI remote name
request function call in Linux/BT
implementation
Malformed remote device
name request
Crashes BT, may allow root
access via separate exploit Integer underflow
Affected multiple Linux distributions [15]
Linux implementation
of BT (Affix and
Bluez)
No check on sign of protocol
value
Figure 4.3: Vulnerabilities and exploits in Bluetooth (BT)
therefore, we do not mention the specific manufacturer and model names that are affected
by these vulnerabilities. The references cited in the last column of Figure 4.3.2 provide
detailed information on each exploit and names of affected devices. Many of these exploits
can be prevented by downloading the appropriate patches from the Internet. However, it
should be noted that service providers and mobile phone vendors do not currently have
any infrastructure in place to patch an existing Bluetooth software stack on phones when
an exploit is discovered. They typically correct the software flaw in their future phones
and model releases, since any recall of mobile phones is an expensive and time-consuming
process. Therefore, a mobile virus may take advantage of multiple unpatched vulnerabili-
ties in an older Bluetooth stack. The risk can be partially mitigated by installing anti-virus
software for mobile handsets. However, the anti-virus tools do not patch exploits in OS
and Bluetooth software stack — they simply remove the infected files and directories from
the handset. Therefore, it is crucial to developsecure proceduresfor on-demand and over-
81
the-air (OTA) (or over-the-Internet) patching to protect against future mobile attacks. We
discuss the potential exploits and vulnerabilities next.
† Brute-force proximity scanning: There are brute-force techniques such as Red-
Fang [146] that can be used to guess the Bluetooth device identifier (48-bit) of a
remote device. The last 3 bytes of the identifier should be unique to each Blue-
tooth device.2 In practice, some cellular phone manufacturers choose not to assign
a unique Bluetooth identifier to each phone. By reducing the size of the searchable
address space (e.g., when the manufacturer of the remote device is known, i.e., the
device is within the visual range) and by improving the address search algorithm,
it is now possible to find all hidden Bluetooth devices within range in about four
and half days [146]. This means that the spreading rate of a mobile virus based on
current-generation brute-force proximity scanning techniques is relatively low. How-
ever, further reduction in time is possible due to pseudo-random number generators
used for addresses by device manufacturers, and by employing an approach similar
to permutation scanning [144] used by regular Internet worms. The brute-force ap-
proach is not a limiting factor for a malicious attacker who uses a Bluetooth-enabled
device simply to launch a crossover worm or virus (discussed in Section 4.2.1).
† Discovering addresses during communication:Since a Bluetooth device must be
discoverable for pairing with a new device, its address can be recorded by a mali-
cious user during the short time required to complete the pairing process. In many
Bluetooth implementations, when a remote device is discovered, its address (device
identifier) is not shown along with the device name. Since a device name can be eas-
ily forged by a malicious user, the remote user may think of it as a legitimate device
in the network. A variation of this attack works very similarly to attacks involving
setting up a fake public wireless LAN (WLAN) access point (AP) for enticing un-
suspecting users. A malicious Bluetooth AP can accept connection requests from
Bluetooth devices and record their addresses and paired link keys.
† Compromise of link key database:If a malicious agent gains root access on a Blue-
2The first 3 bytes of the address are specific to each manufacturer and are assigned by IEEE.
82
tooth device using a known exploit (e.g., the integer underflow exploit in Figure 4.3),
it may be able to read the stored [link key, device address] pairs, effectively gain-
ing access to a set of previously-paired devices. Finding victim hosts in this manner
is very similar to an email- or instant messaging (IM) worm obtaining addresses of
potential victims from an address book or buddy lists on the compromised host.
† Software errors:Software and programming errors such as improper exception han-
dling, buffer overflows, integer underflows, etc., can make the Bluetooth software
stack highly vulnerable to remote attacks. We have highlighted several vulnerabili-
ties [9, 11, 16, 19] of this type in Figure 4.3. For example, in one Bluetooth imple-
mentation, failure to check the received remote device name allowed an attacker to
send any command string in place of the remote device name and therefore, take
control of the device via a known root exploit. Software errors, in particular an ap-
plication’s failure to properly bound-check user-supplied input data, remain one of
the most popular and effective exploits by Internet virus writers.
† Incorrect protocol handling: Incorrect protocol handling is another vulnerability
that can be exploited by a mobile virus. The most notable vulnerabilities of this type
are found in the Logical Link Control and Adaptation Protocol (L2CAP) layer [6, 18,
20] and Object Exchange (OBEX) protocol [8, 10, 13] of certain Bluetooth software
stack (see Figure 4.3). These vulnerabilities can be exploited to launch Denial of
Service (DoS) attacks or crash the target device.
4.4 SMS/MMS Vulnerabilities
Unlike proximity scanning whose range is limited to a small area, mobile viruses that
exploit Short (SMS) or Multimedia Messaging Service (MMS) to spread to other devices
are capable of causing worldwide damage, similar to the scale of attacks seen on the Inter-
net. This is because the structure of real-world SMS/MMS networks resembles a scale-free
topology similar to email and IM networks, as we will see in Section 4.6. The primary
reason why we have not witnessed any large-scale attacks involving SMS is a limit on the
83
size of messages (up to 160 B) that can be sent via SMS. An MMS message does not have
a size limit unless imposed by a service provider (typically up to 300 KB). While SMS
messages are primarily restricted to text, MMS messages can have embedded text, audio
(MP3, MIDI), images (JPEG, GIF) and video (MPEG). For example, the payload size of
Commwarrior is 27 KB which can be easily sent to another phone as an MMS attachment.
Before discussing the vulnerabilities, a short discussion of the SMS messaging system
is in order. When a mobile user sends a message from a handset (i.e., Mobile Originated or
MO) or a web-based gateway to another phone number, the message is received by the Base
Station System (BSS) of the service provider. The BSS then forwards the message to the
Mobile Switching Center (MSC). Upon receiving a MO message, the MSC sends the end-
user information to the Visitor Location Register (VLR) of the cell and performs checks
on the message for any violation. It then forwards the message to the Short Messaging
Service Center (SMSC) of the provider. The SMSC stores the messages in a queue, records
the transaction in the network billing system and sends a confirmation back to the MSC.
The status of the message is changed from MO to Mobile Terminated (MT) at this point.
Through a series of steps, the message is then forwarded by SMSC to the receiving user’s
MSC. The MSC receives the subscriber information from the VLR and finally forwards the
message to the receiving handset. The store-forward nature of SMS makes it vulnerable to
Denial of Service (DoS) attacks, as demonstrated by a recent study [52]. In the following,
we focus on vulnerabilities that can be exploited by a future mobile virus.
† SMS gateway errors:Many wireless providers allow Internet users to send short
text messages directly to their mobile phone subscribers via a web-based SMS gate-
way. When not designed correctly, such a gateway opens the door to send large
volumes of SMS spams and other malicious content. These gateways can benefit by
using a visual challenge-response test such as CAPTCHA (Completely Automated
Public Turing test to tell Computers and Humans Apart) [136] to prevent automated
spam generators from using the system. However, implementation errors, e.g. by
not having enough characters in the CAPTCHA image, can make the SMS gateway
vulnerable to brute-force attacks.
84
† Software errors:SMS/MMS systems can suffer from software vulnerabilities in em-
bedded objects such as images or video. For example, a vulnerability in GIF image
execution function [7] in MSN Messenger 6.2 could allow a remote attacker to ex-
ecute arbitrary code caused by improper bounds checking of user-supplied input in
the width and height fields of a GIF image file. MPEG stream buffer overflows due
to incorrect bound checking in MPEG players have also been reported — this can
be exploited by invoking a vulnerable MPEG player within MMS. Similarly, a de-
sign flaw in the graphical user interface (GUI) of the Java API on a particular mobile
phone allowed remote attackers to send unauthorized SMS messages by overlaying a
confirmation message with a malicious message [5]. Successful exploits of software
errors may allow a mobile virus to send unauthorized messages and execute arbitrary
machine code within the context of the SMS/MMS application on the handset.
† SMS spoofing attacks:SMS address spoofing is an emerging threat that allows a
malicious agent to make an SMS message appear as though it came from a different
user and network. This is similar to how email spams and spam relays work. The
SMS web-based gateways can also be exploited to spoof the message’s origin. There
appears to be even an open-source tool on the Internet called “SMS Spoof” for Palm
OS that allows any user to send spoofed messages through any SMSC supporting the
EMI/UCP protocol.
4.5 AMM for SMS and Bluetooth Threats
In this section, we briefly discuss capabilities added to the agent-based malware mod-
eling (AMM) framework that we described in Chapter 2 to investigate mobile viruses ex-
ploiting SMS, MMS and Bluetooth vulnerabilities on cellular handsets. We added a SMS
Center (SMSC) as a gateway for all SMS messages exchanged among the handsets in the
cellular network. The agent services consist of client programs for SMS/MMS messaging,
whereas the SMSC agent consists of a store-and-forward server only. As before, there are
two types of topologies in our simulation environment. Thephysicalconnectivity is deter-
85
mined by the cellular network infrastructure (base stations and SMSC) and movement of
the agents, whereas thelogical connectivity is determined by the SMS messages exchanged
among the agents, and the Bluetooth piconet formations.
The SMS/MMS service topologies are extracted from traces collected from a real-world
cellular network, as we have used in our simulation results. The inclusion of a state diagram
of the mobile virus results in a more realistic epidemic spreading in AMM. An alternative
is to simply input the topology of a particular service such as SMS, and consider all nodes
in the graph equally vulnerable to a SMS virus. The spread of the epidemic in this case
solely depends on a constant infection probability and the topology of the SMS network.
While most modeling literature on malware spreading that exploits specific services such
as email or IM follows this methodology, this simulates only the worst-case attack scenario
and may not represent the true spreading of the epidemic within the network.
SMS infection model: The SMS infection model has the following parameters: message
sending rates (ns(Ncs)), message receiving rates (nr(Ncs)), cumulative density functions
(cdf) of user-to-user message size (B) and message service time (Tssms), and the SMS user
topology (G(Ncs;Ecs)), whereNcs andEcs represent the total number of cellular subscribers
in the network and the number of service-interaction edges, respectively. We also introduce
two parameters describing the malicious agent: malicious agent messaging rate (ms(Ics))
for the set of infected mobile users (Ics) and a probability of clicking on an infected message
(Prsms). In the absence of traces collected during an actual occurrence of a mobile worm or
virus, one has to estimate these two parameters.
4.6 Simulation of a Mobile Virus
In this section, we present simulation results for propagation of a generic mobile virus
developed in Section 4.2.3 and implemented in AMM. Our goal is to study the epidemic
growth rate of a mobile virus in a realistic messaging network. The mobile virus uses both
SMS and Bluetooth to spread to other devices. To the best of our knowledge, there does not
exist any malware propagation model using SMS/MMS services in a cellular network. A
recent study [107] of SMS usage characterization collected call data records and SS7 traces
86
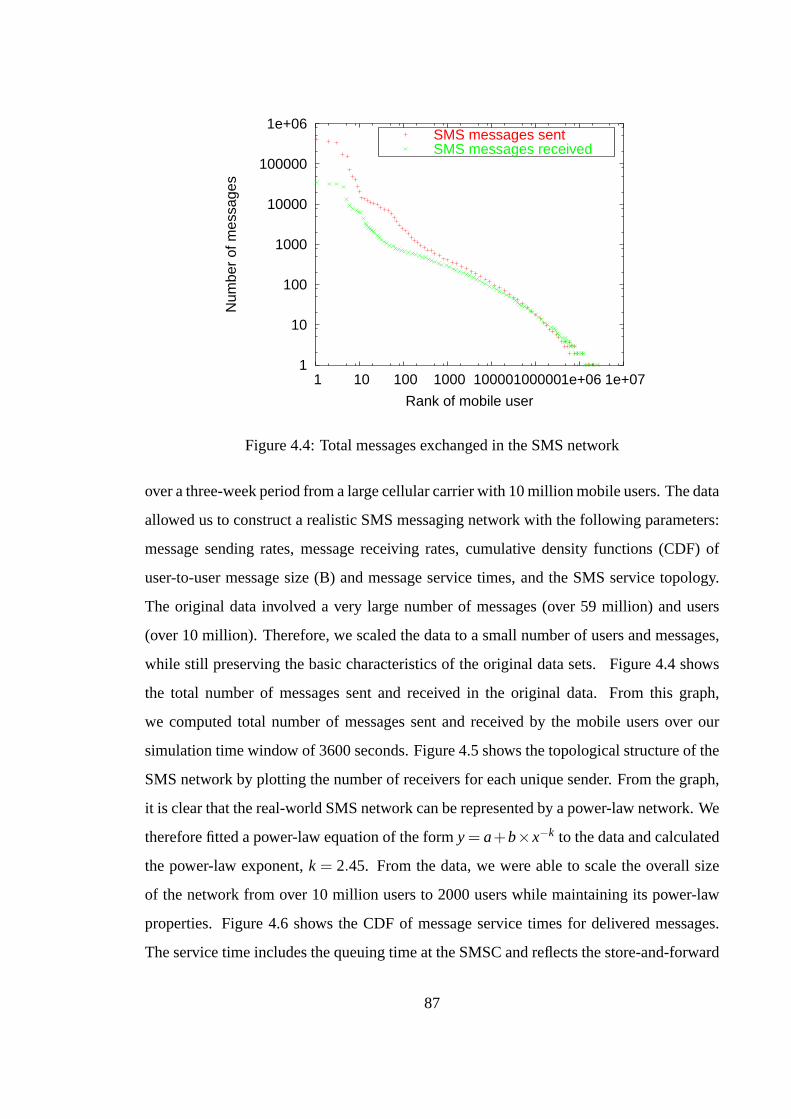
1
10
100
1000
10000
100000
1e+06
1 10 100 1000 10000 100000 1e+06 1e+07
Num
ber
of m
essa
ges
Rank of mobile user
SMS messages sentSMS messages received
Figure 4.4: Total messages exchanged in the SMS network
over a three-week period from a large cellular carrier with 10 million mobile users. The data
allowed us to construct a realistic SMS messaging network with the following parameters:
message sending rates, message receiving rates, cumulative density functions (CDF) of
user-to-user message size (B) and message service times, and the SMS service topology.
The original data involved a very large number of messages (over 59 million) and users
(over 10 million). Therefore, we scaled the data to a small number of users and messages,
while still preserving the basic characteristics of the original data sets. Figure 4.4 shows
the total number of messages sent and received in the original data. From this graph,
we computed total number of messages sent and received by the mobile users over our
simulation time window of 3600 seconds. Figure 4.5 shows the topological structure of the
SMS network by plotting the number of receivers for each unique sender. From the graph,
it is clear that the real-world SMS network can be represented by a power-law network. We
therefore fitted a power-law equation of the formy = a+b£x¡k to the data and calculated
the power-law exponent,k = 2:45. From the data, we were able to scale the overall size
of the network from over 10 million users to2000users while maintaining its power-law
properties. Figure 4.6 shows the CDF of message service times for delivered messages.
The service time includes the queuing time at the SMSC and reflects the store-and-forward
87
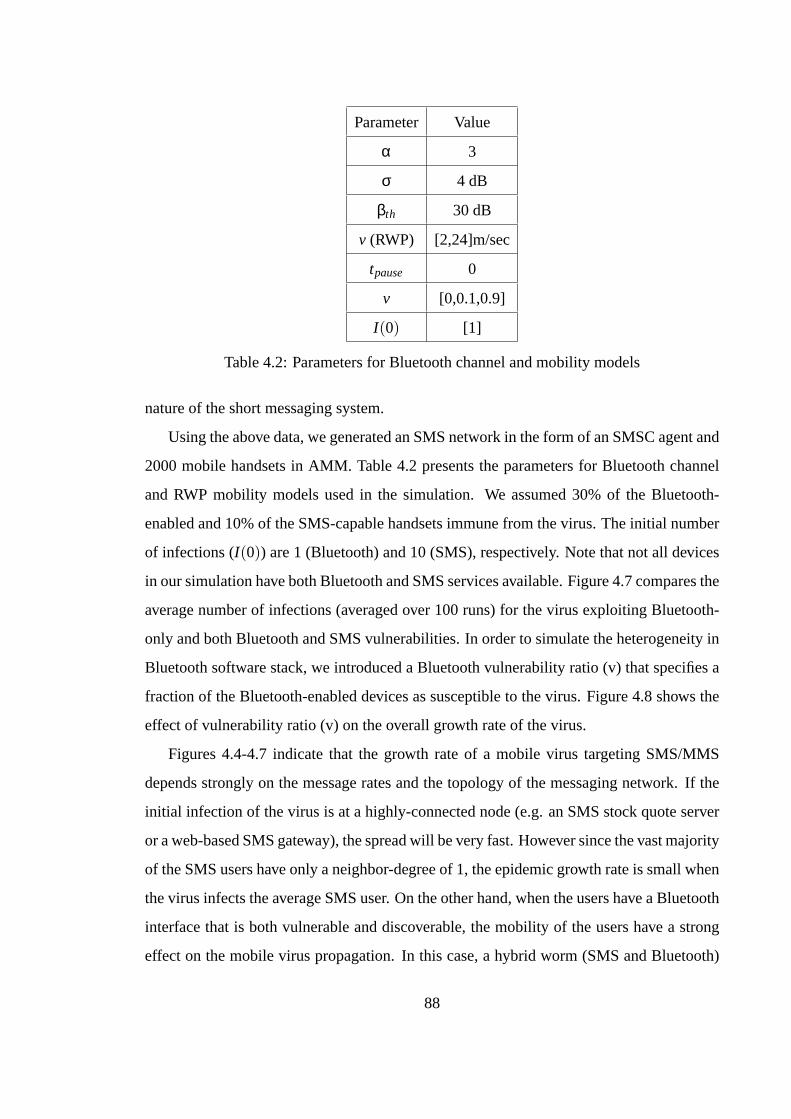
Parameter Value
α 3
σ 4 dB
βth 30 dB
v (RWP) [2,24]m/sec
tpause 0
v [0,0.1,0.9]
I(0) [1]
Table 4.2: Parameters for Bluetooth channel and mobility models
nature of the short messaging system.
Using the above data, we generated an SMS network in the form of an SMSC agent and
2000 mobile handsets in AMM. Table 4.2 presents the parameters for Bluetooth channel
and RWP mobility models used in the simulation. We assumed 30% of the Bluetooth-
enabled and 10% of the SMS-capable handsets immune from the virus. The initial number
of infections (I(0)) are 1 (Bluetooth) and 10 (SMS), respectively. Note that not all devices
in our simulation have both Bluetooth and SMS services available. Figure 4.7 compares the
average number of infections (averaged over 100 runs) for the virus exploiting Bluetooth-
only and both Bluetooth and SMS vulnerabilities. In order to simulate the heterogeneity in
Bluetooth software stack, we introduced a Bluetooth vulnerability ratio (v) that specifies a
fraction of the Bluetooth-enabled devices as susceptible to the virus. Figure 4.8 shows the
effect of vulnerability ratio (v) on the overall growth rate of the virus.
Figures 4.4-4.7 indicate that the growth rate of a mobile virus targeting SMS/MMS
depends strongly on the message rates and the topology of the messaging network. If the
initial infection of the virus is at a highly-connected node (e.g. an SMS stock quote server
or a web-based SMS gateway), the spread will be very fast. However since the vast majority
of the SMS users have only a neighbor-degree of 1, the epidemic growth rate is small when
the virus infects the average SMS user. On the other hand, when the users have a Bluetooth
interface that is both vulnerable and discoverable, the mobility of the users have a strong
effect on the mobile virus propagation. In this case, a hybrid worm (SMS and Bluetooth)
88
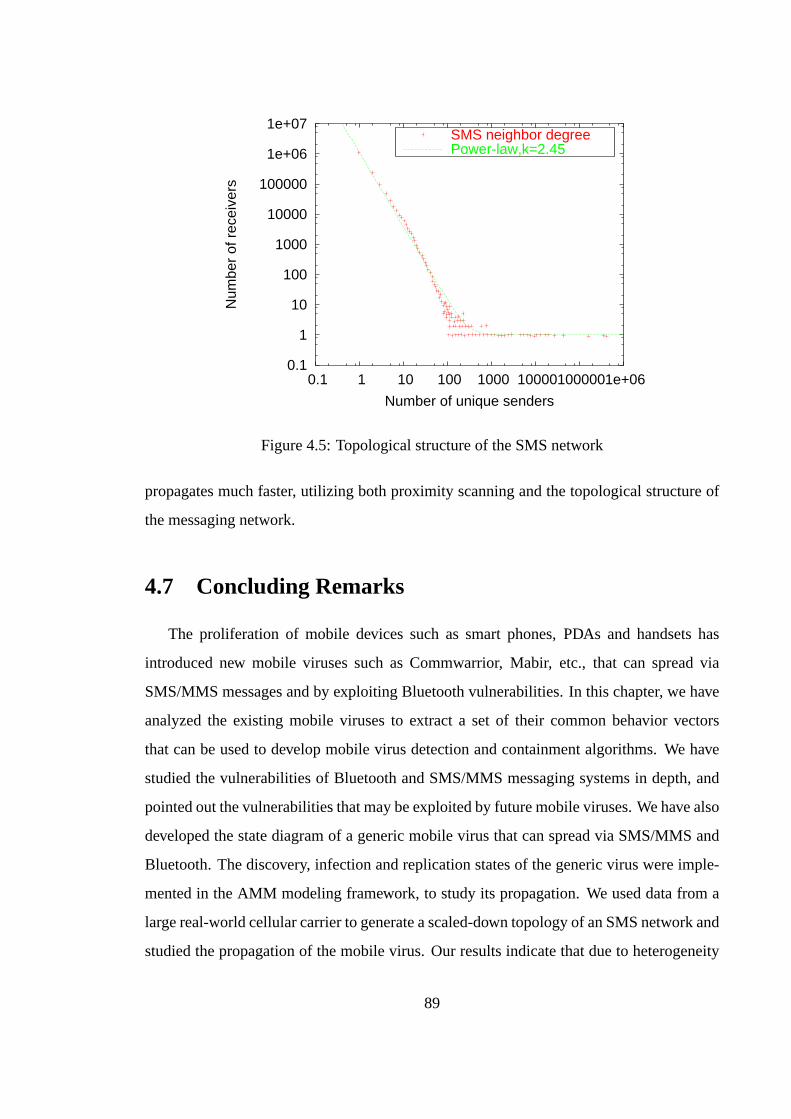
0.1
1
10
100
1000
10000
100000
1e+06
1e+07
0.1 1 10 100 1000 10000 100000 1e+06
Num
ber
of r
ecei
vers
Number of unique senders
SMS neighbor degreePower-law,k=2.45
Figure 4.5: Topological structure of the SMS network
propagates much faster, utilizing both proximity scanning and the topological structure of
the messaging network.
4.7 Concluding Remarks
The proliferation of mobile devices such as smart phones, PDAs and handsets has
introduced new mobile viruses such as Commwarrior, Mabir, etc., that can spread via
SMS/MMS messages and by exploiting Bluetooth vulnerabilities. In this chapter, we have
analyzed the existing mobile viruses to extract a set of their common behavior vectors
that can be used to develop mobile virus detection and containment algorithms. We have
studied the vulnerabilities of Bluetooth and SMS/MMS messaging systems in depth, and
pointed out the vulnerabilities that may be exploited by future mobile viruses. We have also
developed the state diagram of a generic mobile virus that can spread via SMS/MMS and
Bluetooth. The discovery, infection and replication states of the generic virus were imple-
mented in the AMM modeling framework, to study its propagation. We used data from a
large real-world cellular carrier to generate a scaled-down topology of an SMS network and
studied the propagation of the mobile virus. Our results indicate that due to heterogeneity
89
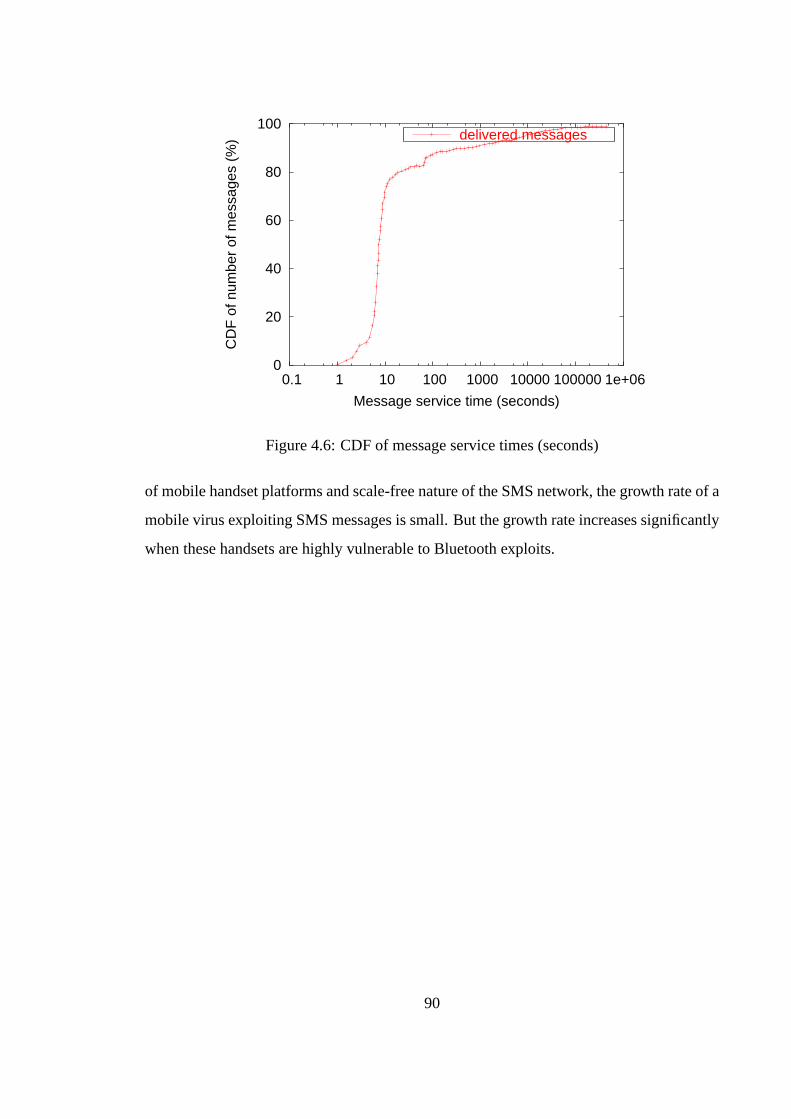
0
20
40
60
80
100
0.1 1 10 100 1000 10000 100000 1e+06
CD
F o
f num
ber
of m
essa
ges
(%)
Message service time (seconds)
delivered messages
Figure 4.6: CDF of message service times (seconds)
of mobile handset platforms and scale-free nature of the SMS network, the growth rate of a
mobile virus exploiting SMS messages is small. But the growth rate increases significantly
when these handsets are highly vulnerable to Bluetooth exploits.
90
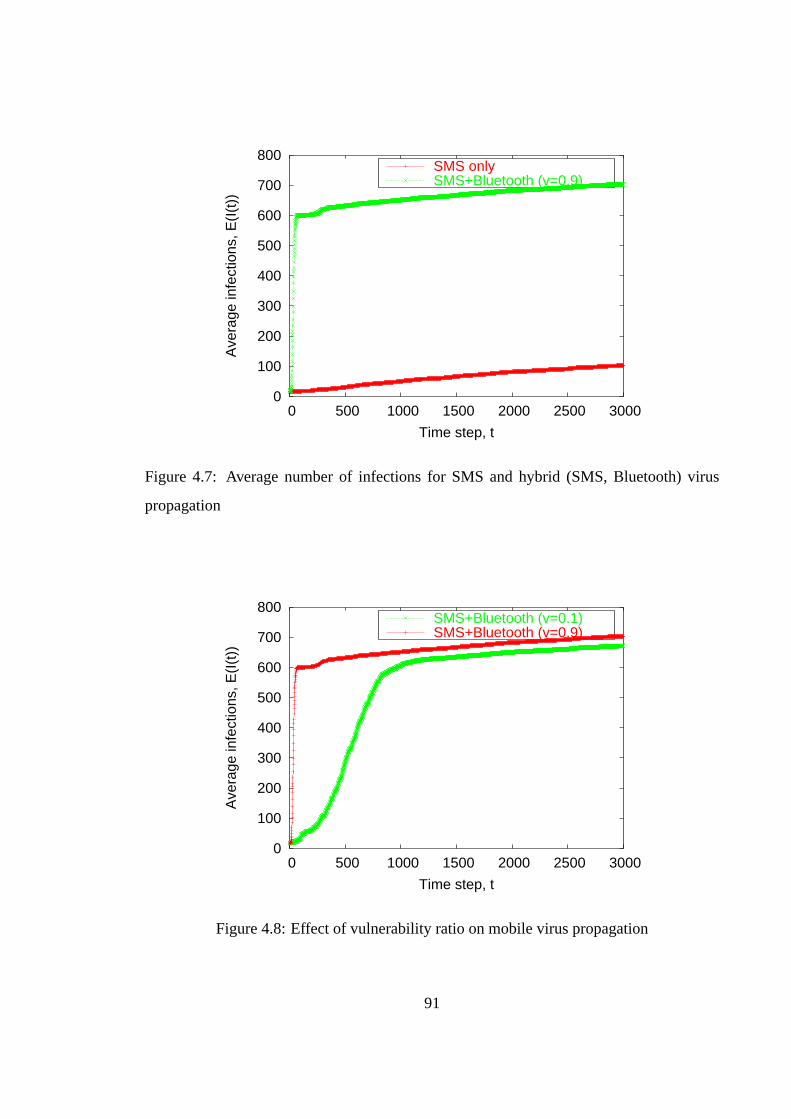
0
100
200
300
400
500
600
700
800
0 500 1000 1500 2000 2500 3000
Ave
rage
infe
ctio
ns, E
(I(t
))
Time step, t
SMS onlySMS+Bluetooth (v=0.9)
Figure 4.7: Average number of infections for SMS and hybrid (SMS, Bluetooth) virus
propagation
0
100
200
300
400
500
600
700
800
0 500 1000 1500 2000 2500 3000
Ave
rage
infe
ctio
ns, E
(I(t
))
Time step, t
SMS+Bluetooth (v=0.1)SMS+Bluetooth (v=0.9)
Figure 4.8: Effect of vulnerability ratio on mobile virus propagation
91
CHAPTER 5
Behavioral Detection of Mobile Malware
5.1 Introduction
Although there has not been a major worldwide outbreak of mobile malware, which
make most people mistakenly think that mobile malware exist only in the labs of anti-virus
companies, the threats posed by mobile malware are far more realistic and mobile handsets
are expected to increasingly become targets of these malware [75]. For example, in less
than one year, the infection of both Cabir and Commwarrior worms have been reported in
more than 20 countries [79] and 0.5–1.5% of MMS traffic in a Russian mobile network is
made up of infected messages (which is already close to the fraction of malicious code in
email traffic) [80]. In response to this increasing threat, a number of handset manufacturers
and network operators have partnered with security software vendors to offer anti-virus
programs for mobile devices [39, 41, 67]. However, current anti-virus solutions for mobile
devices rely primarily on signature-based detection and are thus useful mostly for post-
infection cleanup. For example, if a handset is infected with a mobile virus, these tools can
be used to scan thesystemdirectory for the presence of files with specific extensions (e.g.,
.APP, .RSC and .MDL in Symbian-based devices) typical of virus payload. Although the
infected files are deleted by the anti-virus tool, the underlying vulnerability —overwriting
the system directory— is notpatched. As a result, a cleaned handset may get infected again
by another instance of the same virus, requiring repeated cleanup. Another approach is to
only trust and install digitally signed applications on the phone. For example, the Symbian
92
Signed [126] framework derives a unique application certificate from the Symbian Root
certificate issued by its Certificate Authority (CA) for signing an application. When a
signed application is installed, the Symbian installer program verifies that the signature is
valid before proceeding with the installation. This ensures that the software has not been
tampered with during its distribution and has undergone a standard testing procedure as
part of being Symbian Signed. However, given the vast number of mobile applications
available on the Internet, especially peer-to-peer sites, one can not expect all applications
to be signed with a certificate.1 An application that has been self-signed cannot be trusted
to be free of malicious code. Moreover, even when an application is signed by a trusted CA,
a malicious program can still enter the system via downloads (e.g., SMS/MMS messages
with multimedia attachments), and it may exploit known vulnerabilities of an unsigned
helper application.
Several important differences exist between mobile environments and traditional desk-
top settings, making the conventional anti-virus solutions unsuitable for mobile devices.
First, mobile devices generally have limited resources such as CPU, memory, and battery
power. Although handsets’ CPU speed and memory capacity have been increasing signif-
icantly at low cost in recent years, they are much less than their desktop counterpart. In
particular, energy-efficiency is perhaps the most critical issue for battery-powered handsets
that limits innovations in mobile devices. Since the signature-based approach must check
if each derived signature matches any signature in the malware database, it will not be effi-
cient for resource-constrained mobile devices, especially in view of the fact that their mal-
ware threats will grow at a very fast rate with soon-to-emerge all IP mobile devices based
on Wibro and WiMAX technologies. The emergence of crossover worms and viruses [54]
that infect a handset when it is connected to a desktop for synchronization (and vice versa)
requires mobile applications and data to be checked against both traditional as well as mo-
bile virus signatures. Furthermore, signature-based checking can be easily evaded with the
help from simple obfuscation, polymorphism and packing techniques [36, 93], thus requir-
ing a new signature for almost every single malware variant. These all limit the extent
to which the signature-based approach can be deployed on resource-constrained handsets.
1Currently, very few operators lock down handsets to prevent users from installing unsigned applications.
93
Second, most published studies [43, 109, 114, 157] on the detection of Internet malware
have focused on their network signatures (i.e., scanning, failed connection, and DNS re-
quest). However, due to the mobility of devices and the relatively closed nature of cellular
networks, constructing network signatures of mobile malware is extremely difficult. In
addition, the emergence of mobile malware that spread via non-traditional vectors (i.e.
SMS/MMS messaging and Bluetooth [30, 52]) makes possible malware outbreak whose
progress closely tracks human mobility patterns [75] and hence require novel detection
methods. Also, compared to traditional OSes, Symbian and other mobile OSes have im-
portant differences in the way file permissions and modifications to the OS are handled.
Thus considering all these differences, a low-overhead classifier that accounts for new mal-
ware behaviors is more suitable for mobile phone settings, and the goal of this work is to
develop such a detection framework that overcomes the limitations of the signature-based
approach while addressing unique features and limitations of the mobile environment.
An alternative to signature-based methods,behavioral detection[49], has emerged as
a promising way of preventing the intrusion of spyware, viruses and worms. In behav-
ioral detection, the run-time behavior of an application (e.g., file accesses, API calls) is
monitored and compared against a set of malicious and/or normal behavior profiles. The
malicious behavior profiles can be specified as global rules that apply to all applications,
as well as fine-grained application-specific rules. Behavioral detection is more resilient to
polymorphic worms [98] or code obfuscation, because it assesses the effects of an applica-
tion based on more than just specific payload signatures. For example, a widely-used poly-
morphism technique is the program packer that encrypts the executable file and decrypts
it before its execution. Since encryption/decryption does not alter the malware behavior,
multiple malware variants generated via executable packers e.g., UPX[4] can be detected
with a single behavior specification. As a result, a typical database of behavior profiles and
rules should be smaller than that needed for storing specific payload signatures of many
different classes of malware. This makes behavioral detection methods particularly suit-
able for handsets. Moreover, behavioral detection has potential for detecting new malware
and zero-day [140] worms, since many new malware are constructed by adding new be-
haviors to existing malware [87] or replacing the obsolete modules with fresh components.
94
Consequently, they share similar behavior patterns with existing malware.
However, there are two challenges in deploying behavioral detection. The first isspeci-
ficationof what constitutes normal or malicious behavior that covers a wide range of appli-
cations, while keeping false positives low. The second ison-line reconstructionof poten-
tially suspicious behavior from the run-time behavior of applications, so that the observed
signatures can be matched against a database of normal and malicious signatures. The
main contribution of our work is to overcome these two challenges in the mobile operating
environment.
The starting point of our approach is to generate a catalog of malicious behavior signa-
tures by examining the behavior of current-generation mobile viruses, worms and Trojans
that have thus far been reported in the wild. We specify an application behavior as a col-
lection of system events and resource-access attempts made by programs, interposed by a
temporal logic called thetemporal logic of causal knowledge(TLCK). Monitoring system
call events and file accesses have been used successfully in intrusion detection [59, 60] and
backtracking [74]. In our approach, we reconstruct higher-level behavior signatures on-
line from lower-level system calls and file accesses, much like how individual pieces are
put together to form a jigsaw puzzle. The TLCK-based behavior specification addresses
the first challenge of behavioral detection, by providing a compact “spatial-temporal” rep-
resentation of program behavior. The next step is fast and accurate reconstruction of these
signatures during run-time by monitoring system calls and resource accesses so that ap-
propriate alerts can be generated. This overcomes the second challenge for deployment of
behavioral detection in mobile handsets. In order to detect malicious programs from their
partial or incomplete behavior signatures (e.g., new worms that share only partial behav-
iors with known worms), we train a machining learning classifier calledSupport Vector
Machines(SVMs) [35, 63] withbothnormal and malicious behaviors, so that partial sig-
natures for malicious behavior can be classified from those of normal applications running
on the handset. For real-life deployment, the resulting SVM model and the malicious sig-
nature database are preloaded onto the handset by either the handset manufacturer or a
cellular service provider. These are updated only when new behaviors (i.e., not minor vari-
ants of current malware) are discovered. The updating process is similar to how anti-virus
95
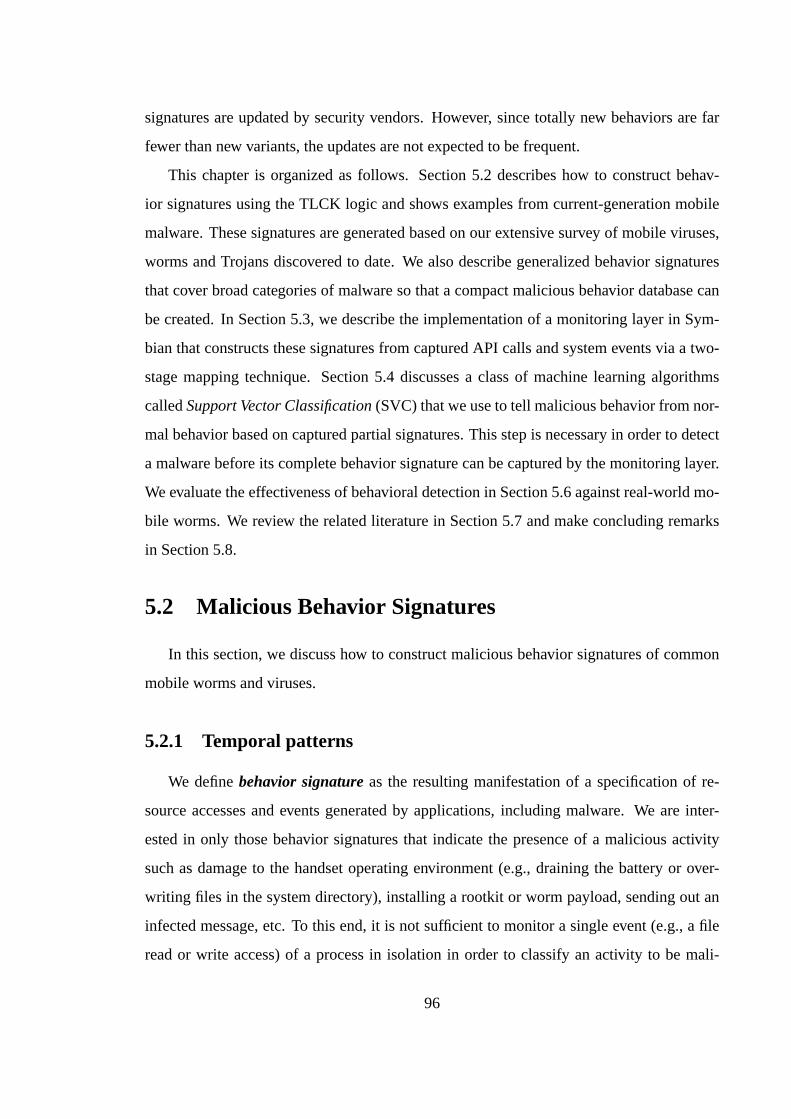
signatures are updated by security vendors. However, since totally new behaviors are far
fewer than new variants, the updates are not expected to be frequent.
This chapter is organized as follows. Section 5.2 describes how to construct behav-
ior signatures using the TLCK logic and shows examples from current-generation mobile
malware. These signatures are generated based on our extensive survey of mobile viruses,
worms and Trojans discovered to date. We also describe generalized behavior signatures
that cover broad categories of malware so that a compact malicious behavior database can
be created. In Section 5.3, we describe the implementation of a monitoring layer in Sym-
bian that constructs these signatures from captured API calls and system events via a two-
stage mapping technique. Section 5.4 discusses a class of machine learning algorithms
calledSupport Vector Classification(SVC) that we use to tell malicious behavior from nor-
mal behavior based on captured partial signatures. This step is necessary in order to detect
a malware before its complete behavior signature can be captured by the monitoring layer.
We evaluate the effectiveness of behavioral detection in Section 5.6 against real-world mo-
bile worms. We review the related literature in Section 5.7 and make concluding remarks
in Section 5.8.
5.2 Malicious Behavior Signatures
In this section, we discuss how to construct malicious behavior signatures of common
mobile worms and viruses.
5.2.1 Temporal patterns
We definebehavior signatureas the resulting manifestation of a specification of re-
source accesses and events generated by applications, including malware. We are inter-
ested in only those behavior signatures that indicate the presence of a malicious activity
such as damage to the handset operating environment (e.g., draining the battery or over-
writing files in the system directory), installing a rootkit or worm payload, sending out an
infected message, etc. To this end, it is not sufficient to monitor a single event (e.g., a file
read or write access) of a process in isolation in order to classify an activity to be mali-
96
cious. In fact, there are many steps a malicious worm or virus performs in the course of its
life-cycle that may appear to be harmless when analyzed in isolation. However, a logical
ordering of these steps over time often clearly reveals the malicious intent. Thetemporal
pattern—i.e., the precedence order of these events and resource accesses in time—is there-
fore key to detecting such malicious intent. For example, consider a simple file transfer
by calling the Bluetooth OBEX system call (e.g.,CObexClient::Put()and related OBEX
operations) in Symbian. This is often used by applications for exchanging data such as
games and music files among nearby handsets. On their own, any such calls will appear
to be harmless. However, when the received file is of type.SIS(Symbian installation file)
andthat file is later executed,andthe installer process seeks to overwrite files in thesystem
directory, we can say with a high degree of certainty that the handset has been infected by
a virus such as Mabir [123] or Commwarrior [122]. With subsequent monitoring of the
files and processes touched by the above activities, the confidence level of detection can
be improved further. This means that if we view the handset as a system exhibiting a wide
range of behaviors over time, we can classify some of the temporal manifestations of these
behaviors as malicious. Note that therealizationof specific behaviors is dependent on how
a user interacts with the handset and the specific implementation (e.g., infection vectors)
of a malware. However, thespecificationof temporal manifestation of malicious behaviors
can still be prescribeda priori by considering their effects on the handset resources and the
environment. This is why behavioral detection is more resilient to code obfuscation and
polymorphism than the signature-based detection.
A simple representation of malicious behavior can be given by ordering the correspond-
ing actions using a vector clock [81] and applying the “and” operator to the actions. How-
ever, for more complex behavior that requires complicated temporal relationships among
actions performed by different processes, simple temporal representations may not be suffi-
cient. This suggests that behavior signatures are best specified using temporal logic instead
of classical propositional logic. Propositional logic supports reasoning with statements that
evaluate to be either true or false. On the other hand, temporal logic allows propositions
whose evaluation depends on time, making it suitable for describing sequences of events
and properties of correlated behaviors. There have been significant research in applying
97
temporal logic to study distributed systems, and software programs. There are also various
branches of temporal logic such as linear time and branching time logic [51]. In Linear
Time Temporal Logic (LTTL), program execution behavior can be modeled as a linear se-
quence of states, where each state has a fixed (i.e., deterministic) output. On the other hand,
the Branching Time Temporal Logic (BTTL) allows state transitions via a finite (or infinite)
number of reachable states where the states can be seen to form a reachability tree. Since
program execution and file/memory accesses are not always linear in time, LTTL is not a
suitable choice for our purpose. A variant of BTTL called thetemporal logic of causal
knowledge(TLCK) [102], on the other hand, allows concurrency relations on branching
structures that are naturally suitable for describing actions of multiple programs. There-
fore, we adopt the specification language of TLCK to represent malicious behaviors within
the context of a handset operating environment.
5.2.2 Temporal Logic of Malicious Behavior
This section describes how to specify malicious behavior in terms of system calls and
events, interposed by temporal and logical operators. The specification of malicious be-
havior is the first step of any behavioral detection framework. Although our presentation
is primarily targeted to the Symbian OS, it can be extended for other mobile operating
systems as well.
First, let us formally define a behavior signature as a finite set of propositional variables
interposed using TLCK, where each variable (when true) confirms the execution of either
(i) a single or an aggregation of system calls, or (ii) an event such as read/write access to
a given file descriptor, directory structure or memory location. Note that we donot keep
track of all system calls and events generated by all processes — doing so will impose
unacceptable performance overhead in constructing behavior signatures. Therefore, only
those system calls and events that are used in the specification of malicious behavior are
to be monitored. In fact, we find that specifying behavior signatures for the majority of
mobile malicious programs reported to date, requires monitoring only a small subset of
Symbian API calls.
98

Let PS= fp1; p2; ¢ ¢ ¢ ; pmgSfiji 2 Ng be a set ofm atomic propositional variables be-
longing toN malicious behavior signatures. Atomic propositions can be joined together
to form higher-level propositional variables in our specification. The logical operatorsnot
(:) andand(^) are defined as usual. The temporal operators defined using past-time logic
are as follows:
† flt true at time t
† }t true at some instant before t
† ⁄t true at all instants before t
† }t¡kt true at some instant in the interval[t ¡k; t].
}t¡kt is a quantified temporal operator to rangek time instants over the time variablet.
We make the following assumptions.
1. Time is represented by an infinite sequence of discrete time instants.
2. A duration is given by a sequence of time instants with initiating and terminating
instants.
3. A system call or an event is instantiated at a given instant but may take place over a
duration.
4. The strong synchrony hypothesis [27] holds for the handset operating system envi-
ronment, i.e., the instantiation of a single event at a given instant can generate other
events synchronously. In case of synchronous events, one can still use relative order
to denote relationship among events.
5. Higher-level events and system calls of greater complexity can be composed by tem-
poral and logical predications of the above atomic propositional variables.
To illustrate the application of the above logic, we apply it to specify the behavior
of a family of mobile worms known as Commwarrior. Following this, we will specify
behavior signatures that are general enough to cover different families of mobile worms.
This generalization is a key benefit of using a behavioral detection approach as opposed to
payload signatures, given the small memory and storage footprint of these devices.
99
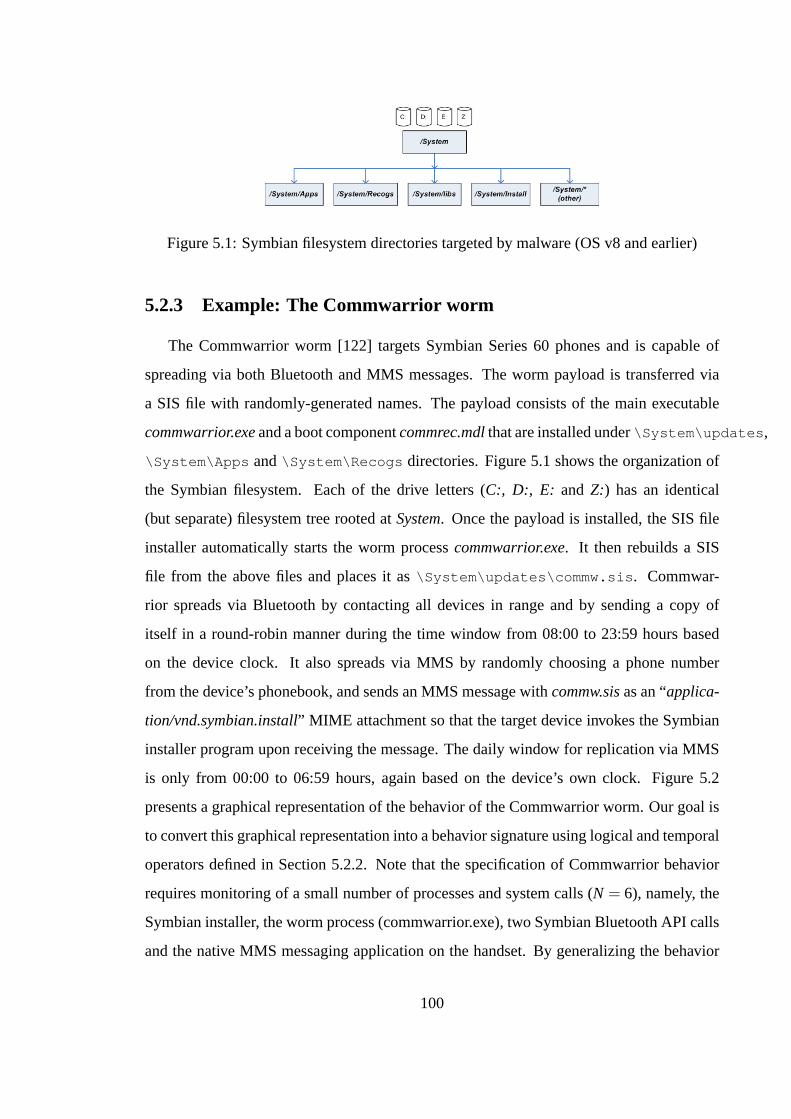
Figure 5.1: Symbian filesystem directories targeted by malware (OS v8 and earlier)
5.2.3 Example: The Commwarrior worm
The Commwarrior worm [122] targets Symbian Series 60 phones and is capable of
spreading via both Bluetooth and MMS messages. The worm payload is transferred via
a SIS file with randomly-generated names. The payload consists of the main executable
commwarrior.exeand a boot componentcommrec.mdlthat are installed under\System\updates ,
\System\Apps and\System\Recogs directories. Figure 5.1 shows the organization of
the Symbian filesystem. Each of the drive letters (C:, D:, E: and Z:) has an identical
(but separate) filesystem tree rooted atSystem. Once the payload is installed, the SIS file
installer automatically starts the worm processcommwarrior.exe. It then rebuilds a SIS
file from the above files and places it as\System\updates\commw.sis . Commwar-
rior spreads via Bluetooth by contacting all devices in range and by sending a copy of
itself in a round-robin manner during the time window from 08:00 to 23:59 hours based
on the device clock. It also spreads via MMS by randomly choosing a phone number
from the device’s phonebook, and sends an MMS message withcommw.sisas an “applica-
tion/vnd.symbian.install” MIME attachment so that the target device invokes the Symbian
installer program upon receiving the message. The daily window for replication via MMS
is only from 00:00 to 06:59 hours, again based on the device’s own clock. Figure 5.2
presents a graphical representation of the behavior of the Commwarrior worm. Our goal is
to convert this graphical representation into a behavior signature using logical and temporal
operators defined in Section 5.2.2. Note that the specification of Commwarrior behavior
requires monitoring of a small number of processes and system calls (N = 6), namely, the
Symbian installer, the worm process (commwarrior.exe), two Symbian Bluetooth API calls
and the native MMS messaging application on the handset. By generalizing the behavior
100
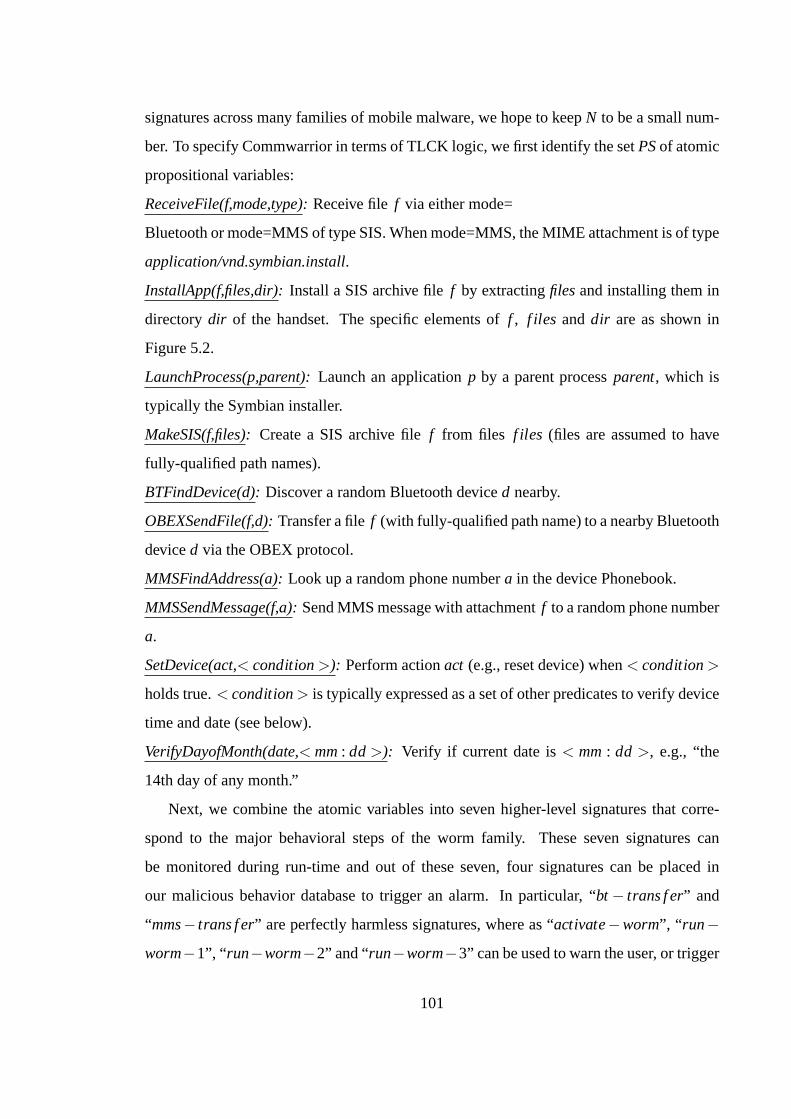
signatures across many families of mobile malware, we hope to keepN to be a small num-
ber. To specify Commwarrior in terms of TLCK logic, we first identify the setPSof atomic
propositional variables:
ReceiveFile(f,mode,type): Receive filef via either mode=
Bluetooth or mode=MMS of type SIS. When mode=MMS, the MIME attachment is of type
application/vnd.symbian.install.
InstallApp(f,files,dir): Install a SIS archive filef by extractingfilesand installing them in
directorydir of the handset. The specific elements off , f iles anddir are as shown in
Figure 5.2.
LaunchProcess(p,parent): Launch an applicationp by a parent processparent, which is
typically the Symbian installer.
MakeSIS(f,files): Create a SIS archive filef from files f iles (files are assumed to have
fully-qualified path names).
BTFindDevice(d): Discover a random Bluetooth deviced nearby.
OBEXSendFile(f,d): Transfer a filef (with fully-qualified path name) to a nearby Bluetooth
deviced via the OBEX protocol.
MMSFindAddress(a): Look up a random phone numbera in the device Phonebook.
MMSSendMessage(f,a): Send MMS message with attachmentf to a random phone number
a.
SetDevice(act,< condition>): Perform actionact (e.g., reset device) when< condition>
holds true.< condition> is typically expressed as a set of other predicates to verify device
time and date (see below).
VerifyDayofMonth(date,< mm: dd >): Verify if current date is< mm: dd >, e.g., “the
14th day of any month.”
Next, we combine the atomic variables into seven higher-level signatures that corre-
spond to the major behavioral steps of the worm family. These seven signatures can
be monitored during run-time and out of these seven, four signatures can be placed in
our malicious behavior database to trigger an alarm. In particular,“bt ¡ trans f er” and
“mms¡ trans f er” are perfectly harmless signatures, where as“activate¡ worm” , “ run¡worm¡1”, “ run¡worm¡2” and“ run¡worm¡3” can be used to warn the user, or trigger
101
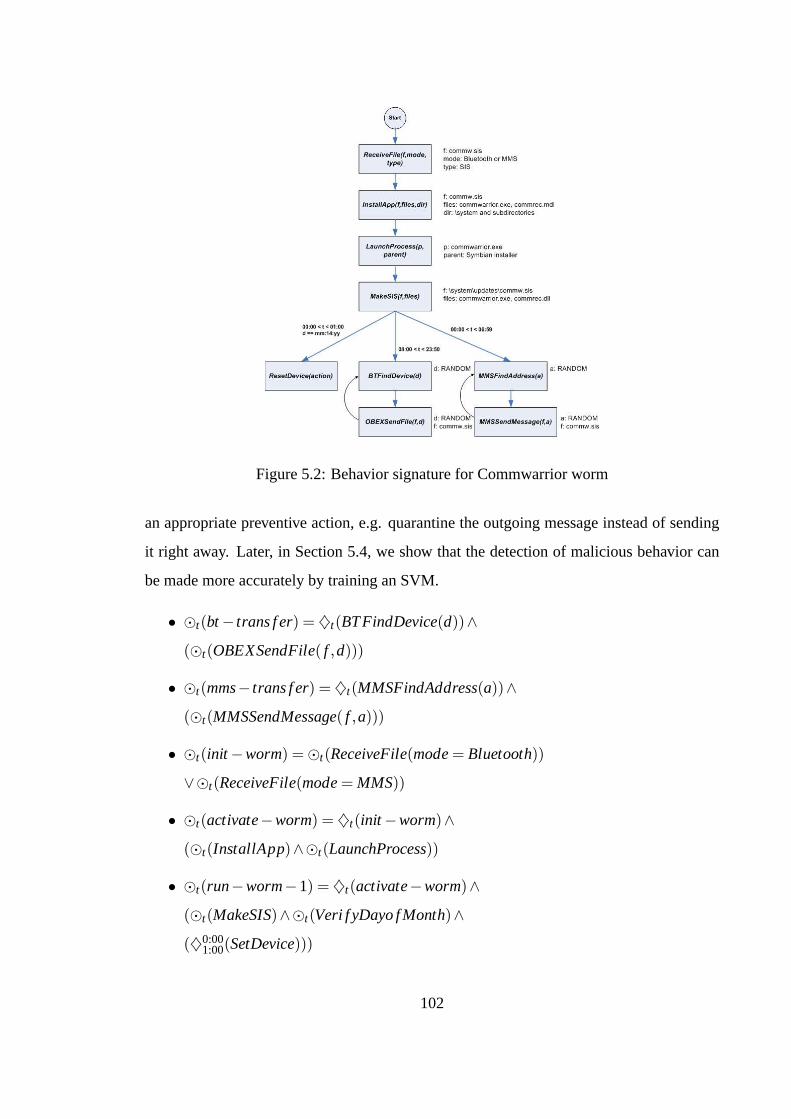
Figure 5.2: Behavior signature for Commwarrior worm
an appropriate preventive action, e.g. quarantine the outgoing message instead of sending
it right away. Later, in Section 5.4, we show that the detection of malicious behavior can
be made more accurately by training an SVM.
† flt(bt ¡ trans f er) = }t(BTFindDevice(d))^(flt(OBEXSendFile( f ;d)))
† flt(mms¡ trans f er) = }t(MMSFindAddress(a))^(flt(MMSSendMessage( f ;a)))
† flt(init ¡worm) = flt(ReceiveFile(mode= Bluetooth))
_flt(ReceiveFile(mode= MMS))
† flt(activate¡worm) = }t(init ¡worm)^(flt(InstallApp)^flt(LaunchProcess))
† flt(run¡worm¡1) = }t(activate¡worm)^(flt(MakeSIS)^flt(Veri f yDayo f Month)^(}0:00
1:00(SetDevice)))
102
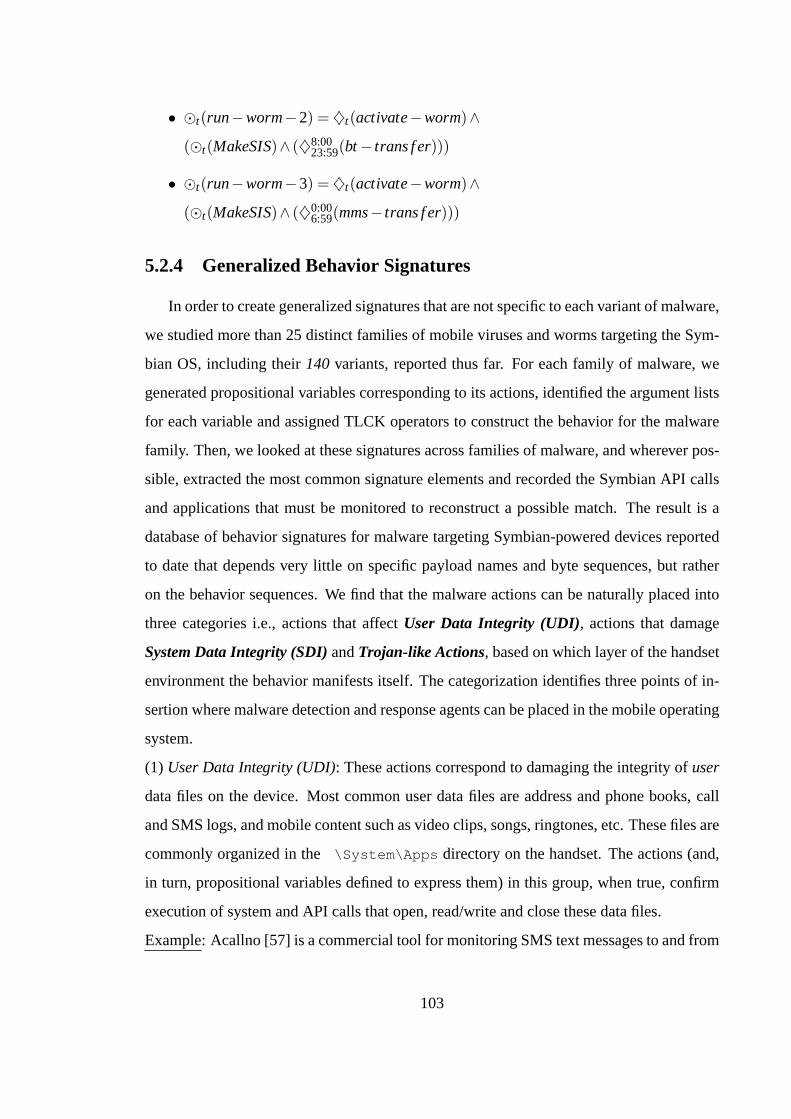
† flt(run¡worm¡2) = }t(activate¡worm)^(flt(MakeSIS)^ (}8:00
23:59(bt ¡ trans f er)))
† flt(run¡worm¡3) = }t(activate¡worm)^(flt(MakeSIS)^ (}0:00
6:59(mms¡ trans f er)))
5.2.4 Generalized Behavior Signatures
In order to create generalized signatures that are not specific to each variant of malware,
we studied more than 25 distinct families of mobile viruses and worms targeting the Sym-
bian OS, including their140 variants, reported thus far. For each family of malware, we
generated propositional variables corresponding to its actions, identified the argument lists
for each variable and assigned TLCK operators to construct the behavior for the malware
family. Then, we looked at these signatures across families of malware, and wherever pos-
sible, extracted the most common signature elements and recorded the Symbian API calls
and applications that must be monitored to reconstruct a possible match. The result is a
database of behavior signatures for malware targeting Symbian-powered devices reported
to date that depends very little on specific payload names and byte sequences, but rather
on the behavior sequences. We find that the malware actions can be naturally placed into
three categories i.e., actions that affectUser Data Integrity (UDI), actions that damage
System Data Integrity (SDI)andTrojan-like Actions, based on which layer of the handset
environment the behavior manifests itself. The categorization identifies three points of in-
sertion where malware detection and response agents can be placed in the mobile operating
system.
(1) User Data Integrity (UDI): These actions correspond to damaging the integrity ofuser
data files on the device. Most common user data files are address and phone books, call
and SMS logs, and mobile content such as video clips, songs, ringtones, etc. These files are
commonly organized in the\System\Apps directory on the handset. The actions (and,
in turn, propositional variables defined to express them) in this group, when true, confirm
execution of system and API calls that open, read/write and close these data files.
Example: Acallno [57] is a commercial tool for monitoring SMS text messages to and from
103
a target phone — the tool has been recently classified as a spyware by security software
vendors. Acallno forwards all incoming and outgoing SMS messages on the designated
phone to a pre-configured phone number. We define three UDI variables,CopySMSTo-
Draft(msg), RemoveEntrySMSLog(msg)andForwardSMSToNumber(msg,phone number),
to represent the major tasks performed by Acallno.CopySMSToDraft(msg)copies the last
SMS messagemsgreceived into a new SMS message in the Drafts folder.RemoveEn-
trySMSLog(msg)is true when the corresponding entry formsg is successfully deleted
from the SMS log so that the user is not aware of the presence of Acallno.ForwardSM-
SToNumber(msg,phone number)is true whenmsgis forwarded to an externalphone num-
ber. These three variables, when interposed with appropriate temporal logic, represent
the behavior of “SMS spying” on a device. The UDI variable called “InstallApp(f, files,
dir)” that we have already used earlier for Commwarrior has the following argument val-
ues for Acallno: f [SMSCatcher.SIS], files [s60calls.exe, s60system.exe, s60system1.exe,
s60calls.mdl, s60sysp.mdl, s60syss.mdl] and dir [\System\Apps ,
\System\recogs ]. These four UDI actions are present in all SMS spyware programs
such as Acallno, MobiSpy and SMSSender, and the resultinggeneralizedbehavior signa-
ture can be used for their detection in place of their specific payload signatures.
(2) System Data Integrity (SDI): Several malware attempt to damage the integrity of system
configuration files and helper application data files by overwriting the original files in the
Symbian system directory with corrupted versions. This is possible for two reasons: (i)
the malware files are installed in flash RAM driveC: under Symbian with the same path
as the operating system binaries in ROM driveZ: . The Symbian OS allows files inC:
take precedence over files inZ: with the same name and pathname, and therefore, any
file with the same path can be overwritten; and (ii) Symbian does not enforce basic security
policies such as file permissions based on user and group IDs and access control lists. As a
result, the user, by agreeing to install an infected SIS file, unknowingly allows the malware
to modify the handset operating environment. The SDI actions (and the propositional vari-
ables) correspond to attempts to modify critical system and application files including files
required at device startup.
104
Example: The actions of Skulls, Doomboot (or, SingleJump), AppDisabler, and their vari-
ants can be categorized under SDI. These malware overwrite and disable a wide range of
applications running under Symbian, including InfraRed, File Manager, System Explorer,
Antivirus (Simworks, F-Secure), and device drivers for camera, video recorders, etc. The
target directories are, for example,
\System\Apps\IrApp\ and \System\Apps\BtUi\ for Infra Red and Bluetooth con-
trol panels, respectively. Any file with the ”.APP” extension in these directories is an ap-
plication that is visible in the applications menu. If any of these files is overwritten with
a corrupted version, the corresponding application is disabled. Since there are many ap-
plication directories under\System\Apps , our goal is to monitor only those directories
that contain critical system and application files such as fonts, file manager, device drivers,
startup files, anti-virus, etc. We define the variableReplaceSystemAppDirectory(directory)
wheredirectory is a canonical pathname of the target directory of a SIS archive.2 The vari-
able returns true whendirectorymatches against a hash table of pre-compiled list of critical
system and application directories. At this point, the installation process can be halted until
the user permits to go ahead with the installation.
Another serious SDI action is deletion of subdirectories under\System . One of the ac-
tions performed by the Cardblock Trojan is deletingbootdata, data , install, libs,
mail in C:\System . The install directory contains installation and uninstallation in-
formation for applications. Many Symbian applications log error codes inC:\System\bootdata
when they generate a panic. Without these directories, most handset applications become
unusable. As a general rule, no user application should be able to delete these directo-
ries. We, therefore, define a variable calledDRSystemDirectory(directory)wheredirectory
checks against a hash table of these directories whenever a process attempts to either delete
or rename a subdirectory underC:\System .
(3) Trojan-like Actions: This category of actions are performed by a malware when it is
delivered to a device via either another malware (“dropper”) or an infected memory card.
2When there are multiple target directories,ReplaceSystemAppDirectory(directory)is evaluated for eachentry in the target list.
105
These actions attempt to compromise the integrity of user and system data on the device
(without requiring user prompts) by exploiting specific OS features and by masquerading
as an otherwise useful program (“cracking”). Once a malware infects a device with Trojan-
like actions, it may use UDI and SDI actions to alter the handset environment. To date, we
find that there are two types of vectors for mobile Trojans: (i) memory cards and (ii) other
malware. The memory cards used in cell phones are primarily Reduced-Size MultiMedi-
aCard (RS-MMC) and micro/mini Secure Digital (SD) cards that can be secured using a
password. As shown in Figure 5.1, the Symbian driveE: is used for memory cards with
the same \System directory structure as of the other drives.
Example: The Cardblock Trojan mentioned earlier, is a cracked version of a legitimate
Symbian application called InstantSis. InstantSis allows a user to create a SIS archive of
any installed application and copy them to another device. Cardblock appears to have the
same look and feel of InstantSis, except that when the user attempts to use the program, it
blocks the MMC memory card and deletes the subdirectories inC:\System (SDI action).
The Trojan-like action of Cardblock is the locking of the MMC card which it accomplishes
by setting a random password to the card. Detection of Cardblock must be done either
when it is first installed on the device or before it actually performs its two tasks (MMC
blocking and deleting system directories). We define a variable calledSetPasswdtoMMC()
to capture the event that a process is attempting to set a password to the MMC card without
prompting the user.
SDI Actions and Symbian OS V9
In order to restrict applications from accessing the entire filesystem, Symbian has re-
cently introducedcapabilitiesbeginning with Symbian OS v9 [126]. A capability is an
access token that allows the token holder to access restricted system resources. In previ-
ous versions of Symbian OS, all user-level applications had read/write access to the entire
filesystem, including \System and all its subdirectories. Therefore, malicious applica-
tions can easily overwrite or replace critical system files in all previous versions of Sym-
bian, including OS v8. However, in the new Symbian platform security model, access to
106
certain functions and APIs will be restricted by capabilities. In order to access the sensitive
capabilities, an application must be “Symbian Signed” by Symbian. In case of self-certified
applications, the phone manufacturer must recommend the application developer for access
to desired capabilities from Symbian. The three capabilities that can prevent many SDI ac-
tions currently performed by mobile malware areAllFiles, TCB(Trusted Computing Base)
andDiskAdmin. Without these capabilities, an application will no longer be able to access
the “/sys” directory where most of the critical system executables and data are stored. For
example, it requiresAllFiles capability to read from andTCBcapability to write to “/sys”.
Most user applications in Symbian OS v9 are allowed to access a single directory called
“/sys/bin” to install executables and create a private directory called “/private/SID” for tem-
porary files, where SID refers to the Secure ID of the caller application, assigned when the
application is Symbian Signed. There are also important changes in OS v9 regarding how
an application is installed. The“ \System\Apps ” subdirectory previously used by appli-
cations for storing application information (resource files, bitmap files, helper application,
etc.) is no longer supported. Instead, a separate filesystem path called“ \resource\apps ”
is used for storing application information. By separating system and application data
in different filesystems and by introducing capabilities for accessing sensitive system re-
sources, Symbian OS v9 clearly improves the security model for mobile devices and will
prevent a number of current-generation malware from damaging the integrity of the device.
However, it may not prevent (i) mobile worms that spread via SMS/MMS or Bluetooth and
social engineering techniques, (ii) malware from launching DoS attacks on other phones or
communication infrastructure due to other vulnerabilities.
5.3 Run-Time Construction of Behavior Signatures
To build a malware detection system, the behavior signatures described in Section 5.2
must be constructed at run-time by monitoring the target set of system events and API
calls. For the early generation of mobile handsets, building such a monitoring layer in the
OS would cause unacceptably high performance overhead. However, in recent years, many
embedded microprocessor vendors, especially ARM, have implemented features that allow
107
real-time tracing of program instruction flow and data accesses. There are already a num-
ber of commercial tracing and debugging tools for ARM cores with an Embedded Trace
Macrocell (ETM) unit, for resolving real-time application issues when traditional “halt-
and-debug” methods cannot be used. In what follows, we describe the implementation of
the monitoring layer in Symbian. Next, we describe the implementation of the monitoring
layer in Symbian.
5.3.1 Monitoring of API calls via Proxy DLL
Since Symbian is a proprietary OS and provides neither kernel monitoring APIs nor
system-wide hooks (e.g., Windowsmessage hooksor Linux netfilter hooks), intercepting
API calls is extremely difficult, if not impossible. Fortunately, the Symbian SDK is ac-
companied with a Symbian OS emulator which is a Windows application that accurately
emulates almost all functionalities of a real handset, such as input devices, user interfaces
and APIs for services (Bluetooth, SMS/MMS, filesystem accesses). Most Symbian-based
handset developers, therefore, build and test mobile applications using the emulator before
transferring them to the real handset. Moreover, the emulator implements all the Sym-
bian APIs in the form of Dynamic Link Libraries (DLLs) which are loaded into memory
at run-time. This is the feature that we were able to utilize to build our monitoring layer.
Specifically, due to the dynamic load feature of the DLLs, the API traces of applications
running in the emulator could be collected via a “Proxy DLL” shown in Figure 5.3. Proxy
Dll is a popular technique used by many anti-virus tools written for Windows, e.g., to hook
into Winsock’s I/O functions and network data for virus signatures [70].
Before delving into the details ofProxy DLL, we briefly discuss how DLLs work in
the Windows OS. When a DLL is built, each function exported by the DLL is assigned a
unique integer value known as itsordinal number. DLL functions are invoked at run-time
by first loading the DLL library into memory, then looking up this ordinal in the DLL to find
the memory address of the corresponding functions, and finally executing them. However,
since the ordinal number is difficult to use and remember, programs using functions in the
DLL often statically link to animport library (.lib). The role of the import library is to
108
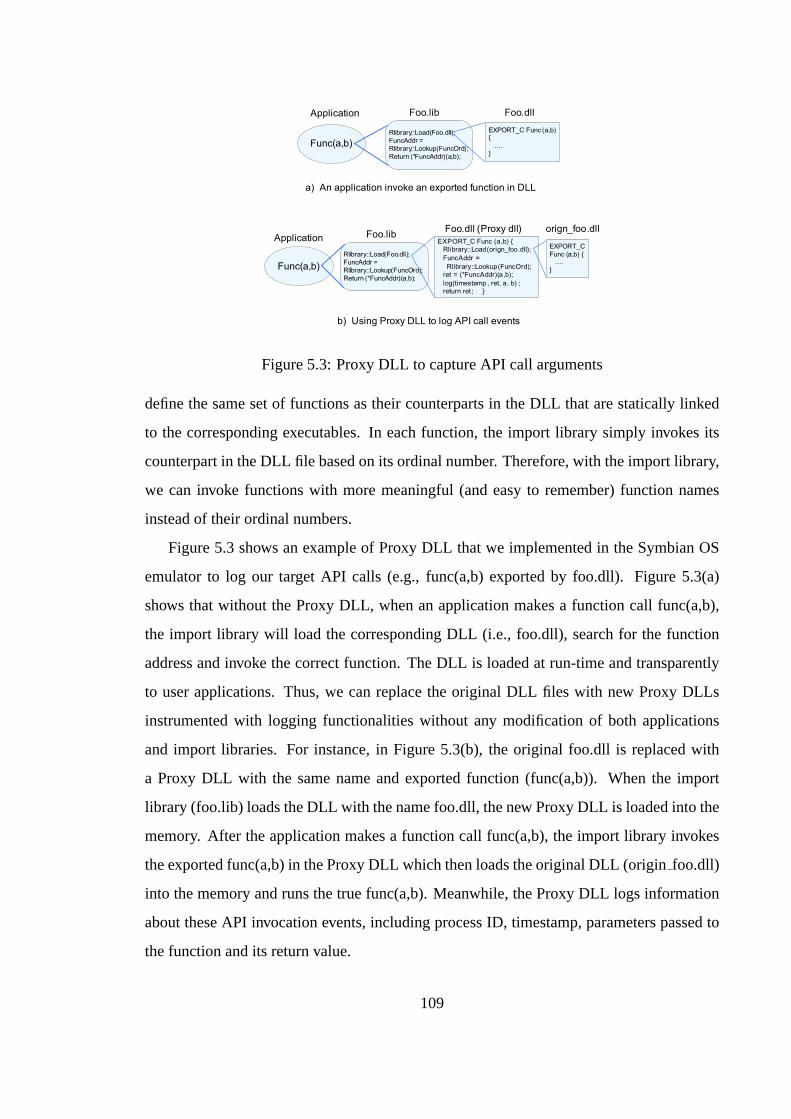
Func(a,b)
Application
Rlibrary::Load(Foo.dll);
FuncAddr =
Rlibrary::Lookup(FuncOrd);
Return (*FuncAddr)(a,b);
Foo.lib Foo.dll
a) An application invoke an exported function in DLL
Application
Rlibrary::Load(Foo.dll);
FuncAddr =
Rlibrary::Lookup(FuncOrd);
Return (*FuncAddr)(a,b);
Foo.libFoo.dll (Proxy dll)
b) Using Proxy DLL to log API call events
Func(a,b)
EXPORT_C Func (a,b) {
….
}
EXPORT_C Func (a,b) {
Rlibrary::Load(orign_foo.dll);
FuncAddr =
Rlibrary::Lookup(FuncOrd);
ret = (*FuncAddr)(a,b);
log(timestamp , ret, a, b) ;
return ret; }
orign_foo.dll
EXPORT_C
Func (a,b) { ….
}
Figure 5.3: Proxy DLL to capture API call arguments
define the same set of functions as their counterparts in the DLL that are statically linked
to the corresponding executables. In each function, the import library simply invokes its
counterpart in the DLL file based on its ordinal number. Therefore, with the import library,
we can invoke functions with more meaningful (and easy to remember) function names
instead of their ordinal numbers.
Figure 5.3 shows an example of Proxy DLL that we implemented in the Symbian OS
emulator to log our target API calls (e.g., func(a,b) exported by foo.dll). Figure 5.3(a)
shows that without the Proxy DLL, when an application makes a function call func(a,b),
the import library will load the corresponding DLL (i.e., foo.dll), search for the function
address and invoke the correct function. The DLL is loaded at run-time and transparently
to user applications. Thus, we can replace the original DLL files with new Proxy DLLs
instrumented with logging functionalities without any modification of both applications
and import libraries. For instance, in Figure 5.3(b), the original foo.dll is replaced with
a Proxy DLL with the same name and exported function (func(a,b)). When the import
library (foo.lib) loads the DLL with the name foo.dll, the new Proxy DLL is loaded into the
memory. After the application makes a function call func(a,b), the import library invokes
the exported func(a,b) in the Proxy DLL which then loads the original DLL (originfoo.dll)
into the memory and runs the true func(a,b). Meanwhile, the Proxy DLL logs information
about these API invocation events, including process ID, timestamp, parameters passed to
the function and its return value.
109
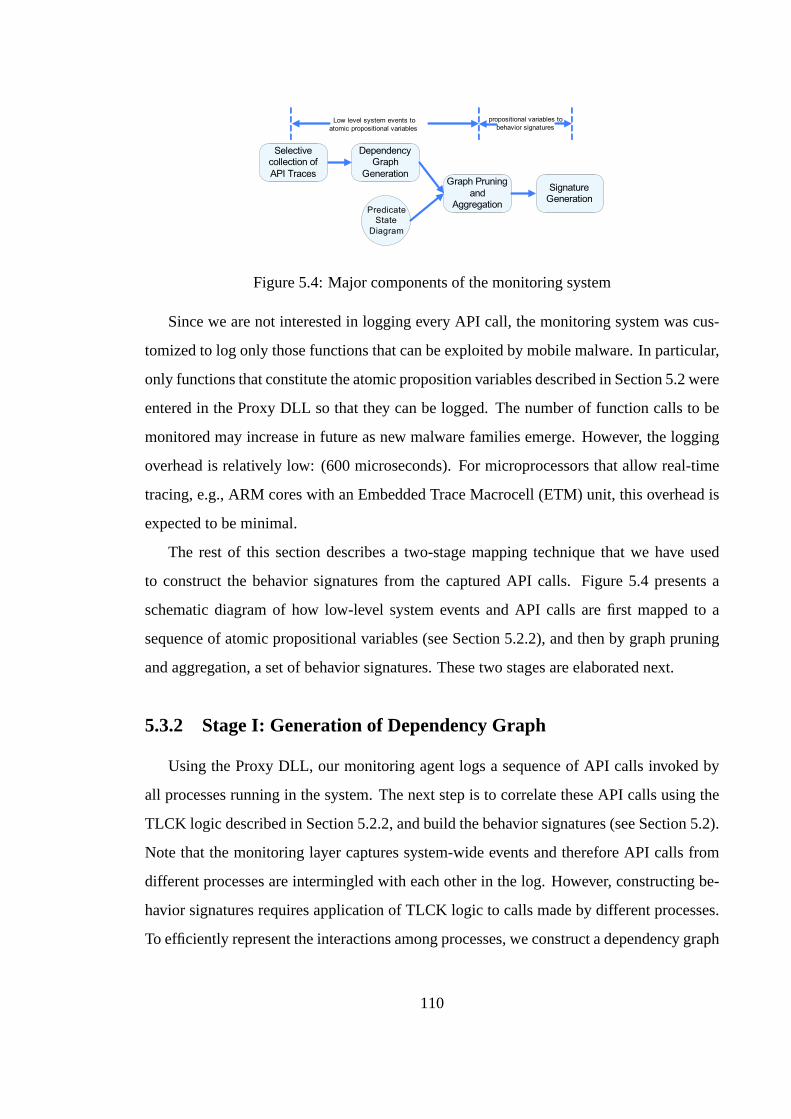
Dependency Graph
Generation
Selective collection of
API TracesGraph Pruning
and Aggregation
Predicate
State
Diagram
Signature Generation
Low level system events to
atomic propositional variables
propositional variables to
behavior signatures
Figure 5.4: Major components of the monitoring system
Since we are not interested in logging every API call, the monitoring system was cus-
tomized to log only those functions that can be exploited by mobile malware. In particular,
only functions that constitute the atomic proposition variables described in Section 5.2 were
entered in the Proxy DLL so that they can be logged. The number of function calls to be
monitored may increase in future as new malware families emerge. However, the logging
overhead is relatively low: (600 microseconds). For microprocessors that allow real-time
tracing, e.g., ARM cores with an Embedded Trace Macrocell (ETM) unit, this overhead is
expected to be minimal.
The rest of this section describes a two-stage mapping technique that we have used
to construct the behavior signatures from the captured API calls. Figure 5.4 presents a
schematic diagram of how low-level system events and API calls are first mapped to a
sequence of atomic propositional variables (see Section 5.2.2), and then by graph pruning
and aggregation, a set of behavior signatures. These two stages are elaborated next.
5.3.2 Stage I: Generation of Dependency Graph
Using the Proxy DLL, our monitoring agent logs a sequence of API calls invoked by
all processes running in the system. The next step is to correlate these API calls using the
TLCK logic described in Section 5.2.2, and build the behavior signatures (see Section 5.2).
Note that the monitoring layer captures system-wide events and therefore API calls from
different processes are intermingled with each other in the log. However, constructing be-
havior signatures requires application of TLCK logic to calls made by different processes.
To efficiently represent the interactions among processes, we construct a dependency graph
110
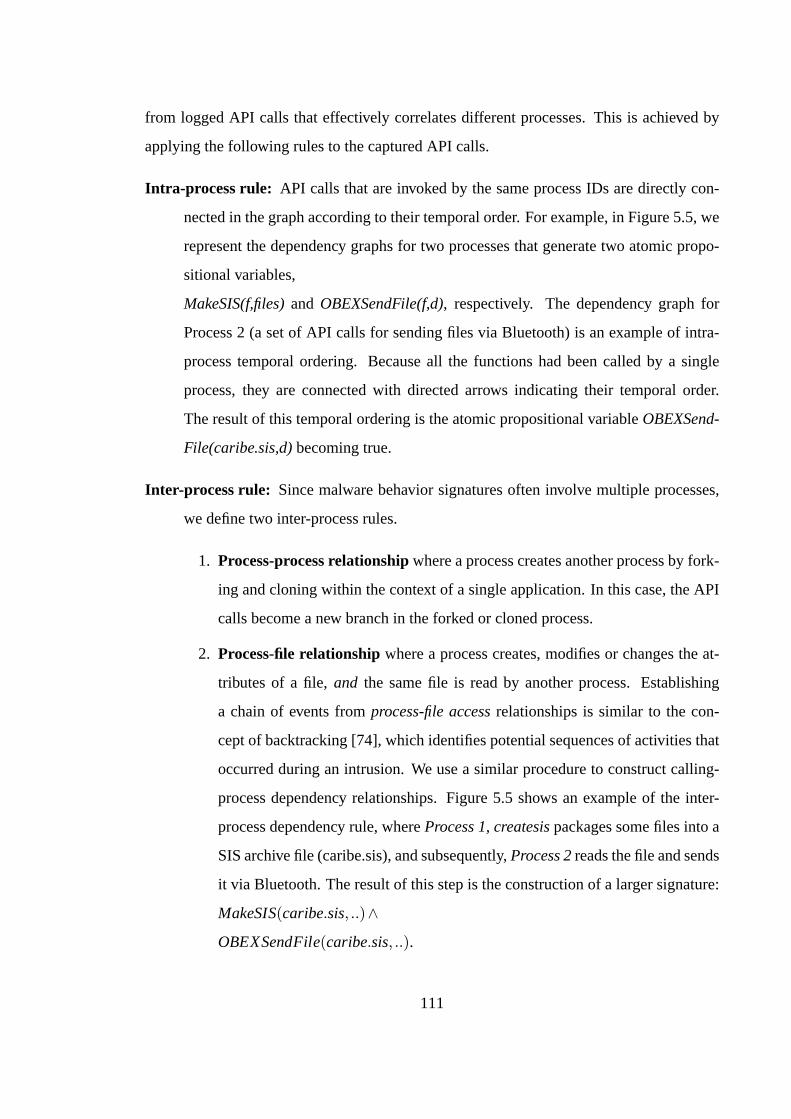
from logged API calls that effectively correlates different processes. This is achieved by
applying the following rules to the captured API calls.
Intra-process rule: API calls that are invoked by the same process IDs are directly con-
nected in the graph according to their temporal order. For example, in Figure 5.5, we
represent the dependency graphs for two processes that generate two atomic propo-
sitional variables,
MakeSIS(f,files)and OBEXSendFile(f,d), respectively. The dependency graph for
Process 2 (a set of API calls for sending files via Bluetooth) is an example of intra-
process temporal ordering. Because all the functions had been called by a single
process, they are connected with directed arrows indicating their temporal order.
The result of this temporal ordering is the atomic propositional variableOBEXSend-
File(caribe.sis,d)becoming true.
Inter-process rule: Since malware behavior signatures often involve multiple processes,
we define two inter-process rules.
1. Process-process relationshipwhere a process creates another process by fork-
ing and cloning within the context of a single application. In this case, the API
calls become a new branch in the forked or cloned process.
2. Process-file relationshipwhere a process creates, modifies or changes the at-
tributes of a file,and the same file is read by another process. Establishing
a chain of events fromprocess-file accessrelationships is similar to the con-
cept of backtracking [74], which identifies potential sequences of activities that
occurred during an intrusion. We use a similar procedure to construct calling-
process dependency relationships. Figure 5.5 shows an example of the inter-
process dependency rule, whereProcess 1, createsispackages some files into a
SIS archive file (caribe.sis), and subsequently,Process 2reads the file and sends
it via Bluetooth. The result of this step is the construction of a larger signature:
MakeSIS(caribe:sis; ::)^OBEXSendFile(caribe:sis; ::).
111
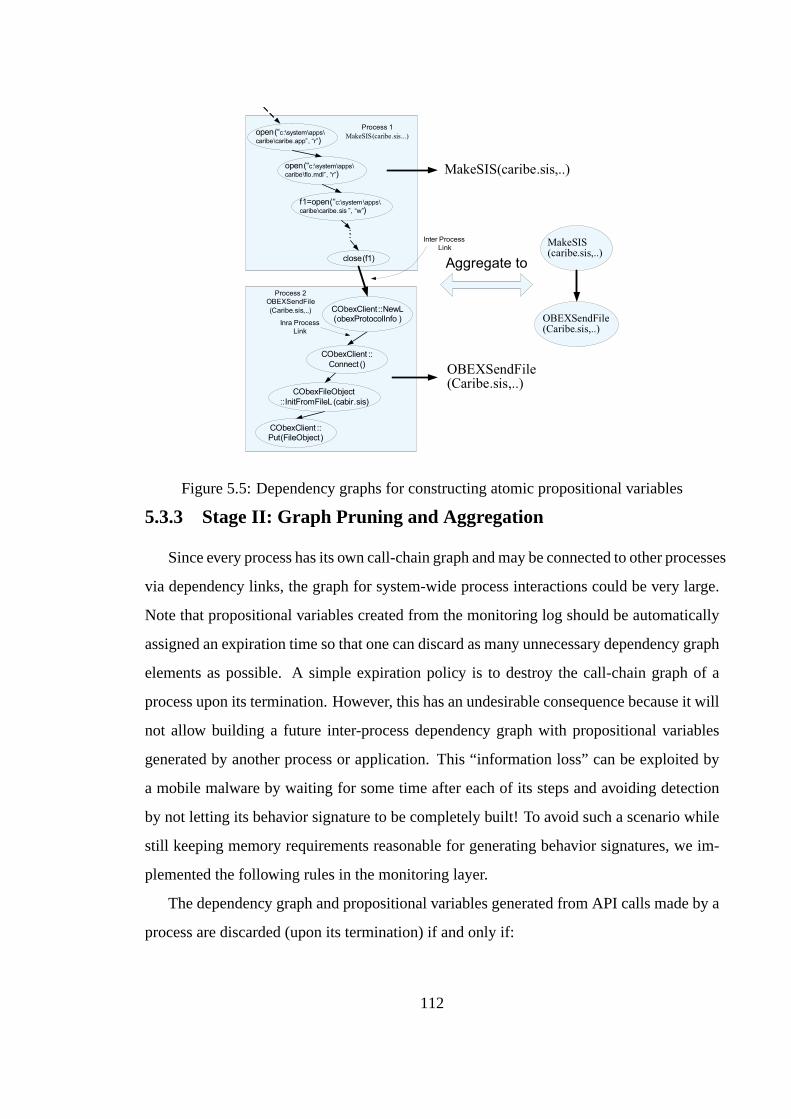
Process 2
OBEXSendFile
(Caribe.sis,..) CObexClient::NewL(obexProtocolInfo )
CObexClient ::
Connect ()
CObexFileObject
::InitFromFileL(cabir.sis)
CObexClient ::Put(FileObject)
open(“c:\system\apps\
caribe\caribe.app”, “r”)
open(“c:\system\apps\
caribe\flo.mdl”, “r”)
f1=open(“c:\system\apps\
caribe\caribe.sis ”, “w”)
close(f1)
Process 1
MakeSIS(caribe.sis...)
Inter Process
Link
Inra Process
Link
MakeSIS(caribe.sis,..)
OBEXSendFile(Caribe.sis,..)
Aggregate to
MakeSIS (caribe.sis,..)
OBEXSendFile(Caribe.sis,..)
Figure 5.5: Dependency graphs for constructing atomic propositional variables
5.3.3 Stage II: Graph Pruning and Aggregation
Since every process has its own call-chain graph and may be connected to other processes
via dependency links, the graph for system-wide process interactions could be very large.
Note that propositional variables created from the monitoring log should be automatically
assigned an expiration time so that one can discard as many unnecessary dependency graph
elements as possible. A simple expiration policy is to destroy the call-chain graph of a
process upon its termination. However, this has an undesirable consequence because it will
not allow building a future inter-process dependency graph with propositional variables
generated by another process or application. This “information loss” can be exploited by
a mobile malware by waiting for some time after each of its steps and avoiding detection
by not letting its behavior signature to be completely built! To avoid such a scenario while
still keeping memory requirements reasonable for generating behavior signatures, we im-
plemented the following rules in the monitoring layer.
The dependency graph and propositional variables generated from API calls made by a
process are discarded (upon its termination) if and only if:
112
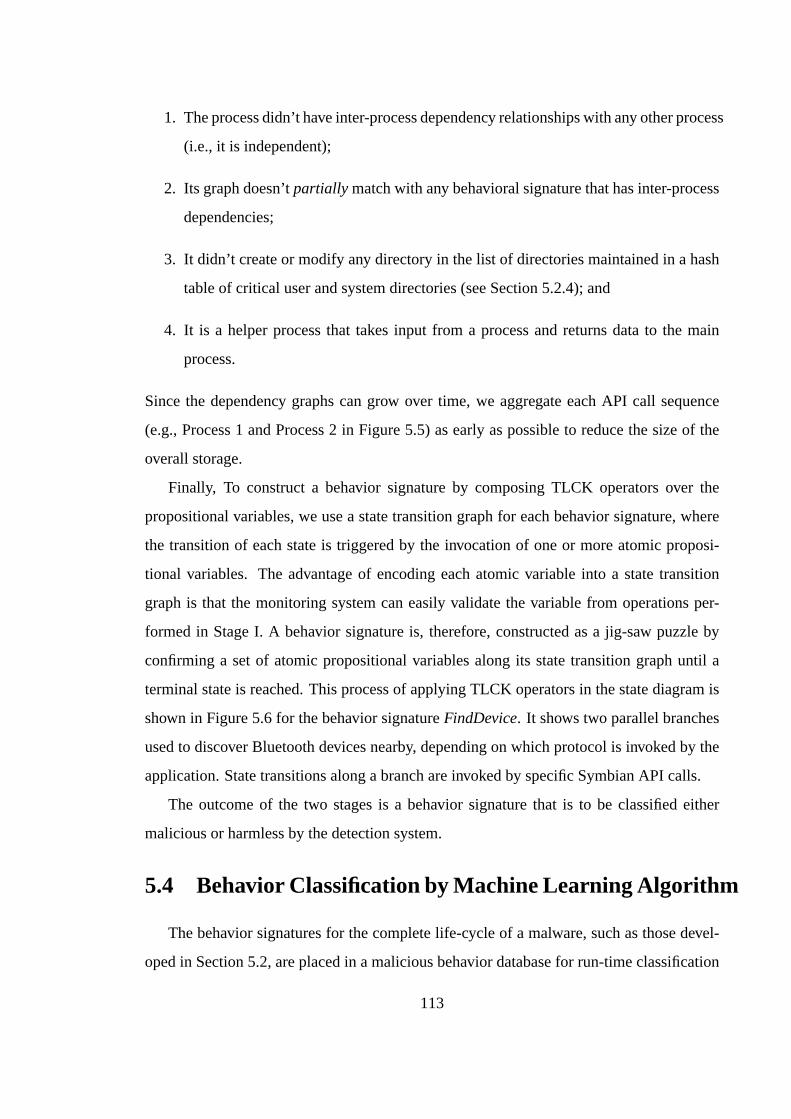
1. The process didn’t have inter-process dependency relationships with any other process
(i.e., it is independent);
2. Its graph doesn’tpartially match with any behavioral signature that has inter-process
dependencies;
3. It didn’t create or modify any directory in the list of directories maintained in a hash
table of critical user and system directories (see Section 5.2.4); and
4. It is a helper process that takes input from a process and returns data to the main
process.
Since the dependency graphs can grow over time, we aggregate each API call sequence
(e.g., Process 1 and Process 2 in Figure 5.5) as early as possible to reduce the size of the
overall storage.
Finally, To construct a behavior signature by composing TLCK operators over the
propositional variables, we use a state transition graph for each behavior signature, where
the transition of each state is triggered by the invocation of one or more atomic proposi-
tional variables. The advantage of encoding each atomic variable into a state transition
graph is that the monitoring system can easily validate the variable from operations per-
formed in Stage I. A behavior signature is, therefore, constructed as a jig-saw puzzle by
confirming a set of atomic propositional variables along its state transition graph until a
terminal state is reached. This process of applying TLCK operators in the state diagram is
shown in Figure 5.6 for the behavior signatureFindDevice. It shows two parallel branches
used to discover Bluetooth devices nearby, depending on which protocol is invoked by the
application. State transitions along a branch are invoked by specific Symbian API calls.
The outcome of the two stages is a behavior signature that is to be classified either
malicious or harmless by the detection system.
5.4 Behavior Classification by Machine Learning Algorithm
The behavior signatures for the complete life-cycle of a malware, such as those devel-
oped in Section 5.2, are placed in a malicious behavior database for run-time classification
113
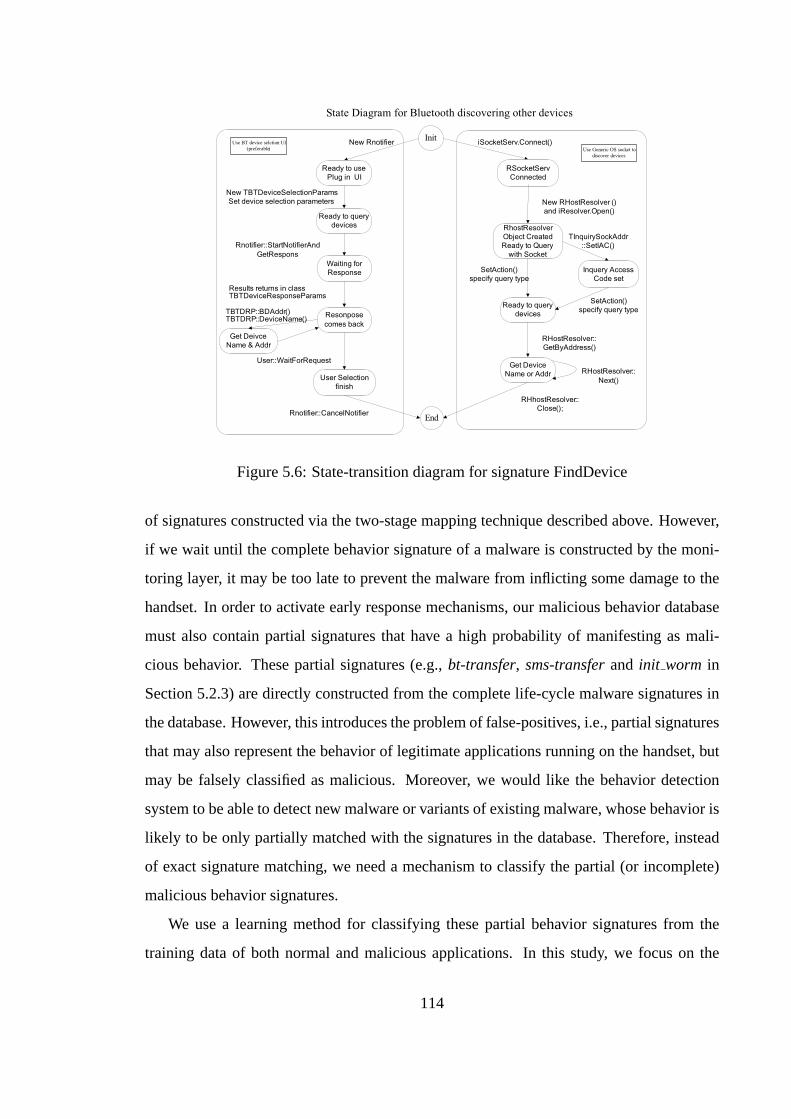
State Diagram for Bluetooth discovering other devices
Init
End
Ready to use
Plug in UI
New Rnotifier
Ready to query
devices
New TBTDeviceSelectionParams
Set device selection parameters
Rnotifier::StartNotifierAnd
GetRespons
Waiting for
Response
Resonpose
comes back
Results returns in class TBTDeviceResponseParams
Rnotifier::CancelNotifier
Use BT device selction UI
(preferable)
RSocketServ
Connected
iSocketServ.Connect()
Get Deivce
Name & Addr
TBTDRP::BDAddr() TBTDRP::DeviceName()
New RHostResolver ()
and iResolver.Open()
RhostResolver
Object Created
Ready to Query
with Socket
Inquery Access
Code set
TInquirySockAddr
::SetIAC()
Ready to query
devices
SetAction()
specify query type
SetAction()
specify query type
RHostResolver::
GetByAddress()
Get Device
Name or Addr RHostResolver::
Next()
RHhostResolver::
Close();
Use Generic OS socket to
discover devices
User Selection
finish
User::WaitForRequest
Figure 5.6: State-transition diagram for signature FindDevice
of signatures constructed via the two-stage mapping technique described above. However,
if we wait until the complete behavior signature of a malware is constructed by the moni-
toring layer, it may be too late to prevent the malware from inflicting some damage to the
handset. In order to activate early response mechanisms, our malicious behavior database
must also contain partial signatures that have a high probability of manifesting as mali-
cious behavior. These partial signatures (e.g.,bt-transfer, sms-transferand init worm in
Section 5.2.3) are directly constructed from the complete life-cycle malware signatures in
the database. However, this introduces the problem of false-positives, i.e., partial signatures
that may also represent the behavior of legitimate applications running on the handset, but
may be falsely classified as malicious. Moreover, we would like the behavior detection
system to be able to detect new malware or variants of existing malware, whose behavior is
likely to be only partially matched with the signatures in the database. Therefore, instead
of exact signature matching, we need a mechanism to classify the partial (or incomplete)
malicious behavior signatures.
We use a learning method for classifying these partial behavior signatures from the
training data of both normal and malicious applications. In this study, we focus on the
114
binary classification problem where the goal is to generate a function that can classify the
input behavior signatures as belonging to either malicious (+1) or not (-1). In what fol-
lows, we describe a particular machine learning approach calledSupport Vector Machines
(SVMs)that we implemented for the binary classification problem of partial behavior sig-
natures.
5.4.1 Support Vector Machines
SVMs, based on the pioneering work of Vapnik [134] and Joachim [68] on statistical
learning theory, have been successfully applied to a large number of classification prob-
lems, such as intrusion detection, gene expression analysis and machine diagnostics. SVMs
are a supervised learning method that addresses the general problem of learning to differ-
entiate between positive and negative members of a class ofn-dimensional vectors [100].
SVMs address the problems of overfitting and capacity control associated with the classical
learning machines such as neural networks. Traditional neural networks suffer from gen-
eralization, resulting in models that can overfit the training data. For a given learning task
with a finite training set, the learning machine must strike a balance between the accuracy
obtained on the given training set and thecapacityof the machine which measures its abil-
ity to learn future unknown data without error. A machine with either high or low capacity
may result in falsely classifying new observations. The flexible generalization ability of
SVMs makes the approach suitable for real-world applications with a limited amount of
training data. Here we refer to solving classification problems using SVMs asSupport
Vector Classification(SVC).
Let (x1;y1); ¢ ¢ ¢ ;(xm;ym) denotem observations (or the training set) of behavior sig-
naturesx. Each behavior signaturexi is of dimensiond corresponding to the number of
propositional variables, andyi = §1 is the corresponding class label (i.e., malicious or
non-malicious) assigned to each observationi. Since behavior signatures are specified as
propositional variables interposed with TLCK operators, we encode each signature with
two types of features: Propositional Variable (PV) and Temporal Order (TO) features. In
the current implementation, the first 10 elements in the feature vectorx specify the PV
115

features, each of which corresponds to one atomic propositional variable defined in Sec-
tion 5.2.3 and has a value indicating the number of executions of the variable. For instance,
4-th and 5-th elements inx correspond to the variables: BTFindDevice and OBEXSendFile
and their values indicate how many times the monitored program has searched for nearby
devices and sent files via Bluetooth. The rest of the elements inx are TO features, encod-
ing the temporal constraints dictated by TLCK logic. For example, the 11-th element in
x records how many times variable BTFindDevicehappened beforeOBEXSendFile (i.e.
the high-level signature bt-transfer) . As a result, each normal or malicious behavior signa-
ture is encoded into a the feature vectorx, which is then learned by the SVM algorithm to
generate the optimal classifiers for detecting malicious codes.
We denote the space of input signatures (i.e.,xi ’s) asΘ. Given this training data, we
want to be able togeneralizeto new observations, i.e., given a new observationx 2 Θ, we
would like to predict the correspondingy 2 f§1g. To do this, we need a function,k(x; x),
that can measure similarity (i.e., a real-valued scalar distance) between data pointsx andx
in Θ:
k : Θ £ Θ ! ℜ (5.1)
(x; x) ‰ k(x; x): (5.2)
The functionk is called akerneland is most often represented as a canonical dot prod-
uct. For example, given two behavior vectorsx andx of dimension d, the kernelk can be
represented as
k(x:x) = Σdi=1(x)i :(x)i : (5.3)
The dot-product representation of kernels allows geometrical interpretation of the be-
havior signatures in terms of angles, lengths and their distances. In fact, the dot product
represents the cosine of the angle between vectorsx andx when their lengths are normal-
ized to 1. A key step in SVM is mapping of the vectorsx from their original input space
Θ to a higher-dimensional dot-product space,F , called thefeature space. This mapping
is represented asΦ : Θ ! F . The mapping functions are chosen such that the similarity
measure is preserved as a dot product inF :
k(x; x) ! K(x; x)) := (Φ(x):Φ(x)) (5.4)
116
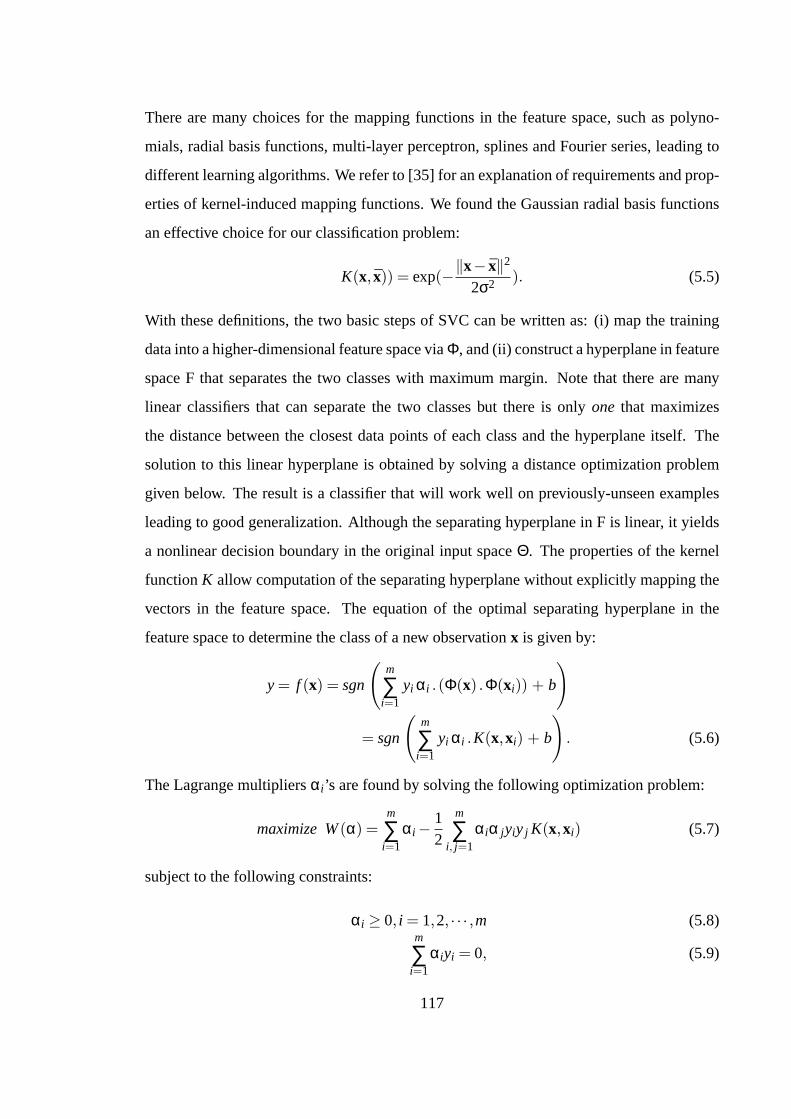
There are many choices for the mapping functions in the feature space, such as polyno-
mials, radial basis functions, multi-layer perceptron, splines and Fourier series, leading to
different learning algorithms. We refer to [35] for an explanation of requirements and prop-
erties of kernel-induced mapping functions. We found the Gaussian radial basis functions
an effective choice for our classification problem:
K(x; x)) = exp(¡kx ¡ xk2
2σ2 ): (5.5)
With these definitions, the two basic steps of SVC can be written as: (i) map the training
data into a higher-dimensional feature space viaΦ, and (ii) construct a hyperplane in feature
space F that separates the two classes with maximum margin. Note that there are many
linear classifiers that can separate the two classes but there is onlyone that maximizes
the distance between the closest data points of each class and the hyperplane itself. The
solution to this linear hyperplane is obtained by solving a distance optimization problem
given below. The result is a classifier that will work well on previously-unseen examples
leading to good generalization. Although the separating hyperplane in F is linear, it yields
a nonlinear decision boundary in the original input spaceΘ. The properties of the kernel
functionK allow computation of the separating hyperplane without explicitly mapping the
vectors in the feature space. The equation of the optimal separating hyperplane in the
feature space to determine the class of a new observationx is given by:
y = f (x) = sgn
ˆm
∑i=1
yi αi : (Φ(x) :Φ(xi)) + b
!
= sgn
ˆm
∑i=1
yi αi :K(x;xi) + b
!: (5.6)
The Lagrange multipliersαi ’s are found by solving the following optimization problem:
maximize W(α) =m
∑i=1
αi ¡ 12
m
∑i; j=1
αiα jyiy j K(x;xi) (5.7)
subject to the following constraints:
αi ‚ 0; i = 1;2; ¢ ¢ ¢ ;m (5.8)m
∑i=1
αiyi = 0; (5.9)
117
wherexi ’s denote the training data of the behavior vectors. Note that only those data that
have non-zeroαi contribute to the hyperplane equation. These are termedSupport Vectors
(SVs). If the data points are linearly separable, all the SVs will lie on the margin and
therefore, the number of SVs will be small. As a result, the hyperplane will be determined
by a small subset of the training set. The other points in the training set will have no effect
on the hyperplane. With an appropriate choice of kernelK, one can transform a linearly
non-separable training set into one that is linearly separable in the feature set and apply the
above equations as shown. The parameterb (also called the “bias”) can be calculated from:
b =12
m
∑i=1
αiyi [K(xi ;xr)+K(xi ;xs)] (5.10)
wherexr andxs are any SVs from each class satisfyingαr ;αs > 0 andyr = ¡1;ys = 1.
In practice, a separating hyperplane may not always be computed due to high overlap
of the two classes in the input behavior vectors. There are modified formulations of the
optimization problem, e.g., with slack variables andsoft margin classifiers[35], resulting
in well-generalizing classifiers in this case. We have not explored this in the present study.
5.5 Possible Evasion & Limitations, and Their Counter-
measures
We now discuss (i) several possible ways attackers may evade our detection framework
as well as a few limitations associated with it, and (ii) possible countermeasures for them.
A malware writer who has learned our detection system may try to evade it by mod-
ifying the behaviors of existing malware or creating new malicious behaviors. Similar to
code obfuscation [87], program behavior can be obfuscated by: behavior reordering, file or
directory renaming, normal behavior insertion and equivalent behavior replacement. For
behavior reordering, note that attackers cannot arbitrarily reorder the program behaviors,
since some temporal constraints must be satisfied in order to maintain the correct function-
ality. For example, the temporal ordering of ReceiveFile and InstallApp cannot be reversed,
because installation of malware depends on first receiving the malware file. Similar tem-
poral ordering must hold for Bluetooth or MMS transfer. On the other hand, the ordering
118
between Bluetooth and MMS transfers can be changed arbitrarily. Our approach is resilient
to reordering because we only use TLCK to captures these inherent constraints to con-
struct high-level behavior signatures (Section 5.2), thus providing strong protection against
behavior-reordering obfuscation. File/directory renaming is done by assigning different
names to malware executables or installation directories so that exact matching will fail to
detect the variant. To resist such obfuscation, we abstract away the file/directory name and
keep only file types, e.g., installation type (.SiS) and system directory names in the behav-
ior signatures(\system ). The third type of obfuscation (i.e, normal behavior insertion)
inserts useless or innocent behavior sequences that do not influence the program function-
ality among malicious behaviors. Our approach is resilient to this obfuscation because it
does not seek any exact match of some malicious template with program behavior. Instead,
the signature is constructed by validating each behavior predicate and then classified via a
machine learning algorithm. Moreover, in our framework, most of the behavior predicates
on their own are normal, but they together, when connected with temporal relationships,
become strong indicators of malicious behaviors. Hence, insertion of useless or normal
behavior cannot evade our detection scheme. Finally, equivalent behavior substitution re-
places groups of behaviors with other sequences that have the same functionality but are not
captured with our signature predicates. Alternatively, attackers may try to circumvent the
detection by mimicry attacks [138], i.e., disguising its behavior as normal sequences while
having the same effect on the system. Although our approach cannot completely handle this
type of obfuscation, it makes substitution or mimicry more difficult. First, the high-level
definition of behavior signature hides many implementation details. Finding equivalent
behavior sequences is not as easy as that for machine instruction sequences, where a rich
instruction set is available [87]. Second, even if the monitor layer misses some malware
behaviors due to lack of predicate specification for equivalent behavior sequences, the ma-
chine learning algorithm may still be able to make correct classification if the remaining
behaviors captured are similar enough to existing worm behavior.
However, our approach also has a few limitations. First, since the current set of behavior
predicates is defined based on the existing mobile malware, the detection might not succeed
if most behaviors of a mobile worm are the same as normal programs or completely new
119
(this is equivalent to the case when attackers manage to substitute most of their malicious
behaviors with equivalent sequences that are not detectable by our system). This is a fun-
damental limitation of any behavioral approach which detects unseen anomalies based on
their similarities or dissimilarities from existing training data. Fortunately, in most cases,
new malware share a great deal of similarity with their predecessors for the following rea-
sons. First, the modularization and complexity of current malware make addition of new
behaviors to existing malware a common technique used by malware writers [87]. Cre-
ation of truly new malware is very rare. Second, runtime packers (e.g., UPX [4], MEW [2],
FSG [1], etc.) are one of the most widely-used techniques for generating malware variants
(for example, over 92% of malware files in wild list 02/2006 are packed [32]). Running
these packed malware essentially unpacks the original executable codes and then transfers
control to them. This means that the behavior of these packed variants is the same as the
original executables. A recent report by Symatec [38] also confirms our observation that
most new malware are variations of existing ones and the number of new malware families
is declining. In future, however, we would like to derive a similarity threshold for detec-
tion, i.e., how dissimilar the new malware has to be from the previous malware behavior in
order not to be caught by our framework. Second, as a general problem for all host-based
mechanisms, our system can be circumvented by malware that can bypass the API moni-
toring (e.g., install rootkit, place hook deeper than the monitor) or modify the framework
configuration (e.g., disable the detection engine). Countermeasures have been proposed
for desktop environments, such as the rootkit revealer [3], trusted virtual machine moni-
tor [129], etc. These approaches may be applied in mobile settings as handsets become
more powerful.
While there are several ways an attacker could attempt to evade detection, our approach,
as demonstrated in the next section, is still effective in detecting many mobile malware
variants and thus significantly raises the bar for mobile malware writers to overcome, unlike
the traditional signature-based detection.
120
5.6 Evaluation and Results
5.6.1 Methodology
Due to limited access to source code3 of worm and normal applications, we evalu-
ate the proposed behavioral detection framework first by emulating program behavior and
then testing it against real-world worm. First, we wrote several applications that emu-
lated known Symbian worms: Cabir, Mabir, Lasco, Commwarrior and a generic worm that
spreads by sending messages via MMS and Bluetooth. For each malware, we reproduced
the infection state machine, especially the resource accesses and system events that these
malware trigger in the Symbian OS. We also included variants of each malware based
on our review of the malware family published by various anti-virus vendors. For most
malware, this required addition of different variations in application lifetime, number and
subject of messages sent to other devices, file name, type and attachment sizes, different
installation directories for the worm payload, etc. We also built 3 legitimate applications
that shared several common partial behavior signatures with the worms. These are Blue-
tooth OBEX file transfer, MMS client, and theMakeSISutility in Symbian OS that creates
an SIS archive file from a given list of files.
These 8 (5 worms and 3 legitimate) applications contain many execution branches cor-
responding to different behavior signatures that can be captured by the runtime monitor-
ing. To execute all possible branches, we run these applications many times so that most
branches are executed at least once. Each run of an application results in a set of behavior
signatures captured by the monitoring layer. Depending on the time window over which
these behavior signatures are created from the monitoring logs, we obtain partial/full sig-
natures of various predicate lengths. Next, we remove all repeated signatures and collect
only the unique signatures generated from the above runs to create a training dataset and a
test dataset that are subsequently used for our evaluation. We generate several training and
test datasets by repeating the above procedure so that expected averages of classification
accuracy, false positive and false negative rates can be calculated. Next, we use the training
data to train the SVM model and classify each signature in the test data using this model
3Since the monitor is implemented in Symbian emulator which requires applications to be recompiled inorder to be executed
121
to determine the classification accuracy. Here we refer to solving classification problems
using SVMs asSupport Vector Classification(SVC).
5.6.2 Accuracy of SVC
To evaluate the effectiveness of the kernel function, we first vary the size of the train-
ing set to determine its effect on the classification error. Table 5.1 shows the classification
accuracy, number of false positives and false negatives for a test data size of 905 distinct
signatures and different training data sizes. We found that SVC almost never falsely classi-
fies a legitimate application signature to be malicious. On the other hand, for small training
data sizes, the number of false negatives (malicious signatures classified as legitimate) is
high. However, as the training data size is increased, the classification accuracy increases
quickly, reaching near 100% detection of malicious signatures. In our experiments with
other training and test dataset sizes, we observed very similar classification results.
Table 5.1 also shows the number of Support Vectors (SVs) for each training set. SVs
indicate the size of the SVM model that must be included in the monitoring layer for clas-
sifying the run-time behavior signatures. Since a training data size of150is sufficient for
the 5 worms we studied, on average, about 50 SVs are included in the SVM model for run-
time detection. Each SV corresponds to a signature in the training dataset and therefore,
the number of signatures needed for classification for hundreds of variants of these worms
is relatively small.
5.6.3 Generality of Behavior Signatures
A major benefit of behavioral detection is its capability of detecting new malware based
on existing malicious behavior signatures if the new malware is written, as is commonly the
case, to possess some of the behavior of the existing malware signatures. In case of payload
signature-based detection systems, their signature database must be updated to detect the
new malware. In order to evaluate the effectiveness of ‘generalization’ in our malicious be-
havior signatures, we divide the 4 worms (Cabir, Mabir, Lasco, and Commwarrior (CW))
into 2 groups. The signatures of the first group (“known worms”) are placed in the mali-
cious behavior signature database including their partial signatures. These worms are used
122
to train the SVM classification model. The worms in the second group (“unknown worms”)
are then executed in the emulator; their signatures are captured in the monitoring layer and
comprise the test dataset. The resulting detection rates for different combinations of known
and unknown worms are summarized in Table 5.2. The results show that the combination
of TLCK-based signature generation and SVC methodology can detect “unknown” worms
even when the training data sets are relatively small. This is especially true for malware
that are similar in behavior to each other. We plan to explore this further in future so that
the size of the malicious signature database may remain small as new strains of malware
targeting handsets are discovered.
5.6.4 Evaluation with Real-world Mobile Worms
To confirm the effectiveness of our behavior-based detection, we tested it against real-
world mobile malware. We were able to collect the original samples for 2 Symbian worms,
Cabir and Lasco, whose source codes are available online. Cabir [55] replicates over Blue-
tooth connections by scanning to discover Bluetooth devices in its range and sending copies
of infected worm file (SIS file). Lasco [56] propagates via Bluetooth in the same manner
as Cabir. It is also capable of inserting itself into other SIS file found in the devices, so that
Lasco will start during the installation of the injected file.
We collected the behavior signatures for these worms by compiling and running them
on the Symbian emulator. Considering the fact that the dynamic analysis results may de-
pend on the run-time environment, we ran each malware sample 10 times with different
environmental settings such as running time, number of neighboring devices, number of
failed Bluetooth connections, etc. For example, in one setting, the number of neighboring
device is zero, thus making the worm continuously search for new devices. This generates
varying-size signatures that describe the worm behavior in each specific environment. We
apply the trained classifier (with training set 92 as in Table 5.1) on each signature. SVC
was found to achieve 100% detection of all worm instances.
In order to test the resilience of SVC to the variations of worm, we modified the source
code and implemented known worm variants based on the information in F-Secure mobile
malware descriptions [58]. Since we did not find any description for Lasco variants, we
123
only created variants for Cabir which has 32 variants (Cabir.A-Z, AA, AB, AC,AD, AE,
AF). Most of these variants are found to be minor variations of the original Cabir worm. For
example, Cabir.Z differs only in the infected SIS file name (i.e., file-renaming obfuscation)
from Cabir.B, which, in turn, differs trivially from the original Cabir by displaying a differ-
ent message on the screen. Since the behavioral detection abstracts away the name details,
these variants are easily detectable by our approach.4 As a result, we only implement major
variations which fall into 3 categories. First, the original Cabir has an implementation flaw
that makes it lock on the device found first and never search for the others, which slows
down its spreading speed. One major variant (e.g., Cabir.H) fixes this bug by enabling the
worm to search for new targets when the first device is out of range. We modified the repli-
cation routine and implemented this variation. The second major variant is Cabir.AF, which
is a size-optimized recompilation of the original Cabir. We implemented this variation by
incorporating the compression routine found in Lasco source code, which utilizes the zlib
library to compress the SIS file. Third, we implemented a synthetic behavior-reordering
obfuscation. The original Cabir worm always prepares an infected SIS file before search-
ing for nearby Bluetooth devices. In contrast, the new variant finds an available device first,
then creates SIS file and finally transfers it via Bluetooth. We collected behavior signatures
for these variants by running each of them 10 times in different environments and apply the
trained classifier. Again, SVC is found to be resilient to these obfuscation, and successfully
detects all the variants.
5.6.5 Overhead of Proxy DLL
The major overhead of our monitoring system comes from the Proxy DLL that logs
API calls in real-time. To estimate the overhead imposed by Proxy DLL, we measure the
execution times of functions before and after they are wrapped by Proxy DLL. Average
overheads for some of the typical function calls are: 564.2µs(establish a session with the
local Bluetooth service database), 670µs(display a message in the screen), 625.8µs(SMS
4Although the signature-based approach is also resilient to simple renaming obfuscation, some of thevariants (e.g., Cabir.AA) modify and recompile the source code, thus resulting in different binary imagesfrom the original worm, which may require additional signatures in case of the signature-based detection. Bycontrast, in the behavioral detection, a single behavior signature for the original worm suffices.
124
messaging library calls) and 608.5µs(allocate new objects). The overhead of Proxy DLL
is, on average, 600 microseconds. We conjecture that this is primarily due to the disk access
overhead. Because we only monitor a small subset of API calls, this overhead is acceptable
low for practical deployment.
5.6.6 Summary and Discussion of Evaluation Results
Overall, we find that the behavior signature-based detection is highly effective for mo-
bile malware and its variants. However, we also noticed the limitation of current evaluation:
the monitoring layer has not yet been implemented in a real handset due to the restricted
access of the Symbian OS kernel information which is only available to their business part-
ners or licensed users. This keeps us from testing the framework against a wide range of
normal applications whose source codes are not available. Thus, we have to resort to em-
ulation to accurately reproduce the programs’ real behavior. However, the synthetic traces
could overestimate the detection accuracy and/or underestimate the framework overhead.
We are currently collaborating with a major mobile phone manufacturer to implement the
proposed framework on real handsets. Despite this limitation, our evaluation results on
real mobile worms still suggest that the behavioral detection offers a good alternative to
signature-based detection, because of a small number of behaviors that are sufficient to
represent many families of malware.
5.7 Related Literature
The most relevant to our work are analysis of mobile viruses and worms [89, 131],
behavior-based worm detection [49, 64], backtracking [74] and Support Vectors for intru-
sion detection [65, 94]. Many well-known mobile viruses and worms, including some of
the malware mentioned in this section, have been analyzed in Chapter 4 and [131]. There
have also been recent studies to model propagation of such malware in cellular and adhoc
(e.g., in Bluetooth piconets) networks. For example, the authors of [89] proposed an ana-
lytical model called probabilistic queuing for modeling malware propagation in an ad-hoc
Bluetooth environment.
125
Recently, to overcome the limitations of signature-based detection, behavior based mal-
ware analysis and detection techniques have been proposed, mostly for the desktop envi-
ronment. Here we compare and contrast our approach with related work in the area of
behavior-based malware detection. Besides the difference in the target environment (our
approach focuses primarily on mobile malware), several important features also distinguish
our work from previous research.
Early efforts, such as the one by Forrestet al. [60, 115], are designed for host-based
anomaly detection. These approaches observe the application behavior in the form of sys-
tem calls and create a database of all the fixed-length consecutive system calls from normal
applications. Possible intrusions are discovered by looking for call sequences that do not
appear in the database. Later work improves the behavior profile by applying advanced
mining techniques on the call sequences, e.g., rule learning algorithms [37], finite-state au-
tomata [77, 113], and Hidden Markov Model [141]. All these share the same concept of
representing programs’ normal behavior with system calls and performing anomaly detec-
tion by measuring the deviation from normal profiles. One limitation of these approaches
is that they ignore the semantics of system call sequences and thus, could be evaded by
simple obfuscation or mimicry attacks [138]. To address this deficiency, Christodorescuet
al. proposed semantics-aware malware detection [87],that attempts to detect polymorphic
malware by identifying semantically-equivalent instruction sequences in the malware vari-
ants. In their work, malicious behavior e.g, decryption loop is described with a template
of instruction sequences. A matching algorithm is applied on the disassembled binaries to
find the instruction sequences that match the predefined malicious template. By abstracting
away the name of register and symbolic constants, it is resilient to several code obfuscation
techniques. However, as it requires exact matching between the template node and appli-
cation instructions, attacks using the equivalent instruction replacement and reordering are
still possible. Similar to [87], several other existing efforts also use static analysis of ap-
plication behavior to detect unwanted programs e.g., rootkit [78] and spyware [47]. The
authors in [78] propose to detects the kernel rootkits by statically analyzing kernel mod-
ules and looking for suspicious instruction sequences. The approach in [47] determines a
spyware component by statically extract a list of Windows API calls invoked in response to
126
browser events, and combines it with dynamic analysis to identify the interactions between
the component and the OS. A spyware-like behavior is detected if the component monitors
user behavior and leaks this information by invoking some API calls. Static analysis is also
widely used to collect the structural information of an executable file (e.g., control and data
flow) and detect various attacks [34] or malware [73].
Our approach differs from those mentioned above in several ways. The most signif-
icant difference lies in the definition of application behavior. Our approach observes the
programs’run-timebehavior at a higher level (i.e., system events or resource-access) than
system calls [60, 115, 141] and machine instructions [87]. This higher-level abstraction
improves resilience to polymorphism and facilitates detection of malware variants, as it ab-
stracts away more low-level implementation details. Second, our approach employs a run-
time analysis, effectively bypassing the need to deal with code/data obfuscation [130]. Run-
time analysis also avoids the possible loss of information of the static approach, since a sta-
tic analysis often fails to reveal inter-compnet/system interaction information [130] and/or
disassembly is not always possible for all binaries (Linn and Debray [84] showed that dis-
assemblers can be thwarted with simple obfuscations). Moreover, in contrast to Forrest’s
anomaly detection [60] which learns only normal applications’ behavior or Christodor-
escu’s misuse detection [87] which matches against only malicious templates, our approach
exploits information onboth normal programs’ and malware’s behaviors, and employs a
machine learning (instead of exact matching) algorithm to improve the detection accuracy.
Since the learning and classification are based on two opposite-side data sets, this approach
conceptually combines the anomaly detection with misuse detection and therefore, could
strike a balance between false positives and false negatives.
Like our approach, some existing work also leverages on the run-time analysis for im-
proving the detection accuracy. Newsome and Song [99] proposed a dynamic taint analysis
to detect the buffer overflow exploits on commodity software. Their approach is to perform
binary rewriting at run-time to track the propagation and improper use of unsafe or tainted
data. Lee and Mody [130] collected a sequence of application events at run-time and con-
structed an opaque object to represent the behavior in rich syntax. Their work is similar
to ours in that both apply a machine learning algorithm on high-level behavior represen-
127
tations. However, their work focuses on clustering malware into different families using
nearest-neighbor algorithms based on the edit distance between data samples, while we
are only interested in distinguishing normal from malicious programs. Moreover, we use
a supervised learning procedure to make best of existing normal and malicious program
information while clustering is a common unsupervised learning procedure.
Ellis et al. in [49] present a novel approach for automatic detection of Internet worms
using their behavioral signatures. These signatures were generated from worm behaviors
manifested in network traffic, e.g., tree-like propagation and changing a server into a client.
Along the same line, NetSpy [139] performs behavior characterization and differential
analysis on the network traffic to help automatically generate network-level signatures of
new spyware. Our approach is fundamentally different from [49] and [139] in that we focus
on characterization of host-based malware behavior, incorporating a wide range of system
events into behavior signatures. The Primary Response from Sana Security [64] is another
host-based behavioral approach that monitors desktop applications and employs multiple
behavioral heuristics and correlations (e.g., Registry modification, keylogging procedures,
process hijacking, etc.) to identify a malicious application. BackTracker [74] aims to au-
tomatically identify potential sequences of activities that occurred in an intrusion. Starting
with a single detection point (e.g., a suspicious file), BackTracker recursively identifies files
and processes that could have affected the detection point, and displays chains of events in
a dependency graph. We use a similar technique to build dependency graphs for generating
behavior signatures that manifest in interactions among multiple applications.
Previous research we have discussed so far dealt primarily with the desktop environ-
ment and thus does not address mobile malware that can spread via non-traditional vectors
such as Bluetooth and SMS/MMS messages. To the best of our knowledge, this is the
first attempt to construct a behavioral detection model for mobile environments. The most
relevant to our work is the analysis of mobile viruses and worms [30, 89, 131]. Many well-
known mobile viruses and worms, including some of the malware mentioned herein, have
been analyzed in [30] and [131]. Morales et.al in [93] test virus detectors for handsets
against windows mobile viruses and show that current anti-virus solution performs poorly
in identify virus variants. There have also been recent studies to model propagation of such
128
malware in cellular and ad-hoc (e.g., in Bluetooth piconets) networks [89, 119, 151, 152].
For example, the authors of [89] proposed an analytical model calledprobabilistic queu-
ing for modeling malware propagation in an ad-hoc Bluetooth environment. Although our
focus is primarily handset-based detection, analysis and propagation modeling of mobile
viruses and worms help us devise appropriate behavior signatures and response mecha-
nisms.
Applying machine learning algorithms in anomaly detection has also received consid-
erable attention [62]. Recently, Support Vector Machines (SVMs), a supervised learning
algorithm based on the pioneering work of Vapnik [134] and Joachim [68] on statistical
learning theory, have been successfully used in a number of classification problems. For
example, [94] compares the performance of neural networks-based and SVM-based sys-
tems for intrusion detection using a set of DARPA benchmark data. The authors of [65]
describe Adaptive Model Generation (AMG), a real-time architecture for implementing
data mining-based intrusion detection systems. AMG uses SVMs as one specific type of
model-generation algorithms for unsupervised anomaly detection. Methods for unsuper-
vised SVM [112] can be easily implemented in our framework, eliminating the need for
labeled training data.
5.8 Conclusion
We have presented a behavioral detection framework for viruses, worms and Trojans
that increasingly target mobile handsets. Mobile environments must cope with various
unique constraints and new features which do not exist in traditional desktop settings. Es-
pecially, a lightweight behavior classifier for malware detection is a must for resource-
constrained mobile environments.We have generated a malicious behavior signature data-
base based on a comprehensive review of mobile malware reported to date. Since behavior
signatures are fewer and shorter than traditional payload signatures, the database is com-
pact enough to be placed on a handset. A behavior signature also describes behavior for
an entire family of malware including their variants. This eliminates the need for frequent
updates of the behavior signature database as new variants appear. We have implemented
129
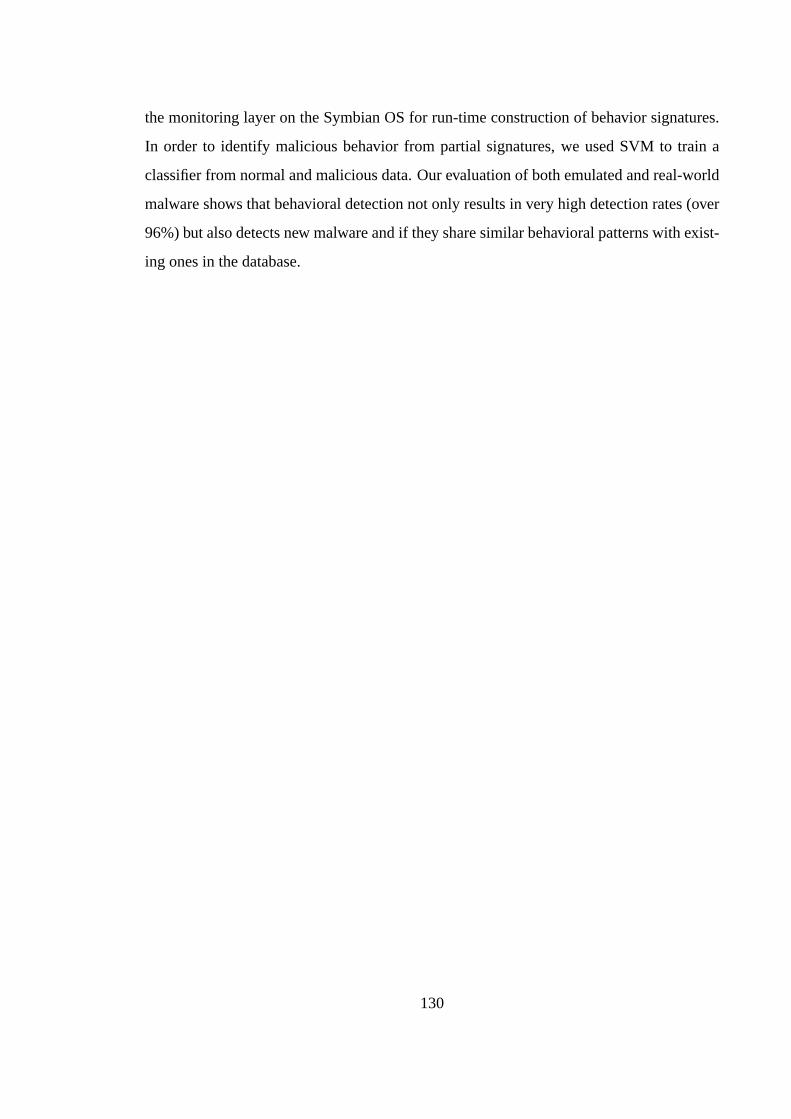
the monitoring layer on the Symbian OS for run-time construction of behavior signatures.
In order to identify malicious behavior from partial signatures, we used SVM to train a
classifier from normal and malicious data. Our evaluation of both emulated and real-world
malware shows that behavioral detection not only results in very high detection rates (over
96%) but also detects new malware and if they share similar behavioral patterns with exist-
ing ones in the database.
130
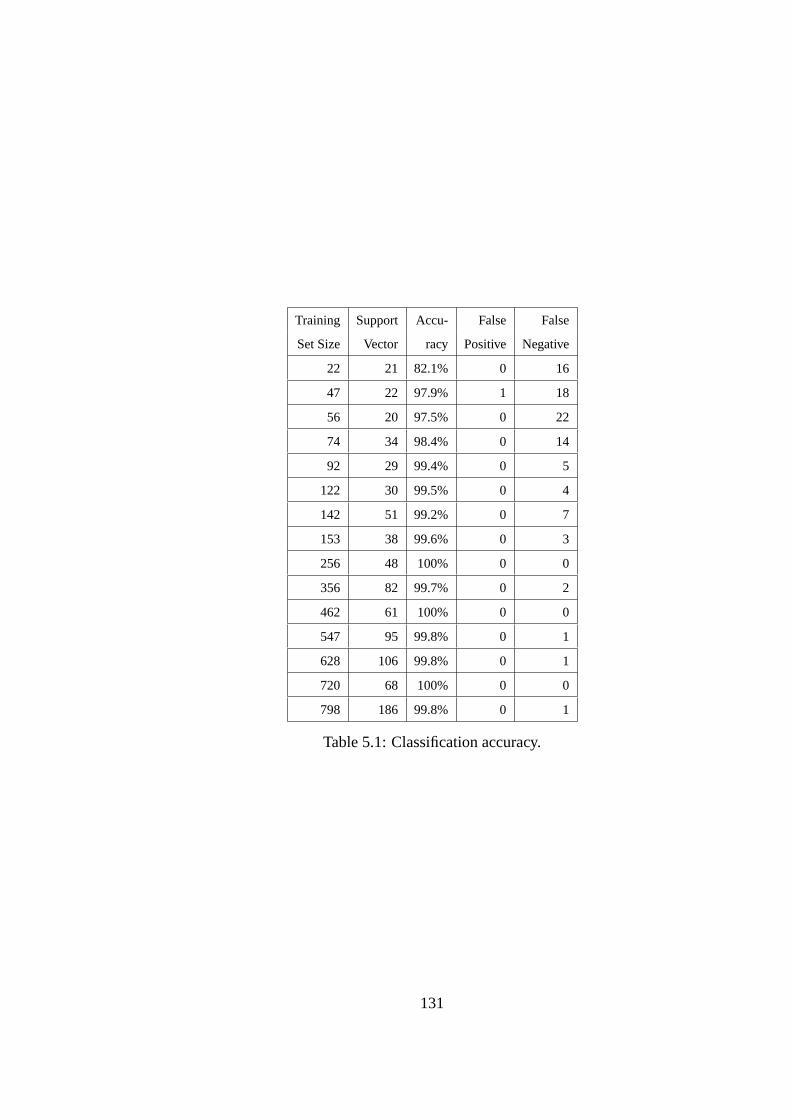
Training Support Accu- False False
Set Size Vector racy Positive Negative
22 21 82.1% 0 16
47 22 97.9% 1 18
56 20 97.5% 0 22
74 34 98.4% 0 14
92 29 99.4% 0 5
122 30 99.5% 0 4
142 51 99.2% 0 7
153 38 99.6% 0 3
256 48 100% 0 0
356 82 99.7% 0 2
462 61 100% 0 0
547 95 99.8% 0 1
628 106 99.8% 0 1
720 68 100% 0 0
798 186 99.8% 0 1
Table 5.1: Classification accuracy.
131
Training Set Testing Set Overall
Cabir Mabir CW Lasco
Cabir 100 17 35 72.5 56
Mabir 100 100 51 27 69.5
CW 100 30.5 100 69.5 75
Lasco 64.5 17.5 38.5 100 55.1
Cabir Mabir 100 100 42 54 74
Cabir CW 100 45 100 100 86.3
Cabir Lasco 100 27 50.5 100 69.4
Mabir CW 100 100 100 100 100
Mabir Lasco 100 100 100 100 100
CW Lasco 100 34.5 100 100 86.3
Cabir Mabir CW 100 100 100 76.5 94.1
Cabir Mabir Lasco 100 100 100 100 100
Cabir CW Lasco 100 99.5 100 100 99.9
Mabir CW Lasco 100 100 100 100 100
Table 5.2: Detection accuracy (%) for unknown
worms
132
CHAPTER 6
Conclusions and Future Work
In this dissertation, we investigated propagation, detection and containment of emerg-
ing malware that spread using non-traditional vectors such as power-law topologies, mobile
messaging systems, short-range RF communication channels, etc. Traditional epidemic
models of infection propagation based on node homogeneity and average degree of con-
nectivity among nodes are not suitable for capturing the propagation of these viruses and
worms. It may not always be possible to develop differential equation-based models that
can capture the underlying interactions at various time scales and heterogeneity of nodes.
Therefore, in Chapter 2, we investigated agent-based modeling to study propagation dy-
namics of these malware. Using agent-based simulation, we incorporated different services
(Bluetooth, IM, SMS/MMS, email, P2P, etc.) available on individual nodes (or,laptops,
PDAs and handsets) that are targeted by the malware at a fine-grained level. The effect
of mobility on the propagation was also studied by incorporating a number of commonly
used mobility models. Our simulations affirm that combining multiple services increases
the initial growth rate of the epidemic almost exponentially and therefore, human counter-
measures will be useless. With the increasing number of hybrid malware reported in recent
years, potential for wide-spread damage from such malware is high for both the Internet as
well as the cellular networks.
In Chapter 3, we proposed a novel containment framework calledProactive Group
Behavior Containment(PGBC) to contain malicious programs spreading in power-law
topologies such as IM and SMS/MMS networks. The main ideas behind PGBC are service-
133
behavior graphs constructed at the server from client messaging patterns and partitioning of
these graphs into behavior clusters that identify clients of similar behavior patterns. Then,
PGBC uses a combination of message rate-limiting and quarantine with increasing reac-
tion to alerts in the network. In our evaluation results for a SMS network based on real-life
SMS traces, PGBC is found to be several orders-of-magnitude more effective than tradi-
tional defenses such as “detect-and-block” and traditional client rate-limiting. Our results
show that group-based proactive defense is key to slowing down malicious codes during the
early stages of their spreading. This is critical because there is only a small time window
between the time an infection is detected and the time the cumulative number of infections
reaches an epidemic threshold. PGBC makes most of this time window by proactively
quarantining and rate-limiting vulnerable clients in the network.
In order to develop robust general-purpose detection and containment methodologies,
one must analyze current-generation malware to extract a set of their common behavior
vectors. In Chapter 4, we studied the vulnerabilities of Bluetooth and SMS/MMS mes-
saging systems in depth, and identified the vulnerabilities that may be exploited by future
mobile viruses. We have also developed the state diagram of a generic mobile virus that
can spread via SMS/MMS and Bluetooth. We used data from a large real-world cellular
carrier to generate a scaled-down topology of an SMS network and studied the propaga-
tion of this mobile virus. Our results indicate that due to heterogeneity of mobile handset
platforms and scale-free nature of the SMS network, the growth rate of a mobile virus ex-
ploiting SMS messages is small. But the growth rate increases significantly when these
handsets are highly vulnerable to Bluetooth exploits. Next, in Chapter 5, we proposed a
novel behavioral detection framework for mobile malware based on extraction of common
behavior vectors from a large number of reported mobile viruses, spyware and worms. Our
detection framework applies the TLCK logic on a set of atomic behavioral steps that the
malware must perform to create behavior signatures of broad category of malware. In order
to identify malicious behavior, we train an SVM classifier with samples of both normal as
well as malicious signatures. Our results indicate that behavioral detection not only results
in very high detection rates (over 96%) but may also detect new worms and viruses if they
display any behavioral pattern already in the database.
134
There are a number of areas where future work can be pursued.
† Service topologies: With millions of users joining P2P, IM and SMS networks, prop-
agation and containment of malware in these networks will continue to be studied.
The recent proliferation of social networks adds another dimension to the malware
problem. Accurate characterization of power-law and social networks is an area
where further research can be carried out. Reconstruction of these networks at pe-
riodic intervals will improve the accuracy and scalability of the PGBC algorithm.
For example, one can track only incremental changes of the adjacency graph in time,
instead of constructing the topology from scratch during each interval. In addition,
fast indexing into this graph is also necessary to quickly determine the list of vul-
nerable hosts when an alert is generated. Therefore, more efficient service topology
construction and search algorithms on graphs can be investigated.
† Large network simulation: In order to study mobile malware propagation in real-
life cellular networks, the AMM simulator should be optimized to handle millions of
handset agents. This requires more efficient data structures and infection propagation
algorithms. Further, parallel systems such as inexpensive Linux clusters can be used
to perform the simulation in parallel and to accommodate large number of agents by
decomposing the simulation domain into sub-domains.
† Mobile malware detection and containment: The behavioral detection methodol-
ogy presented in this dissertation should be integrated with a real-time containment
framework that can selectively control different services available on the handset.
This will ensure that voice and other services (e.g., navigation, local search etc.)
on the handset are separately monitored by the containment layer, e.g., voice calls
should not be impacted by malware that target only Bluetooth or SMS/MMS mes-
saging. It will also be necessary to develop efficient over-the-air or Internet-based
approaches for uploading new behavior signatures for the detection subsystem. As
new generations of hybrid and crossover malware continue to appear at an increasing
rate, further work will be necessary in all three aspects of malware research: propa-
gation, detection and containment.
135

APPENDIX
136
APPENDIX A
Appendix
A.1 Time-Series Modeling Techniques for Behavior Vec-
tors
In this section, we apply the VARMA and exponential smoothing techniques to generate
short-term forecasts for behavior vectors. Let us denoteYt = [y1t ;y2t ; ¢ ¢ ¢ ;ymt];0< t < ∞, be
a collection ofm time-series corresponding to themparameters of a behavior vector. Then,
the VARMA(p;q) process for a stationary multivariate time-series with a zero mean vector
can be represented as:
Yt = µ+ Σpi=1ΦiYt¡i + εt ¡ Σq
j=1Θ jεt¡ j (A.1)
whereµ(= E(Yt) is the mean vector,εt is the white noise with 0 mean and a positive
definite covariance matrixσ2. Yt ;µ andε arem£ 1 vectors. The constantsΦi andΘ j are
calledAuto-Regressive(AR) andMoving Average(MA) coefficients, respectively. These
arem£mmatrices and can be estimated with the least-squares fit. The above equation can
be written in a polynomial form by using operatorL:
Φ(L)Yt = µ+ Θ(L)εt (A.2)
LkYt = Yt¡k; L0Yt = Yt : (A.3)
137
Φ(L) andΘ(L) are characteristic polynomials of orderp andq, respectively:
Φ(L) = I ¡ Σpi=1ΦiL
i ; Θ(L) = I ¡ Σqi=1ΘiL
i : (A.4)
In Eq. (A.2), each parameteryit depends not only on its own histories, but also on time-
series data of the other parameters in the behavior vector. Such cross-dependency cannot
be observed by generating univariate ARMA models for individual elements of the behav-
ior vector. The seriesYt is both stationary and invertible when the roots ofΦ(L) = 0 and
Θ(L) = 0 are on, or outside the unit circle, respectively. The ordersp andq of the au-
toregressive and moving average terms are identified by calculating the extended sample
autocorrelation function (ESCAF). We refer to [133] for a description of the estimation
procedure.
Since VARMA is applied to stationary time-series data, we must test the stationarity
assumption of the time-series data. We assume weak stationarity, i.e., both the mean and
variance remain constant over time, and the auto-covariance depends only on the time lags
in the data. Nonstationarity in time-series data may arise from several conditions such as
drift, trend, outliers, random walk and changes in variance [150]. Of these, outliers can
often be identified from a time-sequence plot of the original series since they tend to distort
the mean, making it non-constant. A trend can be either stochastic (e.g., a random walk)
or deterministic, making the series change in level over time. In general, a nonstation-
ary series can be transformed into stationary by “differencing” (i.e., subtracting the lagged
value of the series from its current value) for stochastic trends, and by regression for deter-
ministic trends [53]. We use the Multivariate Augmented Dicky Fuller (MADF) test [128]
for stationarity. This is possible because, as observed in [106], the MA(q) component of
an ARMA(p;q) process can be represented by an AR(p) process under the condition of
invertibility of MA( q) when a large enough value ofp is chosen. Using this observation,
it is possible to test for a unit root of a time-series by estimating the auxiliary regression
equation (for components ofYt):
yit = µi + Σpj=1ρi j yit¡ j + εit (A.5)
and to test for allm equations:
138
H0 : Σpj=1ρi j ¡1 = 0;8i 2 1;2; ¢ ¢ ¢ ;m: (A.6)
We refer to [128] for further details on MADF and the solution procedure.
Recent characterization studies [71, 153] have revealed self-similarity and long-range
dependency of Internet traffic, and evidence of nonstationarity of end-to-end parameters. It
has been suggested that the notion of stationarity depends on the time scale of observation.
The above studies show that certain processes, such as loss and traffic rates, can be modeled
well as i.i.d. within the periods of stationary behavior. Similar observations on Ethernet
campus backbone traffic and studies of time-series modeling are not widely available. In
order to accurately characterize the traffic in a large enterprise network, we have recently
started a large-scale data-collection effort for a class B enterprise network. Note that the
parameters of a behavior vector, being aggregated observations, are less noisy than packet-
level observations and therefore, yield stationary processes. This is in agreement with our
studies of the enterprise network. Once we detect instability of the variance with time,
we perform variance-stabilizing transformations. There are several options such as natural
log, power and Box-Cox transformations [150] that can render the variance more stable. To
test if a particular transformation is appropriate, we used standard measures of goodness of
fit such as Mean Square Error (MSE), Akaike Information Criterion (AIC) and Schwartz
Bayesian Criterion [44, 46].
When the data in a behavior vector are insufficient, highly irregular, or the correla-
tions change rapidly over time (such situations may especially arise in mobile and wireless
segments), we model the parameters with exponential-smoothing models since VARMA
processes are not suitable for modeling such data. Instead, a window ofw traces are col-
lected periodically at an interval of∆T, and the behavior vectorsS are rebuilt at every
∆T. If each trace is of durationδt, ∆T should be chosen such that∆T ‚ wδt. We apply
exponential smoothing to the traces captured at timest andt + ∆T, to create a smoothed
series. The parameters of a behavior vector computed from the most recent traces (“ob-
servations”) are weighted higher than those in the previous window to create a forecast for
the next∆T. An accurate calculation of service interactions and the associated weights is,
therefore, dependent on several factors like window sizew, sampling interval∆T, duration
139
of each traceδt, and the smoothing parameterα (0 • α • 1). In general, the accuracy of
service-behavior graph,G, increases with larger values ofm, δt, and smaller values of∆T.
We give an example of computing a specific element(nm) of the behavior vector. letn
andq denote the number of vertices inG and the number of observed services (or protocols)
in the network, respectively. Also, letpi andr j denote any protocoli, and the number of
captured frames in tracej during ∆T, respectively. The set of messages belonging to a
protocol i and a tracej is written as[MSG(pi ; j)], and therefore,r j = ∑qi=1[MSG(pi ; j)].
A subset of these messages that belong to a given pair of verticesu andv are given by
[MSG(pi ; j)](u;v). Using these notations, we calculate the normalized number of messages,
nm(t), for an edgeeuv in G at timet as follows:
nm(t) =∑w
j=i ∑qi=1weight(pi) [MSG(pi ; j)](u;v)
∑wj=1 r j
: (A.7)
The parameterweight(pi) is a protocol-dependent weight in the network, and can be
estimated from the fraction of all messages attributed to each of the protocols, as well as
the number of hosts participating in each protocol. For example, if the traffic in a network
consists mostly of HTTP,w(HTTP) is close to1. This is done in such a way that the most
heavily-used protocols in the network have large weights. One can also build protocol-
specific subsets ofG by choosing appropriate subsets ofweight(pi).1
Let nm(t + ∆T) andnm(t) denote current and previous forecast values of the smoothed
nm(t) at t + ∆T andt, respectively. Then, applying exponential smoothing to the observed
data yields:
nm(t + ∆T) = αnm(t)+(1¡ α)nm(t): (A.8)
Eqs. (A.7) and (A.8) are used to calculate a weight for the edgeeuv in G, i.e., set
weighte(uv) = nm(t +∆T). Therefore, the weight reflects a communication cost associated
with edgeeuv.
Similarly, we calculate the vertex weights by considering the total number of ingress
and egress flows associated with each vertex. The vertex cost function can be used to
group vertices that have similar communication costs. Let[FLOW(pi ; j)](k) denote all
flows in trace j of protocol typep(i) that have vertexk as either source or destination.
1weight(pi)=0 eliminates protocolp(i) from being included in the cost function.
140

The normalized number of flows associated with vertexk at t, nf (t), its forecast value
nf (t + ∆T) and the vertex costweightv(k) are given as:
nf (t) =∑w
j=i ∑qi=1weightv(pi) [FLOW(pi ; j)](k)
∑ni=1∑w
j=1∑qi=1[FLOW(pi ; j)](k)
(A.9)
nf (t + ∆T) = αnf (t)+(1¡ α)nf (t) (A.10)
weightv(k) = nf (t + ∆T): (A.11)
141

BIBLIOGRAPHY
142
BIBLIOGRAPHY
[1] Fsg: Free small good exe packer. http://www.sac.sk/files.php?d=7&l=F.
[2] Mew 11 se 1.2. http://www.softpedia.com/get/Programming/Packers-Crypters-Protectors/MEW-SE.shtml.
[3] Rootkitrevelaer. http://www.microsoft.com/technet/sysinternals/Utilities/RootkitRevealer.mspx.
[4] Upx: the ultimate packer for executables. http://upx.sourceforge.net/.
[5] Siemens s55 cellular telephone sms confirmation message bypass vulnerability.http://www.securityfocus.com/bid/10227, 2004.
[6] Bluetooth helomoto attack. http://trifinite.org, 2005.
[7] Microsoft network messenger gif image code execution.http://xforce.iss.net/xforce/xfdb/19950, 2005.
[8] Nokia 3210 and 7610 remote obex denial of service vulnerability.http://www.securityfocus.com/bid/14948, 2005.
[9] Nokia affix bluetooth btsrv poor use of popen().http://www.digitalmunition.com/DMA
[10] Nokia affix bluetooth btsrv/btobex vulnerability. http://www.digitalmunition.com/DMA[2005-0712b].txt, 2005.
[11] Nokia affix bluetooth integer underflow. http://www.digitalmunition.com/DMA%5B2005-0423a%5D.txt, 2005.
[12] Worldwide smart phone market. http://www.canalys.com/pr/2005/r2005102.htm,2005.
[13] Ambicom bluetooth object push overflow. http://www.digitalmunition.com/DMA%5B2006-0115a%5D.txt, 2006.
[14] Bluetooth special interest group (sig). http://www.bluetooth.com/Bluetooth/SIG/,2006.
[15] Common vulnerability and exposures database. http://www.cve.mitre.org, 2006.
143
[16] Motorola bluetooth interface dialog spoofing vulnerability.http://www.securityfocus.com/bid/17190, 2006.
[17] National vulnerability database. http://nvd.nist.gov, 2006.
[18] Nokia n70 l2cap dos attack. http://www.secuobs.com/news/ 15022006-nokia n70.shtml#english, 2006.
[19] Nokia symbian os malformed nickname vulnerability.http://securitytracker.com/alerts/2005/Mar/1013380.html, 2006.
[20] Sony-ericsson bluetooth stack dos attack. http://marc.theaimsgroup.com, 2006.
[21] 2nd International Workshop Networking with Ultra Wide Band. Workshop on ultrawide band for sensor networks. July 2005.
[22] 3GPP. Ts 32.205 charging data description for the circuit switched (cs) domain,March 2003.
[23] APWG. The antiphishing working group (apwg). http://www.antiphishing.org/,2005.
[24] Justin Balthrop, Stephanie Forrest, M. E. J. Newman, and Matthew M.Williamson. Technological networks and the spread of computer viruses.Science,304(5670):527–529, April 2004.
[25] Albert-Laszlo Barabasi and Reka Albert. Emergence of scaling in random networks.Science, 286:509–512, 1999.
[26] John Bellardo and Stefan Savage. 802.11 denial-of-service attacks: Real vulnera-bilities and practical solutions. InProceedings of the USENIX Security Symposium,August 2003.
[27] Gerard Berry and Georges Gonthier. The esterel synchronous programming lan-guage: Design, semantics, implementation.Science of Computer Programming,19(2):87–152, 1992.
[28] Christian Bettstetter and Christian Hartmann. Connectivity of wireless multihopnetworks in a shadow fading environment.ACM/Springer Wireless Networks,11:5:571–579, September 2005.
[29] Eric Bonabeau. Agent-based modeling: Methods and techniques for simulatinghuman systems. InPNAS, volume 99, pages 7280–7287, 2002.
[30] A. Bose and K. G. Shin. On mobile viruses exploiting messaging and Bluetoothservices.IEEE International Conference on Security and Privacy in CommunicationNetworks (SecureComm), 2006.
144
[31] Linda Briesemeister, Patrick Lincoln, and Phillip Porras. Epidemic profiles anddefense of scale-free networks. InProceedings of the 2003 ACM Workshop on RapidMalcode (WORM), pages 67–75, October 2003.
[32] Tom Brosch and Maik Morgenstern. Runtime packers: The hidden problem? BlackHat USA 2006.
[33] Tracy Camp, Jeff Boleng, and Vanessa Davies. A survey of mobility models for adhoc network research. InWireless Communications and Mobile Computing, volume2(5), pages 483–502, 2002.
[34] Miguel Castro, Manuel Costa, and Tim Harris. Securing software by enforcing data-flow integrity. InUSENIX’06: Proceedings of the 7th conference on USENIX Sym-posium on Operating Systems Design and Implementation, pages 11–11, Berkeley,CA, USA, 2006. USENIX Association.
[35] N. Christianini and J. Shawe-Taylor. An introduction to Support Vector Machinesand other kernel-based learning methods. Cambridge University Press, 2000.
[36] Mihai Christodorescu and Somesh Jha. Testing malware detectors. InProceedings ofthe 2004 ACM SIGSOFT International Symposium on Software Testing and Analysis(ISSTA 2004), pages 34–44, Boston, MA, USA, July 2004. ACM Press.
[37] William W. Cohen. Fast effective rule induction. In Armand Prieditis and StuartRussell, editors,Proc. of the 12th International Conference on Machine Learning,pages 115–123, Tahoe City, CA, July 9–12, 1995. Morgan Kaufmann.
[38] Symantec Corp. Symantec internet security threat report trends for janu-ary 06cjune 06. http://eval.symantec.com/mktginfo/enterprise/whitepapers/ent-whitepapersymantecinternetsecuritythreatreport x 09 2006.en-us.pdf, 2003.
[39] F-Secure Corporation. F-Secure mobile anti-virus. http://mobile.f-secure.com,2006.
[40] IBM Corporation. Ibm tivoli configuration manager. http://www-306.ibm.com/software/tivoli/products/config-mgr/.
[41] Kaspersky Corporation. Kaspersky Anti-Virus Mobile.http://usa.kaspersky.com/productsservices/antivirus-mobile.php, 2006.
[42] Symantec Corporation. W32.nimda.a@mm virus description.http://securityresponse.symantec.com/avcenter/venc /data/[email protected],September 2001.
[43] D. Dagon, X. Qin, G. Gu, W. Lee, J. Grizzard, J. Levine, and H. Owen. HoneyStat:local worm detection using honeypots.Intl. Symp. on Recent Advances In IntrusionDetection (RAID), 2004.
[44] F. Diebold.Elements of Forecasting. South-Western College Publishing, 1998.
145
[45] H. Ebel, L. Mielsch, and S. Bornholdt. Scale-free topology of e-mail networks. InPhys. Rev. E, volume 66, 2002.
[46] G. Ege.SAS ETSUser’s Guide, 2nd Edition. SAS Institute Press, 1993.
[47] E.Kirda, C.Kruegel, G.Banks, G.Vigna, and R.Kemmerer. Behavior-based spywaredetection. InProceedings of the 15th USENIX Security Symposium, 2006.
[48] Daniel R. Ellis. Worm anatomy and model. InWORM ’03: Proceedings of the 2003ACM workshop on Rapid malcode, pages 42–50, 2003.
[49] Daniel R. Ellis, John G. Aiken, Kira S. Attwood, and Scott D. Tenaglia. A behav-ioral approach to worm detection. InWORM ’04: Proceedings of the 2004 ACMworkshop on Rapid malcode, pages 43–53, 2004.
[50] Daniel R. Ellis, John G. Aiken, Kira S. Attwood, and Scott D. Tenaglia. A behav-ioral approach to worm detection. InWORM ’04: Proceedings of the 2004 ACMworkshop on Rapid malcode, pages 43–53, 2004.
[51] E. A. Emerson and J. Y. Halpern.Decision procedures and expressiveness in thetemporal logic of branching time. ACM Press New York, NY, USA, 1982.
[52] William Enck, Patrick Traynor, Patrick McDaniel, and Tom La Porta. Exploitingopen functionality in sms-capable cellular networks. InProceedings of the 12thACM Conference on Computer and Communications Security (CCS), pages 393–404, November 2005.
[53] Walter Enders.Applied Econometric Time Series, 2nd Edition. Wiley, 2003.
[54] F-Secure. SymbOS.Cardtrap Trojan description. http://www.f-secure.com/v-descs/cardtrapa.shtml, September 2005.
[55] F-secure. Cabir. http://www.f-secure.com/v-descs/cabir.shtml, 2006.
[56] F-secure. Lasco.a. http://www.f-secure.com/v-descs/lascoa.shtml, 2006.
[57] F-Secure. SymbOS.Acallno Trojan description. http://www.f-secure.com/sw-desc/acallnoa.shtml, August 2006.
[58] F-secure. Mobile detection descriptions. http://www.f-secure.com/v-descs/mobile-description-index.shtml, 2007.
[59] H. H. Feng, O. M. Kolesnikov, P. Fogla, and W. Lee. Anomaly detection using callstack information.IEEE Symposium on Security and Privacy, pages 62–75, 2003.
[60] Stephanie Forrest, Steven A. Hofmeyr, Anil Somayaji, and Thomas A. Longstaff. Asense of self for Unix processes. InProceedinges of the 1996 IEEE Symposium onResearch in Security and Privacy, pages 120–128. IEEE Computer Society Press,1996.
146
[61] FSecure. F-secure virus descriptions : Cardtrap.a. http://www.f-secure.com/v-descs/cardtrapa.shtml, December 2004.
[62] Anup K. Ghosh, Aaron Schwartzbard, and Michael Schatz. Learning program be-havior profiles for intrusion detection. InID’99: Proceedings of the 1st conferenceon Workshop on Intrusion Detection and Network Monitoring, pages 6–6, Berkeley,CA, USA, 1999. USENIX Association.
[63] K. A. Heller, K. M. Svore, A. D. Keromytis, and S. J. Stolfo. One class SupportVector Machines for detecting anomalous Windows Registry accesses.IEEE DataMining for Computer Security Workshop, 1401, 2003.
[64] S. Hofmeyr and M. Williamson. Primary response technical white paper. InSanaSecurity, 2005.
[65] A. Honig, A. Howard, E. Eskin, and S. Stolfo. Adaptive model generation:: Anarchitecture for the deployment of data minig-based intrusion detection systems.Data Mining for Security Applications, 2002.
[66] In-Stat. 3g cellular deployment report. http://www.instat.com, March 2006.
[67] Trend Micro Incorporated. Trend Micro mobile security.http://www.trendmicro.com/en/ products/mobile/tmms/, 2006.
[68] T. Joachims. Making large-scale support vector machine learning practical. InB. Scholkopf, C. Burges, and A. Smola, editors,Advances in Kernel Methods: Sup-port Vector Machines. MIT Press, Cambridge, MA, 1998.
[69] J. Jung, V. Paxson, A. Berger, and H. Balakrishnan. Fast portscan detection usingsequential hypothesis testing. InIn Proceedings of the IEEE Symposium on Securityand Privacy, May 2004.
[70] Yariv Kaplan. API spying techniques for Windows 9x, NT and 2000.http://www.internals.com/articles/apispy/apispy.htm, 2000.
[71] T. Karagiannis, M. Molle, M. Faloutsos, and A. Broido. A nonstationary poissonview of internet traffic. InIEEE INFOCOM, March 2004.
[72] J. Kephart and S. White. Directed-graph epidemiological models of computerviruses. InProceedings of the IEEE Computer Symposium on Research in Secu-rity and Privacy, pages 343–359, May 1991.
[73] Johannes Kinder, Stefan Katzenbeisser, Christian Schallhart, and Helmut Veith. De-tecting malicious code by model checking. InGI SIG SIDAR Conference on De-tection of Intrusions and Malware & Vulnerability Assessment (DIMVA’05), volume3548 ofLecture Notes in Computer Science, pages 174–187. Springer, july 2005.
[74] S. T. King and P. M. Chen. Backtracking intrusions.ACM Transactions on ComputerSystems (TOCS), 23(1):51–76, 2005.
147
[75] Jon Kleinberg. The wireless epidemic.Nature, 449(20):287–288, September 2007.
[76] Konstantin Klemm and Victor M. Eguluz. Highly clustered scale-free networks.Physical Review E, 65, December 2002.
[77] Andrew P. Kosoresow and Steven A. Hofmeyr. Intrusion detection via system calltraces.IEEE Softw., 14(5):35–42, 1997.
[78] Christopher Kruegel, William Robertson, and Giovanni Vigna. Detecting kernel-level rootkits through binary analysis. InACSAC ’04: Proceedings of the 20thAnnual Computer Security Applications Conference (ACSAC’04), pages 91–100,Washington, DC, USA, 2004. IEEE Computer Society.
[79] Kaspersky Lab. Mobile malware evolution: An overview, part 2.http://www.viruslist.com/en/analysis?pubid=201225789.
[80] Kaspersky Lab. Mobile threats - myth or reality?http://www.viruslist.com/en/weblog?weblogid=204924390.
[81] L. Lamport. Time, clocks, and the ordering of events in a distributed system.Com-munications of the ACM, 21(7):558–565, 1978.
[82] B. Liang and Z. Haas. Predictive distance-based mobility management for pcs net-works. InProceedings of the INFOCOM, March 1999.
[83] M. Liljenstam, D. Nicol, V. Berk, and R. Gray. Simulating realistic network wormtraffic for worm warning system design and testing. InProceedings of the 2003 ACMWorkshop on Rapid Malcode (WORM 2003), 2003.
[84] C. Linn and S. Debray. Obfuscation of executable code to improve resistance tostatic disassembly, 2003.
[85] Mohammad Mannan and Paul C. van Oorschot. Instant messaging worms, analysisand countermeasures. In3rd Workshop on Rapid Malcode (WORM), 2005.
[86] P. McDaniel, S. Sen, O. Spatscheck, J. Van der Merwe, B. Aiello, and C. Kalmanek.Enterprise security: A community of interest based approach. InIn Proc. of NDSS,2006.
[87] M.Christodorescu, S.Jha, S.A.Seshia, D.Song, and R.E.Bryant. Semantics-awaremalware detection. InProceedings of the IEEE Symposium on Security and Privacy,2005.
[88] L. McLaughlin. Bot software spreads, causes new worries.IEEE Distributed Sys-tems Online, 5, 2004.
[89] James W. Mickens and Brian D. Noble. Modeling epidemic spreading in mobileenvironments. InProceedings of the 2005 ACM Workshop on Wireless Security(WiSe 2005), September 2005.
148
[90] Douglas Montgomery, Lynwood Johnson, and John Gardner.Forecasting and TimeSeries Analysis, 2nd Edition. McGraw-Hill, Inc., 1990.
[91] D. Moore, C. Shannon, and J. Brown. Code-red: a case study on the spread andvictims of an internet worm. InACM Internet Measurement Workshop, 2002.
[92] David Moore, Vern Paxson, Stefan Savage, Colleen Shannon, Stu-art Staniford, and Nicholas Weaver. Inside the slammer worm.http://www.computer.org/security/v1n4/j4wea.htm, 2003.
[93] Jose Andre Morales, Peter J. Clarke, Yi Deng, and B. M. Golam Kibria. Testingand evaluating virus detectors for handheld devices.Journal in Computer Virology,2(2):135–147, November 2006.
[94] S. Mukkamala, G. Janoski, and A. Sung. Intrusion detection using neural networksand support vectormachines.Intl. Joint Conf. on Neural Networks, 2002, 2, 2002.
[95] W. Navidi, T. Camp, and N. Bauer. Improving the accuracy of random waypoint sim-ulations through steady-state initialization. InProceedings of the 15th InternationalConference on Modeling and Simulation, pages 319–326, March 2004.
[96] J. Nazario.Defense and Detection Strategies against Internet Worms. Artech House,2003.
[97] M. Newman. The structure and function of complex networks. InSIAM Review,45(2):167– 256, 2003.
[98] J. Newsome, B. Karp, and D. Song. Polygraph: automatically generating signaturesfor polymorphic worms.IEEE Symposium on Security and Privacy, pages 226–241,2005.
[99] J. Newsome and D. Song. Dynamic taint analysis for automatic detection, analysis,and signature generation of exploits on commodity software. InProceedings ofnetwork and Distributed System Security Symposium, 2005.
[100] William Stafford Noble. Gist support vector machine. http://svm.sdsc.edu/svm-overview.html, 2006.
[101] R. Pastor-Satorras and A. Vespignani. Epidemics and immunization in scale-freenetworks. InHandbook of Graphs and Networks, Wiley-VCH, Berlin, 2003.
[102] W. Penczek. Temporal logic of causal knowledge.Proc. of WoLLiC, 98, 1998.
[103] K.S. Perumalla and S. Sundaragopalan. High-fidelity modeling of computer networkworms. InAnnual Computer Security Applications Conference (ACSAC), December2004.
[104] P. Porras, L. Briesemeister, K. Skinner, K.Levitt, J. Rowe, and Y. A. Ting. A hybridquarantine defense. InACM workshop on Rapid malcode (WORM), pages 73–82,October 2004.
149
[105] RAV. Vbs/timofonica virus description. http://www.ravantivirus.com/virus/showvirus.php?v=56,June 2000.
[106] S. E. Said and D. A. Dickey. Testing for unit roots in autoregressive-moving averagemodels with unknown order.Biometrika, pages 599–608, 1984.
[107] Vidyut Samanta. A study of mobile messaging services.UCLA Master’s Thesis,2005.
[108] S. Saroiu, P. K. Gummadi, and S. D. Gribble. A measurement study of peer-to-peerfile sharing systems. InIn Proceedings of Multimedia Computing and Networking,2002.
[109] S. Schechter, J. Jung, and A. Berger. Fast detection of scanning worm infections.In In Proceedings of the Seventh International Symposium on Recent Advances inIntrusion Detection, 2004.
[110] M. T. Schlosser, T. E. Condie, and S. D. Kamvar. Simulating a file-sharing p2pnetwork. InFirst Workshop on Semantics in P2P and Grid Computing, 2002.
[111] Bruce Schneier. Phishing without computers.http://www.schneier.com/blog/archives /2005/10/phishingwithou.html, 2005.
[112] B. Scholkopf, J.C. Platt, J. Shawe-Taylor, A.J. Smola, and R.C. Williamson. Es-timating the Support of a High-Dimensional Distribution.Neural Computation,13(7):1443–1471, 2001.
[113] R. Sekar, M. Bendre, D. Dhurjati, and P. Bollineni. A fast automaton-based methodfor detecting anomalous program behaviors. InSP ’01: Proceedings of the 2001IEEE Symposium on Security and Privacy, page 144, Washington, DC, USA, 2001.IEEE Computer Society.
[114] S. Singh, , C. Estan, G. Varghese, and S. Savage. The EarlyBird system for real-timedetection of unknown worms.ACM Workshop on Hot Topics in Networks, 2003.
[115] A. Somayaji and S.Forrest. Automated response using system-call delays. InPro-ceedings of the USENIX Security Symposium, 2000.
[116] Stuart Staniford, Vern Paxson, and Nicholas Weaver. How to 0wn the internet inyour spare time.11th USENIX Security Symposium, August 2002.
[117] S. Staniford-Chen, S. Cheung, R. Crawford, M. Dilger, J. Frank, J. Hoagland,K. Levitt, C. Wee, R. Yip, and D. Zerkle. GrIDS – A graph-based intrusion de-tection system for large networks. InProceedings of the 19th National InformationSystems Security Conference, 1996.
[118] S. J. Stolfo. Worm and attack early warning: piercing stealthy reconnaissance.IEEESecurity & Privacy Magazine, 02(3), May 2004.
150
[119] Jing Su, Kelvin K. W. Chan, Andrew G. Miklas, Kenneth Po, Ali Akhavan, StefanSaroiu, Eyal de Lara, and Ashvin Goel. A preliminary investigation of worm in-fections in a bluetooth environment. InWORM ’06: Proceedings of the 4th ACMworkshop on Recurring malcode, pages 9–16, New York, NY, USA, 2006. ACMPress.
[120] Symantec. Palm.phage.dropper virus descrip-tion. http://securityresponse.symantec.com/avcenter/venc/data/palm.phage.dropper.html, September 2000.
[121] Symantec. W32.hllw.fizzer@mm worm. http://securityresponse.symantec.com/avcenter/venc/data/[email protected], 2003.
[122] Symantec. Symbos.commwarrior worm descrip-tion. http://securityresponse.symantec.com/avcenter/venc/data/symbos.commwarrior.a.html, October 2005.
[123] Symantec. Symbos.mabir worm description.http://securityresponse.symantec.com/avcenter/venc /data/symbos.mabir.html,April 2005.
[124] Symantec. W32.spybot.ivq worm. http://securityresponse.symantec.com/avcenter/venc/data/w32.spybot.ivq.html, 2005.
[125] Symantec. Symantec internet security threat report.http://www.symantec.com/enterprise/threatreport/index.jsp, March 2006.
[126] Symbian. Symbian Signed platform security. http://www.symbiansigned.com.
[127] Cisco Systems. Cisco network admission control. http://www.cisco.com, 2003.
[128] M. P. Taylor and L. Sarno. The behavior of real exchange rates during the post-bretton woods period.Journal of International Economics, 46(2):281–312, Decem-ber 1998.
[129] T.Garfinkel, B.Pfaff, J.Chow, M.Rosenblum, and D.B.Terra. A virtual machine-based platform for trusted computing. InProceedings of the Symposium on Operat-ing Systems Principles, 2003.
[130] T.Lee and J.J.Mody. Behavioral classification.http://www.microsoft.com/downloads/details.aspx?FamilyID=7b5d8cc8-b336-4091-abb5-2cc500a6c41a&displaylang=en, 2006.
[131] S. Toyssy and M. Helenius. About malicious software in smartphones.Journal inComputer Virology, 2(2):109–119, 2006.
[132] Inc. Trend Micro. Network viruswall outbreak prevention appliance.http://www.trendmicro.com, 2004.
151
[133] R. S. Tsay and G. C. Tiao. Consistent estimates of autoregressive parameters and ex-tended sample autocorrelation function for stationary and nonstationary arma model.Journal of the American Statistical Association, pages 84–96, March 1984.
[134] V. Vapnik. The Nature of Statistical Learning Theory. Springer, New York, 1995.
[135] Viruslist.com. Instant messaging worm win32.opanki.d.http://www.viruslist.com/en/viruses/encyclopedia?virusid=84950.
[136] L. von Ahn, M. Blum, and J. Langford. Telling humans and computers apart auto-matically, 2004.
[137] A. Wagner, T. Dbendorfer, B. Plattner, and R. Hiestand. Experiences with wormpropagation simulations. InProceedings of the 2003 ACM Workshop on Rapid Mal-code, 2003.
[138] D. Wagner and P. Soto. Mimicry attacks on host based intrusion detection systems,2002.
[139] H. Wang, S. Jha, and V. Ganapathy. NetSpy: Automatic generation of spywaresignatures for NIDS. InProceedings of Annual Computer Security ApplicationsConference, 2006.
[140] K. Wang, G. Cretu, and S. J. Stolfo. Anomalous payload-based worm detectionand signature generation.International Symposium on Recent Advances in IntrusionDetection (RAID), 2005.
[141] Christina Warrender, Stephanie Forrest, and Barak A. Pearlmutter. Detecting intru-sions using system calls: Alternative data models. InIEEE Symposium on Securityand Privacy, pages 133–145, 1999.
[142] N. Weaver, V. Paxson, S. Staniford, and R. Cunningham. Large scale maliciouscode: A research agenda. InDARPA and Silicon Defense Technical Report, May2003.
[143] N. Weaver, S. Staniford, and V. Paxson. Very fast containment of scanning worms.In 13th USENIX Security Symposium, August 2004.
[144] Nicholas Weaver, Vern Paxson, Stuart Staniford, and Robert Cunningham. A taxon-omy of computer worms. InACM Workshop on Rapid Malcode (WORM), October2003.
[145] Songjie Wei, Jelena Mirkovic, and Martin Swany. Distributed worm simulation witha realistic internet model. InPrinciples of Advanced and Distributed Simulation(PADS), 2005.
[146] Ollie Whitehouse. Redfang 2.5. http://www.net-security.org/software.php?id=519,2003.
152
[147] M. Williamson, A. Parry, and A. Byde. Virus throttling for instant messaging. InVirus Bulletin Conference, 2004.
[148] M. M. Williamson. Throttling viruses: restricting propagation to defeat maliciousmobile code. In18th Annual Computer Security Applications Conference, pages61–68, December 2002.
[149] C. Wong, S. Bielski, A. Studer, and C. Wang. Empirical analysis of rate limitingmechanisms. InProc. 8th International Symposium on Recent Advances in IntrusionDetection (RAID), 2005.
[150] Robert A. Yaffee and Monnie McGee.An Introduction to Time Series Analysis andForecasting. Academic Press, 2000.
[151] Guanhua Yan, , and Stephan Eidenbenz. Bluetooth worms: Models, dynamics, anddefense implications. InComputer Security Applications Conference, 2006. ACSAC’06. 22nd Annual, 2006.
[152] Guanhua Yan, Hector D. Flores, Leticia Cuellar, Nicolas Hengartner, Stephan Ei-denbenz, and Vincent Vu. Bluetooth worm propagation: mobility pattern matters!In ASIACCS ’07: Proceedings of the 2nd ACM symposium on Information, com-puter and communications security, pages 32–44, New York, NY, USA, 2007. ACMPress.
[153] Y. Zhang, N. Duffield, V. Paxson, and S. Shenker. On the constancy of internet pathproperties. InACM SIGCOMM Internet Measurement Workshop, 2001.
[154] L. Zhou, L. Zhang, F. McSherry, N. Immorlica, M. Costa, and S. Chien. A firstlook at peer-to-peer worms: threats and defenses. In4th International Workshop onPeer-To-Peer Systems, 2005.
[155] C. Zou, W. Gong, and D. Towsley. Worm propagation modeling and analysis un-der dynamic quarantine defense. InACM Workshop on Rapid Malcode (WORM),October 2003.
[156] C. Zou, D. Towsley, and W. Gong. A firewall network system for worm defensein enterprise networks. InUMass ECE Technical Report TR-04-CSE-01, February2004.
[157] C. C. Zou, W. Gong, D. Towsley, and L. Gao. The monitoring and early detection ofInternet worms.IEEE/ACM Transactions on Networking, 13(5):961–974, 2005.
[158] C. C. Zou, D. Towsley, and W. Gong. Email worm modeling and defense. In13th In-ternational Conference on Computer Communications and Networks (ICCCN’04),2004.
153
Related Documents
![GQ: Practical Containment for Measuring Modern Malware Systems · Third, we present insights from our extensive oper- ational experience [4,9,13,17,18,24] in developing containment](https://static.cupdf.com/doc/110x72/5d4f47a688c993d6278b6fad/gq-practical-containment-for-measuring-modern-malware-third-we-present-insights.jpg)