Promoting rational use of antibiotics in low/middle income countries: Focus on S. E. Asia Kathleen Holloway Former Regional Advisor in Essential Medicines WHO/SEARO Visiting Fellow IDS May 2017

Promoting rational use of antibiotics in low and middle income countries
Jan 22, 2018
Welcome message from author
This document is posted to help you gain knowledge. Please leave a comment to let me know what you think about it! Share it to your friends and learn new things together.
Transcript

Promoting rational use of antibiotics in low/middle
income countries:Focus on S. E. Asia
Kathleen Holloway
Former Regional Advisor in Essential Medicines WHO/SEARO
Visiting Fellow IDS
May 2017

0
5
10
15
20
25
30
35
FR GR LU PT IT BE SK HR PL IS IE ES FI BG CZ SI SE HU NO UK DK DE LV AT EE NL
DD
D p
er 1
000
inh
. per
day
Variation in OPD AB use in 26 European countries 2002Source: Goosens et al, Lancet, 2005; 365: 579-587; ESAC project.
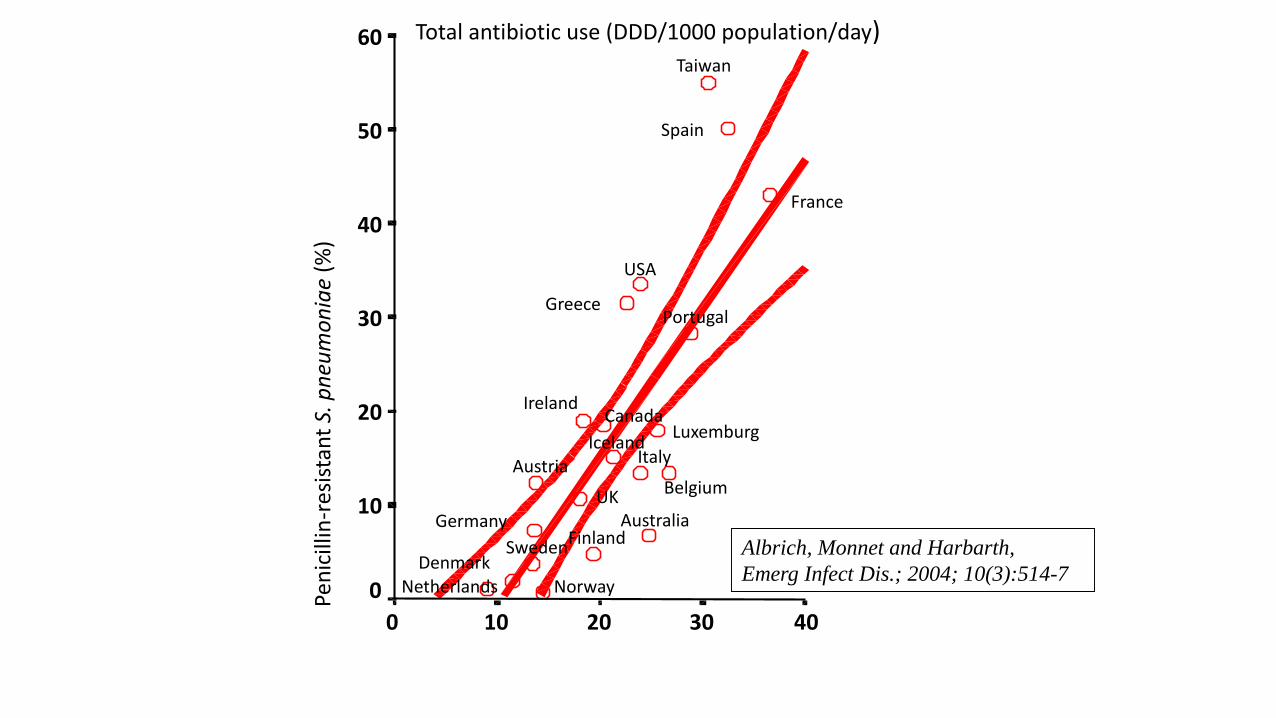
Total antibiotic use (DDD/1000 population/day)
403020100
Pen
icill
in-r
esis
tan
t S.
pn
eum
on
iae
(%)
60
50
40
30
20
10
0
USA
UK
Sweden
Spain
Portugal
NorwayNetherlands
Luxemburg
Italy
Ireland
Iceland
Greece
Germany
France
Finland
Denmark
Canada
BelgiumAustria
Australia
Albrich, Monnet and Harbarth,
Emerg Infect Dis.; 2004; 10(3):514-7
Taiwan

Percent change in antibiotic consumption,
out-patient care in 25 European countries 1997-2003Data from ESAC
-20
-15
-10
-5
0
5
10
15
20
25
Poland
Croatia
Gre
ece
Irela
nd
Portugal
Denmark
Luxem
bourg
HungaryIta
ly
Slova
kia
Isra
el
Norway
Sweden
Austria
Slove
nia
Estonia
Finla
nd
Spain
The Neth
erlands
Germ
any
Belgiu
m
Icela
nd
Czech
Republic UK
France
Per
cen
t ch
ang
e
For Iceland, total data (including hospitals) are used
Increase
Slide courtesy of Otto Cars, STRAMA, Sweden
% change in AB outpatient consumption in 25 European countries 1997-2003, ESAC Data
Decrease
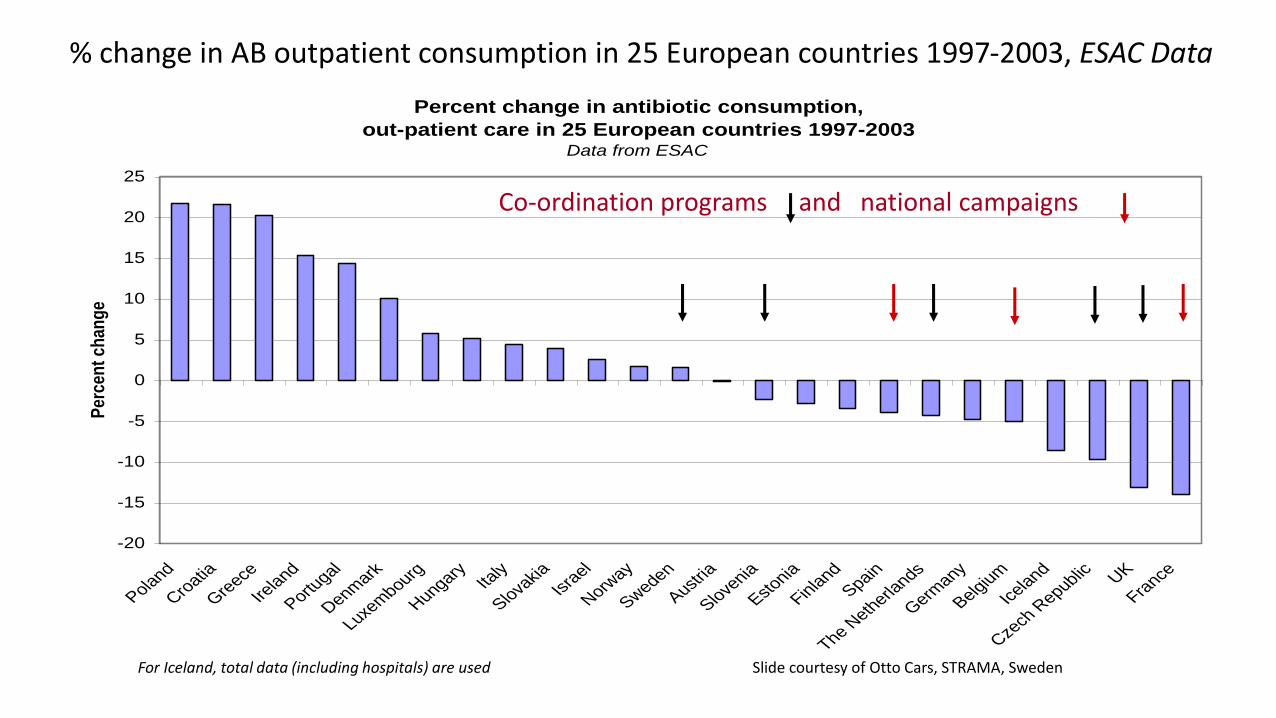
Percent change in antibiotic consumption,
out-patient care in 25 European countries 1997-2003Data from ESAC
-20
-15
-10
-5
0
5
10
15
20
25
Poland
Croatia
Gre
ece
Irela
nd
Portugal
Denmark
Luxem
bourg
HungaryIta
ly
Slova
kia
Isra
el
Norway
Sweden
Austria
Slove
nia
Estonia
Finla
nd
Spain
The Neth
erlands
Germ
any
Belgiu
m
Icela
nd
Czech
Republic UK
France
Per
cen
t ch
ang
e
For Iceland, total data (including hospitals) are used
Co-ordination programs and national campaigns
Slide courtesy of Otto Cars, STRAMA, Sweden
% change in AB outpatient consumption in 25 European countries 1997-2003, ESAC Data

Medicines use in PHC in LMIC
• WHO database of all medicines use surveys using standard indicators in primary care in developing and transitional countries
• Studies identified from INRUD bibliog, PUBMED, WHO archives
• Data on study setting, interventions, methods and drug use extracted & entered
• All data extraction and entry checked by 2 persons
• Now > 1400 studies entered
• Systematic quantitative review
• Data analysis published in 2009, 2014, 2015 & used for WHA60.16 in 2007

Trends in AB use in Primary Care, WHO Database 2015
0
10
20
30
40
50
60
70
80
90
<1990 1990-4 1995-9 2000-4 2005-9 2010-14
% patients given ABs (n=32, 134, 193, 175, 92, 62)
% diarrhoea cases given ABs (n=17, 88, 49, 61, 37, 14)
% URTI cases given ABs (n=13, 53, 70, 92, 35, 40)

AB use in Primary Care in WHO regions 2010-2014, WHO Database 2015
0
10
20
30
40
50
60
70
80
90
AFRO EMRO SEARO WPRO
% patients given ABs (n=26,10,53,32) % diarrhoea cases given ABs (n=6,8,13,1)
% URTI cases given ABs (n=6,2,25,20)
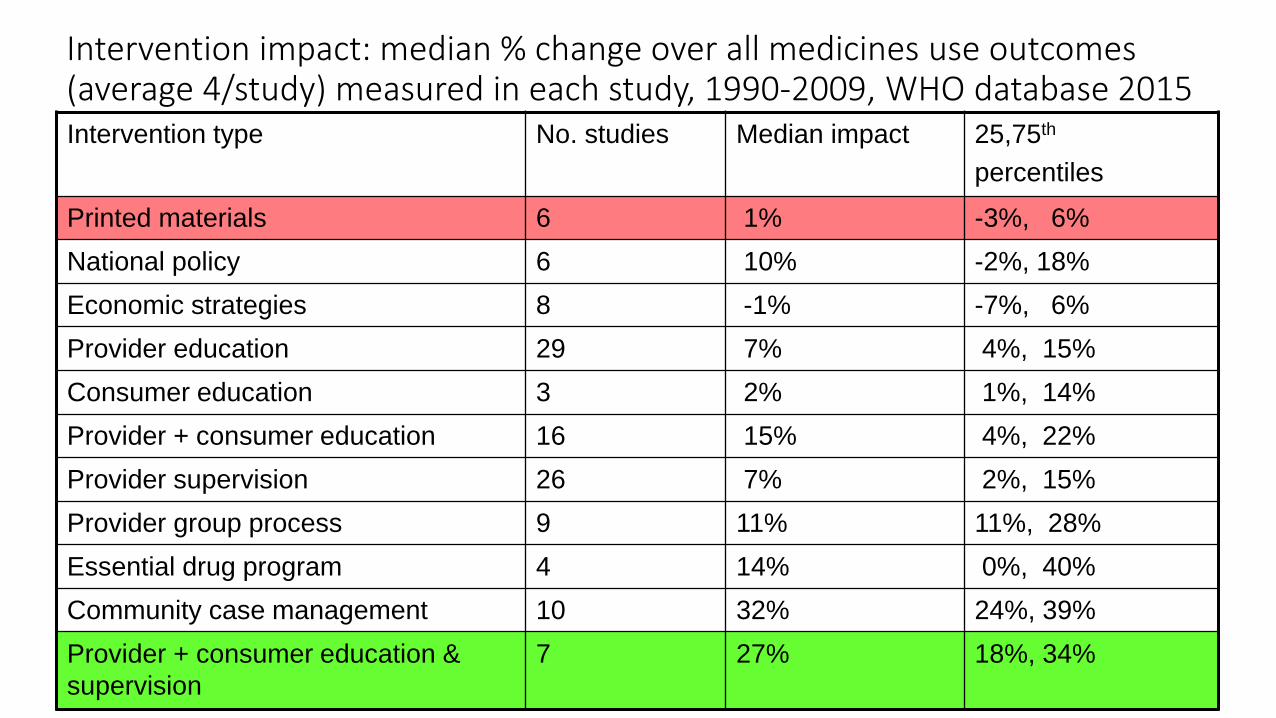
Intervention impact: median % change over all medicines use outcomes (average 4/study) measured in each study, 1990-2009, WHO database 2015Intervention type No. studies Median impact 25,75th
percentiles
Printed materials 6 1% -3%, 6%
National policy 6 10% -2%, 18%
Economic strategies 8 -1% -7%, 6%
Provider education 29 7% 4%, 15%
Consumer education 3 2% 1%, 14%
Provider + consumer education 16 15% 4%, 22%
Provider supervision 26 7% 2%, 15%
Provider group process 9 11% 11%, 28%
Essential drug program 4 14% 0%, 40%
Community case management 10 32% 24%, 39%
Provider + consumer education &
supervision
7 27% 18%, 34%
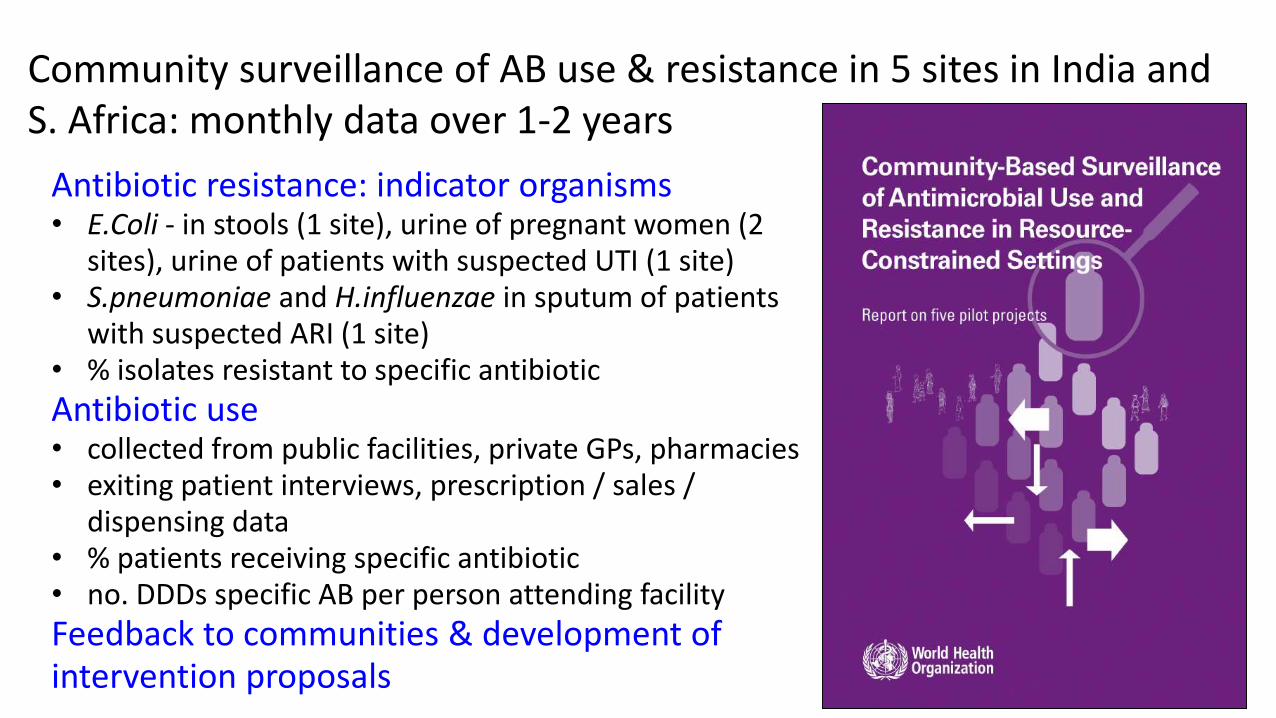
Community surveillance of AB use & resistance in 5 sites in India and S. Africa: monthly data over 1-2 years
Antibiotic resistance: indicator organisms• E.Coli - in stools (1 site), urine of pregnant women (2
sites), urine of patients with suspected UTI (1 site) • S.pneumoniae and H.influenzae in sputum of patients
with suspected ARI (1 site)• % isolates resistant to specific antibiotic
Antibiotic use• collected from public facilities, private GPs, pharmacies• exiting patient interviews, prescription / sales /
dispensing data• % patients receiving specific antibiotic• no. DDDs specific AB per person attending facility
Feedback to communities & development of intervention proposals

AB resistance & use in India & S. Africa: results• AMR rates high: E.coli S. pneu/H. influ
Antibiotic Commensals(India) Pathogens(India) CP mix (S.Africa) CP mix (S.Africa)
Cotrimoxazole 24-56% 46-65% 52% 50%
Amoxycillin 18-52% 52-85% 66% 50 -70%
Ciprofloxacin 4-34% 32-59% 2%
• Higher AB use in India compared to S. Africa in all sites & facility types
Public facilities Private facilities
% patients receiving ABs: 28-48% (India), 16-26% (S.Africa) 43-51% (India), 12-13% (S.Africa)
• Inexpensive older ABs (cotrimox, tetracycline) used more in public facilities & expensive newer ABs (fluoroquinolines, cephalosporins) in private facilities in all sites.
• Seasonal variation for AB use followed by similar changes in AMR after 3-month lag.
• Intervention proposals based on community feedback & qualitative investigation into reasons underlying behaviour developed, but funders not found.
• Very serious weaknesses in local tech. capacity to undertake AB use & AMR surveillance
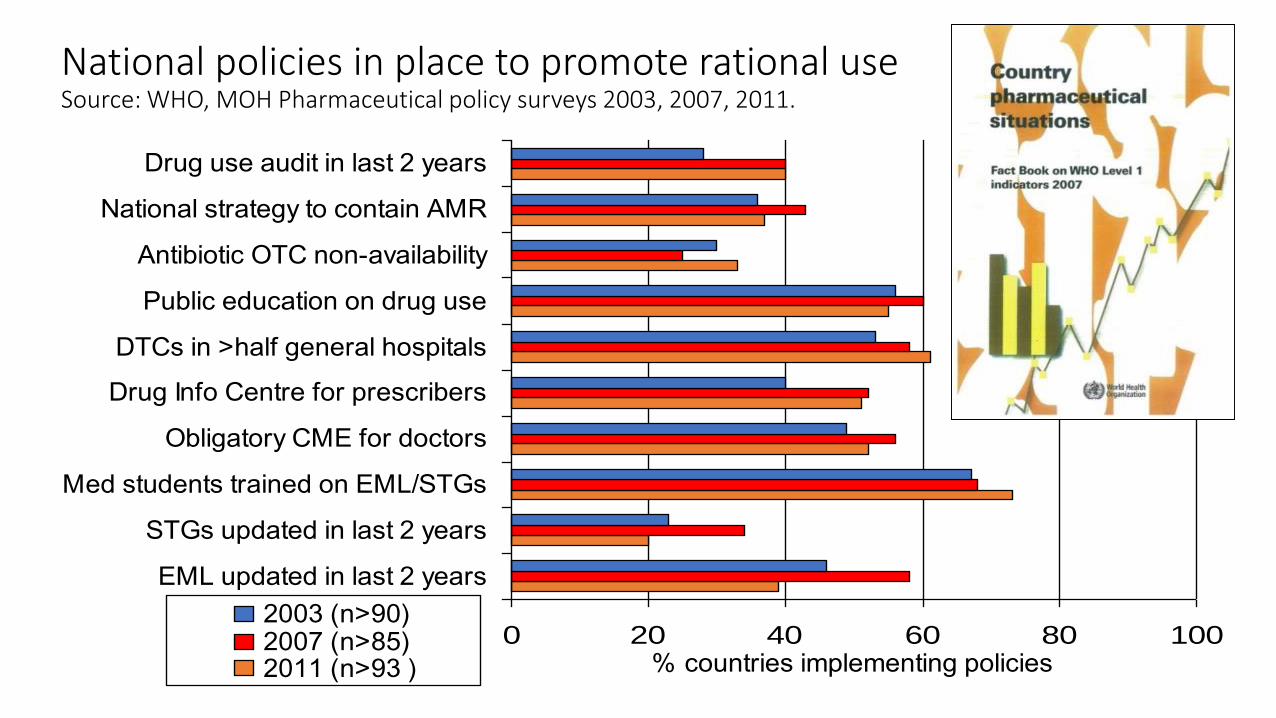
National policies in place to promote rational use Source: WHO, MOH Pharmaceutical policy surveys 2003, 2007, 2011.
0 20 40 60 80 100
EML updated in last 2 years
STGs updated in last 2 years
Med students trained on EML/STGs
Obligatory CME for doctors
Drug Info Centre for prescribers
DTCs in >half general hospitals
Public education on drug use
Antibiotic OTC non-availability
National strategy to contain AMR
Drug use audit in last 2 years
% countries implementing policies
2003 (n>90)2007 (n>85)2011 (n>93 )

Are drug policies associated with better use?Source: Holloway & Henry PloS Medicine 2014
• Methods• Data extracted on 36 policy variables & 10 validated indictors of
medicines use reported in surveys during 2002-8
• Drug use scores (based on 10 indicators) compared between countries with and without specific policies
• Policies associated with positive effects included in a regression analysis of medicines use vs total number of policies (country as unit of analysis)
• Results•56 countries with drug policy and medicine use data
•Africa 42%, E. Mediterranean 19%, Europe 7%, South-East Asia 7%, Western Pacific 13%, Latin America 12%.
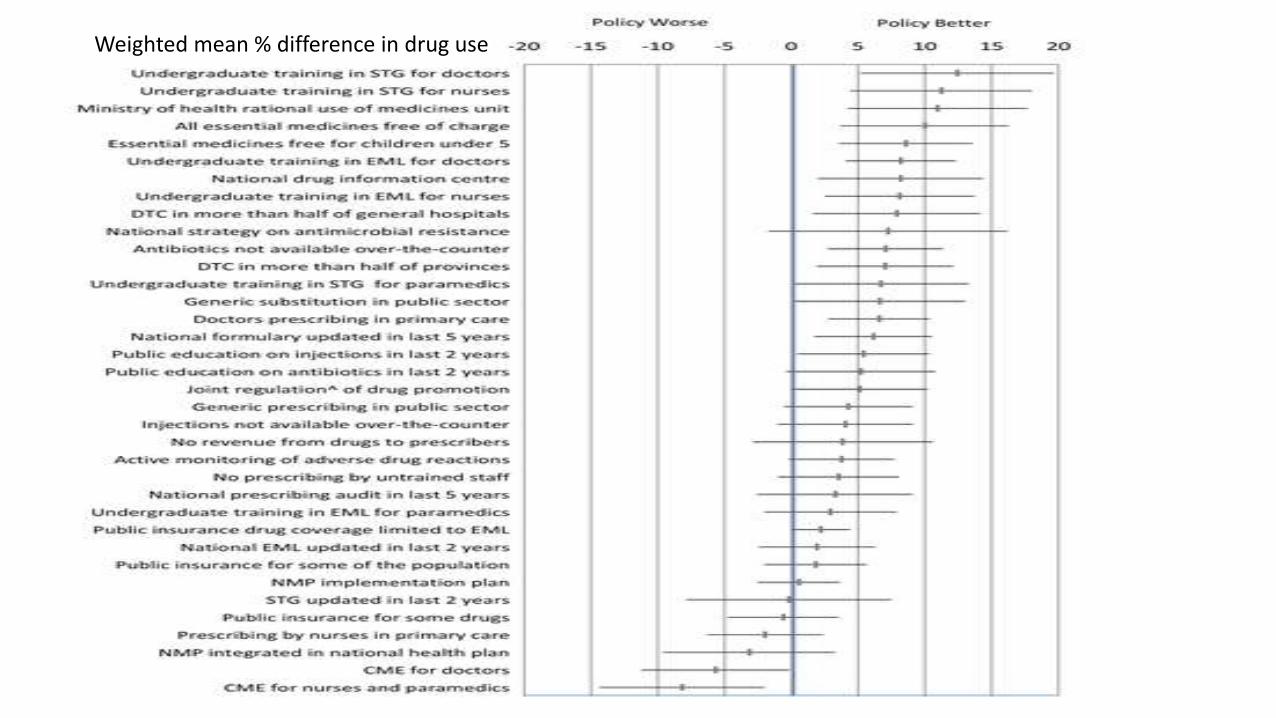
Weighted mean % difference in drug use
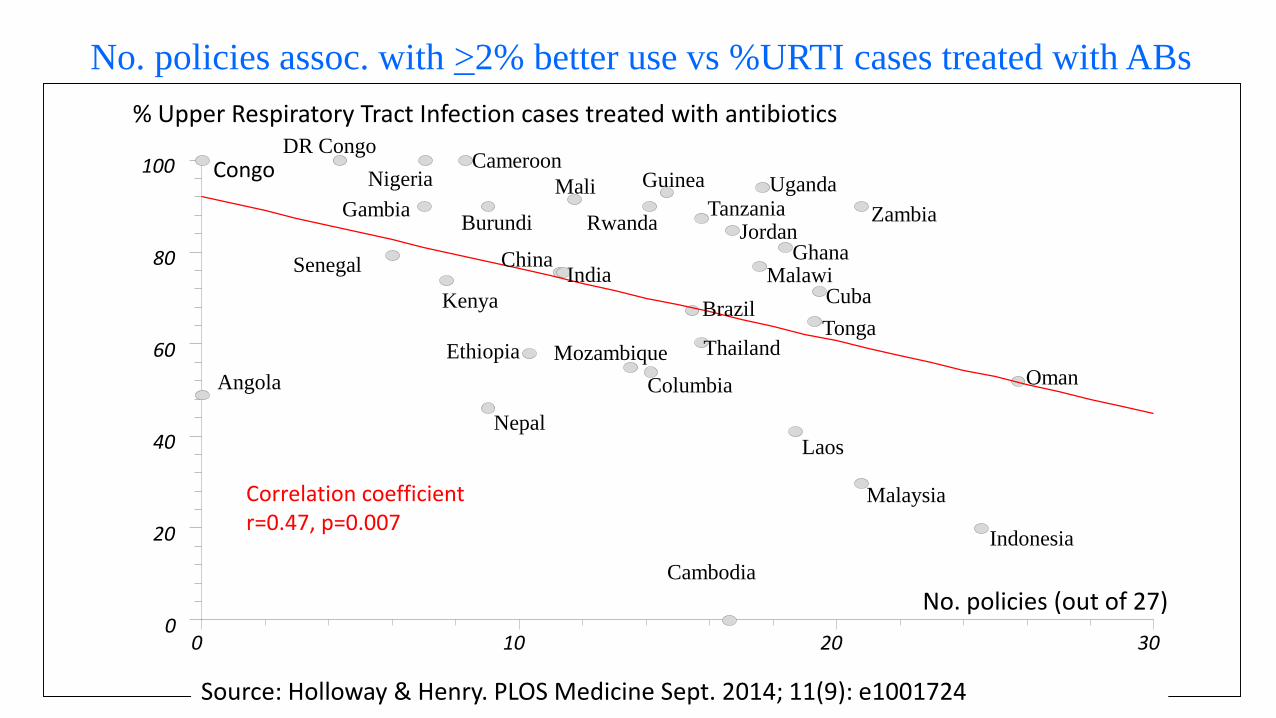
No. policies assoc. with >2% better use vs %URTI cases treated with ABs
0 10 20 300
20
40
60
80
100
% Upper Respiratory Tract Infection cases treated with antibiotics
No. policies (out of 27)
Oman
Indonesia
Malaysia
Laos
Columbia
Mozambique
Nepal
Senegal
Nigeria
DR Congo
Zambia
Uganda
Kenya
IndiaChina
BrazilCuba
Thailand
Jordan
Mali
EthiopiaTonga
Burundi
Ghana
Cameroon
Gambia
Malawi
Guinea
RwandaTanzania
Angola
Cambodia
Correlation coefficient r=0.47, p=0.007
Source: Holloway & Henry. PLOS Medicine Sept. 2014; 11(9): e1001724
Congo

Need for a national coordinated health systems approach to promote appropriate AB use
• Monitoring of medicines management:
• Medicines availability, use & policy implementation often suboptimal
• International conferences on improving use of medicines, 2004 & 2011
• Few national scale projects done, http: www.icium.org
• WHA resolutions:
• WHA58.27 on AMR and WHA60.16 on rational use of medicines
• National programs needed to monitor & improve use & contain AMR
• RC resolutions:
• SEA/RC55/R4 & SEA/RC62/R6 call for measures to improve access to essential medicines & to strengthen drug regulatory authorities
• SEA/RC64/R5 and SEA/RC66/R7 call for monitoring use & request country situational analysis to be done 4-yearly to identify a country-contextualized roadmap for action and to monitor progress
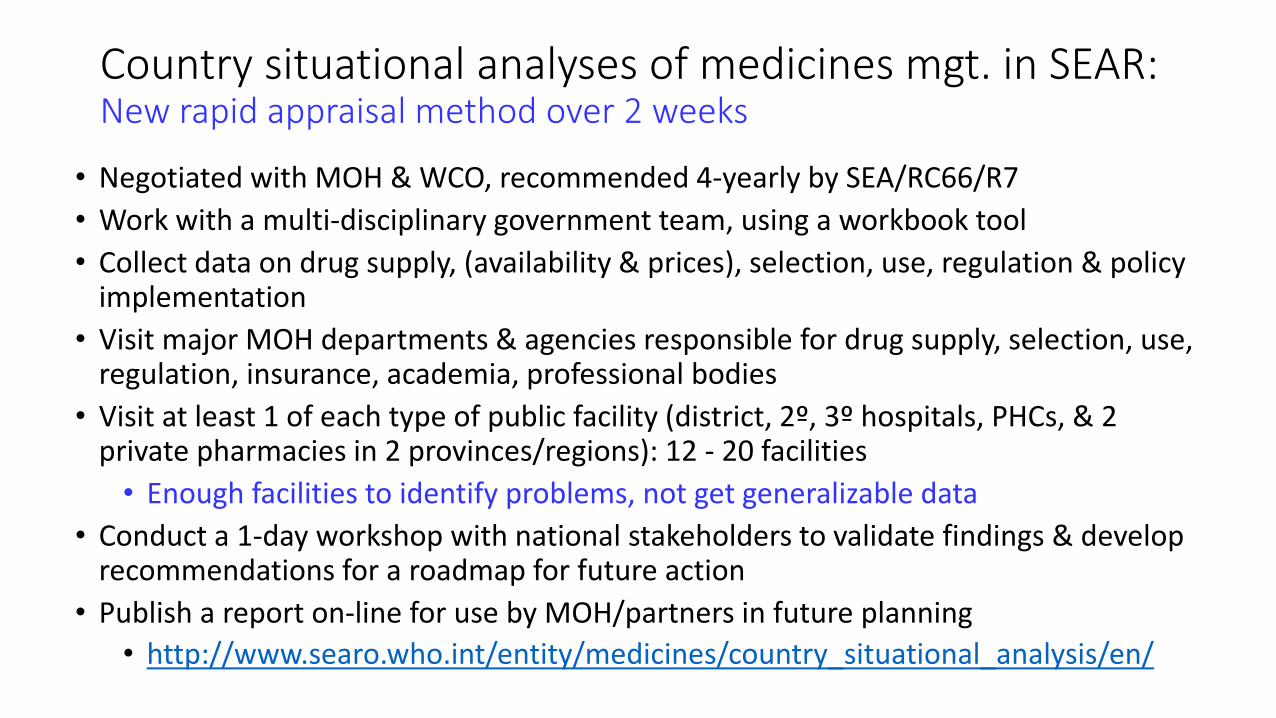
Country situational analyses of medicines mgt. in SEAR:New rapid appraisal method over 2 weeks
• Negotiated with MOH & WCO, recommended 4-yearly by SEA/RC66/R7
• Work with a multi-disciplinary government team, using a workbook tool
• Collect data on drug supply, (availability & prices), selection, use, regulation & policy implementation
• Visit major MOH departments & agencies responsible for drug supply, selection, use, regulation, insurance, academia, professional bodies
• Visit at least 1 of each type of public facility (district, 2º, 3º hospitals, PHCs, & 2 private pharmacies in 2 provinces/regions): 12 - 20 facilities
• Enough facilities to identify problems, not get generalizable data
• Conduct a 1-day workshop with national stakeholders to validate findings & develop recommendations for a roadmap for future action
• Publish a report on-line for use by MOH/partners in future planning
• http://www.searo.who.int/entity/medicines/country_situational_analysis/en/
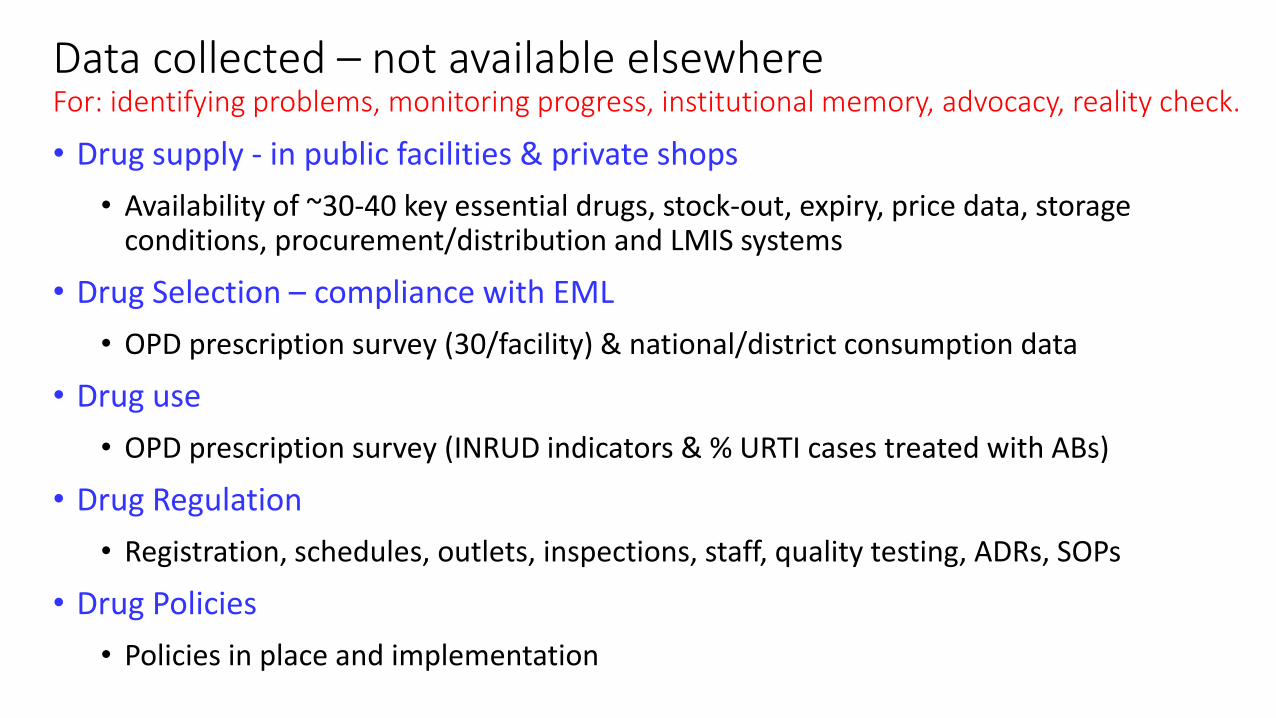
Data collected – not available elsewhereFor: identifying problems, monitoring progress, institutional memory, advocacy, reality check.
• Drug supply - in public facilities & private shops
• Availability of ~30-40 key essential drugs, stock-out, expiry, price data, storage conditions, procurement/distribution and LMIS systems
• Drug Selection – compliance with EML
• OPD prescription survey (30/facility) & national/district consumption data
• Drug use
• OPD prescription survey (INRUD indicators & % URTI cases treated with ABs)
• Drug Regulation
• Registration, schedules, outlets, inspections, staff, quality testing, ADRs, SOPs
• Drug Policies
• Policies in place and implementation

Talking to stakeholders
National Regulatory Authority
Professional body
Academia
Central Medical Supplies Depot
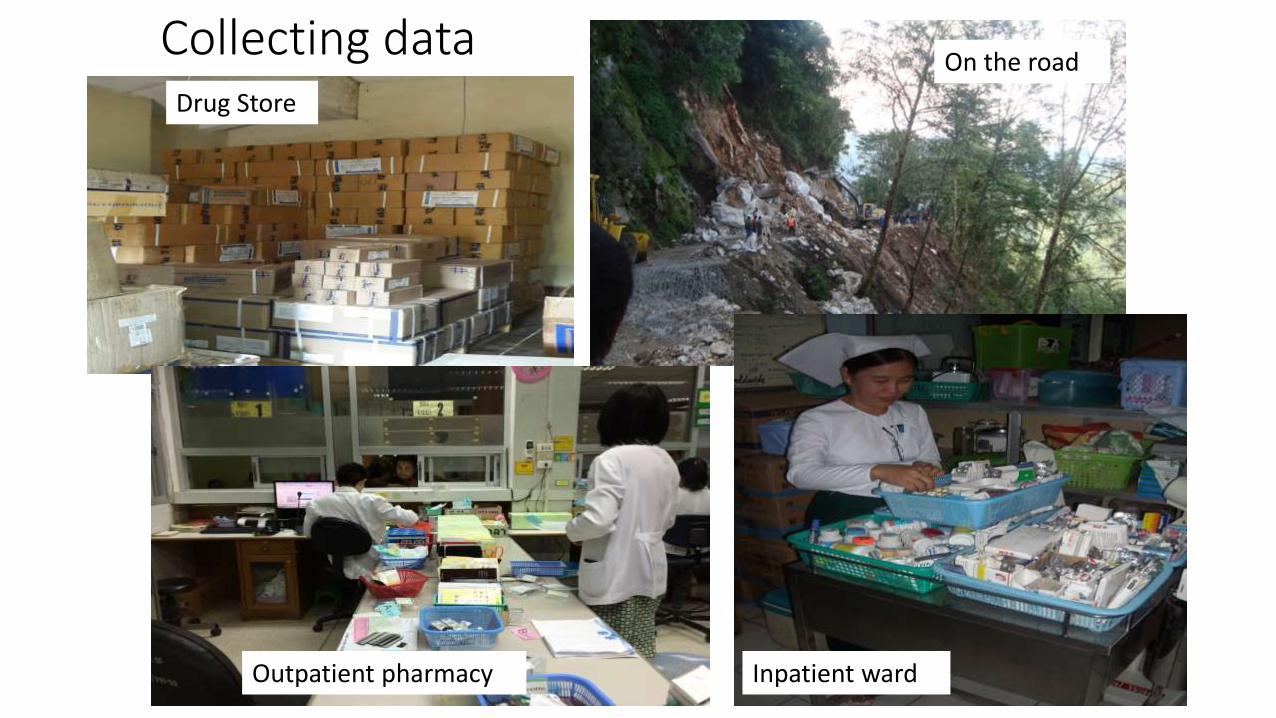
Collecting dataDrug Store
Outpatient pharmacy
On the road
Inpatient ward
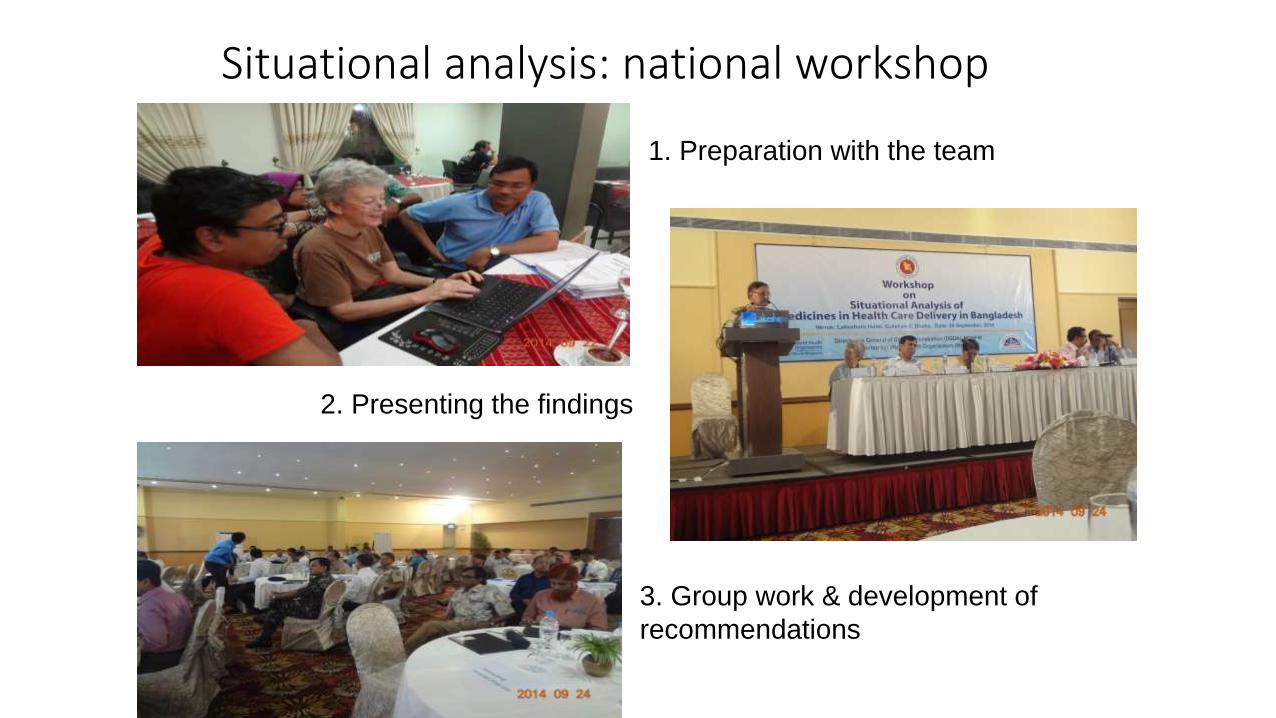
Situational analysis: national workshop
1. Preparation with the team
2. Presenting the findings
3. Group work & development of
recommendations
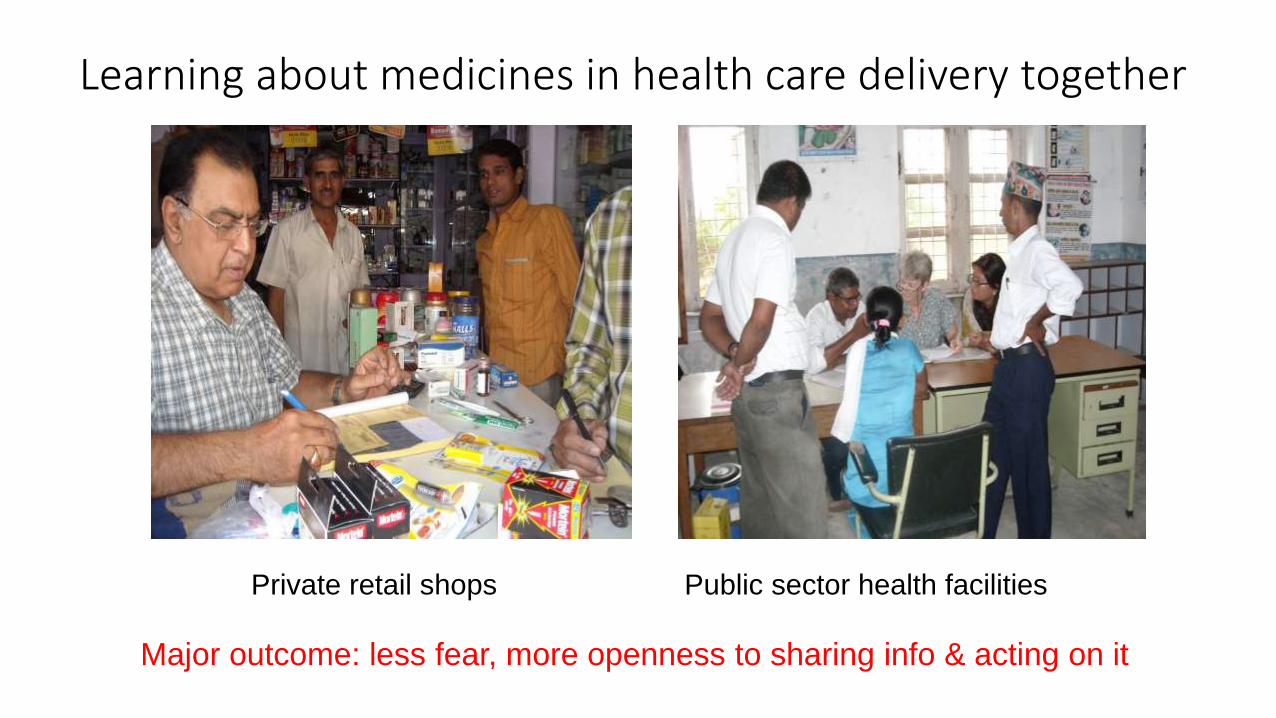
Learning about medicines in health care delivery together
Private retail shops Public sector health facilities
Major outcome: less fear, more openness to sharing info & acting on it
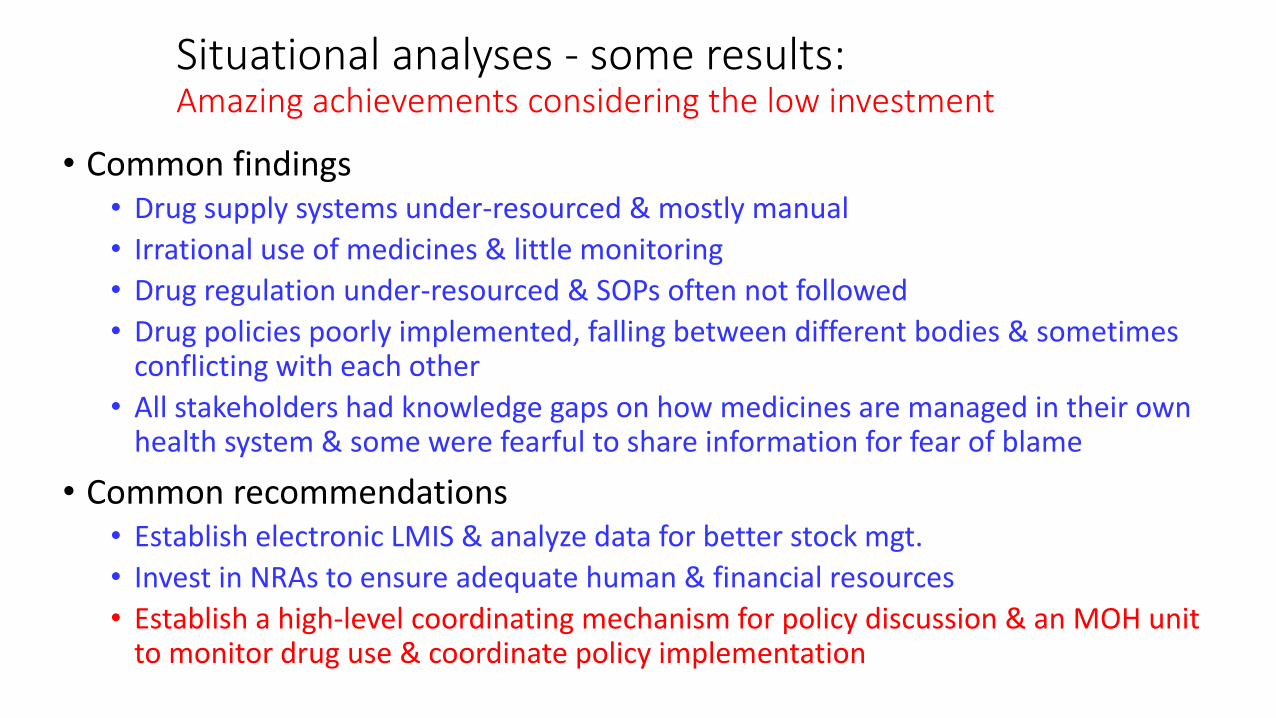
Situational analyses - some results:Amazing achievements considering the low investment
• Common findings• Drug supply systems under-resourced & mostly manual
• Irrational use of medicines & little monitoring
• Drug regulation under-resourced & SOPs often not followed
• Drug policies poorly implemented, falling between different bodies & sometimes conflicting with each other
• All stakeholders had knowledge gaps on how medicines are managed in their own health system & some were fearful to share information for fear of blame
• Common recommendations• Establish electronic LMIS & analyze data for better stock mgt.
• Invest in NRAs to ensure adequate human & financial resources
• Establish a high-level coordinating mechanism for policy discussion & an MOH unit to monitor drug use & coordinate policy implementation

Health worker views
• Doctor in Bangladesh• How can I make a proper diagnosis in one minute?
• Doctor in Sri Lanka• According to STGs, for fever, coughs and colds, we should give paracetamol and or
chlorpheniramine for a few days and only give antibiotics if there is no response, but I like to give the complete treatment from the start.
• Pharmacy Technician in Bhutan• There is a lot of irrational prescribing by doctors but it is very difficult to give any
feedback
• HP in Charge (Senior AHW) in Nepal• For children under 5 years with pneumonia I must give amoxycillin according to the
IMCI guidelines. Since we are short of amoxycillin and have short-dated chloramphenicol syrup, I am prescribing chloramphenicol syrup to children of more than 5 years with pneumonia in order to use up the stock.

Public PHC AB use & stewardship – S.E. AsiaCountry
N=10-20
% OPD
given AB
% URTI
given AB
Nat AMR
strategy
DTCs
most
hos.
ABs
OTC
Pub educ.
on ABs in
last 2 yrs
Bangladesh 2014 19-54 59-60 No No Yes No
Bhutan 2015 33-49 26-42 No Rf hos Yes No
DPR Korea 2012 18-51 58-81 No No Yes Not on AB
Rajasthan 2013 53-67 81-100 No Yes Yes No
Karnataka 2013 23-45 67-78 No No Yes No
Indonesia 2011 34-55 72 2011 Yes Yes Yes
Maldives 2014 15-34 33-48 No No Yes No
Myanmar 2014 34-53 73-96 No No Yes No
Nepal 2014 40-48 63-71 2001 Rf hos Yes No
Sri Lanka 2015 45-67 47-85 No Yes Yes Not on AB
Thailand 2015 11-14 20-52 2011 Yes Yes Not on AB
Timor-Lest 2015 33-50 46-66 No No Yes No
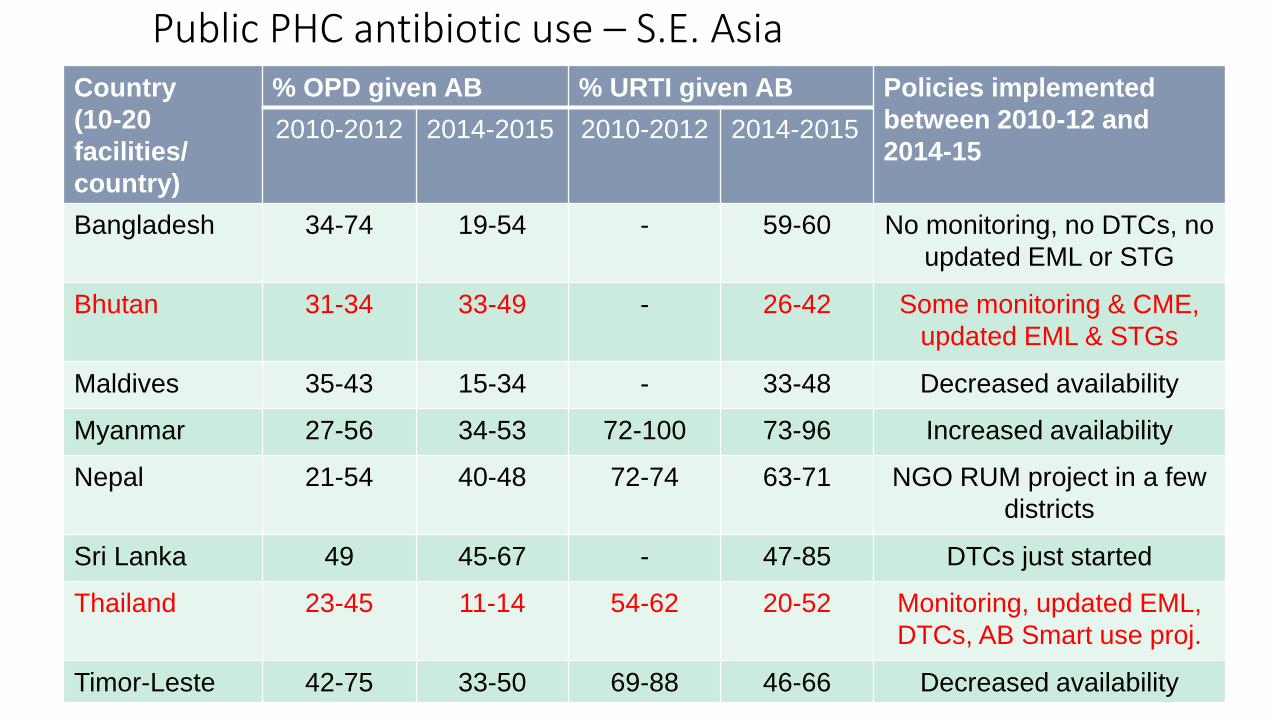
Public PHC antibiotic use – S.E. AsiaCountry
(10-20
facilities/
country)
% OPD given AB % URTI given AB Policies implemented
between 2010-12 and
2014-152010-2012 2014-2015 2010-2012 2014-2015
Bangladesh 34-74 19-54 - 59-60 No monitoring, no DTCs, no
updated EML or STG
Bhutan 31-34 33-49 - 26-42 Some monitoring & CME,
updated EML & STGs
Maldives 35-43 15-34 - 33-48 Decreased availability
Myanmar 27-56 34-53 72-100 73-96 Increased availability
Nepal 21-54 40-48 72-74 63-71 NGO RUM project in a few
districts
Sri Lanka 49 45-67 - 47-85 DTCs just started
Thailand 23-45 11-14 54-62 20-52 Monitoring, updated EML,
DTCs, AB Smart use proj.
Timor-Leste 42-75 33-50 69-88 46-66 Decreased availability
Summary
• Widespread irrational AB use and poor policy implementation in many countries
• Monitoring antibiotic use and policy implementation is the first step to improving it
• Global monitoring by WHO useful for advocacy, but
• Review of antibiotic use and policy implementation in the country context (as done in the situational analyses) can identify priority next steps, but follow-up is needed
• Much greater long-term investment by countries & partners needed
Related Documents