Department of International Economics NUPI Working Paper 831 A value chain approach Promoting conservation in India by greening coffee P.G. Chengappa, Karl M. Rich, Arun Muniyappa, Yadava C.G., Pradeepa Babu B.N., and Magda Rich

Welcome message from author
This document is posted to help you gain knowledge. Please leave a comment to let me know what you think about it! Share it to your friends and learn new things together.
Transcript

Department of International EconomicsNUPI Working Paper 831
A value chain approach
Promoting conservation in India by greening coffee
P.G. Chengappa, Karl M. Rich, Arun Muniyappa, Yadava C.G., Pradeepa Babu B.N., and Magda Rich
Publisher:
Copyright:
Norwegian Institute of International Affairs
© Norwegian Institute of International Affairs 2014
Any views expressed in this publication are those of the
authors. They should not be interpreted as reflecting the
views of the Norwegian Institute of International Affairs. The
text may not be printed in part or in full without the
permission of the authors.
Visiting address:
Address:
Internet:
E-mail:
Fax:
Tel:
C.J. Hambros plass 2d
P.O. Box 8159 Dep.
NO-0033 Oslo, Norway
www.nupi.no
[+ 47] 22 99 40 50
[+ 47] 22 99 40 00

Promoting conservation
in India by greening
coffee: A value chain
approach
P.G. Chengappa*, Karl M. Rich, Arun Muniyappa,
Yadava C.G., Pradeepa Babu B.N., and Magda Rich
Abstract The Indian coffee sector is at an important transition point, increasingly stuck in the middle between quality and value segments of the market. A potential niche for India is in the development of eco-friendly (green) coffees, leveraging the natural environment and biodiversity present in many regions. In this study, we conducted a value chain assessment of the coffee sector in Coorg, a major production area in India, to identify the potential entry points and constraints to a conservation-oriented strategy of upgrading. Our results highlight that coffee value chains in Coorg are fragmented and largely uncoordinated, with innovative upgrading efforts largely individually motivated. This suggests that integrating conservation principles in a broad-based branding strategy could be difficult at the level of the chain without institutional support or the entry of chain champions. On the other hand, integrating conservation as a diversification activity e.g. through the development of butterfly gardens for tourism, could provide a low-cost way of adding value for farmers while promoting good environmental stewardship.
Published by Norwegian Institute of International Affairs
_______________________ * Corresponding author. This research was funded by the Norwegian Research
Council’s NORGLOBAL program, project number #217203 as a joint collaboration
between the Norwegian Institute of International Affairs and the Institute for Social
and Economic Change, Bangalore.
Contents
Introduction .......................................................................................... 4
Overview of the global coffee Industry .................................................. 6
Methodology ........................................................................................ 10
An assessment of the Coorg coffee value chain ................................... 11
Governance in the coffee value chain .................................................. 26
Upgrading strategies in the Indian coffee value chain – what role for ecologically-based products? .............................................................. 28
Conclusions ......................................................................................... 33
References ........................................................................................... 34

Introduction
The coffee sector in India is at an important transition point in its development. Traditionally, Indian coffee has targeted low-value, commodity markets for products such as instant coffee, facilitated by state management in the form of the Indian Coffee Board. With market liberalization in the 1990s and the emergence of Viet Nam as a strong competitor in the low value side of the market, the Indian coffee sector finds itself squeezed in a market increasingly bifurcated between high-value specialty coffee and commodity sectors dominated by Brazil and Viet Nam. To compete in this environment, India not only needs to improve the quality of its product offerings, but also the diversity of products to tap into emerging growth segments, particularly since 70 percent of Indian coffee is exported. This is also important from the standpoint of rural development, as smallholder production dominates the sector.
The market for specialty coffees in particular is growing rapidly. USAID (2010) reports that specialty coffee represents 15 to 20 percent of the market in the United States, with growth rates of approximately 10 percent per year. Volumes are expected to double between 2009 and 2019. Similarly, Pierrot, Giovannucci, and Kasterine (2011) find that certified coffees (e.g., Fairtrade, Utz, etc.) have achieved market shares of over 10 percent in some European markets (e.g., Scandinavia), with a 40 percent market share in the Netherlands. Growth rates for certified coffees have ranged between 20-25 percent per year compared to just 2 percent for conventional coffee (Pierrot, Giovannucci, and Kasterine 2011). Pay (2009) notes that while the organic market remains small (around 3 percent of the market), growth per annum prior to the financial crisis (2000-2008) in the United States was 29 percent per year. These trends portend an important opportunity for India, provided its coffee can meet both the quality and attribute profiles of consumers.
A potential niche for India is in the development of eco-friendly coffees, leveraging the natural environment and biodiversity present in many regions. For instance, according to the Indian Foundation for Butterflies (http://ifoundbutterflies.org/), India is home to over 1800 species of butterflies, of which 15-20 percent are specific to India itself. In Coorg, a region in the Western Ghats of southwestern India, Rich et al. (2014) report that a majority of tree species, reptiles, and fish are endemic to the region, while some 325 species of flora and fauna are listed as globally threatened according to IUCN’s Red List. An opportunity for coffee farmers is to incorporate practices that promote preservation of the natural environment with the production of higher
Promoting conservation in India by greening coffee: A value chain approach 5
quality, certified coffees. Much of the coffee in Coorg is already grown under shade cover conditions, but this market niche has not been fully exploited. Other conservation-oriented niches also potentially exist, but pursuing these requires better knowledge of the coffee marketing system to identify where the possible entry points for such production exist.
In this paper, we analyze the integration of coffee producers into potential conservation-oriented market segments. Our research was initially motivated by ways to preserve butterfly environments in India, whose habitats are increasingly threatened by changing land use patterns. Unlike other parts of the world, however, Indian regulations prohibit the development of commercialized butterfly farms for export, which in many countries have been an important driver for conservation and attitudinal changes towards the environment (Rich, Rich, and Chengappa, 2014; Rich et al. 2014). However, by preserving habitats and integrating preservation practices into commercial production systems for other products (e.g., coffee), market opportunities potentially exist. We couch our analysis through the lens of the value chain, mapping the different coffee chains present in Coorg, the focal point of our research, as well as the governance structures that influence interactions and strategies for upgrading. We include a quantitative assessment of the sector to identify whether integrating “butterfly-friendly” production means are cost-effective given current production systems.
Our analysis finds that value chains for coffee are largely diffuse in nature, with limited coordination in terms of quality and specifications in the conventional chain. Coordination is stronger in certified and organic chains, but incentives and motivation for upgrading largely stem from individual efforts to add value rather than those taking place at the chain-level. This suggests that integrating conservation principles in a branding strategy could be difficult at the level of the chain without institutional support or the entry of chain champions, though there are individual farmers that could adopt such a strategy. On the other hand, integrating conservation as a diversification activity e.g. through the development of butterfly gardens for tourism, could provide a low-cost way of adding value for farmers while promoting good environmental stewardship.

Overview of the global coffee Industry
Coffee is the most popular beverage in the world. Over 2.25 billion cups of coffee are consumed daily around the globe (Ponte, 2002). Global coffee consumption (137.9 million bags1) exceeded its production (132.7 million bags) during 2011-12 (ICO, 2012). Coffee consumption is largely driven by economic conditions in consuming countries, with such fluctuations causing uncertainty in the income received by growers, the majority of whom are small and marginal holders (roughly 70 percent of producers). More than 90 percent of global coffee production comes from developing countries, while over 70 percent of its consumption is concentrated in developed nations (Ponte, 2004). Brazil (35 percent of global production) and Vietnam (15 percent of global production) are the largest coffee producers in the world (see figure 1). India is the sixth largest producer with a production of 5.30 million bags, and accounts for 3.65 percent of the global share in coffee production.
Figure 1. Share of different countries in coffee production (2012)
Source: ICO annual review report (2012)
1 One bag of coffee is equivalent to 60 kg of clean coffee.

Promoting conservation in India by greening coffee: A value chain approach 7
In India, coffee marketing has undergone a significant paradigm shift with the introduction of new economic policy reforms during 1991-92. Previous to these reforms, the Coffee Act of 1942 imbued the Indian Coffee Board with the power to procure and sell all the coffee produced in the country. The introduction of Internal Sales Quotas (ISQ) in 1993 was the first step in liberalizing the coffee industry by permitting coffee farmers to sell 30 percent of their production within India. This was amended further in 1994 through a Free Sale Quota (FSQ) that increased these sales in domestic/international markets to 70 percent of production. A final amendment in September 1996 fully liberalized the market (Chattopadhyay and John, 2007).
These policy changes have contributed to significant growth in the coffee industry. Cultivated area under coffee has increased from 0.27 million hectares in 1990-91 to 0.41 million hectares in 2011-12. Coffee production nearly doubled from 0.17 to 0.32 million tons during the same period (figure 2). The annual growth rate of 2 percent per annum in cultivated area is mainly due to the expansion of coffee cultivation in non-traditional areas such as states in the northeastern part of India (Coffee Board, 2013). Similarly, the increase in production is mainly due to the higher growth in the production of robusta coffee (0.09 million tons to 0.22 million tons from 1990-91 to 2011-12). In fact, the share of arabica in total coffee production has declined from 46 to 32 percent, indicating a clear shift in favor of robusta, given higher costs of cultivation and declining yields (averaging a 1.63 percent decline annually) during the last two decades for arabica. Despite the negative trend in arabica yields, India ranks third in global coffee productivity (Economic Times, 2013) with an average yield of 1097 Kg/hectare for robusta and 560 Kg/ha for arabica (Indian Coffee Board, 2013).
Figure 2. Area, production, and productivity of coffee in India, 1990-91 to
2011-12
Source: Indian Coffee Board (2013). Note: * indicates provisional figures
P.G. Chengappa, Karl M. Rich, Arun Muniyappa, Yadava C.G., Pradeepa Babu B.N., and
Magda Rich
8
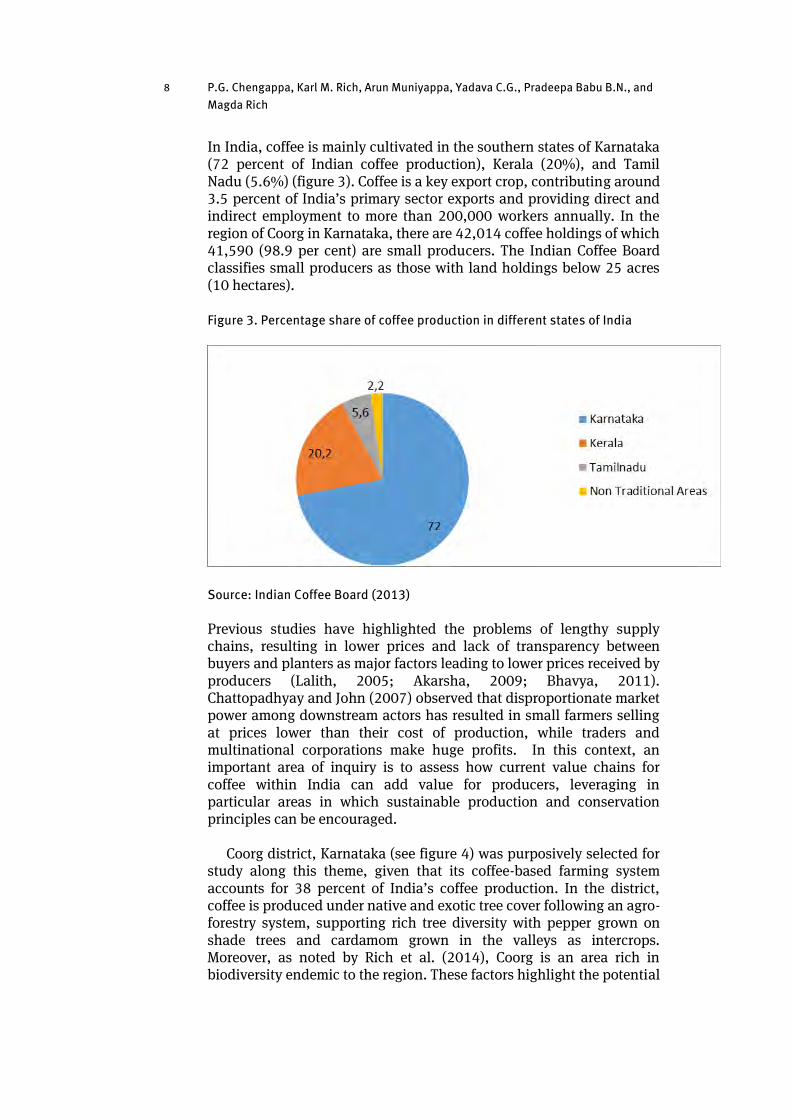
In India, coffee is mainly cultivated in the southern states of Karnataka (72 percent of Indian coffee production), Kerala (20%), and Tamil Nadu (5.6%) (figure 3). Coffee is a key export crop, contributing around 3.5 percent of India’s primary sector exports and providing direct and indirect employment to more than 200,000 workers annually. In the region of Coorg in Karnataka, there are 42,014 coffee holdings of which 41,590 (98.9 per cent) are small producers. The Indian Coffee Board classifies small producers as those with land holdings below 25 acres (10 hectares).
Figure 3. Percentage share of coffee production in different states of India
Source: Indian Coffee Board (2013)
Previous studies have highlighted the problems of lengthy supply chains, resulting in lower prices and lack of transparency between buyers and planters as major factors leading to lower prices received by producers (Lalith, 2005; Akarsha, 2009; Bhavya, 2011). Chattopadhyay and John (2007) observed that disproportionate market power among downstream actors has resulted in small farmers selling at prices lower than their cost of production, while traders and multinational corporations make huge profits. In this context, an important area of inquiry is to assess how current value chains for coffee within India can add value for producers, leveraging in particular areas in which sustainable production and conservation principles can be encouraged.
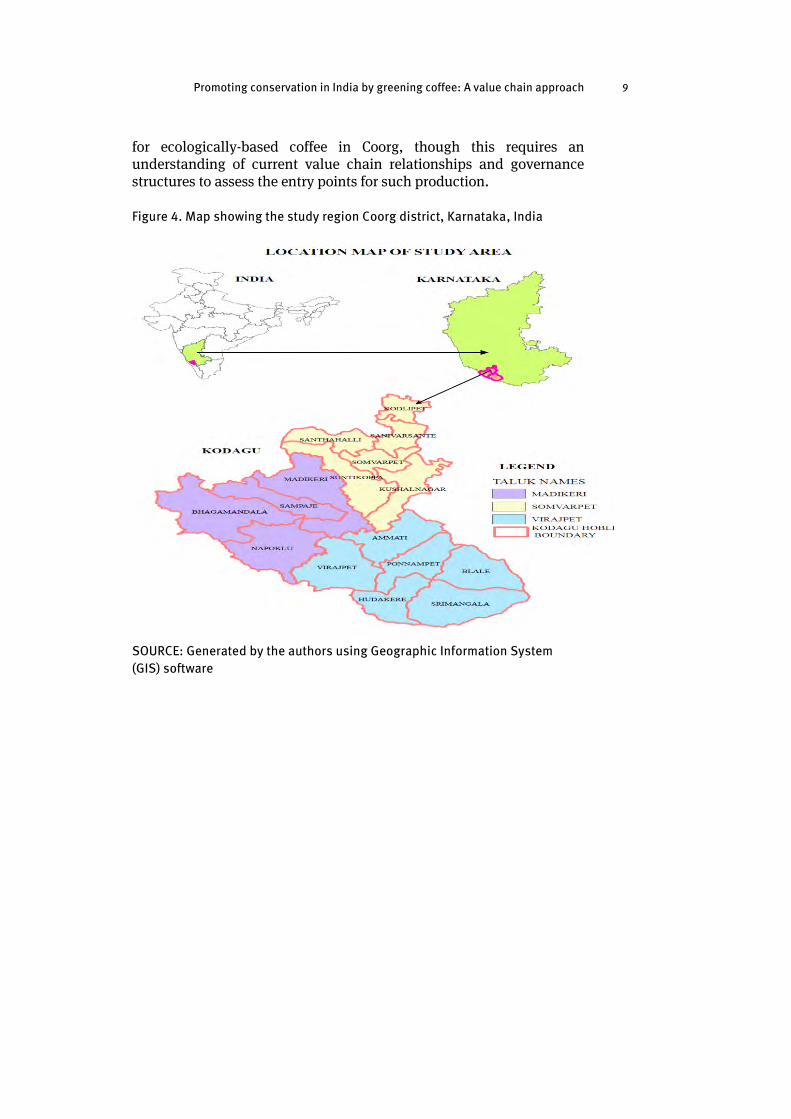
Coorg district, Karnataka (see figure 4) was purposively selected for study along this theme, given that its coffee-based farming system accounts for 38 percent of India’s coffee production. In the district, coffee is produced under native and exotic tree cover following an agro-forestry system, supporting rich tree diversity with pepper grown on shade trees and cardamom grown in the valleys as intercrops. Moreover, as noted by Rich et al. (2014), Coorg is an area rich in biodiversity endemic to the region. These factors highlight the potential
Promoting conservation in India by greening coffee: A value chain approach 9
for ecologically-based coffee in Coorg, though this requires an understanding of current value chain relationships and governance structures to assess the entry points for such production.
Figure 4. Map showing the study region Coorg district, Karnataka, India
SOURCE: Generated by the authors using Geographic Information System
(GIS) software
Methodology
Data, sampling design and analytical tools The study used both qualitative (involving extensive field observations on production and marketing practices) and quantitative data collected for coffee value chain actors in Coorg during February-April 2013 period (details can be found in Chengappa et al. (2014)). The data are based on the coffee year 2011-12. A semi-structured, pre-tested survey with both open and closed ended questions was used to collect relevant information from planters based on their records and memory. The survey addressed information related to production, costs of cultivation, processing and marketing practices. For other downstream actors, separate checklists were used, with information on costs, returns, and marketing practices elicited through facilitated discussions. Secondary data were collected from the publications of the Indian Coffee Board and International Coffee Organization. Care was taken to explain the objectives of the study to the respondents so as to convince them to provide factual and truthful data and avoid redundancy.
Overall, the sample included 52 planters comprising of 31 conventional, 15 certified, and 6 organic planters; five traders; three hullers; three curers; four roasters; and eight retailers. The analysis of the data involved computation of simple descriptive statistics to estimate costs of production2, transaction costs, returns, value-added, and margins.
We adopted the ValueLinks methodology of GIZ (2008) in our analysis that expands the value chain tools and methods explicated by Kaplinsky and Morris (2001) in a manner that better operationalizes the mechanisms for chain upgrading. In this context, we first identified the key players/operators involved in the marketing channel, mapping these relationships graphically and identifying supporters, enablers, and disablers in the chain. We further assessed governance relationships based on methods motivated by Gereffi et al. (2005) and Riisgaard et al. (2008). Based on this analysis, we identified different conservation-oriented upgrading strategies and analyzed their feasibility.
2 For all actors, cost, returns and value added are presented for clean coffee in order
to maintain uniformity.
An assessment of the Coorg coffee value chain
Mapping of coffee value chains in Coorg We identified three distinct types of production systems for coffee in our study: conventional, certified, and organic coffee. Maps for each of the value chains can be found in figures 5-7. Following the ValueLinks methodology, we differentiate between the processes in the chain (top part of each figure, denoted by block arrows), actors associated with the different processes (denoted by rectangles), and various institutional supporters (denoted by trapezoids). Wherever an actor undertakes more than one function, a larger rectangle is used to depict this (e.g. domestic companies and MNCs undertaking aggregation, curing, and export in figure 5). We identified constraints by boxes with a call-out arrow and a lightning bolt, while opportunities have a similar shape with a star instead of a lightning bolt. An advantage of the ValueLinks approach is the visual disaggregation between processes, people, and supporters to illuminate complex systems in a more transparent way.
The conventional coffee value chain is comprised of producers (referred to as planters), village level consolidators, traders, hullers, agent aggregators domestic companies, multinational companies (MNCs), curers, exporters, importers, domestic and international roasters, wholesalers, retailers, and consumers (figure 5). By contrast, the certified and organic chains (figures 6 and 7, respectively) involve significantly fewer actors, particularly intermediaries such as traders or consolidators. In the certified chain (figure 6), direct linkages exist between planters and buyers (MNCs) that ostensibly can improve market communication and facilitate the adoption of new practices to add value. In the organic chain (figure 7), planters take a more integrated role in many functions of the chain, including processing, local trading, and exports that allows them to add significantly more value (and receive more earnings from chain participation), though this also requires more investment and a greater tolerance for risk.

Figure 5: Value chain for conventional coffee in Coorg
.
Source: Compiled by the authors from fieldwork conducted during February-March 2013
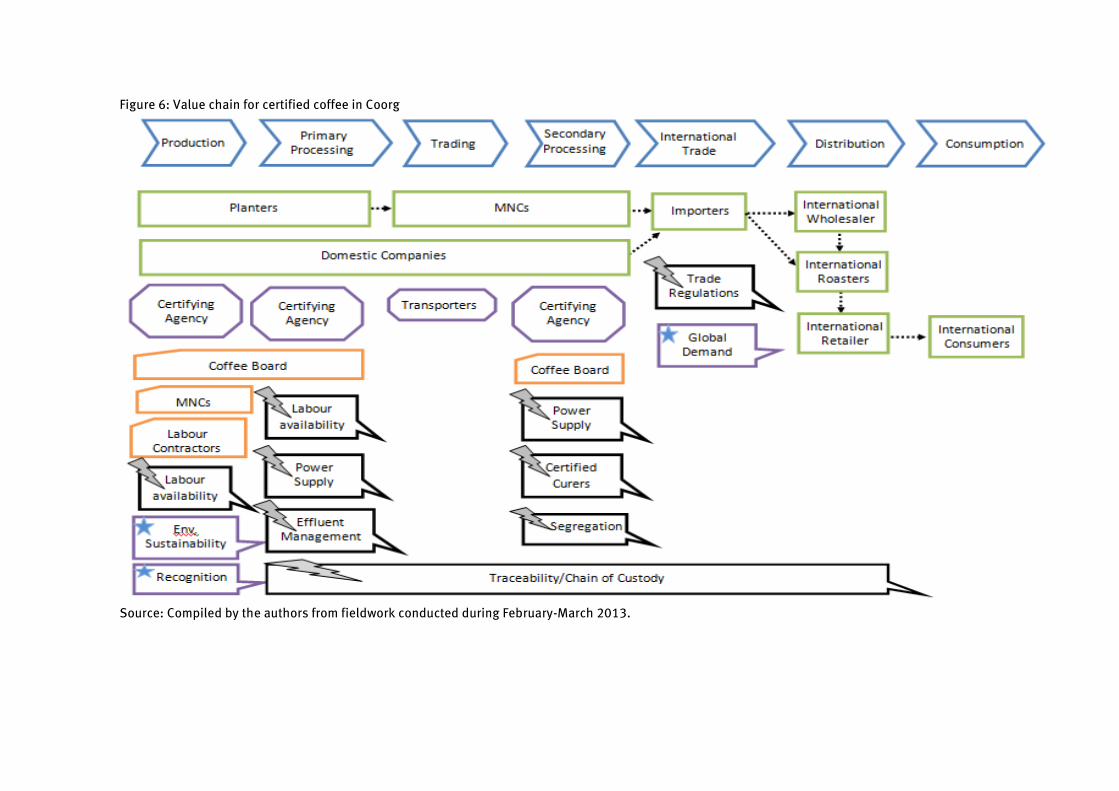
Figure 6: Value chain for certified coffee in Coorg
Source: Compiled by the authors from fieldwork conducted during February-March 2013.
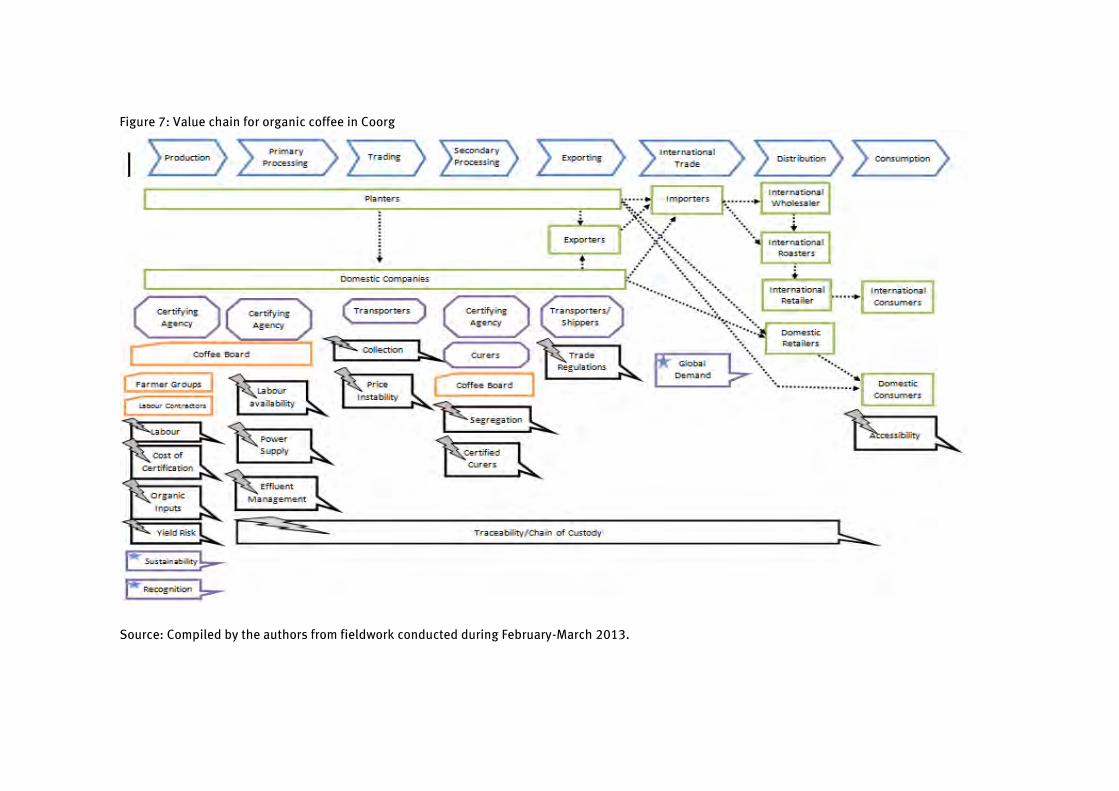
Figure 7: Value chain for organic coffee in Coorg
Source: Compiled by the authors from fieldwork conducted during February-March 2013.
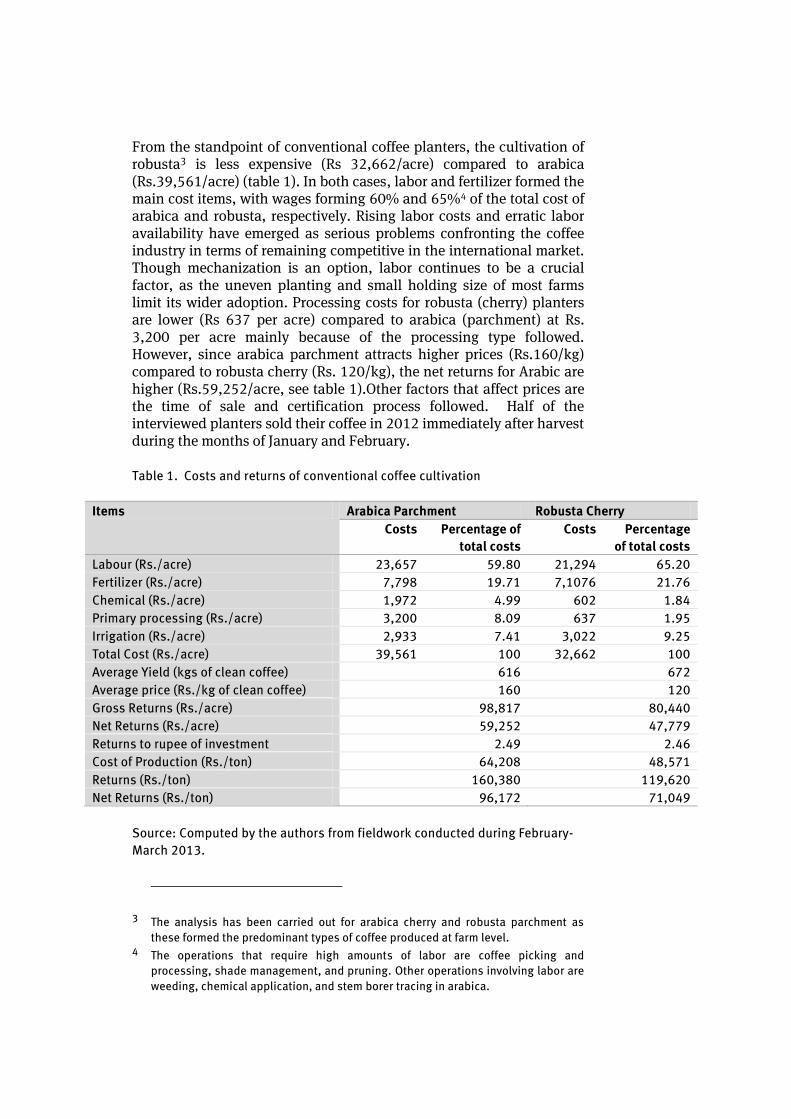
From the standpoint of conventional coffee planters, the cultivation of robusta3 is less expensive (Rs 32,662/acre) compared to arabica (Rs.39,561/acre) (table 1). In both cases, labor and fertilizer formed the main cost items, with wages forming 60% and 65%4 of the total cost of arabica and robusta, respectively. Rising labor costs and erratic labor availability have emerged as serious problems confronting the coffee industry in terms of remaining competitive in the international market. Though mechanization is an option, labor continues to be a crucial factor, as the uneven planting and small holding size of most farms limit its wider adoption. Processing costs for robusta (cherry) planters are lower (Rs 637 per acre) compared to arabica (parchment) at Rs. 3,200 per acre mainly because of the processing type followed. However, since arabica parchment attracts higher prices (Rs.160/kg) compared to robusta cherry (Rs. 120/kg), the net returns for Arabic are higher (Rs.59,252/acre, see table 1).Other factors that affect prices are the time of sale and certification process followed. Half of the interviewed planters sold their coffee in 2012 immediately after harvest during the months of January and February.
Table 1. Costs and returns of conventional coffee cultivation
Items Arabica Parchment Robusta Cherry
Costs Percentage of
total costs
Costs Percentage
of total costs
Labour (Rs./acre) 23,657 59.80 21,294 65.20
Fertilizer (Rs./acre) 7,798 19.71 7,1076 21.76
Chemical (Rs./acre) 1,972 4.99 602 1.84
Primary processing (Rs./acre) 3,200 8.09 637 1.95
Irrigation (Rs./acre) 2,933 7.41 3,022 9.25
Total Cost (Rs./acre) 39,561 100 32,662 100
Average Yield (kgs of clean coffee) 616 672
Average price (Rs./kg of clean coffee) 160 120
Gross Returns (Rs./acre) 98,817 80,440
Net Returns (Rs./acre) 59,252 47,779
Returns to rupee of investment 2.49 2.46
Cost of Production (Rs./ton) 64,208 48,571
Returns (Rs./ton) 160,380 119,620
Net Returns (Rs./ton) 96,172 71,049
Source: Computed by the authors from fieldwork conducted during February-
March 2013.
3 The analysis has been carried out for arabica cherry and robusta parchment as
these formed the predominant types of coffee produced at farm level. 4 The operations that require high amounts of labor are coffee picking and
processing, shade management, and pruning. Other operations involving labor are
weeding, chemical application, and stem borer tracing in arabica.

P.G. Chengappa, Karl M. Rich, Arun Muniyappa, Yadava C.G., Pradeepa Babu B.N., and
Magda Rich
16
The difference in the returns of certified, organic, and conventional coffee farming practices is reflected through a partial budgeting analysis summarized in table 2. The cost incurred for certification (Rs. 214/ac) is small, as those growers that adopt certification practices usually have most of the required facilities. However, interviewed planters revealed that they are not satisfied with the premium received (Rs 995/ac). Moreover, most planters indicated that they could sell only 40 percent of their certified coffee production as certified mainly due to problems involved in its transportation to specific buyers at their location. Undertaking individual and group certification by MNCs and with NGO support (group certification) in the case of small producers has helped in realizing premiums as they can now access new markets. On the other hand, organic certification reveals the advantage of both increased returns and reduced costs, once yield levels stabilize after organic conversion (table 2).
Table 2 . Partial budgets of different types of coffee cultivation (Rs./acre)
(a) Certified robusta over conventional robusta coffee production
Certified robusta coffee production Conventional robusta coffee production
Total costs associated with certified
farming practices A = 32,876
Total costs associated with
conventional farming practices C =
32,662
Additional costs associated with
certified farming practices X = A-C =
214
Gross return available if certified
practices were followed B = 81,649
Gross return available if conventional
practices were followed D = 80,440
Additional return associated with
certified farming practices Y = B-D =
1,209
Net return from certified farming
practices
E = B-A = 48,773
Net return from conventional farming
practices
F = D-C = 47,779
Net gain from certified practices (E-F)
= 995

Promoting conservation in India by greening coffee: A value chain approach 17
(b) Organic robusta over conventional robusta coffee production
Organic robusta coffee production Conventional robusta coffee production
Total costs associated with organic
farming practices A = 27,486
Total costs associated with
conventional farming practices C =
32,662
Additional costs associated with
organic farming practices X = A-C = -
5176
Gross return available if organic
practices were followed B = 82,046
Gross return available if conventional
practices were followed D = 80,440
Additional return associated with
organic farming practices Y = B-D =
1,606
Net return from organic farming
practices
E = B-A = 54,560
Net return from conventional farming
practices
F = D-C = 47,778
Net gain from organic practices (E-F)
= 6,782
Source: Computed by the authors from fieldwork conducted during February-
March 2013.
The quality of coffee depends greatly on the method of picking and processing. During the survey, it was found that planters (especially large holders) are more quality-conscious and practiced selective picking as a means of obtaining higher quality berries, even though it leads to increased labor costs. As seen from table 3, a majority of arabica growers with facilities for wet processing practiced three rounds of picking: first selective picking referred to as fly picking, followed by a second round of selective picking, and finally the stripping of the remaining fruits. By contrast, most robusta growers either practiced stripping or two rounds of selective picking. It is interesting to note that the average price following three rounds of the selective picking of robusta cherry was 12.5 percent higher compared to stripping. The method of drying also impacts quality. In the past, it was common practice to use raised perforated tables to dry coffee but this is hardly in use at present because of the high costs involved. 5 Indeed, only three interviewed farmers used such tables, with most planters using either cemented or tiled floors, while a few others used plastic sheets or shade nets spread on the mud floor. The latter practice reduces the quality as the beans absorb the moisture and bad odors from the ground surface.
5 Presently, only organic planters with an orientation towards the international
market follow the perforated table method of drying.

P.G. Chengappa, Karl M. Rich, Arun Muniyappa, Yadava C.G., Pradeepa Babu B.N., and
Magda Rich
18
Table 3. Coffee harvesting practices among planters
Harvest
typeCoffee type
Stripping Selective
picking (twice)
Selective picking
(three times
Arabica No. of planters 4 5 16
Average price
(Rs./bag) 7,750 7,970 8,120
Robusta No. of planters 25 17 10
Average price
(Rs./bag) 2,900 3,125 3,350
Source: Computed by the authors from fieldwork conducted during February-
March 2013.
The picked ripe berries of coffee are processed primarily at the farm level into either cherry (dry processing) and/or parchment coffee (wet processing).6 In Coorg, the vast majority of farmers use dry processing techniques, whereby the harvested coffee fruits are spread over in the drying yard or floor (mud/cement/tile) and dried in the sun. Fresh beans can also be first pulped, followed by sun drying to obtain ‘parchment’ coffee (this is referred to as wet processing7). Dry processing is followed by a majority of robusta growers and smallholder growers of arabica, while wet processing requires infrastructure in machinery and waste management that is only feasible for medium to larger holders of arabica. A few small planters use the pulping facilities of neighboring large farms for making parchment coffee for a fee. Our sample indicates that arabica was mostly processed into parchment (82 percent) while for robusta, cherry processing constituted 74 percent (table 4).
Table 4. Production and method of coffee processing among sample farmers
in Coorg district
Coffee Type Type of processing (%)
Cherry Parchment
Arabica 18.30 81.70
Robusta 74.15 25.85
Total 100 100
Source: Computed by the authors from fieldwork conducted during February-
March 2013.
6 Even those who engage in parchment processing need to process a small portion as
cherry (say, about 10 percent) consisting of floats in the pulping process. 7 This process requires good water and lagoon facilities for waste management
(mucilage).
Promoting conservation in India by greening coffee: A value chain approach 19
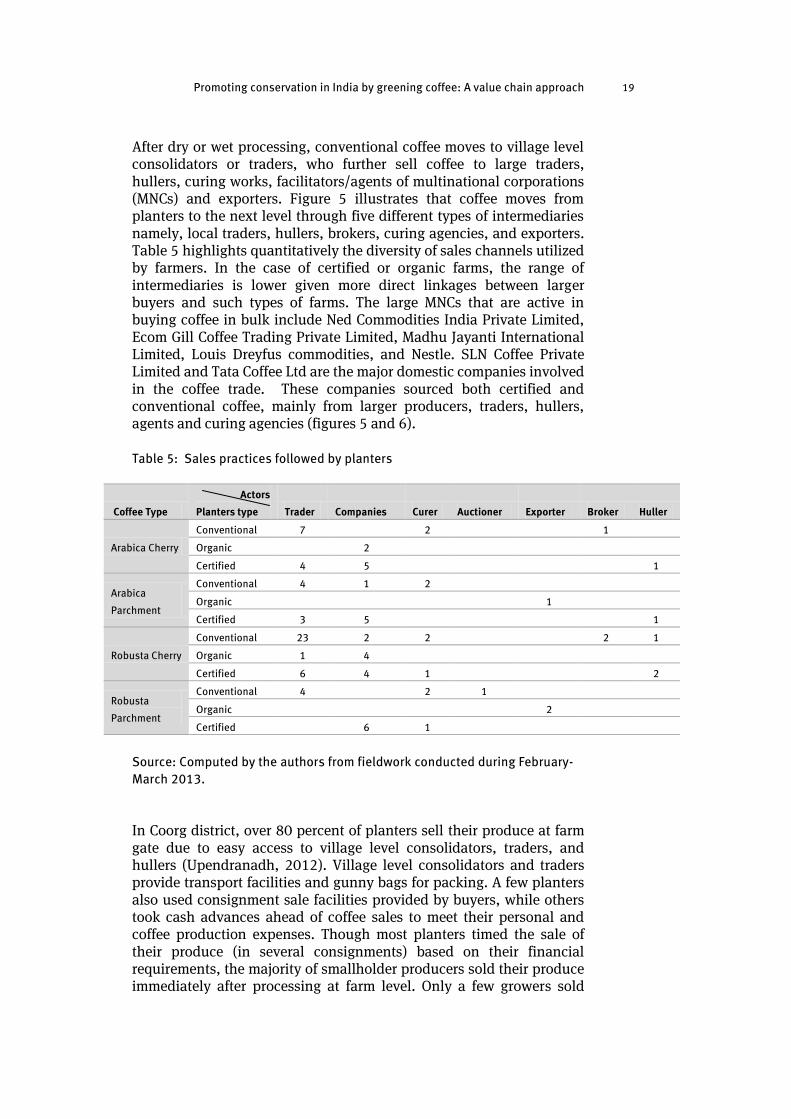
After dry or wet processing, conventional coffee moves to village level consolidators or traders, who further sell coffee to large traders, hullers, curing works, facilitators/agents of multinational corporations (MNCs) and exporters. Figure 5 illustrates that coffee moves from planters to the next level through five different types of intermediaries namely, local traders, hullers, brokers, curing agencies, and exporters. Table 5 highlights quantitatively the diversity of sales channels utilized by farmers. In the case of certified or organic farms, the range of intermediaries is lower given more direct linkages between larger buyers and such types of farms. The large MNCs that are active in buying coffee in bulk include Ned Commodities India Private Limited, Ecom Gill Coffee Trading Private Limited, Madhu Jayanti International Limited, Louis Dreyfus commodities, and Nestle. SLN Coffee Private Limited and Tata Coffee Ltd are the major domestic companies involved in the coffee trade. These companies sourced both certified and conventional coffee, mainly from larger producers, traders, hullers, agents and curing agencies (figures 5 and 6).
Table 5: Sales practices followed by planters
Coffee Type
Actors
Planters type Trader Companies Curer Auctioner Exporter Broker Huller
Arabica Cherry
Conventional 7 2 1
Organic 2
Certified 4 5 1
Arabica
Parchment
Conventional 4 1 2
Organic 1
Certified 3 5 1
Robusta Cherry
Conventional 23 2 2 2 1
Organic 1 4
Certified 6 4 1 2
Robusta
Parchment
Conventional 4 2 1
Organic 2
Certified 6 1
Source: Computed by the authors from fieldwork conducted during February-
March 2013.
In Coorg district, over 80 percent of planters sell their produce at farm gate due to easy access to village level consolidators, traders, and hullers (Upendranadh, 2012). Village level consolidators and traders provide transport facilities and gunny bags for packing. A few planters also used consignment sale facilities provided by buyers, while others took cash advances ahead of coffee sales to meet their personal and coffee production expenses. Though most planters timed the sale of their produce (in several consignments) based on their financial requirements, the majority of smallholder producers sold their produce immediately after processing at farm level. Only a few growers sold

P.G. Chengappa, Karl M. Rich, Arun Muniyappa, Yadava C.G., Pradeepa Babu B.N., and
Magda Rich
20
their produce to agents/facilitators of domestic companies and MNCs. Nearly two-thirds (62%) of the sampled coffee growers sold their coffee to a particular trader or a set of traders with whom they maintained a considerable length of trading relationship. Small planters preferred higher prices and cash payments and hence sold to the trader offering the best price (table 6).
Table 6. Sales preferences of coffee growers across farm size groups
Producer
Type
Size
Group
Repeated sale to
same buyer/s
Sell to any trader
with best offer
Grand
Total
Conventional
Small 6 7 13
Medium 8 4 12
Large 4 2 6
Total 18 13 31
Organic
Small 2 2 4
Medium 1 1
Large 1 1
Total 3 3 6
Certified
Small 3 1 4
Medium 3 1 4
Large 5 2 7
Total 11 4 15
Source: Computed by the authors from fieldwork conducted during February-
March 2013.
In procuring coffee, moisture and outturn8 are the two major criteria considered by all buyers. Twelve percent moisture content and 52 per cent outturn are the standard norms of the industry for robusta cherry coffee. If planters fail to maintain these standards, pro rata deductions are made from the final price. Similarly, if the quality parameters are above the stipulated standard, premiums are paid. Most traders and hulling units have facilities to test samples. Larger coffee growers tend to have greater access to competitive marketing arrangements, with most of them selling their coffee to curers who offered them accurate outturn and prevailing market prices.
In the conventional coffee chain, estate level processed coffee is subsequently sold to local traders, who act on behalf of block level traders and hullers. Based on the quality parameters (from a sample of a kilogram of processed robusta cherry), traders make their price offers to producers. Farmers obtain other such bids from different players in the local market and the one who makes the best offer is chosen for
8 This refers to the rate of conversion of cherry/parchment to clean coffee.
Promoting conservation in India by greening coffee: A value chain approach 21
sale. Small farmers tend to prefer working with local traders as they provide gunny bags, weighing facilities, transportation from the farmer’s doorstep, and immediate cash payment.9 It is interesting to note that while these players offer competitive prices at par with larger traders, curers, and MNCs, some may resort to the use of some fraudulent practices such as under weighing, unauthorized quality deductions, and not providing premiums based on exact outturn.10 The prevalence of such practices indicates marketing inefficiency, depriving producers of competitive prices.
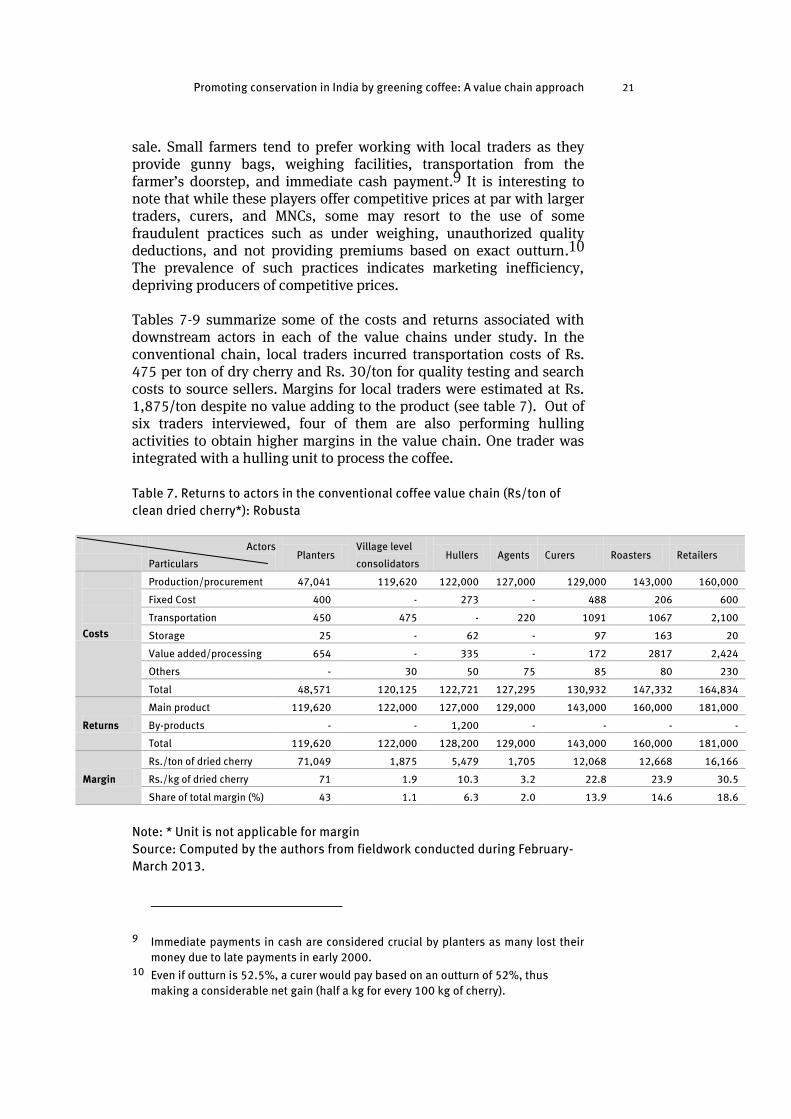
Tables 7-9 summarize some of the costs and returns associated with downstream actors in each of the value chains under study. In the conventional chain, local traders incurred transportation costs of Rs. 475 per ton of dry cherry and Rs. 30/ton for quality testing and search costs to source sellers. Margins for local traders were estimated at Rs. 1,875/ton despite no value adding to the product (see table 7). Out of six traders interviewed, four of them are also performing hulling activities to obtain higher margins in the value chain. One trader was integrated with a hulling unit to process the coffee.
Table 7. Returns to actors in the conventional coffee value chain (Rs/ton of
clean dried cherry*): Robusta
Actors
Particulars Planters
Village level
consolidators Hullers Agents Curers Roasters Retailers
Costs
Production/procurement 47,041 119,620 122,000 127,000 129,000 143,000 160,000
Fixed Cost 400 - 273 - 488 206 600
Transportation 450 475 - 220 1091 1067 2,100
Storage 25 - 62 - 97 163 20
Value added/processing 654 - 335 - 172 2817 2,424
Others - 30 50 75 85 80 230
Total 48,571 120,125 122,721 127,295 130,932 147,332 164,834
Returns
Main product 119,620 122,000 127,000 129,000 143,000 160,000 181,000
By-products - - 1,200 - - - -
Total 119,620 122,000 128,200 129,000 143,000 160,000 181,000
Margin
Rs./ton of dried cherry 71,049 1,875 5,479 1,705 12,068 12,668 16,166
Rs./kg of dried cherry 71 1.9 10.3 3.2 22.8 23.9 30.5
Share of total margin (%) 43 1.1 6.3 2.0 13.9 14.6 18.6
Note: * Unit is not applicable for margin
Source: Computed by the authors from fieldwork conducted during February-
March 2013.
9 Immediate payments in cash are considered crucial by planters as many lost their
money due to late payments in early 2000. 10 Even if outturn is 52.5%, a curer would pay based on an outturn of 52%, thus
making a considerable net gain (half a kg for every 100 kg of cherry).

P.G. Chengappa, Karl M. Rich, Arun Muniyappa, Yadava C.G., Pradeepa Babu B.N., and
Magda Rich
22
Table 8. Returns to actors in the certified coffee value chain (Rs/ton of clean
Coffee): Robusta
Particulars
Actors Planters Curers/MNCs
Cost
Production/Procurement 47226 121420
Fixed Cost 678 3200
Transportation - 412
Storage 71 217
Value
addition/Processing
756 718
Other 158 142
Total 48889 126109
Returns
Main product 121420 -
By-product - -
Total 121420 -
Margin 72531
Source: Compiled by the authors from fieldwork conducted during February-
March 2013.

Promoting conservation in India by greening coffee: A value chain approach 23
Table 9. Returns to actors in the organic coffee value chain (Rs/ton of pure
coffee): Robusta
Source: Computed by the authors from fieldwork conducted during February-
March 2013.
Hulling is the process of removing the outer skin of dry cherry coffee that yields estate pounded coffee. Hullers are located near the production centers act as intermediary processors and contribute in reducing the transportation cost by removing the husk. The husk is then used in curing tobacco and is a good source of manure. In the case of those who sell dry cherries directly to MNCs or curing agents, transportation costs will be higher as they are located farther away from these buyers, thus reducing the value chain efficiency.
Most hullers rely on local traders for sourcing coffee. Hulling units not only undertake processing of their own coffee, but also offer custom hulling services to planters or traders at a fee of Rs. 400 per ton. Overall, the net returns worked to Rs. 5,479 per ton of processed clean coffee (table 6). Hullers face high volatility in coffee prices and hence sell the processed coffee on the same day to insure themselves against the volatility of prices.11 In the conventional chain, the processing cost
11 One of the hullers interviewed indicated he lost heavily during bad coffee years
when prices crashed.
Actors
Particulars Planters
Domestic
companies
Domestic
Retailers
Co
st
Production/Procurement 37615 124500 286000
Fixed Cost 1470 621 238
Transportation 473 1036 689
Storage 85 198 152
Value
addition/Processing 761 1974 1902
Other 1305 602 308
Total 41709 128931 289289
Re
turn
s
Main product 124500 286000 374400
By-product - 900 -
Total 124500 286900 374400
Margin 82791 157969 85111
P.G. Chengappa, Karl M. Rich, Arun Muniyappa, Yadava C.G., Pradeepa Babu B.N., and
Magda Rich
24
of hullers was estimated at Rs. 335/ton (table 7). Hullers also incur costs for transport, storage, office maintenance, and fixed cost for storage. As the electricity supply can be erratic, many hulling units maintain diesel generator sets.
Hullers sell their produce to the agent aggregators, MNCs, or curing works. Transportation cost is borne by hullers themselves and they receive payments immediately either in cash or through a bank. It is important to note that hullers not only undertake processing (hulling) but trading as well.
Agent aggregators provide a vital link between growers, curers, and exporters, given the bulky nature of coffee and long distances required in procurement. Eight agent aggregators operate in the study area (Kushalnagar, a coffee processing hub). Of these, the study team interviewed one to elicit information through semi-structured techniques. This agent aggregator operated in all three coffee growing districts of Karnataka i.e., Coorg, Chickmagalore, and Hassan and handled 35,000 tons of coffee during 2011-12. Eighty percent of this trade was in robusta and the rest was in arabica. In the case of robusta, 90 percent was in the form of cherry while in the case of arabica, parchment formed over 60 percent of the volume. The agent aggregator facilitated large companies in procuring their requirements, incurring costs for transportation (Rs 220/ton), bank interest, communication, and maintenance of an office (Rs. 75/ton). The aggregator did not maintain his own storage as he uses the warehouse facilities of the curers to whom he sells. The agent aggregator sold coffee immediately (within a day) to large buyers. The net profit for the agent aggregator in the conventional chain was estimated at Rs. 1,705/ton (table 7).
Curing is the most important value adding function in the coffee value chain. The process involves removing the outer cover of the dry cherry and silver skin in the case of plantation (washed) coffee and sorting into grades of clean coffee. There are 70 curing works in India, most of which are medium and small units which handle relatively small volumes with low technology, and then sell the cured coffee to exporters or domestic roasters involved in the coffee business. Three types of curing agencies can be identified: (i) MNCs with state of art curing infrastructure and technologies with a mechanized processes that enables large scale operations; (ii) local curers operating with moderate levels of technology; and (iii) small scale operators with traditional technology. The entry of large players, mainly MNCs, over the last decade has led to market concentration, with such companies undertaking a variety of processing and marketing tasks such as curing, certification, export, branding, and retailing, resulting in high level of functional integration. In the conventional chain, given an average sale price of Rs. 143/ kg for clean robusta coffee, the net profit to the curer was Rs.12,067/ ton. The main cost area for curers was in transport, estimated at Rs. 1,091/ton (table 7).
Promoting conservation in India by greening coffee: A value chain approach 25
Roasters play an important role in reaching the end market of the value chain. They are stringent on the quality parameters of coffee as they have direct links and feedback with consumers. Roasting is the deciding factor in bringing about market acceptance. Roasters blend different varieties and grades of coffee beans before undertaking roasting to a desired level. Many roasters hold long-term contracts with curers and a few larger planters, though most of the procurement occurs through commission agents, hullers, and curers. Basically, there are two categories of roasters. The first combines roles as both a roaster and retailer whereby roasted beans are ground and sold in local coffee shops. The second type is comprised of large operators, who are basically wholesalers that distribute roasted beans to retailers locally, regionally, or nationally. This category includes players like Café Coffee Day, Bayers coffee and Cothas Coffee, in addition to many local players. In the conventional chain, roasters obtained an average net margin of Rs. 12,668/ton, the highest of any actor in the coffee value chain (table 7).
Governance in the coffee value chain
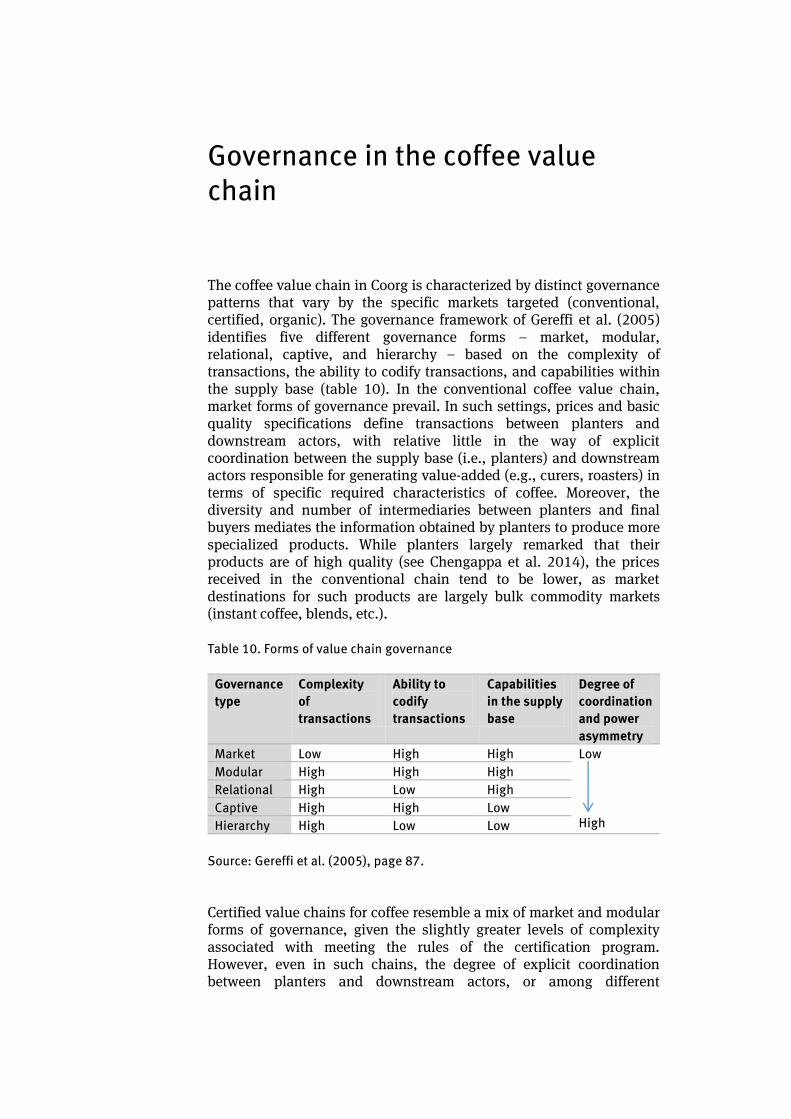
The coffee value chain in Coorg is characterized by distinct governance patterns that vary by the specific markets targeted (conventional, certified, organic). The governance framework of Gereffi et al. (2005) identifies five different governance forms – market, modular, relational, captive, and hierarchy – based on the complexity of transactions, the ability to codify transactions, and capabilities within the supply base (table 10). In the conventional coffee value chain, market forms of governance prevail. In such settings, prices and basic quality specifications define transactions between planters and downstream actors, with relative little in the way of explicit coordination between the supply base (i.e., planters) and downstream actors responsible for generating value-added (e.g., curers, roasters) in terms of specific required characteristics of coffee. Moreover, the diversity and number of intermediaries between planters and final buyers mediates the information obtained by planters to produce more specialized products. While planters largely remarked that their products are of high quality (see Chengappa et al. 2014), the prices received in the conventional chain tend to be lower, as market destinations for such products are largely bulk commodity markets (instant coffee, blends, etc.).
Table 10. Forms of value chain governance
Governance
type
Complexity
of
transactions
Ability to
codify
transactions
Capabilities
in the supply
base
Degree of
coordination
and power
asymmetry
Market Low High High Low
High
Modular High High High
Relational High Low High
Captive High High Low
Hierarchy High Low Low
Source: Gereffi et al. (2005), page 87.
Certified value chains for coffee resemble a mix of market and modular forms of governance, given the slightly greater levels of complexity associated with meeting the rules of the certification program. However, even in such chains, the degree of explicit coordination between planters and downstream actors, or among different
Promoting conservation in India by greening coffee: A value chain approach 27
downstream actors, remains relatively low. Once certified coffee is purchased from planters, the main area of coordination downstream is through maintaining the chain of custody of certified products throughout the value chain, though little attention is given in associating certified coffee with efforts towards higher quality or market differentiation. In this manner, certification is only a simple form of product differentiation, with limited price premiums – Chengappa et al. (2014) report premiums of between Rs. 50-150 per bag, roughly 2-3 percent higher than the conventional price. At the same time, certification also increases the potential power asymmetries between planters and buyers, given that rules are imposed externally on planters with little negotiation possible on compliance. However, most interviewed certified planters suggested that compliance with certification was both clear and inexpensive (Chengappa et al. 2014).
The organic value chain more clearly exhibits modular forms of governance, with planters not only engaged in more complex transactions at the production level, but also undertaking value-adding functions within the value chain in terms of processing. Prima facie, the functional upgrading undertaken by organic producers could serve as a counterbalance to the potential power asymmetries resulting from compliance with international organic standards. On the other hand, survey results reported in Chengappa et al. (2014) suggest that both the clarity and expense of compliance with certification are higher for organic producers than certified producers, though this has also generated higher prices and greater market access. The greater internal and external integration within the organic coffee value further suggests greater ease in developing higher quality products and addressing new market niches than either the conventional or certified coffee value chains.
The global trend towards certified products potentially exposes actors in the conventional coffee chain to be excluded from international markets, particularly smallholder producers. Group certification with support from NGOs is one means to reduce producer vulnerability. At the same time, as global coffee markets become increasingly segmented and value segments lost to lower cost competitors (e.g., Viet Nam), the general lack of quality orientation within the Indian coffee value chain and limited value chain coordination given the dispersion among value chain actors potentially restrict the ability of the value chain to respond to emerging trends. As we will discuss in the next section, the possibilities of leveraging current value chain governance structures along innovative segments such as ecological coffee may be limited
.

Upgrading strategies in the Indian coffee value chain – what role for ecologically-based products?
Different actors within the coffee value chain currently undertake a variety of upgrading strategies. Given the pressures in remaining competitive, cost-saving technologies, particularly those that involve mechanization given increasingly costly and scarce labor, are being increasingly adopted. Further downstream, there are moves among some curers to increase their functions within the value chain, as well as by roasters to diversify market outlets and product offerings. Auction markets are also becoming an increasingly common way to market coffee. Two auctioneers, J.Thomas & Co. Pvt Ltd., and Forbes, Ewart & Figgs Pvt. Ltd., are involved in the auctioning of coffee through the Indian Coffee Trading Association (ICTA), in the premises of the Indian Coffee Board in Bangalore. The weekly auctions include the displaying of a sample of 500 gram/lot that specifies the grade and quantity offered. The lot size varies from 250 to 1,500 kg. This channel provides opportunity to sell coffee at a competitive price by reducing intermediaries.
However, our survey largely highlighted that such innovative efforts were individually motivated. For instance, four surveyed farmers in Coorg were found to engage in estate level branding to identify the place of origin and the environment in which coffee is grown. Of the six organic producers interviewed, three sold their coffee using their own brand name; two exported to international markets (Palthope and Balmore) while the other sold locally within Coorg (Jaivik Greens) from an outlet located in Kushalnagar and has burgeoning plans to expand sales in Bangalore. In addition, the President of the Specialty Coffee Association of India sold his estate brand, Balnoor, in the German market. Individual-level efforts have further been made to link a planter with a roaster to engage in online sales of the brand ‘Appa’s Coffee’ in different Indian urban markets. But these efforts tend to be specific cases, with the majority of the planters content to produce for commodity markets. Indeed, revisiting the economics of coffee production as found in tables 1 and 2 highlight that for those farms with adequate size (e.g. over 100 acres), coffee production is relatively profitable. Conversely, many smaller farms typically do not have the capital to engage in riskier endeavors such as estate branding or mark-eting, and as such value chains are diffuse, there is a lack of “chain champions” to drive such innovations forward. Improved institutional support through producer associations or better contractual linkages

Promoting conservation in India by greening coffee: A value chain approach 29
between buyers and planters could be one way to address this, but requires leadership and vision in the chain.
What about the role of conservation? Going back to our initial premise, are there ways that practices favorable towards the conservation of butterflies be integrated in a cost-effective way? Our survey and research suggests two possible avenues. The first would be through the development of a new market segment that tries to tap into consumer consciousness for the environment, using butterflies as a potential sentinel for such marketing. As noted in Chengappa et al. (2014), such a segment could try to bridge the link between producers and consumers by trying to personalize the efforts put forth by planters. However, the challenges in this type of strategy are threefold. First, distinguishing such a brand in an increasingly competitive niche of ecologically-based products (e.g., bird-friendly coffee) in global markets is not trivial. Second, a niche market strategy that tried to personalize conservation efforts of producers would necessarily require a significant market premium to pay for the brand, and subsequently require products of sufficiently high quality. In Coorg, where the majority of production is low-value robusta, bridging this quality gap would be difficult, though possible with a small group of producers. Third, the disperse nature of the coffee chain would make such a strategy difficult within significant efforts at coordination and building market linkages, again adding costs to this type of strategies. This is not to imply that such a market niche is not viable, but it is likely to follow the individual efforts cited above rather than a sector-wide initiative that could involve numerous actors.
A second strategy, and one that is potentially more viable, is to develop practices on-farm that diversify the product offerings themselves of farmers to include conservation-oriented goods. Rich et al. (2014) discusses the development of a butterfly garden at Swastha, a school for disabled children, as a means of promoting conservation through education. The development of butterfly gardens as a value-adding tool for farmers, particularly given the growing importance of tourism in Coorg, could be one way in which butterfly-oriented conservation could be enhanced. In this manner, Coorg could follow the model adopted in Costa Rica, in which butterfly gardens and other forms of biodiversity preservation have been marketed as part of the value proportion of the tourism experience (Aylward et al. 1996; Menkhaus and Lober 1996; Nadkarni and Wheelwright 2000). One planter in Coorg, Honeypot Farms, already includes homestays and nature walks as part of their portfolio of activities in addition to coffee. Mainstreaming conservation as a form of diversification is potentially a means through which incomes could be enhanced and the environment preserved.
What are the economics associated with establishing a butterfly garden in a coffee estate? In table 11, we adopted a partial budget

P.G. Chengappa, Karl M. Rich, Arun Muniyappa, Yadava C.G., Pradeepa Babu B.N., and
Magda Rich
30
approach to arrive at the costs and returns towards establishing and maintaining a butterfly garden in coffee estates. We estimated the establishment cost of a butterfly garden at Rs. 64,000 per acre, with the majority of costs comprised of planting materials. Establishment costs were amortized over the economic life span of the garden assumed at 50 years. The annual maintenance cost of butterfly garden worked to Rs. 4,280 per acre. These costs do not include extra labor costs rewuired for maintenancae, as some gardens could use existing labor from their farms
Table 11. The economics of establishing butterfly gardens in coffee farms
(a) Establishment and maintenance costs (Rs./acre)
Cost items Cost
a) Establishment costs
Fencing of land 6,000
Land preparation 3,000
Cost of 500 host plants @Rs 100/plant 50,000
Digging of pits and planting 2,000
Manure 2,000
Equipment for watering, inter-cultivation etc 1,000
Total 64,000
b) Maintenance costs
Weeding, inter cultivation, irrigation, training of plants 3,000
Apportioned establishment cost assuming the life of the garden at 50 years 1,280
Total annual cost of maintaining a butterfly garden 4,280
Promoting conservation in India by greening coffee: A value chain approach 31
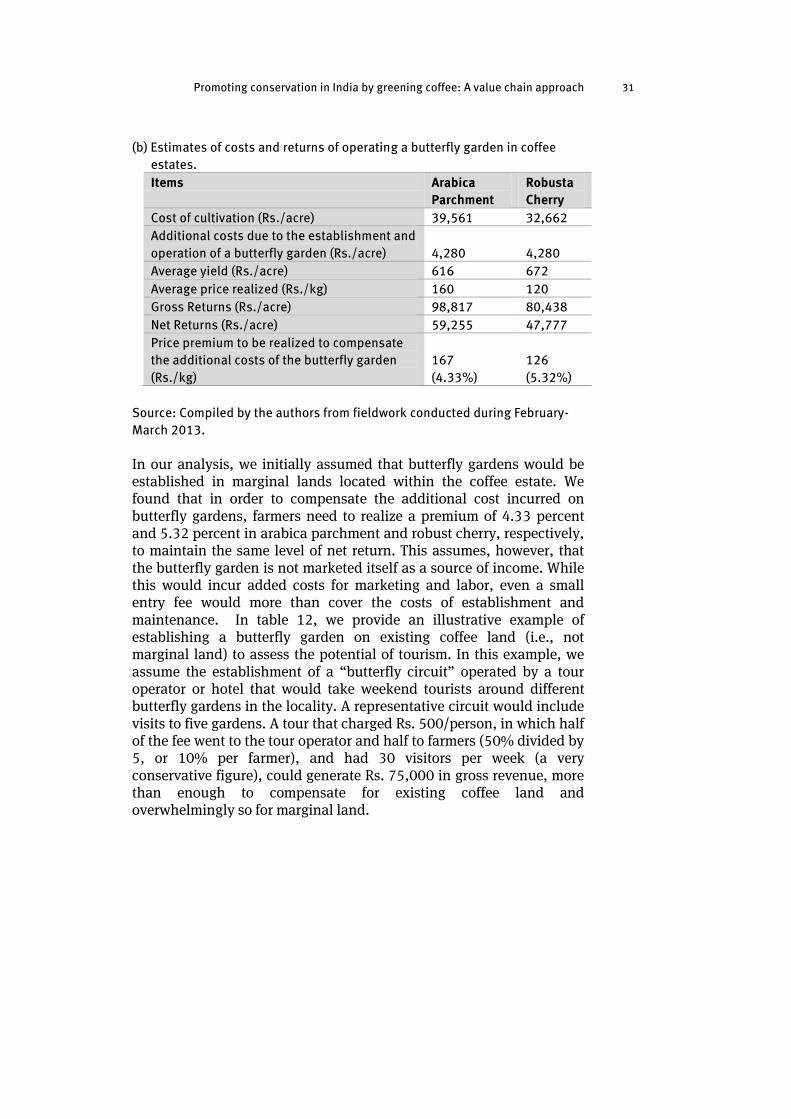
(b) Estimates of costs and returns of operating a butterfly garden in coffee
estates.
Items Arabica
Parchment
Robusta
Cherry
Cost of cultivation (Rs./acre) 39,561 32,662
Additional costs due to the establishment and
operation of a butterfly garden (Rs./acre) 4,280 4,280
Average yield (Rs./acre) 616 672
Average price realized (Rs./kg) 160 120
Gross Returns (Rs./acre) 98,817 80,438
Net Returns (Rs./acre) 59,255 47,777
Price premium to be realized to compensate
the additional costs of the butterfly garden
(Rs./kg)
167
(4.33%)
126
(5.32%)
Source: Compiled by the authors from fieldwork conducted during February-
March 2013.
In our analysis, we initially assumed that butterfly gardens would be established in marginal lands located within the coffee estate. We found that in order to compensate the additional cost incurred on butterfly gardens, farmers need to realize a premium of 4.33 percent and 5.32 percent in arabica parchment and robust cherry, respectively, to maintain the same level of net return. This assumes, however, that the butterfly garden is not marketed itself as a source of income. While this would incur added costs for marketing and labor, even a small entry fee would more than cover the costs of establishment and maintenance. In table 12, we provide an illustrative example of establishing a butterfly garden on existing coffee land (i.e., not marginal land) to assess the potential of tourism. In this example, we assume the establishment of a “butterfly circuit” operated by a tour operator or hotel that would take weekend tourists around different butterfly gardens in the locality. A representative circuit would include visits to five gardens. A tour that charged Rs. 500/person, in which half of the fee went to the tour operator and half to farmers (50% divided by 5, or 10% per farmer), and had 30 visitors per week (a very conservative figure), could generate Rs. 75,000 in gross revenue, more than enough to compensate for existing coffee land and overwhelmingly so for marginal land.

P.G. Chengappa, Karl M. Rich, Arun Muniyappa, Yadava C.G., Pradeepa Babu B.N., and
Magda Rich
32
Table 12. An illustrative example of the economics of establishing a one-acre
butterfly garden for tourism
Item Value
Opportunity costs of establishing a butterfly garden on
coffee land, Rs./acre(from table 11) 59,255
Number of potential tourists per weekend 30
Tour price per tourist (Rs./person) 500
Number of weeks/year for tours 50
Percentage of value accruing to individual farmer 10%
Gross return to butterfly garden 75,000
Net return (Rs./acre) 15,745
Source: Computed by the authors
Conclusions
The coffee value chain in India is at an important transition point. Traditional means of marketing and production are increasingly under threat from market pressures, with new strategies for diversification of income streams and production lines necessary. Our analysis highlighted some of the challenges faced in the value chain and explored the possibility of conservation-based activities, such as those preserving butterfly habitats, as an option for farmers. While adding another conservation-focused brand is potentially challenging at a large scale given the diffuse nature of coordination in the different value chains, integrating simple, relatively low-cost activities such as the establishment of butterfly gardens, is potentially viable and accessible for a range of stakeholders, particularly smallholders. Scaling this out will require partnerships with various actors governing both conservation and tourism, but show potential in rebranding Coorg as not just a destination for coffee, but for responsible environmental stewardship as well.
References
Akarsha, B.M., 2009: Farm Labour in the Indian Coffee Sector: Emerging
Challenges for Factor Intensive Systems in Karnataka, Masters Thesis,
Humboldt University of Berlin.
Aylward, B., Allen, K., Echeverría, J., & Tosi, J. 1996. Sustainable
Ecotourism in Costa Rica: the Monteverde Cloud Forest Preserve.
Biodiversity & Conservation, 5(3), 315-343.
Bhavya, K.V., 2011: Value Chain Analysis for Coffee in Karnataka, India,
Masters thesis, Ghent University.
Chattopadhayay, S., John, P. 2007. Bitter Beans: An Analysis of Coffee
Crisis in India, Partners in change, First edition. www.picindia.org.
Chengappa, P.G., Rich, K.M., Muniyappa, A.,Yadava C.G., Ganashruthi,
M.K., Babu, P., Shubha Y.C., Rich, M. 2014. Sustainable Coffee
Certification in India: Perceptions and Practices. NUPI Working Paper
830, Oslo: Norwegian Institute of International Affairs.
Economic Times, 2013. India's coffee exports down by 10 per cent in FY13,
4 Apr, 2013, 01.57PM IST
(http://economictimes.indiatimes.com/articleshow/19378295.cms)
Gereffi, G., Humphrey, J., & Sturgeon, T. 2005. The governance of global
value chains. Review of International Political Economy 12(1), 78-104.
Indian Coffee Board 2012: Database on Coffee, March 2012.
www.indiacoffee.org
Kaplinsky, R. and Morris, M. 2000: A Handbook for Value Chain Research,
prepared for International Development Research Centre, Ottawa.
Menkhaus, S., & Lober, D. J. (1996). International ecotourism and the
valuation of tropical rainforests in Costa Rica. Journal of Environmental Management, 47(1), 1-10.
Nadkarni, N. M., & Wheelwright, N. T. (Eds.). (2000). Monteverde: Ecology and Conservation of a Tropical Cloud Forest. Oxford: Oxford University
Press.
Pay, E. (2009). The market for organic and fair-trade coffee. Study prepared
in the framework of FAO project GCP/RAF/404/GER, Trade and Markets

Promoting conservation in India by greening coffee: A value chain approach 35
Division. Rome: Food and Agriculture Organization of the United
Nations.
Pierrot, J., Giovannucci, D., & Kasterine, A. 2011. Trends in the Trade of
Certified Coffees. International Trade Centre (ITC), Geneva.
Ponte, S. 2002. The latte revolution? Regulation, markets and consumption
in the global coffee chain. World Development, 30(7), 1099-1122.
Ponte, S., 2004. Standards and Sustainability in the Coffee Sector. A Global
Value Chain Approach.United Nations Conference on Trade and
Development and the International Institute for Sustainable
Development, Published by the International Institute for Sustainable
Development, Canada.
Rich, K.M., Rich, M., Chengappa, P.G. 2014a. The governance of global
value chains for live butterflies. NUPI Working Paper 828, Oslo:
Norwegian Institute of International Affairs.
Rich, M., Changappa, P.G., Babu, K., Rich, K.M. 2014b. Improving
livelihoods through conservation and education: a case study of the
Swastha butterfly garden, NUPI Working Paper 829, Oslo: Norwegian
Institute of International Affairs.
Riisgaard, L., Bolwig, S., Matose, F., Ponte, S., Du Toit, A., & Halberg, N.
2008. A strategic framework and toolbox for action research with small producers in value chains (No. 2008: 17). DIIS working paper,
Copenhagen: Danish Institute for International Studies.
Upendranadh, C. and Subbaiah C., 2012: Small Growers and Coffee
Marketing-Issues and Perspective from the field, Discussion Paper 15,
NRPPD, Centre for Development Studies, Thiruvananthapuram.
USAID (2010) A Regional Strategy For The Specialty Coffee Value Chain In
Eastern Africa: A Practical Approach To Driving Greater Value Capture
In The Region. Paper prepared by Chemonics International Inc. for
USAID, found at Internet address
http://www.competeafrica.org/Files/Regional_Specialty_Coffee_Indust
ry_Strategy.pdf
Website: www.ico.org

NUPINorwegian Institute of International Affairs C.J. Hambros plass 2DPO Box 8159 Dep. NO-0033 Oslo, Norwaywww.nupi.no | [email protected]
Established in 1959, the Norwegian Institute of International Affairs [NUPI] is a leading independent research institute on international politics and areas of relevance to Norwegian foreign policy. Formally under the Ministry of Education and Research, NUPI nevertheless operates as an independent, non-political instance in all its professional activities. Research undertaken at NUPI ranges from short-term applied research to more long-term basic research.
Pradeepa Babu B.N., Research Associate Institute for Social and Economic ChangeBangalore, India
Magda Rich, Research AssistantDepartment of International EconomicsNorwegian Institute of International Affairs
About the AuthorsP.G. Chengappa, Ph.D., National Professor of the Indian Council for Agricultural Research (ICAR)Institute for Social and Economic Change
Karl M. Rich, Ph.D., Research ProfessorDepartment of International EconomicsNorwegian Institute of International Affairs
Arun Muniyappa, Ph.D., Assistant Professor of Agricultural Economics, College of Horticulture
Yadava. C.G., Assistant Professor of Agricultural Economics, College of HorticultureSirsi, Uttara Kannada, Karnataka, India
Related Documents