Promote Exporting Japanese Quality Infrastructure, that is, Best Available Technology Final Report Feasibility Study on DPR/IPR Business in California, the United States, and General-Purpose Business Models, and incorporation into the Master Plan February 2020 Ministry of Economy, Trade and Industry Yokogawa Electric Corporation Mizuho Information & Research Institute, Inc.

Welcome message from author
This document is posted to help you gain knowledge. Please leave a comment to let me know what you think about it! Share it to your friends and learn new things together.
Transcript

Promote Exporting Japanese Quality Infrastructure, that is, Best Available
Technology
Final Report
Feasibility Study on DPR/IPR Business in California, the United States, and
General-Purpose Business Models, and incorporation into the Master Plan
February 2020
Ministry of Economy, Trade and Industry
Yokogawa Electric Corporation
Mizuho Information & Research Institute, Inc.


Table of Contents
1. Status and analyses of California-based IPR/DPR operations ................................................................ - 1 -
1.1 Areas where IPR/DPR projects are to be implemented ............................................................... - 1 -
1.1.1 Target area ............................................................................................................................ - 1 -
1.1.2 Las Virgenes Municipal Water District (LVMWD) ............................................................. - 4 -
1.1.3 Orange County Water District (OCWD) ............................................................................ - 19 -
1.2 Water Policies, Systems, and Master Plans for Implementation of IPR/DPR ........................... - 25 -
1.2.1 Definition of IPR and DPR ................................................................................................ - 25 -
1.2.2 Pre-IPR policy and future targets in California. ................................................................. - 27 -
1.2.3 IPR regulations................................................................................................................... - 28 -
1.2.4 Policy on Direct Potable Reuse (DPR). ............................................................................. - 29 -
1.3 Market Size Forecasts and Influence on the Markets of Other States in the United States ...... - 36 -
2. To verify the superiority and reinforcing measures of Japanese companies .......................................... - 41 -
2.1 Trends in companies entering IPR/DPR business ..................................................................... - 41 -
2.1.1 EPC .................................................................................................................................... - 41 -
2.1.2 Membrane separation activated sludge process ................................................................. - 42 -
2.1.3 RO membrane .................................................................................................................... - 44 -
2.1.4 Disinfection technology ..................................................................................................... - 46 -
2.1.5 Measurement control technology ....................................................................................... - 47 -
2.2 Barriers to entry and solutions .................................................................................................. - 49 -
2.2.1 Application of new technology .......................................................................................... - 49 -
2.2.2 Adaptation to the U.S. market ............................................................................................ - 51 -
2.2.3 Funding .............................................................................................................................. - 54 -
2.3 Examination of technologies that constitute a general-purpose business model and verification of
their supportiveness. ....................................................................................................................... - 55 -
2.3.1 Technological Elements Exploiting the Current Status and Strengths of Membrane Processing
.................................................................................................................................................... - 55 -
2.3.2 Suggestions for the promotion of digitalization ................................................................. - 59 -
2.3.2.1 Survey of current status of membrane treatment (IPR-facilities in OCWD) .................. - 61 -
2.3.2.2 Simulation results ............................................................................................................ - 75 -
2.3.2.3 Holistic optimization application .................................................................................... - 84 -
2.3.2.4 Control system ................................................................................................................ - 86 -
2.3.2.5 Coordination of Simulation and Control Systems........................................................... - 88 -
2.3.2.6 Risk Assessment.............................................................................................................. - 93 -
2.3.2.7 Fail-safe........................................................................................................................... - 95 -
2.3.2.8 Technical proposals for performance assurance through water quality monitoring ........ - 98 -

2.3.2.9 Assessment of RAPID Techniques and Application Effects ......................................... - 124 -
2.3.2.10 Optimization of water quality control methods and treatment processes.................... - 134 -
2.3.3 Promoting measures against RO brine water ................................................................... - 138 -
2.3.3.1 Background and purpose of interest .............................................................................. - 138 -
2.3.3.2 WateReuse Symposium of publication of results .......................................................... - 140 -
2.3.3.3 Current RO-membrane systems in OCWD ................................................................... - 143 -
2.3.3.4 Analyzing the costs of AWTF chemicals in OCWD ..................................................... - 145 -
2.3.3.5 Description of the proposed process ............................................................................. - 148 -
2.3.3.6 Economic estimation of the proposed process .............................................................. - 151 -
2.3.3.7 Examining the possibility of spreading to other regions ............................................... - 153 -
2.3.3.8 Summary of RO membrane brine solutions .................................................................. - 157 -
3. Basic design of the proposed system ................................................................................................ - 159 -
5. Examining and Proposing Finance to Promote Projects in California. ............................................... - 165 -
5.1 Overview of funding measures ............................................................................................... - 165 -
5.1. 1 DWSRF (Provincial Water Supply Development Fund) ................................................. - 170 -
5.1. 2 CWSRF (State Wastewater Development Fund) ............................................................ - 171 -
5.1. 3 WIFIA (Water Infrastructure Funding Reforming Act)................................................... - 172 -
5.1. 4 Water Recycling Funding Program (WRFP)................................................................... - 173 -
5.1. 5 Tax-exempt Bonds .......................................................................................................... - 173 -
5.1.6 Bureau of Reclamation related funding system ............................................................... - 174 -
5.1.7 Measure W ....................................................................................................................... - 176 -
5. Status of Funding for 2 OCWD ................................................................................................ - 177 -
5.2.1 Funding as OCWD ........................................................................................................... - 177 -
5.2. 2 GWRS Costs ................................................................................................................... - 178 -
5.3 Current Status of Funding for LVMWD. ................................................................................ - 179 -
5.3.1 Assumed funding methods ............................................................................................... - 179 -
5.3.2 Project cost structure ........................................................................................................ - 180 -
5. 4 OCWD and LVMWD Financing Proposals ........................................................................... - 182 -
5.4.1 Incorporation into the California DPR Master Plan ......................................................... - 182 -
5.4.2 Finance when market size expands .................................................................................. - 183 -
6. Study of business schemes and business models ............................................................................... - 185 -
6.1 Strategies for Effective Implementation of Survey Content ................................................... - 185 -
6.1.1 Technology and business phases ...................................................................................... - 185 -
6.1.2 Short-term introduction project ........................................................................................ - 186 -
6.1.3 Medium-term introduction project ................................................................................... - 188 -
6.2 Implementation system for commercialization ....................................................................... - 188 -

6.3 Risk analysis and solutions ..................................................................................................... - 190 -
7. Estimation of emissions restrictions of energy-derived CO2, environmental improvement effects, and
environmental and social impacts......................................................................................................... - 197 -
7.1 Need to reduce energy expenditure ......................................................................................... - 197 -
7.1.1 Las Virgenes Water Service (LVMWD) ........................................................................... - 197 -
7.1.2 Orange District Waterworks Bureau (OCWD) ................................................................ - 202 -
7.2 Need to reduce CO2 emissions ............................................................................................... - 204 -
7.3 Estimation of emissions limitation of energy-derived CO2 .................................................... - 206 -
8. Report Implementation .................................................................................................................... - 213 -


Terminology Abbreviations and Acronyms
A2O: Anaerobic-Anoxic-Oxic Process
AI: Artificial Intelligence
AOP: Advanced Oxidation Process
ASM: Activated Sludge Models
Advanced water treatment facilities related to AWTF: Advanced Water Treatment Facility
BAC: Biological Activated Carbon
BOD: Biochemical Oxygen Demand
CAPEX: Capital Expenditure
CCPs: Critical Control Points
CCR: California Code of Regulations
CDC: Centers for Disease Control and Prevention
CDPH: California Department of Public Health
CEC: Pollutants not regulated by Chemicals of Emerging Concern
CF: Cartridge Filter
CFR: Code of Federal Regulations
CIP: Clean in Place
COD: Chemical Oxygen Demand
CR: Crystallizer
CT: Residual disinfectant concentration (mg/L) multiplied by Contact time (minutes)
DBP: Disinfection Byproduct
DCS: Distributed Control System
DDMO: Data Driven Modeling for Optimization
DDWs: Division of Drinking Water in The California State Water Resources Control Board
DO: Dissolved Oxygen
DPR: Direct Potable Reuse
DWTF: Drinking Water Treatment Facility
EC: Electrical Conductivity
ED: Electrodialysis
EL: Electrolyser

FB: Feed Back Control
FF: Feed Forward Control
FS: Filter Screens
GMF: Granular Media Filter
GPD: Gallon per Day
GPH: Gallon per Hour
GPM: Gallon per Minute
GWRS: Groundwater Replenishment System
HACCP: Hazard Analysis Critical Control Point
IoT: Internet of Things
IPR: Indirect Potable Reuse
LVMWD: Las Virgenes Municipal Water District
LIME: lime, slaked lime CaO, and raw lime Ca(OH)2
LRV: Log 10 removing reduction value
MBR: Membrane Bioreactor
mED: Monovalent Ion Selective Electrodialysis
MF: Microfiltration
MGD: Mega Gallon per Day
MLSS: Mixed Liquor Suspended Solids
NDMA: N-nitrosodimethylamine
NF: Nanofiltration
NPDES: National Pollution Discharge Elimination System
NWRI: National Water Research Institute
NTU: Nephelometric Turbidity Units
N2: Nitrogen
NH4-N: Ammonium Nitrogen
NO2-N: Nitrate Nitrogen
NO3-N: Nitrate Nitrogen
O3: Ozone

O&M: Operation and Maintenance
OCSD: Orange County Sanitation District
OCWD: Orange County Water District
OPEX: Operating Expense
ORP: Oxidation-Reduction Potential
OSCG: On-site Sodium Chlorite Generator
OT: Operation Technology
PC: Personal Computer
PCR: Polymerase Chain Reaction
PDT: Pressure Decay Test
pH: Potential of Hydrogen
PIMS: Process Information Management System
PLCs: Programmable Logic Controller
PS: Pellet Softener
QMRA: Quantitative Microbial Risk Assessment
qPCR: Quantitative Polymerase Chain Reaction
RAPID: Rapid Assessment Pathogen Identification Detection
RO: Reverse osmosis
RT-PCR: Reverse Transcription Polymerase Chain Reaction
SAT: Soil Aquifer Treatment
SBS: Sodium Hydrogen Sulfite
SCADA: Supervisory Control And Data Acquisition
SCC: Solids Contact Clarifier
SWA: Surface Water Augmentation
SWB: The California State Water Resources Control Board
TDS: Total Dissolved Solids
TF: Simple filter with Tricking Filter
TI: Threshhold Inhibitor
T-N: Total Nitrogen
TOC: Total Organic Carbon
TSS: Total Suspended Solids

USEPA: United States Environmental Protection Agency
UF: Ultrafiltration
UV: Ultraviolet
UV-AOP: UV Advanced Oxidation Process
WEF: Water Environment Federation
WHO: World Health Organization
WRF: Water Research Foundation
WWTF: Wastewater Treatment Facility
WateReuse: WateReuse Association
ZLD: Zero Liquid Discharge
ZCC: Zero Chemical Charge

- 1 -
1. Status and analyses of California-based IPR/DPR operations
1.1 Areas where IPR/DPR projects are to be implemented
1.1.1 Target area
This study examines the introduction of systems and optimization systems applying advanced
digital management technologies in IPR or DPR projects for the following two water supply offices
(Water District) in the province.
Table 1 Water supply department considering commercialization
No. County Water Bureau
1 Los Angeles County LVMWD (Las Virgenes Municipal Water District)
2 Orange County OCWD (Orange County Water District)
Figure 1 Aqueduct Bureau considering commercialization
LA City
LA County
Orange CountyAnaheim City
Santa-Ana City
State of California
LVMWD
OCWD

- 2 -
One of the hydrological characteristics of the water service areas has reliance on groundwater. Large
aquifers within California are concentrated along the southwestern coast, with the entire Orange
County and the southern part of the LA County overlapping with its distribution.
Figure 2 Hydrology map of California1
The characteristics of each business area are as follows:
⚫ Las Virgenes Municipal Water District (LVMWD):
The southern part of LA County, where aquifers are distributed, is a hilly area, unlike
neighboring areas, and groundwater is not available at all. Therefore, they rely on imported
water from the California water channel (California Aqueduct) in northern California. In the
future, the target is to reduce the percentage of imported water in drinking-purpose water
sources from 100% to 85% at present.
The city of LA (eastern to LVMWD area) is located in the southern part of LA County, where
groundwater is available, but the quantity is very limited, and in the future, costs are planned
to be reduced by reducing purchases from California waterways and by switching to imports
from its own waterways (LA waterways: LA Aqueduct) and increased reliance on groundwater
(Figure 3).
1 Azya Jackson (City of LA) and Anthony Tew (Jacobs Engineering Group) "Reduce Dependency on Imported Water in Los Angeles: Water Reuse is the Answer" (WateReuse, 2019)
LA County
Orange County

- 3 -
⚫ Orange County Water District (OCWD):
Northern Orange County is used as the tract. Groundwater from the aquifer (Orange County
Groundwater Basin) of the county depends on 75% of the supply and the remaining 25% on
imported water from outside the county. Imported water, like LVMWD, is derived from the
California water channel. Because of its valuable water source, the aquifer has been preventing
reclamation and invasion of seawater by OCWD. On the background of this, the county has
been implementing the world's largest IPR project to date.
Figure 3 Water supply plan for the city of LA2
Each area of business is shown below.
2 Azya Jackson (City of LA) and Anthony Tew (Jacobs Engineering Group) "Reduce Dependency on Imported Water in Los Angeles: Water Reuse is the Answer" (WateReuse, 2019)

- 4 -
1.1.2 Las Virgenes Municipal Water District (LVMWD)
(1) Current business outline
Las Virgenes Municipal Water District (LVMWD) provides water supply, wastewater treatment,
reclaimed water, and composts over 75,000 inhabitants in the southwestern part of Los Angeles County,
California (contiguous with Ventura County). The major cities located within the area are the city of
Agoura Hills, the city of Calabasas, the city of Hidden Hills, and the city of Westlake Village; the
headquarters of LVMWD are in the city of Calabasas.
In addition, wastewater treatment in Ventura County, which is located on the western side, is being
conducted. Post-treatment RO-enriched water is also requesting marine dumping through Salinity
Management Pipeline (SMP) owned by Calleguas Municipal Water District (CMWD of Ventura
District (water wholesaler of the county).
In Los Angeles County, water supply operations are conducted directly by Los Angeles City and its
southeastern region (Figure 5). LVMWD is a distinct organization.
Figure 4 Location of LA-county in California, major cities and LVMWD business areas in the
county3
3 Prepared by Mizuho Information Research Institute based on various materials
- 5 -
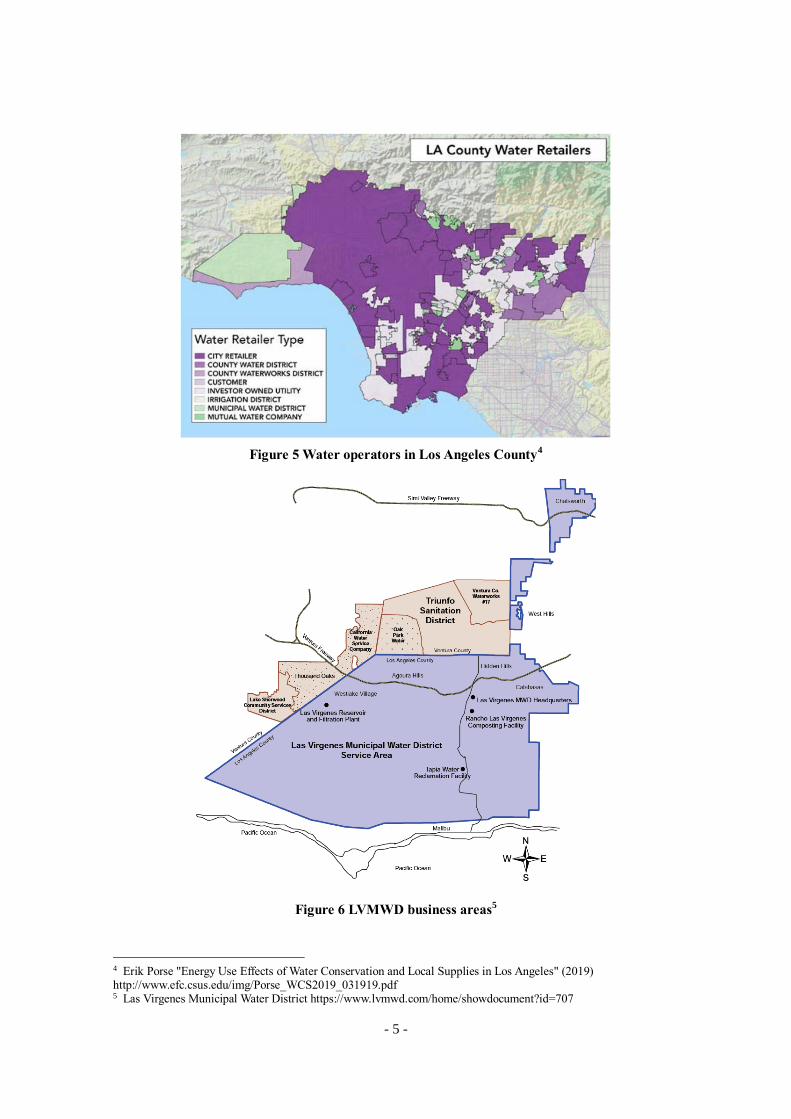
Figure 5 Water operators in Los Angeles County4
Figure 6 LVMWD business areas5
4 Erik Porse "Energy Use Effects of Water Conservation and Local Supplies in Los Angeles" (2019) http://www.efc.csus.edu/img/Porse_WCS2019_031919.pdf 5 Las Virgenes Municipal Water District https://www.lvmwd.com/home/showdocument?id=707

- 6 -
Since there are no sources of drinking-water in LVMWD areas, 100% of them depend on imported
water. Most of them are watered from northern California through MWDs (Metropolitan Water District
of Southern California), one of the world's largest water wholesalers. The small percentage remaining
is the import from VCWWD (Ventura County Waterworks District) in Ventura County.
Water using the Sierra Nevada Mountains (northern California) as a water source is watered through
the California Water Channel (California Aqueduct), a water business in California, and supplied to
the eastern edge of the city of Calabasas in LVMWD area. It is then supplied to the entire area through
the water pipes. Twenty-five water storage tanks and 24 pumping stations are required to carry out
water supply operations.
Approximately 20% of the drinking-water supplied by LVMWD is reused for irrigation of highway
green spaces, golf courses, school gardens, and other public and commercial landscapes. This
reclaimed water is produced by wastewater treatment and supplied through a water supply (66 miles),
two storage tanks, two reservoirs, and four pumping stations.
LVMWD is performing wastewater treatment and operationalizes a system consisting of two trunk-
line sewage systems (8-48 inches in diameter and 56 miles) and two lift stations that deliver wastewater
across mountainous areas to treatment facilities. Composting of treated sludge is also conducted
(distributed free for household use).
In addition, the Las Virgenes reservoir has been operationalized as solutions against peak demand
and as a back-up against the background that there is no own water source.
In this context, in order to reduce the reliance on imported water, particularly for drinking purposes,
LVMWD aims to reduce reliance from 100% to 85% at present6. The project being considered for this
purpose is "Pure Water Project" as SWA (Surface Water Augmentation), which will be the first IPR
project to be conducted by LVMWA (see below).
Table 2 LVMWD water source7 (Unit: AFY)
Source Uses 2015 2020 2025 2030 2035 2040
Import MWD Drinking and
irrigation 19,467 22,412 23,396 24,423 25,495 26,613
VCWWD 117 131 131 131 131 131
Surface
water ― ― 0 0 0 0 0 0
Reuse Existing Irrigation 4,240 4,255 4,269 4,284 4,299 4,314
SWA Drinking The target is 15% of the purpose of drinking.
Total Existing Drinking and
irrigation 23,825 26,798 27,796 28,838 29,925 31,058
6 Hearing to LVMWD (2019). 7 Kennedy/Jenks Consultants "Final Draft: Pure Water Project Las Virgenes-Triunfo Joint Powers Authority Title XVI Feasibility Study" (2018)

- 7 -
Existing + SWA Drinking and
irrigation Under study
Figure 7 Water sources in southern California.8
Table 3 LVMWD Summary9
Established 1958
Governance Five board directors (elected by the public)
Area of business area About 196 km2
Water supply population Seventy-five thousand inhabitants receive water supply, including the
city of Agoura Hills, the city of Calabasas, the city of Hidden Hills, and
the city of Westlake Village. In addition, Las Virgenes-Triunfo Joint
Powers Authority (JPA) provides sanitary services to about 30,000
people.
Number of contracted Potable water
Resident 18,334
Work 846
Recycled water 660
Water supply (2017-18) Drinking water 19,294 acre foot
Reclaimed water 4,868 acre foot
8 Erik Porse "Energy Use Effects of Water Conservation and Local Supplies in Los Angeles" (2019) http://www.efc.csus.edu/img/Porse_WCS2019_031919.pdf 9 LVMWD

- 8 -
Budget (2018-19). 75.7 million USD
Table 4 LVMWD Summary of Existing Facilities10
Las
Virgenes
reservoir
Objective The main objective is to respond to the peak demand of water in
summer. It can also be used as a back-up in preparation for planned
suspension of water supply from the MWD (for 3 months).
Place Westlake Village city
Size Water storage: about 3 billion gallons
Area: about 160 acres (LVMWD owns about 360 acres in the basin
around the reservoir)
History Design and construction: 1970-72
Water storage: 1974
Features It is based on two soil dams made of rock.
The main dam is 160 ft in height, 2,000 ft in length, 20 ft in width
(apex)/750 ft (bottom). The accessory dam is 50 feet in height, 750 feet
in length, 20 feet in width (apex)/425 feet (bottom).
Water collection tower: Concrete. Five valves are placed at different
depths, allowing the operator to take water.
Weak
Filtering
plant
Objective Disinfection and filtration of water from the Las Virgenes reservoir and
use it for water supply.
Place Westlake Village city (Las Virgenes reservoir)
10 LVMWD

- 9 -
History
USD 9 million to meet federal and state regulations (drinking
standards) completed in 1990.
Features The facility is 20,000 square feet and can disinfect and filter up to 18
mgd. Twelve diatomaceous earth filters (DE filters) were used for the
main treatment processes. Disinfection used chloramine treatment.
Tank volume is 5 million gallons.
Tapia Water
Reclamatio
n Facility
Objective Wastewater treatment to produce high-quality reclaimed water. Use of
reclaimed water to reduce reliance on external introduction due to
areas with limited water resources.
Place Along Malibu Canyon Road of non-agency areas (not belonging to
municipalities)
History It was constructed downstream of the Malibu River basin and devised
to allow wastewater to flow into the treatment facility by gravity to
reduce the need for pump infrastructure and energy consumption.
Constructed on a scale of 0. 5 mgd in 1965. It then expanded in size to
2 mgd in 1968, 4 mgd in 1972, 8 mgd in 1984, 10 mgd in 1986, and
present 12 mgd. Production of reclaimed water started in 1972.
Features Currently, the mean 8 mgd is processed.
There are six basins, each with a longitudinal transverse of 160 ft/30
ft/depth of 15 ft, and 540 air injectors can inject 2,100 cubic feet of air
per minute.
Twelve filters have been placed in the tertiary treatment, each filter
having a surface area of 253 squares feet and 4 feet deep smokeless
charcoal on top of 1 foot of gravel.

- 10 -
There are state-certified water quality laboratories within the facility
to ensure that reclaimed water at this facility meets state and federal
standards of health and safety. The laboratory is measuring water
quality in the Malibu River.
Rancho
Compost
Production
Facility
Objective Produce composts compatible with USEPA "Class A-Exceptional
Quality" from sewage sludge, stabilized into environmentally friendly
disposition using sewage sludge generated from treatment in Tapia.
Place Las Virgenes/Lost Hills crossroads in the city of Calabasas.
History Started operation in November 1994 as the first indoor composting
facility in LA County.
Size Annually, the size avoids landfilling of the final disposal site for one
floor height of the football field, treating 120,000 gallons per day and
producing 11,000 cubic yards of compost per year.
Treatment of almost the entire amount of sewage sludge at Tapia Water
Reclamation Facility.
Features The world's most advanced and automated sewage sludge composting
facility.
Implement efficient odor control.
Three anaerobic digesters, 80 feet in diameter and 50 feet in height,
respectively.
Has two centrifuges, 250 gallons per minute for dehydration capacity,
respectively.
Semi-acre biofilters carry out natural treatment for odor control.

- 11 -

- 12 -
(2) Total of DPR/IPR business
● An Overview
At present, LVMWD is examining the IPR business which carries out the advanced treatment for
the purpose of drinking, and it is the stage in which the final draft was completed. The IPR project
"Title XVI project" is referred to as "pure water project" to increase surface water as SWA (Surface
Water Augmentation) and for use in drinking.11
The basic treatment flow is assumed to be that the tertiary treatment water at Tapia Water
Reclamation Facility is treated at an advanced treatment plant (AWTF: Advanced Water Treatment
Plant) and diluted into the Las Virgenes Reservoir as a required environmental buffer in the IPR.
Figure 8 SWA-Plan Concept in LVMWD12
The objective is two points as follows:
1) Establish robust water supply system in term of drought-resistant for the new resident area to
reduce the dependence on imported water.
11 Kennedy/Jenks Consultants "Final Draft: Pure Water Project Las Virgenes-Triunfo Joint Powers Authority Title XVI Feasibility Study" (2018) 12 "AGENDA FOR REGULAR MEETING OF THE BOARD OF DIRECTORS OF THE PALMDALE WATER DISTRICT to be held at the District's office at 2029 East Avenue Q, Palmdale / MONDAY, April 8, 2019" https://www.palmdalewater.org/wp-content/uploads/2019/04/AgendaRegular4-8-19PacketWebsite.pdf

- 13 -
2) Control discharge water to the Malibu River and treat wastewater in compliance with new strict
regulations and standards.
Table 5 Basic Specifications of Pure Water Project 12
Item Unit Value
Water production Initial year AFY 2,092
Year 20 AFY 4,129
Period average AFY 3,100
AWTF throughput MGD 6.0
Recovery rate MF membrane % 95
RO membrane % 85
(RO brine water 15%)
Figure 9 SWA-Plan Map in LVMWD13
Two sites have been considered for AWTF, and it is unclear which one to do. "1a" has the advantage
of being close to reservoirs and "1b" to pipelines.14
13 https://www.ourpureh2o.com/learn-more/co-op-facilities 14 Hearing to LVMWD (2019).

- 14 -
Table 6 Scenarios of Pure Water Project15
AWTF sites Treatment route
Raw water Water production RO concentrated water Waste materials
1a: near the Las
Virgenes reservoir
(Site A)
From Lindero Canyon
Road
To the Las Virgenes
reservoir
Through Thousand Oaks
Blvd. to the SMP
To the sewage supply
of the LA County via
the access way
1b: Extra-Agoura
(Site F)
From Agoura Road Through Lindero Canyon
Road to the Las Virgenes
reservoir
〃 〃
Figure 10 Site map and treatment routes (AWFs, RO brine water) of Pure Water Project15
15 Kennedy/Jenks Consultants "Final Draft: Pure Water Project Las Virgenes-Triunfo Joint Powers Authority Title XVI Feasibility Study" (2018)

- 15 -
With the realization of this project, it is planned to utilize the functions in the Las Virgenes reservoir
and to provide drinking water in response to seasonal variations.
Figure 11 Seasonal variations in demand and supplies of Pure Water Project16
● Treatment process
The advanced water treatment process assumed in this project is as follows, and RO membranes are
adopted as a policy. The incorporation of Japanese technology and equipment for the same process is
described below.
Figure 12 Process of "Pure Water Project"16
16 Kennedy/Jenks Consultants "Final Draft: Pure Water Project Las Virgenes-Triunfo Joint Powers Authority Title XVI Feasibility Study" (2018)

- 16 -
The required LRV credits are 7/8/7 (for a dilution rate of 100:1) in ① and 14/12/12 in ② in the
lower panel. RWQCB (Regional Water Quality Control Board) is generally more strictly regulated.
Whether or not to regulate PFOS (substances generated from the processing of fluorogenic resins, etc.)
is also being investigated.
Figure 13 LRVs in the treatment of Pure Water Project17
The generated RO brine water has been transported in the pipeline to the adjacent Ventura County,
where marine dumps have been made, as described above. LVMWD views on this are as follows:18
⚫ For the treatment of RO brine water, it has been transported out of the autochthonous
region 11 miles apart in the pipeline and subsequently dumped in the ocean.
⚫ Another management organization (water wholesaler in Calleguas Municipal Water
District (CMWD) in Ventura City) commissioned treatment through Salinity
Management Pipeline (SMPs) (owned by the company).
⚫ The recovery rate is 85% without excessive increase (beyond which the viscosity of
the RO brine becomes higher and the scale is generated, not desirable). If the recovery
rate is 95%, the cost of treatment will be three times higher.
⚫ The potential for marine dumping of RO brine water to be subject to regulatory
intensification cannot be denied, but it is not considered at this time. There are also
criticisms from environmental protection organizations, but this is not stronger.
● Timeline for commercialization
The schedule for commercialization is assumed to be as follows: In addition, how to incorporate the
content of this review into the same schedule will be discussed below.
17 Hearing to LVMWD (2019). 18 Hearing to LVMWD (2019).
TAPIA UF RO UV Reservoir DWF
① ②
- 17 -
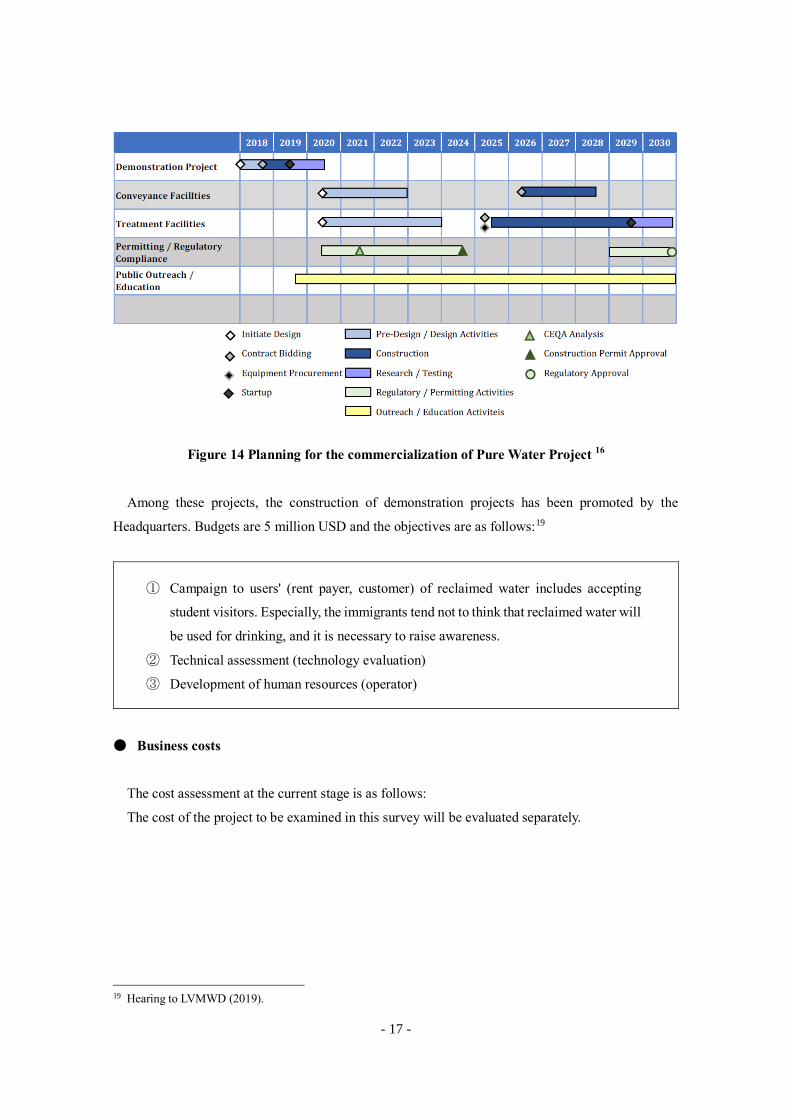
Figure 14 Planning for the commercialization of Pure Water Project 16
Among these projects, the construction of demonstration projects has been promoted by the
Headquarters. Budgets are 5 million USD and the objectives are as follows:19
① Campaign to users' (rent payer, customer) of reclaimed water includes accepting
student visitors. Especially, the immigrants tend not to think that reclaimed water will
be used for drinking, and it is necessary to raise awareness.
② Technical assessment (technology evaluation)
③ Development of human resources (operator)
● Business costs
The cost assessment at the current stage is as follows:
The cost of the project to be examined in this survey will be evaluated separately.
19 Hearing to LVMWD (2019).

- 18 -
Table 7 Cost-assessment of Pure Water Project (in million USD)20
Cost
classification
Cost Scenarios 1a
(AWTF Site A).
Scenarios 1b
(AWTF sites F
CAPEX Treatment 80.6 76.1
Pipeline 35.6 38.6
Pump station 0 3.6
Retention NA NA
Stirring system 1.7 1.7
RO concentrated wastewater
station
0.5 0.5
Land acquisition 0 2.1
Total 118.4 122.6
OPEX Annual O&M costs (USD/year). 3.4 3.4
The unit cost per treatment dose is as follows:
Table 8 Cost-assessment of Pure Water Project (in USD/AF)21
Cost classification Scenarios 1a
(AWTF Site A).
Scenarios 1b
(AWTF sites F
CAPEX 1,949 2,018
OPEX 1,100 1,100
Reducing the cost of imported water -1,488 -1,488
Life cycle costs 1,561 1,630
20 Kennedy/Jenks Consultants "Final Draft: Pure Water Project Las Virgenes-Triunfo Joint Powers Authority Title XVI Feasibility Study" (2018) 21 Adapted in part from Kennedy/Jenks Consultants "Final Draft: Pure Water Project Las Virgenes-Triunfo Joint Powers Authority Title XVI Feasibility Study (2018)

- 19 -
1.1.3 Orange County Water District (OCWD)
(1) Current business outline
Orange County is adjacent to the south of Los Angeles County, which has a city of Los Angeles,
and is also located north of the city of San Diego. Some because of the suburban location flanked by
both metropolitan areas, the population exceeded 3.2 million in 2018, representing an annual growth
rate of 0.7% (higher than the national average population growth rate in the same year).
Figure 15 Location of California and Orange Counties
Water sources in Orange County mainly depend on groundwater from the aquifer (Orange County
Groundwater Basin) in the county grounds and imported water from outside the county.
Table 9 Orange County water sources22
Region Water source Percentage
Northern and Central
Orange County
Ground water 75%
Importation from outside the county (surface water) 25%
Southern Orange County Groundwater (small scale) and reclaimed water for
irrigation
10%
Importation from outside the county (surface water) 90%
22 OCWD (2019)
コロラド川
サンフランシスコ市
ロサンゼルス市
カリフォルニア州
ネバダ州
オレンジ郡
San Francisco
State of California
Los Angeles
Orange CountyColorado River
State of Nevada

- 20 -
Figure 16 Orange County water source23
There are two routes of imported water from outside the counties, all of which are purchased from
MWD (Metropolitan Water District of Southern California).
⚫ Northern California: Water derived from the Sierra Nevada Mountains is conducted through the
California Water Channel (California Aqueduct), a water project in California.
⚫ Southern California: Water from the Colorado River is fed through the Colorado Waterway
(Colorado River Aqueduct), the MWD water business.
Some of these are supplied to the north of Orange County via groundwater recharge, and some are
supplied directly to the county.
23 OCWD (2019)

- 21 -
Figure 17 Water sources in southern California (reprinted)24
The breakdown of aquifer water sources is as follows, and this reclamation project (GWRS:
Ground Water Replenishment System) is conducted as a OCWD project. Some of them are imported
water from outside the county (above), and others include the Santa Ana River (rainfall, snowmelt,
upstream treatment water) and rainfall flowing through Orange County. In addition, treated water from
the IPR project described below is injected into the aquarium.
Figure 18 Water sources in the tract25
24 Erik Porse "Energy Use Effects of Water Conservation and Local Supplies in Los Angeles" (2019) http://www.efc.csus.edu/img/Porse_WCS2019_031919.pdf 25 OCWD (2019/9)
Natural Recharge
17%
Santa Ana River Baseflow
19%
Stormwater15%
Recycled or Reused Water
30%
Imported Water19%

- 22 -
OCWD's business area is northern and central Orange County, with more than 2.5 million
populations in the region.
The remaining 600,000 residents live in southern Orange County, where seven water distribution
agencies and urban water departments provide water. They are outside the region of large aquifers and
10% depend on groundwater and treated water (for irrigation) within small counties. 90% are imported.
As a business, OCWD is conducting wholesale distribution of water, advanced treatment of
wastewater, and recharge of groundwater. As a wholesale, we sell water to retailers and water
distributors in the area. Each wholesale condition (equivalent in units) is identical, and retail and water
distribution operators determine the unit sales value to the final consumer according to local conditions.
Figure 19 OCWD business areas in Orange County26
26 OCWD (2019)

- 23 -
(2) Total IPR business
The IPR project by OCWD is currently the largest IPR in operation worldwide, plans to expand to
130 MGDs by 2023 are under way.
At present facilities, approximately 200 MGDs of sewage and drain from more than 2.5 million
people are sent to OCSD (Orange County Sanitation District) and proceeds to wastewater treatment.
Some of the treated water is released into the ocean. The largest IPR project worldwide has been
conducted since 2008, with approximately 100 MGDs being sent to OCWD Groundwater
Replenishment System (GWRS) and treated to meet drinking standards. The treated water is returned
to the aquifer, mixed with other water sources, and eventually used for drinking. Through this water
flow, about 75% of water demand in northern and central Orange County is covered by groundwater.
Among aquifers, near the shore, they are compressed to prevent saltwater entry (Figure 21, C), and
the portion transferred by the pipeline to the north is to recharge for drinking purposes (Figure 21, A
and B).
In addition, by 2023, a plan to expand the treatment scale of the IPR project has been under way
(Table 10).Table 10 Disposal details of IPR business
Figure 20 IPR project map for Orange County27
27 Compiled by Mizuho Information & Research Institute based on OCWD data

- 24 -
Figure 21 IPR project map for Orange County (subterranean section)28
Table 10 Disposal details of IPR business
Scale of treatment ⚫ Presently 100 MGD
⚫ Plan 130 MGD (~2023)
Equipment
ownership/operators
⚫ OCWD
⚫ Prior to treatment at this facility, treatment shall be conducted at a
water treatment facility in OCSD (Orange County Sanitation
District).
Use of treated water
(Present)
⚫ Coastal zone: Pressure entry of seawater into groundwater aquifer
(total 30 MGD)
⚫ Inland zone: 70 MGD indentation of groundwater aquifer for
drinking purposes
28 OCWD (2019)

- 25 -
1.2 Water Policies, Systems, and Master Plans for Implementation of IPR/DPR
1.2.1 Definition of IPR and DPR
In explaining water policies and systems toward implementation of the California IPR, definitions
in California Water Code of indirect potable reuse (IPR) and direct potable reuse (DPR) in the state
are provided in. SWA is one of the IPRs.
Table 11 Definitions of IPR and DPR in California29
IPR (indirect potable
reuse) of groundwater
replenishment
Reclaimed water use for planned groundwater and aquifer
replenishment is designed to serve as a source of water for public water
systems. (Compliant with Section 116275 of Health and Safety Code)
SWA (surface water
augmentation)
Planned introduction of reclaimed water into surface water reservoirs
and supply as drinking water.
DPR (direct drinking) Planned introduction of reclaimed water directly into public water
systems (in accordance with Section 116275 of Health and Safety
Code) or immediately upstream of the water treatment plant.
Schematic representation of IPR (defined in California Water Code) in California is shown in Figure
22. This shows the introduction of highly treated water into environmental buffers as part of raw water
supplies upstream of DWTF. Figure 22 (a, b) environmental buffers are groundwater aquifers and
therefore need to meet regulations for groundwater recharge. In such projects, advanced treatment
water can be used by surface water (dilution) or by supply to the ground (direct indentation). Also, the
advantages of soil-adsorption treatments (SAT: Soil Aquifer Treatment) have been exploited. Figure
22 (c) requires that as SWA (Surface Water Argumentation), the IPR criteria (drafts) with theoretical
hydrological residence times of 4-6 months or more be met, as environmental buffers are reservoirs of
surface water.
Schematic representation of DPR is shown in Figure 23 (a, b, c). Figure 23 (a) introduces advanced
treatment water using smaller SWA buffers or (b) high treatment water without buffer per raw water
supply just upstream of DWTF. DPR projects in operation licensed in the United States to date include
this form of DPR (i.e., Big Spring Raw Water Production Facility and DPR projects operated by
Colorado River Municipal Water District were used to provide emergency water supply to the city of
Wichita Falls. The Wichita falls Plan was implemented and discontinued in emergencies). In Figure
23(c), reclaimed water has been introduced directly into the water system.
29 Prepared based on SWB (2016) "Evaluation of the Feasibility of Developing Uniform Water Recycling Criteria for Direct Potable Reuse"

- 26 -
Figure 22 Scheme of IPR in California.30
Figure 23 DPR scheme in California31
30 SWB(2016) "Evaluation of the Feasibility of Developing Uniform Water Recycling Criteria for Direct Potable Reuse" 31 SWB(2016) "Evaluation of the Feasibility of Developing Uniform Water Recycling Criteria for Direct Potable Reuse"

- 27 -
1.2.2 Pre-IPR policy and future targets in California.
Non-Potable use of reclaimed water has started in California since the beginning of the 20th century,
and its regulations and standards have been established. During that time, there has been a planned
drinking reuse in the form of indirect potable reuse (IPR). Groundwater Augmentation Regulation
(GWA) was approved in 2014 and Surface Water Augmentation Regulation (SWA) in 2016, and IPR
have been legally operationalized (Table 12). IPR regulations are discussed in the next section, and
DPR policies are discussed in the next section.
California water supplies tend to depend on runoff associated with snowmelt. Moreover, due to
climate change, precipitation is more common as rain than as snow, and runoff is projected to occur
earlier in the season, so supply is likely to decrease in the coming decades.
Thus, in 2013, The California State Water Resources Control Board: SWBs targeted the provision
of reclaimed water and the establishment of IPR/DPR facilities.
⚫ Provide reclaimed water as much as possible by 2030.
⚫ Increase reclaimed water supply from 2002 level. At least 1 million AFY (3.3 million m3 per day)
by 2020 and at least 2 million AFY (6.6 million m3 per day) by 2030.
Table 12 Reclaimed water-related policies and regulations in California.32
1906 CDPH recommended use of septic tank effluents for irrigation purposes.
1907 CDPH recommended not using septic tank effluents for fresh food irrigation.
1918 Enforcement of the Primary Regulation (for irrigation of crops). The use of untreated
sewage and septic tank effluent is prohibited in the irrigation of fresh food.
1933 Additional requirements for cross-connection control and disinfection reliability.
1967 Congress enacted reclaimed water policy (included in the California Water Supply Act).
Develop regulations for the quality of non-potable reclaimed water.
1968 Enhanced standards for irrigation. Added landscape irrigation and reservoir requirements.
1975 Added requirements for treatment reliability.
1978 Enhanced standards for open-access landscape irrigation. Added requirements for general
groundwater supplies.
2000 Changed quality criteria for treatment. Added application and the area required (previously
used as a guideline).
2014 Groundwater Augmentation Regulation (GWA Law) approved.
Requirements for indirect potable reuse (IPR) by supply to groundwater have been added.
2016 Surface Water Augmentation Regulation (SWA Law) approved.
32 Added to SWB (2016) "Evaluation of the Feasibility of Developing Uniform Water Recycling Criteria for Direct Potable Reuse"

- 28 -
1.2.3 IPR regulations
(1) Environmental buffer
A key element of the IPR system is its reliance on environmental buffers. California regulatory on
this environmental buffer are given in Table 13.
Table 13 Regulation of Environmental Buffers in California33
Surface water
system
A review of a panel of experts from the State Water Board uses the reservoir
dilution criterion (100:1 or 10:1+ treatment) as the reservoir performance
criterion and the theoretical storage time as the storage volume operational
criterion as the draft criteria for IPR using surface water increase. These two
criteria define how reservoirs are operationalized for increasing surface
waters.
Underground water
system
California regulations for groundwater replacement projects define the
functions of soil aquifer treatment (SAT) in the unsaturated zone (between
surface and confined aquifer) of groundwater systems.
(2) Pathogens and chemicals
Public health protection requires the removal of microbial pathogens and chemicals in wastewater
to a practical extent prior to their release into the environment or other uses (non-potable, drinking,
etc.). In the United States, these standards for drinking levels are known as "maximal contamination
levels" (MCLs) for chemicals and "log10 reductions" (LRV-value) for pathogenic microorganisms. The
LRV values in California are shown in the table below.
33 SWB(2016) "Evaluation of the Feasibility of Developing Uniform Water Recycling Criteria for Direct Potable Reuse"

- 29 -
Table 14 LRV values in California34
1.2.4 Policy on Direct Potable Reuse (DPR).
In addition to indirect potable reuse (IPR) through the preceding period, policies on direct potable
reuse (DPR) have also evolved. In 2023, Raw Water Augmentation Regulation (RWA Law) was
planned to be approved, and the publication of various reports, such as Table 15, and revision of the
SWA Law (AB574) are being conducted. Among them, the gist is explained on AB574 with many
mentions on direct potable reuse (DPR) and the report Investigation on the Feasibility of Developing
Uniform Water Recycling Criteria for Direct Potable Reuse published in 2016 and the report A
Proposed Framework for Regulating Direct Potable Reuse (DPR) in California published in 2018
Table 15 Revision of legislation to embody the DPR and publication of reports
August, 2016 Publication of "Expert Panel Final Report "Evaluation of the Feasibility of
Developing Uniform Water Recycling Criteria for Direct Potable reuse"
December,
2016
Publication of "Investigation on the Feasibility of Developing Uniform Water
Recycling Criteria for Direct Potable Reuse"
2017 Revision of the SWA-method (AB574).
In April 2018 Publication of "A Proposed Framework for Regulating Direct Potable Reuse
(DPR) in California"
34 SWB(2016) "Evaluation of the Feasibility of Developing Uniform Water Recycling Criteria for Direct Potable Reuse"

- 30 -
(1) Investigation on the Feasibility of Developing Uniform Water Recycling Criteria for Direct
Potable Reuse (2016)
The California Department of Water Resource Management (SWB) decided to conduct the
necessary investigations in this report, in conjunction with the development of DPR standards. The
five research topics are presented in Table 16.
In addition, a survey on water source management strategies in response to chemicals specific to
DPRs was then added. These surveys will be completed in Periods 2020-2021. The former is The
Water Research Foundation (TWRF), and the latter is NWRI, have been chosen as an institution for
managing its progress.
Table 16 Ongoing Research Project in Relation to the Development of DPR Standards
Research theme Progression
management
organization
Implementation of a QMRA to confirm pathogen elimination values and
application of the same technique to assess performance and reliability of
DPR process trains.
TWRF
Monitoring empirical data on the concentration and diversity of pathogenic
bacteria in wastewater
Investigation of the relationship between concentration of pathogenic bacteria
in wastewater and disease occurrence in communities
Identification of optimal methods for the leveling of chemical peak levels
during the final treatment process
Development of comprehensive analytical methods for unknown pollutants,
especially small molecule compounds that are difficult to detect in advanced
treatment by current monitoring methods.
Water source management strategies in response to chemical substances
specific to DPR
NWRI

- 31 -
(2) AB574 (Chapter 528, Statutes of 2017)
After the term surface water augmentation was abolished, reservoir water augmentation was defined
as the term to be included in the IPR; moreover, two forms of DPR (raw water augmentation and
treated water augmentation) were defined. This clarified the distinction between IPR and DPR and
restricted the regulations that were on surface water augmentation to IPR. Treatment processes and
uses of reclaimed water are understandably organized in A Proposed Framework.35
AB574 also requires the State Water Commission to adopt a uniform reclaimed water standard for
raw water augmentation, directly refill to intake of drinking water treatment plant, by 31 December
2023 with conditional on an extension of the deadline. This is the guideline introduction which is
targeted in this project.
35 A Proposed Framework for Regulating Direct Potable Reuse (DPR) in California (April 2018)

- 32 -
Figure 24 Treatment process and utilization of reclaimed water36
36 A Proposed Framework for Regulating Direct Potable Reuse (DPR) in California (April 2018)

- 33 -
(3) A Proposed Framework for Regulating Direct Potable Reuse (DPR) in California (2018)
This report describes the flow of regulatory and types of DPRs as described in the previous section
and summarizes the DPRs scenarios, environmental buffers, risk management approaches (pathogens
and chemicals), and items expected to be established as standards for source water replenishment (raw
water augmentation).
⚫ The scenario of DPR:
Source water replenishment (raw water augmentation) projects assumed by the California State of
Water Resource Control Board are as follows: Regulated water replacement (treated water
augmentation) is also included in the future.
➢ Filtration facilities where drinking-water treatment plants have been well documented to
comply with California surface water treatment regulations over a long period of time
➢ Reclaimed water delivered to a drinking water treatment plant by mixing with raw water.
The blended water is limited to utilities consider public health benefits.
➢ Projects do not meet the criteria for reservoir water augmentation
⚫ Environmental buffer:
DPRs must be equipped with functions that substitute environmental buffers that are distinct from
IPRs. Table 17 shows the substitute functions for groundwater and water reservoirs.
Table 17 Functions of replacing each environmental buffer37
Groundwater ✓ Period of movement of soil and groundwater aquifers for a minimum of
two months
✓ Adsorption and removal of organic compounds and pathogenic bacteria
Water reservoir ✓ Brief water treatment defects up to 24 hours
✓ Minimum 60-day hydrological retention time of the effluent
⚫ Risk management approach (pathogens, chemicals):
Potential regulations, such as Table 18, that outweigh or replace IPRs for pathogens and chemicals,
respectively, are mentioned. The following are mentioned in common: DPR peculiar index selection
and the risk, necessity of early action and the monitoring by the lack of the buffer, CCP approach, etc.
37 A Proposed Framework for Regulating Direct Potable Reuse (DPR) in California (2018)

- 34 -
Table 18 Risk Management Approaches (Pathogens & Chemicals) Required by DPR38
Pathogenic
microorganism
✓ "Escherichia coli, Giardia, Cryptosporidium" and other or alternative
microbial indicators
✓ Ability to cope with deficiencies in water treatment, such as a shorter
reaction time than IPR
✓ Use of the CCP program
✓ Use of PATTP/QMRA, etc.
Chemical
substances
✓ Adoption of techniques such as the use of surrogate indicators
✓ Water source quality over IPR
✓ DPR-specific NL
✓ Adoption of the upper day limit of the surrogate index
✓ Use of bioassays and unspecified analyses
✓ Continuous monitoring of surrogate indicators at CCP, etc.
⚫ Items expected to be included as standards for raw water augmentation:
There are 20 items for which this report is expected to be set as a standard for replenishing raw
water (raw water augmentation) in the future.
Among them, items considered to be important themes (underlined part) were summarized in Table
19. In addition to the above risk management approaches, measures to be taken in the event of
equipment failures, etc., and the system are listed in the items.
✓ Definitions ✓ Authorization body ✓ Public hearing
✓ Technical, executive, and
financial capabilities
✓ Operator certification ✓ Planning of multiple
entities for local projects
✓ solutions against
pathogenic
microorganisms
✓ Chemical Substance
Control
✓ Control of regulated
pollutants and physical
properties
✓ Monitoring of additional
chemicals and
contaminants
✓ Laboratory analysis ✓ Source Assessment and
Control
✓ Operational plan ✓ Critical control point
(CCP) approach
✓ Monitoring of
environmental buffers
✓ Report ✓ Cross connection ✓ Application of California
water supply data
✓ Corrosion control ✓ Alternative water supply
38 A Proposed Framework for Regulating Direct Potable Reuse (DPR) in California (2018)

- 35 -
Table 19 Important Themes and Details of the Establishment of DPR Standards39
Important topic Contents
Operator certification In IPR, advanced treatment plants are to be operated by trained
operators. For DPRs, California Water Environment Association and
California-Nevada American Water Works Association are jointly
developing certified programs. By the time regulations on DPRs have
been adopted, certification programs need to be available.
solutions against
pathogenic
microorganisms
LRV values above IPR may be determined. The LRV used for IPR is
also considered to be adopted in the case of DPR. The California
Department of Water Resource Management conducts two research
projects to obtain information on MRA.
Chemical Substance
Control
More than the IPR-required treatment regime (RO/AOP) (e.g., ozone-
biological activated carbon, O3-BAC) would be required.
Measures to address the increase in chemical concentrations in a short
period of time are also important, and the specification may be
developed based on the results of investigations based on the methods
of identifying unknown small molecule compounds, which are revealed
in the current investigations. Also, high-frequency monitoring may be
considered.
Monitoring of
additional chemicals
and contaminants
The California Department of Water Resource Control anticipates
broad monitoring targets for monitoring, such as small molecule
chemicals, which are of concern in DPRs, with high frequency above
IPRs.
Operational plan In DPR, submission of an institutional operation plan is expected. It is
appropriate to conduct a failure analysis (treatment failure analysis)
including equipment failure, malfunction, and human error.
Critical control point
(CCP) approach
The California Department of Water Resource Management plans to
adopt the CCP approach to the DPR. The resolution and responsiveness
required for CCP function will be defined in the future.
39 A Proposed Framework for Regulating Direct Potable Reuse (DPR) in California (2018)

- 36 -
1.3 Market Size Forecasts and Influence on the Markets of Other States in the United States
Figure 25 shows IPR/DPR operations in the United States. The project phases differ per specific,
including implementation phase, including some of the facilities, and those that are in the research
phase, such as technical evaluation, including demonstration.
Operating areas span the west coast region of California, Oregon, Washington, Arizona, Texas,
Colorado, New Mexico's Central and South inland regions, and the east coast region of Florida,
Georgia, Tennessee, North Carolina, and Virginia.
The largest number of IPRs in the U.S. are underwater recharging projects conducted by OCWD,
Orange, California. In San Diego City, the circulation to the reservoir is conceived, and the
demonstration is being carried out. There are many operations in the research stage, including those.
For DPRs, at Big Spring and Wichita Falls water treatment plants in Texas, reclaimed water is
circulated to treatment plant intakes in thousands of tons of days with limited capacity relative to water
treatment plant capacity.
Although DPR facilities in Texas have not been fully applied, they are in preparation for technical
verification and public understanding to apply DPR as an effective means of securing tap water sources
in the future.
Figure 25 IPR/DPR sites in the United States (implementation or survey phase)40
40 NWRI delivery (NWRI, 2019).

- 37 -
IPR/DPR markets are expected to grow in the future, and as shown in Figure 26, when unapproved
planning budgets from 763 operators in 17 states are aggregated, the investment is US$18 billion (~2
trillion).
Fifty-five percent of the U.S. construction costs for the reclaimed water business are expected to
be spent on drinking-water projects, with investments on the order of US$4.8 billion (¥520 billion)
being budgeted for water treatment facilities that are compatible with IPR/DPR facilities.41
California, Florida, and Texas account for 87 percent of the nation's IPR/DPR markets, with
California accounting for 48 percent.
California approved Groundwater Augmentation Regulation (GWA) in 2014 and Surface Water
Augmentation Regulation (SWA) in 2016, respectively, and IPRs are legally operationalized. In 2023,
Raw Water Augmentation Regulation (RWA) was approved, and DPR facilities are believed to be
included in the market size since 2023, but the IPR market appears to be the mainstay of the budget
for more specific projects. It also suggests that the legislative system enacted by California, a state
occupying IPR/DPR markets, techniques recognized as assistive technologies by deliberation, and
techniques reflected in the guideline are highly effective in spreading to other states.
Figure 26 State of the IPR/DPR site is planned42
41 Focus Report U.S. Municipal Water Reuse: Opportunities, Outlook, & Competitive Landscape 2017-2027 (Bluefield Research, 2017) 42 NWRI delivery (NWRI, 2019).

- 38 -
Figure 27 shows a water production-based calculation of projects with a budget plan (including
approved and unapproved cases) in three major states (California, Texas, and Florida).
The reclaimed water project includes drinking (Potable) consisting of IPR/DPR and not drinking
(Non-Potable) such as irrigation, and covers the establishment, expansion, renewal, and water
transportation (piped) of treatment facilities.
In 2020, Riverside Park reclaimed water facilities in Washington anticipate a 140,000-tons-per-day
reclaimed water transportation (plumbing) business. The occupancy rate in the three major provinces
is relatively low at 65%, but in California there is consistently more than 300,000 tons of reclaimed
water per day.
Figure 27 New IPR/DPR capacity (m3 per day) in major states (California, Texas, Florida)43
Drought occurred in California from 2011 to 17. This has raised awareness that groundwater and
surface water sources are essential to maintain for sustained growth of cities in this state, where the
population is still growing. This has driven an incremental need of potable reuse in the market.
In 2013, The California State Water Resources Control Board (SWB) announced to establish 6.6
million m3 per day capacity of IPR/DPR facilities by 203044. The IPR projects planned for each entity
43 Prepared by Focus Report U. S. Municipal Water Reuse: Opportunities, Outlook, & Competitive Landscape 2017-2027 (Bluefield Research, 2017) 44 Recycled Water Policy,
- 39 -
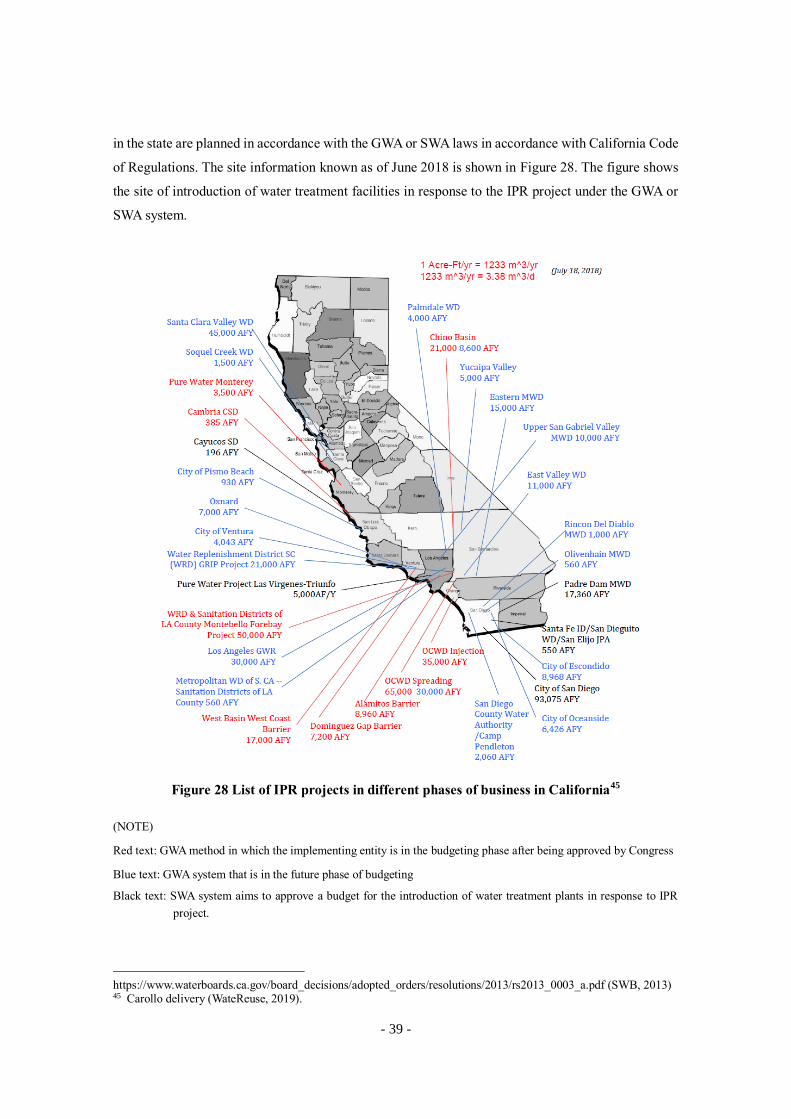
in the state are planned in accordance with the GWA or SWA laws in accordance with California Code
of Regulations. The site information known as of June 2018 is shown in Figure 28. The figure shows
the site of introduction of water treatment facilities in response to the IPR project under the GWA or
SWA system.
Figure 28 List of IPR projects in different phases of business in California45
(NOTE)
Red text: GWA method in which the implementing entity is in the budgeting phase after being approved by Congress
Blue text: GWA system that is in the future phase of budgeting
Black text: SWA system aims to approve a budget for the introduction of water treatment plants in response to IPR
project.
https://www.waterboards.ca.gov/board_decisions/adopted_orders/resolutions/2013/rs2013_0003_a.pdf (SWB, 2013) 45 Carollo delivery (WateReuse, 2019).

- 40 -
Figure 28 shows that the treatment plant size is AFY (acre-feet per year) and the units AFY can be
converted to 3.38m3/day. Table 20 summarizes the capacity at construction site of potable water reuse
treatment facilities in California based upon IPR specific budgeting as of now.
Table 20 Introduction of IPR-compliant water treatment facilities in California (m3 per day)
IPR Project and Budgeting Status
Small to medium
size
(100,000 m3/day)
Large scale
(>100,000
m3/day)
Total
GWA budgets approved 196,192 507,000 703,192
Aim to approve budgets for GWA projects 363,847 354,900 718,747
Aim to approve budgets for SWA projects 78,098 314,594 392,692
The project focused on the master plan to promote the IPR project in this survey is Pura Water Project
Las Virgenes-Triuufo.

- 41 -
2. To verify the superiority and reinforcing measures of Japanese companies
2.1 Trends in companies entering IPR/DPR business
2.1.1 EPC
Figure 29 shows a group of companies with headquarters functions in the U.S. among those who
work as EPC contractors (Engineering, Procurement, and Construction) for the water business and
IPR/DPR business. Each company group is represented on the horizontal axis as company size (sales:
Net Revenues) and on the vertical axis as occupancy of water business in the sales business
Larger groups of companies, such as Black and Veatch (BV), CDM Smith, and MWH, are actively
entering large-scale IPR projects, such as the city of Los Angeles and San Diego, and tend to design
and build more standardized water treatment systems and general-purpose technologies.
The proportion of water operations is generally low in large group of companies. Stantec acquired
MWH, Jacobs is completing CH2M acquisitions, and choosing and concentrating operations,
including water operations, inside and outside the United States. Interest in new areas of business,
such as IPR/DPR, is not necessarily high.
Figure 29 Engineering company developing water business in the United States46
46 Focus Report U.S. Municipal Water Reuse: Opportunities, Outlook, & Competitive Landscape 2017-2027 (Bluefield Research, 2017)

- 42 -
Medium-sized Carollo Engineers (Carollo) and ARCADIS, Brown and Caldwell are actively
developing through demonstration test with new technologies in the U.S. for reclaimed water business.
Table 21 shows the performance of all North American water operations and companies, including
reclaimed water (irrigation and IPR) operations, in 2017 by a representative engineering company.
Carollo has a 100% occupancy of water projects and is very active in IPR/DPR projects that are
expected to expand its markets in the future, with significant activities in research grant programs,
federal-level USEPA (United States Environmental Protection Agency, WEF (Water Environment
Federation), and WHO expert subcommittees recruited by WRF (Water Research Foundation:
American Foundation for Water Research) and WateReuse (WateReuse Association: American Society
for Reclaimed Water Research).
Table 21. Magnitude of sales of major engineering companies in the water business
Major engineering company in water business 2017 sales (million$US)
Water business/total business
ARCADIS 490 / 751
Brown and Caldwell 291 / 373
Carollo 230 / 230
Stantec 859 / 3,909
TETRA TECH 1,145 / 2,753
2.1.2 Membrane separation activated sludge process
Membrane Bioreactor (MBR) is a treatment method that combines biological wastewater
treatment and membrane treatment methods. It is regarded as a technology to be generalized in
response to future IPR/DPR. Effects of the introduction of membrane treatment technology for
reclaimed water use have been reported as follows:47
⚫ The quality of reclaimed water is stable and good, and by choosing the type of membrane
according to the purpose, turbidity and biological concentration from the filtrated water can
be suppressed, and the removal of causative substances of color and odor at the molecular
level is also possible.
47 Guidelines for Introduction of Membrane Treatment Technology to Sewerage (2nd Edition) (MLIT, 2011)

- 43 -
⚫ Total coliform, turbidity, and color are controlled at higher removal rates than or equal to
chlorination, ozone disinfection, and ultraviolet disinfection. Hence, have increased their use
value as reclaimed water because they can obtain
In the United States, the stability of treated water quality, the cost of introduction, and the cost of
operation are inexpensive. Introduction to the IPR project is also being considered, and technical
surveys are being conducted through demonstration, etc.
The California State of Water Resource Control Board (SWB) certifies 16 companies for MBR
systems or membranes for reclaimed water treatment (primarily irrigation applications) as water
treatment technologies that meet Title22. These companies have begun to supply the market.
Figure 30 shows a group of companies that possess unique MBR systems or membranes that have
received Title22 accreditation and can be offered to U.S. water markets (public wastewater and
reclaimed water fields).
⚫ GE Zenon (currently known as Suez), Asahi Kasei, Kubota, Toray, and Koch, Econity are
leading global markets, including the United States, and Japanese companies are prominent.
⚫ WasTech and Veolia are companies with historical performance in the public wastewater
sector in the United States. On the other hand, it aims to grow its performance in the MBR
field.
⚫ Although companies leading the U.S. and international water industry, such as Evoqua and
Ovivo, have not gained Title22, they have strategies to demonstrate their presence in the
MBR field.

- 44 -
Figure 30 MBR system or its membrane supplier48
2.1.3 RO membrane
The application of RO-membranes is one of the core technologies, characterized by a high
percentage of major companies (Dow Chemical, Tore, and Nitto Denko) (approximately 80% in the
top three companies). The RO membranes (elements) provided by these three companies are highly
interchangeable to the RO membrane containment pressure vessels (vessels) distributed in the market,
in analogy to the industrial standards related to shape and pressure resistance, thus forming a situation
where the RO membrane is being replaced. Among them, Japan manufacturers have a share of
approximately fifty percent.
⚫ Toray and Nitto Denko are expanding their results by focusing on large-scale projects such as
desalination of seawater using spiral polyamide composite RO membrane. The RO
membrane market of the U.S. IPR business is occupied by polyamide RO membranes.
➢ According to the results of delivery to OCWD, the largest user in the market, of RO-
membrane water treatment systems consisting of 21 units, 6 units are Dow Chemical
(started in 2015), 12 units are Nitto Denko and Hydranautics (started in 2016 or 17), and
3 units are LG Chem (started in 2018).49 OCWD systematically carries out element
replacement, demonstrating specific permeable water (elements and permeable water
48 Focus Report U.S. Municipal Water Reuse: Opportunities, Outlook, & Competitive Landscape 2017-2027 (Bluefield Research, 2017) 49 OCWD (2019)

- 45 -
per pressure) and durability from about one year prior to replacement, and performing
element selection.
➢ In the RO membrane exchange market of the IPR project, the interchangeability with
current status is important for long-lasting vessels that are durable compared to
elements, and it is essential to build relationships with users by participating in
demonstrations, etc., which are conducted according to the years of use of elements
specified by operators.
➢ Toray has received an order for UF-membranes for the largest U.S. IPR-facility (Pure
Water San Diego) planned in San Diego.50 This IPR facility relies on environmental
buffers of the reservoir in addition to engineering buffers. Toray is looking ahead to the
RO-membrane demand expected in Pure Water San Diego.
⚫ TOYOBO is a hollow-fiber membrane using cellulose triacetate, which can be washed and
sterilized with oxidizing agents such as sodium hypochlorite. Therefore, TOYOBO has
demonstrated performance in desalination of seawater to tolerate microbial-derived
contamination, has a high market share in the Middle East of Saudi Arabia.
The activities of the three Japanese affiliates in the United States are as follows, and the RO
membrane is the highest in Toray's presence.
⚫ Toray: Materials for RO membranes.
⚫ Nitto Denko: Acquired U.S. Hydranautics and developed business (1987).
⚫ TOYOBO: Focus on functional resins and cloth for car.
Table 22 Global share of RO membranes (2016)51
Manufacturer Revenue (billion JPYs) Share
Dow Chemical 402 35.3%
Toray 268 23.5%
Nitto Denko/Hydranautics 245 21.5%
Vontron 75 6.6%
TOYOBO 60 5.3%
LG Chem 24 2.1%
GE 22 1.9%
Lanxess 15 1.3%
Other 29 2.5%
50 East Repress Release (March 19, 2018). 51 The current situation and the future prospects of the aquatic resources-related market (Fuji Economics, 2017)

- 46 -
2.1.4 Disinfection technology
The California Department of Water Resource Control (SWB) certifies the following companies
as water treatment technologies for disinfection technologies that meet Title22, by ultraviolet light,
ozone, and heat disinfection.
UV-technology is mainly applied to UV-AOP treatment in the reclaimed water field, and Trojan
Technologies (currently known as Danaher), Calgon Carbon (currently known as Kuraray), and
Ozonia (currently known as Suez) are a group of companies leading the market.
Figure 31 Suppliers of disinfection (UV, ozone, heat) systems or equipment52
52 Focus Report U.S. Municipal Water Reuse: Opportunities, Outlook, & Competitive Landscape 2017-2027 (Bluefield Research, 2017)

- 47 -
2.1.5 Measurement control technology
In the measurement and control sector, Hach Company, Xylem, Endress+Hauser, Yokogawa,
Emerson Process Management is the top five companies.
Table 23 Suppliers of Control and Information Management Systems Solutions53
Operator Strengths Weakness Business opportunity RISK
Hach
Company
Have a comprehensive
portfolio that includes
equipment, software,
final products, and
services. Access to all
areas of the fishery
industry is strong.
Though it focuses on
the market of North
America and Europe,
the demand in the
same region is
maturing and
saturating.
Strong opportunities
for water reuse.
Price
competitiveness
when the
technological
field is rising.
Xylem Brand strength is strong
and has a wide range of
portfolios for products
used in the fishery
industry.
It is associated with a
high level of burden,
which may affect the
financial situation.
Focus on business
opportunities in the
growing market.
Pressure of Price
Competitiveness.
Endress +
Hauser
Global manufacturing
and marketing sites. The
portal of measurement
equipment is strong.
While focusing on
online devices, they
are weak to
experimental and
analytical
instruments.
Opportunities are
found in the
experimental and
analytical market.
Increased presence in
growing markets in
Southeast Asia,
Brazil, and India.
Variation in
exchange,
European
economies. Price
competition for
online devices.
Yokogawa It has increased its global
presence by responding
to client needs through
community-based
activities. There is a
rating on high-quality and
reliable instruments.
The presence of
portable and
laboratory devices is
not so great. Focus on
continuous
measurement
instruments.
Focus on
Opportunities in
Growing and Mature
Markets Other Than
Japan.
Economic status
of the based
regions (Asia,
Europe, North
America, and the
Middle East).
53 Global Water Analysis Instrumentation Market, Forecast to 2022 technological innovation effectively address need for Real-time Monitoring, Boosting Adoption by Industrial Sector (Frost & Sullivan, 2016)
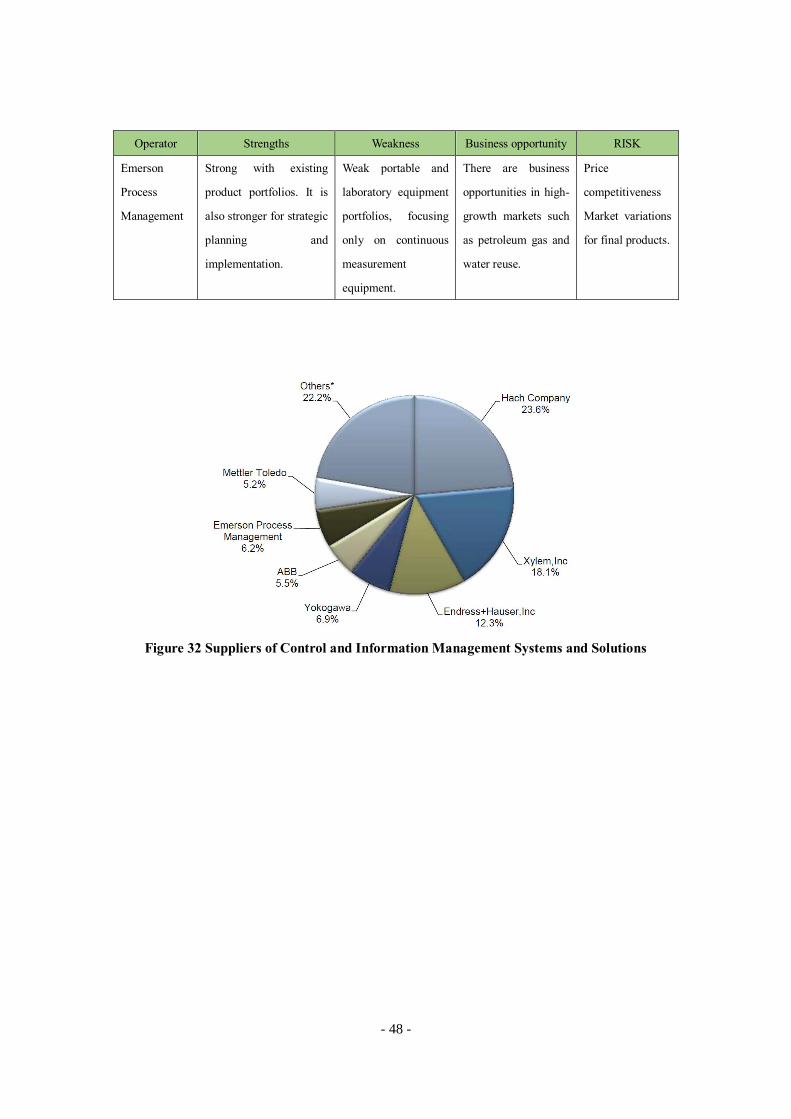
- 48 -
Operator Strengths Weakness Business opportunity RISK
Emerson
Process
Management
Strong with existing
product portfolios. It is
also stronger for strategic
planning and
implementation.
Weak portable and
laboratory equipment
portfolios, focusing
only on continuous
measurement
equipment.
There are business
opportunities in high-
growth markets such
as petroleum gas and
water reuse.
Price
competitiveness
Market variations
for final products.
Figure 32 Suppliers of Control and Information Management Systems and Solutions

- 49 -
2.2 Barriers to entry and solutions
As barriers to entry and solutions for future commercialization, the following three points are
assumed: ① application of new technology, ② adaptation to the U.S. market, and ③ financing.
2.2.1 Application of new technology
Price competition can be a major barrier to entry into the California IPR market due to the
development of pricing competition due to advanced design know-how such as commoditized
technical information and standardization based on legal systems and systematized technologies.
Proposals, technology elements, and concepts that aim to enter the market require comparative
validation with current methods and differentiation of benefits. In order to recognize the effectiveness
of a new technology component, especially if it involves a new technology component, it is a
legitimate law to undergo a scientific and objective evaluation by California.
From that viewpoint, the following points were examined as a solution in this survey. The technical
aspects were examined by the Expert Committee (NWRI is in charge of the legal system related to
IPR/DPR to be newly introduced mainly in California, and Yokogawa is in charge of related
technologies in IPR/DPR).
① Technologies for more rapid determination of the inhibition of pathogenic microorganisms in
response to membrane treatment processes essential for water treatment in IPR/DPR projects
② Digitalization to promote optimization from the viewpoint of water quality and energy
conservation by comprehensively capturing quantitative and qualitative data to be controlled
for IPR/DPR treatment process and the wastewater treatment process in the upstream process
③ Acceptability in California IPR/DPR markets and effective measures (entry barriers and
solutions) for the recognition and dissemination of these technologies, targeting the volume
reduction of enriched water discharged outside the system in RO-membrane processes.
Technical elements, survey perspectives and validation methods applied are as follows: This result
is the starting point for obtaining the evaluation of the effectiveness of the new technology for future
commercialization.

- 50 -
Table 24 Technical elements and verification details
Technical elements Survey perspective and validation methods
Rapid performance
determination of membrane
technology
[Survey perspective].
⚫ Scientific and objective feasibility for the prevention and
identification of pathogenic microorganisms
⚫ Performance assurance by monitoring water quality
⚫ Challenges of existing membrane and system performance
(e.g., robustness, redundancy, obstruction avoidance)
⚫ Effects of rapid performance assessment (optimization and
control of water quality management methods and processes
based on water quality risks)
[Validation Methods].
⚫ The University of Arizona and The University of Tokyo
evaluated the scientific validity of the proposed technology
⚫ Convocation and evaluation of expert councils are delegated
to the California State NWRI to conduct objective evaluation
in the same manner as deliberation of the California State and
other state cases.
Digitalization [Survey perspective].
⚫ Simulation
Maximizing Plant Function in Response to Priority
Purposes
⚫ Holistic optimization application
Comprehensive analysis of water quality, water volume and
water pressure measurement data and control data for
DPR/IPR processes including wastewater (primary and
secondary treatment)
⚫ Control system
Automated control systems that use IoT/OT technologies to
achieve stable water quality and energy conservation
⚫ Coordination of Simulation and Control Systems
Automated updating of the optimal model based on actual
data and automated tuning of parameters that capture the
amount of change in response to changes in urban
environmental issues that lead to variations in sewage load
⚫ Risk Assessment

- 51 -
Technical elements Survey perspective and validation methods
Risk Assessment Related to Component Devices
⚫ Fail-safe
Avoidance captured signs of abnormality. To determine the
cause of any abnormalities, and to prevent recurrence of such
abnormalities, such as the operating management manual
[Validation Methods].
⚫ Evaluation of the proposal and validity for digitalization based
on-site data from the Las Virgenes Water Supply Bureau
RO brine water solution [Survey perspective].
⚫ A Combination Study with Volume Reduction Technology for
Concentrated Water Emitted by RO Membrane Treatment
Disseminated in the United States
⚫ Optimization of technology related to the recovery of
concentrated water
[Validation Methods].
⚫ Investigate acceptability of the American Society for
Reclaimed Water (WateReuse) by verbal presentation of
technical concepts
⚫ NWRI and Carollo assess spillover in California and the
United States
2.2.2 Adaptation to the U.S. market
Since there are many suppliers in the U.S. market that can supply water treatment membranes, their
penetration into the market is based on confidence in technologies such as durability of membrane
materials and avoidance of obstruction risks. However, membrane materials and technology
improvement by each supplier have reached the maturation stage, and it becomes a situation in which
the differentiation is not easily attempted.
Moreover, in the absence of technology to rapidly measure pathogenic microorganisms, including
viruses, in membrane processing, it can be said that differentiation in terms of technology is difficult
in the United States because the performance is set uniformly according to guidelines and technical
standards.
Therefore, it will be directly linked to the differentiation of whether high-quality membrane
materials can be offered more competitively and stably to the market, and whether the membrane can
be easily and standardly incorporated into processing systems by engineering companies that are

- 52 -
influential in the U.S. market.
With regard to RO membranes incorporated in AWTF by IPR operators, since Toray's market share
is remarkable, we interviewed Toray Membrane USA, Inc. (TMUS), a U.S. corporation in Toray, in
order to explore solutions to barriers in the market.54 The outline is as follows:
⚫ Toray proposed the function of UF membrane brand Trefil™ to almost completely remove
suspended substances and pathogenic microorganisms in the pretreatment of RO membrane
brand Romembran™ for demineralization.
⚫ In addition, MBR for sewage and wastewater treatment applications is steadily receiving orders,
and it is a membrane supplier representing Japan, which provides various water treatment
membranes.
⚫ In 2018, TMUS consolidated its Anaheim and San Diego bases in California and now has a
wealth of San Diego membranes (MF, UF, RO, etc.) for its U.S. Green Innovation water
business with 120 employees. With the prospect of expanding the need for IPR and future DPR
in the United States, we have focused on the expansion of UF and RO membranes.
⚫ Current private and public supplies have similar sales ratios. Private supplies are mainly from
the semi-conductor industry, power plants and plant cooling boilers, and beverage makers,
while public supplies are mainly from the upper and lower water supply.
⚫ TMUS sales ratio is small, but as a B to C business, the brand-name CSMs infiltrate as
household water purifiers and deliver membranes to PET bottles and car washers.
⚫ Among them, TMUS has received an order for UF-film treffil™ for the largest IPR facility in
the U.S. (business name: Pure Water San Diego) planned in San Diego, California, U.S.A.55
✓ The IPR facility (which is the largest in the U.S. market in Toray, with 150,000 m3/day
of fresh water) belongs to a recyclable water recycling business that relies on
environmental buffers in reservoirs.
✓ TMUS collaborated with the Canadian engineering company H2O Innovation to test
pilots, validated better operating performance of higher flow rate and durability than
competitors’ UF membranes. The validation results contributed to the order.
✓ With the aim of controlling contaminants and pathogenic microorganisms using UF-
membranes in the pretreatment process of RO-membrane treatment in Pure Water San
Diego, plans to release the products after 2020, in accordance with the planned operation
of the facilities in 2021.
✓ The RO membrane is also incorporated in AWTF by the same Pure Water San Diego,
and TMUS aims to receive an order for the RO membrane.
54 Toray Membrane USA, Inc. (September 2019). 55 East Repress Release (March 19, 2018).

- 53 -
⚫ Polyamide RO membrane materials manufactured in Japan, South Korea, and China are
imported into the United States, and TMUS is a site for implementation of spiralizing
(commercialization as membrane elements) and marketing (including business and financial).
⚫ The reliance rate of materials on Japan is around 70-80%, and TMUS has strengthened its
function as a marketing base to Latin America and Israel, including in the United States.
⚫ TMUS's business strategies are to provide optimal membranes to meet customer needs and to
develop cooperative relationships with engineering companies that design and fabricate
membrane systems (Figure 33: Toray's main engineering company that supplies membranes).
⚫ If the water production scale is smaller than tens of thousands of m3/day, the company is
promoting it to end-users through pilot-testing demonstrations with Wigen Water Technologies,
H2O Innovation, WESTEC and, if larger, Suez and Veolia.
Figure 33 Major Engineering Companies Supplying Membranes by Toray
⚫ TMUS is a competing EVOQUA, GE Water in the UF business (currently known as Suez) and
PALL (Asahi Kasei), but has established client relationships in the RO membrane supply
business.
⚫ MBR and UF membranes for wastewater treatment are completely dependent on import for
TMUS and include UF membranes manufactured in China.
⚫ With regard to the 25% additional taxation on imported tariffs from China under the current
Trump administration, additional taxation is exempted by applications for wastewater
treatment, and TMUS is conducting and flexibly responding to the procedures to apply the
same measures.
In particular, ① collaboration with U.S. engineering companies and EPC contractors according to

- 54 -
size, ② collaboration with companies with local experience in elemental technology is considered
important.
Promote commercialization based on these local conditions (6). See "Review of business schemes
and business models".
2.2.3 Funding
In addition to the funding of IPR/DPR project itself, additional funding is required for new
technologies (holistic optimization systems, RAPID, ZLD/ZCC) to implement the project along with
advanced control. In particular, ① funding for demonstration projects and ② additional funding
through the introduction of new technologies are important.
Specifically, See 5. Examining and Proposing Finance to Promote Projects Within California.

- 55 -
2.3 Examination of technologies that constitute a general-purpose business model and verification
of their supportiveness.
2.3.1 Technological Elements Exploiting the Current Status and Strengths of Membrane Processing
The following are the strengths of membrane processing.
⚫ Pore sizes can be maintained in microfiltration (MF) and ultrafiltration (UF) membranes by
appropriate operational control of treatment systems designed to account for their specific pore
sizes, and water quality can be controlled with respect to suspended substances and
microorganisms in water.
⚫ For reverse osmosis (RO) membranes, the study of water quality control extends to molecular
and ionic substances in water.
⚫ Water treatment processes that utilize membrane control properties derived from different pore
sizes and combine MF or UF membranes as essential pre-treatments for demineralization
processes by RO membranes have been applied to advanced water treatment plants (AWTF)
and seawater desalination involved in common reclaimed water.
⚫ It has been recognized that the mechanism of separating microparticles by MF film and UF
film with submicron order pore size is systematized as a mathematical model and can be
approximated to the mechanism of removing protozoa with micro order particle size.
⚫ Therefore, a treatment system incorporating MF or UF membranes can calculate the removal
performance of protozoa by the system by rapidly grasping the mechanical performance and
physicochemical performance during water treatment operations.
Membrane Filtration Guidance Manual, published by USEPA in 2005, recognizes MF and UF
membranes as useful tools for reliable removal of pathogenic microorganisms, and identifies protozoa
removal rate credits in water (common logarithm of water supply concentration divided by filtered
water concentration: Log Removal Value (LRV)) that can be achieved if treatment systems
incorporating MF or UF membranes are properly operationalized.56 In LRV, the following points can
be pointed out:
⚫ The following can be pointed out in order to guarantee LRV in the water treatment using MF
and UF membranes.
➢ For each membrane-incorporated treatment system, the operational pressure and turbidity
water quality of both supplied and treated water at operation are measured on-line to grasp
56 Membrane Filtration Guidance Manual (USEPA, 2005).

- 56 -
operational indicators.
➢ It is required to perform daily pressure attenuation tests to grasp the soundness of
membrane materials and to implement operational management based on signal values.
➢ Pressure attenuation tests are also called PDT tests (Pressure Decay Test) that directly
detect membrane breaks, which are performed by multiplying a given air pressure from
the feeding side of the water-withdrawn membrane and confirming the presence or
absence of membrane breaks because of the degree of pressure reduction after a given
time-lapse.57
➢ When the MF and UF membranes are physically broken, PDT study is recognized as an
effective detection technique because pressure reduction is markedly enhanced by
stimulation of air bubble membrane permeation.
➢ The California Department of Public Health (CDPH) certifies protozoan
(Cryptosporidium and Giardia) LRVs with MF and UF membranes as 4-log (4LRV) on
the premise that they monitor and control operational pressures by on-line measurement
and turbidimetric water quality, performs daily membrane pressure-attenuation studies to
retain above predetermined pressures.
➢ In the processing system in which MF film and UF film are incorporated, in order to
rapidly calculate protozoan LRV, the system which detects the above signal is mounted,
and it is made to be a standard to reflect in the operation management.
➢ On the other hand, viruses can be removed by UF membranes, but no means exist to
confirm their removal performance online or on daily basis, and UF membranes are
considered unable to clear the virus.
➢ Thus, viral control in water by the MF or UF membranes that integrate into AWTF is
designed AWTF without considering the strengths of the native membrane or the evolving
functions.
⚫ To ensure LRV in water treatment using RO membranes, the following can be pointed out:
➢ RO film has much smaller pore size than MF film and UF film (see Figure 34) as sub-
nanometers (angstrom).
➢ The pore size of RO membranes is markedly smaller compared to the particle size of
protozoa and E. coli in water and the size of the virus, but the pore size of RO membranes
at the water molecule level does not allow PDT studies depending on the permeation of
air bubbles to be performed.
57 Guideline for introduction of advanced reclaimed water system using UF membrane filtration and ultraviolet disinfection (National Institute of Land Technology Policy, Ministry of Land, Transport, Japan, 2018).

- 57 -
Figure 34 Pore sizes of MFs, UFs, and RO-membranes (cited from USEPA)58
➢ The performance of RO-membranes has been confirmed to be more than 6LRV from
3LRV in experimental validation using monitoring viruses. 59 In the experimental
verification, in order to quantitatively evaluate the virus removal rate, it was investigated
by administering the high concentration indicator virus, or it was evaluated using the dye
paint which seemed to be the virus.
➢ However, there is no method to detect the removal performance of the virus in the actual
processing system in which the RO membrane is incorporated, while the existence of the
break of the RO membrane is judged. Moreover, it is not acceptable to administer the
indicator virus to establish the implementation.
➢ In implementation, chemical indicators such as total organic carbon (TOC) and electrical
conductivity (EC) of RO membrane supplied water and treated water are monitored as
surrogate indicators of microbial water quality to provide viral LRV from their respective
removal rates by RO membranes.
➢ In an experimental validation using RO membranes, the viral elimination rate investigated
by an experimental series in which the indicator virus was intentionally administered
showed a 4.3-LRV, with the same RO membrane reported to remain at 1. 6LRV for the
EC elimination rate and at 1.7-LRV for the TOC elimination rate.60
➢ Similar demonstrations have been made by IPR operators during the planning phase, but
overall, water quality assessments relying on alternative indicators of EC or TOC have
been conducted by a method that rapidly detects virus removal rates in water treatment
systems incorporating RO membranes, and water viral control of RO membranes
incorporated into AWTF has been designed under-estimated.
➢ The LRV-credits for RO-membranes set by IPR-operators in designing AWTF are shown
in Table 25.
58 Membrane Filtration Guidance Manual (USEPA, 2005) 59 Potable Reuse, Guidance for Producing Safe Drinking-Water (WHO, 2017) 60 High Purity Water Project – Direct Potable Reuse Demonstration (Clean Water Services, 2014)

- 58 -
Table 25 LRV credits for RO membranes61
IPR-operator (Project)
Viral LRV
(LRV for Cryptosporidium
and Giardia is viral)
Surrogate Indicators
Required for
Monitoring
Water Replenishment District of Southern
California (Gap Barrier Project) 1.5 TOC
Cambria Community Services District (Los
Angeles Bureau of Sanitation Dominguez
Gap Barrier Project)
1.0 EC
Orange County Water District (Groundwater
Replenishment System Mid-Basin Project) 2.0 EC and TOC
61 Expert Panel Final Report: Evaluation of the Feasibility of Developing Uniform Water Recycling Criteria for Direct Potable Reuse (National Water Research Institute, 2016)
- 59 -
2.3.2 Suggestions for the promotion of digitalization
The development of digital technology such as IoT/AI is remarkable, and many organizations and
companies are considering promoting digitalization (Digitalization: digital technology use for
multifaceted work).
However, digitalization has provided value to companies and end users, and it is considered that the
current situation is not being realized, as it remains a superficial debate on what the work in front of
the eye can be innovative. It is necessary to propose specific creations through digitalization with
defined value so that the promotion of digitalization is not a purpose.
As a proposal for digitalization, we investigated the applicability of DDMO (Data Driven Modeling
for Optimization) which can automatically create a facility model from the operation performance data
of the plant developed by Yokogawa. At the beginning of this investigation, we understood the actual
state of operation in public facilities, including IPRs and DWTF and WWTF, discussed with OCWD
about the appeal for digitalization, obtained the results of hearings described below,62 and reflected
them in the investigation policy.
⚫ Generally, unique optimizations are under way for certain typical utilities, such as OCWD,
and it is likely that high-energy efficiencies are being realized by personnel managed with
standardized operating procedures and by unique criteria-based targets, if they are large and
long-run, as is the case with OCWD IPR facilities.
⚫ For example, OCWD has introduced the following facilities and measures to improve
energy-efficiency.
✓ Energy recovery equipment of the RO plant
✓ Interfering aquarium for equalization of water supply so that plant operation can be
performed with high energy efficiency and stable flow rate
✓ Supply and demand power in agreement with local power suppliers leading to reduced
energetic costs for OCWD
62 Hearing from OCWD (September 2019)

- 60 -
⚫ In order to disseminate DDMO to large-scale facilities and highly managed water operators,
it is therefore required to analyze detailed information on water treatment operations through
the collection of long-term data and to develop suggestions prioritized by operators in order
to accurately explain how to save business costs.
⚫ To improve operating efficiencies and costs for certain facilities, methods of using artificial
intelligence (AI) need to be defined, but smaller water operators are more likely to require
AI services such as DDMO compared to larger ones.
⚫ On the other hand, suggestions are needed to appeal to inherent issues based on small
institution-by-center analyses.
In this survey, the water quality monitoring required from the present state of the membrane
treatment operated by OCWD was clarified in the promotion of digitalization to IPR/DPR facilities.
We also tested the efficacies of digitalization using DDMO in Tapia Water Reclamation Facility
operating at a small-to-medium size (process water volume of 36,000 m3 daily) run by the Las Virgenes
Municipal Water District in California and proposed techniques for optimization.
In addition, management of the treatment performance for the optimization of the water treatment
system and the method which ensures the water quality were proposed as a part of the digitalization.

- 61 -
2.3.2.1 Survey of current status of membrane treatment (IPR-facilities in OCWD)
IPR facilities operated by Orange County Water District (OCWD) are releasing secondary treatment
wastewater supplied by the Orange County Sanitation District (OCSD) for reclamation of reclaimed
water generated by AWTF into the Orange County groundwater aquifer (the IPR facility is designated
Groundwater Replenish System: GWRS for OCWD).
The following will be reported based on OCWD interviews and relevant documents provided during
September to December 2019.
GWRS operates a 100-MGD (~380,000 m3 daily) water-building AWTF (see Figure 35) with a
mean annual operating rate of 96.6%.
Figure 35 AWTF constituting GWRS operated by OCWD63
AWTF consists of water treatment systems that use MF-membranes, RO-membranes, and UV-AOP
as the main mechanical treatment processes to achieve stable detoxification of water quality (risk-
reducing for chronic toxicities derived from chemicals with human effects, such as acute toxicity and
carcinogenesis derived from pathogenic microorganisms).
OCWD has established predetermined sampling sites (see Figure 35) for understanding water
63 Groundwater Replenishment System 2018 Annual Report (OCWD, 2019)

- 62 -
quality and optimizing operational control to quantify properties (water quality, water volume). Table
26 describes the sampling sites and describes the characteristics and objectives of each.
Table 26 Sampling symbols and explanations for AWTF water quality surveys
Sampling points (Sign) Descriptions (Supplementary Explanation)
Q1 AWTF influent (OCSD wastewater treatment water, AWTF inflow
water)
MFF MF feed (MF-membrane-fed water)
MFE MF effluent (MF-membrane-filtered water)
ROF RO feed (RO-membrane-fed water)
ROP RO effluent (RO-membrane permeabilized water)
UVF UV-AOP process feed (UV-AOP feeding water)
UVP UV/AOP process product (UV-AOP treated water)
FPW Finish product water (AWTF treated water)
Q1:
For AWTF water supply, it is a critical control point (Critical Control Point: CCP) established prior
to the screening (Filter Screens) that eliminates contaminants that serve as substantial origins in the
treatment processes within AWTF in order to identify the amount and nature of water entering from
OCSD wastewater treatment facilities (such as NDMA and 1, 4 Dioxane as indicators of trace
chemicals with chronic carcinogenic risks in addition to suspended substances and turbidity).
MFF:
For MF membrane water, Filter Screens filtrated water is supplied to the MF membrane after
disinfection with sodium hypochlorite to suppress the activity of microorganisms and to prevent
lightening (biofilm) formed in pipes and downstream facilities. This is a CCP that grasps water quality
(turbidity, residual bound chlorine concentration), water supply to the MF membrane, and water
pressure.
MFE:
For MF membrane filtrated water, it is a CCP to grasp the water volume filtered, water quality

- 63 -
(turbidity) and water pressure (difference from MFF in operation of membrane filtration to the
intermembrane pressure, and pressurized air pressure and pressure attenuation value in PDT test).
ROF:
For the RO membrane supply water, sulfuric acid is injected in order to suppress the mineral
derivation fouling of RO membrane, and dispersant (scale inhibitor) which suppresses the formation
of the particle which causes the RO membrane obstruction is also injected, and it is a CCP which
grasps water quality (pH) which reflects these, water quantity supplied to RO membrane, water
pressure.
ROP:
For RO membrane permeabilized water, it is a CCP to grasp water quantity (equivalent to produced
water subtracted from RO membrane concentrated water excluded by RO membrane from ROF),
water quality (EC and TOC), and water pressure (intermembrane pressure, which can be calculated by
the difference from ROF during membrane filtration operation).
UVF:
For UV-AOP supplies, it has been established after adding hydrogen peroxide to ROPs to result in
a pro-oxidative treatment (Advanced Oxidation Process: AOP) that generates hydroxyl radical
reactions in UV-AOP to oxidize organic matter in water by ultraviolet light (Ultraviolet: UV).
These are CCPs that grasp the amount of water supplied to UV-AOP and the quality of water (e.g.,
NDMA, 1, 4 Dioxane).
UVP:
It is a CCP that grasps the quantity and quality of water (NDMA, 1, 4 Dioxane, etc.) for UV-AOP
treated water. Regarding water quality, the status of detoxification is compared with Q1 and UVF
above, and the abovementioned microchemical and other organic matter removal rates are quantified.
FPW:
For UV-AOP treated water, detoxification of related facilities and geologies (mainly RO-membrane
permeable water is highly erosive water quality due to low dissolved substances and low pH, and
hardness and pH adjustments using calcareous water) is carried out prior to recharge to the Orange
County groundwater aquifer as reclaimed water produced by AWTF. This is a CCP to grasp water
quality and water quantity.
The 2018 water quality data and water quality tolerance values (Permit Limit) obtained by OCWD

- 64 -
at the CCPs are shown in Table 27. Two of the annotation numbers in the table show performance
values from water quality measurements by online sensors, and online measurements are used for
EC, turbidity, and pH. Other water quality items are performed manually on a monthly or quarterly
basis (the annual mean concentration of TOC employs manually collected and analyzed values.
Online TOC measurement is used to measure TOC for the purpose of acquiring LRV credits as a
performance assurance for virus removal by RO membranes, as described below).

- 65 -
Table 27 Water Quality Average Values of 2018 at CCPs in AWTF64
64 Groundwater Replenishment System 2018 Annual Report (OCWD, 2019)

- 66 -
In order to stabilize water quality by AWTF and to maintain mechanical stability of facilities, water
quality and water pressure information and technical requirements managed in CCPs are given in Table
28.
Table 28 Signals and Technological Requirements Grasped in CCPs by Online Sensors65
Sampling points (Sign) ⚫ Descriptions/Target Operation Range (Supplementary description
of technical requirements)
MFF ⚫ Combined Chlorine Residual/3 to 5mg/L (with residual bound
chlorine concentrations ranging from 3 to 5mg/L)
⚫ Turbidity/less than 5 NTU optimum, 5 to 20 NTU for MF warranty,
more than 20 NTU for no more than 4 hours, 20 to 50 NTU at all
time (assuming suboptimal turbidity 5 NTU, warning signaling to
the MF membrane system at 5-20 NTU, cessation of operation of
the MF membrane if 20 NTU for more than 4 hours, and no
detection of 20-50 NTU)
⚫ Differential values from Feed Pressure/MFE are monitored
MFE ⚫ Turbidity/ less than 0. 15 NTU optimum, more than 0. 20 NTU for
no more than 4 hours, less than 0.5 NTU at all times (turbidity ≦
0.15 NTU optimal, 0.20 NTU stopped at >4 hours, and >0.50 NTU
stopped when detected as instantaneous values)
⚫ Effluent Pressure / Calculate transmembrane pressure: TMP from
Feed Pressure & Effluent Pressure. TMP should be ranged from 3.0
to 12. 5psi, and TMP per minute should be less than 0.5 psi/minute
at all times (intermembrane pressure, which is the difference
between MFF and MFE, ranges from 3 to 12.5psi, and the rate of
increase in intermembrane pressure is always ≦0.5psi/min when
driving the MF membrane, and the operation of the MF membrane
is stopped when deviating)
ROF ⚫ Combined Chlorine Residual / less than 5 mg/L
ROP ⚫ Turbidity / less than 0.15 mg/L
⚫ EC / less than 6 mS/m
⚫ TOC / less than 0.1 mg/L
UV-AOP (UVF & UVP) ⚫ UV Transmittance / 95 % minimum at 254 nanometers
⚫ Electrical Energy Dose / 0.23 kWh/kgal minimum
65 Adding Supplementary Information by Hearing Survey Based on Groundwater Replenishment System 2018 Annual Report (OCWD, 2019)

- 67 -
⚫ Average UV power per train / 74 kW minimum
⚫ Calculated UV Dose per train / 111 mJ/cm2minimum
FPW ⚫ pH / less than 9
In AWTF 2018 actual data, the respective water treatment systems using MF membranes (MFF and
MFE), RO membranes (ROF and ROP), and UV-AOP (UVF and UVP) all meet technical requirements.
The following describes the main control items to properly operate and maintain each system in a
proper state, and the concept of LRV credits for pathogenic microorganisms (viruses, cryptosporidium,
and giardia) acquired by satisfying them.
[MF membrane system].
The MF membrane system consists of 36 units that apply the immersion-type MF membrane shown
in Figure 36, and the current MF membrane is made of polypropylene (PP) provided by Evoqua, which
was established in 2014.
As the MF membrane is undergoing change, OCWD has demonstrated the selection of an exchange
membrane, evaluated the robustness of the membrane material and the high permeability rate (the
amount of water permeable per intermembrane pressure difference), and continues to operate by
applying the polyvinylidene fluoride (PVDF) product provided by Scinior to a single unit.
In order to prevent the occlusion of microbial-derived MF membranes (biofouling), the infusion
rate of sodium hypochlorite has tended to increase in order to maintain the predetermined residual
bound chloride concentration. Moreover, OCWD has been able to manage the easier bound chloride
concentration by setting up on-line ammonia measurement since 2017.
A daily PDT test of MF membranes has been conducted in all units to determine the presence or
absence of abnormalities, such as membrane breakage, to determine the integrity of the membranes,
and calculate the LRV conversion values for protozoa (Cryptosporidium and Giardia) based on the
measurement results and standard methods66 to obtain Figure 37.67
OCWD has determined that the protozoan LRV equivalent by the MF membrane system is a mean
of 4.5 (nadir 4.2); however, if the LRV equivalent is below 4.0 in the PDT-test, it has taken a policy
that the target unit should not be operated.
OCWD monitors pressure attenuation values in a unit-by-unit PDT test, and for units with a pressure
attenuation value of more than 0.25psi per minute as the critical value, it is decided to investigate the
integrity of the membrane suspecting an abnormality of the MF membrane modules in the unit.
On the other hand, for MF membranes, OCWD assesses the integrity of the membranes that can be
monitored by PDT-testing to determine the size of a given membrane pore and the absence of fracture,
66 Standard Practice for Integrity Testing of Water Filtration Membrane System (ASTM D6908-06) (ASTM, 2017) 67 Groundwater Replenishment System 2018 Annual Report (OCWD, 2019)

- 68 -
and its effects are limited to eliminating protozoa (Cryptosporidium and Giardia) with particle sizes
larger than the membrane pore size.
The MF membrane system is not provided with LRV credits involved in virus removal because the
PDT test fails to monitor the inhibition of viruses smaller than the membrane pore size.
Figure 36 MF membrane (immersion type) system responsible for solid-liquid separation

- 69 -
Figure 37. Protozoal LRV conversion values for MF membranes based on actual data from the
PDT study.
[RO membrane system].
From mid-2015 to the end of 2018, RO membranes intermittently operate at an pH6. 9 of ROF
(RO membrane-fed water) and the flow rate ratio of ROP to that of ROF (recovery rate of RO
membrane-permeabilized water) at 85%.
The RO membrane system supplies ROF that have previously passed a security filter (Cartridge
Filter) with a pore size of 10 μ. OCWD performs soak washing with sodium hypochlorite every 2 h
to 15 h while monitoring the differential pressure between the filters to prevent obstruction due to
microbial contamination of Cartridge Filter.
The RO membrane contains a flat-walled polyamide RO membrane in a pressure vessel as shown
in Figure 38 in a spiral form. The RO membrane system consists of 21 units, and ROF is supplied by
one pressure booster pump for every 3 units (total 7 units).
The company supplies RO membranes to three units by LG Chem (started use in 2018), to 12
units by Nitto Denko (started use in 2016 or 17), and to six units by Dow (started use in 2015).
OCWD has implemented TOC measurement in the RO membrane system for the acquisition of
LRV credits as a performance assurance related to viral elimination by RO membranes, and has two
online TOC meters in the common plumbing of ROF supplied to all units.
Since continuity and redundancy are required for TOC measurement for ROF, one of the other

- 70 -
units is used for preliminary measurement, and measurement for ROP is performed with the same
idea as for ROF. Online TOC meters have been introduced for preliminary measurement since April
2018, and the operation has been started.
LRV-equivalent values of viral elimination rates calculated from observed TOC concentrations
and TOC elimination rates for ROF and ROP in 2018 are shown in Figure 39 (2018 performance
values for TOC elimination rates are mean 2. 3-log, max 2. 8-log, min 2. 0-log). OCWD are
controlling these actual values as the largest, smallest and mean daily, and report LRVs to DDWs
(Division of Drinking Water in The California State Water Resource Control Board) monthly.
By conducting the above-mentioned controls, DDW have approved LRV credits 2 for viruses and
protozoa (Cryptosporidium and Giardia) against RO membrane systems in OCWD (LRV met 2
based on actual data in 2018).

- 71 -
Figure 38 RO membrane system responsible for desalting
Figure 39 Viral LRV credits for RO membranes based on actual data1

- 72 -
[UV-AOP systems].
OCWD operates 13 UV-irradiation systems as UV-AOP systems (see Figure 40). UV light sources
are thoroughly maintained in accordance with the upper 12,000-hour ramp life limit specified by the
DDWs.
In order to maintain the irradiation intensity, the UV irradiation equipment has been regarded as
the main causes of intensity reduction, including blackouts, irradiation intensity failure, failure of
stabilizer (ballast) which is an electronic component to keep the current constant and eliminate the
flicker of the discharge lamp in order to maintain the irradiation intensity, and it has been regarded as
the emphasis items for maintenance inspection.
In UV radiation facilities, on-line UV transmission and power output measurements are performed,
and UV ramps on a series basis ensure a power output of 74 kW or more and a UV ramp consumed
electrical output (Electrical Energy Dose: EED) of 0.23 kWh/kgal (0.06 OOBm3) or more per unit
water volume to maintain a UV transmission rate of 95% or more. In 2018 performance, the EED
has been maintained ranging from 0.25 to 0.29 kWh/kgal, meeting the required EED of 0.23
kWh/kgal.
OCWD reports the actual measured data quarterly to DDW that OCWD's UV-AOP systems have
acquired viral and protozoal (Cryptosporidium and Giardia) LRV credits of 6 by controlling the
measured values above (see Figure 41).
In addition to the respective systems using MF membrane, RO membrane, and UV-AOP that
constitute AWTF, OCWD has implemented soil adsorption treatment and groundwater recharge
using FPW. 4 LRV credit of viral removal is recognized by monitoring the water quality in the
operation and observation well of the soil adsorption treatment based on the guidance (information is
omitted from this report).
In response to Title22 requirement, the 2018 LRV equivalent by GWRS operated by OCWD
results in Table 29, and the behavior of the LRV equivalent based on the measured removal of
viruses and protozoa (Cryptosporidium and Giardia) per year is shown in Figure 42.

- 73 -
Figure 40 UV-AOP systems responsible for oxidative treatment
Figure 41 Viral LRV credits for UV-AOP based on actual data

- 74 -
Table 29 LRV claimed by OCWD-GWRS and LRV achieved in 201868
Pathogen Minimum Log Reduction
Requirements69
Minimum Daily Total Pathogen
Log Reduction Values Achieved
Viruses 12 12
Cryptosporidium oocysts 10 12.4
Giardia cysts 10 12.4
Figure 42 LRV-equivalent derived from water quality monitoring results by OCWD70
68 Groundwater Replenishment System 2018 Annual Report (OCWD, 2019) 69 Title 22 Water Recycling Criteria (California Code of Regulations, 2014) 70 Groundwater Replenishment System 2018 Annual Report (OCWD, 2019)

- 75 -
2.3.2.2 Simulation results
In this study, the following two water service departments (Water District) in California were
surveyed and proposed in terms of the promotion of digitalization (see Table 30).
Table 30 Water Bureau considering digitalization
No. County Water Bureau
1 Los Angeles County
Las Virgenes Water Service, LVMWD (Las Virgenes Municipal
Water District)
2 Orange County
Orange County Water Service, OCWD (Orange County Water
District)
The surveyed facilities included two sites, the Tapia Water Reclamation Facility in LVMWD, and
AWTF of drinking facilities, a GWRS (Groundwater Replenishment System) operated by OCWD.
Figure 43 and Figure 44 show the respective capacity and outline processing flows.
Figure 43 Schematic flow of LVMWD Tapia Water Reclamation Facility71
71 LVMWD (2019)

- 76 -
Figure 44 AWTF schematic flow in OCWD72
Tapia Water Reclamation Facility in LVMWD is a medium-sized treatment plant with 8MGD daily
treated water (approximately 30,000 m3 daily). On the other hand, AWTF of OCWD is 100MGD
(about 378,000 m3 per day), and GWRS is the largest IPR-facility worldwide as an IPR-facility for
groundwater recharge. It will be further extended to 130 MGDs (approximately 500,000 m3 daily) by
2023.
The content grasped in LVMWD and OCWD is described below.
⚫ LVMWD survey content73
✓ Application of digitally applied technology by AI and IoT to plants will be important in the
future.
✓ In response to energy conservation, measures on the equipment side, such as the adoption of
high-efficiency blowers, are being promoted, but there is great interest in the realization of
energy conservation through the application of digital technology on the operational side.
✓ Existing supervisory control systems have already passed through about two decades since
their introduction. In order to improve the overall efficiency of operation by the system, the
timing is very good when considering what kind of efforts should be carried out in the future,
such as the application of digital technology.
72 Framework for Direct Potable Reuse (WateReuse, American Water Works Association, Water Environment Federation, NWRI, 2015) 73 LVMWD (2019)

- 77 -
It was confirmed that there is great expectation on the application of digital technology from the
front. The operating room is located where the entire facility can be viewed down, and the air status
in the reactor in the field can be visualized. It is an excellent operational management structure.
Normal operating management is routinely performed by one or two operators in a central
management room. The entire plant is monitored by multiple PC screens and large multi-screens,
and the operation is performed using DO values and set points of key management items as needed.
⚫ OCWD survey content74
✓ OCSD (Orange County Sanitation District) which supplies secondary treatment wastewater
to OCWD is completely separated from OCWD.
✓ These facilities are large-scale treatment facilities with state-of-the-art MF membrane water
treatment systems, RO membrane water treatment systems, and UV-AOP treatment systems
for drinking secondary treatment water supplied by upstream WWTF. Details are described
in 2.3.3.1 Survey of the Current Status of Membrane Treatment (IPR Facilities in OCWD).
✓ For water quality items such as ammonia and chemicals, monitoring and data management
are conducted on the supply and treatment sides of each water treatment system.
✓ OCWD considers it critical to verify whether pathogenic microorganisms are being removed
from drinking facilities consisting of MF-membrane water treatment systems, RO-
membrane water treatment systems, UV-AOP treatment systems, etc. and to monitor water
quality data in each system and prioritize the performance assessment of these systems.
✓ The operating rooms were arranged with multiple PCs for operating operations and data
management, followed by a large multi-screen, allowing the overall operation of the
equipment and the behavior of the primary data to be checked at a glance.
✓ As with LVMWD, one or two operators are in a central management room to monitor the
operation of the entire plant using operating PCs and large screens.
✓ Driving is performed using pH values and set points of key control items as needed. Key
operating control data for WWTF managed by OCSD can also be monitored in accordance
with the processing flow.
✓ With regard to operation management, experienced operators are performing proper
operation at all times, and at present, they do not consider the application of digital
application technology by AI and IoT to the processing system.
✓ RO membrane and UV-AOP treatment systems consume power. Hence, energy conservation
should be necessary in future.
Through interviews with OCWD, it was not possible to obtain positive opinions or requests for
74 OCWD (2019)

- 78 -
the applications or introduction of digital technologies. As a reason, for the application of state-
of-the-art technologies such as digital applications, it is believed that it is crucial to first evaluate
them in compact treatment facilities with some scale and function as technology verification prior
to their application in large-scale facilities such as OCWD.
⚫ Selection of facilities to be simulated
In the survey, two sets of treatment facilities were taken up as candidates, and the simulated object
was made to be Tapia Water Reclamation Facility in LVMWD due to the following reasons:
✓ Water reclamation facilities aimed at reusing sewage-treated water for irrigation are
expected to introduce IPR and DPR facilities in the future.
✓ The current throughput is 30,000 m3/day, which applies to the medium-sized range (less than
100,000 m3/day) suitable for functional verification.
✓ The application of digital technology such as AI and IoT is positively applied.
✓ The majority of operations planned for IPR/DPR in the United States are in medium-sized
treatment facilities, which provide great reference for the results of practical evaluations.

- 79 -
⚫ Study of the model application
In Tapia Water Reclamation Facility, the digital technology which evaluates the energy conservation
effect is organized. In order to assess the energy conservation effect, the plant operation is modeled
and optimized. Here, the three commonly used modeling techniques for plant modeling are
characterized below and illustrated in Figure 45.
i. Physical modeling
It is a mechanism-based modeling technique of processes according to physical and
chemical laws. There are advantages such as that the phenomenon of the plant can be
understood based on the principle, that the estimation accuracy is high even outside the normal
operating range, and that the model can be reused. In the meantime, there are disadvantages
such as that the phenomenon which has not been elucidated cannot be modeled, that it takes
time to build the model, and that it takes time to tune the model.75 Applications of physical
models include plant simulators. In WWTF, activated sludge models (ASMs), a
physicochemical model, are commonly used, particularly for designing and operating control
plants.
ii. Statistical modeling
It is a modeling technique based on the operating data of the plant. There are advantages
such as that the mathematical model can be constructed easily from the operation data in the
past, and that the plant phenomenon can be understood intuitively by the explanatory factor,
etc. On the other hand, there are disadvantages such as no physical or chemical basis in the
model equation, low estimation accuracy outside the scope of operational data, and the need
for operational data to explain the phenomenon75. Applications of statistical models include
estimation and prediction.
iii. AI/Machine Learning
It is a modeling technique based on the operating data of the plant. There are advantages
such as being able to correspond to the condition which can not be formulated and rule by
learning from the data, and being able to judge and predict the precision quickly in the well-
learned model, etc. On the other hand, there are disadvantages such as the necessity of a large
amount of well-established data to learn well, the fact that it is not known if the accuracy is
obtained by using it, and the difficulty of locating the cause when the accuracy deteriorates
75 Yokogawa Technical Report English Edition Vol.56 No.1 pp.19-22 (2013)

- 80 -
because it is not known which parameter affects what judgment in humans.76 Applications of
AI and machine learning include pattern recognition and prediction.
Figure 45 Illustration of the modeling procedure
Figure 46 shows the analysis technology and modeling technology possessed by Yokogawa for these
three types of modeling techniques.
Figure 46 Analysis and modeling technology possessed by Yokogawa
76Introduction to Machine-Learning Technologies: https://www.slideshare.net/takahirokubo7792/ss-48083463 (as of January 2020)

- 81 -
Three types of modeling techniques need to be used in accordance with the application object and
purpose of application. This target is a water reclamation facility. The objective of the operation is to
minimize the amount of energy consumed in the water treatment process after maintaining the water
quality of the final effluent (reclaimed water), which is always meeting the water quality standards set
out by environmental regulations.
Optimal operational plan values should be derived, while the behavior of key process data, such as
DO and NH4-N, in response to the operating conditions of the entire facility is identified and the
effluent water quality at the end of the water treatment process is predicted. Here, the optimal
operational plan value refers specifically to the airflow rate.
Approximately 40% to 60% of the total power consumption in wastewater treatment facilities is
consumed by air generators (blowers) involved in the aeration tank. In the wastewater treatment
process, biological treatment is carried out while maintaining the activated sludge (aerobic
microorganism) in good condition in the aeration tank, and organic matter, nitrogen and phosphorus
in wastewater are removed, and the effluent water quality is observed within the effluent standard.
A common method of keeping this activated sludge well is the control of airflow rate. Therefore,
statistical modeling is desirable for digital technology to be applied to this reclaimed water field to
obtain estimation and prediction of water quality using process data and airflow rate.
Conventional modeling challenges include the need for enormous numbers of workers, such as
analysis and process response testing, the complexity and difficulty of the model with a wide range of
equipment and processes, and the difficulty of following the model to changes in process conditions.
DDMO (Data Driven Modeling for Optimization) is a technology that combines several statistical
techniques to automatically generate plant equipment models from operational actual data.77 It is
characterized by the ability to comprehensively extract not only the output characteristics but also
what kind of relationship exists between all variables related to the equipment as a characteristic
equation.
In general facilities, multiple balances such as mass and energy balances are met simultaneously,
and no single equation can express the characteristics of the equipment. In DDMO, it is possible to
automatically detect how many characteristic formulas are required for the equipment and to obtain
all of these formulas.
In addition, since it is a method of extracting the relation which is intrinsic to the operational actual
performance data and constructing the facilities model, the relation can be extracted by DDMO, if the
relation is shown on the data, even if the physical property is unknown.
Estimation of the number of characteristic formulas and derivation of coefficients of characteristic
formulas are essentially automated. The extracted characteristic formula is automatically transformed
77 Yokogawa Technical Report Vol.59 No.1 (2016)

- 82 -
into the model described for optimization software. Such features allow modelling including energies
and qualities with the use of DDMO, which can significantly reduce the effort of modelling for
optimization. In addition to simulating the energy conservation effect, the introduction of the operation
optimization system and the re-tuning when the model is out of the actual condition can be quickly
carried out.
DDMO characteristics are shown in Figure 47.
Figure 47 DDMO characteristics2
Conventional models are based on well-known models, which are constructed by tuning various
parameters to the plant during the reintroduction run-in stage. It is not always able to follow the change
of the environment which surrounds the process, and frequent tuning and model reconstruction are
forced, and it becomes a large burden both in the operational side and in the cost side.
On the other hand, DDMO applied in this case is to automatically generate an optimal model from
actual data based on the basic model based on the organization of the plant, and to automatically tune
the parameters by capturing changes in the measured data in response to environmental changes even
during operation. By automatically controlling the process side using the optimal solution derived
from the information processing system constructed using DDMO, the entire process can be operated
more stably and more efficiently.
The processing flow of the modeling technology applied in this case is shown in Figure 48.

- 83 -
Figure 48 Model techniques applied in this case78
78 Yokogawa Electric Corp. (2019)

- 84 -
2.3.2.3 Holistic optimization application
To operate the plant safely and efficiently, a whole system is constructed in which monitoring and
control systems that control the equipment, and superior information processing systems that analyze
and optimize the operation of operating conditions, are organized together from power facilities and
sensors placed on the site.
The behavior of treatment processes is grasped by various sensors, and control technology (OT:
Operation Technology), simulation and optimization application technology (IoT: Internet of Things)
which utilizes the plant to the maximum extent is required from a comprehensive perspective rather
than a partial optimization.
The image of OT and IoT is shown in Figure 49.
Figure 49 Automated control system fused with IoT and OT
Most of the system applied to WWTF under operation at present is the monitoring control system
mainly on OT technology. Regarding the application of IoT technology in advanced treatment plants,
most of the treatment plants are at the level of demonstration, although some of the treatment plants
have been commercialized, and it is considered that trials and errors are currently being conducted for
practical use.
The running systems at OCWD and LVMWD treatment plants surveyed in this study are also
operating by OTs and operators with monitoring and control systems such as SCADA and some DCS.

- 85 -
To effectively incorporate the results obtained in the simulations above into the current system is an
important point of the digitalization proposal.
The holistic optimization application describes both the optimal application for the entire institution
of interest and the optimal application for the entire system to be applied.
Therefore, not only the part of the reclaimed water treatment plant but also the upstream process,
primary treatment of wastewater, IPR and DPR process as a whole including secondary treatment
process, measurement data such as airflow rate data and process control data such as airflow rate
control, wind volume control, chemical dosing control, etc. are comprehensively analyzed, and the
basic process model is constructed to achieve stable water quality control and energy conservation.
IoT is integrated with OT to derive maximal driving efficiency in system wide control.

- 86 -
2.3.2.4 Control system
As a basic model of the control system for IPR/DPR, the control system which implements the entire
optimum application was examined referring to the process of Tapia Water Reclamation Facility which
carried out the survey in this study. Since Tapia Water Reclamation Facility is operated with existing
control systems, the basic model is examined that maximizes the system currently in operation, and
the system configuration is shown in Figure 50.
Figure 50 System configuration
The basic configuration is to add DDMO (optimized digitally applied technique) to the host side of
the system to the existing SCADA (partially DCS) system (OT).
Adding DCS between SCADA system controllers (PLCs) and DDMO for automatic control of key
equipment such as blowers, so that plant facilities are operated with the optimal solution derived from
DDMO.
This addition of DCS is not always necessary. If it is possible to respond to automatic control by
modifying the software on the existing controllers, it may not be necessary. This adoption or non-
adoption is determined by the comparison of the ability to construct control functions with existing
controllers and, where possible, the costs associated with software modification and the costs of
additional DCS.
In practice, it is required that DDMO can communicate with existing controllers and SCADA
systems by communication functions, and it is necessary to confirm each other's communication
protocols and to conduct reconnecting tests with actual machines.

- 87 -
It is also necessary to connect with all the control systems in operation in the treatment facilities to
be fundamentally covered to realize the entire optimum application.
For Tapia water reclamation facilities in LVMWD, two systems of SCADA and one system of DCS
have been found to exist as existing monitoring and control systems. Design holistic optimization
system considering the equipment, system configuration, function covered by each control system,
and the specific connection method.

- 88 -
2.3.2.5 Coordination of Simulation and Control Systems
For efficient operation of WWTF, AWTF, it is crucial to effectively utilize the large amount of
information obtained from plants.
Results of the simulation for Tapia water reclamation facilities have already been described, but it
is necessary to effectively utilize the optimal results for the indicators obtained from the simulations
in daily operations. It is important to utilize the results (numerical values) interconnected with existing
control systems.
Both OCWD and Tapia Water Reclamation Facilities of LVMWD, which were surveyed in this study,
have been operated daily under the judgment of operators who are familiar with operation control, and
the utilization of AI and IoT for optimum plant operation is to be carried out in the future.
⚫ The Role of Simulation and Control Systems.
The simulations conducted in this study are how to reduce the amount of energy consumed by
blowers by controlling the amount of airflow rate while ensuring that effluent NH4-N, NO3-N within
the statutory limits, and to achieve the economic effects of energy conservation.
The roles of each system are shown in Figure 51 using the control system with DCS and simulations
with DDMO.
Figure 51 Role of simulation and control system
DCS and DDMO deliver data via data management systems (PIMS).

- 89 -
DDMO collects all simulated data from DCS. The important thing at this time is the quality of data
sent from the DCS.
The reliability of the data is the most important because DDMO derives an optimal value based on
the actual data. Therefore, techniques to check the data quality on the DCS and PIMS sides are required.
DDMO refers to the input data and performs selection of variables, calculations of time-delays on
simulations, and setting of various parameters based on discharge criteria. The optimum value is
calculated by the model, and the data is output to the DCS side.
DCS-side incorporates optimal values received from DDMO into control algorithms, control
techniques (OTs), to implement optimal control according to the context of the processes.
A proposed example of a control algorithm for airflow control by a blower on the DCS side is shown
in Figure 52.
Figure 52 Examples of DCS control algorithms
We propose the following four patterns as conventional driving modes:
1) Constant air capacity control
2) Influx proportional control
3) Target DO control
4) Adding optimal airflow rate control with DDMO.
The airflow rate from blowers is controlled so that the DO values at the outlet of the aeration basin
are operated at prespecified targets in order to efficiently remove organic matter and remove

- 90 -
phosphorus and nitrogen in the normal WWTF.
It is considered that the target value can be operationalized within the environmental standard by
allowing sufficient treatment for changes in water quality and environmental changes such as weather
of sewage inflow water. Similar controls have been implemented in Tapia water reclamation facilities
in LVMWD.
DDMO leads to save energy expenditure at lower DO set value if the target water quality of less
severe is acceptable for the current operating situation.
⚫ Coordination of optimization and DCS-control by DDMO.
The holistic optimization application is an application that fuses IoT and OT to derive maximal
driving efficiency. In order to realize this, it is necessary to construct a system which can respond
flexibly to the change of driving situation by combining the function which DDMO and DCS have
well.
In order to fully exert the function of DDMO (IoT), it is important to stabilize the operational
condition of the process as much as possible with the function of the control level which DCS (OT)
possesses.
The function of the level of control received by the DCS side is listed.
✓ Controlling the amount of sewage inflow: minimizing variations in the amount of inflow
✓ Control of returning sludge, control of abstraction of excess sludge: Maintaining good
condition of the reaction tank
✓ Chemical dosing control: Removal of organic matter
It is crucial to coordinate these automatic control functions on the DCS-side by optimizing DDMO.
To combine DO-control mode by DCS and DDMO mode effectively happen to suspend model-driven
optimal control if the plant is severely unstable due to unexpected sudden changes in inflow sewage
quality or abnormalities in main controllers.
It is important to incorporate the optimal automatic switching function of driving mode to avoid
such situation into the system, which is the basic orientation of the optimal application.
⚫ Enhancement of energy efficiency through cooperation
In the results of simulation, the rate of energy reduction by DDMO was calculated to be 3.8%. This
is the result of the calculation of historical operational data prior to the application of the optimal
application, restricted to DDMO part for a given sample-period.
When the optimum application is applied, it is expected that the energy efficiency improvement by
the function of the newly incorporated automatic control in the DCS side is expected. By attempting

- 91 -
the stabilization of the treatment process by the adaptation of the detailed automatic control, it is
possible to produce more energy saving effect.
Based on previous experiences, we believe that an energy reduction rate of more than 10% can be
expected by applying automatic control to treatment plants where operational control is performed by
operators on a manual basis, and that a reduction effect of approximately 15% or more can be expected
in conjunction with the effect caused by DDMO.
⚫ Optimal application for the entire facility through collaboration
In the items of the entire optimum application, there are two different concepts between holistic
control and individual system control.
In this study, OCWD only included AWTF after wearing secondary treatment water, and it was not
possible to obtain information on WWTF managed by OCSD.
LVMWD was beginning to examine the introduction of IPR and AWTF for DPR implementation as
a future for WWTF currently in operation.
Toward full-scale IPR/DPR operations, it is critical that WWTF and AWTF aim to be most
efficiently operationalized as a series of processes rather than performing partial optimization
independently of each other.
For example, simulations can be conducted to develop one model and to derive control standards
and operational methods for most efficiently operating facilities for water quality at WWTF discharge
points and for water quality data at each CCP for AWTF RO-membrane water treatment systems
permeabilization and UV-AOP treatment systems.
Thus, we believe that digitalization will play a major role in developing new operational control
standards for IPR/DPR facilities in the future through data monitoring and simulations for the entire
process.
If the whole system is to be looked at, the cooperation between optimization solutions and control
systems (SCADA, PLCs, and DCS) by DDMO can be expected to create an optimization operation
system that will provide value in optimizing facility control, increasing operating efficiency, and
reducing operating costs (see Figure 53).

- 92 -
Figure 53 Optimization operation system and value

- 93 -
2.3.2.6 Risk Assessment
With the social environment becoming more diverse and complicated, efforts to prevent accidents
and failures and to improve safety are becoming more important.
Risk assessments for WWTF and AWTF include risk assessments for systems used for supervisory
control and risk assessments for WWTF and AWTF process control.
With regard to risk assessment (risk management) in AWTF, the need for control methods of
pathogenic microorganisms and viruses such as Cryptosporidium and Giardia, periodic sampling,
monitoring and analysis of water quality data, risk assessment and management related to
instrumentation has been established in CCPs on treatment processes such as the supply side of UF
membrane water treatment system, the supply side of RO membrane water treatment system and the
permeable side.79
This section describes the system-side risk assessment used for supervisory control.
⚫ Risk assessment of systems used for monitoring and control
Systems used in WWTF and AWTF include monitoring and control systems that are at the core of
operational operations, such as DCS, SCADA, and PLC, and remote systems that use information
processing systems and wirelesses, which are optimal solutions such as DDMO.
These could be anthropogenic, such as natural threats and network attacks, represented by floods
and earthquakes, and possible risks related to environmental threats, such as blackouts, contamination,
corrosive gases, and potential vulnerabilities to the objects themselves.
Regarding the natural surprise, it is necessary to be mindful mainly regarding the selection of
placement sites and the method of placement. In southern California, the risk of flood-induced
inundation was low, and therefore, no specific measures were considered in this study.
Vigilance control systems, such as DCS and SCADA, which are at the core of conventional systems,
use their own hardware, software, and protocols, and are therefore called closed and relatively safe
from a security perspective. The systems that have also been introduced in Tapia water reclamation
facilities and AWTF in OCWD were SCADA and DCS, which did not require any specific measures
due to their relatively safe security.
This time, as a proposal of the digitalization, it is the efficiency improvement of the operation by
the utilization of the optimum application by IoT and OT, and it is the state-of-the-art system.
The process control system is an open, interoperable system of different systems. Part of the system
is open to the public and incorporates IT technology that can be connected to the Internet.
It reduces costs, improves performance, and achieves interoperability by introducing commonly
79 Framework for Direct Potable Reuse (WateReuse, American Water Works Association, Water Environment Federation, NWRI, 2015)

- 94 -
utilized sophisticated IT solutions.
On the other hand, it can be said that there is a possibility of external attack due to openness. Hacker
technology has become increasingly sophisticated in recent, and need to strengthen security measures
to protect the systems used for supervisory control from those attacks.
Yokogawa provides security guidelines and best practices to protect the entire system and
application from threats.80
Items of the security standard are listed below.
✓ Overview of the security environment and related risks surrounding the control system
✓ To develop a systematic framework for information security management systems
➢ Identification of specific vulnerabilities and planning and implementation of protective
measures
✓ Development of security measures
➢ Network architecture, antiviral measures, patch management, system and network
monitoring, Windows domain management, Yokogawa's system security function, and
staff security policy
✓ Development of physical security measures
➢ Definition of physical boundaries, management of removable media, and management of
maintenance by third party, etc.
✓ Development of guidelines for developing business continuity plans
➢ To minimize the risks and harms of security threats
80 Yokogawa Electric Corp. (2019)

- 95 -
2.3.2.7 Fail-safe
Fale-safe in WWTF and AWTF include holistic operation of treatment facilities and individual
system. Especially for the stable and efficient operation of facilities, it is necessary to continue to
operate the main equipment in the plant, such as blowers, pumps and powered valves, which play an
important role in the processing process.
Generally, spare machines are prepared for critical equipment so that the operation of the treatment
plant is not stopped in the event that an operating equipment fails.
It is the operation that effectively exerts this for preparedness and response of the field side, and it
is considered that many parts are carried out by the automatic control function of the system.
This paper describes the idea of fail-safe related to the operation of the treatment facility carried out
by the control system and the idea of fail-safe related to the control system itself.
⚫ Fail-safe related to the operation of treatment facilities
It is important to capture the precursors and avoid the abnormality in the stage before the abnormal
generation, and to minimize the damage without causing the problem in the operation of the treatment
facility even if the abnormality occurs.
On the main equipment, it was explained that the reserve machine was prepared and corresponded
in advance, and it is important that on the control system side, the measurement information such as
current, voltage, frequency and temperature from each equipment is continuously monitored, and that
the operation situation has not changed, while it is checked with the process data such as airflow rate
and pressure, and that it is monitored using the data analysis function.
Analytical functions are to derive operational correlation among two or more variables, such as data
domain monitoring, from historical data, to define appropriate domains in normal driving, and to
monitor drivers constantly in that domain in real time.
It is important to set up a reserve machine smoothly and automatically, and to improve the automatic
control function so as not to affect the processing process, even if the equipment failure occurs. Once
the device fails and takes a long time to return, it may have a major impact on the water treatment
process, often consuming more energy than needed to restore the situation.
Delayed restoration measures, especially for blowers and key pumps around reaction tank, can have
a major impact on the quality of treated water, and therefore cause significant loss in energy
expenditure because they are forced to consume more than the normal amount of energy and recover
it.
It is assumed that even in actual operations, it is possible to improve the efficiency by more than 5%
to 10% only by reinforcing the failure response of the main equipment on the automatic control system
side, such as deterioration of water quality in the reaction tank due to failure of the main equipment

- 96 -
and delayed response, and some cases in which it takes more than two weeks to recover microbial
activity.
In addition, by integrating the operation control function and maintenance function into the optimum
application as a whole, analyzing the data up to the failure occurrence and investigating the cause, and
by enhancing the guidance function on the response after the occurrence, the burden on operators and
maintainers can be reduced, as well as managed and operationalized as an electronic operational
management manual as an appropriate measure in the event of an abnormality, it can serve as an
important tool in the prevention of recurrence and in the event of an outbreak.
⚫ High-confidence design relevant to the system itself
In order to operate facilities stably and efficiently, the control system used for device control needs
to be highly reliable.
Since the control system is composed of many parts, it is necessary to identify and select reliable
parts at the design stage, but it is still difficult to achieve a failure rate of zero.
The following describes the high-confidence design techniques required for the control system.
✓ Trouble-resistant design-fault avoidance
It is the most fundamental one, and it is important to identify the component with good
plausibility, design technology such as implementation design and heat design, low-power
consumption, environment resistance design, and noise resistance design, and to apply this
properly with moderate allowance.
✓ Design with minimal impact in the event of failure-fail-safe/fail-soft
It is important to manipulate the output to the safety side so that the control system will not
affect important controls (e.g., airflow rate control) if it fails. This includes holding the control
output value from the control system to avoid affecting the operating situation. It is also
important to perform some of the control functions even if they fail, such as manual back-up.
✓ Design-Fault Tolerance That Can Continue Movement in the Event of Failure
It is required that the control system continues the operation in real time at all time. Especially,
it is indispensable in the execution of the entire optimum application, and it is not necessary for
all control equipment, and especially, the correspondence of CPUs and communication
departments of the field control equipment which is responsible for the control of important
equipment, and doubling and redundancy of input and output modules is necessary.
✓ Design that can be restored quickly if it fails

- 97 -
Since the control system is composed of multiple CPUs modules, communication modules,
and input-output modules, there are relatively many failures in some modules during operation.
It is important that each module be prepared as a supplementary component in advance.
The system of Yokogawa is characterized in that the replacement work can be easily carried
out on-line without stopping the system, and the loss due to the failure can be reduced as much
as possible and the operation rate can be increased.
- 98 -
2.3.2.8 Technical proposals for performance assurance through water quality monitoring
As mentioned above, LRV-credits for membrane systems in California IPR-markets are set on the
premise that indicators of microorganisms and pathogenic microorganisms (Indicator) in water cannot
be measured directly.
OCWD water quality control policy and California licensing set out that the LRV credits for viruses
in the MF membrane system is 0, and the RO membrane system is not virally informative, but is
managed by an alternative indicator (Surrogate) for ECs and TOCs that can easily be measured in real
time.2
The removal performance of microorganisms, including viruses, by actual MF and RO membranes
is higher than LRV-credits, and the potential need of markets for performance assurance by Indicator
water quality monitoring is high.
[Market trends and analysis of water quality monitoring related to microorganisms].
Concerning the measurement which rapidly judges the contamination of microorganisms in water,
the competition technique which distributes to the market was investigated.
Figure 54 shows the relationship between detection time (several minutes to one week) and
detection information (microorganism, gene, protein, microbial activity, molecular structure, etc. to be
detected) on the detection technology of microorganism, and summarizes the technical features of
monitoring and the cost view of the competitive market.
Yokogawa aims at rapid quantitative evaluation of microorganisms based on gene analysis for a
plurality of microorganisms and intends to create business opportunities corresponding to the technical
area shown by the red broken line in Figure 54.
Characteristics of concepts that rapidly measure "microbial indicators: Indicator" and "microbial
substitution indicators: Surrogate" are used to identify pricing information. Detection information, its
suppliers, and marketing pricing bands are shown in Table 31, and product characteristics for each
supplier are shown in Table 32 to Table 39.

- 99 -
Figure 54 Relationship between time required for microbial detection and identifiable
microbial information

- 100 -
Table 31 Technology to detect microbial-major suppliers and price ranges
Technology Major supplier Price range
(x10,000 yen)
DNA probe Takara Bio, Fasmac 5 – 10
DNA chip Oriental cans 300 – 500
PCR Hygiena, 3M, QIAGEN, Shimadzu Corporation
and Thermo Fisher Corporation
250 – 500
Microcolony BD 1000 – 5000
ATP MERCK, Hitachi High Technology Solutions,
Nitta
5 – 10
Fluorescent staining Thermo Fisher; Sharps; Sysmex 500 – 1000
Culture medium Thermo Fisher、BD、Sysmex、MERCK、
Beckman
10 – 20
TOC HACH、SUEZ、Schneider Electric 500 – 1000
⚫ DNA probe
A DNA probe is a DNA that uses the complementarity of DNA to detect a particular gene or virus
or to pair with the DNA of interest.
Here, I will explain the products of Takara Bio and Fasmac.
Table 32 Characteristics of each company of DNA probes
Product name Characteristic
qPCR Probe81
(Takara Bio)
Example of custom manufacturing products
⚫ Summary: TaKaRa Biotechnology provides total support from the
marketing of standardized probes to the preparation of template
DNA/RNA to qPCR that is tailored to the needs of the client.
81Takarabio http://catalog.takara-bio.co.jp/jutaku/basic_info.php?unitid=U100007565 (as of October HP 2019, Takarabio)

- 101 -
Product name Characteristic
⚫ Characteristic:
➢ Optimal primer-probe design for highly specific real-time PCR
using fluorescently labeled probes
➢ Primers and probes can be designed on the basis of information
such as Accession No. of the target gene, sequence information,
gene name, species, and fluorescent labeling.
➢ Probe PCR enzymes, culture media, etc. have peripheral
equipment and know-how. Detection kits can be prepared totally.
⚫ Main applications: General biotechnology industry
Probe
(Fasmac)
An example of a reagent kit82
⚫ Overview: Fasmac provides genetic testing kits for a variety of foods
that meet the needs of its clients, with high technical capabilities such
as primer preparation, DNA contract synthesis, and DNA sequence
analysis.
⚫ Characteristic:
➢ Short delivery period
➢ Reliable support system for manufacturing in Japan
➢ Implementation of cumbersome sequence design through
optimization.
➢ PNA probes, such as peptide nucleic acid probes, are also used to
generate characteristic probes, such as strong hybridization at low
ionic intensities and enhanced sequence selectivity.
⚫ Main applications: Food gene business, seed and seedling inspection,
etc.
⚫ DNA microarray (DNA chip)
DNA microarrays (DNA chips) are analytical instruments in which a large number of DNA probes
are placed densely on substrates such as plastics or glasses.
82FASMAC http://fasmac.co.jp/product/kitidensi5 (as of November HP 2019 of FASMAC)

- 102 -
A single strand of DNA with an obvious base sequence is placed on a variety of substrates, and the
sample is reacted to it so that the DNA strand of the sample binds only to the part of the sequence
complementary to the DNA sequence of the sample.
The binding position is detected by fluorescence and current, and the DNA sequence contained in
the sample is detected from the initial configuration.
Here, the products of Oriental Can Co. are explained.
Table 33 Characteristics of DNA microarrays
Product name Characteristic
GENOGATE83
(Toyo Seikan)
GENOGATE
⚫ Outline: Focusing on food and packaging factories, they are used to
prevent mold contamination. In the process, the species to be detected
are used for screening whether they are contained in the environment
(process).
⚫ Characteristic:
➢ Can isolation culture be unnecessary and detected in a short time?
➢ Multiple colonies can be tested in bloc, and the higher the number
of colonies, the lower the cost of testing compared to traditional
morphological observation and gene identification (sequencing)
methods
➢ Since the detection object is DNA, the high accuracy test is
possible in comparison with the morphological observation
method, etc.
➢ Corresponding to xerophilic, drought-tolerant, and wet-phallic
molds, with 637 fungal species detected
83Use of Rapid Estimation System for Microbial Contamination Sources by Flora Analysis of Earth Environmental Service and Effectiveness http://sysmex-is.jp/wp/wp-content/uploads/2014/12/315fcc798887c3873a9dc8d038aaf97a.pdf (as of November HP 2019, Earth Environmental Service)

- 103 -
Product name Characteristic
➢ Limited number of spots detected, and limited number of bacterial
species tested
⚫ Main applications: Food hygiene control, environmental inspection

- 104 -
⚫ PCR method
Polymerase chain reaction (polymerase chain reaction, PCR) is used to amplify certain regions
(regions of interest) on DNA sequences using thermostable DNA polymerases by repeating thermal
denaturation, annealing, and elongation reactions.84
Here, the products of Hygiena Co., 3M Co., QIAGEN Co., and Shimadzu Mfg., will be described.
Table 34 Characteristics of PCR Companies
Product name Characteristic
Cryobacks system
(Hygiena)85
BAX Q7
⚫ Overview: A screening system for pathogenic bacteria in foods by PCR.
Polymerase chain reaction (PCR) is a technique for amplifying
characteristic genes in a short time. Taking advantage of their
characteristics, they continue to be chosen by food manufacturing,
designated laboratories, administrative laboratories and others
worldwide for more than two decades to enable molecular detection of
food raw materials, food processed products, or food poisoning
bacteria, spoilage bacteria and other bacteria in their manufacturing
environment, protect food safety, and rapidly supply tested products.
⚫ Characteristic:
➢ Reducing the complexity of the reagent preparation process by
tableting the PCR reagents required for the reaction
➢ Uniquely developed primers required for growth and
commercialized in many food and bacterial species
⚫ Main uses: Food inspection
84https://www.falco-life.co.jp/oyaku/iden/pcrgenri.html (as of November HP 2019, Falco Biosystems, Inc.) on the principles of PCR-based assays, Department of Life Sciences, Falco Biosystems, Inc. 85Central Science https://cscjp.co.jp/creos/baxsystem.html (as of December HP 2019, Central Science)

- 105 -
Product name Characteristic
3M Molecular
Detection System
(3M)86
3M Molecular Detection System
⚫ Outline: The uniquely developed loop-mediated isothermal
amplification (LAMP) technique utilizes molecular microbiology to
detect pathogens, allowing for more detailed control of testing
processes.
⚫ Characteristic:
➢ Robust, efficient, and sensitive
➢ Is not affected by inhibitors from samples arising from
conventional PCR
⚫ Main uses: Food inspection
Rotor-Gene Q
(QIAGEN)87
Rotar-Gene Q
⚫ Overview: Using a centrifugal air-control system, it retains high
temperature uniformity (±0.01°C) between the reaction samples and
achieves sensitive, accurate and rapid real-time PCR with short optical
path lengths from the plateau to the detector in a restrictive manner.
⚫ Characteristic:
86 3M™ Molecular Detection System https://www.3m.com/3M/en_US/company-us/all-3m-products/~/All-3M-Products/Food-Safety-Microbiology/Pathogen-Testing/3M-Molecular-Detection- System/?N=5002385+8711017+8711414+8716587+8716597+3294857497&rt=r3 (as of December, HP 2019, Inc., 3M) 87 QIAGEN Company https://www.qiagen.com/jp/products/instruments-and-automation/pcr-instruments/rotor-gene-q/#orderinginformation (as of December HP 2019 of QIAGEN Company)

- 106 -
Product name Characteristic
➢ High temperature uniformity between samples was realized
(±0.02°C) with centrifugal air control method.
➢ Corresponding to a wide range of optical systems covering the UV
to infrared region
➢ Reduction of running time by high-speed heating and cooling
mechanism
➢ High sensitivity and reproducibility
⚫ Major applications: Medicine (Genotyping, Methylation Analysis,
Gene Scanning, etc.)
GVP-9600
96 Well genotype
detector
(Shimadzu
Corporation)88
GVP-9600 (from HPs)
⚫ Overview: Real-time PCR is a method to amplify a portion of the DNA
by polymerase chain reaction (PCR) and to measure the expression
level of the amplified product in real time. It is characterized by the
ability to perform accurate and rapid genetic analysis, allowing early
identification of the source of infection, such as E. coli O157 and
noroviruses.
⚫ Characteristic:
➢ Rapid rate of climbing and descending temperature (4°C/sec) and
photometry
➢ The availability of commercially available, inexpensive 96-well
plates and 8-tube tubes as reaction vessels required for
measurement allows rapid and cost reduction
➢ Since the reaction liquid volume corresponds to up to 100μL, it is
highly versatile and suitable for the application of direct PCR
detection of very small amounts of viruses and bacteria contained
in the sample.
88https://www.shimadzu.co.jp/news/press/n00kbc0000000qub.html, Shimazu Pharmaceutical Co., Ltd. (as of October HP 2019, Shimazu Pharmaceutical Co., Ltd.)

- 107 -
Product name Characteristic
⚫ Major applications: College institutions, detection of food-associated
pathogens
⚫ Microcolony
The microcolony method is a method of detecting and counting fine colonies of about 10-50 μm in
diameter by brief cultivation of bacteria collected on a filter on the medium under a fluorescent
microscope.
This method has the advantage of being able to rapidly quantify bacteria with growth potential.
The product of BD (Vector Dickxon) is explained here.
Table 35 Characteristics of Micro-Colony Companies
Product name Characteristic
Micro-bio μ3D
(BD)89
Micro-bio μ3D
⚫ Overview: As the world's first rapid fully automated detection system
for μ3D colonies, the detection of colonies from the level of
microcolonies will allow quicker quality control processes by detecting
colonies much earlier than can be seen.
⚫ Characteristic:
➢ Accurate enumeration in the first worldwide colony 3D analysis
➢ Function of continuous monitoring from micro level, reducing
detection time
➢ Fully automated measurement regardless of contamination/smear
culture
⚫ Main applications: Food, cosmetics, and pharmaceutical markets
89BD https://www.bdj.co.jp/micro/products/ind/micro3d.html (as of October HP 2019, BD)

- 108 -
⚫ ATP method
The ATP method is a method for measuring the luminescence (Relative Light Unit) of ATP
(adenosine triphosphate) present in the cells of all organisms combined with enzymes, etc. This
method has the "advantage that conventional culture methods can confirm the results in tens of
seconds" compared with taking more than 24 hours to reach the results.90
This section describes the products of MERCK, Hitachi High Technology Solutions, and Nitta.
Table 36 Characteristics of each company of the ATP method
Product name Characteristic
HY-LiTE
System(MERCK)91
HY-LiTE System
⚫ Overview: Specific reactions with reagents quantitatively measure
ATP (adenosine triphosphate) found in all biological residues. The
released bioluminescence is detected by HY-LiTE® luminometer.
⚫ Characteristic:
➢ Rapid measurement is possible.
➢ Portable type, manipulated or simplified
➢ Unique detectors reduce the impact of disinfectant residues and
provide reliable results.
⚫ Main uses: Cleaning process quality of food and beverage
manufacturing plants
90 Nitta-ATP method http://www.nitta-monitoring.com/sanitary/atp/what/ (as of October, Nitta HP 2019) 91MERCK http://www.merckmillipore.com/JP/ja/product/HY-LiTE-System,MM_NF-C143779 (as of October HP 2019 of MERCK)

- 109 -
Product name Characteristic
Lumione BL series
(Hitachi High
Technology)92
Lumione BL-2000
⚫ Overview: Hitachi's unique ATP bioluminescence method was
adopted to reduce the examination time to the fastest 1 hour.
Simultaneously, the sensitivity improvement over 10 times the
conventional ratio was realized by the new reagent which enables
noise reduction and high-precise detection of the detection system
which became a problem in the test sensitivity. In addition, by
establishing manufacturing methods for consumables, such as filters
for sample filtration, which avoid contamination of microorganisms
and ATP, the product achieved both reduced test times and improved
test accuracy. The product responds to the CSV required for
pharmaceutical manufacturing and quality control.
⚫ Characteristic:
➢ No medium required
➢ 1 hour fastest test time
➢ Higher sensitivity using Hitachi's proprietary technology
(achieving the same level of sensitivity as the culture method)
➢ Bacterial species not identified
⚫ Main applications: for microbiological examination of water for
pharmaceutical production (pharmaceutical water)
92Hitachi High Technology Solutions https://www.hitachi-hightech.com/hsl/product_detail/?pn=lumione_bl-2000 (as of October HP 2019, Hitachi High Technology Solutions)

- 110 -
Product name Characteristic
Luminometer
(Nitta)93
Luminometer
⚫ Overview: The ATP wipe test method involves the measurement of
not only microbes but also biological substances (organic matter).
However, in food factories and other manufacturing sites, it promotes
the growth of microorganisms in the event of biological
contamination. Therefore, it is important to consider not only
microbiological testing but also ATP testing.
⚫ Main applications: cleanliness of food processing, medical
equipment, hands, etc.
⚫ Fluorescent staining
Fluorescent staining is a technique that uses antibodies to fluorescently label specific biological
targets in a sample. Antibodies are Y-shaped, high-molecular-weight glycoproteins, also called
immunoglobulins, that bind specifically (but not covalently) to another molecule (often called an
antigen or epitope).
In immunofluorescence, the specificity of the fluorescent label is derived from the specificity of the
antibody to the antigen. The bound antibody is detected by a fluorescent dye attached to the antibody.
The products of Thermo Fisher and Sharp Life Science are explained here.
93 Nitta http://www.nitta-monitoring.com/sanitary/hospital/atp-ruminometer/ (as of October HP 2019, Nitta)

- 111 -
Table 37 Characteristics of each company using fluorescent staining
Product name Characteristic
EVOS M7000
(Thermo Fisher)94
EVOS M7000 Imaging System
⚫ Overview: Fluorescent staining techniques are also used to provide
high-performance and high-speed automated imaging. The system is
designed with advanced functionalities and facilitates cell-based
imaging applications that require much such as live cell analysis,
image tiling, and z-stacking.
⚫ Characteristic:
➢ Rapid measurement is possible (scannable within 5 min with
three fluorescent channels per 96 well plate)
➢ Flexibility The system can be customized by choosing 20 or
more LED light cubes, dual cameras (monochrome and collar),
various lenses from 1.25× to 100× magnification, and more than
one vessels owner
➢ Using Onstage incubators with time-lapse live-cell imaging
options allows a wide range of biological studies to be
performed under physiological conditions by arbitrarily setting
and precisely controlling temperature, humidity and gases in
normoxic or hypoxic conditions
➢ In addition, various quantitative imaging and statistical analyses
are possible by using automated and optional data analysis
software such as auto-foci to improve experimental
reproducibility.
⚫ Main applications: Life science research
94Thermo Fisher https://www.thermofisher.com/jp/ja/home/life-science/cell-analysis/cellular-imaging/cell-imaging-systems/evos-m7000-cell-imaging-system.html (as of October HP 2019 of
Thermo Fisher)

- 112 -
Product name Characteristic
BM-300C
(Sharp Life
Science)95
BM-300C microbial sensors
⚫ Overview: The bacteria and microparticles are collected by
electrostatic capture, and only microorganisms are detected using the
heat fluorescence augmentation method. Time course of microbial
abundance in the field can be 'visualized'.
⚫ Characteristic:
➢ Microbial quantities including culture and dead molds and
bacteria can be measured in a minimum of 10 minutes.
➢ Simple measurement. Stable measurement accuracy can be
obtained even if there is no use experience.
➢ Light weight and compact
⚫ Main uses: Different manufacturing sites and facilities such as foods,
medicines and hospitals
⚫ Culture medium
The medium method is a technique for detecting microorganisms by immobilizing them in the
medium and culturing them. Few organisms are capable of degrading agar as a material, and they are
unlikely to be degraded during cultivation.
In addition, autoclave sterilization (121°C) is possible while the medium is added because it is
chemically stable even at high temperatures, and it is said that the results of the inspection tests are
easy to eliminate the effects of other contaminants and are difficult to make errors. Different media
can be cultured in different organisms. In other words, as long as certain media are used, bacteria and
fungi cannot be cultured and cannot be detected.
The typical products of Thermo Fisher and BD are explained here.
95Sharp Life Science https://www.slsjp.co.jp/microbe-sensor (as of October HP 2019, Sharp Life
Science)

- 113 -
Table 38 Characteristics of each company of the culture medium method
Product name Characteristic
Agar basal medium
(Thermo Fisher).
e.g., Oxoid™ Brilliance™ Salmonella agar basal medium96
⚫ Overview: It provides a microbiology solution for the diagnosis of
infectious diseases and for the detection of bacterial contamination in
industrial applications. It provides public health, clinical laboratories,
food companies, environmental screening and pharmaceutical
laboratories with product portions such as chemical susceptibility
testing solutions and market-leading molecular biology solutions for
food hygiene testing. This product is one of the most versatile food
microbiology test products. Other tests include Salmonella enterica
subsp. enterica serotype Salmonella typhi detection kits.
⚫ Characteristic:
➢ Incubation supplements inhibit the growth of other
contaminants, etc.
⚫ Main uses: public health, clinical laboratories, food companies,
environmental screening and detection of microorganisms in
pharmaceutical laboratories
Non-proprietary
Bacterial Medium
(BD)97
General Bacterial Media Series
⚫ Overview: With regard to infectious disease testing, a lineup of more
than 300 different media products is available. As microbiological
examination, the lineup of plated raw medium, test tube medium, and
powder medium is available for medical institutions.
⚫ Main applications: Medical and pharmaceutical products
96Thermo Fisher https://www.thermofisher.com/order/catalog/product/CM1092B (as of October HP 2019 of Thermo Fisher) 97BD https://www.bdj.co.jp/micro/products/1f3pro00000s8mut.html (as of November HP 2019, BD)

- 114 -
⚫ TOC
The TOC meter is a total organic carbon meter, which is a measurement by oxidizing and degrading
organic matter in water and quantifying carbon dioxide produced by decomposition using a detector.
It directly measures the amount of organic matter in comparison with BOD, etc., and it seems to be
superior as a quantitative index. Microorganisms are not directly measured to measure all organic
matter present in water (e.g., sugars, alcohols, resins, etc.), but are commonly used as contamination
monitoring techniques with organic matter.
Here, the products of HACH and SUEZ are explained.
Table 39 Characteristics of TOC Companies
Product name Characteristic
BioTector B7000i
(HACH)98
BioTector used at the University of Arizona
⚫ Overview: The two-step wet oxidation system can operate with less
influence on the field environment.
⚫ Characteristic:
➢ Automated internal cleaning function reduces the frequency of
clogging and periodic maintenance procedures
➢ Undiluted, filter-free, measurable up to 20,000mg/L
⚫ Main applications: Sewage and wastewater
Sievers TOC meter
(SUEZ)99
Sievers 5310C used in UofA
98HACH https://jp.hach.com/toc/hach-biotector-b7000i-toc/family?productCategoryId=52238972651 (as of December HP 2019 of HACH) 99Central Science https://aqua-ckc.jp/products/toc_m9.html (as of October HP 2019, Central Science)

- 115 -
Product name Characteristic
⚫ Overview: The gas-permeable membrane dielectric constant
measurement method enables accurate TOC measurement by removing
the effects of other ions other than carbon dioxide.
⚫ Characteristic:
➢ Removal of interfering ions by gas permeable membrane dielectric
modulus measurement method
➢ Low running cost (gas-free/calibrated: annual)
➢ Shortened measurement interval (usually 2 min/time)
⚫ Main Uses: Control of Water for Manufacturing
Based on the above survey, techniques for indirect and qualitative detection by luminescence of cell
activity using conventional media and ATP can be sourced from thousands to tens of thousands of yens
as simple tests. On the other hand, for qualitative analyses at the genetic level, the purchases ranged
from 5 million to 10 million.
Yokogawa aims at the possibility of rapid and quantitative evaluation based on gene analysis, and
the price setting of about 30 million yen is assumed, but the validity in the market trend was found in
this survey.
Based on the results of an evaluation of the acceptability in the above markets, the expected prices
for the proposed technical are mentioned for the field surveys and expert councils in California, which
are discussed below.
⚫ RAPID of rapid measurement techniques for microorganisms proposed by Yokogawa to
IPR/DPR
The need to monitor water quality at the CCPs of water treatment processes that constitute AWTF
in IPR/DPR is to measure the abundance of indicator bacteria before and after each treatment, and to
more quickly identify the removal rate of microorganisms, including highly toxic viruses, by water
treatment systems based on actual measurements.
The water treatment system focused on membrane filtration (using MF and RO membranes) systems
with limited LRV-credits involved in virus elimination in California and OCWD.
Performance assurance by this water treatment system must be fully taken into account to determine
whether the system is mechanically capable of detoxifying water quality by monitoring the quality of
raw water entering the system and the digitalization involved in optimizing operations to achieve this
performance.
In order to ensure the performance of water treatment systems, this study proposes to evaluate water
quality by focusing on environmental viruses that are highly correlated with faecal contamination,

- 116 -
such as pepper spotted virus (Pepper Mild Mottle of Virus: PMMoV), which are resident in water
environments and can be measured at levels of abundance.
The appropriateness of water quality assessment and Yokogawa's technical proposals and their
acceptability to California-state markets were assessed by the Expert Council of OCWD and NWRI,
which will be discussed later.
[Novel Technological RAPID of Microbial Detection Technologies].
Yokogawa has developed microbial detection technology for many years and has recently
constructed microbial detection technology in the manufacturing process of food products. Obtaining
information on microorganisms contaminated in food is essential in food hygiene control, but
conventional microbiological test methods require several days to weeks to obtain test results, and
techniques to shorten the examination time are desired.
Yokogawa has developed a signaling array probe, a new nucleic acid detection probe that allows
rapid and simplified detection of genes by DNA microarrays. By using this probe, the complicated
operation such as fluorescent labeling to the target nucleic acid molecule to be detected, which is
required in the nucleic acid analysis by DNA microarray until now, becomes unnecessary.
In addition, it is possible to omit the cleaning process of the microarray after hybridization (by
conjugating the target nucleic acid molecule to the detection probe) which is required when the
fluorescent labeling is carried out to the target nucleic acid molecule, and the inspection process can
be simplified.100
With this technology, the detection of microorganisms can be performed quickly and conveniently,
and the highly reproducible test can be performed by everyone. This technique is traditionally a
technique to extract DNA from bacteria and fungi in a sample and to distinguish the type with the
detection of the fungus by DNA microarray.
In water quality monitoring of water treatment systems, the indicator organisms to be detected
include those classified as viruses. Therefore, by designing and generating signaling array probes to
detect viruses, this technology may be applicable for water quality monitoring of water treatment
systems.
To test this technology RAPID, a new technology for rapid detection of microorganisms, for the
need of water quality monitoring, and to extract challenges and subdivide needs by detecting field
samples. The organization of a novel microbial detection technique RAPID capable of detecting
viruses is shown in Figure 55.
Water from pre-and post-water treatment systems should be used as a sample, and microbial
concentration techniques should be used to increase the microbial concentration in the sample and to
remove Inhibitors artifacts in the late reactions.
100 Development of Nucleic Acid Detection Method for Rapid Microbial Testing (Yokogawa Electric Corp., 2017)

- 117 -
RNA is simply extracted from enriched microbial samples by HTP (High Temperature Pressure
method) extraction, reverse-transcription reactions are performed by RT-PCR, and single-stranded
targeted nucleic acids of interest are amplified by asymmetric PCR.
The asymmetric PCR product is hybridized with a DNA microarray spotted by a signaling array
probe designed for virus detection, and the fluorescence of the DNA microarray is detected, and the
virus is detected.
Figure 55 Organization of the Microbial Detection Technique RAPID
⚫ Principle of the HTP extraction method
Conventionally commercially available gene extraction kits, microbial gene extraction has not
become a uniform method, since multiple kits and protocols have been applied due to the nature of the
organism.
Also, the use of gene extraction kits has the challenge of requiring proficiency, such as the technique
of general biological experiments, and the difficulty of handling multiple samples simultaneously,
taking more than one hour for extraction protocols.
The HTP extraction method is a method that allows gene extraction from a wide variety of
microorganisms simultaneously with a single test protocol for a more rapid and simple test method.
A total of 20 μl of each microorganism's culture medium enriched with culture medium is sealed in
a dedicated container containing a dissolving aid and processed under high-temperature pressurization.
The high-temperature pressurization treatment time is completed within 1 minute. In the verification
of the principle, the applicability is confirmed for Gram-negative bacteria, positive bacteria and fungi.
Candida albicans, Eschrichia coli, Pseudomoas aeruginosa, Staphylococcus aureus, Salmonella sp.
was selected and subjected to enrichment culture at 30°C for 48 h by liquid GPLP medium or SCDLP
medium.
A total of 20 μl of the culture medium for each microorganism to be detected was sealed in a
dedicated container containing a dissolving aid, processed under high-temperature pressurization, and
nucleic acid extracts were prepared. Twenty μl of 10-fold diluted nucleic acid extract was added to 20
μl of PCR reagent containing the intercalator and each microbe-specific primer (5 sets).
Amplification of the extracted nucleic acid was performed by a qPCR device (TAKARA BIO INC.)
and the presence of the target microorganism was confirmed by checking the presence or absence of

- 118 -
amplification by increasing the fluorescent intensities. The HTP-extraction method allowed
simultaneous extraction from a Candida albicans in which nucleic acid extraction was relatively
difficult in the presence of several microorganisms.
In addition, studies have been conducted to improve nucleic acid extraction rates by examining
various reaction conditions such as buffer composition. In addition, it was clarified that nucleic acid
could be extracted from spores (Bacillus subtilis) which were difficult to extract under conventional
conditions.101
⚫ Genetic analysis by DNA microarray.
A DNA microarray is an analytical tool in which a detection DNA probe with a complementary
sequence of the nucleic acid to be detected on a solid substrate is spotted in an array and immobilized
(see Figure 56). Nucleic acid molecules with complementary sequences have the property to bind each
other under certain temperature and solution composition conditions.
This property makes it possible for DNA probes anchored on DNA microarrays to selectively
capture molecules with complementary sequences among the large number of DNA molecules
contained in the sample. This method is utilized in various research fields because it can detect
differences in nucleotide sequences as few as a few bases, and because it allows comprehensive
analysis of DNA in multiple sequences to be performed in a small amount of specimens and a sufficient
amount in a short time.102
101 Development of a specific microbial detection system for cosmetic applications using a novel nucleic acid extraction method (Japan Antimicrobial and Antifungal Society, 2014). 102 Development of Nucleic Acid Detection Method for Rapid Microbial Testing (Yokogawa Electric Corp., 2017)
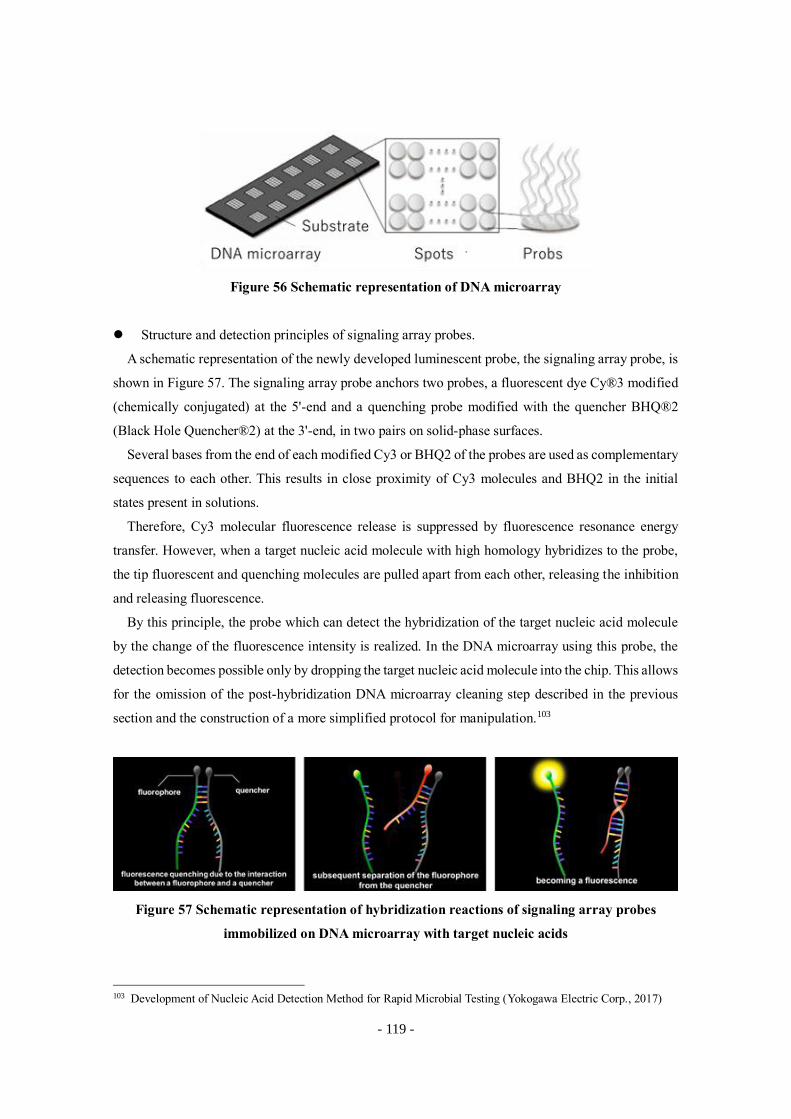
- 119 -
Figure 56 Schematic representation of DNA microarray
⚫ Structure and detection principles of signaling array probes.
A schematic representation of the newly developed luminescent probe, the signaling array probe, is
shown in Figure 57. The signaling array probe anchors two probes, a fluorescent dye Cy®3 modified
(chemically conjugated) at the 5'-end and a quenching probe modified with the quencher BHQ®2
(Black Hole Quencher®2) at the 3'-end, in two pairs on solid-phase surfaces.
Several bases from the end of each modified Cy3 or BHQ2 of the probes are used as complementary
sequences to each other. This results in close proximity of Cy3 molecules and BHQ2 in the initial
states present in solutions.
Therefore, Cy3 molecular fluorescence release is suppressed by fluorescence resonance energy
transfer. However, when a target nucleic acid molecule with high homology hybridizes to the probe,
the tip fluorescent and quenching molecules are pulled apart from each other, releasing the inhibition
and releasing fluorescence.
By this principle, the probe which can detect the hybridization of the target nucleic acid molecule
by the change of the fluorescence intensity is realized. In the DNA microarray using this probe, the
detection becomes possible only by dropping the target nucleic acid molecule into the chip. This allows
for the omission of the post-hybridization DNA microarray cleaning step described in the previous
section and the construction of a more simplified protocol for manipulation.103
Figure 57 Schematic representation of hybridization reactions of signaling array probes
immobilized on DNA microarray with target nucleic acids
103 Development of Nucleic Acid Detection Method for Rapid Microbial Testing (Yokogawa Electric Corp., 2017)

- 120 -
[Technical assessment by the University of Arizona and OCWD in RAPID].
⚫ Technology referral program conducted in Japan
To confirm the applicability of the Microbial Detection Technology RAPID to water quality
monitoring of water treatment systems, a technology transfer was conducted to enable work by U.S.
field workers.
The University of Arizona researcher was invited (September-October, 2019) to implement a
technology transfer program at Yokogawa Electronic Inc. Technological transfer followed a manual
illustrating RAPID working protocol (see Figure 58 and Figure 59) in which the field studies acquired
the task while performing the real protocol with E. coli culture samples and PMMoV culture samples
as simulated samples to confirm the reproducibility and feasibility of the experiments.
The need to verify the operability, reliability, detection times, etc. of RAPID by the operation by the
field researcher and apply it to water quality monitoring of the water treatment system was fragmented.
Figure 58 Extracts of RAPID operating manuals, HTPs
Figure 59 Extracts and hybridizations of RAPID operating manuals

- 121 -
⚫ Driving and Technological Assessment of RAPID in the United States.
In order to extract problems and subdivide needs by detecting microorganisms in response to the need
for water quality monitoring of water treatment systems, RAPID of Yokogawa Electric Co., Ltd., a
new technology for rapid detection of microorganisms, was tried in the U.S.A., and the reproducibility
of performance was confirmed, and the technology was evaluated.
Figure 55 Organization of the Microbial Detection Technique RAPID
WEST centers are state-of-the-art research facilities that monitor the performance of water treatment
systems constituting WWTF and AWTF and focus on alternative energies and related technologies.
WEST center is located adjacent to the Aguanuéba Water Reclamation Facility (WWTF and AWTF
performing IPR aimed at groundwater reclamation) operated by Pima County, Arizona, and also
adjacent to reclaimed water reservoirs and artificial wetlands in response to the IPR project by Pima
County.
It is unique in that the necessary translational research can be conducted to advance future
sustainable technologies. Laboratory facilities capable of direct laboratory collection of samples
simulating water quality monitoring in response to IPR/DPR project and calibration of the techniques
that constitute RAPID are in place, making it a suitable laboratory to try to localize the new
technologies.104
For RAPID installed by Yokogawa at WEST Center, HTP-extraction and subsequent protocols were
carried out using culture samples of microorganisms to confirm the operation of the center and to
determine whether or not to detect microorganisms, and it was confirmed that the HTP-extraction and
subsequent protocols could be used on-site.
104https://west.arizona.edu/ (as of October 2019)

- 122 -
Figure 60 Photograph of real-time sensing laboratory
Figure 61 Photograph of RAPID, WEST Centre

- 123 -
Assessment of microbial detection techniques by OCWD was performed at WEST center (see
Figure 62). The assessment was based on the perspective of the end-users of OCWD operating the IPR
facilities, and there was a call for simplification, such as the need to prepare the equipment to be used
to be autoclaved and only removed from the autoclave back.
Thorough prevention of contamination of detected samples in microbial and RNA handling and
assurance of the reliability of detection is an evaluation criterion.
And, it was indicated that there was a non-specific amplification example by PCR of the gene which
can become the false positive in the detection of the gene which is the principle of this technology (the
risk of false detection of the gene which is not a detection object).
At present, since the design of the detection gene sequence of the probe is inherent to the gene to
be detected in this technology, it was understood that the false detection has not occurred.
Figure 62 Inspection of Microbial Detection Techniques by OCWD

- 124 -
2.3.2.9 Assessment of RAPID Techniques and Application Effects
On November 20, an expert panel was convened by NWRI in OCWD, and the Japan, U.S. Research
Team (Yokogawa Electronic, University of Arizona, University of Tokyo) formed by the Ministry of
Health, Labour and Welfare commissioning project published and questioned the expert panel
(Andrew Salveson (Chair), WateReuse Practice Leader, Carollo Engineers/Daniel Gerrity, Ph.D.,
Principal Research Scientist, Southern Nevada Water Authority/Sunny Jiang, Ph.D., Professor and
Chair, Department of Civil and Environmental on Engineering, University of California at Irvine),
observers (NWRI, OCWD), and participants (JETRO-LA, Mizuho Information & Research Institute).
NWRI convened experts within the United States who were familiar with the U.S. reclaimed water
situation and the field of molecular biology.
The panel reviewed technical content and relevance at the Council convened by NWRI (see Figure
63 and Figure 64) to advocate for water quality control of water treatment systems by RAPID, looking
at California's IPR markets and future DPR markets.
In addition, the California-institutionalized LRV credits are official removal rates that are uniformly
set for each water treatment system on the assumption that the index of microorganisms and
pathogenic microorganisms (Indicator) in water cannot be directly measured. The possibility found by
introducing RAPID technique is also discussed.
Table 40 Details of deliberations by expert committees on RAPID
Technical Evaluation
and Challenges
⚫ Technical assessment and challenges of RAPID.
⚫ In particular, with respect to techniques that can ensure
detoxification of pathogenic microorganisms in quasi-real time by
performing rapid measurements against the indicator PMMoV of
pathogenic microorganisms and evaluating the performance of
water treatment systems with LRVs.
Effects of Technology
and Social Benefits
⚫ Social benefits guided by RAPID counting.
⚫ In particular, regarding the fact that the removal rate of pathogenic
microorganisms provides an alternative to LRV credits for water
quality control and to ensure safe water quality.
Hypothesis setting for
dissemination
⚫ RAPID dissemination scenarios.
⚫ Especially assuming existing and future IPR projects in California.

- 125 -
Figure 63 Expert Committee
Figure 64 Materials Used for Explanation and Deliberation by the Expert Committee

- 126 -
Figure 65Figure 65 Expert Committee (11/20) Agenda

- 127 -
Figure 65 Expert Committee (11/20) Agenda
Evaluations were conducted within the experts and NWRI based on discussions and deliberations
by the expert panel. Thereby, assessment and recommendations for RAPID techniques are as
follows:105
[Technical evaluation and challenges].
⚫ Sampling
The performance of primary precipitation tank, secondary processes, tertiary treatments,
membrane filtration (MF membrane, UF membrane, MBR, RO membrane) treatments and
other physicochemical treatments constituting WWTF and AWTF is generally understood from
the concentration behavior of organic and solid substances.
✓ RAPID can be used to measure PMMoV concentrations by sampling inflow and outflow
sites of different water treatment systems with similar concepts, and the concentration
differences can be assessed as removal rates (performance) of water treatment systems.
✓ In sampling, the facilities are not limited to being affected by variations in weather
conditions and external environmental factors. Therefore, the sampling system should
be set with due consideration to the specific design conditions and limiting factors of the
end-user.
105 Independent Advisory Panel Report (NWRI, 2020)

- 128 -
✓ Develop procedures and measures that allow continuous and stable sampling of
microorganism-derived contamination and events that can be challenging to perform on-
going operations that can interfere with RAPID sampling.
⚫ Sample Concentration for Microbial Recovery
✓ The process of concentrating and recovering viruses and other microorganisms of
interest should be performed accurately and constitutively regardless of the end-user
skill or experience and should preferably be automated.
✓ Automation is set and implemented as an independent topic so as not to be a hindrance
for basic investigations and engineering improvements related to RAPID.
✓ For quantitative or semi-quantitative detection, the detection sensitivity and the
detection of an alerting signal corresponding to the LRV decision to be tested are set. In
setting the water content of an enriched sample, RAPID should emphasize the effects of
on-line and quasi-real-time measurements and determine the volume of enriched water
in the context of practical conditions, such as the time required for sampling.
✓ Concentrations of viruses recovered by enrichment are of concern for water quality
conditions that inhibit analysis and their variations.
✓ Different water quality conditions and water treatment systems are likely to be
influenced by sampling site-specific conditions, including time-varying water quality
loads. The LRV of water treatment systems needs to be calculated by establishing a
calibration procedure that can flexibly respond to such variability factors affecting virus
enrichment recovery.
⚫ Nucleic acid extraction
✓ High-temperature high-pressure nucleic acid extraction is superior to other techniques
present in the market and may be applicable to other microorganisms such as
Cryptosporidium and Giardia.
✓ Yokogawa should provide data and reports that have been compared and verified by the
same method used in RAPID and other methods and should be widely recognized.
✓ To highlight the lack of inhibition and effect on any microorganism of any species, it
should be demonstrated that recovery of nucleic acid extraction is possible using
microorganisms with tough and less damaging cell walls or spores referred in the
literature, etc.

- 129 -
⚫ Detection
For IPR/DPR applications in California, a considerable amount of proof-of-concept
information is required and verified by the Council, and the DDW is approved for
compliance with the law before the DDW is applied to the implementation of the DDW. The
following verification methods were recommended:
✓ Given that RAPID has a good performance in detecting E. coli in the food field, other
commonly applied E. coli detection and quantification techniques in WTFs, WWTF, and
AWTF will be used to validate RAPID versus validation in demonstration experiments
of reclaimed water.
✓ By the time SWB certification is reached, proof-of-concept is conducted at multiple
institutions and high reproducibility is asked.
✓ The expert panel supports the assessment of RAPID compared with the results
quantified by qPCR and that the third party of the University of Arizona and the
University of Tokyo was responsible for its assessment.
✓ In California, the reliance on bacteriophage MS2(MS2 as a surrogate indicator for
enteroviruses makes it easier for RAPID to understand and endorse by the deliberators
and actors of IPR/DPR project if it is tested in addition to a PMMoV with a unique
shape.
⚫ Quantification of microorganisms
✓ The performance assessment of water treatment systems using PMMoV is meaningful,
but other microbial indicators are added at the same time as PMMoV.
✓ The expert panel endorses proposing quantifying PMMoV by incorporating the most
probable number method into RAPID counting and hopes to refine the relevant
techniques.
✓ Quantitative information on other microorganisms capable of measuring RAPID is
measured by offline qPCR to compare the quantitative results and enrich the
information.
Although there is a need to proceed with the above technical challenges and verification of
RAPID measurements through data accumulation, the Expert Committee supported Yokogawa's
ability to assess the removal rate (treatment performance) of water treatment systems by applying
Yokogawa's extraction and signaling array probe technologies related to nucleic acid detections, as
well as RAPID's application technologies to quantitative measurement.

- 130 -
[Effects of technology, societal benefits].
⚫ Time required to ensure the safety of water quality in water treatment systems
For IPR operators who rely on environmental buffers such as groundwater aquifers and
reservoirs for water quality stability of discharged water, the required time to ensure water
quality safety of water treatment systems becomes a more important concept.
California has a minimum set time of 2 months for hydrological residence of discharged
water in reservoirs regulated by the IPR SWA. In addition, IPR projects that reduce the
hydrological residence time by more than two months may also be approved for IPR
operators in California given that it is not always easy to obtain a place for environmental
buffers that meets the required specifications.
Some operators consider replacing the DPR business because they cannot rely on
environmental buffers that do not have the original functions of adequate dilution or self-
purification in the IPR business.
In the DPR project, discharged water from AWTF will be transported to a treatment plant,
but the discharged water will be retained in a reservoir of trunk or artificial structures to
ensure the safety of the water quality of the discharged water before being transported.
Therefore, a reduction in the time required to be determined to be safe before water is
delivered to a treatment plant will directly reduce the ability of the structure to be stored and
will contribute to a reduction in construction costs.
It is ideal that the time required to ensure the safety of the treated water in a water
treatment system corresponds to the hydrological residence time when the quality of the
treated water is concerned, and that the performance of the water treatment system and the
quality of the treated water can be assessed within the same time period.
Many tap water, sewage, and IPR operators are not uniquely equipped with equipment or
expert technicians to measure pathogenic microorganisms (norovirus, cryptosporidium), and
sampled water samples are transported to specialist agencies, ideally providing analytical and
reporting feedback for about a week.
However, in fact, there are only a limited number of specialized analytical institutions that
can handle the above-mentioned measurements, and it is common to take at least one month.
Technologies that can rapidly quantify pathogenic microorganisms in these situations will
appeal to the market.
The expert panel refers to market backgrounds and states that refinement and expectations
of RAPID technologies are as follows:

- 131 -
✓ In the current situation where it takes days from sampling to detection, if the required
time is reduced to 24 h, 12 h, 6 h and 1 h, the value of RAPID is evaluated higher in
markets.
✓ Attempts to shorten water quality assessment may lead to innovations in water quality
control of treated water released from AWTF to groundwater recharge, etc.
✓ For both IPR/DPR operators, RAPID will be a technique to assess the predetermined
performance of water treatment systems responsible for mechanical water quality
detoxification and to ensure confidence in the system.
✓ This effect mitigates the technical specification of water treatment systems that
constitute AWTF that has been required by LRV credit.
✓ The deliberators require correlations with the removal performance of pathogenic
microorganisms recognized for validation using PMMoV.
✓ We recommend that information on whether or not PMMoV can serve as a kinetic
indicator for pathogenic microorganisms be investigated in different water treatment
systems and their treatment processes in WWTF and AWTF.
Water quality control methods using RAPID measurements are expected to facilitate the
optimization of treatment processes that constitute SWA-compliant IPR facilities and are
mentioned in more detail in Section 2.3.2.10.
⚫ Qualitative (presence/absence) and quantitative determination
Yokogawa has proposed qualitative judgment that measures PMMoV concentrations in
wastewater water, secondary treated water, tertiary treated water, MF and UF membrane filtrate
water, improves the detection lower limit of RO membrane filtrate water by utilizing
concentration techniques, and exhibits a predetermined warning signal.
For the deliberators and public users, PMMoV and other microbial detection
(presence/absence) products are meaningful from the perspective of ensuring water quality in
water treatment plants, but the expectations for microbial quantification are remarkably high.
The expert panel states that PMMoV of RAPID techniques and the quantitation of other
microorganisms are as follows:
✓ As the relevance of pathogenic microorganisms to alternative indicators is increasingly
understood, quasi-real-time monitoring of PMMoV broadly explains the reduction of
pathogenic microorganisms, and it can be recommended that measurement-informed
water quality microbial risk assessment (QMRA) be conducted, but first of all, efforts
should be focused on the construction of RAPID technologies.

- 132 -
✓ The discussion should be deepened by providing possible concentrated water volume
and cost information in practical facilities.
✓ A direct quantitative measurement of microorganisms should be performed rather than
the quantitative determination and removal rate of organic and inorganic concentrations
as an alternative measure current.
✓ The removal rate of pathogenic microorganisms in water treatment processes measured
directly by quantitative determination may be greater than the current LRV credits given
to the treatment process.
[Hypothesis setting for dissemination].
⚫ Presentation of companies who are likely to apply RAPID's technological developments and
refinements
The coverage of RAPID in California as assessed by the expert panel was analyzed as
follows:
✓ In existing water treatment systems, water quality is managed using water quality
sensors that are widely used in the market, but operators wishing to acquire LRV higher
than LRV credits.
✓ Operators who have not implemented water quality management with alternative
indicators in existing water treatment systems.
✓ Although water quality sensors are established and managed in markets, in order to
improve public health in the societies of the water cycle, they should be compatible with
existing water quality management (the current sensors are able to measure water
quality in real time like TOCs but remain an alternative indicator, so that water quality
management can be more thoroughly implemented through quasi-real-time
microbiometry as in RAPID).
⚫ Trends in Current Monitoring Methods for Water Treatment Systems to Be Considered in
Developing RAPID Technologies
Trends in current monitoring methods indicated by the expert panel are as follows:
✓ Alternative indicators such as EC and TOC have penetrated the market for water quality
management of RO membrane systems, and reliable online sensors have become
popular.
✓ RO membrane systems are also underway to develop alternative instrumentation
techniques to confer LRV credits in line with their actual viral elimination capacity.
✓ On the other hand, since there is no movement to impart LRV credits to MF membrane
systems, UF membrane systems, or simplified filtration systems so far, and because
- 133 -
PMMoV concentrations are easy to measure at high concentrations, we recommend it as
a target for technological developments.
⚫ Microorganisms to be measured
The expert panel assessed the following for indexing PMMoV proposed by Yokogawa:
✓ They support the enrichment of research studies related to PMMoV and perceive it as
valid as an indicator.
✓ On the other hand, in order to obtain support from the understandings and deliberators
of the industry, PMMoV justifies it as an indicator and then proves that RAPID can
measure PMMoV through comprehensive empirical data accumulation.
✓ Variations in PMMoV concentrations in different water treatment processes in different
facilities should be systematically organized.
✓ Considering the future application in the water field, the indexing should be aimed at
microbes other than PMMoV as well, but it can be assessed that the present construction
of RAPID technologies has begun to focus on PMMoV.

- 134 -
2.3.2.10 Optimization of water quality control methods and treatment processes
In the California-based IPR project, the LRVs of pathogenic microorganisms (viruses, Giardia,
and Cryptosporidium) required for AWTF are as shown in Table 43, depending on the diluting
effects of AWTF effluent in the reservoir and the hydrological residence times.Table 41 Pathogen
Reduction Requirement
From a public health perspective, the required hydraulic residence time is set at 60 days (2
months) or more to maintain a safe water quality that contributes to tap water sources by reservoirs
flooding the above discharged water.
The current status of water quality testing for effluents and reservoirs is set at a minimum of this
hydrological residence time, taking into account the practical and practical days required to be
reported after manual collection of the sampling before transportation, analysis and determination of
safety to the laboratory.
The IPR project assumes that DWTF takes water from the reservoir, and if the results of the water
quality test indicate that the LRV required for AWTF has not been achieved, the IPR facilities,
including AWTF, will be stopped operating.
If the California IPR project enables more rapid water quality measurement and information
management, the following effects can be achieved:
⚫ It contributes to the reduction of water storage capacity in facilities with water storage
function.
⚫ Facilitate optimization of related processes and contribute to control of investment in the
equipment.
Table 41 Pathogen Reduction Requirement106
Minimum Dilution in
Reservoir
Minimum Hydraulic
Retention Time in
Reservoir (days)
Minimum LRV for Virus
Giardia
Cryptosporidium
100:1 180 and more
8
7
8
10:1 180 and more
9
8
9
106 60320.308. Pathogenic Microorganism Control (CCR, Register 2018)

- 135 -
100:1 60 to 120
9
8
9
10:1 60 to 120
10
9
10
RAPID is consistent with California market demands because it has the notion of updating
information on pathogenic microorganisms within hours or half a day.
The expert panel convened by NWRI recommends that a 12-month on-site technical validation be
used to investigate the applicability of the technique to future IPR facilities by summarizing RAPID
current knowledge and relevant information and by validating the technique with prototypes that
attempted to refine RAPID measurement.107
The expert panel also suggests that the establishment of a guideline in accordance with regulatory
verification for water treatment systems that apply RAPID is essential for its dissemination in
California, and that a typical validation organization recognized in the province will establish a
water quality control procedure with the following nine items.
1) What behaviour and dynamics of the microorganisms to be measured by RAPID are in the
water treatment systems to be monitored?
⚫ Through a literature review, we will understand the mechanisms by which microorganisms
are removed in water treatment systems and whether RAPID can assess their performance.
2) Establishment of indicator microorganisms and surrogate indicators in validation experiments.
⚫ Relative comparisons between indicator and pathogenic microorganisms and surrogate
indicators will be made through a literature survey and empirical analysis.
⚫ Understand the relationship between indicator microorganisms (e.g., PMMoV) and
microorganisms (e.g., MS2) that are commonly used to grasp the performance of MF-
membrane systems with current knowledge by RAPID measurement.
3) Analysis of Factors Affecting the Removal Performance of Indicator Microorganisms.
⚫ Through empirical analysis, the detection limit (lower limit) of the microbial
concentrations to be measured by RAPID and the factors that take into account detection
inhibitions and sensitivities, etc. will be grasped.
107 Independent Advisory Panel Report (NWRI, 2020)

- 136 -
4) Correlation with conventional performance indicators for water treatment systems.
⚫ Understand correlations with conventional monitoring methods (alternative indicators) that
complement RAPID measurement and water quality information through a literature
survey.
5) Details of validation methods are explained.
6) Details related to data analysis are explained.
7) Limitations and limiting factors of measurement, monitoring and control
⚫ All of the above items capture the following common details through empirical analysis.
✓ Validation of semi-quantitative detections that contribute to the alerting signals
emitted to understand the proper performance and control of water treatment systems
from the presence or absence of microorganisms by RAPID, with the ability to detect
indicator microorganisms.
✓ Validation of quantitative detection corresponding to concentration information for
water supplies and treated water (permeable water in the case of membrane filtration
systems) in water treatment systems.
✓ Since RAPID is a technique for detecting nucleic acids (DNA/RNA) extracted
outside the cells of microorganisms, water treatment systems capable of assessing
performance target removal (physicochemical exclusion) rather than inactivation of
microorganisms, thus covering membrane (MFs, UFs, ROs and MBRs) and filtration
processes. The fraction of these membranes and filtrates (particle size to be excluded)
and the results of RAPID measurements are arranged.
✓ To understand the typical surrogate indicators, such as MS2 and TOCs, and the
proposed updated indicators, and to verify the monitoring effects of water treatment
systems in combination with RAPID measurement.
8) Detailed description of the index microbe-by-microbe LRV quantified in the measurable range
⚫ Through empirical analyses, the removal rate of water treatment systems, as measured by
RAPID measurements of indicator microorganisms, is compared with the removal rate, as
assessed by alternative indicators and pathogenic microorganism (as assessed by culture
usage) concentrations.
9) Need for revalidation and additional validation

- 137 -
⚫ Through empirical analyses, it is verified whether the effects of aging degradation in water
treatment systems can be addressed by responsiveness to indicator microorganisms in
RAPID measurements, if there are concerns that the removal of pathogenic
microorganisms will be reduced.

- 138 -
2.3.3 Promoting measures against RO brine water
2.3.3.1 Background and purpose of interest
In the project feasibility study project for the overseas deployment of high-quality energy
infrastructure in fiscal 2018 (the volume reduction survey of RO brine water in the wastewater
reclamation treatment process using Japanese desalination technology in the United States), which
was a project conducted by the Ministry of Economics and Industries in 2018, a proposal was made
from two perspectives: 1) the volume reduction (ZLD) of RO brine water in the wastewater
reclamation process using RO membranes and electrodialysis equipment, and 2) the self-contained
type (ZCC) that produced valuable products such as hydrochloric acid (HCl), sodium hydroxide
(NaOH), and sodium hypochlorite (NaClO) from RO brine water and consumed locally without
transporting the chemicals for water treatment from outside, and then conducted a commissioned
survey.108
The unique technical aspect of this project is that the synergistic effect can be expected by
physicochemical desalting process using RO membrane and electrochemical separation synthesis
technique using monovalent ion-selective electrodialysis equipment (mED) and electrolysis
equipment (EL).
By utilizing diluted and concentrated water brought about by electrochemical technology as
appropriate, as well as merely combining the techniques currently available, high recovery rate
operation by RO membrane can be realized, improving the conventional recovery rate and contributing
to further volume reduction of RO brine water.
An overview of the condensed water reuse and volume reduction process incorporating mED and
EL (hereafter, the proposed process) involves the deposition of hardness components by a crystallizer
(CR) that precipitates calcium carbonate components from the concentrated water of low-pressure RO
membrane treatment, then supplying the treated water to the mED for separation into mED-
concentrated water and mED-diluted water containing a large amount of salt without the presence of
polyvalent ions.
This is a process in which the same mED diluted water is fed to a medium pressure RO film
treatment for water recovery, and mED concentrated water is supplied to EL for on-site production of
chemicals such as acid and alkali by electrolysis.
Simulated raw water used for analysis in this project was water quality (TDS:500mg/L, NaCl:
115mg/L, and Ca: 30-40mg/L), representing the U.S. interior. Considering the actual range of water
quality variations and the water-building capacity of the equipment, the analysis ranges combining
108 2018 Survey Report on Project Implementation Potential for Overseas Expansion of High-Quality Energy
Infrastructure (Survey on Reduction of Volume of RO Concentrated Water in Sewage Recycling Process Using Japanese Desalination Technology in the United States) (2019)

- 139 -
Na/Ca proportion of raw water (1.33 or 1.0) and the segregation rate of calcium carbonate components
in CR (50% or 67%) were established.
This Na/Ca ratio and isolation rate in CRs were applied because they are conditions that more
reproduce the real water quality.
Economic estimates in the target areas (around the city of Lino, Nevada) ranged from 0.1$/kWh for
power, 0.9 to 1.8$/lb for chemicals, 0.63 to 6.3 MGD for treated water, and 250 to 1,000mg/L for TDS.
The results confirmed that the years of investment recovery were approximately 10 years and
practicable.
The water treatment processes proposed here are technically novel, and patent applications
(application numbers 2019-162106 and application numbers 2019-162099) and publicization (San
Diego, WateReuse 34th Annual Symposium) were performed.
UNRs (University of Nevada, Rino) and NWII (Nevada Water Innovation Institute comment on the
economics of the case as follows:109
⚫ CAPEX will be assessed courtesy of Competitive (within the extent of the review).
⚫ Although OPEX may be somewhat higher, it may not be worse if the assumption is to obtain
a DPR-equivalent quality of water, given the separate costs of treatment for obtaining
comparable water quality in other processes.
⚫ Sensitivity analyses of CAPEX, OPEX for key parameters are valid, but there is economic
relevance if investment retrieval can be realized in 10 years.
109 UNR, NWRI (2019)

- 140 -
2.3.3.2 WateReuse Symposium of publication of results110
In a WateReuse 34th Annual Symposium lecture in September 2019, which was a specific activity
for publicization, we reported an economic estimation of the proposed process while referring to the
operating conditions of Chino II Desalter facility (see Figure 67), which is being implemented at the
city wastewater treatment plant in Chino, California (treated water capacity 20. 5MGD, see Figure 66).
The city has been promoting Chino Basin Groundwater Recharge Project since 2007, and has
implemented an IPR project in which treated water is pressurized into groundwater and used for
drinking by soil adsorption treatments (SATs), with a treatment size of 18 MGDs.
Subsequent increases in the cost of treatment of RO brine water resulted in the planning of a project
to increase the recovery rate of 83.5% of RO permeate water. This led to the construction of a
desalination facility, Chino Desalter II, and the following projects were initiated (completed in May
2017):
The facility achieves a recovery rate of RO permeate water at 95% (volume reduction of RO brine
water to 5%), and by-product calcium carbonate is used as a valuable product.
Figure 66 Schematic flow of water treatment in Chino City
110WateReuse 34thAnnual Symposium, San Diego (2019)
Low-Pressure RO High-Pressure ROPre-Treatment
Chino Desalter II

- 141 -
Figure 67 Flow of Chino Desalter-II facilities
Pelleted crystallizers (Pellet Softener: PS), precipitation separators (Solids Contact Clarifier: SCC)
and particulate filtration devices (Granular Media Filter: GMF) remove calcium (Ca) ions,
magnesium (Mg) ions and silica (SiO2) from primary RO brine water. Recovery of RO permeate
water increases at 95% and more.
These systems require essential chemicals (alkaline agents such as lime, carbon dioxide). Therefore,
it is a burden on the system operation because the chemical is transported and stored from outside.
As a way to solve this, a proposed process for on-site production of chemicals used in PS, SCC and
GMF by setting up mED and ELs operating using RO brine water as a raw material, as well as for
improving the recovery rate of permeate water by middle pressure RO membrane treatment at the
latter stage, is shown in Figure 68.
2nd -RO potential fouling with either silica or CaCO3
• Silica solubility increases as pH increases.
• CaCO3 solubility increases as pH decreases.
pH 10.5 to 11.5
Less than 0.5 NTU
Depress pH
For Pellet Softener•Lime at 200 mg/L•NaOH at 820 mg/L•Na2CO3 at 125 mg/L
For Clarifier•FeCl3 20 mg/L
66%
34%

- 142 -
Figure 68 Desalination flow with the proposed electrolysis technique
(dashed line area is proposed additional process)
The estimated condition was water volume in 6.3 MGD and water quality in Chino source water
data in Table 44. Since the hardness components were as high as 130mg/L, Na/Ca ratio was 1 or less,
and NaCl concentrations were low to apply the proposed processes, assumptions were made to be
purchased the shortage NaCl. NaCl price was set at 0.2$/lb, the other chemical price (HCl and NaOH)
at 1.35$/lb, and the electrical cost at 0.2$/kWh.
Chemicals produced by the electrolysis apparatus are of low quality because raw water is generated
from water concentrated by RO membranes, but of sufficient quality for the precipitation and cleaning
processes of the intended hardness components (mainly Ca and Mg). The number of years of
investment recovery was about 10 years, and it was confirmed that there was practicability.
Based on the results of the above survey reports, the practicability of the proposed process was
confirmed for secondary treatment water in the United States. Therefore, it was concluded that the
possibility of application based on regional differences in raw water (water quality and water quantity),
power, and pharmaceutical affordability should be widely investigated.
For example, in the U.S. coastal region, higher concentrations of NaCl (≧500mg/L), TDSs
(≧1,000mg/L) were used as treatment water and were estimated to be suitable for the proposed
processes.
P
Pre-RO1 Post-RO1
P
Post-RO2
Pre-RO2SiO2 less than 80 mg/L
100% 85%
15%
10%
95%
5%
RO1 Concentrate
RO2 ConcentrateHardness removal: 99%
Electrolyzer(EL)
Electro-dialysis cell (mED)
NaCl tank
Alkaline
Acid

- 143 -
2.3.3.3 Current RO-membrane systems in OCWD
OCWD initiated the world largest IPR project (GWRS) in 2008 with the aim of pressure injection
of sewage-treated water into the groundwater pulse, thereby preventing groundwater pulse recharge
and salinization. IPR facilities in GWRS have a maximal permeability circulation of 100 MGDs as
designed values.
Secondary treated water by conventional biological treatment is treated with MF membranes (some
of which are replaced by UF membranes pretreated), RO membranes, and advanced oxidation
treatments using hydrogen peroxide and ultraviolet light to enhance safety against chemicals and
pathogenic microorganisms and to a level comparable to that of drinking-water.
It is used as a tap water source to penetrate the groundwater vein, prevent the invasion of seawater,
and to store it in the groundwater vein and to pump water through the well. Figure 69 shows AWTF
of OCWD, but the raw water of the same AWTF is supplied with OCSD secondary treatment water.
The 2018 performance averaged 116.2MGD as MF membrane water supply (although the
standardized throughput was 126MGD, it was less affected than the case-year in which there was a
restoration of pipelines in the plant during the summer period).
Figure 69 Treatment flow introduced by AWTF in OCWD

- 144 -
The objectives and characteristics of the equipment, driving methods that constitute AWTF
associated with the processes proposed in OCWD are noted below.
⚫ MF membrane system:
MF membranes, which are placed as pretreatment for RO membranes, were treated with
116MGD of water in fiscal 2018. The MF membrane water contains as much as 2mg/L of nitrate
nitrogen and chloramine formed by reaction with added sodium hypochlorite (4mg/L). Sodium
hypochlorite addition concentrations range from 9 to 10mg/L because excessive supply of sodium
hypochlorite damages the MF and RO membranes.
Chemical in Table 42 Chemical Use and Price.
⚫ RO membrane system:
Twenty-one skipped RO membrane systems (20 skids operation and one for standby, 5MGD
permeate capacity per per skid) have been established in the facilities, and the water permeated
to RO permeate water has been recovered at 85% from RO feed water.
The RO feed water is supplemented with sulfuric acid and scale inhibitor (Threshhold
Inhibitor: TI) to prevent from forming a scale of RO membranes. The sulfuric acids described in
Table 42 are utilized here.
⚫ Decarbonation unit and addition of slaked lime:
RO feed water is maintained below pH 7.2 to stabilize the demineralization performance by
RO membrane systems, but pH 7.6 is also maintained in RO permeate water due to the
equilibration of the carbonate ions present with bicarbonate ions. Since it is recommended that
the pH of the final treatment water be maintained between 8 and 9 to control corrosion such as
plumbing, the removal (aeration) of residual carbon dioxide after UV-AOP treatment should be
performed. The decarboxylation apparatus has the ability of 72MGD.
Some UV-AOP treated water is diverged, and high-pH is achieved by decarboxylation and
mixed with unbranched water at the previous stage of calcification. It is recommended that the
slaked lime neutralizes the residual carbonic acid components and that the pH of the final treated
water be maintained at about 8.5. The average concentration of slaked lime at this time is 26mg/L.
Total consumption is given in Table 42.
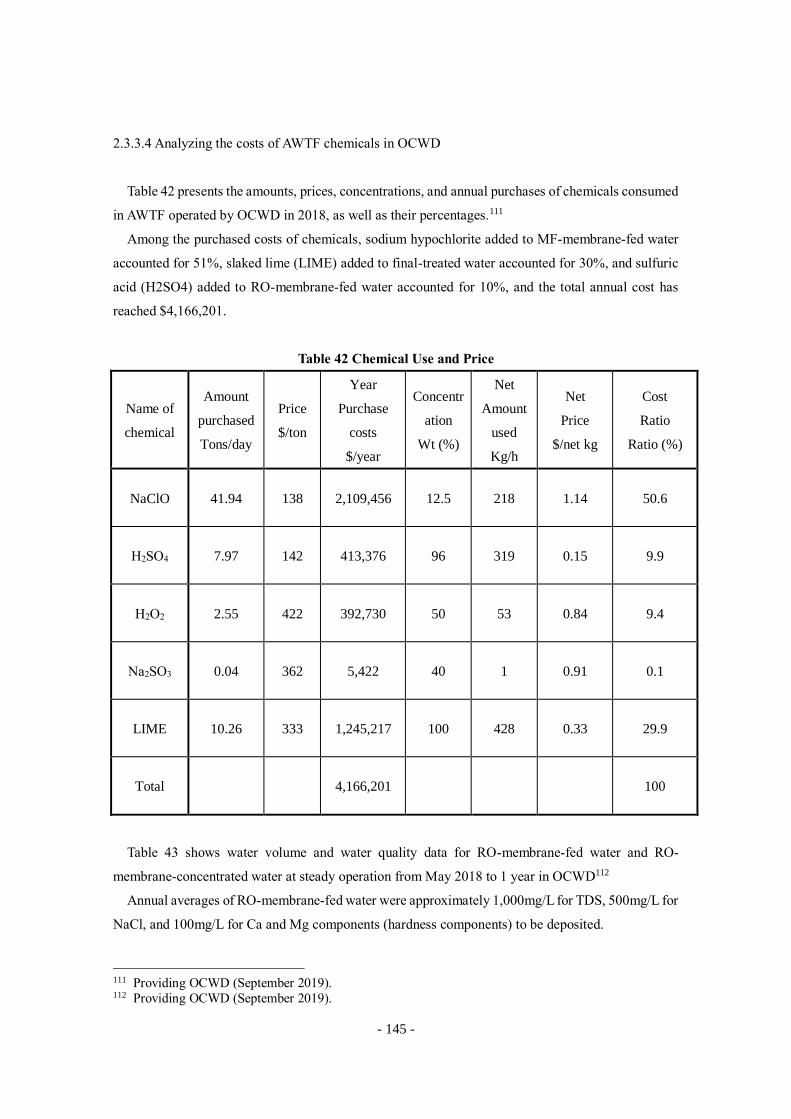
- 145 -
2.3.3.4 Analyzing the costs of AWTF chemicals in OCWD
Table 42 presents the amounts, prices, concentrations, and annual purchases of chemicals consumed
in AWTF operated by OCWD in 2018, as well as their percentages.111
Among the purchased costs of chemicals, sodium hypochlorite added to MF-membrane-fed water
accounted for 51%, slaked lime (LIME) added to final-treated water accounted for 30%, and sulfuric
acid (H2SO4) added to RO-membrane-fed water accounted for 10%, and the total annual cost has
reached $4,166,201.
Table 42 Chemical Use and Price
Name of
chemical
Amount
purchased
Tons/day
Price
$/ton
Year
Purchase
costs
$/year
Concentr
ation
Wt (%)
Net
Amount
used
Kg/h
Net
Price
$/net kg
Cost
Ratio
Ratio (%)
NaClO 41.94 138 2,109,456 12.5 218 1.14 50.6
H2SO4 7.97 142 413,376 96 319 0.15 9.9
H2O2 2.55 422 392,730 50 53 0.84 9.4
Na2SO3 0.04 362 5,422 40 1 0.91 0.1
LIME 10.26 333 1,245,217 100 428 0.33 29.9
Total 4,166,201 100
Table 43 shows water volume and water quality data for RO-membrane-fed water and RO-
membrane-concentrated water at steady operation from May 2018 to 1 year in OCWD112
Annual averages of RO-membrane-fed water were approximately 1,000mg/L for TDS, 500mg/L for
NaCl, and 100mg/L for Ca and Mg components (hardness components) to be deposited.
111 Providing OCWD (September 2019). 112 Providing OCWD (September 2019).

- 146 -
The TDSs of RO-membrane-concentrated water were 6,500mg/L, NaCl concentration was about
3,400mg/L, and the hardness component concentration to be precipitated was about 700mg/L.
Table 43 Water quality data at steady operation in 2018
Water quality items RO membrane feed
(at steady operation)
RO membrane brine water
(at steady operation)
Water volume (m3/h) 921 (stdev *:13) 138 (standard deviation: 2)
Item Concentra
tion
Standard
Deviation
Total
weight
Concentra
tion
Standard
Deviation
Total
weight
Unit
(pH in no dimension) mg/L mg/L kg/h mg/L mg/L kg/h
TOC 7.9 0.2 7 Nd Nd Nd
TDS 1,026 33 945 6,500 291 898
pH 7.2 0.1 7.6 0.1
Ca 78 3.2 72 516 24 71
Mg 26 0.8 24 177 9 24
Na 220 12 202 1,474 88 204
Total Hardness 302 11 278 2,018 89 279
Cl 296 10 272 1,925 104 266
SO4 164 57 151 1,319 125 182
Si 21 0.9 19 131 10 18
K 19 0.9 17 123 5 17
* The standard deviation s was obtained with the square root of variance s2= {}/ n calculated using n
data for a particular substance x.∑ 𝑥𝑛𝑖=1 (i)2 − (∑ 𝑥𝑛
𝑖=1 (i))2/n

- 147 -
Since NaCl concentrations are present at about five times the hardness concentrations, it is estimated
that the amounts of acids and alkalis produced by the proposed process are higher than those required
for the process operation. Table 46 presents a comparison with the water quality under analysis in this
report.Table 44 Water quality comparison of RO membrane
NaCl concentrations at OCWD were about 4-fold higher and TDSs as high as 2-fold higher
compared to Chino, while the hard components of OCWD were lower, so they were assumed to be
suitable for the proposed processes.
Table 44 Water quality comparison of RO membrane feed
Item Unit
Commissioned survey
in fiscal 18
Simulated raw water
Chino raw water OCWD raw
water
pH 7.4 7.4 7.2
Ca mg/L 60 113 78
Mg mg/L 34 17 26
Na mg/L 80 44 220
Total Hardness mg/L 120 351 302
Cl mg/L 150 75 296
SO4 mg/L N.D. N.D. 165
NO3 mg/L N.D. 94 N.D.
SiO2 mg/L 64 32 21
Al mg/L N.D. N.D. 301
TDS mg/L 500 566 1,026

- 148 -
2.3.3.5 Description of the proposed process
The schematic block flow of the proposed process (dashed area) considering the water quality
condition to AWTF of OCWD is shown in Figure 70.
The proposed process uses the same AWTF of RO-membrane-concentrated water as a raw material
and incorporates electrolytic equipment, mED and ELs, to produce the chemicals used on-site. The
proposed process allows replacing the chemical described in the figure (319kg/h of sulfuric acid,
equivalent to 428kg/h of slaked lime as described in Table 42).
If it is not acceptable to inject locally manufactured chemicals after RO membrane treatment, they
may be marketed as valuable. The components, objectives, and effects of the processes proposed in
AWTF are described below.
⚫ Pelleted crystallizer (Pellet Softener: PS):
The alkali solution produced by EL is injected into the RO membrane concentrated water to
remove 99% of the hardness component.
⚫ Precipitation separator (Solids Contact Clarifier: SCC):
Ferric chloride (FeCl3) is added to the treatment solution at the above equipment to facilitate
precipitation and separation of hard components.
⚫ Granular filtration device (Granular Media Filter: GMF):
Acidic solutions produced by ELs are injected into the separating treatment solution, and solid
silica (SiO2) is reduced to 80mg/L or less by filtration.
⚫ mED:
After acidifying the filtrate by injecting an acidic solution produced in the EL, supply it to the
dilution room of the dialyzer, and recover the high concentration and high purity monovalent salt
by 90% in the concentration room. Dilution chamber outlet water is used as raw water for newly
introduced RO membranes as described below.
⚫ EL:
The acid and alkali required for the proposed process are synthesized on-site by electrolysis of
mED-concentrated water as raw water. Salt degradation rates of up to 30% are available. Due to
poor performance due to contamination of impurities, a washing process is regularly required
with acidic solutions generated in the EL.

- 149 -
⚫ A novel RO membrane system:
Treatment of RO membranes with the above-mentioned mED dilution chambers as raw water
can increase water production by 10% and simultaneously decrease RO brine water by 10% in
OCWD IPR facilities.
pH preparations and periodic cleaning processes are required.
The alkalis generated by the proposed processes can be used for solid-liquid separation of hardness
components in pelleted crystallizers (Pellet Softener: PS) and precipitation separators (Solids Contact
Clarifier: SCC), and the precipitated hardness components can be used as an alternative to the slaked
lime used in the later stages, omitting the externally carried sourcing and storage of slaked lime.
If it is not acceptable to inject lime manufactured from RO brine water into the water treatment
process, it can be marketed as a valuable.
The generated acid can be used as an alternative to the silica components in particulate filtration
devices (Granular Media Filter: GMFs) and sulfuric acid used in RO feed water to omit the chemical
from outside transportation sourcing and storage.
Different from the proposed process, the estimation of sodium hypochlorite by electrolysis is also
examined.
At the same time, it is estimated that the additional new RO membrane increases the permeate water
production from 5.0 MGD to 5.6MGD by 0.6MGD (achieving 95% recovery of RO permeate water
in total) and can reduce a considerable amount of RO brine water.

- 150 -
Figure 70 Block-flow diagram of proposed processes in IPR-facilities in OCWD
Return to OSCD Secondary water Return to OSCD
Screen
NaClO
MF
Sulfuric acid
Anti Scaling
RO Cleaning
Concentrate Permeate
Pellet Softener UV-AOP Hydrogen peroxide
Solids Contact Clarifier Hardness Solid Decarbonator
Granular Media Filter RO Flush
SBS
mED
Lime
ED Concentrate ED Dilute solution
EL HCl Newly added RO
NaOH Concentrate
Return to OSCD IPR water

- 151 -
2.3.3.6 Economic estimation of the proposed process
The following economic estimates were performed on a scale of 0.88 MGD (138m3/h) as RO
membrane concentrated water (equivalent to the smallest unit of RO membrane held by OCWD and
equivalent to 5MGD as RO membrane supplied water).
OPEX and CAPEX were eligible to calculate mED and ELs, using $107/$ as an exchange
conversion and $0.0947/kWh as an electric price.
In the mED, the residual fraction of monovalent ions in the dilution chamber was set to 10% and
90% monovalent ions were assumed to move to the concentrating chamber.
The combined CAPEX of mED and EL could be estimated to be 15.8M$, and the combined OPEX
of mED and EL could be estimated to be 1.18M$ (other equipment CAPEX and OPEX were not
included in economic estimates, which associated with increasing water production and reducing the
volume of brine water through RO membrane).
⚫ mED (electrodialyzer):
We asked Astom (Head Office: Nishi-Shimbashi, Minato-ku, Tokyo) to examine the mED
specifications. Using the salinity recovery rate at 90%, the estimates for each species in a single-step
arrangement as mED are as follows:
CAPEX : 5.5M$
OPEX : 0.98 M$
Power consumption (kW) : 1,180kW
Current efficiency : 90%
Other OPEX : Electrodialysis Membrane Exchange (8 Years of Life)
: membrane (CIMS, ACS) 0.1 M$/year
⚫ EL (electrolytic apparatus):
CAPEX : 10.3M$
OPEX (0.05MGD) : 0.20 M$
Power consumption (kW) : 260kW
Current efficiency : 90%
Salt degradation rate : 67%
Other OPEX : Electrodes (3 years of life) 0.04M$/year
Chemicals produced above
Concentrations and quantities of hydrochloric acid produced in ELs are 28g/L (0.8M) and
0.035MGD, and alkaline (predominantly NaOH) are 135g/L (3.4M) and 0.017MGD.

- 152 -
This meets the acid requirement used for hardness and silica removal during the overall process, pH
preparation of RO feed water.
Investment pay-back years
The annual purchases of sulfuric acid and slaked lime in the current process are $1.65 M as shown
in Table 444. This fraction can be replaced by chemicals produced by the proposed process, but as
indicated by “J” in Table 45, OPEX “H” is approximately 0.7M$ higher than the current cost. The
initial investment is pay-back through the operation. Similar estimates were obtained when
manufactured slaked lime was sold instead of using at this process.
Table 45 Economic Estimates of Introduction of mED and EL
CAPEX
EL Capex A 10,316,561 $
mED Capex B 5,512,445 $
Sub Total: A + B C 15,829,006 $
OPEX
EL power cost D 210,703 $/year
EL maintenance cost E 36,845 $/year
mED power cost F 965,780 $/year
mED maintenance cost G 98,437 $/year
Sub Total: D + E + F + G H 1,311,765 $/year
Payback Period
Total Opex in Present system I 601,915 $/year
Difference: I - H J -709,850 $/year
Payback period: C/J Impossible to
return year

- 153 -
2.3.3.7 Examining the possibility of spreading to other regions
The merit of the proposed process increases with higher chemical and lower power affordability.
The current densities of the ELs were estimated as 300 A per ft2 for the years of investment retrieval
obtained when the values shown in Case A and Case B were imputed as power, chemical, and lime
(purchased or marketed) prices that differed from the actual values in OCWD (Table 46).
In order to organize the trial results, we introduced the ratio of the pharmaceutical price to the
power price (pharmaceutical price/power cost) as R, and M, the product of the TDS concentration
(mg/L) and water volume (MGD) of the RO-membrane-supplied water (TDS × Q), as novel
variables.
Figure 71 shows the recovery period for investment relative to R using M as a parameter; with
the increase in R (the higher the chemical price and the lower the power charge), the recovery period
has shortened; with the increase in M, CAPEX has decreased, and the period has shortened.
Table 46 Investment Payback year of the proposed process considering regional power and
chemical prices
Case Power
Price
Chemical
Price R (chemicals/power)
Investment pay-back years
Log (M)
$/kWh $/kg ($/kg)/ ($/kWh) 4 5 6
A 0.1 2.0 20 9.6 6.8 4.8
0.1 1.5 15 15.7 11.1 7.9
0.1 1.0 10 43.6 30.9 21.9
B 0.05 1.5 30 11.2 7.9 5.6
0.05 1.0 20 20.3 14.4 10.2
0.05 0.5 10 118.7 84.0 59.5

- 154 -
Figure 71 Dependence of the reimbursement year on R (ratio to chemical/power price)
Figure 72 shows that there is a negative gradient between R and log(M) because we assumed a
reduction in CAPEX with increasing facility size. The colored ranges indicate that the investment
recovery period of the proposed process is within 10 years and is a valued facility. Chino sites (blue
dots) are R=15, log (M) = 4.1, and are within this scope. OCWD (red dots) is R=3.3, log (M) = 5, and
falls outside this scope.
0
10
20
30
40
50
0 10 20 30 40
456456
R=(Chemical cost/ Electric cost)
Pay
bac
kp
erio
d(y
ear)
log (M)
Case BCase A

- 155 -
Figure 72 Relationship between Price Ratio R and Facility Scale M in terms of arithmetic
Figure 73 shows the relationship line, with M as a parameter and the return on investment of 10 years,
as the relationship between the ratio R to the power price of the chemical price and the power price. It
improves the validity in the range of higher chemical affordability even in the case of higher power
pricing.
0
5
10
15
20
25
30
1 2 3 4 5log M(mg/L・MGD)
R(
$/k
g/(
$/k
Wh
))
Chino
OCWD
Case B
Average
Case A
Payback period <10
Payback period >10

- 156 -
Figure 73 Branch line showing the decade of investment recovery
Based on these relationship diagrams, areas suitable for the establishment of the proposed process
can be selected.
0
5
10
15
20
25
30
35
0 0.05 0.1 0.15 0.2
Electric cost ($/kWh)
R(
$/k
g/($
/kW
h))
log (M)
345
Payback period <10
Payback period >10
Chino
OCWD

- 157 -
2.3.3.8 Summary of RO membrane brine solutions
At the assessment meeting of this survey held in Tokyo (Yokogawa Head Office) on December 10,
2019, the following comments were received from NWRI (National Water Research Institute and
Carollo Engineers regarding its applicability in the U.S.
1. The introduction of the proposed process to OCWD was confirmed to be suitable for the
introduction of the process in Chino, though the calculability could not be found because of the
inexpensive chemical affordability.
2. The LVMWD presumes that the suitability of this process is high due to local characteristics,
and it is important as an economic evaluation object, and more quantitative examination should
be proceeded.
Depending on future design policies, RO brine water must be added to economic estimates in
some regions because it is expensive for management of corrosion and scale measures when long-
distance transport is assumed in the pipeline.
In addition, dumping to the ocean itself may be subject to strict legal regulations, which
ultimately require economic evaluation, including reclamation of solids, recovery of valuable
substances, and reuse, after reducing the volume of concentrated water to the greatest extent
possible.
3. In the event of a challenging disaster such as a stagnant transport of a chemical, the concept of
on-site manufacturing has great merit in terms of risk assessment, and the assertion of value from
this perspective is also important.
4. The quality of chemicals produced from RO brine water is assumed to be inferior to that of
purchased products, and there are limitations in the points of use of the produced chemicals, and
no utilization of RO permeate water and RO membrane process or later is permitted.
5. In the proposed process, it is important to control the quantity and concentration of chemicals
manufactured, and the participation of companies with knowledge in the control technology is
essential.
Thus, when examining the economics of the proposed processes incorporating mED and ELs in the
same way as Chino II Desalter in OCWD, we found that the purchased chemical and power prices and
power prices adopted by OCWD did not extend to the estimated chemical and power prices that are
computable, and we were unable to recognize the validity in the year of introduction cost recovery of
electrolysis facilities.
On the other hand, it was possible to organize the relationship between the power and
pharmaceutical prices required for the investment recovery of the proposed process, and to obtain

- 158 -
effective information for the selection of appropriate target areas in the future.
Although the proposed processes are difficult to apply in critical areas such as OCWD, they can be
applied in areas where the water quality and size functions defined in this report are consistent, as well
as areas where emergencies and issues involving transporting concentrated water become apparent.

- 159 -
3. Basic design of the proposed system
As a basic model of the control system to apply the holistic optimization application, the basic design
of Tapia Water Reclamation Facility in LVMWD along the proposed scenarios was carried out
considering AWTF and the control system in OCWD.
AWTF of OCWD is a facility that produces potable water from WWTF of OCSD. WWTF and
AWTF were examined together from the viewpoint of the whole optimization. The basic model of the
control system that applies the overall optimization application is shown in Figure 74.
Figure 74 Basic model of the holistic optimization application
There are full scale IPR/DPR facilities upgraded from existing non-potable water reclamation
facilities, such as LVMWD. In general concept, the designed AWTF for IPR/DPR receives water from
a tertiary effluent. In the latter case, WWTF and AWTF are collectively referred to as AWTF, and
AWTF may mean facilities for advanced drinking treatment from wastewater treatment, but this
project deals with WWTF and AWTF separately.
In the case of OCWD, the current WWTF operational control is not covered, but it is structured that
OCSD can share key WWTF process-information and monitor operating conditions. In such cases, a
system can be constructed in which the system of the host control system is linked and DDMO is
equipped. Functions are added to each other's monitoring and control system (DCS and SCADA), and
equipment such as blowers and pumps are efficiently controlled by on-site controllers (CNTs: control
stations and PLCs) to apply the whole optimization application.
However, the operation management of facilities owned individually in OCSD and OCWD as
described in "2.3.2 Suggestions for the promotion of digitalization". They have already been promoted
by standardized operating procedures, and are sufficiently highly managed in the current situation, and

- 160 -
there are no expectations for optimization application technology such as DDMO at present.
Based on this situation, the basic design of the system was examined for the case in which AWTF
was newly introduced to a small and currently available WWTF such as LVMWD, which is expected
to be carried out in the early stage toward IPR/DPR, and the case in which the new construction of the
reclaimed water treatment plant including the wastewater treatment plant was carried out.
⚫ AWTF incorporation into an existing WWTF
In the introduction phase for practical application of IPR/DPR, it is assumed that a new AWTF
will be created, as in LVMWD, to receive water from treated water separated by solid-liquid
WWTF (tertiary-treated water) after a pre-existing WWTF.
Since supervised control systems (SCADA, DCS, etc.) are already in operation in WWTF, the
adaptation of the entire optimum application will be a method to make the best use of existing
control systems and add DDMO optimization solutions to the upper layers of existing systems.
Figure 75 shows the basic model at the existing treatment plant.
Figure 75 Existing Basic Models
Most important in realizing the holistic optimization application is the efficient collaboration
between OT controlling on-site equipment and IoT deriving optimal solutions from a number of
information, including various process data, equipment characteristics, environmental data and
operational information.
Rather than optimally operating plants by DDMO alone, the optimal solution calculated by
DDMO is received by control systems such as DCS and SCADA, and the optimal operation can
be achieved by combining it with the automatic control function. Therefore, it is essential that

- 161 -
major equipment such as blowers and pumps currently performed by existing control systems can
be controlled with instructions from the control system.
For existing control systems and on-site devices, there are prerequisites needed to achieve a
holistic optimization application. For example, when a reduction in energy expenditure is required
due to the suppression of airflow rate, such as the proposed here, the blower must be equipped
with an inverter-controlled function and other functions that can adjust airflow rate.
Existing systems (DCS, SCADA) should also have communicative functions to connect with
DDMO. It is necessary to confirm whether existing wastewater treatment plants meet these
prerequisites at the basic design stage and to improve and strengthen functions as necessary.
The potential energy conservation benefits of the full optimal application to existing wastewater
treatment plants are described below with reference to the results of simulations conducted at
Tapia Water Reclamation Facility, LVMWD.
In the simulation result, DDMO was able to optimize a reduction rate of 7.5% in the airflow
rate and a reduction rate of 3.8% in the blower power consumption. The reason for the different
reduction rates is due to blower characteristics, where the airflow rate and blower consumption
power are not necessarily proportional. Currently, the blower has been updated to a new model
with a more linear relationship between airflow rate and blower power consumption, so it is
expected that the reduction rate of power consumption of blowers will be similar to the reduction
rate of blower volume.
In addition, the automatic switching function by the control system expects to provide a 5% to
10% effect in reducing the amount of power through quantification of the amount of sewage inflow,
optimization of returning sludge, sludge subtraction, and response to fail-safety. Therefore, we
speculate reduction effect corresponds to be 15% of power consumption.
As a result, basic design philosophy for the new AWTF incorporate with existing WWTF as
follows:
✓ Improving operational efficiency by applying a holistic optimization application to
maximize the use of existing control systems.
✓ Increasing DDMO to existing systems for a holistic optimization application.
✓ The software function of the existing system is increased, and the efficiency of the
operation control is streamlined by the sophistication of the automatic control function
by the cooperation with DDMO.
✓ Ensure that various instruments are in place for optimization, including the quality of
influent sewage, effluent water quality, water quality in reaction tank, influent water
quality, and airflow rate, with additional measures as needed.

- 162 -
✓ Optimization of DDMO and automatic control of the control system will reduce power
by about 15%.
⚫ Case of constructing a new WWTF and AWTF
In the new construction of AWTF, the entire optimum application and control system according
to the treatment scale are planned in the design. At the design stage, it is necessary to select
equipment that can accommodate various sensors, such as water quality meters and flow meters,
as well as variable speed control functions by inverters, etc. for major equipment, such as blowers.
It is important to design considering the application of the holistic optimization application.
The larger the processing size, the more the series of processing processes, the more
sophisticated and complex control functions are required. However, the larger the size does not
change the basic philosophy and structure of system. Figure 76 shows the basic model of the
system corresponding to the medium size (around 20,000 m3/day capacity).
Figure 76 Basic model of small and medium capacity
Basic concepts for establishing new WWTF and AWTF are as follows:
✓ Selection of on-site equipment and sensors considering the application of the holistic
optimization application is performed during the design phase.
✓ Through the cooperation of DDMO and control systems, the efficiency of operation
control by highly automatic control is attempted.
✓ By optimization function of DDMO and automatic control function of the control
system, etc., the power quantity reduction effectiveness rate of about 20% is achieved
compared with that without the optimization.

- 163 -
Figure 77 shows the basic model for the large-scale (≧100,000 m3/day) system to compare the
differences in the basic model across scales.
Figure 77 Large-scale basic model
With larger treatment capacity, the number of control points increase due to more trains of
treatment systems, and the size of the on-site control system will also increase, but the basic
structure and philosophy of the system are not changed.
⚫ Summary of power reduction effect rate
The effectiveness of reducing the power consumption by the whole system is shown in Table
47, with reference to the simulated results on the power consumption reduction effect by DDMO
in established Tapia water reclamation facilities in LVMWD.
Table 47 Effect of reducing power consumption
DDMO Whole system
Existing 3.8%
(Reference for Tapia Water
Reclamation Facility)
15%
New Construction - 20%

- 164 -

- 165 -
5. Examining and Proposing Finance to Promote Projects in California.
5.1 Overview of funding measures
Governmental funding supports include subsidy and lending, and bonding preference measures. The
following representative funding support systems are reviewed:
➢ Drinking Water State Revolving Fund (DWSRF)
➢ Clean Water State Revolving Fund (CWSRF)
➢ Water Infrastructure Finance and Innovation Act (WIFIA)
➢ Water Recycling Funding Program (WRFP)
➢ Tax-Exempt Bonds (Non-taxable Bonds)
➢ Bureau of Reclamation (BoR) related funding system
➢ Measure W: Subsidy system, etc. funded by asset taxation
We categorized EPA-managed DWSRF, CWSRF, WIFIA, WRFP provided in California in
conjunction with CWSRF, Tax-Exempt Bonds widely used in the municipalities (Non-taxable Bonds),
and the other Bureau of Reclamation related funding scheme, Measure W of LA County creation. The
former can be seen mainly as a lending system and a bond-issued preference system, and the latter as
a subsidy system.
Each of the former EPA lending systems is distinctive. DWSRF for tap water and CWSRF for
wastewater can be used in a wide range of projects. WIFIA is characterized by the flexibility of the
lending condition, such as the ability to combine DWSRF with CWSRF and the setting of a rate that
does not depend on the entity's rating for 5 years of graded reimbursement grades. Tax-Exempt Bonds
is widely used in municipal public services.
On the other hand, the latter has limited availability. BoR-related funding is aimed at demonstrating
technologies, but challenges include the need for self-funding of 50% of applicants, the limitation of
Measure W to LA County, and the fact that many operational methods have not yet been established
since the institution has just been established.
[SRF]
A system in which the state government lends funding secured by grants from the federal
government, state general tax income, state bond issue income, municipal deposits, and provincial
contributions to the development of social capital or industry promotion funded by local
governments, local development companies (including private companies that met designated
conditions) in a low and long-term loans. In particular, Clean Water State Revolving Fund, which
is State Revolving Fund representative, is characterized in re-lends the funds that it has loaned and
collected.

- 166 -
Table 48 Funding Support System (1)
DWSRF CWSRF
Overview ⚫ Founded by the 1996 Revision of
SDWA
⚫ Used in water services
⚫ A retention frame exists.
⚫ Established by the Prevention of
Water Purification Law in 1987
(modified by the Water
Infrastructure Financing and
Innovation Law in 2014)
⚫ Used in wastewater services
Federal ⚫ EPA ⚫ EPA
Major support
measures
⚫ Focus on lending
⚫ Subsidies for small-scale business
entities, etc.
⚫ Focus on lending
⚫ A system that provides additional
grants, such as an exemption
from the principal
Eligibility for
beneficiary
(Subjects)
⚫ Public and private water systems
⚫ Non-profit non-community (non-
community) water systems
⚫ Community
⚫ Private business entity
⚫ Nonprofit body
⚫ Civil organization (Citizen
Groups)
Condition of
the lending
⚫ State Prepares 20% of Funds
⚫ Duration: up to 30 years
⚫ Reimbursement extendable period:
18 months
⚫ Interest 1.6% (2018 average)
⚫ State Prepares 20% of Funds
⚫ Term: up to 30 years
⚫ Interest 1.5% (2018 average)
Results of
lending, etc.
⚫ $38.2 billion (since 1997)
⚫ 14,500 (since 1997)
⚫ $133. 0 billion (since 1987)
⚫ 39,948 (since 1987)
Funding
options
⚫ Lending (lawn)
⚫ Borrowing
⚫ Purchase
⚫ Local Debt Assurance
⚫ Purchases of assurance insurance
for small communities with
difficulty
⚫ Subsidy (grants)
⚫ Principle forgiveness
⚫ Negative interest rate loans
⚫ Lending money
⚫ Purchase or refinancing of debts
⚫ Assurance and insurance
⚫ Assurance of SRF Revenue Debt
⚫ Provision of financial assurance
⚫ Additional subsidy
⚫ Profit gain

- 167 -
Applications ⚫ Improvement of drinking water
treatment
⚫ Repairing water leakage or old
pipes (distribution)
⚫ Improving water supply sources
⚫ Replacement and construction of
water storage tanks
⚫ Other infrastructure projects
needed to protect public health
⚫ Construction of public treatment
facilities
⚫ Astigmatic light source
⚫ National estuarine program project
⚫ Decentralized wastewater
treatment system
⚫ Storm water
⚫ Water conservation, efficiency,
and reuse
⚫ Basin pilot project
⚫ Energy efficiency
⚫ Water reuse
⚫ Public treatment plant security
measures
⚫ Technical support
Table 49 Funding Support System (2)
WIFIA
Overview ⚫ Founded by the 2014 Water Infrastructure Financing and Innovation Act
⚫ Minimum project size exists depending on the size of the target population
Federal ⚫ EPA
Major support
measures
⚫ Loans (mainly)
⚫ Private Equity, Revenue Bonds, Bonds, Grants, SRF
Eligibility for
beneficiary
(Subjects)
⚫ Community, state, and federal entities
⚫ Associations (Partnerships) and JVs
⚫ Company and trust foundation
⚫ Can be combined with DWSRF/CWSRF
Condition of
the lending
⚫ Maximum portion: 49%
⚫ Duration: up to 35 years
⚫ Reimbursement extendable period: 5 years
⚫ Interest: The rate can be reduced (not based on the rating) to the Ministry of
Finance.
Funding
options
⚫ Lending
Applications ⚫ Projects covered by CWSRF despite the public rights provision
⚫ Projects covered by DWSRF

- 168 -
⚫ Energy conservation project for water and wastewater facilities
⚫ Desalination of brackish or seawater, recharge of aquifers, alternative water
supplies, water recycling projects
⚫ Drought prevention, reduction and mitigation projects
⚫ Acquisition of resources that are essential to the project or mitigate the
environmental impact of the project, etc.
Table 50 Funding support system (3)
WRFP Tax-Exempt Bonds
Overview ⚫ Started in January 2007 with the
approval of the Strategic Plan by
California Water Board.
⚫ Collaborate with CWSRF to
support R&D and business
activities.
⚫ Local bonds in which the
recipient benefits are nontaxable
(many local bonds are equivalent
to this)
⚫ A wide range of public operations
besides water supply and
wastewater supply are covered.
Organizations ⚫ California Water Boards ⚫ Internal Revenue Service
Major support
measures
⚫ Low-profit lending
⚫ 35% of the cost of construction,
conditional on up to $1 million
⚫ Non-taxable interest income
⚫ No upper limit of issued
Eligibility for
beneficiary
(Subjects)
⚫ Public water supplier ⚫ Mainly public associations
⚫ Depending on the content, PPP
operators may be permitted.
Applications ⚫ Support R&D and business
related to wastewater and
reclaimed water treatment to
ensure potable water
⚫ Public business including
transportation, etc. in addition to
water and wastewater systems
Business scale ⚫ 36 Conclusion of support
agreement for business
⚫ A total of $1203 million from
CWSRF was provided (until
February 2019).
⚫ Many

- 169 -
Table 51 Funding system (4)
Bureau of Reclamation
Related funding system
Measure W
Overview ⚫ Support demonstrations of
effective technologies for water
resource issues such as drought,
population growth, and
infrastructure aging
⚫ Key words "WaterSMART"
⚫ Taxation of assets in LA county
⚫ Establishment of the system
passed at the Congress of LA
county in November 2018
Federal ⚫ Bureau of Reclamation ⚫ (-)
Major support
measures
⚫ Federal government (Bureau of
Reclamation) supports 50% of
business budgets (applicants out-
of-pocket for 50%)
⚫ Subsidies are considered to be the
mainstay.
Eligibility for
beneficiary
(Subjects)
⚫ Local water supplier or irrigation
water supplier
⚫ For basins (50% of the tax
income)
⚫ For municipalities (40% of tax
income)
⚫ For LA County flooding control
district (LACFCD) (10% of the
tax income)
Applications ⚫ Sustained water resource
management of the basin
⚫ Effective response technology in
drought areas
⚫ Improvement of water and energy
efficiency
⚫ Projects related to flood control
and the use of reclaimed water
(below)
⚫ Large-scale stormwater
utilization facilities in which
multiple cities collaborate
⚫ Retrieval of stormwater and
storage of wastewater in nearby
parks (small scale)
Business scale ⚫ 6 Operator, total $35.3 million
(2019 budget)
⚫ $300 million per year of tax
revenue (on the order of $5 billion
per decade)

- 170 -
5.1. 1 DWSRF (Provincial Water Supply Development Fund)
(1) Overview
It was established by the amendment of SDWA in 1996. The main actors involved are the American
Congress, the Federal Environmental Protection Agency (EPA), and each state. The U.S. Congress
approves financial expenditures for the Water Supply Development Fund. EPAs will provide
capitalization grants to state water supply funding in each state. The state will provide 20% of the
donated capital grant.
State can secure up to 31% of capital grants as a retention frame (Set-Asides). Also, after deducting
the retention frame, the state will deposit it to a dedicated State Water Supply Development Fund with
funding commensurate with capital grants from the EPA.
Funding will be reimbursed by the State's Water Supply Fund, and the state will provide new
funding to another person. These reimbursements and income permit state water supply funding in
each state to revolve over a long period of time.
Each state can provide a variety of types of support, including:
➢ Lending
➢ Borrowing
➢ Purchase
➢ Local Debt Assurance
➢ Purchases of assurance insurance
In addition, the Provincial Water Supply can receive additional subsidy to address the needs of small,
disadvantaged communities. Additional subsidy may include the following:
➢ Grants
➢ Principle forgiveness
➢ Negative interest rate loans
(2) Set-Asides113
Each state has four options that ensure up to 31% of capital grants as a retention frame:
➢ Management and technical assistance (4% of the funds current ratings, $400,000 or one-fifth
greater)
➢ Small-Scale Systems Technology Support (2%)
➢ State program management (10%) and
➢ Regional support and other national programs (15%).
113 EPA (https://www.epa.gov/dwcapacity/use-drinking-water-state-revolving-fund-dwsrf-set-asides)

- 171 -
5.1. 2 CWSRF (State Wastewater Development Fund)114
(1) Overview
CWSRF was created as a funding programme for a wide range of water infrastructure projects,
based on 33U.S. Code§1383, due to the 1987 amendments to the Clean Water Act (CWA). This
program is a strong partnership between EPA and each state, replacing EPA construction subsidy
programs. Countries have the flexibility to funding a range of projects that respond to the most priority
water quality needs. The plan was modified by the 2014 Water Infrastructure Funding Reform Act.
State CWSRF programs combine federal and state funding to provide lending to qualified
beneficiaries for the following purposes:
➢ Construction of municipal wastewater facilities
➢ Control of non-point sources of contamination
➢ Construction of a decentralized wastewater treatment system
➢ Implementation of environmentally friendly infrastructure projects
➢ Estuarine protection
➢ Funding for other water quality improvement projects
(2) Result
Based on federal investments of $45.2 billion, state CWSRF provided $138.0 billion to communities
by 2019, benefiting hundreds of millions of people by providing 41,234 low-interest loans to protect
public health, protect valuable fishery resources, and comply with environmental standards.
114 EPA (https://www.epa.gov/cwsrf)

- 172 -
5.1. 3 WIFIA (Water Infrastructure Funding Reforming Act)115
(1) Overview
The 2014 Water Infrastructure Funding Reform Act (WIFIA) is a federal credence programme
managed by EPAs for eligible water and wastewater infrastructure projects. Local, state, tribal, and
federal agencies, partnerships and joint ventures, corporations and trusts, and other SRF programs are
covered.
WIFIA programme may provide funding for the development and implementation activities of
eligible projects such as:
➢ Projects covered by CWSRF, regardless of public ownership provision
➢ Projects covered by DWSRF
➢ Enhancement of energy efficiency project for water supply and sewerage facilities
➢ Desalination of brackish or seawater; Groundwater recharge; Alternative water supply; Water
recycling project
➢ Drought prevention, reduction and mitigation projects
➢ Acquisition of wealth that is essential to the project or mitigates the environmental impact of the
project
➢ Project submitted based on a combination of projects ensured by a common security pledge or
on a single application by the SRF program
(2) Important function of the program
➢ $20 million, the smallest project size of a large community.
➢ $5 million, the smallest size of a small community project (≦25,000 populations).
➢ 49%: the largest part of the cost of eligible projects available to WIFIA.
➢ The total amount of federal aid should not exceed 80% of the project's eligible cost.
➢ Year 35: Upper limit of the last full-term date after virtually completion.
➢ Five years: the longest time that reimbursement can be postponed after substantial completion of
the project.
➢ The interest rate is equal to or greater than the Treasury bond interest rate on the same maturity
date at the balance sheet date.
➢ The project must be trustworthy and have a dedicated source of income.
➢ NEPA, Davis-Bacon, American Iron and Steel and all other Federal Cross-Sectional Article apply.
115 EPA (https://www.epa.gov/wifia/learn-about-wifia-program#overview)

- 173 -
5.1. 4 Water Recycling Funding Program (WRFP)116
California operationalizes Water Recycling Funding Program (WRFP) to provide water operators
with R&D and project support related to wastewater and reclaimed water treatment to ensure potable-
water. The Clean Water State Revolving Fund (CWSRF) provides loans at a low interest rate of 1%
for a $1 million business. The contract has been signed to support 36 projects involving reclaimed
water by water operators by February 2019, and a total of $1,203 million has been provided by CWSRF.
WRFP also operationalizes support programs for demonstrations using new technologies that
contribute to the drinking of reclaimed water by water operators, allowing up to $35% of the cost of
construction to be introduced and up to $million. These support programs are intended to support
public water operators, but they are active in collaboration with business areas capable of introducing
new technologies and private companies possessing core technologies in the same area.
5.1. 5 Tax-exempt Bonds
Bonds with non-taxing and no upper limit of the issued amount (local) are the equivalent of a
number of long-term municipal bonds. The application is public business including transportation, etc.
besides upper and lower water supply. In principle, it is not covered by public or private business for
profit. However, there are also PABs (Private Activity Bond). However, there are more constraints
than non-taxable public bonds, such as high upper limits for each state, constraints on the content of
the contract, and taxations for some.117
Methods for setting the publication rate118 of public bonds are mainly divided into two types, the
variable rate option and the fixed rate option. Variable rates are associated with lower costs than fixed
rates in terms of past performance. The rate of variation is directly correlated with market indices as
blow:
➢ The London InterBank Offered Rate (LIBOR), or
➢ The Securities Industry and Financial Markets Association (SIFMA) Index
Fixed interest rates are most likely to take the form of tax-exempt revenue bonds (revenue bonds)
for LVMWD and TSD (Triunfo Sanitation District).119 An income bond is issued by restricting the
source of reimbursement to a particular source of income, in contrast to a bond that contains both the
source and the tax income.
116 California Water Board(https://www.waterboards.ca.gov/water_issues/programs/grants_loans/water_recycling/) 117 A Survey Report on PPP Legislation and Operational Status in Major U.S. States (March 2018, Jetro New York Office). 118 Kennedy/Jenks Consultants(2018) 119 Kennedy/Jenks Consultants(2018)

- 174 -
5.1.6 Bureau of Reclamation related funding system
The U.S. Bureau of Reclamation supports verification of effective technologies for solving these
problems by considering concerns about the continued use of water resources, such as wide-area,
seriously interfering, increasing population, and aging social infrastructures in the United States.
In the case of support projects in recent years, "WaterSMART" has been included as a key word and
deals with technical demonstrations for local water operators or irrigation water suppliers in the fields
of "sustained management of water resources in watersheds," "effective response techniques in
drought areas," and "improvement of water and energy efficiencies" in areas where water supply is
highly stressful to the demands.
In both cases, financial support is provided for each public theme, requiring the applicant's own
funding (matching cost) or considerable contribution to 50% of the financial support from the federal
government, up to $1.5 million per event for up to two years, and up to $300,000 for up to three
years.120
The agency also plans to implement a financial support program for a representative water
reclamation project for water workers who are severely stressed in 2019. The support program for the
release of the program in January was $35.3 million for 6 companies in California and $13 million for
3 companies in California for the release in August of the same year (shown below are support
operators, outlines, and support amounts).
120 U.S. Department of Home Affairs Bureau of Development (https://www.usbr.gov/newsroom/newsrelease/detail.cfm?RecordID=64444))

- 175 -
Table 52 Support for Water Businesses in California by the BoR121
Applicant An Overview
Amount of
support
(Dollars)
Publication
of adoption
Period
City of Escondido Development of reclaimed water technology
using RO membranes.
5,000,000 January
2019
City of San Diego Promotion of Pure Water San Diego Program
in the city
9,000,000 〃
City of San Jose Renovation of core infrastructure in South Bay
Water Recycling Phase 1B business
2,545,471 〃
Elsinore Valley
Municipal Water
District
Extension and updating of Horsethief Canyon
Wastewater Reclamation Facility
2,693,455 〃
Hi Desert Water
District
Support for Hi Desert Water District,
Wastewater Treatment and Reclamation
8,668,500 〃
Padre Dam
Municipal
Water District
Support for "Padre Dam Municipal Water
District, East County Advanced Water
Purification Program"
7,392,351 〃
〃 Support for "San Diego Area Water
Reclamation Program"
778,003 August
2019
City of San Diego Support for "San Diego Area Water
Reclamation Program"
10,361,379 〃
Rancho California
Water District
Support for Rancho California Water District
Project
1,727,960 〃
121U.S. Department of Home Affairs Bureau of Development (https://www.usbr.gov/newsroom/newsrelease/detail.cfm?RecordID=64444) and https://www.usbr.gov/newsroom/newsrelease/detail.cfm?RecordID=67463))

- 176 -
5.1.7 Measure W
Measure W was passed in Los Angeles County by the inhabitant vote in November 2018. Measure
H (homelessness issue), Measure A (parks and open space districts), and Measure M (metro/traffic
issues) have already been introduced in the County.
This is a 2.5 cent tax per sf imposed on non-penetrant land plots, equivalent to an average of $87
per household per year.
Tax income is estimated to be $300 million per year. It is a tool to promote The Safe, Clean Water
Program and is used for flooding control and use of reclaimed water.
It is not a financial resource that can be used as a subsidy. Smaller scales can be used for stormwater
recovery and wastewater storage in neighboring parks, and larger scales for stormwater use facilities
in conjunction with multiple cities.
50% of tax revenue will be allocated to regional projects divided by basin, 40% for municipalities
to improve water quality, and the remaining 10% for LA County Flood-Response Area (LACFCD) 122.
At present, the details of its use are under investigation.
The end year of this plot taxation is not defined, and termination is determined by the inhabitant's
vote against it.
122 The Planning Report website: September 3, 2019 (https://www.planningreport.com/2019/09/03/katy-young-yaroslavsky-unpacks-measure-w-implementation-la-s-safe-clean-water-program))

- 177 -
5. Status of Funding for 2 OCWD
5.2.1 Funding as OCWD
It receives subsidies for operating costs from State Revolving Fund, WRFP from the State, WIFIA
from the federal government, Metropolitan Water District of Southern California.123
(1) State Revolving Fund and WRFP
A total of approximately 200 million dollars of low-interest was received. Rates are as low as 2%
compared to 4% (at least 3%) of community rates. Although the reimbursement period is relatively
long, ranging from 21 to 30 years, public water projects have generally been lent for more than 20
years.
The validity of the business is emphasized in order to obtain the money, but there is no quantitative
judgment standard. Water, power, etc. are lifelines and should not be considered by themselves.
Since highly treated reclaimed water is used for groundwater reclamation, reclaimed water plants
are being operated. However, active research and demonstration are being developed for technologies
that contribute to future expansion and further improvement of treatment efficiencies. Funding from
WRFP has been supported by more than 10 demonstration projects with private companies and
universities.
(2) WIFIA
The federal government has also received low-profit funding from WIFIA. Its use includes
restoration of facilities. This is approved by Congress on a yearly basis, and it is undetermined whether
the future will continue to receive low-profit money.124
(3) Subsidy for operational costs
A grant of $30 million for operational costs has been obtained from Metropolitan Water District of
Southern California. This corresponds to a part of MWD LRP Subsidy of the 2018/2019 business costs
described below.
123 Hearing to OCWD (2019) 124 Hearing to OCWD (2019)
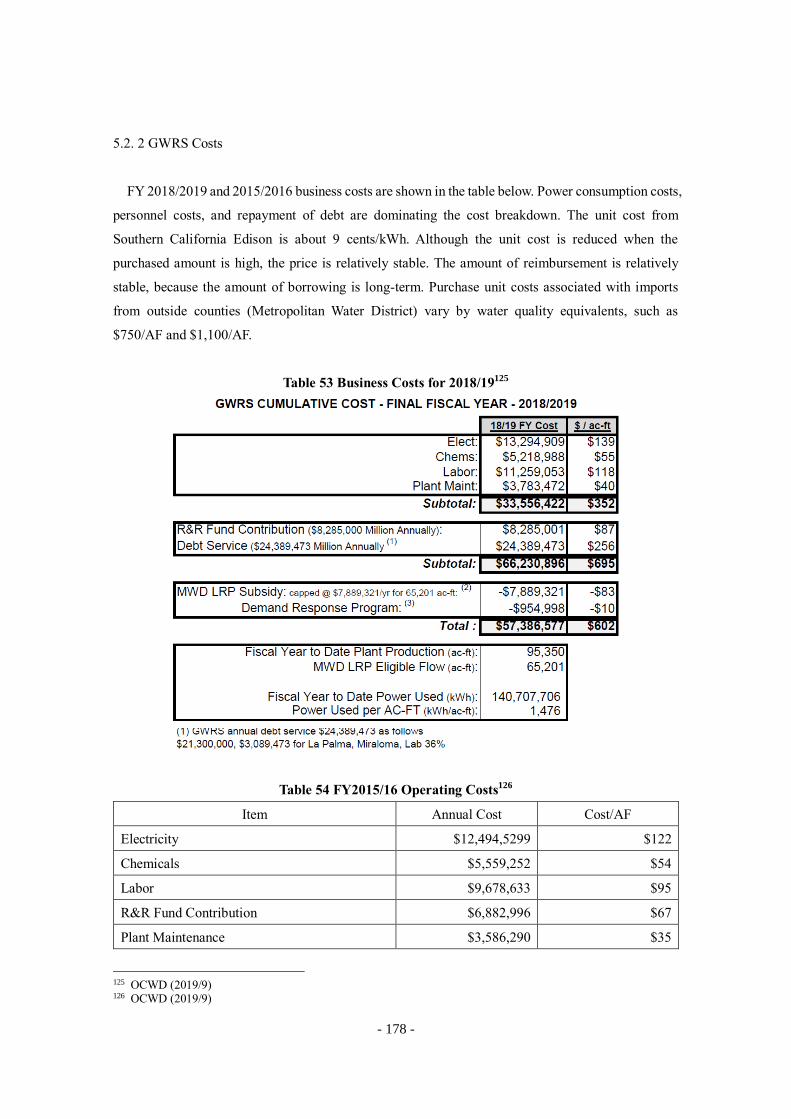
- 178 -
5.2. 2 GWRS Costs
FY 2018/2019 and 2015/2016 business costs are shown in the table below. Power consumption costs,
personnel costs, and repayment of debt are dominating the cost breakdown. The unit cost from
Southern California Edison is about 9 cents/kWh. Although the unit cost is reduced when the
purchased amount is high, the price is relatively stable. The amount of reimbursement is relatively
stable, because the amount of borrowing is long-term. Purchase unit costs associated with imports
from outside counties (Metropolitan Water District) vary by water quality equivalents, such as
$750/AF and $1,100/AF.
Table 53 Business Costs for 2018/19125
Table 54 FY2015/16 Operating Costs126
Item Annual Cost Cost/AF
Electricity $12,494,5299 $122
Chemicals $5,559,252 $54
Labor $9,678,633 $95
R&R Fund Contribution $6,882,996 $67
Plant Maintenance $3,586,290 $35
125 OCWD (2019/9) 126 OCWD (2019/9)

- 179 -
Debt Service $20,700,000 $203
Sub Total $58,901,700 $577
Operating Subsidies
(Including Demand Response and MWD LRP)
($9,469,996) ($93)
Total Net Cost* $49,431,704 $484/af
(0.39/m3)
* Based on a production of 102,138 acre foot Power used is 1,385 kWh/acre foot
5.3 Current Status of Funding for LVMWD.
Focusing on Pure Water Project, an IPR-based project in LVMWD, we explain the assumed funding
methods and the cost structure of the project.
5.3.1 Assumed funding methods
Procurement costs are lower in the order of grant, state revolving fund (SRF), and Tax-Exempt
Bonds, as shown in the figure below. As of 2018, among the total project costs of 130 million USD,
we were considering funding structure with 25% subsidy, 45% rotational funding, and 30% nontaxing
bonding; however, the potential for subsidy to be obtained from Measure W budgets is emerging and
we wish to use them. Forty percent of the budget can be used for wastewater treatment in addition to
stormwater control. The grant upper limit of the Department of Internal Affairs pioneering bureau is
25% of the project cost.127
SRF is also a long-term, low-profit funding (1% rate, 30-year lending period) and is the preferred
funding method after subsidy. Although the commonly issued rates of bonding depend on the financial
status of the entity, LVMWD is considered to be non-defaulted and to result in lower sourcing costs.
In the case of WIFIA (federal), it can be borrowed up to 100% of business costs, but it is less
prioritized than nontaxing bonds in terms of sourcing costs.
When developing a funding plan, it is believed that because the operation actor is public, it would
be necessary to set a fee for use to a degree that does not result in red letters, without the need for
financial benchmarks related to operations such as IRR.128
127 Hearing to LVMWD 128 Hearing to LVMWD

- 180 -
Figure 78 Funding costs estimated (PFM (2016))129
5.3.2 Project cost structure
Pure Water Project investments are $118 million in Site A and $123 million in Site F.
Implementation of the project would result in a reduction of $1,488/AF in the costs of externally
purchased water (red boxed area in the table below), although facility investment and operation are
expensive. Kennedy/Jenks Consultants (2018) is closer to the current outlook than PFM (2016). Eighty
percent of users (rent payer) understood the use of reclaimed water, and there is a prospect that the
increase in charges associated with implementing IPR projects (2-7%) is likely to be recognized.130
The energy conservation effects by DDMO is expected to reduce operational costs and improve the
economics of the project.
129 Kennedy/Jenks Consultants (2018) 130 Hearing to LVMWD (2019)

- 181 -
Table 55 Economic evaluation of projects131
131 Kennedy/Jenks Consultants (2018)

- 182 -
5. 4 OCWD and LVMWD Financing Proposals
5.4.1 Incorporation into the California DPR Master Plan
The short-term goal of OCWD and LVMWD projects covered in this study is to demonstrate
Japanese technologies, that create opportunity to incorporate into the DPR master plan in 2023.
LVMWD has acquired budgets for demonstration projects related to Pure Water Project. In addition,
the South California Metropolitan Water Public has a demonstration of new technology and concepts
or a budget for PoC, suggesting that it aims to commission them.
OCWD does not have visible budget option for demonstration currently, suggestions and
recommendations for obtaining WaterSMART budgets for Bureau of Reclamation, as well as utilizing
the funding of NEDO demonstration projects, are considered as options. After the demonstration
project, it will be the stage to be project phase for OCWD and LVMWD. According to investigation
to each entity, a public business does not pursue the benefits in prospect. It is considered that each
entity will investigate the use of the funding systems of the United States and California, rather than
funding from the private sector. Therefore, it becomes a role of the Japan side that the cost reduction
effect by both projects is shown in the project planning phase.
Figure 79 Project Planning for Pure Water Project 16

- 183 -
5.4.2 Finance when market size expands
The successful incorporation of this project into the Master Plan will lead to broad participation of
Japanese companies, and further development of the project into a large-scale IPR/DPR project itself
will require a new framework. For example, in the high-speed railway business in Texas, U.S.A., Japan
Transport and Urban Development Support Organization (JOIN) provides funding through SPVs
established jointly with the Japan Bank for International Cooperation.

- 184 -
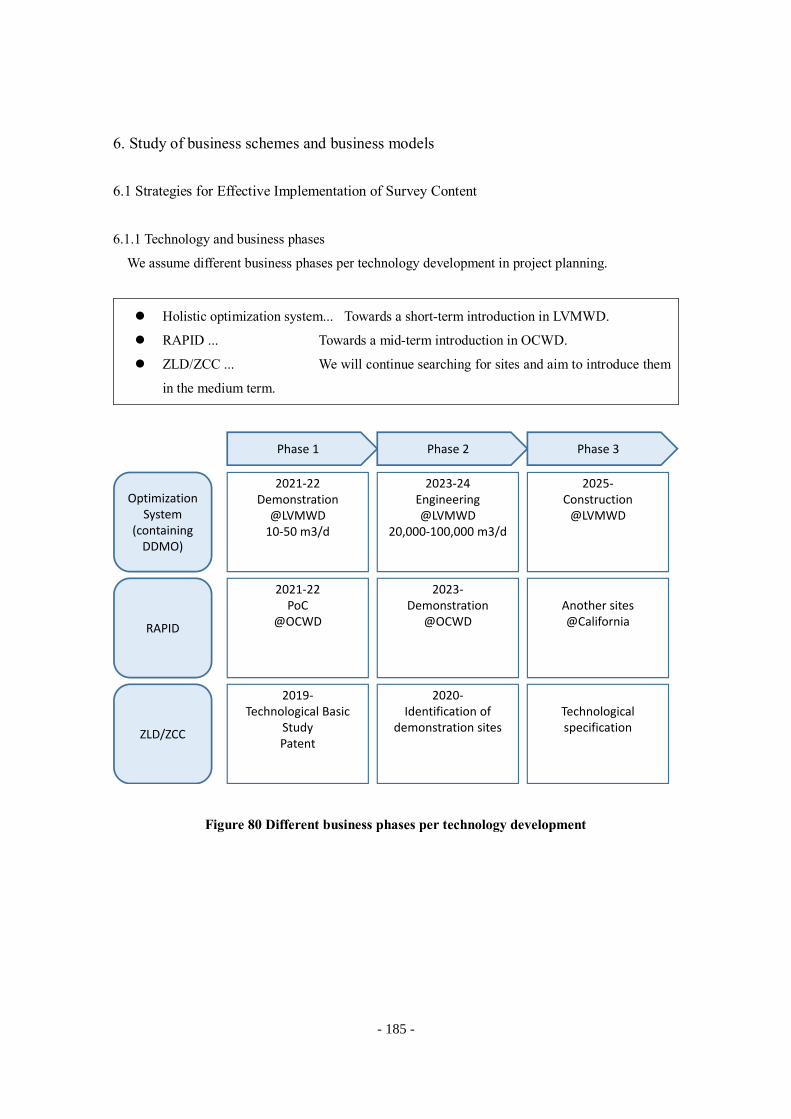
- 185 -
6. Study of business schemes and business models
6.1 Strategies for Effective Implementation of Survey Content
6.1.1 Technology and business phases
We assume different business phases per technology development in project planning.
⚫ Holistic optimization system... Towards a short-term introduction in LVMWD.
⚫ RAPID ... Towards a mid-term introduction in OCWD.
⚫ ZLD/ZCC ... We will continue searching for sites and aim to introduce them
in the medium term.
Figure 80 Different business phases per technology development
Phase 1 Phase 2 Phase 3
Optimization System
(containing DDMO)
RAPID
ZLD/ZCC
2021-22Demonstration
@LVMWD10-50 m3/d
2021-22PoC
@OCWD
2019-Technological Basic
StudyPatent
2023-24Engineering@LVMWD
20,000-100,000 m3/d
2023-Demonstration
@OCWD
2020-Identification of
demonstration sites
2025-Construction
@LVMWD
Another sites@California
Technological specification

- 186 -
6.1.2 Short-term introduction project
For the system of the entire optimum application including DDMO, the following project formation
is assumed in LVMWD.
Table 56 Holistic optimization system in phases
Phase Period Implementation details Remarks
Phase 1 2021-22 Demonstration project
10-50 m3/day
Continuation of the demonstration
project (2018-20) for the new IPR project
by Pure Water Project
Phase 2 2023-24 Design
20,000-100,000 m3/day
Phase 3 2025- Introduction
Assuming the introduction of systems
into the new IPR business Pure Water
Project
In LVMWD, as a project to increase source water by SWA (Surface Water Augmentation) and use
for potable water production, the IPR project by Pure Water Project is under way to realize. It is
desirable to realize holistic optimization system in the project, proceed in a framework of the project
roadmap. The framework of the project roadmap is organized and shared as follows:
Table 57 Roadmap for commercialization of the IPR project Pure Water Project
Current situation Timing of implementation
Demonstration project Ongoing 2018-20
Pipeline, etc. Before design 2020-22 (Design)
2026-28 (Construction)
Facilities and facilities 〃 2020-23 (Design)
2025-29 (Construction)
2029-30 (pilot operation)
Approval/Regulatory Response Before
acquisition
2020-24 (acquired for construction)
2029-30 (obtained for operation)
Public Outreach/education Ongoing 2019-30 (Including public release
demonstration results)
In contrast, it is assumed that the introduction of the holistic optimization system will be coordinated
in each phase. Therefore, discussions with LVMWD and others will be repeated after completion of
this survey.

- 187 -
Figure 81 "Pure Water Project" using concept of holistically optimal systems132
Demonstration of the introduction of the holistic optimization system at existing facilities (Tapia
wastewater treatment plant) and new reclaimed water treatment plants will be conducted. Consider the
use of MWD (Southern California Metropolitan Water Public) grants as public funding as well as
LVMWD self-funding for demonstration projects.
For commercial operations, measures from the perspective of licensing and regulatory responses
and public outreach as well as Pure Water Project are required. The points are shown below.
Table 58 Demonstration points to regulatory authorities133
1 ⚫ Measures to remove pathogenic microorganisms (real-time, total)
⚫ Identification of substantive elements (techniques, application conditions, etc.)
⚫ Time course analysis of problem points, modification points, and unexpected results
2 ⚫ Other measures to remove water quality items (TOC, TDS, nitrogen, etc.) (real-time,
total)
⚫ Time course analysis of problem points, modification points, and unexpected results
3 ⚫ Monitoring of basic parameters of operation (membrane flux, input of chemicals, UV
treatment, etc.)
4 ⚫ Summarizing and updating various data
132 Adapted from Kennedy/Jenks Consultants "Final Draft: Pure Water Project Las Virgenes-Triunfo Joint Powers Authority Title XVI Feasibility Study (2018) 133 Carollo Engineers
Pu
re W
ater
Pro
ject
Optimization system Demonstration Design ConstructionContinuation

- 188 -
Table 59 Points of public outreach134
1 ⚫ Constant public health and safety bulletins using online monitors
2 ⚫ Continuous presentation of the appearance of treated water (TDS, etc.)
3 ⚫ Posting energy and costs
4 ⚫ Periodic updates of the results of water quality measurements over a wide area
6.1.3 Medium-term introduction project
For the introduction of RAPID, PoC (proof-of-concept) will be conducted as Phase 1 to confirm the
technical effectiveness of PoC. The transition to the demonstration project is examined according to
the result.
As for ZLD (Zero Liquid Discharge)/ZCC (Zero Chemicals Charge), which minimizes RO brine
water and manufactures useful chemicals, searches for appropriate sites meet the designated conditions.
It is currently difficult to be commercialized in Los Angeles.
6.2 Implementation system for commercialization
The implementation system for future business strategy is assumed to be as follows:
Table 60 Implementation system for projects
Technology Holistic optimization
system
RAPID ZLD/ZCC
Operator LVMWD OCWD Under exploration
EPC Carollo Engineers Carollo Engineers Carollo Engineers
Core
technology
Yokogawa Yokogawa De Nora Permelec
Institutional
supervision
NWRI NWRI NWRI
Technical
supervision
The University of Tokyo
The University of Arizona
The University of
Nevada
Particularly the key participant roles are as follows:
134 Carollo Engineers

- 189 -
Table 61 Role of each participant
Subject Role
NWRI ⚫ From a scientific point of view, the introduction of technologies
suitable for IPR/DPR projects will be discussed among the typical end-
users (e.g., OCWD) developing IPRs projects and end-users (e.g.,
LVMWD) who will conduct IPR/DPR projects in the future.
⚫ Advise end-users and participants on effective measures to develop
water policies and inhabitants' willingness, taking social conditions
into account, and contribute to the development of the project outline.
Univ. Arizona
Univ. Tokyo
⚫ Share and validate technical concepts from a scientific perspective.
⚫ Provide third-party opinions and recommendations for end users and
NWRI.
Carollo Engineers ⚫ IPR/DPR activities and the development are alien to legal systems,
responsible for end-users, including states or municipalities, or
municipalities, which should be consolidated with demonstrations.
IPR/DPR project owners recognize the Master Plan with specific
budgetary approvals, validate technologies through demonstration and
specify technical conditions.
⚫ Technical supervision shall be provided to end users regarding the
formulation of a master plan and the formulation of specific draft
demonstrations for commercialization.
LVMWD ⚫ In the future, the development of DPRs will also be considered, and
the validity and prospects of DPRs will be evaluated as supporting
technologies for water treatment processes in IPR/DPR projects.
OCWD ⚫ To assess the appropriateness and prospects of advanced IPR projects
that have introduced RAPID in the future, with a view to operating
advanced IPR projects.
⚫ Evaluate technical specification that takes into account operators'
operations and practices as users.
Yokogawa ⚫ The aim is to introduce an advanced control system including the entire
optimum system and RAPID.
De Nora Permelec ⚫ Targeting ZLD/ZCC application of RO brine water.
⚫ Therefore, in addition to continuing the activities of basic
technological investigations, patent applications, and publicization,
searching sites will be conducted.

- 190 -
6.3 Risk analysis and solutions
The risks arising when implementing the following activities are summarized. The specific risk
analysis itself should be conducted at the stage of consolidation of the project plan and the funding
plan in parallel. There are no major risk concerns in the current arrangement.
Risk items are generally broadly categorized into commercial risk, economic risk, and political
risk. The following arrangement is in accordance with the table below.
Table 62 Risk Classification
Political risk Commercial risk Economic risk
⚫ Sanctions risk
⚫ Changes in legislation
⚫ Breach of agreement
⚫ Suitability
⚫ Sponsor
⚫ Artificial
⚫ Authorization
⚫ Technology
⚫ Operation
⚫ Offtake (market)
⚫ Environment
⚫ Force majeure
⚫ Price
⚫ Exchange rate
⚫ Interest
● Political risk
Political risk details and solutions are provided in.
Table 63 Content of political risk and solutions
Classification Contents Reduction and solutions
Change in
law risk
⚫ Risk of a change in the legal
system
⚫ The current IPR regulations by
California and the risks that the DPR
guidelines (2023 schedule) differ from
assumptions need to be kept in mind.
Risk of
violation of
contractual
duties
⚫ In the case of public operations,
there is a risk that the
government agency of the
borrower will delay the
reimbursement.
⚫ Confirm the possibility of state
delinquent debt. However, it has not
been pointed out.
⚫ Consideration of granting government
assurance to public business grants
⚫ Consideration of granting government
assurance to public business off-take

- 191 -
Classification Contents Reduction and solutions
⚫ Generally, neither a budget nor
an offtake agreement is granted
governmental assurance.
agreements (equivalent to the supply
of treated water)
● Commercial risk
Commercial risk details and solutions are provided below.
Table 64 Commercial risk details and solutions
Classification Item Contents Reduction and solutions
Suitability Reducing initial
costs
Detailed CAPEX
was assessed.
⚫ Refinement of application
technology
⚫ Examination of overseas
production (Japanese products)
⚫ Refinement of application
conditions and prior assessment
⚫ Application of Japanese and U.S.
government support measures
To ensure the
return
Detailed OPEX and
business return
assessed.
⚫ Sophistication of cash flow
analysis in line with concrete
financing
Sponsor risk Ability to
perform on the
job
Confirm sponsor
(especially initiative)
investment and
operational
performance.
⚫ LVMWD and OCWD, which are
assumed to be business entities,
have already implemented
commercial operations and
conducted demonstration projects
at the time of introduction of new
technologies, with no concerns.
Funding
capacity
Confirm sponsors'
ratings
(Moody's/S&P or in-
line ratings of the
bank to which they
lend) and credibility
(financial content).
⚫ Confirmation of the financial
situation of the business entity of
the project.
⚫ If ratings and credibility are
insufficient, consider the following
three proposals.
(1) Provision of confidence
supplementation (Letter of

- 192 -
Classification Item Contents Reduction and solutions
Credit, LCs) by banks, parent
companies, etc.
(2) Pre-funding (Equity First) of
funding:
(3) Solidarity assurance
Complementary
assurance
capacity
Confirm the
sponsor's capacity
for complementary
assurance (financial
competence).
⚫ If assurance capacity is insufficient,
consider the following two
proposals.
(1) Presentation of LC
(2) Solidarity assurance
Complementary
risk
Selection of the
contractor
Confirmed the
construction
performance,
credibility of the
contractor, the size of
the company, and the
proportion of the
contract money, etc.
⚫ In the case of large-scale
construction, confirm the risks
associated with the selection of the
contractor.
⚫ This case is not particularly
applicable.
Cost Overrun Confirm whether
there are
construction costs
that are not
committed at the
time of the close of
finance.
Costs and other
upward factors were
investigated.
⚫ Sufficient reserve costs are set
aside.
⚫ Provide sponsored warranty or cost
overrun support.
Delayed
completion
Identify possible
reasons for delay.
⚫ In the case of construction delay, it
is specified to pay for the expected
delayed damage.
⚫ If the reaction is due to
irreducibility or to special
circumstances of the country, the
solutions should be appropriately

- 193 -
Classification Item Contents Reduction and solutions
incorporated into the construction
plan.
Performance not
reached
Ensure definitions of
completion are clear.
⚫ Define the terms for completion.
(1) Physical completion of
reclaimed water facilities and
completion of trial operations.
(2) On-site verification of
completion status by technical
consultant for render jobs.
⚫ Define that the contractor will pay
the project company for loss of
performance.
⚫ Request the sponsor for a complete
construction guarantee.
Licensing risk Approval for
construction of
all facilities
Confirm whether
approval is obtained
or not, and the
possibility of delay.
⚫ The following two drafts should be
considered for reduction/response
measures.
(1) Required licensing and
registration are required for
completion.
(2) Complete delay due to delay in
obtaining approval is responsible
for the contractor.
Technical risk Reliability of
the new
technology and
obsolescence of
the technology
Consider the risks of
obsolete technology
originally planned
without new
technology or
adequate
commercial
experience.
⚫ Request risk sharing by technical
consultants for scanning,
sponsoring, and contractor
assurance (assurance that covers the
performance of business facilities
over a long period of time rather
than routine construction
assurance).
⚫ This project considers novel
combinations of technologies.
Advantages of
technology
By the superiority of
the technology, the
⚫ Targeting speck-in by linking the
benefits of new technologies (e.g.

- 194 -
Classification Item Contents Reduction and solutions
element which can
enjoy is confirmed.
energy conservation) to state
policies.
Environmental
risks
Local
environment-
related law
system
Ensure that
environmental
impact assessment is
approved.
⚫ Confirm the necessity of
environmental impact assessment
in this project (recognized as
unnecessary at present).
Other
environmental
guidelines
Ensure that the
environmental
guidelines of the
financial institution
are met and that they
comply with other
relevant
international
environmental
standards when
receiving financial
support from the
international
financial institution.
⚫ If Japanese exporting money is
applied, it is mandatory to meet the
environmental guideline and to
comply with the Equatorial
Principles (Equator Principles).
⚫ It is recognized that this project
does not apply specifically.
Operational risk Availability of
business
facilities
Confirming the
operating
performance and
know-how of
operators.
⚫ If the operators do not have
adequate performance, confirm the
possibility of support from other
high-performance companies.
Damage insurance for accidents
and disasters during operations is
recommended.
⚫ It is recognized that this project
does not apply specifically.
Cost Cost overrun of
operational costs,
checking whether
there is room for
money to torsion the
costs required for
⚫ Accumulate sufficient preparations
for the operating reserve account.

- 195 -
Classification Item Contents Reduction and solutions
large-scale repairs.
Off-taker risk Off-taker
creditworthiness
Examine the
creditworthiness of
off-taker treated
water.
⚫ Consider adequately that there are
no institutional issues in the supply
of treated water (political risk).
Sales volume
and price
No particular
Raw material
supply risk
- Wastewater supply
stability was
checked.
⚫ Assuming that the amount of
wastewater cannot be fully
secured, we will consider
collecting sponsor assurance and
ensuring the thickness of internal
reserves within the project
company in preparation for future
reductions in production.
Irreversible
force
- Confirmed factors
such as natural
disasters and other
factors that may
cause non-
anticipation.
⚫ 100% coverage (NEXI) for non-
insurance coverage if exported
money is to be applied.
⚫ Consider avoiding sanctions for
maritime insurance upon import

- 196 -
● Economic risk
The details of economic risks and solutions are as follows:
Table 65 Details of economic risks and solutions
Classification Contents Reduction and solutions
Price
fluctuations
risk
Cost overrun of
construction due to
inflation, confirming
reduced coverage of the
detect service for renders at
the time of operation.
⚫ Immobilization of contract money, funding costs,
advisor costs, etc.
⚫ Establishment of safety rates for cost items for
which money cannot be fixed
⚫ Components of fees linked to price fluctuations
Rate
variation risk
The impact of fluctuations
in loan interest rates on
profitability was confirmed.
⚫ Adoption of fixed rates
⚫ Adoption of rate swaps
Change of
change risk
Confirming the effects
associated with exchange
rate variations in funding
currents.
(1) Risk of shortage of
foreign currencies to be
exchanged for domestic
currencies
(2) Risk of not being
approved for exchange
(3) Risk of not being able to
send foreign currents to
other countries
⚫ Use in yen
⚫ The risk is not as worrisome in the U.S. dollars.

- 197 -
7. Estimation of emissions restrictions of energy-derived CO2, environmental
improvement effects, and environmental and social impacts
7.1 Need to reduce energy expenditure
7.1.1 Las Virgenes Water Service (LVMWD)
Within the LA County, the energy expenditure unit associated with the water conduction of imported
water is very high. The energy unit for recharging and pumping imported water into groundwater is
equally high (Table 66, Figure 82, Figure 83). In State Water Project (SWP), water supply from
northern California and Gulf Delta is carried out, and in the process, it has been raised to an altitude
of 2,000 ft to overcome the Tehachapi Mountains in the southern edge of the Sierra Nevada Mountains.
LVMWD relies on imported water (mostly purchased through MWD) for all sources of drinking-
water, and energy strength (energy intensity) is very high as the pumps used in the business operate.
For this reason, the need for energy reduction is higher than in other regions.
Table 66 Energy consumption per unit of water treatment method135136
Technology and water sources Energy consumption
Primary unit
(kWh/AF)
Low High
Ground water Pump water withdrawal 580
Treatment Conventional water treatment (sedimentation,
filtration, etc.)
98 130
Membrane treatment (MF or UF membrane). 326 489
Secondary treatment (excluding nutrient removal) 342 456
Tertiary treatment (including nutrient removal and
filtration)
521 635
Membrane separation activated sludge method
(MBR)
740 2,839
Brackish water desalination 1,010 2,020
Advanced treatment 1,059 1,303
Externally Colorado River 2,004 2,411
135 Mika et al. "LA Sustainable Water Project: Los Angeles City-Wide Overview" (2018) https://escholarship.org/uc/item/4tp3x8g4 136 Erik Porse "Energy Use Effects of Water Conservation and Local Supplies in Los Angeles" (2019) http://www.efc.csus.edu/img/Porse_WCS2019_031919.pdf

- 198 -
conducted water Provincial water business (SWP) 2,581 3,232
Water distribution in the area Vary from region to
region
Desalting of seawater 3,096 4,806
Figure 82 Energy unit for water treatment in Los Angeles County137
Figure 83 Relationship between externally derived water proportion and energy intensity in
Los Angeles County.138
137 Erik Porse, et al. "Energy Use for Urban Water Management by Utilities and Households in Los Angeles" (2019) 138 Erik Porse "Energy Use Effects of Water Conservation and Local Supplies in Los Angeles" (2019) http://www.efc.csus.edu/img/Porse_WCS2019_031919.pdf
LVMWD

- 199 -
Distribution of water by water operators in the area requires pump power, depending on the altitude
and distance raised. For topographical reasons, the energy source for water distribution in LVMWD
business areas is greater than in other areas. Therefore, both in water supply and distribution, the
energetic strength of LVMWD is higher than in other areas.
Figure 84 Distribution of water distribution energy intensity in Los Angeles County.139
Figure 85 Total energy expenditure in Los Angeles County (mean December)140
In addition, raw units of water consumed in LVMWD business areas are consistently considerably
higher (overall, in private households). Water is used especially for irrigation, and therefore, it is
important to control the consumption of water for landscapes in winter.
139 Erik Porse "Energy Use Effects of Water Conservation and Local Supplies in Los Angeles" (2019) http://www.efc.csus.edu/img/Porse_WCS2019_031919.pdf 140 Erik Porse "Energy Use Effects of Water Conservation and Local Supplies in Los Angeles" (2019) http://www.efc.csus.edu/img/Porse_WCS2019_031919.pdf
LVMWD
LVMWD
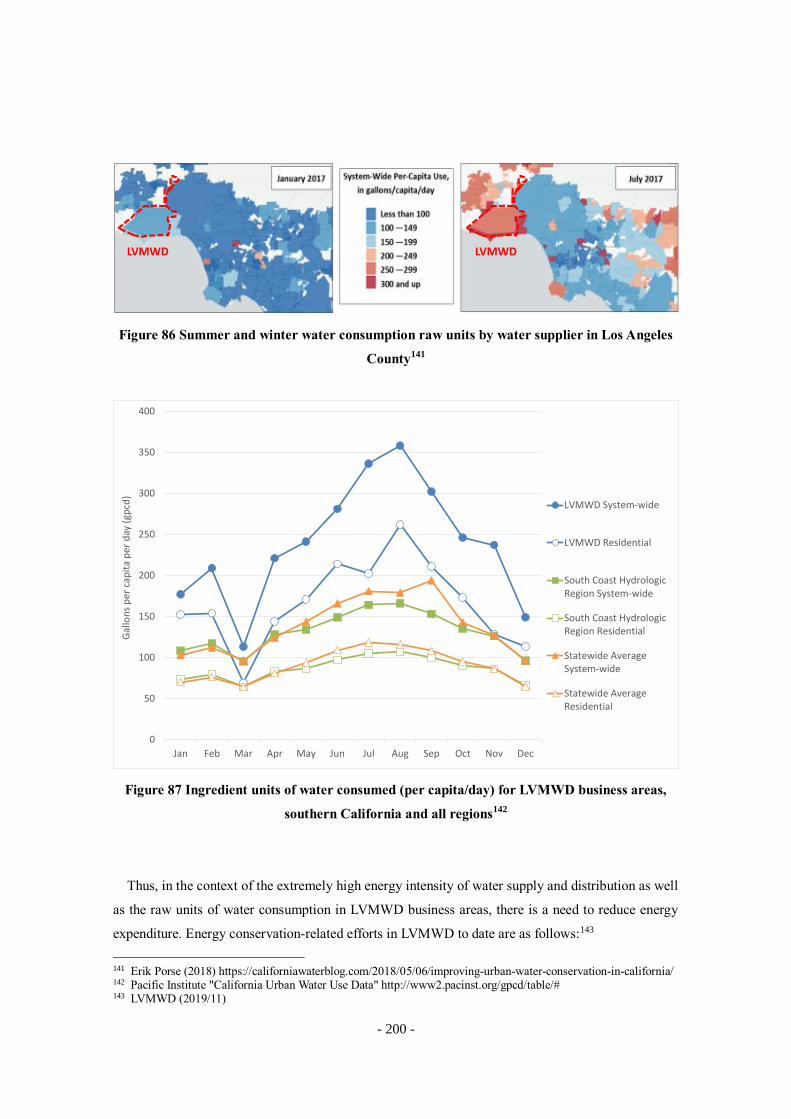
- 200 -
Figure 86 Summer and winter water consumption raw units by water supplier in Los Angeles
County141
Figure 87 Ingredient units of water consumed (per capita/day) for LVMWD business areas,
southern California and all regions142
Thus, in the context of the extremely high energy intensity of water supply and distribution as well
as the raw units of water consumption in LVMWD business areas, there is a need to reduce energy
expenditure. Energy conservation-related efforts in LVMWD to date are as follows:143
141 Erik Porse (2018) https://californiawaterblog.com/2018/05/06/improving-urban-water-conservation-in-california/ 142 Pacific Institute "California Urban Water Use Data" http://www2.pacinst.org/gpcd/table/# 143 LVMWD (2019/11)
LVMWD LVMWD
0
50
100
150
200
250
300
350
400
Jan Feb Mar Apr May Jun Jul Aug Sep Oct Nov Dec
Gal
lon
s p
er c
apit
a p
er d
ay (
gpcd
)
LVMWD System-wide
LVMWD Residential
South Coast HydrologicRegion System-wide
South Coast HydrologicRegion Residential
Statewide AverageSystem-wide
Statewide AverageResidential

- 201 -
⚫ LED lighting was introduced as an effort to reduce the amount of energy used. This reduced
70% of the power used for illumination.
⚫ Solar power 1 MW is purchased from Tesla (using RES-BCT). The unit cost was 10.
5cent/kWh, which was reduced by 3. 5cent per kWh from 14 cent/kWh of the purchasing unit
cost from SCE (Southern California Edison). Additionally, a Borrego solar radiation was
introduced for 3.9 MW.
⚫ In addition, the cost of damage caused by wildfires on the last day was also higher than before
because of being shifted off.
⚫ Generally, 60% of the energy expenditure of water supplies is due to blowers. However, the
energy expenditure dropped by 20% as it was updated to a new blower with low energy
expenditure, resulting in 2 million kWh per year.
⚫ Methane fermentation using sewage sludge as a raw material is carried out to provide power
(by gas engines generators) and heat for fermentation tanks.
⚫ In addition, the energy expenditure of the pumps may be high.
⚫ There is great interest in further energy expenditure reduction in the future.
The realization of energy conservation will directly reduce payments to SCEs, which are purchase
preceptors (purchase unit value: about 14 cents/kWh). Indirectly, the amount of water imported from
outside counties (MWD) can be controlled by the increase in the amount of circulating water in the
water supply area associated with the implementation of IPR.
Figure 88 Business districts in CAISO (The California Independent System Operator,
California144
144 https://www.ferc.gov/market-oversight/mkt-electric/california.asp

- 202 -
7.1.2 Orange District Waterworks Bureau (OCWD)
Regarding OCWD groundwater reclamation project (GWRS: Ground Water Replenishment
System), approximately 40% of the annual expenditures, except for the financial use of money
reimbursement and the receipt of grants, are attributable to purchased power. In addition, 43% of the
total energy expenditure used in the project is power in the RO membrane.
Therefore, OCWD has the intention to make the energy expenditure of RO membrane part
particularly high-efficiency and energy recovery, and to reduce the costs.
Table 67 OCWD Groundwater Recharge Project Cash Flow (2018/19)145
145 OCWD (2019/9)
40%

- 203 -
Figure 89 Energy expenditure in groundwater recharge projects in OCWD, 2017146
Reductions in energy consumption are not mandatory regulations by the federal and state
governments (as discussed by the state, a shift to a policy of increasing renewable energy).
However, the province has a demand-response energy-saving policy for IPP, which has a budget of
$900,000 per year. If energy expenditures are reduced, the IPP will receive a reduction bonus (about
$700,000 per year). Therefore, for OCWD, there are direct energy cost savings and this indirect cost
advantage, which motivates us to make energy expenditure savings.
There are two major IPP (Pacific Gas & Electric, Southern California Edison) in the provinces, and
OCWD purchases electricity from the latter.
Consequently, the realization of energy conservation will directly reduce the payments to SCEs
(purchase cost: approximately 9 cents/kWh). Indirectly, the amount of water imported from outside
counties (MWD) can be controlled by the increase in the amount of circulating water in the water
supply area associated with the implementation of IPR.
146 OCWD (2019/9)
Flow Equalization0%
Screenings0%
Pumping to Percolation
Basin21%
Injection Pumping4%
Lime Post Treatment0%
Decarbonation1%
UV7%
RO43%
MF24%
Flow Equalization Screenings Pumping to Percolation Basin
Injection Pumping Lime Post Treatment Decarbonation
UV RO MF

- 204 -
Figure 90 CAISO (The California Independent System Operator, California)'s division of
business (reprogrammed)147
7.2 Need to reduce CO2 emissions
California has membership in the Western Climate Initiative (WCI: Western Climate Initiative) and
introduced the cap-and-trade system for greenhouse gases within the state in 2014. The target
departments are power, industry, transportation, etc. (450 target sites), and sites performing water and
sewage operations are not subject to direct CO2 reductions.148
On the other hand, under the cap-trade system, carbon constraints on the targeted power generation
facilities are costly and are shifted to retail prices. Therefore, it is considered that the cost of purchased
power that can be reduced by energy conservation is equal to the cost of carbon that the power operator
who has generated the power originally added to the retail.
147 https://www.ferc.gov/market-oversight/mkt-electric/california.asp 148 It is a regional initiative for reducing greenhouse gas emissions in western U.S. states and publishes guidelines on factors that should be met by state systems.

- 205 -
Figure 91 Price-shifting of CO2 costs associated with adherence to the cap-and-trade system
There are the following analysis cases on the addition of carbon costs to power charges.
Table 68 Addition of Carbon-Price 1 USD/t-CO2 to Power Charges in California149
Power line Carbon costs (USD/MWh
North Path 15 (NP15) 0.41
South of Path 15 (SP15) 0.59
Mid-Columbia (Mid-C) 0.41
Palo Verde (PV) 0.15
In California, CO2 allowance prices (2018) averaged $14.91 per t-CO2150, with electricity charges
on the order of 4 USD per MWh. On the other hand, the charges currently purchased by LVMWD and
OCWD from SCEs are approximately $0.09/kWh and $0.14/kWh (= $90/MWh, $140/MWh),
respectively, and it can be assumed that some percent are internalized as carbon costs.
149 C.K.Woo, A.Olson, Y.Chen, J.Moore, N.Schlag, A.Ong, T.Ho "Does California's CO2 price affect wholesale
electricity prices in the Western U.S.A.?" (Energy Policy, Volume 110, November 2017) 150 ICAP
https://icapcarbonaction.com/en/?option=com_etsmap&task=export&format=pdf&layout=list&systems%5B%5D=45
Water District
PPSIndustrial
Facility
CO2Allowance
Payment
Electricity
Payment
CO2reduction
Cap & Trade Program
Passed on the customers

- 206 -
7.3 Estimation of emissions limitation of energy-derived CO2
● Power supply system
In California, large-scale PPS (Power Producer and Supplier) such as PG & E (Pacific Gas &
Electric), SCE (Southern California Edison), and SDG & E (San Diego Gas & Electric) exist as
previously described. Among these, those who provide power to LVMWD and OCWD are SCEs.
However, the power source is not sourced directly by each PPS only in-house.
The U.S. power system is broadly divided into eastern, western, and southern lineages, and it
operates a power system that reflects its own infrastructure, resources, economic industry, and culture.
On the other hand, in the United States, there are many local public companies for PPS (thousands of
companies throughout the country). In addition, there may be a broad-spectrum system operating
agency (RTO/ISO) between large-scale power systems and individual PPSs, providing broad-spectrum
transmission services. Seven such institutions exist in the United States, and in states where they do
not exist, a vertically integrated power company runs a power network.
Figure 92 U.S. broad-spectrum system operation organization (RTO/ISO)151
151 US DOE "Staff Report to the Secretary on Electricity Markets and Reliability August 2017"

- 207 -
Figure 93 Form of power delivery through a broad-spectrum system operation organization
(RTO/ISO)152
This case is connected to a power plant within the western U.S. lineage through a broad-spectrum
system operation organization called the PPS, where the SCE supplies power, and the power source is
CAISO (California Independent System Operator. Because CAISO is insufficient in power supply and
imports power from other regions, the configuration of the source when the SCE generates an electric
supply is not restricted to the state of California.
Figure 94 Power supply and demand balances in different provinces within WECC
(darker red indicates more demand, darker blue indicates more supply)153
152 Overseas Electricity Business (2014) by the Overseas Electricity Research Council 153WECC (https://www.wecc.biz/epubs/StateOfTheInterconnection/Pages/Transmission/Net-Interchange.aspx)
IPP
TO
DO
Retailer
Customer
Own
Grid Operation
Market Operation Market

- 208 -
Power supply structure in California is as follows; only natural gases and nuclear power are fossil
fuels that emit CO2 through combustion.
Table 69 Power source configuration for power generation in California (July 2017)154
Source type Percentage
Natural gas 46.0%
Coal 0.1%
Nuclear power 7.9%
Renewable energy 44.7%
However, the power source structure of SCE is somewhat different. In addition, 34% of the total is
dependent on a power source other than its own, but it is not possible to identify it. Therefore, it is
reasonable to apply the configuration of the in-house power supply in the estimation here.
Table 70 Power source configuration of SCE (2017)155
154 EPA (2019) 155 SCE (https://www.sce.com/sites/default/files/inline-files/2017PCL_0.pdf)

- 209 -
Table 71 Power source configuration of SCE (2017)156
Source type Percentage Percentage (in-house
power supply)
Natural gas 20% 30%
Coal 0% 0%
Nuclear power 6% 9%
Renewable energy (including hydraulic
power)
40% 61%
External imports 34% ―
California announces a plan to increase the proportion of renewable energy to 50% as RPS
(Renewable Portfolio Standard, standards for the proportion of regeneratable energy used) for power
companies and retailers by 2030, and the effects of reducing CO2 emissions associated with reducing
energy expenditure, such as this project, may be smaller than currently.
Figure 95 State-by-State RPS Targets in the United States157
156 SCE (https://www.sce.com/sites/default/files/inline-files/2017PCL_0.pdf) 157 Renewable Energy Institute(2018)、Renewable Energy in the US Power Sector, the Other Revolution

- 210 -
● Estimation of emissions limitation of energy-derived CO2
Methods for assessing CO2 reductions associated with reducing electrical consumption received
from grids differ for CDM (Clean Development Mechanism) and JCM (Joint Crediting Mechanism),
etc., but at this stage, it is reasonable to use a simple operating margin (weighted mean of emission
factors for each fuel consumption).
Emission factors (t-CO2/MWh) of fuels
= Emission factor per calorie (kg-CO2/TJ)/power generation efficiency (%) × 0.0036/1000
Although
Emission rate per calorie (kg-CO2/TJ): Natural gases (56,100), coal (94,600)158
Power generation efficiency in the United States (2011): natural gas (49%), coal (33%)159
Based on the above, a weighted calculation of the percentage of fuels is performed, and the emission
factor to be applied in this case is estimated as follows.
Emission factor in this case
= 56,100 kg-CO2/TJ / 49% * 0.0036/1000 * 30%
= 0.12 t-CO2/MWh
● Results of estimation of emissions limitation of energy-derived CO2 by realizing the present study
This study was conducted in the following three cases as defined by Basic Design of the Proposed
System in Section 3).
Table 72 Base Case Studied in the Survey
Case Existing New Wastewater treatment capacity
1 〇 About 30,000 m3/day (equivalent to
LVMWD)
2 〇 20,000 m3/day or less
3 〇 100,000 m3/day or more
The energy conservation assessed for Case 1 is the contribution by DDMO of the holistic
optimization applications (see 2.3.2.2 Simulation Results). The resulting CO2 reduction effects are
158 IPCC (2006) 159 Ecofys (2014)
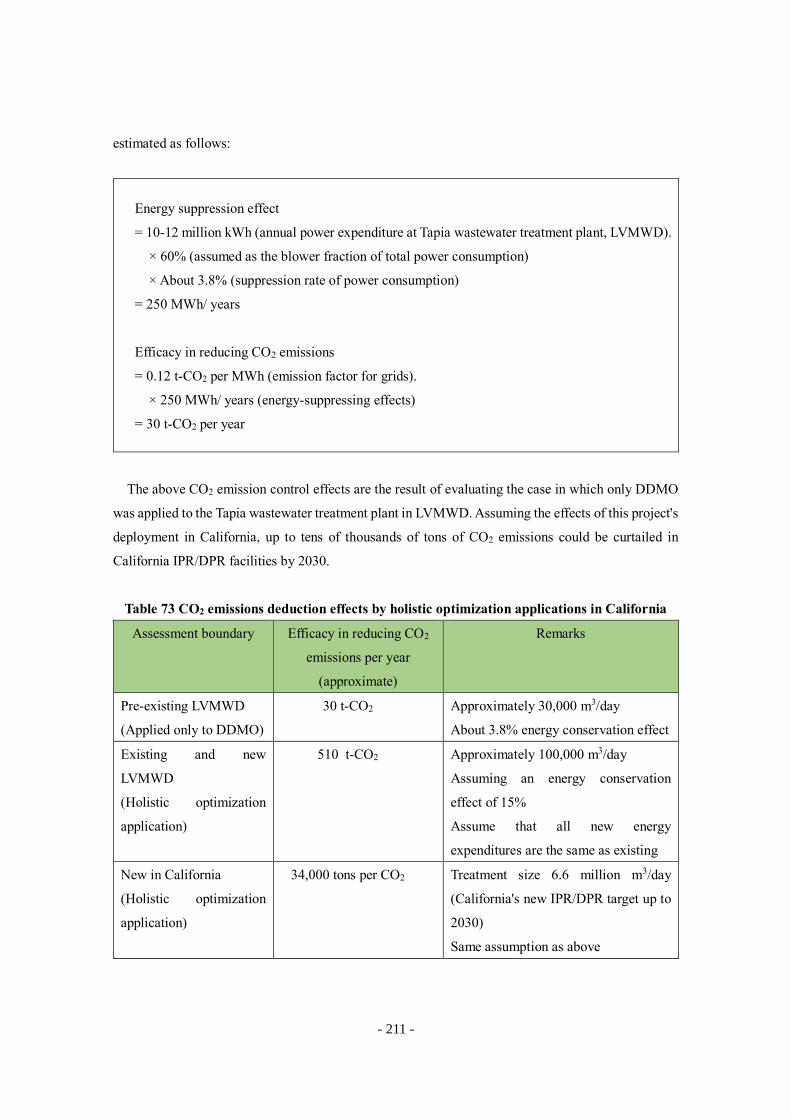
- 211 -
estimated as follows:
Energy suppression effect
= 10-12 million kWh (annual power expenditure at Tapia wastewater treatment plant, LVMWD).
× 60% (assumed as the blower fraction of total power consumption)
× About 3.8% (suppression rate of power consumption)
= 250 MWh/ years
Efficacy in reducing CO2 emissions
= 0.12 t-CO2 per MWh (emission factor for grids).
× 250 MWh/ years (energy-suppressing effects)
= 30 t-CO2 per year
The above CO2 emission control effects are the result of evaluating the case in which only DDMO
was applied to the Tapia wastewater treatment plant in LVMWD. Assuming the effects of this project's
deployment in California, up to tens of thousands of tons of CO2 emissions could be curtailed in
California IPR/DPR facilities by 2030.
Table 73 CO2 emissions deduction effects by holistic optimization applications in California
Assessment boundary Efficacy in reducing CO2
emissions per year
(approximate)
Remarks
Pre-existing LVMWD
(Applied only to DDMO)
30 t-CO2 Approximately 30,000 m3/day
About 3.8% energy conservation effect
Existing and new
LVMWD
(Holistic optimization
application)
510 t-CO2 Approximately 100,000 m3/day
Assuming an energy conservation
effect of 15%
Assume that all new energy
expenditures are the same as existing
New in California
(Holistic optimization
application)
34,000 tons per CO2 Treatment size 6.6 million m3/day
(California's new IPR/DPR target up to
2030)
Same assumption as above

- 212 -
7.4 Other environmental improvement effects, etc.
Since the present case is based on the premise of ensuring the safety of drinking, there is no
environmental effect or environmental improvement effect due to the realization of the business from
the viewpoint of safety.

- 213 -
8. Report Implementation
Organized LVMWD final report meeting
Purpose:
In this project, we reported the effects and business scenarios of IPR projects incorporating DDMO
and RAPID at the Ras Virgenes Water Service in Los Angeles County, California, in which we
examined the commercialization and general-purpose business models of DPR/IPR business and
examined their incorporation into the master plan. We also provided proof-of-concept and proof-of-
technology recommendations for the examination and introduction of these technologies and business
models.
Time: 23 January 2020 (10am - 5pm)
Location: Las Virgenes Water Bureau and Tapia Water Reclamation Facility
Participants:
David Pedersen, Brett Dingman, John Zhao, Eric Schlageter and colleagues (LasVirgenes Aqueduct
Bureau)
Kevin Hardy (National Water Research Institute)
Andrew Salveson (Carollo Engineers)
Tokuhiko Saeki (JETRO Los Angeles Office)
Yasuhiro Matsui, Yasuhito Ishii, Jun Aoki, and Mika Kawata (Yokogawa Electric Co., Ltd.)
Satoshi Saito (Mizuho Information and Research Institute Inc.)
Distribution material (with cover sheet)
⚫ Agenda

- 214 -
⚫ LVMWD survey results
⚫ Introduction of RAPID Technologies and Details of Deliberation by Expert Committees
⚫ Suggestions for proof-of-concept

- 215 -
⚫ In Tapia Wastewater Reclamation Facility operated by LVMWD, annual energy conservation
effects by DDMO were reported based on 2018-19 performance by old blowers (now replaced
by new blowers). This effect is a result of taking into account the regulation of ammonia nitrogen
and nitrate nitrogen emissions and focusing on adjusting the air volume of old blowers.
✓ In response to this discussion, LVMWD assessed the contribution of DDMO to stable water
quality and energetic efficacy and mentioned the application of DDMO to the following
challenges that we wish to solve for the future:
✓ Due to the high efficiency of the new blower, the amount of air is reduced, resulting in a
decrease in water temperature in the activated sludge reactor, which may lead to a poor
nitrification response. Functionality of the activated sludge reactor and further issues
compatible with improved treatment water quality and energy conservation.
✓ The optimum operation of all facilities that will be covered by the sewerage treatment
process following the sewerage treatment in the IPR project conceived by the same water
service bureau in the future.
⚫ Shared the information (listed below) and evaluate the rapid pathogens quantitative detection by
RAPID proposed by Yokogawa. Mainly, this paper introduces the business deliberated in NWRI
expert committee, and shares the trend starting for the improvement of RAPID and the production
of the plot-type.
✓ RAPID prompts the rapid measurement of pathogenic microbial density information by
mechanical water treatment systems from wastewater to drinking in IPR/DPR markets and
the visualization of information related to acute toxicity or detoxification.
✓ The presence or absence of pathogenic microorganisms and their concentrations, which are
measured information by RAPID, are incorporated into DDMO and contribute to the
optimization of water treatment systems.
⚫ Recommendations for a preliminary study were made for demonstration of techniques
incorporating DDMO and RAPID, taking into account Pure Water Project "3.4.1 Incorporation
into the California DPR Master Plan" held by LVMWD.
Related Documents