PLEASE SCROLL DOWN FOR ARTICLE This article was downloaded by: [Zaccone, Renata] On: 4 June 2010 Access details: Access Details: [subscription number 922436765] Publisher Taylor & Francis Informa Ltd Registered in England and Wales Registered Number: 1072954 Registered office: Mortimer House, 37- 41 Mortimer Street, London W1T 3JH, UK Chemistry and Ecology Publication details, including instructions for authors and subscription information: http://www.informaworld.com/smpp/title~content=t713455114 Prokaryotic activities and abundance in pelagic areas of the Ionian Sea R. Zaccone a ; G. Caruso a ; M. Azzaro a ; F. Azzaro a ; E. Crisafi a ; F. Decembrini a ; E. De Domenico b ; M. De Domenico b ; R. La Ferla a ; M. Leonardi a ; A. Lo Giudice b ; G. Maimone a ; M. Mancuso a ; L. Michaud b ; L. S. Monticelli a ; F. Raffa a ; G. Ruggeri b ; V. Bruni b a IAMC-CNR, Istituto per l'Ambiente Marino Costiero, Messina, Italy b DBAEM Dipartimento di Biologia Animale ed Ecologia Marina, Università degli Studi di Messina, Messina, Italy Online publication date: 20 May 2010 To cite this Article Zaccone, R. , Caruso, G. , Azzaro, M. , Azzaro, F. , Crisafi, E. , Decembrini, F. , De Domenico, E. , De Domenico, M. , La Ferla, R. , Leonardi, M. , Lo Giudice, A. , Maimone, G. , Mancuso, M. , Michaud, L. , Monticelli, L. S. , Raffa, F. , Ruggeri, G. and Bruni, V.(2010) 'Prokaryotic activities and abundance in pelagic areas of the Ionian Sea', Chemistry and Ecology, 26: 1, 169 — 197 To link to this Article: DOI: 10.1080/02757541003772914 URL: http://dx.doi.org/10.1080/02757541003772914 Full terms and conditions of use: http://www.informaworld.com/terms-and-conditions-of-access.pdf This article may be used for research, teaching and private study purposes. Any substantial or systematic reproduction, re-distribution, re-selling, loan or sub-licensing, systematic supply or distribution in any form to anyone is expressly forbidden. The publisher does not give any warranty express or implied or make any representation that the contents will be complete or accurate or up to date. The accuracy of any instructions, formulae and drug doses should be independently verified with primary sources. The publisher shall not be liable for any loss, actions, claims, proceedings, demand or costs or damages whatsoever or howsoever caused arising directly or indirectly in connection with or arising out of the use of this material.

Welcome message from author
This document is posted to help you gain knowledge. Please leave a comment to let me know what you think about it! Share it to your friends and learn new things together.
Transcript
PLEASE SCROLL DOWN FOR ARTICLE
This article was downloaded by: [Zaccone, Renata]On: 4 June 2010Access details: Access Details: [subscription number 922436765]Publisher Taylor & FrancisInforma Ltd Registered in England and Wales Registered Number: 1072954 Registered office: Mortimer House, 37-41 Mortimer Street, London W1T 3JH, UK
Chemistry and EcologyPublication details, including instructions for authors and subscription information:http://www.informaworld.com/smpp/title~content=t713455114
Prokaryotic activities and abundance in pelagic areas of the Ionian SeaR. Zacconea; G. Carusoa; M. Azzaroa; F. Azzaroa; E. Crisafia; F. Decembrinia; E. De Domenicob; M. DeDomenicob; R. La Ferlaa; M. Leonardia; A. Lo Giudiceb; G. Maimonea; M. Mancusoa; L. Michaudb; L. S.Monticellia; F. Raffaa; G. Ruggerib; V. Brunib
a IAMC-CNR, Istituto per l'Ambiente Marino Costiero, Messina, Italy b DBAEM Dipartimento diBiologia Animale ed Ecologia Marina, Università degli Studi di Messina, Messina, Italy
Online publication date: 20 May 2010
To cite this Article Zaccone, R. , Caruso, G. , Azzaro, M. , Azzaro, F. , Crisafi, E. , Decembrini, F. , De Domenico, E. , DeDomenico, M. , La Ferla, R. , Leonardi, M. , Lo Giudice, A. , Maimone, G. , Mancuso, M. , Michaud, L. , Monticelli, L. S. ,Raffa, F. , Ruggeri, G. and Bruni, V.(2010) 'Prokaryotic activities and abundance in pelagic areas of the Ionian Sea',Chemistry and Ecology, 26: 1, 169 — 197To link to this Article: DOI: 10.1080/02757541003772914URL: http://dx.doi.org/10.1080/02757541003772914
Full terms and conditions of use: http://www.informaworld.com/terms-and-conditions-of-access.pdf
This article may be used for research, teaching and private study purposes. Any substantial orsystematic reproduction, re-distribution, re-selling, loan or sub-licensing, systematic supply ordistribution in any form to anyone is expressly forbidden.
The publisher does not give any warranty express or implied or make any representation that the contentswill be complete or accurate or up to date. The accuracy of any instructions, formulae and drug dosesshould be independently verified with primary sources. The publisher shall not be liable for any loss,actions, claims, proceedings, demand or costs or damages whatsoever or howsoever caused arising directlyor indirectly in connection with or arising out of the use of this material.
Chemistry and EcologyVol. 26, Supplement, June 2010, 169–197
Prokaryotic activities and abundance in pelagic areasof the Ionian Sea
R. Zacconea*, G. Carusoa, M. Azzaroa, F. Azzaroa, E. Crisafia, F. Decembrinia,E. De Domenicob, M. De Domenicob, R. La Ferlaa, M. Leonardia, A. Lo Giudiceb,G. Maimonea, M. Mancusoa, L. Michaudb, L.S. Monticellia, F. Raffaa, G. Ruggerib
and V. Brunib
aIAMC-CNR, Istituto per l’Ambiente Marino Costiero, Messina, Italy; bDBAEM Dipartimentodi Biologia Animale ed Ecologia Marina, Università degli Studi di Messina, Messina, Italy
(Received 19 January 2010; final version received 12 March 2010 )
The Ionian Sea represents a suitable basin for studying the biogeochemical processes mediated by microbialactivities. Because of its characteristics as a crossing region between the western and eastern MediterraneanSea, it is one of the sites most affected by changes in water mass composition and dynamics, caused bythe Eastern Mediterranean Transient (EMT). To date, relatively few data exist on microbial activities inpelagic areas of the Ionian Sea. From 1998 to 2004, during different research cruises, prokaryotic parameters(abundance, extracellular enzyme activities leucine aminopeptidase, β-glucosidase, alkaline phosphatase,bacterial production and respiration) were measured together with culturable bacteria and the main physical,chemical and trophic parameters (temperature, salinity, nutrients, particulated organic matter). The aim ofthe study was to describe the spatial and temporal variability in microbial activities involved in the carbonand phosphorus cycles, in different layers. Results showed that organic matter transformation mediatedby the microbial community displayed a significant increase in autumn, highlighting the occurrence ofsignificant changes at meso- and bathypelagic depths. Unlike the dark ocean, bacterial growth efficiency inthe Ionian Sea, which increased with depth, seemed to vary from being a source of carbon in the epipelagiclayer to a sink in the meso- and bathypelagic layers. The mechanism of phosphatase regulation showed aweak inverse correlation between specific phosphatase and inorganic P in all seasons except autumn. It isworth mentioning that the reported results constitute, to the best of our knowledge, one of the availabledatasets giving information about microbial activities in the Ionian Sea.
Keywords: Mediterranean Sea; prokaryotic activities; prokaryotic abundance; growth efficiency; watercolumn; biogeochemical cycles
1. Introduction
The Ionian Sea represents a crossing region between the western and eastern Mediterranean Seaand is one of the sites most affected by changes in water mass composition and dynamics, causedby the climatic event known as the Eastern Mediterranean Transient (EMT) [1]. Since the 1990s,a significant change in the thermohaline deep cell has occurred in the eastern Mediterranean. Thischange consists of a shift in the source of eastern Mediterranean deep waters from the Adriatic
*Corresponding author. Email: [email protected]
ISSN 0275-7540 print/ISSN 1029-0370 online© 2010 Taylor & FrancisDOI: 10.1080/02757541003772914http://www.informaworld.com
Downloaded By: [Zaccone, Renata] At: 09:36 4 June 2010

170 R. Zaccone et al.
to the Aegean Sea [2], which has modified the hydrological structure of the water masses andthe distribution of dissolved nutrients in the southern Adriatic and Ionian basins [1,3,4]. Briefly,salinity increased in the intermediate/deep layers of the Mediterranean Sea, whereas temperatureincreased in the surface layer. Observations in 2003 indicate propagation of the signal from eastto west. Newly formed high-temperature and high-salinity water seems to fill the deep layer,replacing the resident waters. So temperature is a key parameter in water mass formation [5]and the EMT influences the characteristics of the biogeochemical cycles and primary productionprocesses in the area [6].
Important changes in the circulation of the water masses have led to changes in some biologicalecosystem components, such as increases in organism adaptability or metabolism, connected withthe rise in temperature [7].
In general, the epipelagic layer of the Ionian Sea is mainly occupied by Modified AtlanticWater (MAW). This spreads eastward from the Sicily Straits in the surface layer and can usuallybe identified as a subsurface minimum of salinity between 30 and 200 m depth. The Ionian SurfaceWater (ISW) is also present in this layer, and can be clearly distinguished from the MAW in summerbecause it is saltier and warmer [8].
The mesopelagic layer is occupied by the Levantine Intermediate Water (LIW), which joins theIonian Sea through the Cretan passage, spreading in from its formation sites to the northeasternLevantine basin. The LIW is identified by high salinity levels in the layer between the depths 200and 600 m. The bathypelagic layer in the depth horizon below 1600 m is occupied by the colderand less saline Eastern Mediterranean Deep Water (EMDW) – the main source of which is theAdriatic Deep Water (ADW). The layer between 700 and 1600 m is occupied by a transitionalwater mass with properties intermediate between LIW and EMDW.
In addition, the Sicilian Channel, which connects the western and eastern Mediterranean basins,is strongly affected by two water masses (MAW and LIW) flowing in opposite directions [9].
Research over the past two decades has demonstrated that planktonic prokaryotes are themain drivers of marine biogeochemical cycles. Heterotrophic prokaryotes channel about halfof the primary production into the microbial loop in the euphotic zone [10] and might com-pete with eukaryotic phytoplankton for inorganic nutrients [11]. High amounts of organic matterare released into the surrounding water at different trophic levels, providing substrates for het-erotrophic prokaryotes. In the euphotic layer, their growth is mainly controlled by flagellates andviruses via a top-down mechanism. The meso- and bathypelagic zones harbour a simpler foodweb than epipelagic waters, owing to the lack of phytoplankton, which is partly compensated forby a major prokaryotic autotrophic component [12].
In the Mediterranean Sea, many studies have focused mainly on coastal and euphotic zones[13–17], nevertheless little information is available to date on the bacterial activities occurring inthe coastal and pelagic zones of the Ionian Sea and Sicily Channel [18–20].
In the pelagic environment, microbial activity over both particulate organic matter (POM) anddissolved organic matter (DOM), produced in the euphotic layer, is the main factor which sus-tains life at greater depths. In fact, during sinking through the water column, organic polymers aresubjected to a gradual degradation by different microbial processes. Bioavailable DOM becomesavailable to the deep microbial community through the transformation and solubilisation of par-ticles, rather than through the direct export of surface DOM into the dark ocean [21]. Along thewater column, the DOM is depleted of N and P but enriched with C which becomes rather refrac-tory [22], as indicated by the increase in the C:N:P ratio of the DOM in layers of different depths.The Mediterranean Sea might be an exception because several studies have identified labile DOCtransported into the deep layer [23].
In deep waters, POM might also support the metabolism of the micro-heterotrophic community[18,24]. POM originates mainly from phytoplankton and grazing activities, although it may alsoderive from the aggregation of organic macromolecules [21]. Few vertical profiles of extracellular
Downloaded By: [Zaccone, Renata] At: 09:36 4 June 2010

Chemistry and Ecology 171
enzymatic activities extending from the euphotic zone to the meso- or bathypelagic realm areavailable in the Mediterranean Sea [17,18,24–26] and oceans [27,28]. Recent research suggeststhat in the bathypelagic domain, prokaryotes express highly cell-specific extracellular enzymesand have lower growth yields [28]. Protease and phosphatase activities are much higher thanglucosidase activity, producing preferential nitrogen and phosphorus cleavage compared withcarbon [21]. Moreover, the lack of long-term time series on enzymatic activity, respiration andbacterial production has limited knowledge of the effects of climatic changes on the microbialmarine biocenosis functioning and structure in the epi-, meso- and bathypelagic zones [25].
During several cruises, carried out in the Ionian Sea and Sicily Channel from 1998 to 2004,different biochemical and microbial parameters involved in biogeochemical cycles (C, P, N) weremeasured. Supported by statistical analysis, we analysed the spatial and seasonal variability inmicrobial activities involved in organic matter transformation, both in terms of organic matterdegradation (exoenzymes production) and utilisation (carbon production and respiration). Wepaid special attention to bacterial growth efficiency. The aim of this study was to verify whetherdifferent microbial processes inside the C and P cycles occur in different layers and seasons inthe Ionian Sea.
2. Materials and methods
The data analysed in this study derive from several multidisciplinary field studies carried out inthe Ionian Sea (Figure 1). Data were obtained within the framework of the following researchprojects (see Table 1):
1. Marine Ecosystems, seasonal interannual and decadal variability in the atmosphere, oceans andrelated marine ecosystems (SINAPSI) project, Task B10: Recent history of the Mediterraneanwater masses analysed by in situ determination of microbial activities. Two cruises were carriedout in December 1998 to January 1999 (Sinapsi III) and March to April 2002 (Sinapsi IV).
2. Neutrin Monitoring Observatory (NEMO) project developed from 1999 to 2002, with fourcruises named Talastro I–IV (December 1999, October 2000, July 2001, March 2002), to studythe hydrobiological characteristics of marine area in front of Capo Passero (Km3 station).
Figure 1. Map of the central Mediterranean Sea and areas investigated over 1998–2004 (Ocean Data View Software,Schlitzer, 2003. Available at http://odv.awi.de): Sinapsi cruises ©; Talastro cruises ♦; MED-BIO cruises �.
Downloaded By: [Zaccone, Renata] At: 09:36 4 June 2010
172R
.Zaccone
etal.
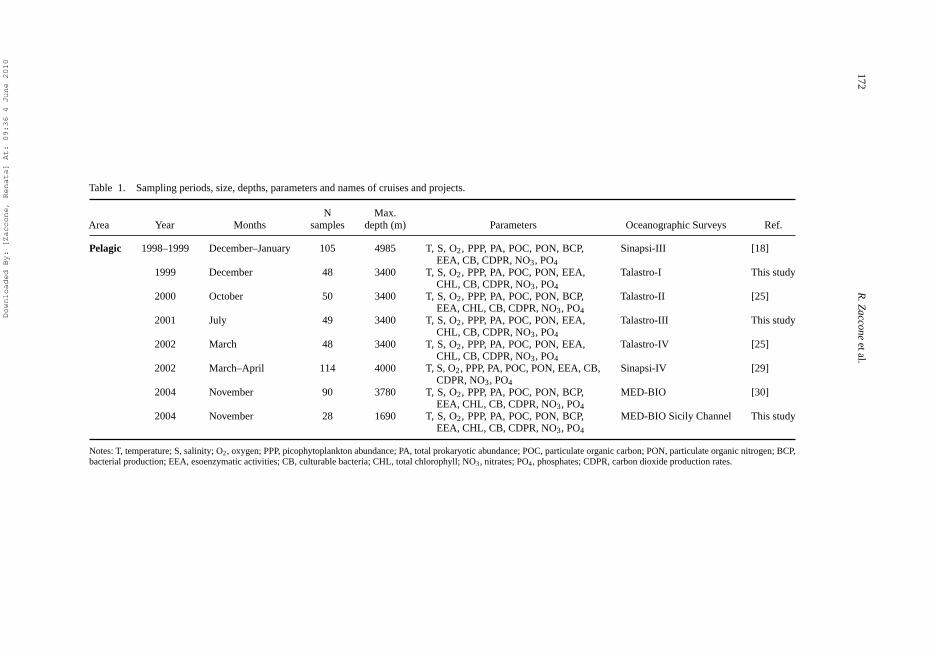
Table 1. Sampling periods, size, depths, parameters and names of cruises and projects.
N Max.Area Year Months samples depth (m) Parameters Oceanographic Surveys Ref.
Pelagic 1998–1999 December–January 105 4985 T, S, O2, PPP, PA, POC, PON, BCP,EEA, CB, CDPR, NO3, PO4
Sinapsi-III [18]
1999 December 48 3400 T, S, O2, PPP, PA, POC, PON, EEA,CHL, CB, CDPR, NO3, PO4
Talastro-I This study
2000 October 50 3400 T, S, O2, PPP, PA, POC, PON, BCP,EEA, CHL, CB, CDPR, NO3, PO4
Talastro-II [25]
2001 July 49 3400 T, S, O2, PPP, PA, POC, PON, EEA,CHL, CB, CDPR, NO3, PO4
Talastro-III This study
2002 March 48 3400 T, S, O2, PPP, PA, POC, PON, EEA,CHL, CB, CDPR, NO3, PO4
Talastro-IV [25]
2002 March–April 114 4000 T, S, O2, PPP, PA, POC, PON, EEA, CB,CDPR, NO3, PO4
Sinapsi-IV [29]
2004 November 90 3780 T, S, O2, PPP, PA, POC, PON, BCP,EEA, CHL, CB, CDPR, NO3, PO4
MED-BIO [30]
2004 November 28 1690 T, S, O2, PPP, PA, POC, PON, BCP,EEA, CHL, CB, CDPR, NO3, PO4
MED-BIO Sicily Channel This study
Notes: T, temperature; S, salinity; O2, oxygen; PPP, picophytoplankton abundance; PA, total prokaryotic abundance; POC, particulate organic carbon; PON, particulate organic nitrogen; BCP,bacterial production; EEA, esoenzymatic activities; CB, culturable bacteria; CHL, total chlorophyll; NO3, nitrates; PO4, phosphates; CDPR, carbon dioxide production rates.
Downloaded By: [Zaccone, Renata] At: 09:36 4 June 2010

Chemistry and Ecology 173
3. FIRB-MIUR project: Biodiversity and organisation of the communities in different envi-ronmental contexts, MED-BIO cruise (Mediterranean biodiversity) carried out in November2004.
The surveys discussed here had similar scientific objectives, research approaches, sampling strate-gies and methods. Details on the data collection and sampling strategies (Table 1) have beendescribed previously [18,25,29,30].
The cruises were carried out on board the R/V Urania and R/V Thetis of the Italian CNR. Watersamples were collected at different depths from the surface to the bottom (5 to 4900 m), usinga rosette sampler equipped with 10 L acid-rinsed Niskin bottles. Samples were either processedimmediately for specific measurements aboard the R/V or stored for subsequent analyses in thelaboratory.
The studied parameters, analytical procedures and specific references are reported in Table 2[14,31–40]. Regarding bacterial carbon production (BCP) analysis, in situ determination of leucineisotopical dilution was calculated for each cruise and water layer [34,41]. The conversion factorsused for enzymatic activities (calculated as Vmax) were 72 for leucine aminopeptidase (LAP) andβ-glucosidase (GLU) activities, and 31 to convert alkaline phosphatase (AP) activity into P [35].Also, the results of electron transport system (ETS) activity were converted into C and expressedas carbon dioxide production rates (CDPR), according to La Ferla et al. [42] in the euphotic zoneand according to Packard et al. [43] and Azzaro et al. [44] in the aphotic zone.
Bacterial growth efficiency (BGE), which indicated the fraction of carbon utilised by bacteriafor their growth, was also calculated as the percentage ratio between bacterial carbon production(BCP) and bacterial carbon demand (BCP + CDPR) [45].
2.1. Statistical analysis
Differences in each dependent variable of the dataset (see Table 2 for list of abbreviations) wereestablished using analysis of variance (ANOVA) and considering the following fixed factors: layers(epi- vs meso- vs bathypelagic zone) and seasons (cold vs warm periods – summer and autumn).All variables were logarithmically transformed to comply with the assumption ofANOVA (normaldistribution). Pearson’s correlation coefficient was also calculated among the parameters.Analyseswere performed with SigmaStat software v3.0.
Table 2. Methods and instrumentation utilised for analyses.
Parameters Method Instrumentation Ref.
T Temperature CTD multiparametric sensor (SBE 19 Plus)S Salinity CTD multiparametric sensor (SBE 19 Plus)O2 Oxygen CTD multiparametric sensorPPP Picophytoplankton abundance Microscopic count Zeiss AXIOPLAN 2 [31]PA Total prokaryotic abundance Microscopic count Zeiss AXIOPLAN 2 [32]BCP Bacterial carbon production [3H]-Leucine uptake Beta-Counter Wallac 1414 [33,34]CB Culturable bacteria Colony forming units Marine Agar 2216 [14]LAP Leucine–aminopeptidase Fluorogenic substrates Turner TD 700 fluorimeter [35]GLU β−Glucosidase Fluorogenic substrates Turner TD 700 [35]AP Alkaline phosphatase Fluorogenic substrates Turner TD 700 [35]CHL Chlorophyll a Fluorimetric measurement [36]POC Particulate organic carbon CHN-Autoanalyzer 2400 [37]PON Particulate organic nitrogen CHN-Autoanalyzer 2400 [37]NO3 Nitrates Spectrophotometer [38]PO4 Orthophosphate Spectrophotometer [38]CDPR Carbon dioxide production rates ETS activity Varian Spectrophotometer [39,40]
Downloaded By: [Zaccone, Renata] At: 09:36 4 June 2010

174 R. Zaccone et al.
In order to identify eventual differences among epi-, meso- and bathypelagic zones of eachconsidered cruise, the principal components analysis (PCA) was computed on normaliseddata. This multivariate analysis generates new variables, called principal components (linearcomponents of the original variables) which explain the highest dispersion of the samples.
Analysis of similarities (ANOSIM) was carried out to assess statistical differences betweenclusters into the multivariate datasets. ANOSIM is a nonparametric permutation procedure thattests whether differences in dissimilarity between groups exceed differences within groups [46].ANOSIM results produce a sample statistic, R, which represents the degree of separation betweentest groups: a value close to 1 indicates that all replicates of a sampling site or a treatment aremore similar to each other than any replicates of another site or treatment, whereas a value of 0indicates no difference.
The contribution of each parameter to the dissimilarity among clusters, as well as to thesimilarity within each cluster, was identified using SIMPER analysis [47].
PCA, ANOSIM and SIMPER were carried out using Primer 6 software, Version 6β R6(Copyright 2004, PRIMER-E Ltd).
3. Results
In order to compare the microbial processes occurring in the Ionian Sea with other marine areasof the world, the results were grouped by layers as follows: epipelagos (10–200 m), mesopelagos(200–1000 m) and bathypelagos (>1000 m).
3.1. Analysis of dataset
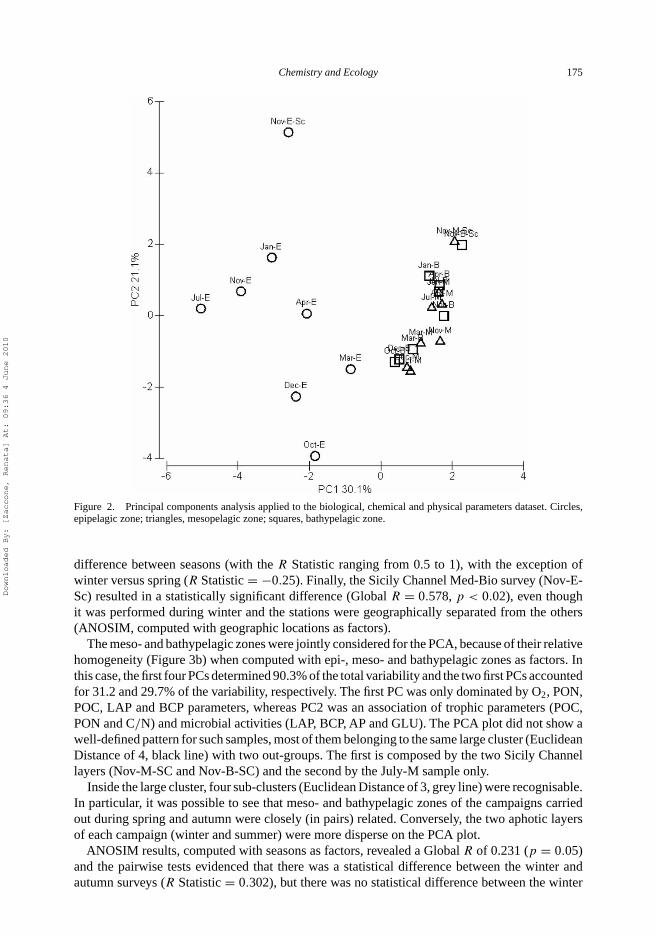
For PCA, each cruise was subdivided into epi-, meso- and bathypelagic zones (Figure 2). The firstfour principal components (PCs) explained 75.9% of the total variability, with the first two PCsrepresenting 30.1 and 21.1% of the total variability, respectively. The first PC was dominated bysalinity (S), temperature (T), CDPR and PO4, whereas the second PC was mainly a mixture ofseveral parameters (AP, ETS, C/N, POC and PON) with a greater weight for POC and PON.
Overall, the PCA plots highlighted that the meso- and bathypelagic layers were closely grouped,because their values fell into a single cluster with an Euclidean distance of 5.2 (not shown).By contrast, the epipelagic layer was very dispersed in the PCA plot, because its values fellinto various clusters (Euclidean distance of 5.2), reflecting the seasonality of the sampling.Additional ANOSIM, computed with epi-, meso- and bathypelagic zones as factors, revealeda significant difference (Global R = 0.345, p < 0.01) among all the three layers. In particular,ANOSIM Pairwise Test highlighted a statistical difference between the epi- and mesopelagic zones(R Statistic = 0.587,p < 0.02) and between the epi- and bathypelagic zones (R Statistic = 0.556,p < 0.02). Any statistical difference was retrieved between meso- and bathypelagic layers.
A new PCA plot was computed considering only the epipelagic zone (Figure 3a). The firstfour PCs explained 90.6% of the total variability, whereas the first two PCs represented 36.4 and32.8% of the total variability, respectively. Both PCs were a mixture of several parameters, withgreater weight for S, POC, PON, AP and ETS for PC1 and Total PA and PPP mainly for PC2.
Stations were grouped into a large cluster (Euclidean Distance 5, grey line) including winterand spring, whereas the autumn sample was included in a larger cluster (Euclidean Cluster of6.7, black line). Two out-group clusters were identified; one corresponding to the Sicily ChannelMed-Bio survey (Nov-E-Sc) and the second corresponding to the unique summer cruise (Jul-E).ANOSIM – computed with seasons as factors – highlighted a statistical difference among thestations (Global R = 0.279, p = 0.02). Moreover, the ANOSIM Pairwise Test underlined a great
Downloaded By: [Zaccone, Renata] At: 09:36 4 June 2010
Chemistry and Ecology 175
Figure 2. Principal components analysis applied to the biological, chemical and physical parameters dataset. Circles,epipelagic zone; triangles, mesopelagic zone; squares, bathypelagic zone.
difference between seasons (with the R Statistic ranging from 0.5 to 1), with the exception ofwinter versus spring (R Statistic = −0.25). Finally, the Sicily Channel Med-Bio survey (Nov-E-Sc) resulted in a statistically significant difference (Global R = 0.578, p < 0.02), even thoughit was performed during winter and the stations were geographically separated from the others(ANOSIM, computed with geographic locations as factors).
The meso- and bathypelagic zones were jointly considered for the PCA, because of their relativehomogeneity (Figure 3b) when computed with epi-, meso- and bathypelagic zones as factors. Inthis case, the first four PCs determined 90.3% of the total variability and the two first PCs accountedfor 31.2 and 29.7% of the variability, respectively. The first PC was only dominated by O2, PON,POC, LAP and BCP parameters, whereas PC2 was an association of trophic parameters (POC,PON and C/N) and microbial activities (LAP, BCP, AP and GLU). The PCA plot did not show awell-defined pattern for such samples, most of them belonging to the same large cluster (EuclideanDistance of 4, black line) with two out-groups. The first is composed by the two Sicily Channellayers (Nov-M-SC and Nov-B-SC) and the second by the July-M sample only.
Inside the large cluster, four sub-clusters (Euclidean Distance of 3, grey line) were recognisable.In particular, it was possible to see that meso- and bathypelagic zones of the campaigns carriedout during spring and autumn were closely (in pairs) related. Conversely, the two aphotic layersof each campaign (winter and summer) were more disperse on the PCA plot.
ANOSIM results, computed with seasons as factors, revealed a Global R of 0.231 (p = 0.05)and the pairwise tests evidenced that there was a statistical difference between the winter andautumn surveys (R Statistic = 0.302), but there was no statistical difference between the winter
Downloaded By: [Zaccone, Renata] At: 09:36 4 June 2010

176 R. Zaccone et al.
Figure 3. Principal components analysis applied to the biological, chemical and physical parameters of the epipelagic(a), meso- and bathypelagic (b) datasets in different periods.
and both summer and spring surveys. The other pairwise tests (autumn vs summer, autumn vsspring, summer vs spring) were statistically different (R Statistic ranging from 0.5 to 1).
SIMPER analysis was used to determine parameter dominance and showed that the most impor-tant parameters separating the epi- and meso- groups were S, ETS, PO4 and GLU (contributionpercentage ranging from 13.2 to 8.9, and a cumulative percentage of 53.5), whereas those sepa-rating the epi- and bathy- groups were S, PO4, ETS and T (contribution percentage ranging from11.4 to 9.2, and a cumulative percentage of 53.9). However, the meso- and bathypelagic layerswere separated only by C/N, POC and BCP (contribution percentage ranging from 28.9 to 14.0,and a cumulative percentage of 58.5).
SIMPER analysis was also carried out to individuate parameters explaining the distances amongcampaigns with ‘Seasons’as factors. The distance between winter and autumn groups was mainly
Downloaded By: [Zaccone, Renata] At: 09:36 4 June 2010

Chemistry and Ecology 177
due to AP, PON, GLU and BCP (from 28.1 to 8.5%; cumulative 54.3%), whereas between thewinter and spring group the distance was mainly due to C/N, BCP, ETS, POC and PON (from 11.9to 9.1%; cumulative 51.6%). Finally, the winter and summer groups were separated by three mainparameters (cumulative 60.1%): PPP (23.1%), PA (23.1%) and LAP (13.8%). Conversely, autumnand spring were separated by AP (40%), BCP (25.4%) and GLU (10.5%), whereas autumn andsummer were separated by AP (20.6%), PPP (22.2%) and Total PA (20.1%). Finally, the summerand spring groups were separated by PA (22.9%), PPP (22.9%) and LAP (18.8%).
Based on the PCA, in the following section, results are reported by considering the epipelagiclayer alone, and the meso- and bathypelagos together.
3.2. Epipelagic layer
This part of the water column is generally characterised by high variability in chemical, physicaland biological parameters, owing to seasonal variations, trophic processes and exchanges withthe atmosphere. Results from the ANOSIM showed a great difference among seasons, with theexception of winter versus spring. For this reason, we grouped data into summer, autumn and coldperiod (all months with the exception of July and October).
Surface water temperature showed a seasonal fluctuation with marked differences between coldand warm periods, ranging from 15.17 ◦C (January) to 17.47 ◦C (October). Salinity showed smalldifferences in the Ionian Sea during the examined periods with the exception of the epipelagiclayer in the Sicily Channel (Table 3).
In the surface layer, maximum mean values of nitrate and phosphate concentrations wereobserved in March and November, respectively (Table 3), and the minimum in April (0.45 μMNO3 and 0.06 μM PO4). In this layer, nitrate and phosphate distributions were characterisedby large standard deviations, particularly for nitrate, which indicated wide variations in nutrientconcentrations at these depths, because of biological processes.
POC amounts in the Ionian pelagic waters were generally low, and showed significant decreaseswith depth (Table 4a). In the epipelagic layer, the highest POC and PON incidences andnoticeable seasonal fluctuations were recorded (Table 3). Peaks were registered in October(48.32 μg C·L−1 and 7.37 μg N·L−1), whereas the lowest values were in January (20.05 μg C·L−1
and 3.54 μg N·L−1).Prokaryotic abundance (PA) in the Ionian Sea was in the order of 105 cells·mL−1 and declined
significantly with depth (Figures 4–6); the mean values ranged from 3.3 × 10⁵ cells· mL−1 inApril to 6.3 × 10⁴ cells·mL−1 in July. In these layers, a slight increase over time was observed.Seasonal fluctuations in PA were also evident when comparing the cold period versus July andOctober (Table 4b).
Picophytoplankton abundance (PPP) showed values 1 or 2 orders of magnitude lower thanthose of PA. The highest mean value was recorded in January (1.79 × 10⁴ cells·mL−1) and thelowest in October (1.2 × 10³ cells·mL−1).
CB showed wide variations within each layer and seasonal fluctuations (Figure 4); the highestvalues were observed in October sampling, and the lowest in March and December. Owing to highstandard deviations, the differences in depth were not significant (Table 4a). Seasonal fluctuationsin CB were confirmed by ANOVA among cold and warm periods (Table 4b).
BCP, analysed in three periods only, showed values ranging from 0.0166 (January) to0.0191 μg C·L−1·h−1 (October); an intermediate value of 0.0178 μg C·L−1·h−1 was observedin November.
Greater variability in enzymatic activities was observed, compared with PA. LAP activ-ity showed high variability in the epipelagic layer with mean values ranging from 0.11 to
Downloaded By: [Zaccone, Renata] At: 09:36 4 June 2010
178R
.Zaccone
etal.
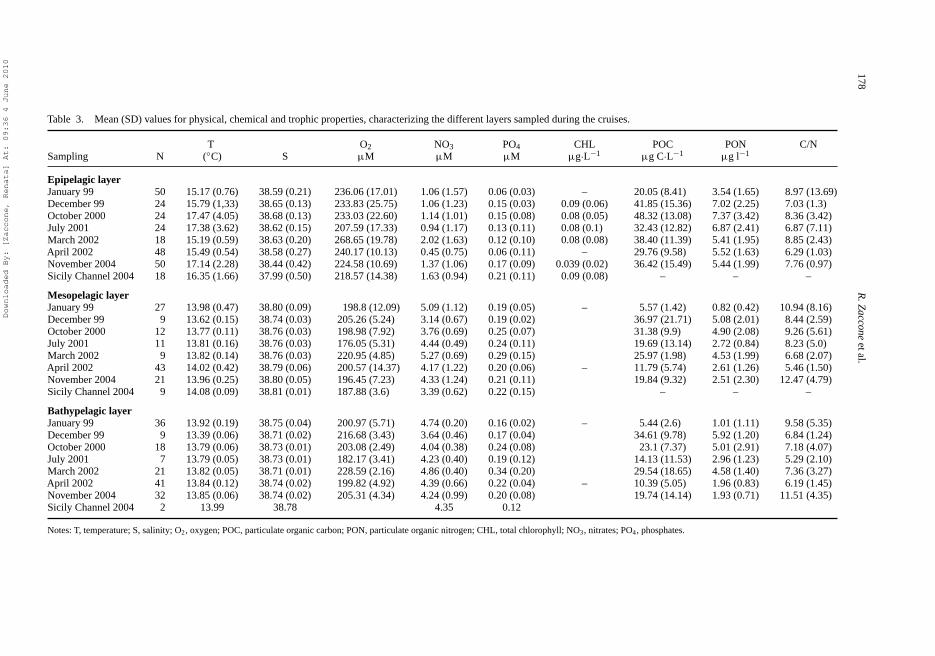
Table 3. Mean (SD) values for physical, chemical and trophic properties, characterizing the different layers sampled during the cruises.
T O2 NO3 PO4 CHL POC PON C/NSampling N (◦C) S μM μM μM μg·L−1 μg C·L−1 μg l−1
Epipelagic layerJanuary 99 50 15.17 (0.76) 38.59 (0.21) 236.06 (17.01) 1.06 (1.57) 0.06 (0.03) – 20.05 (8.41) 3.54 (1.65) 8.97 (13.69)December 99 24 15.79 (1,33) 38.65 (0.13) 233.83 (25.75) 1.06 (1.23) 0.15 (0.03) 0.09 (0.06) 41.85 (15.36) 7.02 (2.25) 7.03 (1.3)October 2000 24 17.47 (4.05) 38.68 (0.13) 233.03 (22.60) 1.14 (1.01) 0.15 (0.08) 0.08 (0.05) 48.32 (13.08) 7.37 (3.42) 8.36 (3.42)July 2001 24 17.38 (3.62) 38.62 (0.15) 207.59 (17.33) 0.94 (1.17) 0.13 (0.11) 0.08 (0.1) 32.43 (12.82) 6.87 (2.41) 6.87 (7.11)March 2002 18 15.19 (0.59) 38.63 (0.20) 268.65 (19.78) 2.02 (1.63) 0.12 (0.10) 0.08 (0.08) 38.40 (11.39) 5.41 (1.95) 8.85 (2.43)April 2002 48 15.49 (0.54) 38.58 (0.27) 240.17 (10.13) 0.45 (0.75) 0.06 (0.11) – 29.76 (9.58) 5.52 (1.63) 6.29 (1.03)November 2004 50 17.14 (2.28) 38.44 (0.42) 224.58 (10.69) 1.37 (1.06) 0.17 (0.09) 0.039 (0.02) 36.42 (15.49) 5.44 (1.99) 7.76 (0.97)Sicily Channel 2004 18 16.35 (1.66) 37.99 (0.50) 218.57 (14.38) 1.63 (0.94) 0.21 (0.11) 0.09 (0.08) – – –
Mesopelagic layerJanuary 99 27 13.98 (0.47) 38.80 (0.09) 198.8 (12.09) 5.09 (1.12) 0.19 (0.05) – 5.57 (1.42) 0.82 (0.42) 10.94 (8.16)December 99 9 13.62 (0.15) 38.74 (0.03) 205.26 (5.24) 3.14 (0.67) 0.19 (0.02) 36.97 (21.71) 5.08 (2.01) 8.44 (2.59)October 2000 12 13.77 (0.11) 38.76 (0.03) 198.98 (7.92) 3.76 (0.69) 0.25 (0.07) 31.38 (9.9) 4.90 (2.08) 9.26 (5.61)July 2001 11 13.81 (0.16) 38.76 (0.03) 176.05 (5.31) 4.44 (0.49) 0.24 (0.11) 19.69 (13.14) 2.72 (0.84) 8.23 (5.0)March 2002 9 13.82 (0.14) 38.76 (0.03) 220.95 (4.85) 5.27 (0.69) 0.29 (0.15) 25.97 (1.98) 4.53 (1.99) 6.68 (2.07)April 2002 43 14.02 (0.42) 38.79 (0.06) 200.57 (14.37) 4.17 (1.22) 0.20 (0.06) – 11.79 (5.74) 2.61 (1.26) 5.46 (1.50)November 2004 21 13.96 (0.25) 38.80 (0.05) 196.45 (7.23) 4.33 (1.24) 0.21 (0.11) 19.84 (9.32) 2.51 (2.30) 12.47 (4.79)Sicily Channel 2004 9 14.08 (0.09) 38.81 (0.01) 187.88 (3.6) 3.39 (0.62) 0.22 (0.15) – – –
Bathypelagic layerJanuary 99 36 13.92 (0.19) 38.75 (0.04) 200.97 (5.71) 4.74 (0.20) 0.16 (0.02) – 5.44 (2.6) 1.01 (1.11) 9.58 (5.35)December 99 9 13.39 (0.06) 38.71 (0.02) 216.68 (3.43) 3.64 (0.46) 0.17 (0.04) 34.61 (9.78) 5.92 (1.20) 6.84 (1.24)October 2000 18 13.79 (0.06) 38.73 (0.01) 203.08 (2.49) 4.04 (0.38) 0.24 (0.08) 23.1 (7.37) 5.01 (2.91) 7.18 (4.07)July 2001 7 13.79 (0.05) 38.73 (0.01) 182.17 (3.41) 4.23 (0.40) 0.19 (0.12) 14.13 (11.53) 2.96 (1.23) 5.29 (2.10)March 2002 21 13.82 (0.05) 38.71 (0.01) 228.59 (2.16) 4.86 (0.40) 0.34 (0.20) 29.54 (18.65) 4.58 (1.40) 7.36 (3.27)April 2002 41 13.84 (0.12) 38.74 (0.02) 199.82 (4.92) 4.39 (0.66) 0.22 (0.04) – 10.39 (5.05) 1.96 (0.83) 6.19 (1.45)November 2004 32 13.85 (0.06) 38.74 (0.02) 205.31 (4.34) 4.24 (0.99) 0.20 (0.08) 19.74 (14.14) 1.93 (0.71) 11.51 (4.35)Sicily Channel 2004 2 13.99 38.78 4.35 0.12
Notes: T, temperature; S, salinity; O2, oxygen; POC, particulate organic carbon; PON, particulate organic nitrogen; CHL, total chlorophyll; NO3, nitrates; PO4, phosphates.
Downloaded By: [Zaccone, Renata] At: 09:36 4 June 2010
Chemistry and Ecology 179
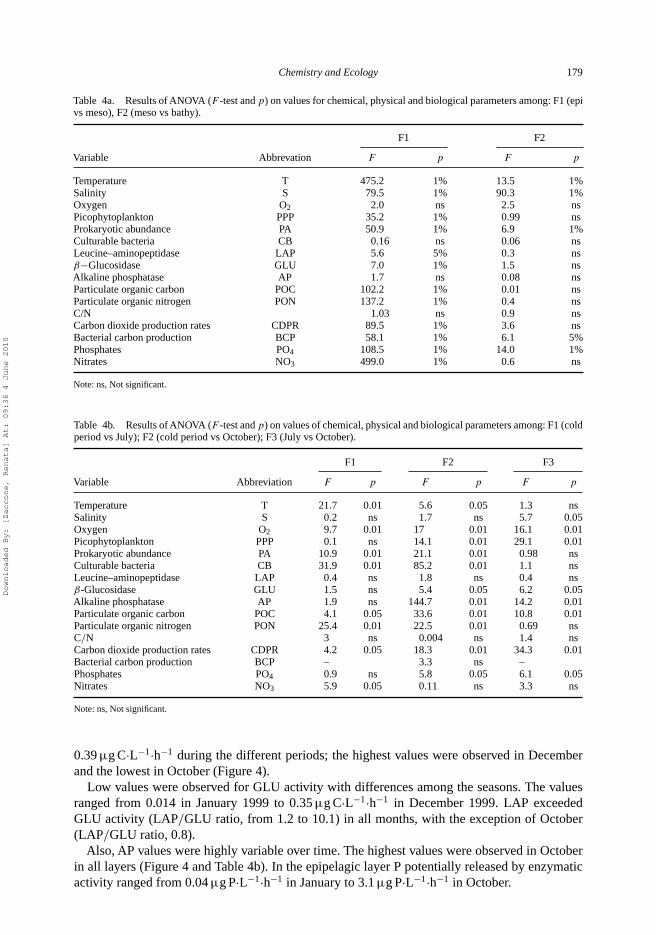
Table 4a. Results of ANOVA (F -test and p) on values for chemical, physical and biological parameters among: F1 (epivs meso), F2 (meso vs bathy).
F1 F2
Variable Abbrevation F p F p
Temperature T 475.2 1% 13.5 1%Salinity S 79.5 1% 90.3 1%Oxygen O2 2.0 ns 2.5 nsPicophytoplankton PPP 35.2 1% 0.99 nsProkaryotic abundance PA 50.9 1% 6.9 1%Culturable bacteria CB 0.16 ns 0.06 nsLeucine–aminopeptidase LAP 5.6 5% 0.3 nsβ−Glucosidase GLU 7.0 1% 1.5 nsAlkaline phosphatase AP 1.7 ns 0.08 nsParticulate organic carbon POC 102.2 1% 0.01 nsParticulate organic nitrogen PON 137.2 1% 0.4 nsC/N 1.03 ns 0.9 nsCarbon dioxide production rates CDPR 89.5 1% 3.6 nsBacterial carbon production BCP 58.1 1% 6.1 5%Phosphates PO4 108.5 1% 14.0 1%Nitrates NO3 499.0 1% 0.6 ns
Note: ns, Not significant.
Table 4b. Results of ANOVA (F -test and p) on values of chemical, physical and biological parameters among: F1 (coldperiod vs July); F2 (cold period vs October); F3 (July vs October).
F1 F2 F3
Variable Abbreviation F p F p F p
Temperature T 21.7 0.01 5.6 0.05 1.3 nsSalinity S 0.2 ns 1.7 ns 5.7 0.05Oxygen O2 9.7 0.01 17 0.01 16.1 0.01Picophytoplankton PPP 0.1 ns 14.1 0.01 29.1 0.01Prokaryotic abundance PA 10.9 0.01 21.1 0.01 0.98 nsCulturable bacteria CB 31.9 0.01 85.2 0.01 1.1 nsLeucine–aminopeptidase LAP 0.4 ns 1.8 ns 0.4 nsβ-Glucosidase GLU 1.5 ns 5.4 0.05 6.2 0.05Alkaline phosphatase AP 1.9 ns 144.7 0.01 14.2 0.01Particulate organic carbon POC 4.1 0.05 33.6 0.01 10.8 0.01Particulate organic nitrogen PON 25.4 0.01 22.5 0.01 0.69 nsC/N 3 ns 0.004 ns 1.4 nsCarbon dioxide production rates CDPR 4.2 0.05 18.3 0.01 34.3 0.01Bacterial carbon production BCP – 3.3 ns –Phosphates PO4 0.9 ns 5.8 0.05 6.1 0.05Nitrates NO3 5.9 0.05 0.11 ns 3.3 ns
Note: ns, Not significant.
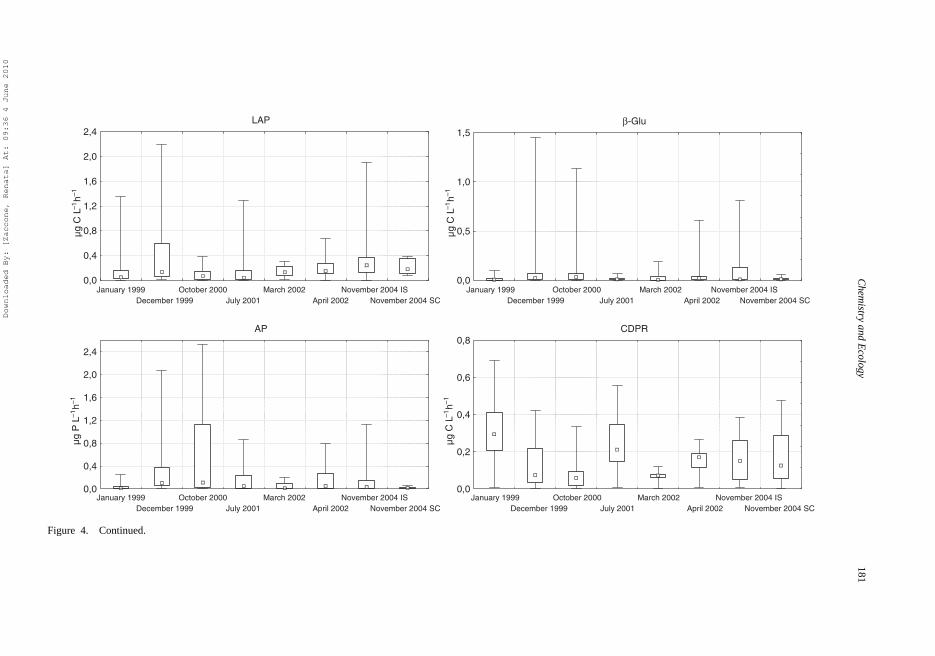
0.39 μg C·L−1·h−1 during the different periods; the highest values were observed in Decemberand the lowest in October (Figure 4).
Low values were observed for GLU activity with differences among the seasons. The valuesranged from 0.014 in January 1999 to 0.35 μg C·L−1·h−1 in December 1999. LAP exceededGLU activity (LAP/GLU ratio, from 1.2 to 10.1) in all months, with the exception of October(LAP/GLU ratio, 0.8).
Also, AP values were highly variable over time. The highest values were observed in Octoberin all layers (Figure 4 and Table 4b). In the epipelagic layer P potentially released by enzymaticactivity ranged from 0.04 μg P·L−1·h−1 in January to 3.1 μg P·L−1·h−1 in October.
Downloaded By: [Zaccone, Renata] At: 09:36 4 June 2010

180R
.Zaccone
etal.
PA
log
cell
mL–1
January 1999December 1999
October 2000July 2001
March 2002April 2002
November 2004 ISNovember 2004 SC
January 1999December 1999
October 2000July 2001
March 2002April 2002
November 2004 ISNovember 2004 SC
January 1999December 1999
October 2000July 2001
March 2002April 2002
November 2004 ISNovember 2004 SC
January 1999December 1999
October 2000July 2001
March 2002April 2002
November 2004 ISNovember 2004 SC
3,8
4,2
4,6
5,0
5,4
5,8
6,2PPP
log
cell
mL–1
1
2
3
4
5
6
CB
log
CF
U
0
1
2
3
4
BCP
µg C
L–1
h–1
0,00
0,01
0,02
0,03
0,04
Figure 4. Box plot of prokaryotic abundance (PA), picophytoplankton abundance (PPP), culturable bacteria (CB), bacterial carbon production (BCP), leucine aminopeptidase (LAP),β-glucosidase (GLU), alkaline phosphatase (AP) and respiration (CDPR) in epipelagic layer during the different cruises. The statistical distribution in each box plot is used: the small squarerepresents the median, the large square encloses the 25 and 75% percentiles of the data and the vertical bars indicate the max and min of the data.
Downloaded By: [Zaccone, Renata] At: 09:36 4 June 2010
Chem
istryand
Ecology
181
LAP
January 1999December 1999
October 2000July 2001
March 2002April 2002
November 2004 ISNovember 2004 SC
January 1999December 1999
October 2000July 2001
March 2002April 2002
November 2004 ISNovember 2004 SC
January 1999December 1999
October 2000July 2001
March 2002April 2002
November 2004 ISNovember 2004 SC
January 1999December 1999
October 2000July 2001
March 2002April 2002
November 2004 ISNovember 2004 SC
0,0
0,4
0,8
1,2
1,6
2,0
2,4β-Glu
µg C
L–1
h–1µg
C L
–1h–1
µg C
L–1
h–1µg
P L
–1h–1
0,0
0,5
1,0
1,5
AP
0,0
0,4
0,8
1,2
1,6
2,0
2,4
CDPR
0,0
0,2
0,4
0,6
0,8
Figure 4. Continued.
Downloaded By: [Zaccone, Renata] At: 09:36 4 June 2010

182R
.Zaccone
etal.
PA
January 1999
December 1999
October 2000
July 2001
March 2002
April 2002
November 2004 IS
November 2004 SC
January 1999
December 1999
October 2000
July 2001
March 2002
April 2002
November 2004 IS
November 2004 SC
January 1999
December 1999
October 2000
July 2001
March 2002
April 2002
November 2004 IS
November 2004 SC
January 1999
December 1999
October 2000
July 2001
March 2002
April 2002
November 2004 IS
November 2004 SC
3,8
4,2
4,6
5,0
5,4
5,8
6,2
log
cell
mL–1
PPP
log
cell
mL–1
1,2
1,8
2,4
3,0
3,6
4,2
4,8
CB
0
1
2
3
4
log
CF
U
BCP
µg C
L–1
h–1
0,000
0,002
0,004
0,006
0,008
0,010
Figure 5. Box plot of prokaryotic abundance (PA), picophytoplankton abundance (PPP), culturable bacteria (CB), bacterial carbon production (BCP), leucine aminopeptidase (LAP),β-glucosidase (GLU), alkaline phosphatase (AP) and respiration (CDPR) in mesopelagic layer during the different cruises. For statistical explanation see Figure 4.
Downloaded By: [Zaccone, Renata] At: 09:36 4 June 2010

Chem
istryand
Ecology
183
LAP
January 1999December 1999
October 2000July 2001
March 2002April 2002
November 2004 ISNovember 2004 SC
January 1999December 1999
October 2000July 2001
March 2002April 2002
November 2004 ISNovember 2004 SC
January 1999December 1999
October 2000July 2001
March 2002April 2002
November 2004 ISNovember 2004 SC
January 1999December 1999
October 2000July 2001
March 2002April 2002
November 2004 ISNovember 2004 SC
0,0
0,2
0,4
0,6
0,8
1,0
1,2
1,4
µg C
L–1
h–1
β -Glu
0,00
0,05
0,10
0,15
0,20
0,25
0,30
µg C
L–1
h–1
AP
µg P
L–1
h–1
0,0
0,2
0,4
0,6
0,8
1,0CDPR
µg C
L–1
h–1
0,00
0,01
0,02
0,03
0,04
Figure 5. Continued.
Downloaded By: [Zaccone, Renata] At: 09:36 4 June 2010
184 R. Zaccone et al.
LAP/AP ratio was generally >1, except in October when AP was the dominant enzymaticactivity (LAP/AP ratio, 0.05).
CDPR greatly varied both over time (months and years) and in relation to depth. High variabilityoccurred in January, July and November. Its distribution showed important decreases along thewater column, particularly between the epi- versus mesopelagic layers (Table 4a). In the epipelagiczone the CDPR varied from 0.07 (March) to 0.36 μg C·L−1·h−1 (January).
3.3. Meso- and bathypelagic layers
In the meso- and bathypelagic zones, T decreased significantly compared with the epipelagiclayer with a minimum of 13.39 ◦C in December; the values showed lower standard deviations andvariations over seasons. Higher S values with narrow variations in the meso- and bathypelagiclayers than in the epipelagic layer were observed (Table 3).
The mean values of nutrients (NO3 and PO4) were significantly higher in the mesopelagic thanin the other layers. Seasonal variations were found in the meso- and bathypelagic layers for NO3
and PO4, reaching maximum values in March. In the deepest layer, nutrient concentrations wererelatively constant, as indicated by weak standard deviations (Table 3).
ANOVA results for testing the null hypothesis of equality among layers showed differencesfrom epi- to mesopelagic layers for most of the analysed biological parameters (PA, PPP, BCP,LAP, GLU, POC, PON and CDPR). Only a few biological variables were significantly differentbetween the meso- and bathypelagic layers (PA, BCP) (Table 4a).
POC and PON amounts in the mesopelagic layer were very low, never exceeding36.97 μg C · L−1 and 0.82 μg N·L−1, respectively. In this layer, the most significant decreases,∼44 and 46% of the epipelagic values, were recorded in summer (Tables 3 and 4a).
In the bathypelagic layer, POC and PON showed further decreases respecting the epi- andmesopelagic layers. In particular, POC decreases from the epi- to bathypelagic layers wereobserved in summer and autumn, whereas in winter the lowest POC values were recorded in themesopelagic layer (Figure 7). The same patterns were observed for PON, which was significantlycorrelated with POC (Table 5).
C/N ratios higher than those recorded in the other layers were observed in the mesopelagiclayer for all the investigated seasons (except spring), indicating more refractory organic matter inthis layer.
The PA decrease was 50% in the mesopelagic layer and ∼10% in the bathypelagic layer, withrespect to former layer abundance. Nevertheless, the epipelagic trend was reflected at deeperlayers although to a lower extent, with an increase in values over time. In the bathypelagic layer,a wide range of PA values was gathered from April to November; the mean values varied from3.13 × 104 to 1.88 × 10⁵ cells·mL−1 (Figures 5 and 6).
PPP cells were also observed repeatedly in the meso- and bathypelagic zones, with a reductionof one order of magnitude (Figure 5). In both the deep layers, higher values were registered inJuly than in the other periods.
CB showed high variability with the highest values observed in October sampling, whereas thelowest values were observed in March and December in both layers.
BCP showed significant differences among layers with higher values measured in theepipelagic rather than the meso- and bathypelagic layers (Table 4a). Mesopelagic layerdisplayed mean values ranging from 0.0006 (November) to 0.0033 μg C·L−1·h−1 (Octo-ber). Such a layer was less productive. ANOVA showed significant differences amongthe sampling periods (F = 0.364, p < 0.01). A slight decrease between meso- and bathy-pelagic layers was observed. In the bathypelagic zone, the highest mean values wereobserved in October (0.0041 μg C·L−1·h−1), followed by January and November (0.0029 and
Downloaded By: [Zaccone, Renata] At: 09:36 4 June 2010

Chem
istryand
Ecology
185
PA
log
cell
mL–1
January 1999
December 1999
October 2000
July 2001
March 2002
April 2002
November 2004 IS
November 2004 SC
January 1999
December 1999
October 2000
July 2001
March 2002
April 2002
November 2004 IS
November 2004 SC
January 1999
December 1999
October 2000
July 2001
March 2002
April 2002
November 2004 IS
November 2004 SC
January 1999
December 1999
October 2000
July 2001
March 2002
April 2002
November 2004 IS
November 2004 SC
3,8
4,2
4,6
5,0
5,4
5,8
6,2PPP
log
cell
mL–1
1,2
1,8
2,4
3,0
3,6
4,2
4,8
CB
log
CF
U
0
1
2
3
4
BCP
µg C
L–1
h–10,002
0,004
0,006
0,008
0,010
Figure 6. Box plot of prokaryotic abundance (PA), picophytoplankton abundance (PPP), culturable bacteria (CB), bacterial carbon production (BCP), leucine aminopeptidase (LAP),β-glucosidase (GLU), alkaline phosphatase (AP) and respiration (CDPR) in bathypelagic layer during the different cruises. For statistical explanation see Figure 4.
Downloaded By: [Zaccone, Renata] At: 09:36 4 June 2010

186R
.Zaccone
etal.
LAP
µg C
L–1
h–1
µg C
L–1
h–1µg
C L
–1h–1
µg P
L–1
h–1
January 1999
December 1999
October 2000
July 2001
March 2002
April 2002
November 2004 IS
November 2004 SC
January 1999
December 1999
October 2000
July 2001
March 2002
April 2002
November 2004 IS
November 2004 SC
January 1999
December 1999
October 2000
July 2001
March 2002
April 2002
November 2004 IS
November 2004 SC
January 1999
December 1999
October 2000
July 2001
March 2002
April 2002
November 2004 IS
November 2004 SC
0,0
0,2
0,4
0,6
0,8
1,0
1,2
1,4β -Glu
0,00
0,05
0,10
0,15
0,20
0,25
0,30
AP
0,0
0,2
0,4
0,6
0,8
1,0CDPR
0,00
0,01
0,02
0,03
0,04
Figure 6. Continued.
Downloaded By: [Zaccone, Renata] At: 09:36 4 June 2010

Chemistry and Ecology 187
POC
0.00 10.00 20.00 30.00 40.00 50.00 60.00
BATHYMESO
EPI
BATHYMESO
EPI
BATHYMESO
EPIC
old
perio
dA
utum
nS
umm
er
Figure 7. Distribution of particulate organic carbon (POC) in the epi-, meso- and bathypelagic layers (mean values withstandard deviation) during cold and warm periods.
0.001 μg C·L−1·h−1, respectively). Significant differences among seasons were observed (F =8.54, p < 0.001).
The distribution of BCP per cell followed a decreasing trend from epi- to bathy- andmesopelagos (0.161, 0.080, 0.050 fg C·cell−1·h−1, respectively).
As other biological parameters, LAP displayed a decreasing pattern from the epi- to mesopelagiclayers (Table 4a); the reduction was ∼21%. No seasonal differences were observed, probablybecause of the high variability, however, the lowest mean values were observed in March andthe highest in December (0.032–0.27 μg C·L−1·h−1, respectively). In the bathypelagic layer LAPshowed similar or lower values than in the mesopelagic layer, varying from 0.02 μg C·L−1·h−1 inApril to 0.33 μg C·L−1·h−1 in November (Figure 5).
A greater reduction of 66% was observed for GLU between the epi- and mesopelagos (Table 4a),where the values varied from 0.005 (April) to 0.05 μg C·L−1·h−1 (December). As a consequence,the importance of LAP over GLU increased in mesopelagos (LAP/GLU ratio ranging from 3.1 to10.5). In the bathypelagic layer, an increase in GLU compared with the upper layer was observedin October, when the highest values were reached (0.21 μg C·L−1·h−1). In fact, GLU activity inOctober exceeded the LAP activity as indicated by the LAP/GLU ratio (0.24). Conversely, thelowest GLU mean value was registered in April (0.004 μg C·L−1·h−1).
In the mesopelagic layer, AP showed low values in all the studied periods, with the exceptionof the October sampling. In this month, AP exceeded LAP activity as indicated by LAP/AP ratio(0.07). High differences in AP activity were observed in the bathypelagic layer in relation todifferent periods (Figure 6), ranging from 0.003 in March to 0.50 μg P·L−1·h−1 in October. Infact, the LAP/AP ratio was <1 in October and July.
CDPR in the mesopelagic zones ranged from 0.002 to 0.01 μg C·L−1·h−1. CDPR variabilityin the mesopelagic layer showed a trend over time similar to the upper horizon, with high valuesand wide dispersion in January, low rates and narrow variability in October.
CDPR in the bathypelagic zones varied from 0.0035 to 0.01 μg C·L−1 h−1, inApril and January,respectively. The trend with time was quite similar to the mesopelagic one from January to March.
3.4. Sicily Channel
Surface waters were characterised by lower temperature and salinity than the Ionian basin(Table 3). PA was characterised by decreasing mean values from epi- to meso- and bathypelagiczones (2.8 × 10⁵, 1.8 × 10⁵, 9.9 × 10⁴ cells·mL−1 respectively). In a similar way, CB decreasedwith depth. BCP was measured only in one station and varied from 0.029 to 0.0002 μg C·L−1·h−1.
Downloaded By: [Zaccone, Renata] At: 09:36 4 June 2010
188 R. Zaccone et al.
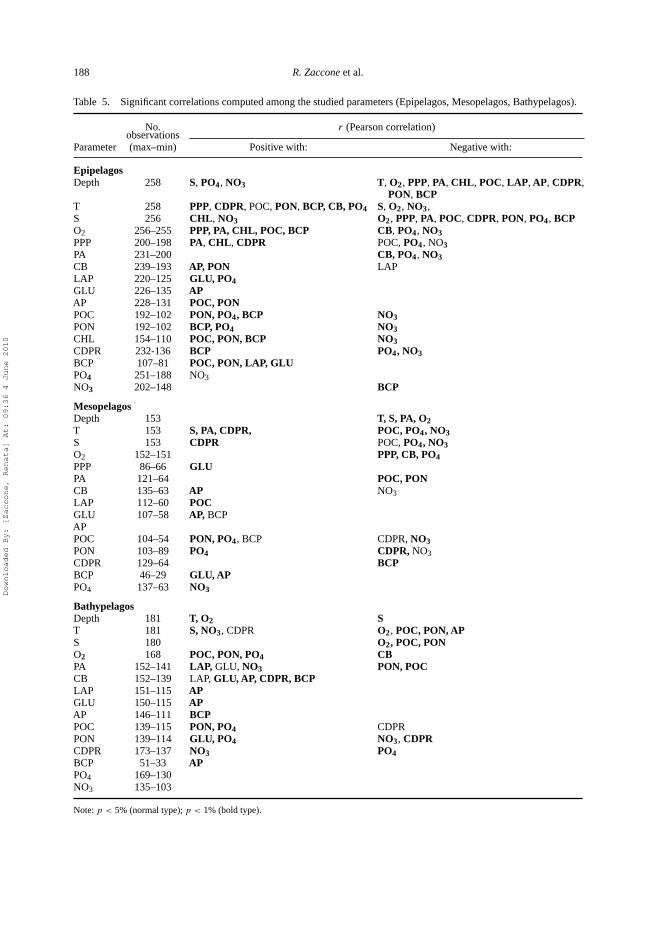
Table 5. Significant correlations computed among the studied parameters (Epipelagos, Mesopelagos, Bathypelagos).
No. r (Pearson correlation)observations
Parameter (max–min) Positive with: Negative with:
EpipelagosDepth 258 S, PO4, NO3 T, O2, PPP, PA, CHL, POC, LAP, AP, CDPR,
PON, BCPT 258 PPP, CDPR, POC, PON, BCP, CB, PO4 S, O2, NO3,S 256 CHL, NO3 O2, PPP, PA, POC, CDPR, PON, PO4, BCPO2 256–255 PPP, PA, CHL, POC, BCP CB, PO4, NO3PPP 200–198 PA, CHL, CDPR POC, PO4, NO3PA 231–200 CB, PO4, NO3CB 239–193 AP, PON LAPLAP 220–125 GLU, PO4GLU 226–135 APAP 228–131 POC, PONPOC 192–102 PON, PO4, BCP NO3PON 192–102 BCP, PO4 NO3CHL 154–110 POC, PON, BCP NO3CDPR 232-136 BCP PO4, NO3BCP 107–81 POC, PON, LAP, GLUPO4 251–188 NO3NO3 202–148 BCP
MesopelagosDepth 153 T, S, PA, O2T 153 S, PA, CDPR, POC, PO4, NO3S 153 CDPR POC, PO4, NO3O2 152–151 PPP, CB, PO4PPP 86–66 GLUPA 121–64 POC, PONCB 135–63 AP NO3LAP 112–60 POCGLU 107–58 AP, BCPAPPOC 104–54 PON, PO4, BCP CDPR, NO3PON 103–89 PO4 CDPR, NO3CDPR 129–64 BCPBCP 46–29 GLU, APPO4 137–63 NO3
BathypelagosDepth 181 T, O2 ST 181 S, NO3, CDPR O2, POC, PON, APS 180 O2, POC, PONO2 168 POC, PON, PO4 CBPA 152–141 LAP, GLU, NO3 PON, POCCB 152–139 LAP, GLU, AP, CDPR, BCPLAP 151–115 APGLU 150–115 APAP 146–111 BCPPOC 139–115 PON, PO4 CDPRPON 139–114 GLU, PO4 NO3, CDPRCDPR 173–137 NO3 PO4BCP 51–33 APPO4 169–130NO3 135–103
Note: p < 5% (normal type); p < 1% (bold type).
Downloaded By: [Zaccone, Renata] At: 09:36 4 June 2010

Chemistry and Ecology 189
Table 6. C potentially mobilised by enzymatic activities, μgC·L−1· h−1 (LAP + GLU) and ratiowith BCP; bacterial growth efficiency (BGE) as % calculated for the epi-, meso- and bathypelagiczones.
LAP + GLU EEA/BCP BGE
January 99 EPI 0.16 13.8 7.84MESO 0.13 53.9 14:09BATHY 0.04 13.4 18.97
October 00 EPI 0.24 11.6 41.94MESO 0.15 42.5 59.3BATHY 0.32 62.6 55.1
November 04 EPI 0.50 28.9 17.89MESO 0.31 374.0 11.1BATHY 0.39 359.2 21.9
EEA showed lower or similar values than those recorded during the November cruise in theIonian Sea. LAP prevailed over the other activities and AP reached the lowest values in all layers.Respiration as CDPR was similar or lower than the Ionian basin at all depths (Figures 4–6).
4. Discussion
The processes we considered are part of three basic biogeochemical cycles: the carbon, the phos-phorus and the nitrogen cycles. We focus the discussion on the spatial (mainly over depth) andseasonal differences in the carbon (even if LAP activity may be used as a source for both C and Nby prokaryotes) and the phosphorus cycles in the Ionian Sea. The Ionian Sea has been classifiedas an oligotrophic area of the eastern Mediterranean Sea, because of low levels of chlorophylland POC [48]. It is assumed that the microbial community (both auto- and heterotrophic) plays akey role in oligotrophic environments [17,49]; cycling within the microbial loop is reported as thedominant mode of nutrient transfer; C, N and P are stored in DOM and POM which are exportedat end of the summer stratified period [50].
4.1. Depth variability
In the present study, major differences both in prokaryotic abundance and activities were noticed,mainly between the epi- and both meso- and bathypelagic layers, suggesting the occurrence ofdifferent processes in different layers; PCA and ANOVA confirmed these differences. SIMPERanalysis showed that the most important parameters which distinguished the epi- and meso- groupswere S, ETS, PO4 and GLU, whereas the meso- and bathypelagic layers were separated only byC/N, POC and BCP.
Vertical profiles of nutrient concentrations also showed differences in NO3/PO4 ratio, whichincreased from 9 at surface waters to ∼19 in the mesopelagic zone and ∼20 in the bathypelagiczone. This was due to different rates of recycling for phosphate and nitrate [21,22,51].According toother AA, bacteria were mainly P limited in the oligotrophic environment, whereas phytoplanktonwas P and N limited [52]. In the epipelagic layer, wide variations in nutrient concentrations couldbe related to increasing mineralisation of organic matter produced in the surface waters. Nitratesand phosphates were related positively to depth and negatively to most microbial and trophicparameters (Table 5), indicating their utilisation by planktonic organisms. Moreover, PPP waspositively related to T and CHL and negatively related to nutrients, confirming the positive effectof T on the autotrophic components of plankton [25].
Downloaded By: [Zaccone, Renata] At: 09:36 4 June 2010
190 R. Zaccone et al.
In the epipelagic environment, other biological parameters (CB, POC, BCP and CDPR)followed the temperature trends (Table 5); BCP in the epipelagic layer was also related to LAPand GLU. Although a correlative approach, by itself, is not sufficient to identify a cause–effectrelationship, all these findings led us to hypothesise that the increase in microbial processes onorganic matter is caused by the water warming. Other investigations in the Mediterranean Sea[25,53,54] found similar correlations. The meaning of this finding could be that the rising tem-peratures, as expected by water warming, may cause an increase in remineralisation – at the costof photosynthetic production – with a consequent predominance of a heterotrophic regime.
In the epipelagic area, the greater amount of POC and low values of the C/N ratio were associatedwith high enzymatic activities; the value of the C/N ratio, recognised as an indicator of organicmatter quality [55], suggested the availability of fresh, labile compounds, prone to prokaryoticdecomposition.
In the Ionian Sea, GLU activity in the epipelagic layer was in a similar range, whereas LAPvalues were lower than those reported for the Gulf of Genoa [17]. LAP activity was significantlyhigher than GLU except in October, as observed in other oligotrophic environments [26,56].
Moreover the amounts of carbon mobilised by EEA and taken up by BCP were quite balanced(see Table 6, EEA/BCP ratio). This coupling suggested a quick turnover of carbon, driving anincrease in PA and biomass. By contrast, in the more eutrophic waters of the Mediterranean Sea,the EEA/BCP ratio was >20 [57].
Comparison of BCP and EEA with other areas of the Mediterranean Sea, showed values in asimilar range to those found in previous studies [15,18,19,58], but higher than those measured inthe eastern Mediterranean Sea [59].
All biological and trophic components decreased significantly in the mesopelagic layer. Thereduction in POC content resulted in an increasing C/N ratio, indicating a more refractory organicmatter.
In this layer, the lowest BCP values were observed. The EEA/BCP ratio displayed the highestvalue (Table 6) indicating greater enzyme production with respect to the needs of prokaryotes.This finding has been observed previously in the north Adriatic Sea and in prokaryotes livingin aggregates [57,60]. Recently, the increasing expression of extracellular enzymes associatedwith a decrease in biomass has also been found in the deep subtropical Atlantic Ocean [28]. Thefree-living prokaryotes usually showed a tight hydrolysis–uptake coupling and the hydrolysisoccurred next to the site of monomers uptake [61]. By contrast, loss of EEA–BCP couplingwas suggested in particle-associated prokaryotes, with EEA released into the environment [62].These findings allowed us to hypothesise that the high EEA/BCP ratio occurring in the deeplayer (Table 6) could indicate particle-associated microbes. Other authors have hypothesised thatEEA was associated with colloidal and microparticulate organic matter in the deep ocean highlycolonised by microbes; in this microenvironment, high EEA was produced by particle-associatedprokaryotes [63].
BCP was positively correlated with GLU,AP and POC (Table 5) indicating a coupling of organicmatter hydrolysis and incorporation of monomers by prokaryotes, similar to processes in theepipelagic zone, although to a lesser extent. In the bathypelagic layer, positive correlations betweenall EEA and BCP were also observed, as well as negative correlations between PA and POCand PON (Table 5). This suggested bacterial growth supported by EEA and the mineralisation ofparticulate matter. Our PCA confirmed the coupling of microbial metabolism with organic matter.Strong positive correlations between EEA and BCP and POC were observed in the deep ocean[63], suggesting an active response to the organic matter pool by prokaryotes. The association ofmicrobial metabolism with the organic matter trophic quality was also stated [64].
Assuming that enzymatic activities were mainly due to the prokaryotic fraction and that all cellshave similar activity levels, the cell-specific activity was calculated to compare surface cell activitywith deep cell activity. The LAP activity per cell in the Ionian Sea (16.29–78.78 amol·cell−1·h−1)
Downloaded By: [Zaccone, Renata] At: 09:36 4 June 2010

Chemistry and Ecology 191
was similar or higher than values obtained for the Tyrrhenian Sea [64]. By contrast, very highGLU activity levels per cell were obtained in the Ionian Sea (5.11–23.43 amol·cell−1·h−1), com-pared with the former study [64]. In the deep zone, the importance of specific GLU activity,compared with LAP, indicated the hydrolysis of more refractory material, such as mucopolysac-charides, with respect to the more labile protein fraction, which was hydrolysed in the surfacelayers. This may be the response of prokaryotes to changes in organic matter quality along thewater column. Baltar et al. [28], in the subtropical Atlantic ocean, showed LAP values similar toour enzyme activity values at the surface and higher in the deep layer, although very low GLUper cell values were reported. Any variation in the rate of the cell-specific activities was expectedto depend on variations in the composition of the prokaryotic community or its physiologicalcharacteristics [14,65].
Finally, spatial differences were observed between the pelagic station of the Ionian Sea andthe Sicily Channel. PCA indicated that this last area was geographically separated from the restof the Ionian stations, probably linked to different water masses of Atlantic origin with lowertemperature and salinity [9].
4.2. Seasonal variability
Variability over the seasons was less significant than that among layers. As expected, seasonalpatterns were marked in the epipelagic zone, but were also present in the deep waters, especiallyduring the October survey.
Traditionally, meso- and bathypelagic prokaryotes have been considered less active than thoseliving in the epipelagos, because of low temperatures and substrate availability [66]. In the Mediter-ranean Sea, large seasonal changes have been observed, particularly in the mesopelagic realm,indicating that cells were active [67]. Seasonal variation in BCP in deep water was also observedin the oceans [21].
Significant differences over time were observed for PA, CB, POC, PON, NO3 and ETS betweenthe cold period and summer. More parameters with an autotrophic component (such as PPP, GLU,AP and PO4) showed differences between the cold period and autumn. The values of PPP, POC,GLU, AP and ETS were also different between summer and autumn (Table 4b).
Changes in prokaryotic structure or at least in prokaryotic metabolisms were hypothesised incold and warm periods. During cold periods, enzyme activities were in the order LAP > AP >
GLU. The vertical distribution of activities calculated per cell showed a different trend for thethree enzymes: LAP prevailed in the epi- and bathypelagic layers, whereas the importance ofGLU increased at mesopelagic layer. An increase in EEA values with depths was also observedby Baltar et al. [28] who explained this result as an adaptation of enzyme activity patterns to therefractory nature of deeper organic matter.
During warm periods, enzyme levels showed different patterns of distribution: in summer aprevalence of AP over LAP and GLU was observed in the epipelagic layer, whereas in the meso-and bathypelagos LAP prevailed. In autumn, AP assumed a great importance over the otherenzymes in all layers (Figure 8). The high cell-specific activity in the meso- and bathypelagiclayers was a common feature of other pelagic zones. Thus, deep sea prokaryotes might expressmore enzyme activity than those living in the epipelagic layer to achieve the same amounts oforganic polymers [28,68,69]. In the present study, this trend was evident only in autumn.
4.3. Bacterial growth efficiency
The BGE values reported in Table 6 were generally low and similar to other values observedin the Mediterranean Sea [49,70,71]. The values obtained during January and November were
Downloaded By: [Zaccone, Renata] At: 09:36 4 June 2010

192 R. Zaccone et al.
Cold period
0.00 0.50 1.00 1.50 2.00 2.50 3.00 3.50
EPI
(a)
(b)
(c)
MESO
BATHY
LAP
GLU
AP
Summer 0.00 2.00 4.00 6.00 8.00 10.00 12.00
EPI
MESO
BATHY
LAP
GLU
AP
Autumn 0.00 5.00 10.00 15.00 20.00 25.00 30.00 35.00 40.00
EPI
MESO
BATHY
LAP
GLU
AP
Figure 8. Cell-specific activities of leucine aminopeptidase (LAP) and β-glucosidase (GLU) (fg C·cell−1·h−1) andalkaline phosphatase (AP) (fg P·cell−1·h−1), in different layers during cold and warm periods.
comparable with each other, although the October values were significantly higher in all layers(F = 109.8, p < 0.001).
In all periods, a significant increase in BGE values between the epi- and mesopelagic layers wasobserved (F = 23.3, p < 0.001), whereas no differences between the meso- and bathypelagiclayers were shown. The increasing gradient over depth was in opposition to low BGE observed inthe dark ocean [21] and suggested that the deep Ionian Sea is more dynamic than other oceans orthat organic matter has still not been degraded [23]. Highly cell-specific EEA in the bathypelagiclayer, together with the higher temperature of deep Mediterranean compared with open oceanwaters, contribute to explain higher BGE at deep waters.
Changes in the trophic conditions (POC values) observed in the autumn sampling affected theBGE because both the availability of organic matter and high enzymatic activities stimulated theincrease of the microbial growth efficiency. A relationship between BGE and enzymatic activitieshad already been reported [28]. Concerning this, the significant correlations between AP and BGE(r = 0.268, n = 172, p < 0.001), highlighted the important role of AP in supporting microbialgrowth and also in the C cycle [27]. Moreover, BGE was related to POC (r = 0.223, n = 138,p < 0.01), indicating the presence of labile substrate for microbial growth.
At low BGE, more DOM is remineralised, keeping the nutrient recycling within the microbialcycle. In the epipelagic layer, low BGE values indicated higher CO2 release into the ecosystem
Downloaded By: [Zaccone, Renata] At: 09:36 4 June 2010

Chemistry and Ecology 193
Specific AP
1.50
2.00
2.50
3.00
3.50
4.00
4.50
0.00 0.05 0.10 0.15 0.20 0.25 0.30 0.35 0.40
PO4 (µM)
log
(ag
/cel
l h–1
)
Figure 9. Alkaline phosphatase (AP) cell-specific activity (ag P·cell−1·h−1) in relation to inorganic P concentration inthe different layers. The autumn values (circle) were out of linear regression.
and the presence of bacteria, without a good increase in biomass, so the Ionian Sea seemed to actas a CO2 source.
By contrast, at high BGE, the organic matter is transferred from the dissolved to the particulatephase and, probably, into the larger size trophic fractions [45,72,73]. Conversely, during autumnonly, the increase in BGE with the increase in all microbial activities (particularly in meso–bathypelagic waters) indicated that bacteria seem to make a sink of CO2.
4.4. P cycle
AP has been used as a sensitive indicator of P limitation or P starvation [59,74]. It is generallyknown that the expression of some enzymes is regulated by the end product of a reaction [75,76].In this study, a weak inverse correlation was found considering all layers and periods except for theautumn sampling (Figure 9). Moreover, very high values, one order of magnitude higher in autumnthan in the other seasons, were observed. The mechanism of AP regulation probably changes overtime, showing a greater importance of organic matter in regulating AP in autumn in the meso- andbathypelagic waters. Another hypothesis, according to Hoppe [76], was that high AP coincidingwith high phosphate concentrations might be caused by the transport of these enzymes which areattached to sinking particles from euphotic zones. The important changes along the water columnobserved in autumn support this hypothesis. In deep pelagic waters it has been shown that APwas not regulated by the concentration of end products, but the increase in AP was related toC limitation more than P limitation [27]. The decrease in AP with depth, corresponding to anincrease in inorganic P has previously been found in the Mediterranean Sea [18]. In the deepAtlantic waters an increase in cell-specific AP activity with depth was observed [28].
5. Conclusions
This study was aimed mainly at improving current knowledge of the spatial and temporal variationsin the microbial activities involved in the C and P cycles occurring in the Ionian Sea.
Downloaded By: [Zaccone, Renata] At: 09:36 4 June 2010

194 R. Zaccone et al.
Based on the results obtained during a period of seven years (1998–2004), three main findingscan be highlighted:
1. Concerning the vertical distribution of the microbiological parameters, the meso- and bathy-pelagic layers appeared to be quite similar to each other and, in turn, different from the upperepipelagic waters, in terms of prokaryotic abundance and activities. This suggested that differ-ent processes could be performed by prokaryotes at different depths of the water column, evenif microscale patchness cannot be excluded. In the epipelagic zone, a positive effect of waterwarming on microbial activity was observed, indicating a preferential flux of organic mattertowards mineralisation. EEA and BCP were coupled, resulting in an increase in biomass. Inthe meso- and bathypelagic layers, a loose of coupling between these two processes led us tohypothesise the presence of particle-associated prokaryotes. This was also confirmed by thesignificant relationship found between BCP and POC.
2. Seasonality in the investigated microbiological parameters was generally observed. This wasparticularly evident in the epipelagos, which was characterised by a high microbiologicalheterogeneity, as well as in the meso- and bathypelagic layers in which a shift in prevailingenzymatic activity was recorded. Seasonal changes in the rates of organic matter transformationwere found, with a significant increase in autumn.
3. Unlike the dark ocean, BGE values showed an increasing trend with depth, reaching highervalues in the bathypelagic layer. This could be dependent on the well-known occurrence ofthe higher temperature in the deep Mediterranean, and therefore in the Ionian Sea, comparedwith open ocean waters. This corresponds with the high activity rates per cell determined inthe bathypelagic layer. Therefore, the quality of organic carbon material supplied in the seainterior by EMT is the likely cause of observed differences. According to BGE variations, theIonian Sea could act as a source of C in the epipelagic layer and conversely, as a sink of thiselement in the meso- and bathypelagic layers.
References
[1] P. Malanotte-Rizzoli, B.B. Manca, M. Ribera d’Alcalà, A. Theocharis, S. Brenner, G. Budillon and G.E. Ozsoy,The eastern Mediterranean in the 80’s and in the 90’s: The big transition in the intermediate and deep circulation,Dynam. Atmosph. Oceans 29 (1999), pp. 365–395.
[2] W. Roether, B.B. Manca, B. Klein, D. Bregant, D. Georgopoulos, V. Beitzel, D.V. Kovacevic and A. Luchetta, Recentchanges in eastern Mediterranean deep waters, Science 271 (1996), pp. 333–335.
[3] B. Klein, W. Roether, B.B. Manca, D. Bregant, V. Beitzel, V. Kovacevic and A. Luchetta, The large deep watertransient in the eastern Mediterranean, Deep-Sea Res. I 46(1) (1999), pp. 371–414.
[4] N. Pinardi and E. Masetti, Variability of large general circulation of the Mediterranean Sea from observations andmodelling: A review, Paleogeogr. Paleoclimat. Paleoecol. 158 (2000), pp. 153–174.
[5] A. Theocharis, Do we expect significant changes in the Thermohaline Circulation in the Mediterranean in relationto the observed surface layer warming? in Climate Warming and Related Changes in Mediterranean Marine Biota,CIESM Workshop Monographs No. 35, F. Briand, ed., Monaco, 2008, pp. 25–29.
[6] B.B. Manca, V. Kovacevic, M. Gacic and D. Viezzoli, Dense water formation in the southern Adriatic Sea andinteraction with the Ionian Sea in the period 1997–1999, J. Mar. Syst. 33–34 (2002), pp. 133–154.
[7] F. Boero, J.P. Fèral, E.Azzurro, V. Cardine, B. Riedel, M. Despalatooviç, I. Munda, P. Moschella, J. Zaouali, S.Fonda Umani, A. Theocharis, K. Wiltshire and F. Briand, Climate Warming and Related Changes in MediterraneanMarine Biota, in CIESM Workshop Monographs No. 35, F. Briand, ed., Monaco, 2008, pp. 5–21.
[8] P. Malanotte-Rizzoli, B. B. Manca, M. Ribera d’Alcalà, A. Theocharis, A. Bergamasco, D. Bregant, G. Budillon, G.Civitarese, D. Georgopoulos, G. Korres, A. Lascaratos, A. Michelato, E. Sansone, P. Scarazzato and E. Souverme-zoglou, A synthesis of the Ionian Sea hydrography. Circulation and water mass pathways during POEM phase I,Prog. Oceanogr. 39(3) (1997), pp. 153–204.
[9] P.F.J. Lermusiaux andA.R. Robinson, Features of dominant mesoscale variability, circulation patterns and dynamicsin the Strait of Sicily, Deep-Sea Res. I 48 (2001), pp. 1953–1997.
[10] T. Nagata, Production mechanisms of dissolved organic matter, in Microbial Ecology of Oceans, D.L. Kirchman,ed., Wiley-Liss, New York, 2000, pp. 121–152.
[11] I. Obernosterer and G.J. Herndl, Phytoplankton extracellular release and bacterial growth: Dependence on theinorganic N:P ratio, Mar. Ecol. Prog. Ser. 116 (1995), pp. 247–257.
Downloaded By: [Zaccone, Renata] At: 09:36 4 June 2010
Chemistry and Ecology 195
[12] G. Herndl, H.Agoguè, F. Baltar, T. Reinthaler, E. Sintes and M.M. Valera, Regulation of aquatic microbial processes:The ‘microbial loop’ of the sunlit surface waters and the dark ocean dissected, Aquat. Microb. Ecol. 53 (2008), pp.59–68.
[13] G. Caruso and R. Zaccone, Estimates of leucine–aminopeptidase activity in different marine and brackishenvironments, J. Appl. Microbiol. 89 (2000), pp. 951–959.
[14] R. Zaccone, G. Caruso and C. Calì, Heterotrophic bacteria in the northern Adriatic Sea: Seasonal changes andectoenzyme profile, Mar. Environ. Res. 54 (2002), pp. 1–19.
[15] C. Tamburini, J. Garcin, M. Ragor and A. Bianchi, Biopolymer hydrolysis and bacterial production under ambienthydrostatic pressure through a 2000 m water column in the NW Mediterranean, Deep-Sea Res. II 49 (2002), pp.2109–2123.
[16] F. Van Wambeke, S. Heussner, F. Diaz, P. Raimbault and P. Conan, Small-scale variability in the coupling/uncouplingof bacteria, phytoplankton and organic carbon fluxes along the continental margin of the Gulf of Lions, northwesternMediterranean Sea, J. Mar. Syst. 33–34 (2002), pp. 411–429.
[17] C. Misic and M. Fabiano, Ectoenzymatic activity and its relationship to chlorophyll-a and bacteria in the Gulf ofGenoa (Ligurian Sea, NW Mediterrranean), J. Mar. Syst. 60 (2006), pp. 193–206.
[18] R. Zaccone, L.S. Monticelli, A. Seritti, C. Santinelli, M. Azzaro, A. Boldrin, R. La Ferla and M. Ribera D’Alcalà,Bacterial processes in the intermediate and deep layers of the Ionian Sea in winter 1999: Vertical profiles and theirrelationship to the different water masses, J. Geophys. Res. 108 (C9), (2003), pp. 8117-1–11.
[19] F. Van Wambeke, U. Christaki, A. Giannakourou, T. Moutin and K. Souvemerzoglou, Longitudinal and verticaltrends of bacterial limitation by phosphorus and carbon in the Mediterranean Sea, Microb. Ecol. 43 (2002), pp.119–133.
[20] M. Magagnini, C. Corinaldesi, L. S. Monticelli, E. De Domenico and R. Danovaro, Viral abundance and distributionin mesopelagic and bathypelagic waters of the Mediterranean Sea, Deep-Sea Res. I 54 (2007), pp. 1209–1220.
[21] J. Arístegui, G.M. Gasol, C.M. Duarte and G.J. Herndl, Microbial oceanography of the dark ocean’s pelagic realm,Limnol. Oceanogr. 54(5) (2009), pp. 1501–1529.
[22] C.S. Hopkinson Jr. and E.M. Smith, Estuarine respiration: An overview of bentic, pelagic and whole systemrespiration, in Respiration in Aquatic Ecosystems, P.J.L. Williams, ed., Academic Press, New York, 2005, pp.122–146.
[23] C. Santinelli, G.P. Gasparini, L. Nannicini and A. Seritti, Vertical distribution of dissolved organic carbon (DOC)in the western Mediterranean Sea in relation to the hydrological characteristics, Deep-Sea Res. I 49 (2002), pp.2203–2219.
[24] C. Tamburini, J. Garcin and A. Bianchi, Role of deep-sea bacteria in organic matter mineralization and adaptationto hydrostatic pressure conditions in the NW Mediterranean Sea, Aquat. Microb. Ecol. 32 (2003), pp. 209–218.
[25] R. La Ferla, F. Azzaro, M. Azzaro, G. Caruso, F. Decembrini, M. Leonardi, G. Maimone, L.S. Monticelli, F.Raffa, C. Santinelli, R. Zaccone and M. Ribera d’Alcalà, Microbial contribution to carbon biogeochemistry in theMediterranean Sea: Variability of activities and biomass, J. Mar. Syst. 57 (2005), pp. 146–166.
[26] C. Misic, M. Castellano, N. Ruggieri and A. Covazzi Harriague, Variations in ectoenzymatic hydrolytic activity inan oligotrophic environment (southern Tyrrhenian Sea, W Mediterranean), J. Mar. Syst. 73 (2008), pp. 123–137.
[27] H.G. Hoppe and S. Ulrich, Profile of ectoenzymes in the Indian Ocean: Phenomena of phosphatase activity in themesopelagic zone, Aquat. Microb. Ecol. 19 (1999), pp. 139–148.
[28] F. Baltar, J. Arístegui, E. Sintes, H.M. van Haken, J.M. Gasol and G.J. Herndl, Prokaryotic extracellular enzymeactivity in relation to biomass production and respiration in the meso- and bathypelagic waters of the (sub)tropicalAtlantic, Environ. Microbiol. 11(8) (2009), pp. 1998–2014.
[29] R. Zaccone, L.S. Monticelli and D. Zampino, Variability of enzymatic activities in the Ionian Sea, Rapp. Comm. Int.Mer Méditerr. 37 (2004), p. 298.
[30] L.S. Monticelli, G. Caruso, E. De Domenico, F. Azzaro, M. Azzaro, R. La Ferla, M. Leonardi, G. Maimone andF. Decembrini, Attività e biomasse microbiche nelle acque superficiali del Mar Ionio, Proc. Ital. Assoc. Oceanol.Limnol. 19 (2008), pp. 349–359.
[31] A.G.D. El Hag and G.E. Fogg, The distribution of coccoid blue–green algae (cyanobacteria) in the Menai Strait andthe Irish Sea, Br. J. Phycol. 21 (1986), pp. 45–54.
[32] K.G. Porter and Y.S. Feig, The use of DAPI for identifying and counting aquatic microflora, Limnol. Oceanogr. 25(1980), pp. 943–948.
[33] D.C. Smith and F. Azam, A simple, economical method for measuring bacterial protein synthesis rates in seawaterusing 3H-leucine, Mar. Microb. Food Webs 6 (1992), pp. 107–114.
[34] D.L. Kirchman, Leucine incorporation as a measure of biomass production by heterotrophic bacteria, in Handbookof Methods in Aquatic Microbial Ecology, P.F Kemp, B.F. Sherr and E.B. Sherr, eds., Lewis, Boca Raton, FL, 1993,pp. 509–512.
[35] H.G. Hoppe, Significance of exoenzymatic activities in the ecology of brackish water: measurements by means ofmethylumbelliferyl-substrates, Mar. Ecol. Progr. Ser. 11 (1983), pp. 299–308.
[36] L. Lazzara, F. Bianchi, M. Falcucci, V. Hull, M. Modigh and M. Ribera D’Alcalà, Pigmenti clorofilliani, NovaThalassia 11 (1990), pp 207–223.
[37] K. Iseki, R.W. MacDonald and E. Carmack, Distribution of particulate matter in the south-eastern Beaufort Sea inlate summer, Proc. NIPR Symp. Polar Biol. 1 (1987), pp. 35–46.
[38] J.D.H. Strickland and T.R. Parsons, A Practical Handbook of Seawater Analysis, Bulletin of Fishery Research,Canada, 1972.
Downloaded By: [Zaccone, Renata] At: 09:36 4 June 2010

196 R. Zaccone et al.
[39] T.T. Packard, The measurement of respiratory electron transport activity in marine phytoplankton, J. Mar. Res. 29(1971), pp. 235–244.
[40] R. La Ferla, M. Azzaro, G. Civitarese and M. Ribera D’Alcalà, Distribution patterns of carbon oxidation in theeastern Mediterranean Sea: Evidence of changes in remineralization processes, J. Geophys. Res. 108 (2003),pp. 8111-1–14.
[41] P.C. Pollard and D.J.W. Moriarty, Validity of the tritiated thymidine methods for estimating bacterial growth rates:Measurement of isotope dilution during DNA synthesis, Appl. Environ. Microbiol. 48 (1984), pp. 1076–1083.
[42] R La Ferla, M. Azzaro and G. Maimone, Microbial respiration and trophic regimes in the northern Adriatic Sea(Mediterranean Sea), Estuar. Coast. Shelf Sci. 69 (2006), pp. 196–204.
[43] T.T. Packard, M. Denis, M. Rodier and P. Garfield, Deep-ocean metabolic CO2 production: Calculations from ETSactivity, Deep-Sea Res. I 35 (1988), pp. 371–382.
[44] M. Azzaro, R. La Ferla and F. Azzaro, Microbial respiration in the aphotic zone of the Ross Sea (Antarctica), Mar.Chem. 99 (2006), pp. 199–209.
[45] P.A. del Giorgio and J.J. Cole, Bacterial growth efficiency in natural aquatic systems, Annu. Rev. Ecol. Syst. 29(1998), pp. 503–541.
[46] K.R. Clarke and R.M. Warwick, A further biodiversity index applicable to species lists: Variation in taxonomicdistinctness, Mar. Ecol. Prog. Ser. 216 (2001), pp. 265–278.
[47] K.R. Clarke and R.M.Warwick, Similarity-based testing for community pattern: The 2-way layout with no replication,Mar. Biol. 118 (1994), pp. 167–176.
[48] A. Boldrin, S. Miserocchi, S. Rabitti, M.M. Turchetto, V. Balboni and G. Socal, Particulate matter in the southernAdriatic and Ionian Seas: Characterisation and downward fluxes, J. Mar. Syst. 33–34 (2002), pp. 389–410.
[49] T. Tanaka and F. Rassoulzadegan, Vertical and seasonal variations of bacterial abundance and production in themesopelagic layer of the NW Mediterranean Sea: Bottom-up and top-down controls, Deep-Sea Res. I 51 (2004),pp. 531–544.
[50] T.F. Thingstad and R. Rassoulzadegan, Nutrient limitation, microbial food webs, and ‘biological C-pumps’, suggestedinteraction in a P-limited Mediterranean, Mar. Ecol. Progr. Ser. 117 (1995), pp. 125–137.
[51] H.J. Minas, La distribution de l’oxygéne dissous en relation avec la production primaire en Méditerranée Nord-Occidentale, Mar. Biol. 7 (1970), pp. 181–204.
[52] T.F. Thingstad, M.D. Krom, R.F.C. Mantoura, G.A.F. Flaten, S. Groom, B. Herut, N. Kress, CS. Law, A. Pasternak,P. Pitta, S. Psarra, F. Rassoulzadegan, T. Tanaka, A. Tselepides, P. Wassmann, E.M.S. Woodward, C. Wexels Riser, G.Zodiatis and T. Zohary, Nature of P limitation in the ultraoligotrophic eastern Mediterranean, Science 309 (2005),pp. 1068–1071.
[53] C. Misic and A. Covazzi Harriague, Organic matter recycling in a shallow coastal zone (NW Mediterranean): Theinfluence of local and global climatic forcing and organic matter lability on hydrolytic enzyme activity, Contin. ShelfRes. 28 (2008), pp. 2725–2735.
[54] E.S. Kritzberg, J.M. Arietta and C.M. Duarte, Temperature and phosphorous regulating carbon flux through bacteriain a coastal marine system, Aquat. Microb. Ecol. 58 (2010), 141–151.
[55] A.L. Huston and J. Deming, Relationships between microbial extracellular enzymatic activity and suspended andsinking particulate organic matter: Seasonal transformations in the North Water, Deep-Sea Res. II 49 (2002), pp.5211–5225.
[56] J. Rath, C. Schiller and G.J. Herndl, Ectoenzymatic activity and bacterial dynamic along a trophic gradient in theCaribbean Sea, Mar Ecol. Progr. Ser. 102 (1996), pp. 89–96.
[57] R. La Ferla, R. Zaccone, M. Azzaro and G. Caruso, Microbial respiratory activities in the northern Adriatic Sea(Mediterranean Sea), Chem. Ecol. 18 (2002), pp. 75–84.
[58] F. Van Wambeke, F. Christaki, U. Bianchi, M. Psarra and A. Tselepides, Heterotrophic bacterial production in theCretan Sea (NE Mediterranean), Prog. Oceanogr. 46 (2000), pp. 205–216.
[59] T. Zohary and R.V. Robarts, Experimental study of microbial P limitation in the eastern Mediterranean, Limnol.Oceanogr. 43(3) (1998), pp. 387–395.
[60] D.C. Smith, M. Simons, A.L. Alldredge and F. Azam, Intense hydrolytic enzyme activity on marine aggregates andimplication for rapid particle dissolution, Nature 359 (1992), pp. 139–142.
[61] H.G. Hoppe, C. Arnosti, G.J. Herndl, Ecological significance of bacterial enzymes in the marine environment, inEnzyme in the Environment: Activity Ecology and Application, R.G. Burns and R.P. Dick, eds, Marcel Dekker, NewYork, 2002, pp. 73–108.
[62] F. Azam, D.C. Smith, G.F. Steward and A. Hagstrom, Bacteria–organic matter coupling and significance for carboncycling, Microb. Ecol. 28 (1993), pp. 167–179.
[63] F. Baltar, J.Arístegui, J.M. Gasol, E. Sintes, H.M. van Haken and G.J. Herndl, High dissolved extracellular enzymaticactivity in the deep central Atlantic Ocean, Aquat. Microb. Ecol. 58 (2010), pp. 287–302.
[64] C. Misic, M. Castellano, N. Ruggieri and A. Covazzi Harriague, Variations in ectoenzymatic hydrolytic activity inan oligotrophic environment (southern Tyrrhenian Sea, W Mediterranean), J. Mar. Syst. 73 (2008), pp. 123–137.
[65] J. Martinez, D.C. Smith, F. Steward and F. Azam, Variability in ectohydrolytic enzyme activities of pelagic marinebacteria and its significance for substrate processing in the sea, Aquat. Microb. Ecol. 10 (1996), 223–230.
[66] R.Y. Morita, Feast or famine in the deep sea. Developments in industrial microbiology, Soc. Int. Microbiol. 25(1984), pp. 5–16.
[67] T. Tanaka and F. Rassoulzadegan, Full-depth profile (0–2000 m) of bacteria, heterotrophic nanoflagellates andciliates in the NW Mediterranean Sea: Vertical partitioning of microbial trophic structures, Deep-Sea Res. II 49(2002), pp. 2093–2107.
Downloaded By: [Zaccone, Renata] At: 09:36 4 June 2010

Chemistry and Ecology 197
[68] H.G. Hoppe, Use of fluorogenic model substrates for extracellular enzyme activity (EEA) measurement of bacteria,in Handbook of Methods in Aquatic Microbial Ecology, P.F. Kemp, B.F. Sherr and E.B. Sherr, eds., Lewis, BocaRaton, FL, 1993, pp. 423–432.
[69] C. Tamburini, J. Garcin and A. Bianchi, Role of deep-sea bacteria in organic matter mineralization and adaptationto hydrostatic pressure conditions in the NW Mediterranean Sea, Aquat. Microb. Ecol. 32 (2002), pp. 209–218.
[70] T.R. Anderson and C.M. Turley, Low bacterial growth efficiency in the oligotrophic eastern Mediterranean Sea: Amodelling analysis, J. Plankton Res. 25(9) (2003), pp. 1011–1019.
[71] J.M. Gasol, M.D. Doval, J. Pinhassi, J.I. Calderon-Paz, N. Guixa-Bouixareu, D. Vaqué and C. Pedrós-Alió, Dielvariations in bacterial heterotrophic activity and growth in the northwestern Mediterranean Sea, Mar. Ecol. Prog.Ser. 164 (1998), pp 107–124.
[72] P.A. del Giorgio and C.M. Duarte, Respiration in the open ocean, Nature 420 (2002), pp. 379–384.[73] R. Cajal-Medrano and H. Maske, Growth efficiency and respiration at different growth rates in glucose-limited
chemostat with natural marine bacteria populations, Aquat. Microb. Ecol. 38 (2005), pp. 125–133.[74] T.F. Thingstad and R.F.C. Mantoura, Tritrating excess nitrogen content of phosphorous-deficient eastern Mediter-
ranean surface water using alkaline phosphatase activity as bio-indicator, Limnol. Oceanogr. Methods 3 (2005),pp. 94–100.
[75] R.J. Chròst, Environmental control of the synthesis and activity of aquatic microbial ectoenzymes, in MicrobialEnzymes in Aquatic Environments, R.J. Chròst, ed., Springer, New York, 1991, pp. 29–59.
[76] H.G. Hoppe, Phosphatase activity in the sea, Hydrobiologia 493 (2003), pp. 187–200.
Downloaded By: [Zaccone, Renata] At: 09:36 4 June 2010
Related Documents