Projections of the Size and Composition of the U.S. Population: 2014 to 2060 Population Estimates and Projections Current Population Reports By Sandra L. Colby and Jennifer M. Ortman Issued March 2015 P25-1143 U.S. Department of Commerce Economics and Statistics Administration U.S. CENSUS BUREAU census.gov INTRODUCTION Between 2014 and 2060, the U.S. population is pro- jected to increase from 319 million to 417 million, reaching 400 million in 2051. The U.S. population is projected to grow more slowly in future decades than in the recent past, as these projections assume that fertility rates will continue to decline and that there will be a modest decline in the overall rate of net inter- national migration. By 2030, one in five Americans is projected to be 65 and over; by 2044, more than half of all Americans are projected to belong to a minority group (any group other than non-Hispanic White alone); and by 2060, nearly one in five of the nation’s total population is projected to be foreign born. This report summarizes results from the U.S. Census Bureau’s 2014 National Projections, with a focus on changes in the age structure and shifts in the racial and ethnic composition of the population—both the total population as well as the native and foreign born. 2014 NATIONAL PROJECTIONS This report is based on the 2014 National Projections of the resident population by age, sex, race, Hispanic origin, and country of birth (nativity), and include demographic components of change—births, deaths, and net international migration. The projections, based on the 2010 Census and official estimates through 2013, were produced using cohort-component meth- ods. Such methods project the components of popula- tion change separately for each birth cohort (persons born in a given year) based on past trends. The base population is advanced each year by using projected survival rates and net international migration. A new birth cohort is added to the population by applying the annual projected fertility rates to the female popula- tion. The projections cover the period 2014 to 2060. The 2014 National Projections are the first series of Census Bureau projections to incorporate separate assumptions about the fertility of native and foreign- born women. Differentiating assumptions about fertil- ity by nativity is expected to better account for the effects of international migration of the foreign born on changes in the size and composition of the total U.S. population. The 2014 National Projections, including summary tables, downloadable files, and methodology and assumptions, can be found at <www.census.gov /population/projections/data/national/2014.html>.

Welcome message from author
This document is posted to help you gain knowledge. Please leave a comment to let me know what you think about it! Share it to your friends and learn new things together.
Transcript

Projections of the Size and Composition of the U.S. Population: 2014 to 2060Population Estimates and Projections
Current Population Reports
By Sandra L. Colby and Jennifer M. OrtmanIssued March 2015P25-1143
U.S. Department of CommerceEconomics and Statistics Administration
U.S. CENSUS BUREAU
census.gov
INTRODUCTION
Between 2014 and 2060, the U.S. population is pro-jected to increase from 319 million to 417 million, reaching 400 million in 2051. The U.S. population is projected to grow more slowly in future decades than in the recent past, as these projections assume that fertility rates will continue to decline and that there will be a modest decline in the overall rate of net inter-national migration. By 2030, one in five Americans is projected to be 65 and over; by 2044, more than half of all Americans are projected to belong to a minority group (any group other than non-Hispanic White alone); and by 2060, nearly one in five of the nation’s total population is projected to be foreign born.
This report summarizes results from the U.S. Census Bureau’s 2014 National Projections, with a focus on changes in the age structure and shifts in the racial and ethnic composition of the population—both the total population as well as the native and foreign born.
2014 NATIONAL PROJECTIONS
This report is based on the 2014 National Projections of the resident population by age, sex, race, Hispanic origin, and country of birth (nativity), and include
demographic components of change—births, deaths, and net international migration. The projections, based on the 2010 Census and official estimates through 2013, were produced using cohort-component meth-ods. Such methods project the components of popula-tion change separately for each birth cohort (persons born in a given year) based on past trends. The base population is advanced each year by using projected survival rates and net international migration. A new birth cohort is added to the population by applying the annual projected fertility rates to the female popula-tion. The projections cover the period 2014 to 2060.
The 2014 National Projections are the first series of Census Bureau projections to incorporate separate assumptions about the fertility of native and foreign-born women. Differentiating assumptions about fertil-ity by nativity is expected to better account for the effects of international migration of the foreign born on changes in the size and composition of the total U.S. population.
The 2014 National Projections, including summary tables, downloadable files, and methodology and assumptions, can be found at <www.census.gov /population/projections/data/national/2014.html>.
2 U.S. Census Bureau
PROJECTED TRENDS IN POPULATION SIZE AND GROWTH
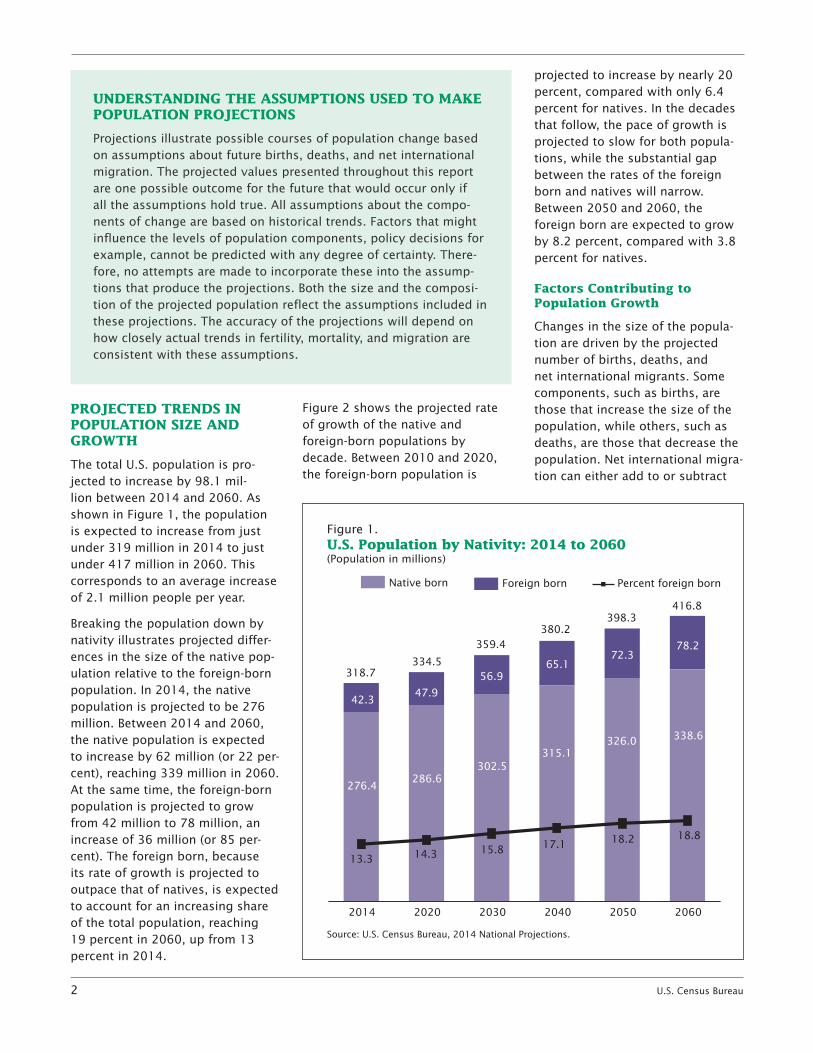
The total U.S. population is pro-jected to increase by 98.1 mil-lion between 2014 and 2060. As shown in Figure 1, the population is expected to increase from just under 319 million in 2014 to just under 417 million in 2060. This corresponds to an average increase of 2.1 million people per year.
Breaking the population down by nativity illustrates projected differ-ences in the size of the native pop-ulation relative to the foreign-born population. In 2014, the native population is projected to be 276 million. Between 2014 and 2060, the native population is expected to increase by 62 million (or 22 per-cent), reaching 339 million in 2060. At the same time, the foreign-born population is projected to grow from 42 million to 78 million, an increase of 36 million (or 85 per-cent). The foreign born, because its rate of growth is projected to outpace that of natives, is expected to account for an increasing share of the total population, reaching 19 percent in 2060, up from 13 percent in 2014.
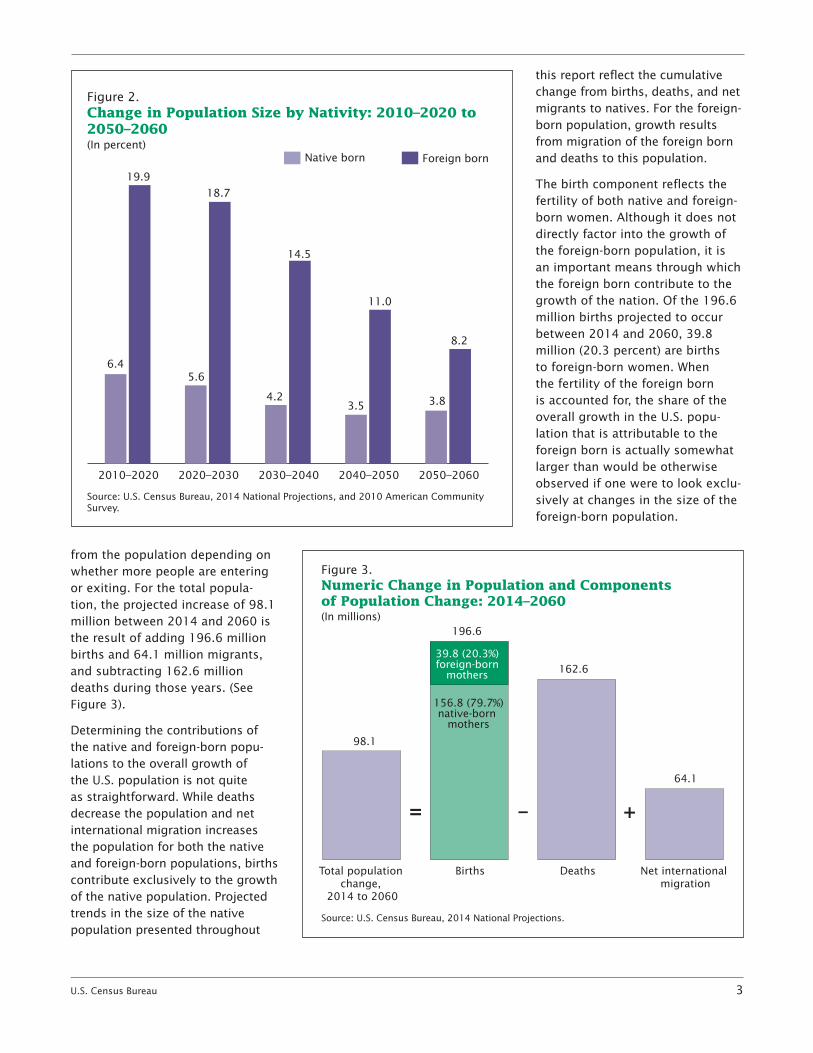
Figure 2 shows the projected rate of growth of the native and foreign-born populations by decade. Between 2010 and 2020, the foreign-born population is
projected to increase by nearly 20 percent, compared with only 6.4 percent for natives. In the decades that follow, the pace of growth is projected to slow for both popula-tions, while the substantial gap between the rates of the foreign born and natives will narrow. Between 2050 and 2060, the foreign born are expected to grow by 8.2 percent, compared with 3.8 percent for natives.
Factors Contributing to Population Growth
Changes in the size of the popula-tion are driven by the projected number of births, deaths, and net international migrants. Some components, such as births, are those that increase the size of the population, while others, such as deaths, are those that decrease the population. Net international migra-tion can either add to or subtract
Figure 1.U.S. Population by Nativity: 2014 to 2060
Source: U.S. Census Bureau, 2014 National Projections.
Foreign bornNative born
(Population in millions)
206020502040203020202014
42.3
276.4
47.9
286.6
56.9
302.5
65.1
315.1
72.3
326.0
78.2
338.6
13.3
318.7334.5
359.4380.2
398.3416.8
Percent foreign born
14.3 15.8 17.1 18.2 18.8
UNDERSTANDING THE ASSUmPTIONS USED TO mAkE POPULATION PROJECTIONS
Projections illustrate possible courses of population change based on assumptions about future births, deaths, and net international migration. The projected values presented throughout this report are one possible outcome for the future that would occur only if all the assumptions hold true. All assumptions about the compo-nents of change are based on historical trends. Factors that might influence the levels of population components, policy decisions for example, cannot be predicted with any degree of certainty. There-fore, no attempts are made to incorporate these into the assump-tions that produce the projections. Both the size and the composi-tion of the projected population reflect the assumptions included in these projections. The accuracy of the projections will depend on how closely actual trends in fertility, mortality, and migration are consistent with these assumptions.
U.S. Census Bureau 3
from the population depending on whether more people are entering or exiting. For the total popula-tion, the projected increase of 98.1 million between 2014 and 2060 is the result of adding 196.6 million births and 64.1 million migrants, and subtracting 162.6 million deaths during those years. (See Figure 3).
Determining the contributions of the native and foreign-born popu-lations to the overall growth of the U.S. population is not quite as straightforward. While deaths decrease the population and net international migration increases the population for both the native and foreign-born populations, births contribute exclusively to the growth of the native population. Projected trends in the size of the native population presented throughout
this report reflect the cumulative change from births, deaths, and net migrants to natives. For the foreign-born population, growth results from migration of the foreign born and deaths to this population.
The birth component reflects the fertility of both native and foreign-born women. Although it does not directly factor into the growth of the foreign-born population, it is an important means through which the foreign born contribute to the growth of the nation. Of the 196.6 million births projected to occur between 2014 and 2060, 39.8 million (20.3 percent) are births to foreign-born women. When the fertility of the foreign born is accounted for, the share of the overall growth in the U.S. popu-lation that is attributable to the foreign born is actually somewhat larger than would be otherwise observed if one were to look exclu-sively at changes in the size of the foreign-born population.
Figure 2.Change in Population Size by Nativity: 2010–2020 to 2050–2060
Source: U.S. Census Bureau, 2014 National Projections, and 2010 American Community Survey.
Native born(In percent)
2050–20602040–20502030–20402020–20302010–2020
6.4
19.9
18.7
14.5
11.0
8.2
5.6
4.23.5 3.8
Foreign born
Figure 3.Numeric Change in Population and Components of Population Change: 2014–2060
Source: U.S. Census Bureau, 2014 National Projections.
Net international migration
DeathsBirthsTotal population change,
2014 to 2060
(In millions)
98.1
= – +
196.6
64.1
162.639.8 (20.3%)foreign-born
mothers
156.8 (79.7%)native-born
mothers
4 U.S. Census Bureau
AGE COmPOSITION
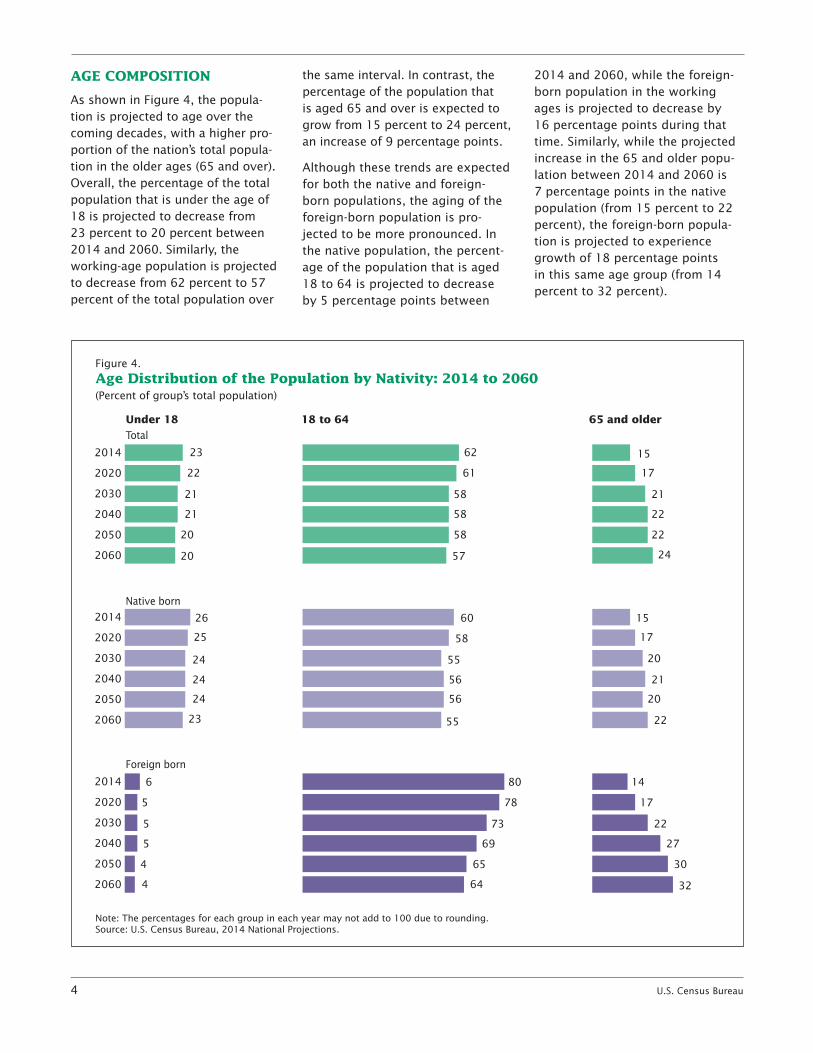
As shown in Figure 4, the popula-tion is projected to age over the coming decades, with a higher pro-portion of the nation’s total popula-tion in the older ages (65 and over). Overall, the percentage of the total population that is under the age of 18 is projected to decrease from 23 percent to 20 percent between 2014 and 2060. Similarly, the working-age population is projected to decrease from 62 percent to 57 percent of the total population over
the same interval. In contrast, the percentage of the population that is aged 65 and over is expected to grow from 15 percent to 24 percent, an increase of 9 percentage points.
Although these trends are expected for both the native and foreign-born populations, the aging of the foreign-born population is pro-jected to be more pronounced. In the native population, the percent-age of the population that is aged 18 to 64 is projected to decrease by 5 percentage points between
2014 and 2060, while the foreign-born population in the working ages is projected to decrease by 16 percentage points during that time. Similarly, while the projected increase in the 65 and older popu-lation between 2014 and 2060 is 7 percentage points in the native population (from 15 percent to 22 percent), the foreign-born popula-tion is projected to experience growth of 18 percentage points in this same age group (from 14 percent to 32 percent).
Figure 4.
Age Distribution of the Population by Nativity: 2014 to 2060(Percent of group’s total population)
Under 18 18 to 64 65 and older
Total
Native born
Foreign born
62
61
58
58
58
57
80
78
73
69
65
64
60
58
55
56
56
55
Note: The percentages for each group in each year may not add to 100 due to rounding.Source: U.S. Census Bureau, 2014 National Projections.
23
22
21
21
20
20
6
5
5
5
4
4
15
17
21
22
22
24
14
17
22
27
30
32
15
17
20
20
21
22
26
25
24
24
24
23
2060
2050
2040
2030
2020
2014
2060
2050
2040
2030
2020
2014
2060
2050
2040
2030
2020
2014
U.S. Census Bureau 5
The foreign-born population is projected to be concentrated in the adult ages, with fewer than 10 percent of its population aged 17 and under, as compared with nearly a quarter of the native population. This youth population is predomi-nately native because all children born in the United States (includ-ing children born to foreign-born mothers) are considered native, and also because rates of international migration are comparatively low in these ages.
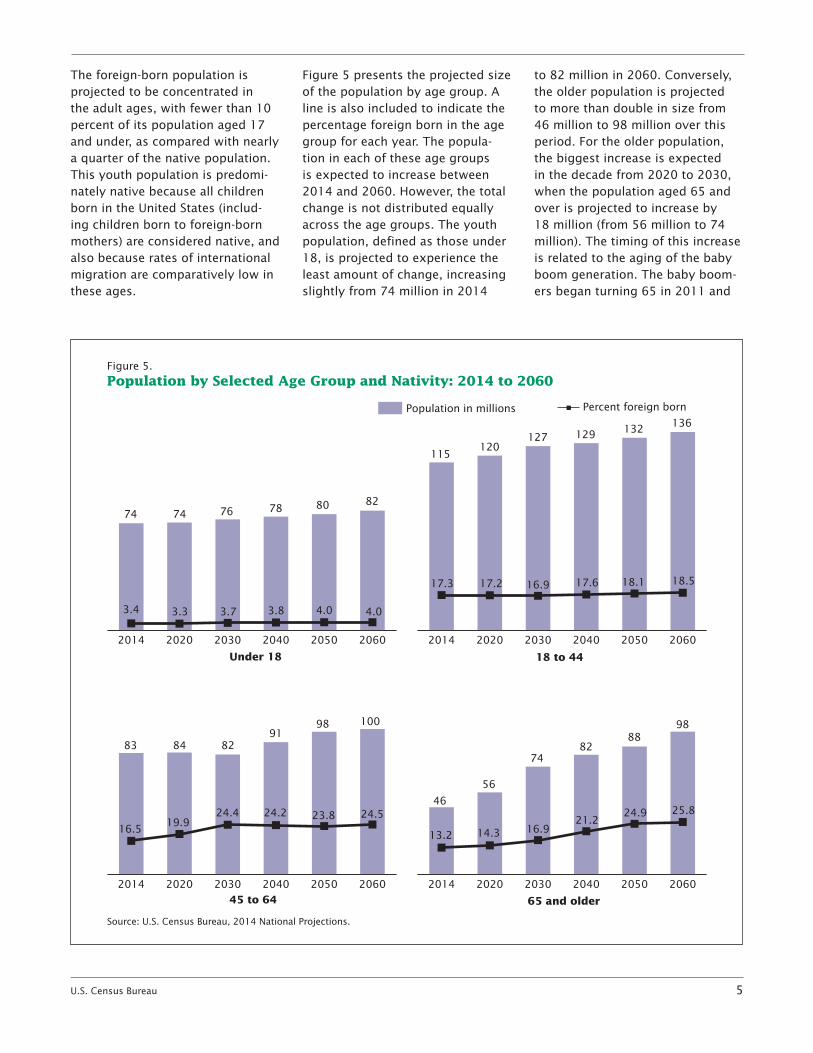
Figure 5 presents the projected size of the population by age group. A line is also included to indicate the percentage foreign born in the age group for each year. The popula-tion in each of these age groups is expected to increase between 2014 and 2060. However, the total change is not distributed equally across the age groups. The youth population, defined as those under 18, is projected to experience the least amount of change, increasing slightly from 74 million in 2014
to 82 million in 2060. Conversely, the older population is projected to more than double in size from 46 million to 98 million over this period. For the older population, the biggest increase is expected in the decade from 2020 to 2030, when the population aged 65 and over is projected to increase by 18 million (from 56 million to 74 million). The timing of this increase is related to the aging of the baby boom generation. The baby boom-ers began turning 65 in 2011 and
Figure 5.
Population by Selected Age Group and Nativity: 2014 to 2060
115120
127 129 132 136Population in millions
Under 18 18 to 44
45 to 64 65 and older
Percent foreign born
767474 78 80 82
46
56
7482
8898
82848391
98 100
Source: U.S. Census Bureau, 2014 National Projections.
17.3 17.2 17.616.9 18.1 18.5
206020502040203020202014
3.4 3.3 3.7 3.8 4.0 4.0
206020502040203020202014
13.2 14.321.2
16.9
24.9 25.8
206020502040203020202014
16.519.9
24.4 24.2 23.8 24.5
206020502040203020202014

6 U.S. Census Bureau
by 2030 they all will be aged 65 and older. The impact of this can also be seen in the figure for ages 45 to 64, where the population is expected to decrease between 2020 and 2030, as the baby boom-ers age out of this group. The pop-ulation aged 18 to 44 is projected to increase steadily throughout the projection period, from 115 million in 2014 to 136 million in 2060.
In addition to showing the popula-tion by age, Figure 5 includes the percentage of the population in each age group that is foreign born. The share of the youth population that is foreign born is projected to remain low throughout the projec-tion period, ranging from a low of 3.3 percent in 2020 to a high of 4 percent in 2050 and 2060. Like-wise, the share of the population aged 18 to 44 that is foreign born is projected to remain stable between 2014 and 2060. Approximately 17 to 18 percent of the population in this age group is projected to be foreign born in all years.
More variation is expected in the distribution of the two older age groups by nativity. The trends projected for these groups reflect the aging of both the baby boom-ers and the foreign born. In 2060, the total population aged 45 to 64 is projected to be just over 100 million, up from 83 million in 2014. Between 2014 and 2030, the share of the population aged 45 to 64 that is foreign born is projected to increase from 17 to 24 percent, with the largest increase shown to occur between 2020 and 2030. From 2030 to 2060, the share of the population that is foreign born in these ages is projected to remain stable at around 24 percent.
For the oldest age group, those 65 and over, the foreign-born population is expected to nearly double its share, increasing from 13 percent in 2014 to 26 percent in 2060. As was discussed earlier, the share of the population that is aged 65 and older is expected to increase within both the native and
foreign-born populations, how-ever, the percentage increase is projected to be much larger for the foreign born. This helps to explain the increase in the proportion of the population aged 65 and older that is foreign born.
Table 1 provides additional infor-mation on projected changes in the population by age, allowing for comparisons between the native and foreign-born popula-tions within particular age groups. For the youngest age group, under 18, the foreign-born population is projected to increase from just over 2.5 million in 2014 to around 3.3 million in 2060, an increase of 29.8 percent. In comparison, the native population under age 18 is projected to increase by only 8.4 percent between 2014 and 2060, corresponding to the increase from 71 million in 2014 to 79 million in 2060. The percentage increase pro-jected for the period 2014 to 2060 is similar for both the native and foreign-born populations aged 18
Table 1.Population by Nativity and Age Group: 2014 to 2060(Population in thousands)
Nativity and age groupPopulation Change, 2014 to 2060
2014 2020 2030 2040 2050 2060 Number Percent
Total All ages . . . . . . . . . . 318,748 334,503 359,402 380,219 398,328 416,795 98,047 30 .8Under 18 . . . . . . . . . . . . . . . . . 73,591 74,128 76,273 78,185 79,888 82,309 8,718 11 .818 to 44 . . . . . . . . . . . . . . . . . . 115,426 120,073 126,588 128,669 132,371 136,310 20,884 18 .145 to 64 . . . . . . . . . . . . . . . . . . 83,477 83,861 82,434 91,021 98,074 100,013 16,536 19 .865 and older . . . . . . . . . . . . . . . 46,255 56,441 74,107 82,344 87,996 98,164 51,909 112 .2
Natives All ages . . . . . . . . . . 276,398 286,611 302,545 315,103 326,030 338,564 62,166 87 .5Under 18 . . . . . . . . . . . . . . . . . 71,083 71,683 73,486 75,189 76,735 79,055 7,972 8 .418 to 44 . . . . . . . . . . . . . . . . . . 95,441 99,369 105,145 106,053 108,433 111,141 15,699 22 .545 to 64 . . . . . . . . . . . . . . . . . . 69,717 67,196 62,302 68,986 74,761 75,493 5,776 14 .465 and older . . . . . . . . . . . . . . . 40,157 48,362 61,612 64,876 66,101 72,876 32,719 77 .3
Foreign Born All ages . . . . . . . . . . 42,350 47,892 56,857 65,116 72,299 78,230 35,881 84 .7Under 18 . . . . . . . . . . . . . . . . . 2,508 2,445 2,787 2,996 3,153 3,254 746 29 .818 to 44 . . . . . . . . . . . . . . . . . . 19,984 20,704 21,443 22,616 23,937 25,169 5,185 25 .945 to 64 . . . . . . . . . . . . . . . . . . 13,760 16,665 20,132 22,035 23,313 24,520 10,760 78 .265 and older . . . . . . . . . . . . . . . 6,098 8,079 12,495 17,469 21,895 25,288 19,190 314 .7
Source: U .S . Census Bureau, 2014 National Projections .

U.S. Census Bureau 7
to 44. In this age group, the native population is projected to increase by 22.5 percent compared to 25.9 percent for the foreign born. Pat-terns of growth in the older ages vary by nativity, with a larger per-centage increase projected for the foreign-born population in both the 45 to 64 year-old age group and the 65 and older age group. In the 45 to 64 year age group, both the numeric and percentage changes between 2014 and 2060 are pro-jected to be larger for the foreign born. The foreign-born population in this age group is projected to increase by over 10.7 million (78.2 percent) compared to an increase of just 5.7 million (14.4 percent) for natives. The difference in the proportional growth of the popula-tion by nativity for the 65 and older age group is more pronounced. The
foreign-born population aged 65 and older is projected to increase by over 300 percent between 2014 and 2060, from 6 million in 2014 to 25 million in 2060. In compari-son, the native population aged 65 and over is projected to grow from 40 million in 2014 to 73 million in 2060, an increase of 77 percent.
Dependency ratios offer another way to examine the changing age structure of the younger as well as older populations. Dependency ratios are an indicator of the potential burden of the dependent population, approximated by those under 18 years and those 65 and older, on those in the working-age population. The ratios are calculated by dividing the number of people in the dependent age groups by the number in the work-ing ages and then multiplying by
100. Old-age dependency is the ratio of individuals 65 and older relative to the population aged 18 to 64, while youth dependency is the ratio of individuals under the age of 18 relative to the population aged 18 to 64. Total dependency is the sum of the population under age 18 and those 65 and over rela-tive to the population aged 18 to 64.
Due to the increasing share of the population that is 65 and older, the old-age dependency ratio is pro-jected to increase, surpassing the youth dependency ratio in 2033 (see Figure 6). The old-age depen-dency ratio is projected to continue to increase after 2033, while the youth dependency ratio is projected to decrease slightly. The increase in the old-age dependency ratio is pro-jected to drive the overall increase in the total dependency ratio.
Figure 6.
Dependency Ratios: 2014 to 2060
Note: Old-age dependency = (Population aged 65 and over/Population aged 18 to 64)*100.Youth dependency = (Population under 18/Population aged 18 to 64)*100.Total dependency = ((Population aged 65 and over + Population under 18)/Population aged 18 to 64)*100.Source: U.S. Census Bureau, 2014 National Projections.
RatioTotal dependencyOld-age dependency Youth dependency
0
10
20
30
40
50
60
70
80
90
100
2060205520502045204020352030202520202015

8 U.S. Census Bureau
According to these projections, there will be 76 people under age 18 and 65 or older for every 100 individuals aged 18 to 64 by 2060.
Figure 7 shows the age and sex structure of the U.S. population by nativity in 2014 and in 2060. The dark purple bars represent the size of the foreign-born population
and the light purple bars repre-sent the native population. The age structure of the foreign-born population is quite different than that of the native population. In 2014, the majority of the foreign born are concentrated in the ages 20 to 60. By 2060, the core of the foreign-born population is pro-jected to expand to include the
ages between 60 and 80, as the current population grows older and the population in the working ages is sustained through the arrival of new foreign-born individuals. In contrast, the native population is more evenly distributed across the ages 65 and under in 2014, with notable exceptions including the bulges associated with the baby boom (ages 50 to 68) and the echo boom (approximate ages of 13 to 33).1 In the 2060 pyramid, these bulges are no longer apparent in the native population. Both the native and foreign-born popula-tions are projected to see increases in the size of the older population in 2060.
RACE AND HISPANIC ORIGIN
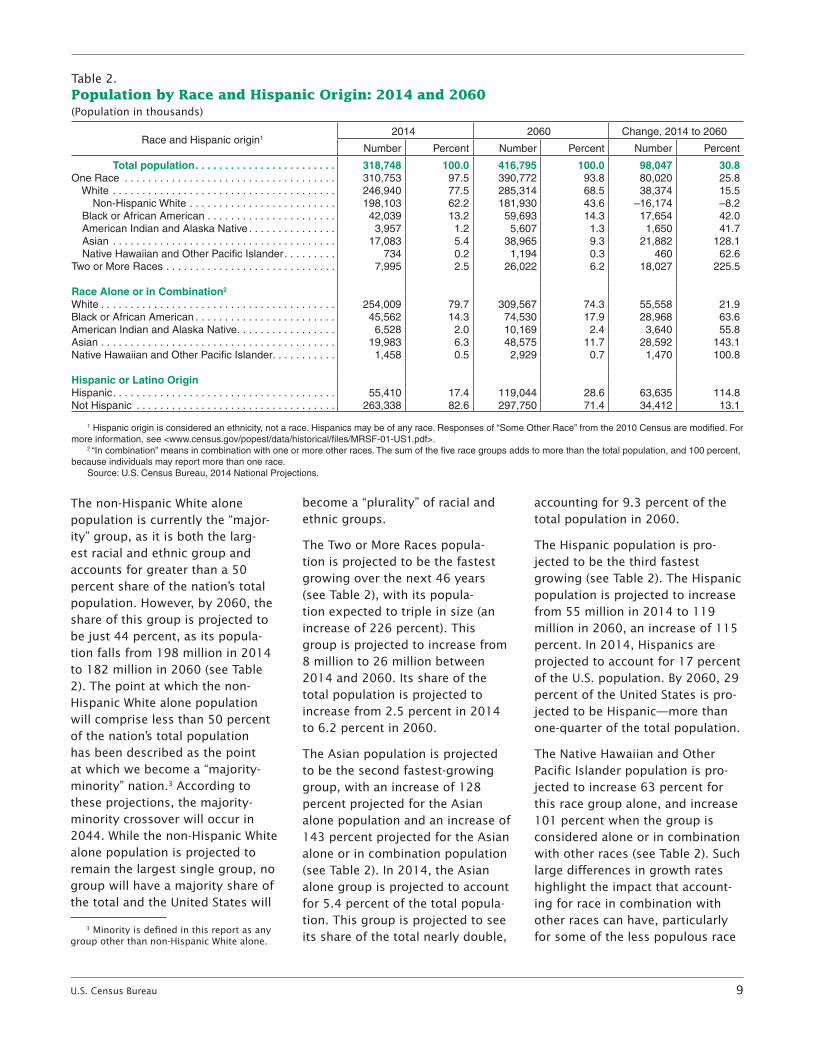
The United States is projected to become more racially and ethnically diverse in the coming years. Table 2 presents projections of the size and distribution of the population by race and Hispanic origin in 2014 and 2060. The top panel shows the race of those reporting to have a single race (97.5 percent in 2014) as well as those reporting two or more races (2.5 percent). The mid-dle panel shows all those reporting to have each race, either alone or in combination with others.2 The lower panel shows those who were Hispanic and non-Hispanic (17.4 percent and 82.6 percent respec-tively in 2014).
1 The echo boom refers to the children born to baby boomers.
2 Accounting for those who report their race alone or in combination has the largest impact on the American Indian and Alaska Native and Native Hawaiian and Other Pacific Islander populations. The American Indian and Alaska Native population alone or in combination with other races (6.5 million) is projected to be 65 percent larger than those reporting that race alone (4.0 million) in 2014. The Native Hawaiian and Other Pacific Islander population alone or in combination with other races (1.5 million) is projected to be 99 percent larger than those reporting that race alone (734 thousand) in 2014.
Figure 7.
Age and Sex Structure of the Population by Nativity: 2014 and 2060
Source: U.S. Census Bureau, 2014 National Projections.
Male
Age
Millions
Female
Female
2014
Native born Foreign born
3 2 10
10
20
30
40
50
60
70
80
90
100+
Male
2060
3 2 1 00
10
20
30
40
50
60
70
80
90
100+
0 1 2 3
1 2 3
U.S. Census Bureau 9
The non-Hispanic White alone population is currently the “major-ity” group, as it is both the larg-est racial and ethnic group and accounts for greater than a 50 percent share of the nation’s total population. However, by 2060, the share of this group is projected to be just 44 percent, as its popula-tion falls from 198 million in 2014 to 182 million in 2060 (see Table 2). The point at which the non-Hispanic White alone population will comprise less than 50 percent of the nation’s total population has been described as the point at which we become a “majority-minority” nation.3 According to these projections, the majority-minority crossover will occur in 2044. While the non-Hispanic White alone population is projected to remain the largest single group, no group will have a majority share of the total and the United States will
3 Minority is defined in this report as any group other than non-Hispanic White alone.
become a “plurality” of racial and ethnic groups.
The Two or More Races popula-tion is projected to be the fastest growing over the next 46 years (see Table 2), with its popula-tion expected to triple in size (an increase of 226 percent). This group is projected to increase from 8 million to 26 million between 2014 and 2060. Its share of the total population is projected to increase from 2.5 percent in 2014 to 6.2 percent in 2060.
The Asian population is projected to be the second fastest-growing group, with an increase of 128 percent projected for the Asian alone population and an increase of 143 percent projected for the Asian alone or in combination population (see Table 2). In 2014, the Asian alone group is projected to account for 5.4 percent of the total popula-tion. This group is projected to see its share of the total nearly double,
accounting for 9.3 percent of the total population in 2060.
The Hispanic population is pro-jected to be the third fastest growing (see Table 2). The Hispanic population is projected to increase from 55 million in 2014 to 119 million in 2060, an increase of 115 percent. In 2014, Hispanics are projected to account for 17 percent of the U.S. population. By 2060, 29 percent of the United States is pro-jected to be Hispanic—more than one-quarter of the total population.
The Native Hawaiian and Other Pacific Islander population is pro-jected to increase 63 percent for this race group alone, and increase 101 percent when the group is considered alone or in combination with other races (see Table 2). Such large differences in growth rates highlight the impact that account-ing for race in combination with other races can have, particularly for some of the less populous race
Table 2. Population by Race and Hispanic Origin: 2014 and 2060(Population in thousands)
Race and Hispanic origin12014 2060 Change, 2014 to 2060
Number Percent Number Percent Number Percent
Total population . . . . . . . . . . . . . . . . . . . . . . . . 318,748 100 .0 416,795 100 .0 98,047 30 .8One Race . . . . . . . . . . . . . . . . . . . . . . . . . . . . . . . . . . . . 310,753 97 .5 390,772 93 .8 80,020 25 .8 White . . . . . . . . . . . . . . . . . . . . . . . . . . . . . . . . . . . . . . 246,940 77 .5 285,314 68 .5 38,374 15 .5 Non-Hispanic White . . . . . . . . . . . . . . . . . . . . . . . . . 198,103 62 .2 181,930 43 .6 –16,174 –8 .2 Black or African American . . . . . . . . . . . . . . . . . . . . . . 42,039 13 .2 59,693 14 .3 17,654 42 .0 American Indian and Alaska Native . . . . . . . . . . . . . . . 3,957 1 .2 5,607 1 .3 1,650 41 .7 Asian . . . . . . . . . . . . . . . . . . . . . . . . . . . . . . . . . . . . . . 17,083 5 .4 38,965 9 .3 21,882 128 .1 Native Hawaiian and Other Pacific Islander . . . . . . . . . 734 0 .2 1,194 0 .3 460 62 .6Two or More Races . . . . . . . . . . . . . . . . . . . . . . . . . . . . . 7,995 2 .5 26,022 6 .2 18,027 225 .5
Race Alone or in Combination2
White . . . . . . . . . . . . . . . . . . . . . . . . . . . . . . . . . . . . . . . . 254,009 79 .7 309,567 74 .3 55,558 21 .9Black or African American . . . . . . . . . . . . . . . . . . . . . . . . 45,562 14 .3 74,530 17 .9 28,968 63 .6American Indian and Alaska Native . . . . . . . . . . . . . . . . . 6,528 2 .0 10,169 2 .4 3,640 55 .8Asian . . . . . . . . . . . . . . . . . . . . . . . . . . . . . . . . . . . . . . . . 19,983 6 .3 48,575 11 .7 28,592 143 .1Native Hawaiian and Other Pacific Islander . . . . . . . . . . . 1,458 0 .5 2,929 0 .7 1,470 100 .8
Hispanic or Latino OriginHispanic . . . . . . . . . . . . . . . . . . . . . . . . . . . . . . . . . . . . . . 55,410 17 .4 119,044 28 .6 63,635 114 .8Not Hispanic . . . . . . . . . . . . . . . . . . . . . . . . . . . . . . . . . . 263,338 82 .6 297,750 71 .4 34,412 13 .1
1 Hispanic origin is considered an ethnicity, not a race . Hispanics may be of any race . Responses of “Some Other Race” from the 2010 Census are modified . For more information, see <www .census .gov/popest/data/historical/files/MRSF-01-US1 .pdf> .
2 “In combination” means in combination with one or more other races . The sum of the five race groups adds to more than the total population, and 100 percent, because individuals may report more than one race .
Source: U .S . Census Bureau, 2014 National Projections .

10 U.S. Census Bureau
groups. The Native Hawaiian and Other Pacific Islander population (either alone or in combination with other races) is projected to represent less than 1 percent of the nation’s total population in both 2014 and 2060.
The remaining two groups, Black and American Indian and Alaska Native, are projected to see mod-est growth in their populations over the next 46 years (see Table 2).4 Between 2014 and 2060, the Black alone population is projected to increase from 42 million to 60 million—an increase of 42 percent. Its share of the total population is projected to increase slightly from
4 The terms “Black” and “Black or African American” are used interchangeably in this report.
13 percent in 2014 to 14 percent in 2060. The American Indian and Alaska Native alone population is projected to increase from 4 million in 2014 to 5.6 million in 2060. Its share of the total population is pro-jected to remain stable at just over 1 percent.
The racial and ethnic composition of the United States is markedly different when looking at just chil-dren, under 18 years of age. Figure 8 compares the distribution of the total and the child populations by race and Hispanic origin in 2014 and 2060 to illustrate how diverse the child population is compared with the total. This figure pres-ents results for the non-Hispanic population by race and aggregates Hispanics, of any race, into one
category so that the sum of the percentages for the groups for a given year equals 100. The percent-age minority is also shown at the bottom, as a way to summarize the trends in diversity over time.
A much smaller percentage of the child population is non-Hispanic White alone, as compared with the total population. In 2014, 52 percent of children are projected to be non-Hispanic White alone, compared with 62 percent of the total population. Thus, among those under age 18, the United States is already nearly a majority-minority nation. The percentage of the population in this group is projected to decrease to only 36 percent by 2060. Put another way, by 2060, 64 percent of children will
Figure 8.
Distribution of the Population by Race and Hispanic Origin for the Total Population and Population Under 18: 2014 and 2060
Note: The percentages for the total population or the population under 18 may not add to 100.0 due to rounding.Unless otherwise specified, race categories represent race alone. NHPI=Native Hawaiian and Other Pacific Islander, AIAN=American Indian and Alaska Native. Minority refers to everyone other than the non-Hispanic White alone population. Source: U.S. Census Bureau, 2014 National Projections.
Non-Hispanic62.2
43.6
12.413.0
0.20.2
2.04.9
17.428.6
37.856.4
0.70.6
5.29.1
Total
2014
2060
Minority
Hispanic
Two or More Races
NHPI
Asian
AIAN
Black
White52.0
35.6
13.813.2
0.20.2
4.1
8.9
24.4
48.0
33.5
64.437.8
56.4
0.90.6
4.77.9
Under 18

U.S. Census Bureau 11
belong to racial and ethnic minori-ties, compared with 56 percent for the total population (see Figure 8).
The percentages of the population in the non-Hispanic Two or More Races and the Hispanic groups are higher for children than for the total population, again reflecting the greater diversity of the child population relative to the total population. In 2014, 2 percent of the total population is non-Hispanic Two or More Races, compared with over 4 percent of the child population. The total population is projected to be 17 percent Hispanic in 2014 and 29 percent Hispanic in 2060. In contrast, nearly one-quar-ter (24 percent) of the child popu-lation is projected to be Hispanic in 2014, and this group’s share is projected to increase to 34 percent in 2060.
The pattern of change from 2014 to 2060 is similar for the total population and for children in most race and ethnic groups (see Figure
9), however, the child population is projected to experience smaller overall growth than the total popu-lation across all race and ethnic groups. The overall rates of fertility in the United States are projected to decrease over this period, lead-ing to smaller growth of the child population. The total population maintains a higher rate of growth due to the dual impact of projected increases in net international migration and life expectancy.
Between 2014 and 2060, the total population is projected to increase by 31 percent, while the number of children is projected to increase by 12 percent. Most race and ethnic groups are projected to experience growth between 2014 and 2060, with the largest rates of growth projected for the non-Hispanic Two or More Races, non-Hispanic Asian, and Hispanic groups. The excep-tions to this trend are non-Hispanic White children and non-Hispanic American Indian and Alaska Native children. The total non-Hispanic
White alone population is pro-jected to decrease by 8 percent, while the number of non-Hispanic White alone children is projected to decrease by 23 percent. The number of single race non-Hispanic American Indian and Alaska Native children is projected to decrease by 20 percent.
The racial and ethnic distribution of the foreign-born population differs substantially from natives (see Fig-ure 10). Moreover, while the com-position of the native population is projected to shift with a decline in the percentage non-Hispanic White and increase in the percent-age minority, there is little shift projected for the distribution of the foreign born. Non-Hispanic White is projected to remain the largest race and ethnic group among natives, while just 19 percent of the foreign born is projected to belong to this group in both 2014 and 2060. Hispanic is the largest foreign-born group, followed by non-Hispanic Asian.
Figure 9.
Change in Total Population and Population Under 18 by Race and Hispanic Origin: 2014 to 2060
Note: Unless otherwise specified, race categories represent race alone. NHPI=Native Hawaiian and Other Pacific Islander, AIAN=American Indian and Alaska Native. Minority refers to everyone other than the non-Hispanic White alone population. Source: U.S. Census Bureau, 2014 National Projections.
145.7
30.8
11.8
-8.2-23.4 -20.1
12.5
37.0
129.1
7.5
86.7
66.7
20.5
218.9(In percent) Total population
Non-Hispanic
Under 18
53.6
94.7
50.0
114.8
MinorityHispanic
Two or More RacesNHPIAsianAIANBlackWhite
Total

12 U.S. Census Bureau
The composition of the foreign-born population is driven by the projected characteristics of those migrating into and out of the United States. In this series of projections, the overall level of net international migration is projected to increase, but the racial and eth-nic characteristics of the migrants are not assumed to change very much over the 46-year period. In contrast, the composition of the native population is driven in large part by projected births. As observed in the trends for the child population, the younger population
is becoming more diverse, resulting in a shift in the overall composition of the total population that is tak-ing place mostly within the native segment.
CONCLUSION
Over the next four decades, as fer-tility rates are projected to continue to fall and modest increases are projected for the overall level of net international migration, the U.S. population is projected to grow more slowly. Growth of the foreign-born population is projected to exceed that of natives, resulting in
an increasing share of the future U.S. population that is foreign born. Differences in growth between the two groups are projected to taper over time, and the distribution of the population by nativity is pro-jected to remain relatively stable in the last decades of the projections.
The population is projected to continue aging, reflected in the growth of the percentage of the population that is in the older ages. Over the next 16 years, the aging of the baby boomers will drive up the ranks of the native population at ages 65 and over, while similarly
Figure 10.
Distribution of the Native-Born and Foreign-Born Populations by Race and Hispanic Origin: 2014 and 2060
Note: The percentages for each group in each year may not add to 100.0 due to rounding. Unless otherwise specified, race categories represent race alone. NHPI=Native Hawaiian and Other Pacific Islander, AIAN=American Indian and Alaska Native. Minority refers to everyone other than the non-Hispanic White alone population.Source: U.S. Census Bureau, 2014 National Projections.
Non-Hispanic 68.849.4
13.013.3
0.20.2
2.15.8
13.025.5
31.250.6
0.80.8
2.0
5.0
Native born
2014
2060
Minority
Hispanic
Two or More Races
NHPI
Asian
AIAN
Black
White18.818.8
8.111.4
0.30.3
25.826.8
1.1
1.0
24.4
40.8
41.645.8
81.281.2
37.8
0.10.1
4.7
7.9
Foreign born

U.S. Census Bureau 13
the aging of the current foreign-born population will contribute to increases in the share of the foreign-born population that is aged 65 and over.
The U.S. population is also pro-jected to become more diverse, as seen in the projected increases in the percentage of the population that is a minority—groups other than non-Hispanic White alone. By 2044, the United States is pro-jected to become a plurality nation. While the non-Hispanic White alone population will still be the largest, no race or ethnic group is projected to have greater than a 50 percent share of the nation’s total. Shifts in the racial and ethnic composition of the future population are projected to occur primarily within the native population, which will become majority-minority by 2044. The child population within the United States is even more diverse and is projected to experience the majority-minority crossover in 2020, just 6 years into the future.
DATA SOURCES AND mETHODOLOGY
This report uses projections of the total U.S. population as of July 1 for the years 2014 to 2060. When both population estimates and projec-tions are available, estimates are the preferred data.5 The universe
5 While projections and estimates may appear similar, there are some distinct differ-ences between the two measures. Estimates are for the past and present, while projec-tions are based on assumptions about future demographic trends. Estimates generally use existing data collected from various sources, while projections make assumptions about what demographic trends will be in the future. Data users may find both an estimate and a projection available for the same date (e.g., July 2011), which may not agree. In such cases, estimates are the preferred data, unless the user’s objective is to compare the number with others in the projected series.
is the resident population of the United States (50 states and the District of Columbia).
The projections are based on the 2010 Census and were produced using a cohort-component method, which uses the components of population change (births, deaths, and net international migration) to project forward. The assump-tions for the components of change are based on time series analysis. Historical mortality trends were calculated using the National Center for Health Statistics’ data on deaths and the U.S. Census Bureau’s population estimates for 1989 to 2012. Fertility trends were calcu-lated using the National Center for Health Statistics’ birth data and the Census Bureau’s estimates of the female population. The time series included data from 1990 to 2012. Trends in net international migration were primarily based on decennial census and American Community Survey estimates on foreign-born immigration for the period from 1980 to 2012.
The methodology for the projec-tions used in this report is available at <www.census.gov/population /projections/methodology/>.
All derived values were computed using unrounded data. In the text, figures, and tables, most whole numbers were rounded to the near-est thousand or million, and most decimals were rounded to the near-est tenth or whole number.
DATA ACCURACY
These projections are based on the 2010 Census and may, therefore, contain nonsampling error due to potential enumeration errors such as differential undercoverage
or overcoverage by demographic characteristics. Technical documen-tation for the 2010 Census is avail-able at <www.census.gov /prod/cen2010/doc/sf1.pdf>. Non-sampling error also exists as the assumptions for the components of change were based on time series analysis. No attempts were made to predict future changes in policy or other factors that might influence levels of the population compo-nents and their directions. Thus, if actual trends or levels in fertility, mortality, or international migration differ radically from the assumed trends and levels, the population projections will be less accurate.
SUGGESTED CITATION
Colby, Sandra L. and Jennifer M. Ortman, Projections of the Size and Composition of the U.S. Population: 2014 to 2060, Current Population Reports, P25-1143, U.S. Census Bureau, Washington, DC, 2014.
CONTACTS
U.S. Census Bureau Customer Service Center 301-763-2422 or 1-866-758-1060 (toll-free) or visit <www.census.gov>
USER COmmENTS
The Census Bureau welcomes the comments and advice of users of our data and reports. Please send comments and suggestions to:
Chief, Population Division U.S. Census Bureau Washington, DC, 20233-8800
Related Documents