1 Projections of Future Phosphorus Production Mohr, S. & Evans, G. (2013). Projections of Future Phosphorus Production. PHILICA.COM Article number 380. Steve Mohr (Institute for Sustainable Futures, University of Technology Sydney) Geoffrey Evans (School of Engineering, University of Newcastle) ABSTRACT Resources information published after 1980 has been used to obtain a best estimate for phosphorus Ultimately Recoverable Resources (URR) of 4181 Mt (P). The majority of those resources are in North Africa, Middle East and China, and to a lesser extent the FSU and USA. Corresponding low and high estimates were found to be 2010 and 9197 Mt (P), respectively. By applying the demand-production interaction resource model of Mohr (2010) on a country-by- country basis for both static and dynamic modes of operation, corresponding peak production (and year) of 28 (2011), 50 (2027) and 55 (2118) Mt (P)/y were obtained for the low, best estimate and high scenarios, respectively. These results were consistent with many other previous studies based on their URR estimates. Whilst it was also found that there was only marginal differences in the peak year dates for the static and dynamic modelling modes, post peak year production was generally higher for the dynamic mode as mines were brought online more quickly in an attempt to satisfy demand. Cumulative production was also calculated for the low, best and high estimates, and it was found that the years when the cumulative demand became greater than the cumulative production were 2030, 2090 and >2200 for the low, best and high estimates, respectively. Finally, given the significance of the reserves for the Morocco/Western Sahara region, the case is considered whereby it experiences a disruption in

Welcome message from author
This document is posted to help you gain knowledge. Please leave a comment to let me know what you think about it! Share it to your friends and learn new things together.
Transcript

1
Projections of Future Phosphorus Production
Mohr, S. & Evans, G. (2013). Projections of Future Phosphorus Production. PHILICA.COM Article number
380.
Steve Mohr (Institute for Sustainable Futures, University of Technology Sydney)
Geoffrey Evans (School of Engineering, University of Newcastle)
ABSTRACT
Resources information published after 1980 has been used to obtain a best estimate for
phosphorus Ultimately Recoverable Resources (URR) of 4181 Mt (P). The majority of those
resources are in North Africa, Middle East and China, and to a lesser extent the FSU and USA.
Corresponding low and high estimates were found to be 2010 and 9197 Mt (P), respectively. By
applying the demand-production interaction resource model of Mohr (2010) on a country-by-
country basis for both static and dynamic modes of operation, corresponding peak production
(and year) of 28 (2011), 50 (2027) and 55 (2118) Mt (P)/y were obtained for the low, best
estimate and high scenarios, respectively. These results were consistent with many other
previous studies based on their URR estimates. Whilst it was also found that there was only
marginal differences in the peak year dates for the static and dynamic modelling modes, post
peak year production was generally higher for the dynamic mode as mines were brought online
more quickly in an attempt to satisfy demand. Cumulative production was also calculated for the
low, best and high estimates, and it was found that the years when the cumulative demand
became greater than the cumulative production were 2030, 2090 and >2200 for the low, best and
high estimates, respectively. Finally, given the significance of the reserves for the
Morocco/Western Sahara region, the case is considered whereby it experiences a disruption in

2
mine activity from 2040-2050 and in the time period when production from the rest of the world
has already peaked.
Key words: Phosphorus, ultimately recoverable resources, peak production, peak year
INTRODUCTION
Phosphorus and its compounds are used in fertilisers, animal feed, detergents, and metal
treatment operations (Steen, 1998). More than 80 percent (Steen, 1998; Cordell et al., 2009; Van
Vuuren et al., 2010) of the phosphorus produced is utilised in fertilisers to assist in crop
production, resulting in increased yields of up to 50 percent (Stewart et al., 2005). Without the
use of fertilisers it would be difficult to provide sufficient food for an expanding world
population, which is projected to grow from around 0.9 billion in 1850 (Kremer, 1993) to 9
billion in 2050 (U.N., 2008). Corresponding to the increase in population has been an annual
increase in phosphorus production, from less than 1 Mt (P)/y in 1850 to 22 Mt (P)/y in 2012.
Currently, the current cumulative production of phosphorus, mined from phosphate rock and
guano, is estimated to be approximately 954 Mt (P). Phosphorus is a finite resource and cannot
be substituted for agricultural uses (USGS var.). Hence it is essential that the resource be
managed in order to avoid, or mitigate at least, any future supply limitation. To do this, reliable
estimates of future demand and realistic projections of production rates are required based on the
amount of phosphorus that remains.

3
For predicting future supply the ultimately recoverable resource (URR) is commonly used and is
equal to the combined sum of all historic and future production. Estimates of URR values for
phosphorus currently range from 1,000 to 36,700 Mt (P) (Cordell et al., 2009; Déry and
Anderson, 2007; Ward, 2008; Van Vuuren et al., 2010). Such a broad range in URR estimates
highlights the uncertainty in the quantity of phosphorus-bearing material actually available.
Future production projections also have a wide variation as they are dependent on both the
amount of the recoverable resources still remaining as well as external drivers, such as droughts,
wars, famines, etc, that influence annual production. For example, Déry and Anderson (2007)
applied the Hubbert curve approach globally, and based on a URR of 1,000 Mt (P) obtained from
Hubbert linearization, determined that world production had peaked at 20 Mt (P)/y in 1988.
Cordell et al. (2009) also applied a Hubbert curve approach, but used a global URR of 3,240 Mt
(P) based on published USGS data to predict that production will peak at 29 Mt (P)/y in 2033.
Alternatively, van Vuuren et al. (2010) assumed that production was in response to (increasing)
demand. They also undertook their analysis on a country-by-country basis and with an estimated
total URR of between 6,700-36,500 Mt (P) they predicted that production will continue to
increase to between 66-115 Mt (P)/y by 2100. The abovementioned studies, undertaken within
three years of each other, predict that phosphorus production either has or will peak between
1988 to beyond 2100. Clearly, there is considerable uncertainty in the supply of what is such a
critical resource for our society.
The aim of this study was firstly to determine the possible range of URR values, referred to here
as low, high and best estimates. This information is then used as input to the demand-production
interaction resource model of Mohr (2010) to predict future production for individual
countries/regions. From the annual production rate projections, peak year is also identified as

4
well as when there is a likelihood of future shortfalls of production in meeting increasing
phosphorus demand. Finally, cumulative production and demand projections are compared to
determine when both annual and stockpiled (from previous years) production can no longer meet
annual phosphorus demand.
MODEL DESCRIPTION
The demand-production interaction model has been described previously (Mohr, 2010) and is
summarized in Appendix 1. As the name implies, the model includes the two-way interaction
between the demand for and the ability to produce a resource with a given URR. For instance, if
demand is increasing then accordingly production will be increased if it can. If there is a large
amount of the URR remaining then demand is only limited by the infrastructure constraints
required to recover the resource. If the URR is depleted it is no longer possible for production to
meet demand, irrespective of what infrastructure is in place, and consequently demand must be
reduced. Presumably the shortfall in demand will be met by an alternative resource. For
phosphorus, however, this would not be possible and the only option would be to conserve and
recycle existing phosphorus resources. The model can be operated in either: (a) static mode,
where production is not influenced by changes in demand—although the model does allow for
manual input of individual changes in supply, such as that due to wars, depressions, etc; or (b)
dynamic mode, where demand and production interact with other.
The demand-production interaction model, which has been validated extensively in Mohr (2010),
was originally developed to project fossil fuels production and included fields (for oil and gas)

5
and mines (for coal, coal shale, tar sands, etc) components in the model. The mines recovery
process was designed to replicate production from open-cut and underground mining operations
and is suitable for modeling phosphate rock and guano recovery. Wherever possible deposits
where the approximate grade is known (e.g. Notholt, 1989) are individually modeled. Currently,
however, the mines model cannot account for ore grade decline.
There are advantages of using the demand-production interaction model over the more
commonly used Hubbert curve approach. These include:
• Inclusion of Disruptions: Some production profiles are not fitted by a Hubbert curve due to
disruptions caused by external influences, e.g. collapse of the FSU. Disruptions can be easily
inputted into the demand-production interaction model.
• No Previous Production: The Hubbert curve approach requires historical data to project future
production. Conversely, for regions yet to commence production the demand-production
interaction model can create projections based on yet-to-be-installed facilities with given
annual production, production life, etc, information.
• Demand and Production Interaction: The Hubbert Curve has no mechanism whereby the
demand of the resource has an influence on production. The demand-production interaction
model specifically allows for mines to be either brought online or taken off-line depending on
whether production is either below or above the intrinsic demand. At the same time, the
intrinsic demand is influenced by the production capacity.
The benefit of the dynamic-production interaction model is that effects of demand can influence
the ultimate supply of production. When coupled with the mines model that includes the
influences of scale, age, and technology advances on production rate, the overall approach is
consistent with the recommendations of Viccari and Strigul (2011) that more theoretical

6
discovery and economic modeling be incorporated to enable more sophisticated and detailed
projections to be created.
The demand-production interaction model requires the following inputs for each country: (1)
historical production, (2) demand projection, (3) URR estimate, and (4) mine production
information. Determination of each of these inputs for phosphorus is described below:
Historical Production
Historical phosphorus production data, sourced from the literature1, is shown in Figure 1 for
seven different regions (see Appendix 2 for definition of regions and the electronic
supplementary material for data for individual countries). It can be seen that production rapidly
increased until about 1980 before leveling out at about 20±4 Mt (P)/y. Since 1980 there have
been two major impacts on global production. Firstly, there was a sharp decline due to the
collapse of the Former Soviet Union (FSU). Secondly, the Asia region, especially China, has
undergone rapid expansion in production.
1 USGS (Var.); Minerals UK (Var.); Mitchell (1982); Mitchell (1983); League of Nations (Var.); Rothwell (Var.);
USGS (2008); US BoM (Var.); CMI (Var.); ABMR (1951); Brink (1977); EFMA (2000); Shepard and
Charleston (1893); Gray (1944); Demmerle and Sackett (1949); Waggaman (1953); Bide (2010).

7
Figure 1: Phosphorus annual production [see Appendix 2 for definition of regions]
Demand Projection
World annual demand, D(t), in year, t, is determined by the product of population, p(t), and
annual demand per capita, DH(t), i.e.:
(1)
From Mohr (2010), projected population can be estimated by:

8
(2)
From eq.(2), population projections for 2010, 2025, 2050, 2075 and 2100 are 6.8, 8.0, 9.2, 9.7
and 9.1 billion, which compares well with the latest UN figures (U.N., 2011) of 6.8, 9.3 and 10.1
billion for 2010, 2050 and 2100, respectively.
Historical annual demand per capita was obtained by dividing world annual production by total
world population. As shown in Figure 2, per capita demand increased exponentially until 1972
but since then demand has remained relatively constant. Mathematically, DH(t) can be fitted by
the expression:
(3)
The apparent plateau in per capita demand of phosphorus is consistent with Vaccari and Strigul
(2011). They state that per capita demand will increase due to diet change in developing
countries and increasing use of marginal lands; which will be offset by a reduction in demand
due to increased price and improved fertilisation efficiencies, and recent developments in
recycling, such as urine diverting toilets, etc. The net effect will be a relatively constant
phosphorus demand per capita, and according to Figure 2, at a value of about 3.5 kg(P)/person/y.
This value is consistent with Metson et al. (2012), whom project that consumption of 2.45
kg(P)/person/y in 2007 will reach 3.67 kg(P)/person/y by 2050.

9
Figure 2: Phosphorus demand vs time
URR Estimate
Since the 1950’s phosphorus reserves have varied significantly as shown by Figure 3; between
the mid 1980’s and until about 2009 the reserve and reserve base2 estimates have converged to
relatively constant values. However, since then the reserves have increased substantially. A
modest increase in 2002 was due principally to the way in which reserve base estimates were
reported as well as an increase in the reserve estimate for China. In 2010, the International
Fertilizer Development Centre (IFDC) substantially revised their reserve and resource estimates
to 60 and 290 Gt, respectively (Kauwenbergh et al. 2010). The revision is the result of 23 year
2 The definitions of Reserve and Reserve Base are from the USGS. The Reserve Base is the portion of the resource
that meets minimum criteria to be mined under current practices. The Reserve is the portion of the Reserve Base
that is economic.

10
old reserve base values for Morocco/Western Sahara being reclassified as modern reserves
(Rosemarin et al., 2010). The USGS has followed a similar revision and increased their reserves
estimates to 71 Gt (USGS 2012).
Figure 3: Historic (����) Reserve and (����) Reserve Base for Phosphate Rock [Taken from USGS
(Var.), Brink (1977), ABMR (1951), Crowson (Var.)]

11
In this study, future production scenarios are investigated for three URR estimates. These are:
Low: Sum of the URR estimates for each country obtained from Hubbert Linearization (HL).
Briefly, the HL technique works by fitting a Hubbert curve to production data in such a way that
the Hubbert curve agrees with recent production data and with recent cumulative production
data. Ideally the historic production data matches a Hubbert curve profile reasonably well. The
key assumption in the Hubbert Linearisation technique is that future production will broadly
follow the determined Hubbert curve. Typically, the Hubbert Linearisation technique is accurate
at determining the URR for a region/country where production is long past the peak production
(e.g. for Nauru or Christmas Island). However, countries with production still increasing, or
recently commenced the Hubbert Linearisation technique typically underestimates the URR
values. Finally the Hubbert Linearisation technique does not work if a region has resources that
will be exploited in the future but currently does not produce the resource. Ultimately, the
Hubbert Linearisation technique is good in mature regions, but does tend to underestimate the
actual URR value. As reported by Déry and Anderson (2007), the HL approach gave the lowest
world URR estimate when applied to global production. Here, we assume that HL will also
provide the lowest URR estimate when applied to individual countries.
Best Estimate: Sum of the URR best estimates made by the authors for each country. The
numerical values are listed in Table 1, along with justifying comments given in the footnotes.
High: Is based on IFDC and USGS reserve numbers combined with cumulative production. For
countries not listed by IFDC and USGS, the URR is determined by cumulative production to
1988 plus the country-by-country resource estimates and assumed deposit grades reported by
Notholt et al. (1989) with a 60 percent recovery. In arriving at high estimates it was generally

12
found that Notholt et al. (1989) and the IFDC reported similar values for almost all
countries/regions (see Table 2). The main exception was for Morocco where recently (Rosemarin
et al., 2010) 23 year old reserve base values have been reclassified as modern reserves. The
updated values for Morocco were used for the high estimation.

13
Table 1: Low, High and Best Estimate URR Estimates

14
Table 2: Phosphate rock resources (Gt)
USBM
(1965)a
USGSb
(1973) a
USBM
(1975) a
Slanskyc
(1975) a
Notholt et al.
(1989)
Steend
(1998)
Morocco 66.8 57.8 46.6 56.3 50.0
South Africa 0.1 2.8 3.0
Tunisia 6.3 1.8 1.2 3.0 1.5
Africa 25.1
Australia 1.4 2.7 3.6
China 12.0 9.0
FSU 24.0 3.6 11.0 20.8 9.0e
Jordan 0.8 1.6 1.5
USA 45.9 9.8 6.4 54.2 32.6 25.0
Other 10.1 4.5 4.1 2.6 30.7 4.0
World 153.1 40.8 76.5 115.6 163.4 103.0 a Reported in Brink (1977)
b Identified resources
c Ore in place
d Values stated in P2O5 equivalents, assumed an average grade of 29% P2O5
e Russia only

15
Mine production
The mines model, summarized in Appendix 1, assumes that over the lifetime of a mine there are
three phases, namely: (1) a four year linear ramp-up to full production, (2) period at full
production, and (3) four year constant decline to zero production, which is based on a typical
profile of a mine Sheviakov (1963). The cumulative production will be equal to the URR for the
mine. Technology developments over time result in an increase in the size of individual mines,
resulting in less mines operating with longer lifetimes and at higher production rates.
Consequently, mine lifetime and full production rate is increased with time.
For the static mode mines are brought on-line in an attempt to achieve, if possible, a production
profile projected from historical data. The rates at which the mines are brought on-line are also
based on historical data and are listed for all countries in the electronic supplementary material.
Estimates have been made for countries which have yet to commence production. For Peru, the
Bayóvar mine is anticipated to commence production in 2010 and operate for 27 years at 3.9
Mt/y of phosphate rock (Mining Technology, N.D.). Using a phosphorus grade of 13.5%
(Notholt et al., 1989), this is equivalent to 0.52 Mt (P)/y. For Finland, the Sokli deposit is
anticipated to be recovered as a single mine starting in 2015 (Nurmi, 2010) with production
capacity of 1.54 Mt (P)/y. Here, a URR of 14 Mt (P) is assumed, based on a resource of 190 Mt
of soft phosphorus rock (Nurmi, 2010) at grade of 7.4% (Notholt et al., 1989).
For the dynamic mode, the mines model is operated similarly to the static mode but with mines
either being brought on- or off-line depending on the difference between production and demand.

16
RESULTS AND DISCUSSION
Projected Annual Demand, Production and Peak Year and Production
Projections versus time for the low, high and best estimate scenarios for both static and dynamic
modes are shown in Figure 4. The corresponding peak year and production rates for the static
and dynamic modes are listed in Tables 3 and 4, respectively. Projections for individual countries
with phosphorus resources are given in the electronic supplement. Also included in the
supplement are the model parameters numerical values used to generate the projections.
There are a number of observations that can be made from the graphs shown in Figure 4. It can
be seen that for both the static and dynamic modes the annual production rate can vary markedly
from year to year and can actually be above the corresponding yearly demand projection,
especially for the period either side of the peak year. The production rate for each year is
determined by an algorithm that considers both global demand as well as the number of mines
on-line and their individual production rates for each country/region. The tendency3 is for a mine
in a given country to remain on-line even though the world production rate is above the global
demand. The consequence of this modelling approach is reasonably steady plateau as production
and demand are trying to match each other. Eventually the remaining resources are so depleted
that production rapidly decreases towards exhaustion. In this situation annual production clearly
is unable to meet the demand.
3 The model parameters that have most control on determining mine operations are k1 and k3,
and a sensitivity analysis on the impact of their numerical values is included in this study.

17
Table 3: Peak Year and Annual Production for Static Mode
Type Peak Year Max Prod. (Mt (P)/y)
low best est. high low best est. high
Africa 2011 2069 2129 6.2 11.7 40.7
Asia 2020 2028 2028 13.9 30.6 31.0
Europe 1999 2020 2027 0.1 1.7 0.9
FSU 1991 1991 2095 5.1 5.1 10.8
Middle East 2003 2086 2086 2.0 8.1 8.4
North America 1986 1986 1986 6.6 6.6 6.6
South America 2033 2035 2047 3.8 4.0 5.8
World 2021 2027 2118 27.8 50.4 54.5
Table 4: Peak Year and Annual Production for Dynamic Mode
Type Peak Year Max Prod. (Mt (P)/y)
Low best est. high low best est. high
Africa 2043 2073 2127 7.7 17.7 40.6
Asia 2020 2028 2028 13.9 30.5 30.9
Europe 2002 2020 2028 0.2 1.6 0.8
FSU 1989 1989 2094 5.1 5.1 10.7
Middle East 2003 2080 2086 2.1 12.0 8.5
North America 1986 1986 1986 6.7 6.7 6.7
South America 2042 2047 2047 4.4 4.2 5.8
World 2020 2027 2118 28.0 49.2 54.4

18
(a1) Static: Low (b1) Dynamic: Low
(a2) Static: Best Estimate (b2) Dynamic: Best Estimate
(a3) Static: High (b3) Dynamic: High
Figure 4: Phosphorus demand-supply vs time

19
The static and dynamic mode projections indicate that world phosphorus production will peak
between 2020 and 2136. In the low and best estimate projections there are sharp peaks and
declines due to production in China. The high projection has an initial sharp peak at just below
40 Mt (P)/y in 2028-9, which is again due to production in China. A second gradual peak at 62-
63 Mt (P)/y is observed in 2027-2136, which is due to production from the Morocco/Western
Sahara region. The predicted peak year and corresponding production rates for each of the
scenarios can be compared with reported literature values. Firstly, the predicted peaks are at
variance with both Déry and Anderson (2007), who indicated that phosphorus production has
already peaked, and Vuuren et al. (2010) who predicted that production will continually increase
from 66 to 115 Mt (P)/y by the year 2100. In this study the high scenario production never
exceeds 63 Mt (P)/y. Secondly, the best estimate scenario peak year of 2026-7, for both the static
and dynamic modes, is similar to the predicted peak in 2033 reported by Cordell et al. (2009).
However, the production rates at the peak year for the two studies are quite different. Cordell et
al. (2009) report a corresponding peak production of 29 Mt (P)/y, whilst for this study the peak
productions for both the static and dynamic modes are approximately 50 Mt (P)/y. The
difference can be partly accounted for by the higher URR assumption of 4180 Mt (P) used in this
study; whereas Cordell et al. (2009) based her model on 3240 Mt (P). The difference is also
possibly due to the use of the mine model in this study (Mohr, 2010) whereby individual mines
are automatically commissioned, upgraded or decommissioned based on their own URR values.

20
Sensitivity of Production Projections to Mine Model Operating Parameters
The production projects given in Figure 4 are the sum of the operating responses of individual
mines. Those responses are a function of the supply and demand interaction operating
parameters, k1 and k3, which are used implicitly to determine what mines need to be brought
either off- or on-line, and whether to increase production of an existing mine (if that’s possible)
or start-up a new mine. Values for k1 and k3 can be obtained from analysis of historical data; and
for the projections given in Figure 4, numerical values of 0.075 and 0.015 for k1 and k3,
respectively, have been used. Like all projections there is uncertainty that the model parameters
which are based on historical trends might no longer apply. Ideally, some quantitative theoretical
expression could be developed relating k1 and k3 to future economic, policy, and technological
conditions. However, this is well beyond the scope of the current study and instead a simple
sensitivity analysis has been undertaken in an attempt to illustrate how changes in k1 and k3
might change the projections. To do this, seven different runs are considered where k1 and k3
values are varied by ±50% from the base case (Run 4) values. The numerical values for k1 and k3
are listed in Table 5.
Table 5: k1 and k3 values used for the Sensitivity Analysis
Run No. k1 k3
1 0.0375 0.0075
2 0.0375 0.0150
3 0.0750 0.0075
4 (base case*) 0.0750 0.0150
5 0.0750 0.0225
6 0.1125 0.0150
7 0.1125 0.0225
* Unless stated, used throughout this study.

21
The k1 and k3 values reported in Table 5 for the seven cases have been used to obtain production
projects for the low, best and high estimates using the dynamic mode model. The corresponding
annual production projections are plotted in Figure 5. Also shown in the figure, and plotted using
the right hand side vertical scale, is the maximum difference between the highest and lowest
production for each year. It can be seen that for the range of k1 and k3 investigated that for the
historical data (prior to 2011) all seven runs match the data quite well, with the difference
between the highest and lowest production rates for the historical data is less than 0.5 Mt (P)/y.
The best fit was for run 4, which has been taken as the default condition for the model analysis.
After 2011, the difference between predictions is increased. For the low and best estimates, the
maximum difference occurs immediately following a local/global peak in production. For the
low estimate a maximum difference of 10 percent occurs at around 2010, whilst for the best
estimate a maximum difference of 20 percent is observed in 2040. For the high estimate the
maximum difference does not coincide with a maximum in production, but instead reaches a
peak of around 50 percent after 2200.
The reasons for the observations in Figure 5 are three-fold. Firstly, for the historical production,
the number of mines and production rate is already determined and k1 and k3 are not utilised in
determining how mines are managed. Secondly, when demand is relatively constant and there is
sufficient quantity of reserves there are relatively few drivers to change mine operations. Hence,
the k1 and k3 combinations for all seven runs are able to respond in relatively the same way
resulting in similar production rate projections. Thirdly, when the drivers for change in
production is increased, due to a reduction in demand or limitation in reserves, then model
responses to the numerical values for k1 and k3 become more pronounced resulting in greater

22
variation in production rate projections. In summarizing the influence of the choice of k1 and k3,
it is important to note that the quantitative values for these terms are based on the fitting to the
historical data. Moreover, even though these parameters significantly influence annual
production rates by determining how individual mines are managed (brought online, upgraded,
taken offline, etc)—which is very interesting at a regional level—the model predictions for
annual global production are not too different from each other. On the basis of the best fit to the
historical data, k1 and k3 given for run 4 have been used for future production projections
throughout the rest of this paper.

23
(a) Dynamic: Low
(b) Dynamic: Best Estimate
(c) Dynamic: High

24
Figure 5: Sensitivity analysis

25
Cumulative Production versus Cumulative Demand
It was shown in Figure 4 that for both the static and dynamic modes there are years when the
production rate is greater than the static demand curve, which is simply the product of the total
population for that year, p(t), and the phosphorus consumption per person per year, DH(t). For
these years the excess production can either be utilised for other purposes or stockpiled to meet
the annual production shortfall for future years. Eventually, however, the stockpiled resource
will be completely consumed, and without new URR discoveries, annual phosphorus demand
will not be met. To determine when this will occur both cumulative production and demand have
been plotted as a function of time in Figure 6 for low, best guess, and high scenarios.
It can be seen that the cumulative production curve, irrespective of whether the model is operated
in the static or dynamic mode, eventually reaches its limiting URR value and annual production
will be zero. Of most significance is the year when the cumulative production curve falls below
the projected existing cumulative demand curve; at which point there will be zero phosphorus
available. For the low scenario the cross-over is predicted to occur in 2029 and 2031 for the
static and dynamic modes, respectively. For the best guess scenario for the static mode the cross-
over is predicted to occur in 2090; whilst the more rapid uptake in the dynamic mode causes the
cross-over to in 2087. For the high scenario, the cross-over does not take until at least 2200 for
both the static and dynamic modelling approaches.

26
(a) Low
(b) Best Estimate
(c) High
Figure 6: Cumulative demand and production vs time

27

28
Impact of disruption in production from Morocco and the Western Sahara Region
Analysis of URR estimates indicates that the Morocco/Western Sahara region has the potential to
become by far the largest source of phosphorus, especially after the production from china has
peaked at around 2029. To do this, significant increases in production will be required and have
been included in the current analysis. However, given recent interventions by the Moroccan
government (Cordell et al., 2009) and issues over disputed territories between Morocco and
Western Sahara, there is some uncertainty as to whether the projected increases in production
resulting from expansion in mining operations can be maintained.
The impact of a disruption to mine operation is considered in the following example. In 2040 the
number of mines in operation in the Morocco/Western Sahara region is predicted to increase to
8; and if there is no disruption then the number of mines in operation will increase to 14 by 2050.
However, due to some (undefined) external disruption from 2040-2050, mines are actually taken
off-line so that only a single mine remains in operation in 2050 (see Figure 7). Beyond 2051,
normal operation is resumed and mines are brought on-line4 within the normal constraints (k1 and
k3 parameter settings) of the demand-production interaction model.
4 The model actually brings back on-line those mines that were taken off-line during the disruption period before
any new mines are considered.

29
Figure 7: Number of mines in operation in Morocco with and without a disruption
The result of the disruption in mine operation for the Morocco/Western Sahara region during
2040-2050 is shown in Figure 8, where annual phosphorus production has been plotted for the
high URR scenario using the dynamic mode of the demand-production interaction model.
Projections are given for the World, Morocco/Western Sahara region and Rest of the World for
both the disruption and no disruption scenarios.

30
Figure 8: Morocco and World supply with and without a disruption
It can be seen from Figure 8 that production for the Rest of the World (ROW) remains
essentially unchanged both during and after the disruption to mine operations in the
Morocco/Western Sahara region. This is due to the ROW already having reached peak
production in 2030 and thereafter not having the capacity (due to the constraints of the k1 and k3
parameter settings) to rapidly increase production. It can also be observed that the 10 year
disruption for the Morocco/Western Sahara region results in an annual decrease of 6-11 Mt (P)/y
in world phosphorus production that goes well beyond the cessation of the disruption. Whilst the
projections presented in Figure 8 are based on a very simplistic set of conditions that does not
include other factors, such as the availability of stockpiled phosphorus or the increased pressure
placed on other countries to accelerate the exploitation of their own dwindling resources, there is
the real possibility that beyond about 2030 world demand for phosphorus will rely heavily on
production from will he Morocco/Western Sahara region. This possibility is for the case of the

31
high URR scenario. For the best estimate used in this study, there is a cautious approach to the
recently announced URR reserves for Morocco/Western Sahara region. If this more conservative
estimate is realised, then there it will be even more difficult to mitigate the impact of a
reasonably significant regional disruption on the global phosphorus market, both in the short and
longer term.
CONCLUSIONS
The current analysis has highlighted significant variations in URR estimations resulting in
differences in predictions for annual production rates. For the high estimate it is unlikely that
there will be shortages in phosphorus supply until at least well beyond 2100. For the low and best
estimates it is projected that production will peak well before 2100. Using the best estimate for
the URR it is predicted that demand will be able to be met until around 2090 through a
combination of annual production and stockpiled resources.
The projections have been obtained from the demand-production interaction resource model
developed by Mohr (2010) operated in the dynamic mode and calibrated using historical
production data where available. The inference here is that future production activities will
follow a similar behaviour. There is no guarantee that this will occur, and for this reason a
sensitivity analysis was undertaken by varying the model parameters (k1 and k3) that determine
if/when a mine is brought online, upgraded, or taken offline. Whilst the sensitivity analysis
resulted in variations in local production behaviour, globally the results were reasonably similar.

32
The analysis also highlighted that beyond 2030, once production from the rest of the world has
peaked, resources from the Morocco/Western Sahara region will become very significant in
meeting any shortfall. In order to be able to meet this shortfall, a marked increase in production
capability as well as security of the supply chain will be required. Historically, almost all of the
phosphorus has been utilised as a single use from mined resources. As shortages occur, as the
modelling has shown, alternative approaches will be required, including increased recycling,
greater efficiency of use in the food production cycle, and finding replacements for non-essential
uses such as detergents, chemicals, etc.
ELECTRONIC SUPPLEMENT
The electronic supplement contains historical and projected production values for each country.
Also included are the models used to calculate projected production. Finally, the Electronic
Supplement contains the alternative High projections using Notholt 1989 URR numbers only.
The information in the electronic supplement can be downloaded from the following link:
https://dl.dropboxusercontent.com/u/45820036/Mohr%20and%20Evans%20Electronic%20Suppl
ement.zip
AUTHORS
Dr Steve Mohr, University of Technology, Sydney, [email protected]
Professor Geoffrey Evans, University of Newcastle, [email protected]
REFERENCES

33
ABMR (ABMR) (1951). Australian Bureau of Mineral Resources Geology and Geophysics, Mineral
Resources of Australia, Summary Report 29, Phosphates.
Bide, T. (2010). Economic Geologist at the British Geological Survey, Personal Communication
Brink, J. (1977). World Resources of Phosphorus. CIBA Foundation Symposium, 13-15, 23-48.
CMI (Var.). Canadian Mineral Industry, Canadian Minerals Yearbooks and Canadian Minerals Statistics,
1886-1956. http://www.nrcan.gc.ca/mms/cmy/info-hist e.htm (08/08/2010).
Cordell, D., Drangert, J-O., and White, S., (2009). The story of phosphorus: Global food security and
food for thought. Global Environmental Change, 19(2) 292-305.
Crowson, P. (1991,1993,1995). Minerals Handbook, Statistics and Analysis of the world’s mineral
industry. Stockton.
Demmerle, R. L. and Sackett, W. J. (1949). Continuous Superphosphate Production. Industrial and
Engineering Chemistry, 41(7) 1306-1313.
Déry, P. and Anderson, B., (2007). Peak phosphorus. Energy Bulletin, 13th August.
EFMA (2000). European Fertilizer Manufacturers Association, Phosphorus: Essential Element for Food
Production. European Fertilizers Manufacturers Association, Brussels.
Gray, A. N. (1944). Phosphates and Superphosphate. 2nd ed. Lewis, London.

34
Kremer, M. (1993). Population growth and technical change, one million B.C. to 1990. Quarterly Journal
of Economics, 108(3) 681-716.
League of Nations, (Var.). Statistics Yearbook of the League of Nations,
http://digital.library.northwestern.edu/league/stat.html (6/7/2013).
Minerals UK (Var.). World Mineral Statistics. British Geological Survey.
Mining Technology (N.D.). Mining-Technology.com, “Bayóvar Phosphate Project, Peru” Mining-
Technology.com website: http://www.mining-technology.com/projects/bayovar-phosphate (06/07/2013).
Mitchell, B. R., (1982). International Historical Statistics: Africa and Asia. University Press, New York.
Mitchell, B. R., (1983). International Historical Statistics: The Americas and Australasia, Gale Research
Company.
Mohr, S. H., (2010). Projection of world fossil fuel production with supply and demand interactions, PhD
The University of Newcastle Australia http://dl.dropbox.com/u/8223301/Steve%20Mohr%20Thesis.pdf
(06/07/2013).
Notholt, A. J. G., Sheldon, R. P. and Davidson, D. F. (1989). Phosphate deposits of the world, Volume 2,
Phosphate rock resources Cambridge University Press.
Nurmi, P. A., (2010). New Mining Projects in Finland. Canada-Finland Mining Opportunities Seminar,
February 18th, Toronto.

35
Rosemarin, A., Schröder, J., Dagerskog, L., Cordell, D., and Smit, B. (2010). Future supply of
phosphorus in agriculture and the need to maximise efficiency of use and reuse, International Fertiliser
Society, Conference paper 10th December 2010, Proceedings 685.
Rothwell, R. P. (Var.). Mineral Industry, its statistics, technology, and trade, Scientific Publishing
Company, New York/Engineering Mining Journal.
Shepard, C. U. and Charleston, M. D. (1893). The Development and Extent of the Fertilizer Industry.
Journal of the American Chemical Society 15(6) 321-343.
Sheviakov, L. D. (1963). Mining of mineral deposits. Foreign Languages Pub. House, Moscow.
English translation by Schiffer, V.
Steen, I. (1998). Phosphorus availability in the 21st Century: management of a nonrenewable resource.
Phosphorus and Potassium, 217, 25-31.
Stewart, W. M., Dibb, D. W., Johnston, A. E., and Smyth, T. J., (2005). The Contribution of Commercial
Fertilizer Nutrients to Food Production. Agronomy Journal, 97(1), 1-6.
U.N. (2011). World Population to reach 10 billion by 2100 if Fertility in all Countries Converges to
Replacement Level, http://esa.un.org/unpd/wpp/Other-Information/Press_Release_WPP2010.pdf
(06/07/2013)
US BoM (Var.) US Bureau of Mines Yearbooks,
http://minerals.usgs.gov/minerals/pubs/commodity/phosphate_rock (05/05/2011).

36
USGS (19995-2009). United States Geological Survey, Mineral Commodity Summaries,
http://minerals.usgs.gov/minerals/pubs/mcs (05/05/2010).
USGS (2008). United States Geological Survey, Phosphorus Statistics, in Kelly, T. D. and Matos, G. R.
Comps. Historical Statistics for minerals and material commodities in the United States: USGS Survey
Data Series 140, http://pubs.usgs.gov/ds/2005/140i (05/05/2010).
Vaccari, D. A., and Strigul, N. (2011). Extrapolating phosphorus production to estimate resource reserves.
Chemosphere, 84(6), 792-797.
Van Kauwenbergh, S. J. (2010). World Phosphate Rock Reserves and Resources, International Fertilizer
Development Center (IFDC) September 2010.
Van Vuuren, D. P., Bouwman, A. F., and Beusen, A. H.W. (2010). Phosphorus demand for the 1970-
2100 period: A scenario analysis of resource depletion. Global Environmental Change, 20(3), 428-439.
Waggaman, W. H. (1953). Phosphoric acid, phosphates and phosphatic fertilizers. 2nd
ed. American
Chemical Society Monograph Series, No. 34, Reinhold Publishing Corporation.
Ward, J. (2008). Peak phosphorus: Quoted reserves vs. production history. Energy Bulletin, 26th August.
Williams, N. (2008) Australia’s Identified Mineral Resources 2009. Australian Government, Geoscience
Australia.
Zhang, P., Wiegel, R., and El-Shall, H., (2006). Phosphate Rock, In Industrial Minerals and Rocks, 7th
Ed. Edited by Kogel, J. E., Trivedi, N. C., Barker, J. M., and Krukowski, S. T., Society for Mining,
Metallurgy, and Exploration, Inc.

37

38
APPENDIX 1: SUMMARY OF THE MODEL OF MOHR (2010)
The following are extracts of the mined-production model previously reported in Mohr and
Evans (2009) and Mohr (2010)5:
Overall Modelling Approach: The model is based on a market approach, whereby the supply of
a resource, such as oil or coal, is influenced by: demand for it, production capacity, and the
amount of reserves available to supply that market. The market is defined depending on the
nature of the resource. For example, oil is shipped globally so it would be appropriate to consider
the global market. Conversely, the global transport of natural gas is relatively minor, so it would
be more appropriate to consider a regional or continental market.
Mining Model Procedure: For products involving mined operations, such as that used for
phosphorus rock recovery, the approach is:
1. Identify what the market is, regional, global, etc, and define the intrinsic demand for the
resource. Here, intrinsic means the demand that the supply is aiming for. Market expectation
(or demand) is a function of supply availability; e.g. if supply cannot satisfy demand then the
market must adjust to reduce demand.
2. Define the Ultimately Recoverable Resources (URR) available to the market, and these are
obtained from literature values.
5 S.H. Mohr and G.M. Evans, “Demand-Supply Interaction on Future Mining Resource Production: The Coal
Model”, CSRP’08 Conference, Brisbane, Australia, 18-19 November, 2008.

39
3. The URR are used to calculate the number of mines with a given production capacity.
Demand-Supply interactions regulate the scheduling of individual mine outputs, including
start-up and shut-down durations, and steady-state production rates based on historical data.
4. An iterative procedure is applied, whereby intrinsic demand and supply try to equalize each
other. When sufficient capacity is available the production is equal to the intrinsic demand,
brought about by a combination of production from existing operating mines and by bringing
new mines on-stream. Increased production from existing mines can also be implemented in
an effort to achieve the intrinsic demand. A point is reached, however, where production is not
sufficient to meet existing intrinsic demand, so the intrinsic demand must be reduced.
A flowsheet of the mining model is illustrated in Figure A1.
Figure A1.1: Flowsheet of mining model
40
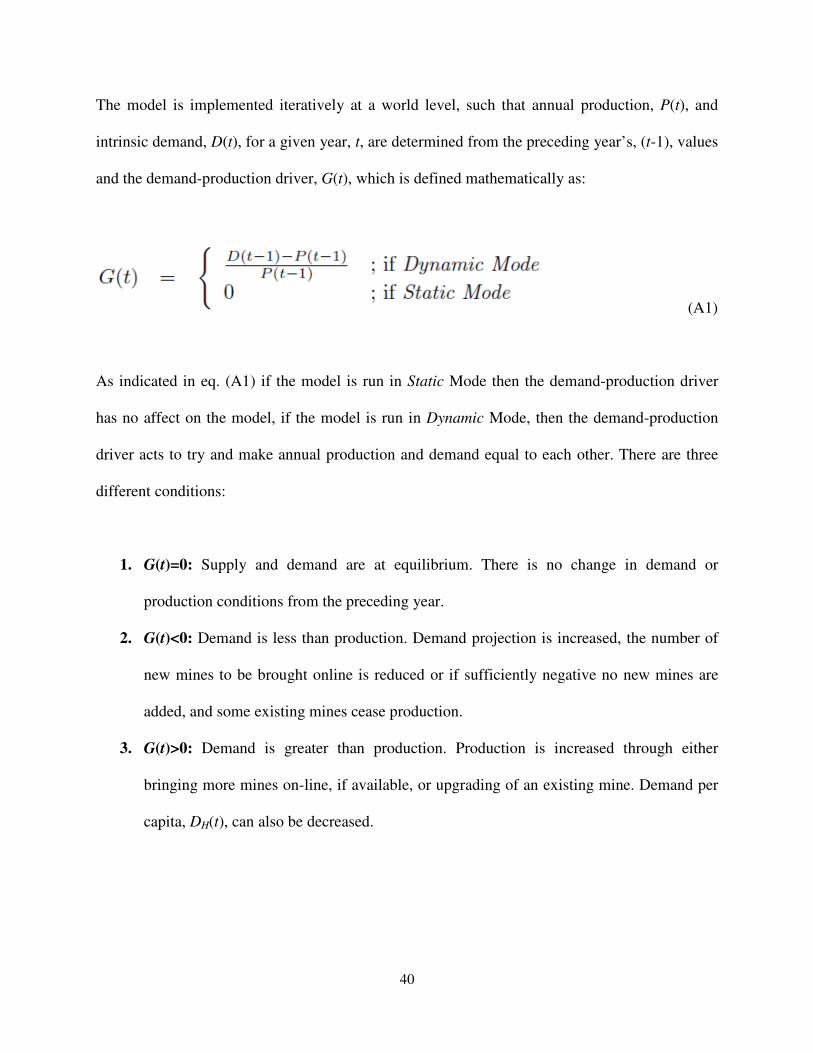
The model is implemented iteratively at a world level, such that annual production, P(t), and
intrinsic demand, D(t), for a given year, t, are determined from the preceding year’s, (t-1), values
and the demand-production driver, G(t), which is defined mathematically as:
(A1)
As indicated in eq. (A1) if the model is run in Static Mode then the demand-production driver
has no affect on the model, if the model is run in Dynamic Mode, then the demand-production
driver acts to try and make annual production and demand equal to each other. There are three
different conditions:
1. G(t)=0: Supply and demand are at equilibrium. There is no change in demand or
production conditions from the preceding year.
2. G(t)<0: Demand is less than production. Demand projection is increased, the number of
new mines to be brought online is reduced or if sufficiently negative no new mines are
added, and some existing mines cease production.
3. G(t)>0: Demand is greater than production. Production is increased through either
bringing more mines on-line, if available, or upgrading of an existing mine. Demand per
capita, DH(t), can also be decreased.
41
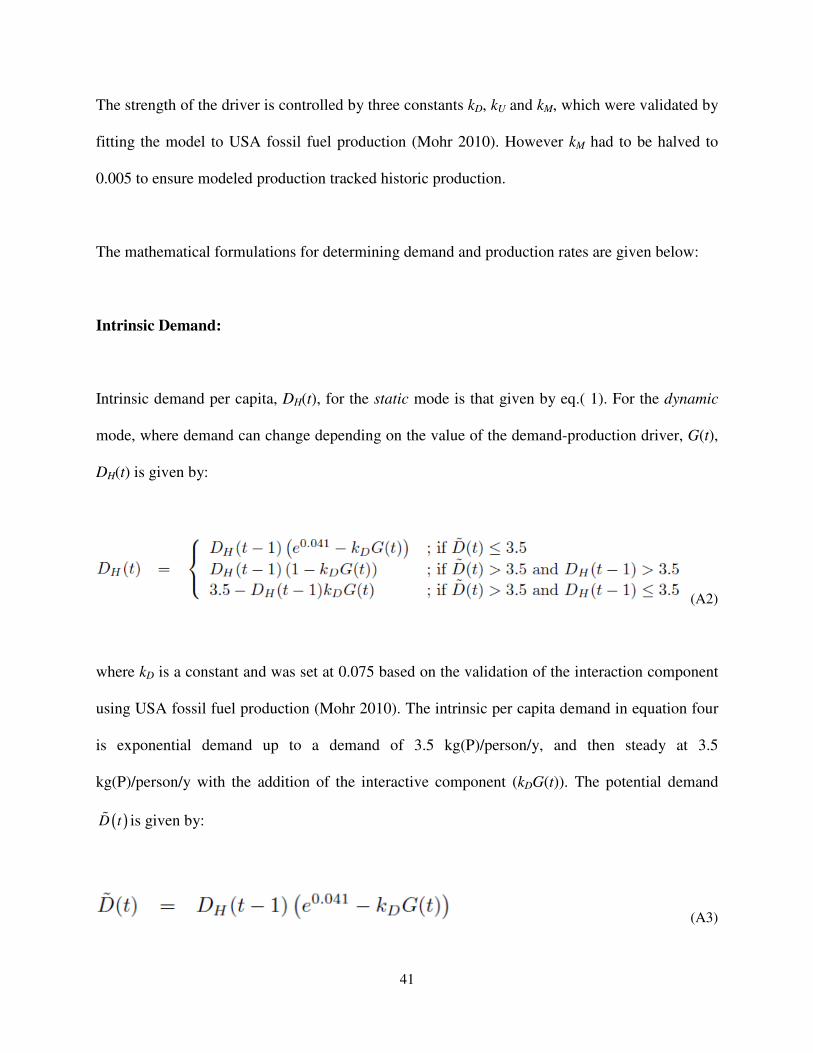
The strength of the driver is controlled by three constants kD, kU and kM, which were validated by
fitting the model to USA fossil fuel production (Mohr 2010). However kM had to be halved to
0.005 to ensure modeled production tracked historic production.
The mathematical formulations for determining demand and production rates are given below:
Intrinsic Demand:
Intrinsic demand per capita, DH(t), for the static mode is that given by eq.( 1). For the dynamic
mode, where demand can change depending on the value of the demand-production driver, G(t),
DH(t) is given by:
(A2)
where kD is a constant and was set at 0.075 based on the validation of the interaction component
using USA fossil fuel production (Mohr 2010). The intrinsic per capita demand in equation four
is exponential demand up to a demand of 3.5 kg(P)/person/y, and then steady at 3.5
kg(P)/person/y with the addition of the interactive component (kDG(t)). The potential demand
( )%D t is given by:
(A3)

42
The potential demand is used to determine if demand has reached the saturation level of 3.5
kg(P)/person/y.
The initial condition for DH(t) in the starting year, YS, is given by:
. (A4)
Production:
The world annual production, P(t), is the sum of the production from individual countries, C. For
each country, total annual production is equal to the sum of the production, PMi(t), from nM(t)
mines, i.e.:
(A5)
Annual Mine Production: Following the approach of Sheviakov (1963), production for a given
mine, PMi(t), is assumed to linearly increase production over a given start-up period to a
maximum production, MP(t), that is maintained for a period of time, determined by the URR
value, QTi, before linearly decreasing to zero production over a shut-down period which is the
assumed to be the same length of time as the start-up. Mine production is shown schematically in
Figure A2 for a start-up and shut-down period of 4 years (used in this study).

43
Figure A1.2: Production profile of the i-th mine
Annual mine production (without upgrade), for a mine commencing production in year, YMi, is
given by:
(A6)
The shaded area under the curve is equal to URR for the mine, QTi, and is given by:
. (A7)
For a country with nM(t) mines in operation at time, t, the actively exploitable URR, QE(t), i.e.
where mining operations already exist or have already existed, is defined as:

44
. (A8)
Each mine is assumed to have a fixed start-up and shut-down period (of 4 years each), as well as
a maximum production, MP(t), and mine lifetime, LM(t), that will vary depending on the year in
which the mine is first brought online, i.e. a mine starting in 2011 will have a larger maximum
production than a mine which started in the year 2000. Mathematically, MP(t) and LM(t) are
assumed to follow a sigmodial (tanh) relationship, varying between the corresponding low (ML
and LL) and high values (MH and LH) for MP(t) and LM(t), respectively, i.e.:
(A9)
(A10)
where rt is a rate constant, and tt is the year midpoint year equal to (LL+LH)/2 and (ML+MH)/2.
Upgrade in Annual Mine Production: There is scope for an individual mine that has been
operating for at least 10 years to upgrade production to twice that of it existing maximum annual
production. Moreover, an upgrade can only take place if there is at least 10 years of production
remaining, including the 4 year ramp-up and shut-down periods. This period has been chosen on
the basis of it being the minimum production period needed to recover construction costs.

45
The decision for upgrading a mine(s), in addition to bringing new mines on-line, is dependent on
the demand-production driver, G(t), exceeding a critical value, GL. The number of mines chosen
to be up-graded, nU(t) in year, t, is given by:
, (A11)
where kU is a constant set at 0.1; based on USA fossil fuel production in Mohr (2010). The mines
chosen to be upgraded are the nU(t) mines that have the most remaining reserves.
Finally, a mine can only be upgraded once, and once upgraded cannot be downgraded to its
previous maximum production. However, a mine can be completely shut-down during times
when production exceeds demand
Total number of mines on-line: For a given country, the total number of mines on-line, nM(t), in
year, t, is given by:
, (A12)
where α(t) is an integer that can be either positive or negative, respectively, depending on
whether new mines are brought on-line or existing mines are taken off-line. The challenge in
determining a value for α(t) is that the total number of mines needed to extract all of a resource is

46
not known until the last mine has been brought on-line. This is because the maximum production
for each mine will vary depending on when it is actually brought on-line. To overcome this
problem the choice of α(t) value is dependent on the difference between the actual actively
exploitable URR, QE(t-1), for the previous year, (t-1), and the estimated6 actively exploitable
URR, Qe(t), for year, t, which for the dynamic mode is given by:
(A13)
where rQT is a rate constant, k3 is a constant set to 0.015, QT is the URR for the country, and QT1
is equal to Qe(t) in the first year, YS, the resource is exploited, i.e. QT1= Qe(YS).
There are two situations when there is a difference between Qe(t) and QE(t-1):
[Qe(t)-QE(t-1)]≥0: New mines are brought on-line and α(t) is determined by the inequality:
, (A14)
[Qe(t)-QE(t-1)]<0: Existing mines are taken off-line and α(t) is equal to the maximum number of
mines that can be removed such that [Qe(t)-QE(t-1)]<0 and those α number of mines are
removed. The value QE(t-1)-QE(t) is the amount of remaining reserves in the α shutdown mines.
α is only negative if the rate constant rQT is negative or if a disruption has occurred.
6 Estimated because its value is not known since the number of mines on-line has not been determined.

47
APPENDIX 2: DEFINITION OF REGIONS
Figure A2.1: Definition of regions
Related Documents