Project TargetCo Sales & Marketing Due Diligence Q1, 2015 Partial deliverable, confidential content excluded

Welcome message from author
This document is posted to help you gain knowledge. Please leave a comment to let me know what you think about it! Share it to your friends and learn new things together.
Transcript
Project TargetCoSales & Marketing Due Diligence
Q1, 2015
Partial deliverable, confidential content excluded
2
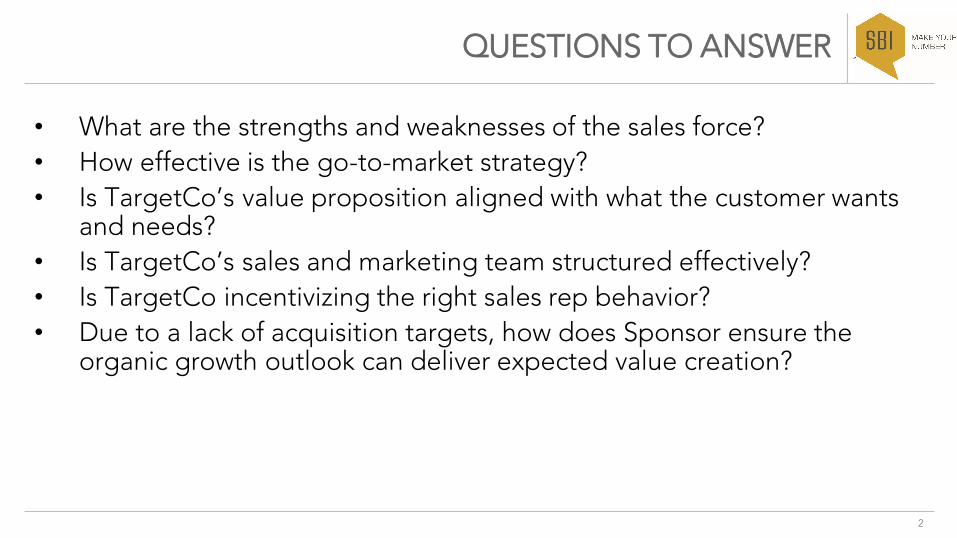
QUESTIONS TO ANSWER
• What are the strengths and weaknesses of the sales force?• How effective is the go-to-market strategy?• Is TargetCo’s value proposition aligned with what the customer wants
and needs?• Is TargetCo’s sales and marketing team structured effectively?• Is TargetCo incentivizing the right sales rep behavior?• Due to a lack of acquisition targets, how does Sponsor ensure the
organic growth outlook can deliver expected value creation?
3
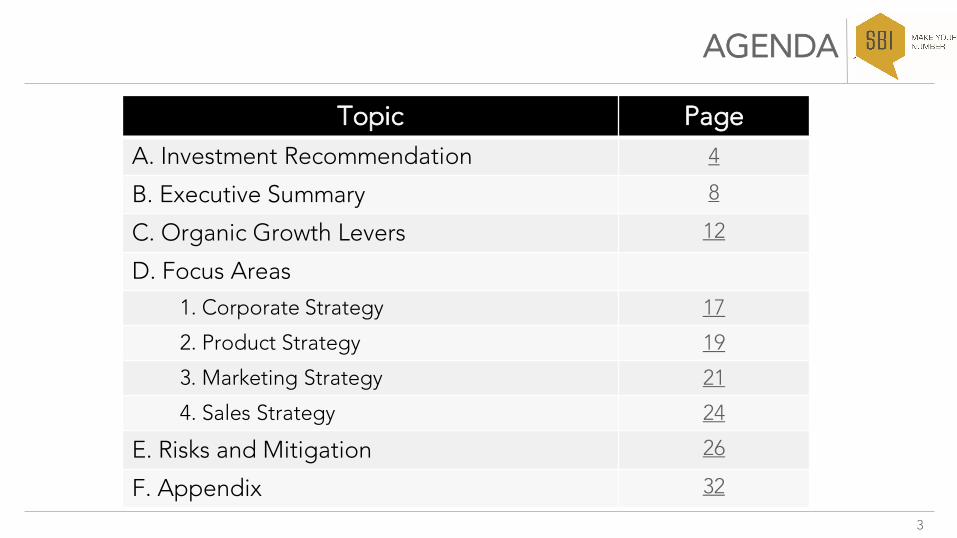
AGENDA
Topic PageA. Investment Recommendation 4
B. Executive Summary 8
C. Organic Growth Levers 12
D. Focus Areas1. Corporate Strategy 172. Product Strategy 193. Marketing Strategy 214. Sales Strategy 24
E. Risks and Mitigation 26
F. Appendix 32
4
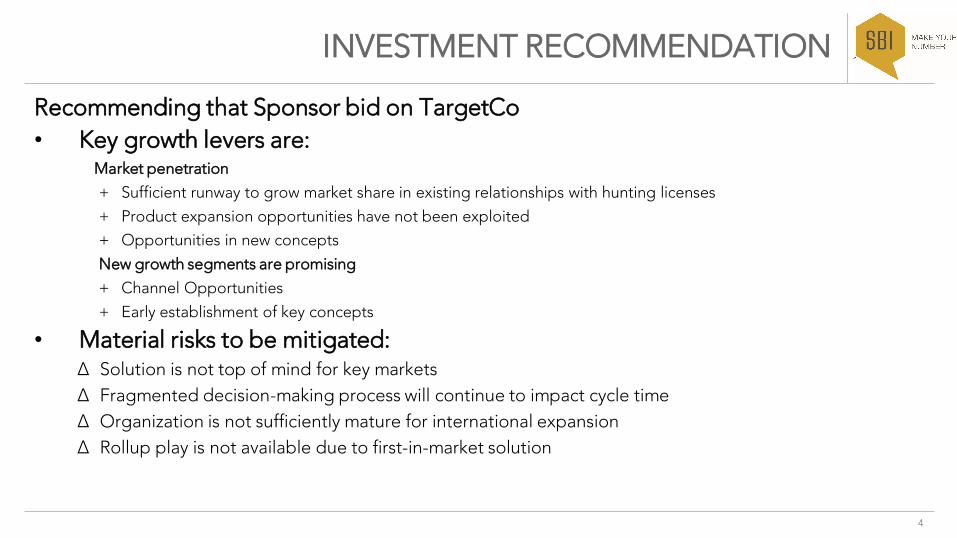
INVESTMENT RECOMMENDATION
Recommending that Sponsor bid on TargetCo• Key growth levers are:
Market penetration+ Sufficient runway to grow market share in existing relationships with hunting licenses+ Product expansion opportunities have not been exploited + Opportunities in new concepts New growth segments are promising+ Channel Opportunities+ Early establishment of key concepts
• Material risks to be mitigated:∆ Solution is not top of mind for key markets∆ Fragmented decision-making process will continue to impact cycle time∆ Organization is not sufficiently mature for international expansion∆ Rollup play is not available due to first-in-market solution
5
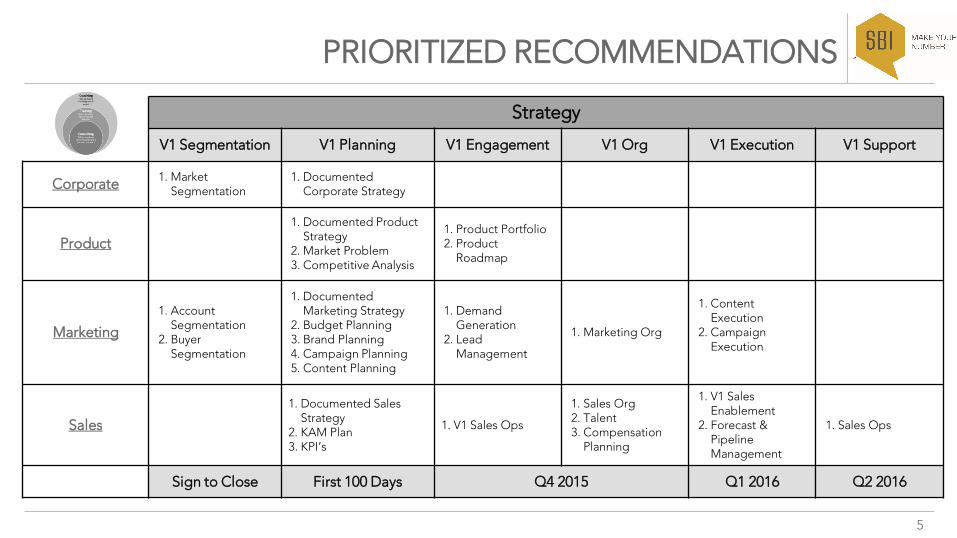
PRIORITIZED RECOMMENDATIONS
Strategy
V1 Segmentation V1 Planning V1 Engagement V1 Org V1 Execution V1 Support
Corporate 1. MarketSegmentation
1. DocumentedCorporate Strategy
Product1. Documented Product
Strategy2. Market Problem3. Competitive Analysis
1. Product Portfolio2. Product
Roadmap
Marketing1. Account
Segmentation2. Buyer
Segmentation
1. Documented Marketing Strategy
2. Budget Planning3. Brand Planning4. Campaign Planning5. Content Planning
1. Demand Generation
2. Lead Management
1. Marketing Org
1. Content Execution
2. Campaign Execution
Sales1. Documented Sales
Strategy2. KAM Plan3. KPI’s
1. V1 Sales Ops
1. Sales Org2. Talent3. Compensation
Planning
1. V1 Sales Enablement
2. Forecast & Pipeline Management
1. Sales Ops
Sign to Close First 100 Days Q4 2015 Q1 2016 Q2 2016
6
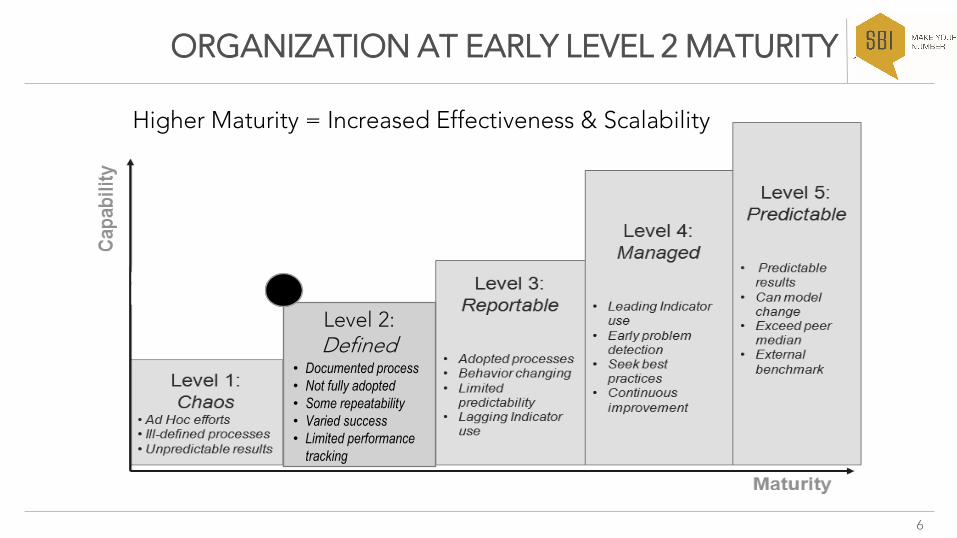
ORGANIZATION AT EARLY LEVEL 2 MATURITY
Level 2:Defined
• Documented process
• Not fully adopted
• Some repeatability
• Varied success
• Limited performance
tracking
Higher Maturity = Increased Effectiveness & Scalability
7
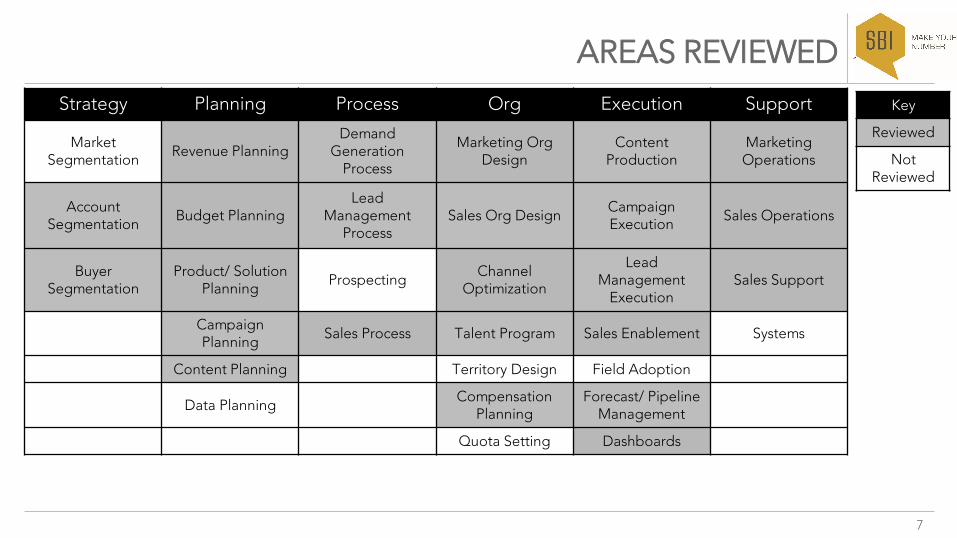
AREAS REVIEWEDStrategy Planning Process Org Execution Support
Market Segmentation Revenue Planning
Demand Generation
Process
Marketing Org Design
Content Production
Marketing Operations
Account Segmentation Budget Planning
Lead Management
ProcessSales Org Design Campaign
Execution Sales Operations
BuyerSegmentation
Product/ Solution Planning Prospecting Channel
Optimization
Lead Management
ExecutionSales Support
Campaign Planning Sales Process Talent Program Sales Enablement Systems
Content Planning Territory Design Field Adoption
Data Planning CompensationPlanning
Forecast/ Pipeline Management
Quota Setting Dashboards
Key
Reviewed
Not Reviewed
8
EXECUTIVE SUMMARY (REFRESH)
Obstacles to achieving organic growth objectives:
1. Customer Intelligence• Lack deep understanding of key accounts and how they make purchasing decisions.• Understanding of marketing and sales critical success factors inside each segment.
2. Resource Allocation• Underinvestment of Marketing organization.• Alignment of resources to key accounts.• Duplicity in selling efforts causes inefficiencies in the sales organization.• Middle Management span of control.
9
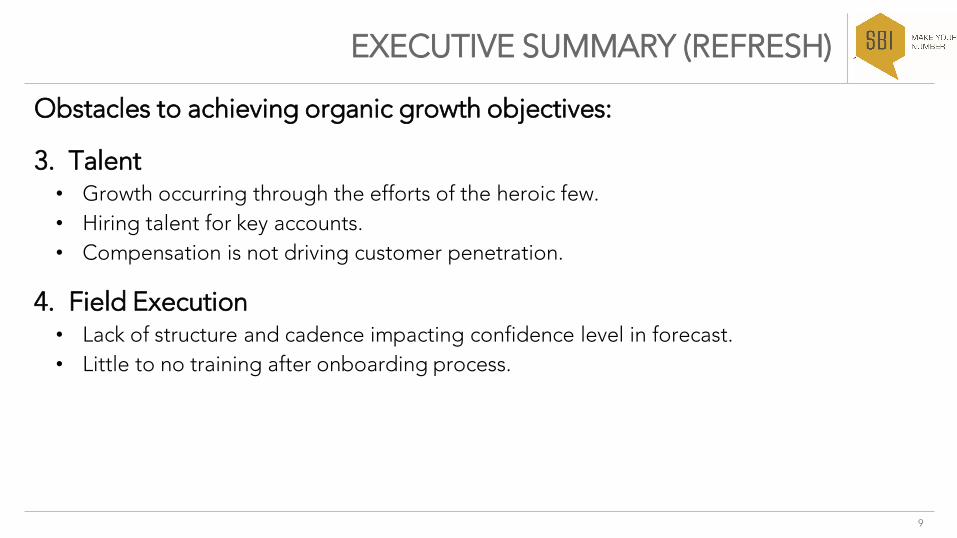
EXECUTIVE SUMMARY (REFRESH)
Obstacles to achieving organic growth objectives:
3. Talent • Growth occurring through the efforts of the heroic few.• Hiring talent for key accounts.• Compensation is not driving customer penetration.
4. Field Execution• Lack of structure and cadence impacting confidence level in forecast.• Little to no training after onboarding process.

10
REASONS FOR THE WRONG SALES STRATEGY
16%
24%
39%
51%
58%
67%
0% 20% 40% 60% 80%
Not Aligned with CorporateStrategy
Not Aligned with ProductStrategy
No Sales Strategy
Tactics Masquerading asStrategy
Not Aligned with BuyerNeeds
Same as Competitors
Organic Growth Levers
12
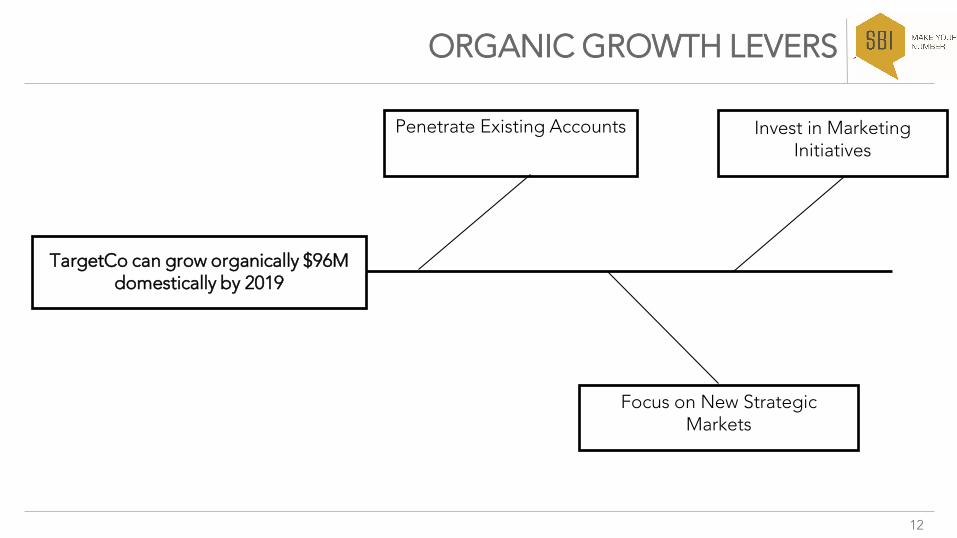
ORGANIC GROWTH LEVERS
Penetrate Existing Accounts
TargetCo can grow organically $96M domestically by 2019
Invest in Marketing Initiatives
Focus on New Strategic Markets
13
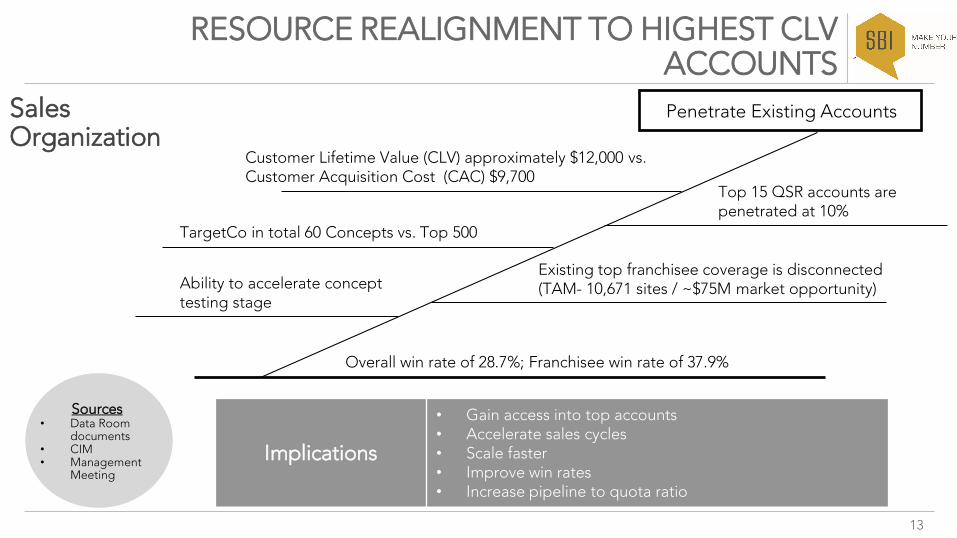
RESOURCE REALIGNMENT TO HIGHEST CLV ACCOUNTS
Sales Organization
Implications
• Gain access into top accounts• Accelerate sales cycles• Scale faster• Improve win rates• Increase pipeline to quota ratio
Penetrate Existing Accounts
Sources• Data Room
documents• CIM• Management
Meeting
Top 15 QSR accounts are penetrated at 10%
Existing top franchisee coverage is disconnected (TAM- 10,671 sites / ~$75M market opportunity)
Overall win rate of 28.7%; Franchisee win rate of 37.9%
TargetCo in total 60 Concepts vs. Top 500
Customer Lifetime Value (CLV) approximately $12,000 vs. Customer Acquisition Cost (CAC) $9,700
Ability to accelerate concept testing stage
14
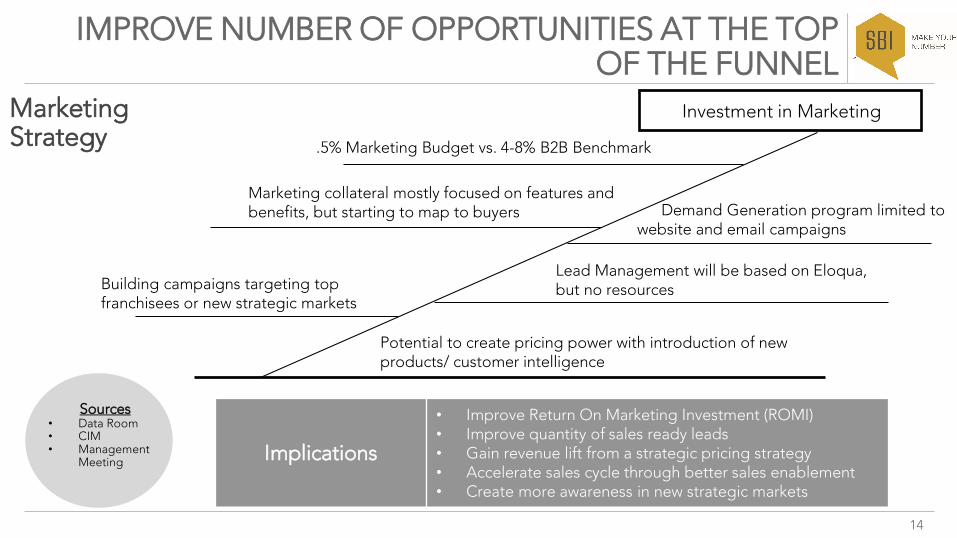
IMPROVE NUMBER OF OPPORTUNITIES AT THE TOP OF THE FUNNEL
Marketing Strategy
Implications
• Improve Return On Marketing Investment (ROMI)• Improve quantity of sales ready leads• Gain revenue lift from a strategic pricing strategy• Accelerate sales cycle through better sales enablement• Create more awareness in new strategic markets
Investment in Marketing
Sources• Data Room• CIM• Management
Meeting
.5% Marketing Budget vs. 4-8% B2B Benchmark
Marketing collateral mostly focused on features and benefits, but starting to map to buyers
Building campaigns targeting top franchisees or new strategic markets
Demand Generation program limited to website and email campaigns
Lead Management will be based on Eloqua, but no resources
Potential to create pricing power with introduction of new products/ customer intelligence
15
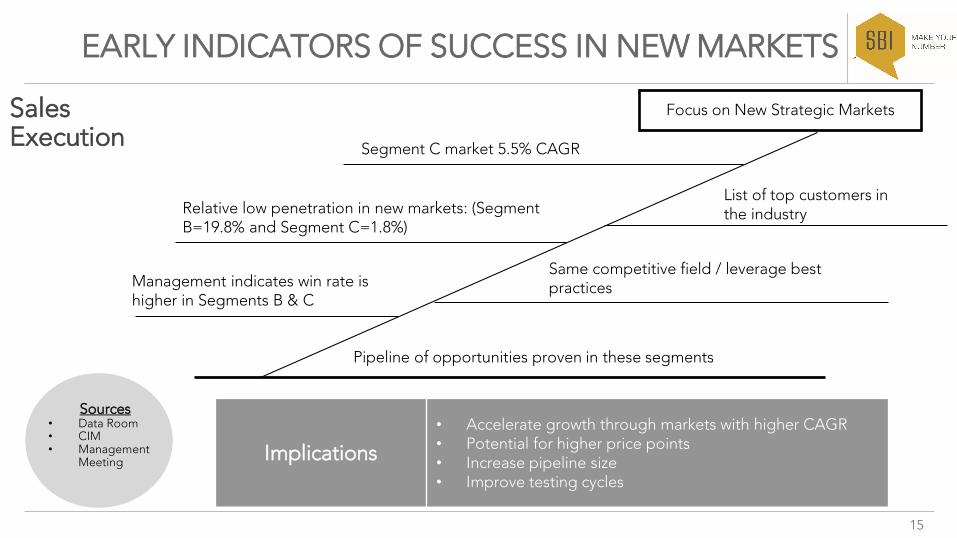
EARLY INDICATORS OF SUCCESS IN NEW MARKETS
Sales Execution
Implications• Accelerate growth through markets with higher CAGR• Potential for higher price points• Increase pipeline size• Improve testing cycles
Sources• Data Room• CIM• Management
Meeting
Focus on New Strategic Markets
Segment C market 5.5% CAGR
Relative low penetration in new markets: (Segment B=19.8% and Segment C=1.8%)
List of top customers in the industry
Same competitive field / leverage best practicesManagement indicates win rate is
higher in Segments B & C
Pipeline of opportunities proven in these segments
Corporate Strategy

17
CORPORATE STRATEGY
MissionHow we win
VisionWhat we want to
become
ValuesHow we behave
BrandHow we serve
customers
ObjectivesCorporate, Product,
Marketing, Sales, Ops
Market Segmentation
Competition
Advantages
Product Strategy
19
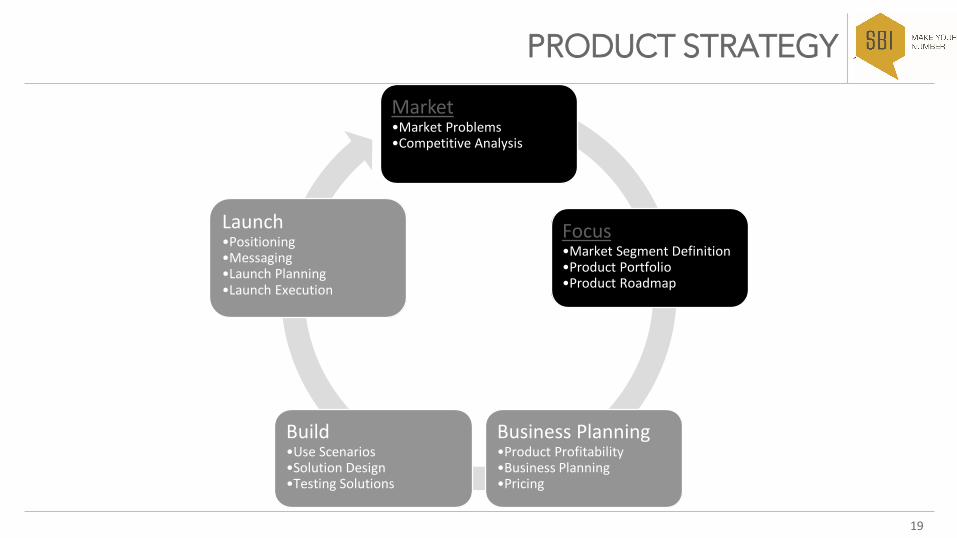
PRODUCT STRATEGY
Market•Market Problems•Competitive Analysis
Focus•Market Segment Definition•Product Portfolio•Product Roadmap
Business Planning•Product Profitability•Business Planning•Pricing
Build•Use Scenarios•Solution Design•Testing Solutions
Launch•Positioning•Messaging•Launch Planning•Launch Execution
Marketing Strategy

21
MARKETING STRATEGY
Market•Market Segmentation•Account Segmentation•Buyer Segmentation
Planning•Brand Planning•Campaign Planning•Budget Planning
Process•Content Process•Campaign Process•Lead Management
Process
Org•Marketing Org Design•Agency Management
Execution•Product Marketing•Content Production•Campaign Execution•Lead Management
Execution•Field Marketing
Support•Reporting•Marketing Operations•Systems
22
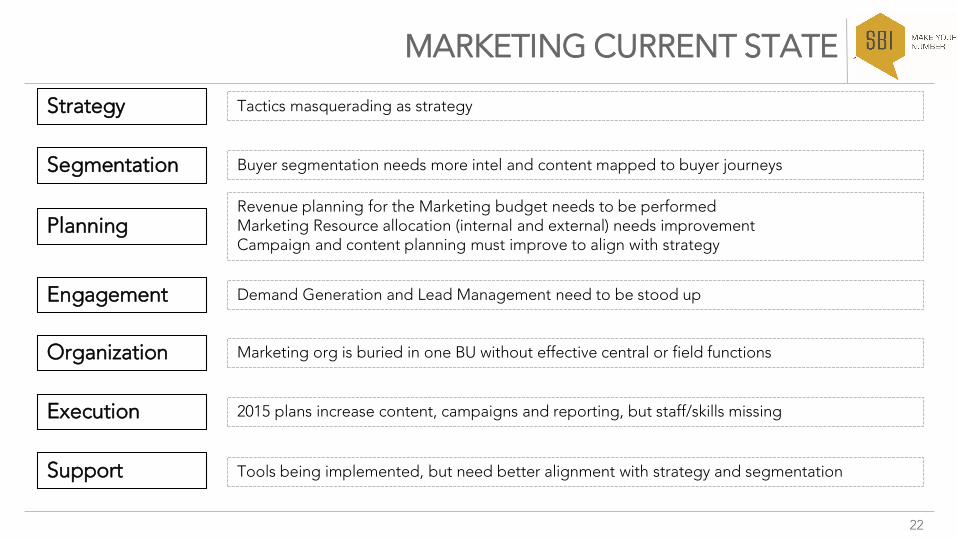
MARKETING CURRENT STATE
Strategy Tactics masquerading as strategy
PlanningRevenue planning for the Marketing budget needs to be performedMarketing Resource allocation (internal and external) needs improvementCampaign and content planning must improve to align with strategy
Segmentation Buyer segmentation needs more intel and content mapped to buyer journeys
Engagement
Organization
Execution
Support
Demand Generation and Lead Management need to be stood up
Marketing org is buried in one BU without effective central or field functions
2015 plans increase content, campaigns and reporting, but staff/skills missing
Tools being implemented, but need better alignment with strategy and segmentation

Sales Strategy

24
SALES STRATEGY
Segmentation•Market Segmentation•Account Segmentation•Buyer Segmentation
Planning•Revenue Planning•Budget Planning•Data Planning
Engagement•Prospecting•Sales Process
Org•Sales Org Design•Channel Optimization•Talent Program•Territory Design•Quota Setting•Compensation Planning
Execution•Sales Enablement•Sales Adoption•Forecast / Pipeline
Management•Reporting
Support•Sales Operations•Sale Support•Systems

Risk and Mitigation

26
Execution Team Company
Execution
Operational
People
Financial
RISK DISCUSSION
Dimensions1. Execution - Can the desired growth timeline
be met?2. Operational - Is there potential business
disruption during the transition?3. People - Does the team have the ability to
adopt & manage over time?4. Financial - What is the revenue implication
from not executing on recommendations?
• The purpose of this section is to:• Capture and quantify the risks specific to sales and marketing that are relevant to a potential TargetCo acquisition
• Identify a series of actions that can mitigate the impact and/or the likelihood that these risks will materialize
Who is affected most by these risks?
27
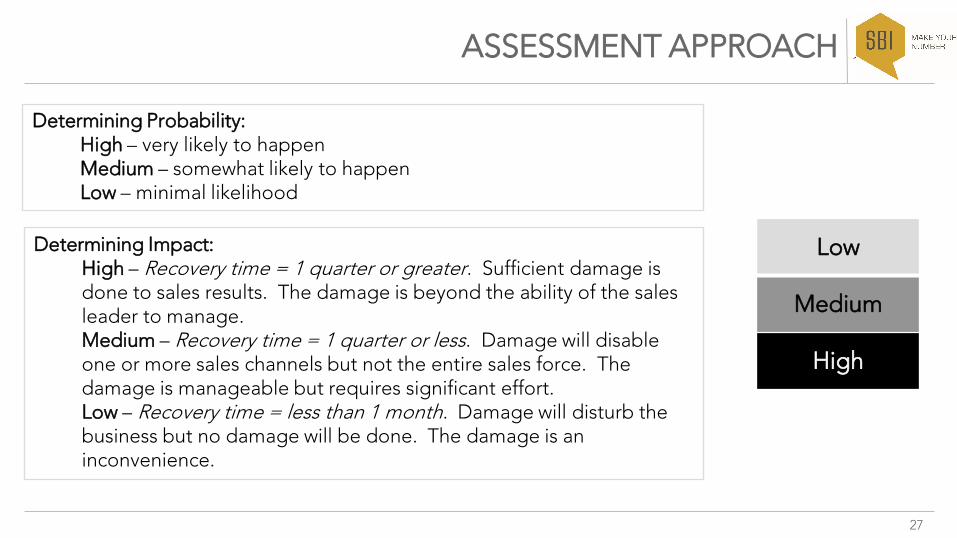
ASSESSMENT APPROACH
Low
Medium
High
Determining Probability: High – very likely to happenMedium – somewhat likely to happenLow – minimal likelihood
Determining Impact: High – Recovery time = 1 quarter or greater. Sufficient damage is done to sales results. The damage is beyond the ability of the sales leader to manage. Medium – Recovery time = 1 quarter or less. Damage will disable one or more sales channels but not the entire sales force. The damage is manageable but requires significant effort. Low – Recovery time = less than 1 month. Damage will disturb the business but no damage will be done. The damage is an inconvenience.

28
EXECUTION
Risk Category Assessment Mitigation Plan
Execution Prob. Impact Comments
Leveraging execs in the sales process cannot be scaled fast enough H H
Hire or train NAMs to be as skilled as current “top to top” sellers; create roundtables where execs can reach many at one time; leverage and enable existing client execs to sell for you
Current leadership approach turns away A players and limits agility and innovation M H Shuffle tenured managers around; assess managers for leadership
competencies and train them;
Management span of control leads to undeveloped talent and turnover H H Implement career paths for supervisor/management positions;
hire/promote sales “team leads” with rep/manager quota mix
Solution is not top of mind for buyers so the value propositions fail to resonate M H Invest in deeper buyer intelligence and modify product positioning
and messaging accordingly; Increase marketing and awareness
Adoption of improvements doesn’t take hold L M Ensure KPIs are related to improvement adoption; leverage robust change management and gamification
Sales pursues low-quality opportunities H M Ensure sales management is coaching reps on prioritized account targeting; modify org to have AS role pursue low-priority accounts
Leads decrease in quality or quantity L H Increase targeted demand generation; ensure no leads go untouched (hire Lead Management personnel)

29
OPERATIONAL
Risk Category Assessment Mitigation Plan
Operational Prob. Impact Comments
Counterattack by competition, especially _________and _________ L M Monitor and mystery shop competition to understand their moves;
socially listen to what’s being said about them; leverage clients
Issues with products cause bad press and lost sales L H
Perform win/loss analyses; ensure rigor around accountimplementation and QBRs; assess risk during sales cycle with new accounts
Key players leave because of new owners L M Prepare and manage strong communications and change mgmt.
Key accounts change stance because of new owners L H Prepare and enable AMs with positive communications about the
change; introduce new owners to key account execs
Backlog increases due to fast growth and lagging operations capabilities L M Sales Management to be measured on forecast accuracy and CRM
use
Aggressive improvement plans placed on the capable few will cause burnout and turnover M M Hire outside help for design, training, implementation tasks
30
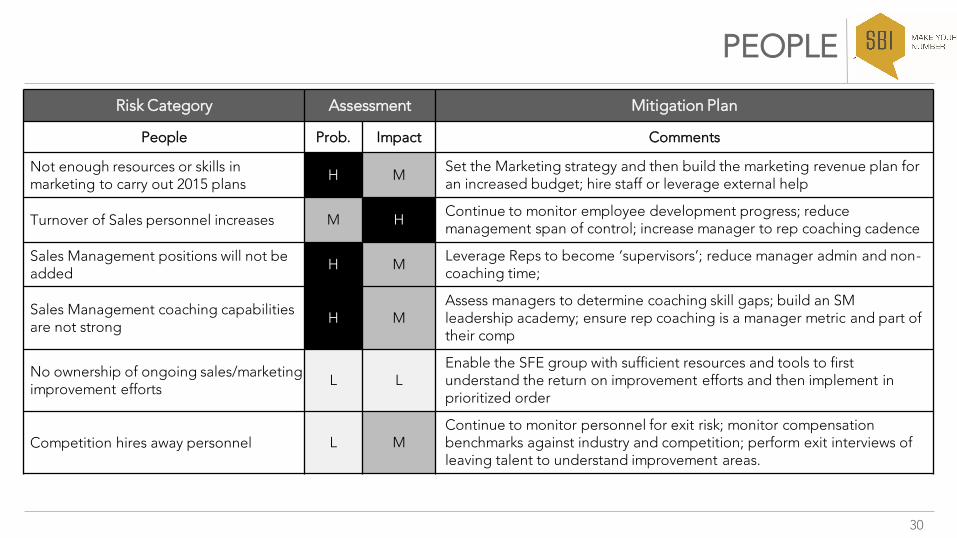
PEOPLE
Risk Category Assessment Mitigation Plan
People Prob. Impact Comments
Not enough resources or skills in marketing to carry out 2015 plans H M Set the Marketing strategy and then build the marketing revenue plan for
an increased budget; hire staff or leverage external help
Turnover of Sales personnel increases M H Continue to monitor employee development progress; reduce management span of control; increase manager to rep coaching cadence
Sales Management positions will not be added H M Leverage Reps to become ‘supervisors’; reduce manager admin and non-
coaching time;
Sales Management coaching capabilities are not strong H M
Assess managers to determine coaching skill gaps; build an SM leadership academy; ensure rep coaching is a manager metric and part of their comp
No ownership of ongoing sales/marketing improvement efforts L L
Enable the SFE group with sufficient resources and tools to first understand the return on improvement efforts and then implement in prioritized order
Competition hires away personnel L MContinue to monitor personnel for exit risk; monitor compensation benchmarks against industry and competition; perform exit interviews of leaving talent to understand improvement areas.
31
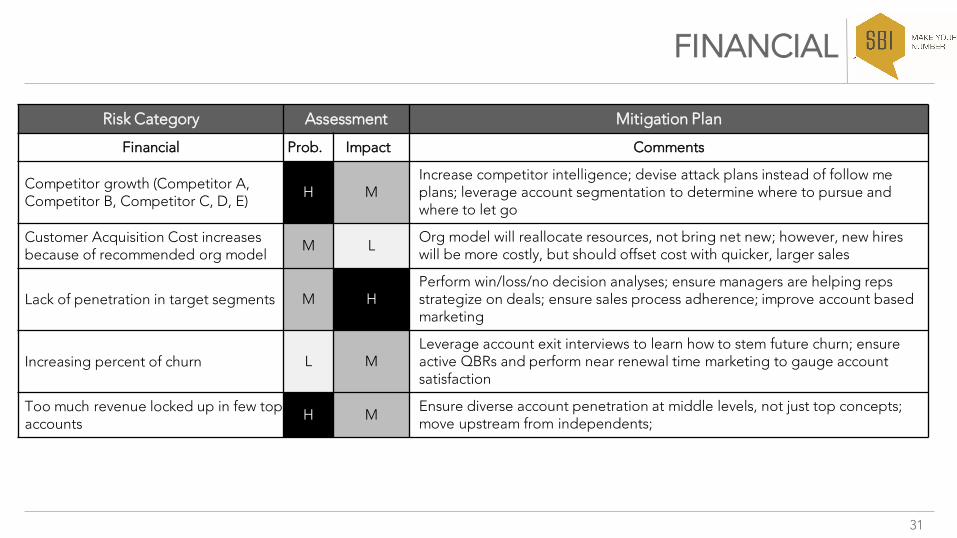
FINANCIAL
Risk Category Assessment Mitigation Plan
Financial Prob. Impact Comments
Competitor growth (Competitor A, Competitor B, Competitor C, D, E) H M
Increase competitor intelligence; devise attack plans instead of follow me plans; leverage account segmentation to determine where to pursue and where to let go
Customer Acquisition Cost increases because of recommended org model M L Org model will reallocate resources, not bring net new; however, new hires
will be more costly, but should offset cost with quicker, larger sales
Lack of penetration in target segments M HPerform win/loss/no decision analyses; ensure managers are helping reps strategize on deals; ensure sales process adherence; improve account based marketing
Increasing percent of churn L MLeverage account exit interviews to learn how to stem future churn; ensure active QBRs and perform near renewal time marketing to gauge account satisfaction
Too much revenue locked up in few top accounts H M Ensure diverse account penetration at middle levels, not just top concepts;
move upstream from independents;
Project TargetCo
Appendix
33
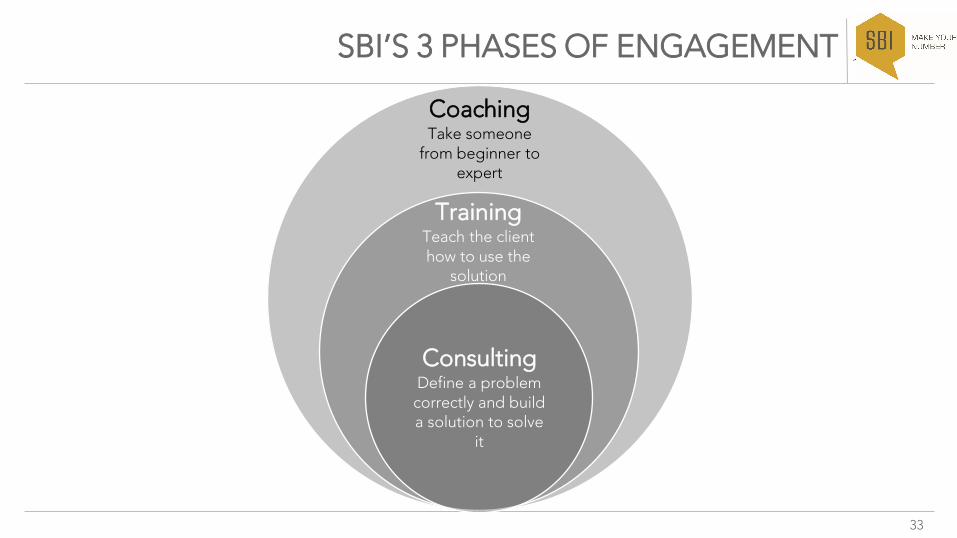
SBI’S 3 PHASES OF ENGAGEMENT
Coaching Take someone
from beginner to expert
Training Teach the client how to use the
solution
Consulting Define a problem correctly and build a solution to solve
it
34
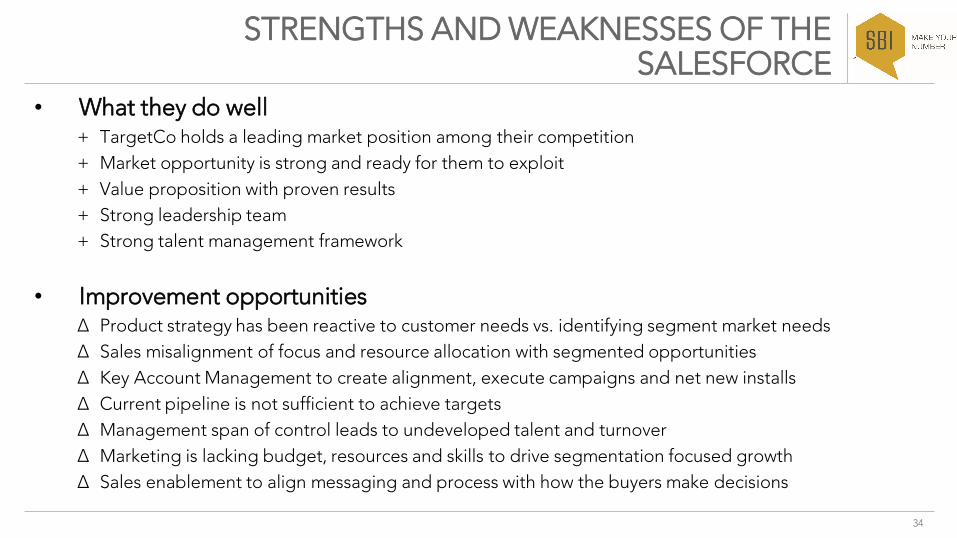
STRENGTHS AND WEAKNESSES OF THE SALESFORCE
• What they do well+ TargetCo holds a leading market position among their competition+ Market opportunity is strong and ready for them to exploit+ Value proposition with proven results+ Strong leadership team+ Strong talent management framework
• Improvement opportunities∆ Product strategy has been reactive to customer needs vs. identifying segment market needs∆ Sales misalignment of focus and resource allocation with segmented opportunities∆ Key Account Management to create alignment, execute campaigns and net new installs∆ Current pipeline is not sufficient to achieve targets∆ Management span of control leads to undeveloped talent and turnover∆ Marketing is lacking budget, resources and skills to drive segmentation focused growth∆ Sales enablement to align messaging and process with how the buyers make decisions
35
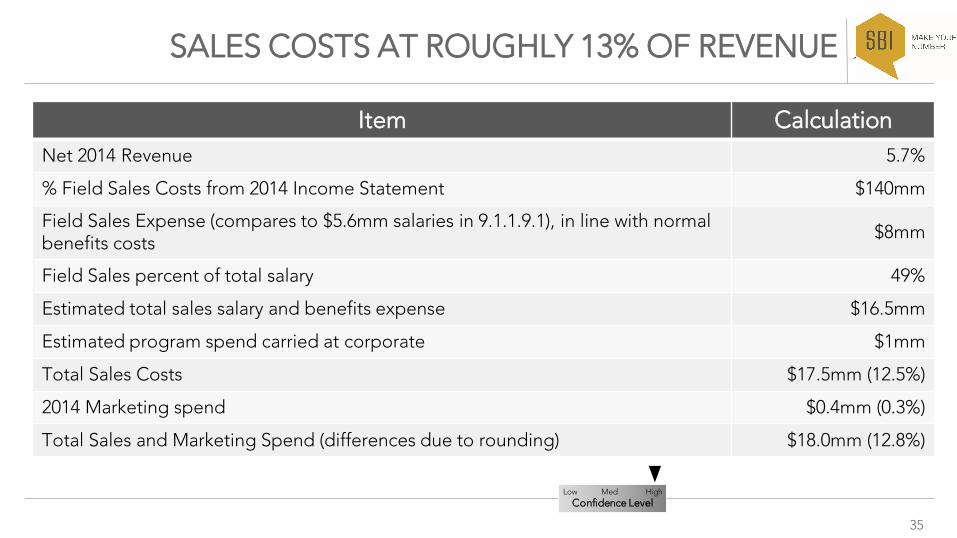
SALES COSTS AT ROUGHLY 13% OF REVENUE
Item CalculationNet 2014 Revenue 5.7%
% Field Sales Costs from 2014 Income Statement $140mm
Field Sales Expense (compares to $5.6mm salaries in 9.1.1.9.1), in line with normal benefits costs $8mm
Field Sales percent of total salary 49%
Estimated total sales salary and benefits expense $16.5mm
Estimated program spend carried at corporate $1mm
Total Sales Costs $17.5mm (12.5%)
2014 Marketing spend $0.4mm (0.3%)
Total Sales and Marketing Spend (differences due to rounding) $18.0mm (12.8%)
Low Med HighConfidence Level

36
CONTRACT SIZE AND CHURN KEY DRIVERS OF CLV
Item CalculationCost of Sales (previous page) 12.5%
Annual Growth 7.8%
Replace annual churn 4.0%
Annual growth ($96mm over 5 year period in CIM) $16.5mm
Sites added in 2014 1,699
Customer Acquisition Cost $9,738
Low Med HighConfidence Level
37
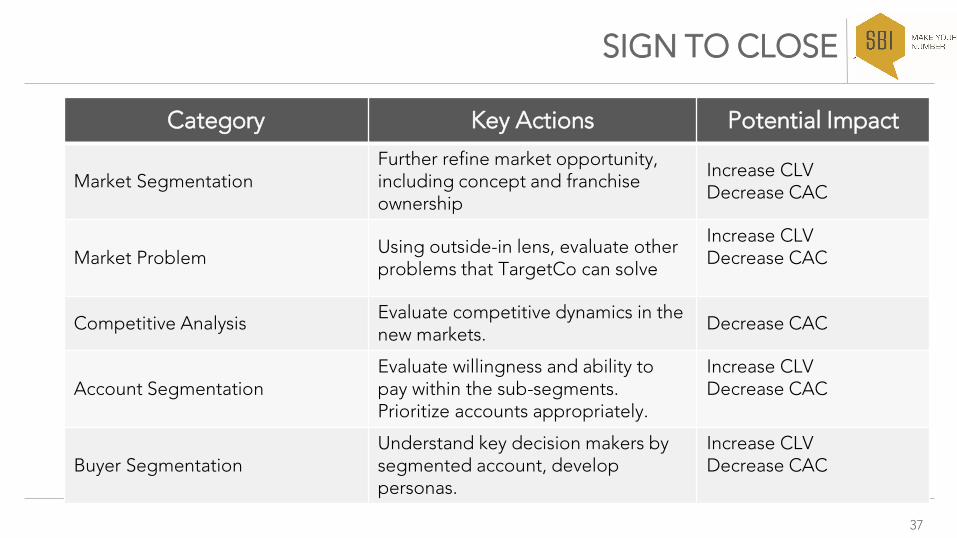
SIGN TO CLOSE
Category Key Actions Potential Impact
Market SegmentationFurther refine market opportunity, including concept and franchise ownership
Increase CLVDecrease CAC
Market Problem Using outside-in lens, evaluate other problems that TargetCo can solve
Increase CLVDecrease CAC
Competitive Analysis Evaluate competitive dynamics in the new markets. Decrease CAC
Account SegmentationEvaluate willingness and ability to pay within the sub-segments.Prioritize accounts appropriately.
Increase CLVDecrease CAC
Buyer SegmentationUnderstand key decision makers by segmented account, develop personas.
Increase CLVDecrease CAC

38
FIRST 100 DAYS
Category Key Actions Potential ImpactProduct Portfolio Calculate profitability by product Increase CLV
Product Roadmap Prioritize development based on new market problems Increase CLV
Budget Planning Increase marketing budget to 2-4% of sales. Revenue increase ~2-5%
Brand Planning Evaluate brand positioning Reduce CAC
Campaign Planning Design campaigns towards buyer personas Reduce CAC
Content Planning Leverage persona data to ensure content is connecting with buyers Reduce CAC
Key Accounts Management Deploy Key Account Management Program
~6-10% increase in CLV, ~8-12% reduction in CAC.
KPIs Evaluate KPIs used to measure sales team
~3-5% reduction in CAC by changing behavior
39
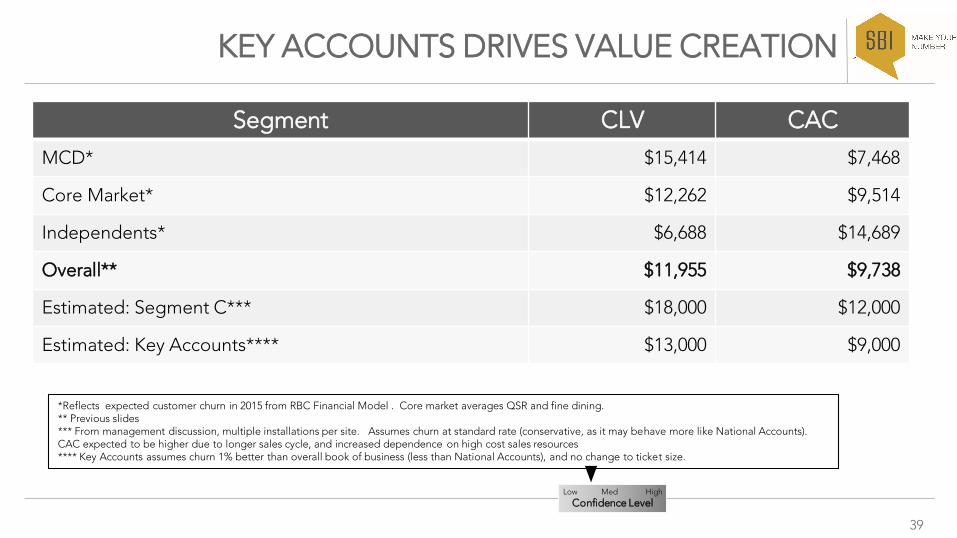
KEY ACCOUNTS DRIVES VALUE CREATION
Segment CLV CACMCD* $15,414 $7,468
Core Market* $12,262 $9,514
Independents* $6,688 $14,689
Overall** $11,955 $9,738
Estimated: Segment C*** $18,000 $12,000
Estimated: Key Accounts**** $13,000 $9,000
Low Med HighConfidence Level
*Reflects expected customer churn in 2015 from RBC Financial Model . Core market averages QSR and fine dining.** Previous slides*** From management discussion, multiple installations per site. Assumes churn at standard rate (conservative, as it may behave more like National Accounts). CAC expected to be higher due to longer sales cycle, and increased dependence on high cost sales resources**** Key Accounts assumes churn 1% better than overall book of business (less than National Accounts), and no change to ticket size.
40
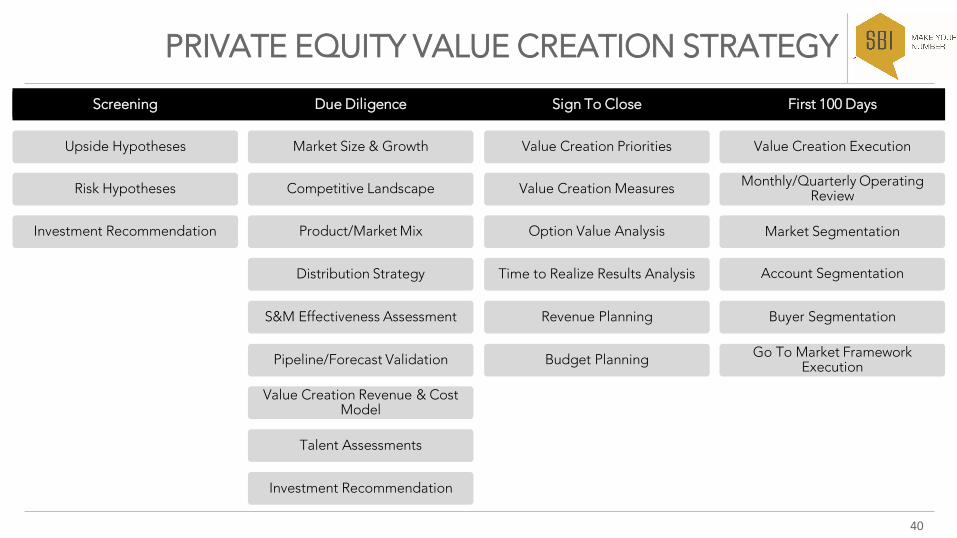
PRIVATE EQUITY VALUE CREATION STRATEGY
Value Creation Revenue & Cost Model
Investment Recommendation
Talent Assessments
Revenue Planning
Budget Planning
Risk Hypotheses
Upside Hypotheses
Investment Recommendation
Competitive Landscape
Market Size & Growth
Distribution Strategy
Product/Market Mix
Pipeline/Forecast Validation
S&M Effectiveness Assessment
Value Creation Measures
Value Creation Priorities
Time to Realize Results Analysis
Option Value Analysis
Monthly/Quarterly Operating Review
Value Creation Execution
Buyer Segmentation
Account Segmentation
Go To Market Framework Execution
Screening Due Diligence Sign To Close First 100 Days
Market Segmentation
41
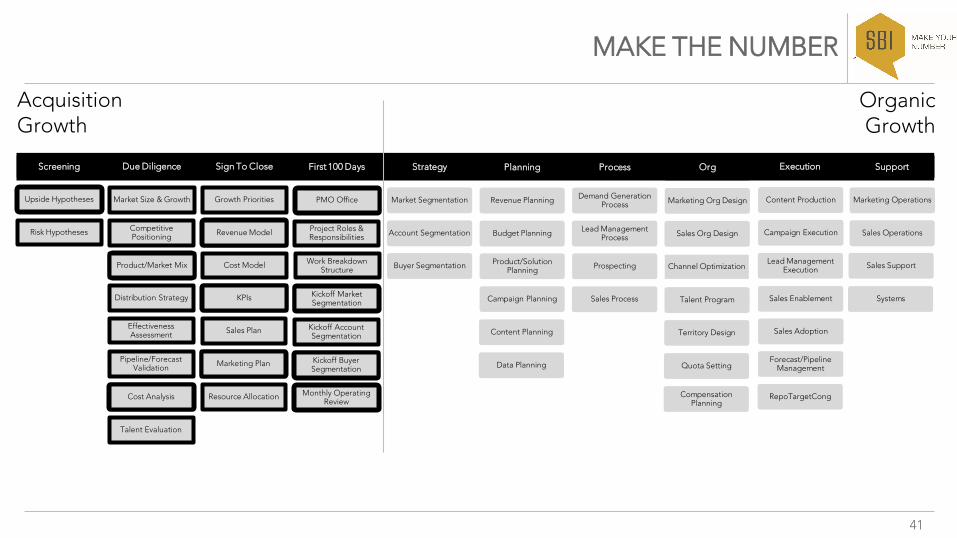
MAKE THE NUMBER
Acquisition Growth
OrganicGrowth
Risk Hypotheses
Upside Hypotheses
Competitive Positioning
Market Size & Growth
Distribution Strategy
Product/Market Mix
Pipeline/Forecast Validation
Effectiveness Assessment
Talent Evaluation
Cost Analysis
Revenue Model
Growth Priorities
KPIs
Cost Model
Marketing Plan
Sales Plan
Resource Allocation
Project Roles & Responsibilities
PMO Office
Kickoff Market Segmentation
Work Breakdown Structure
Kickoff Buyer Segmentation
Kickoff Account Segmentation
Monthly Operating Review
Account Segmentation
Market Segmentation
Buyer Segmentation
Budget Planning
Revenue Planning
Campaign Planning
Product/Solution Planning
Data Planning
Content Planning
Lead Management Process
Demand Generation Process
Sales Process
Prospecting
Sales Org Design
Marketing Org Design
Territory Design
Talent Program
Compensation Planning
Quota Setting
Sales Enablement
Campaign Execution
Forecast/Pipeline Management
Sales Adoption
RepoTargetCong
Sales Operations
Marketing Operations
Sales Support
Systems
Screening Due Diligence Sign To Close First 100 Days Strategy Planning Process Org Execution Support
Lead Management Execution
Content Production
Channel Optimization

42
SBI’s Blog: http://www.salesbenchmarkindex.com/subscribe
SALES FORCE EFFECTIVENESS AND MARKETING EFFECTIVENESS CONTENT
SBI’s Podcasthttp://www.salesbenchmarkindex.com/podcasts
SBI’s Magazine:http://www.salesbenchmarkindex.com/the-sbi-magazine
Related Documents


![Align Sales & Marketing with Sales Enablement [SiriusDecisions Summit 2017]](https://static.cupdf.com/doc/110x72/5a650a5a7f8b9aa2548b6271/align-sales-marketing-with-sales-enablement-siriusdecisions-summit-2017.jpg)