Daily Meat Production Project Storyboard Al-MAWARID Meat Company Kuwait Visit GoLeanSixSigma.com for more Lean Six Sigma Resources

Welcome message from author
This document is posted to help you gain knowledge. Please leave a comment to let me know what you think about it! Share it to your friends and learn new things together.
Transcript
Daily Meat ProductionProject Storyboard
Al-MAWARID Meat Company Kuwait
Visit GoLeanSixSigma.com for more Lean Six Sigma Resources

1.543,4
1.774,41.798,1
1.864,6
NOV-16 DEC-16 JAN-17 FEB-17
Nov-16 to Feb-17 Baseline
Products [kg/d]
1.500,6
1.791,7 1.769,8
1.923,5
NOV-15 DEC-15 JAN-16 FEB-16
Nov-15 to Feb-16 Baseline
Products [kg/d]

Key Words(Specific Meat Processing)
• Production Manager
The PM is the head of the production department (19 persons incl. PM & QC)
• Working hours
The working hours are from 07:00 am to 03:00 pm from Sunday to Thursday. Breaks are from 09:00 to 09:15 am and 12:00 to 12:45 pm.
• Chiller
The chiller is a chilling area 0 – 5 degrees C in order to chill down fresh meat products (expiry date is only 5 days).
• Quick Freezer
The quick freezer is a cooling area -18 degrees C in order to quick freeze frozen meat products (expiry date is 9 months).
• Grinder
A meat grinder or meat mincer is a production appliance for fine chopping ('mincing') of, or mixing of raw meat.
• Mincer
A production equipment used for making smaller pieces of meat for further production steps.
• Soy Protein
Soy protein is an additive for frozen meat. The frozen meat expiry is 9 months.
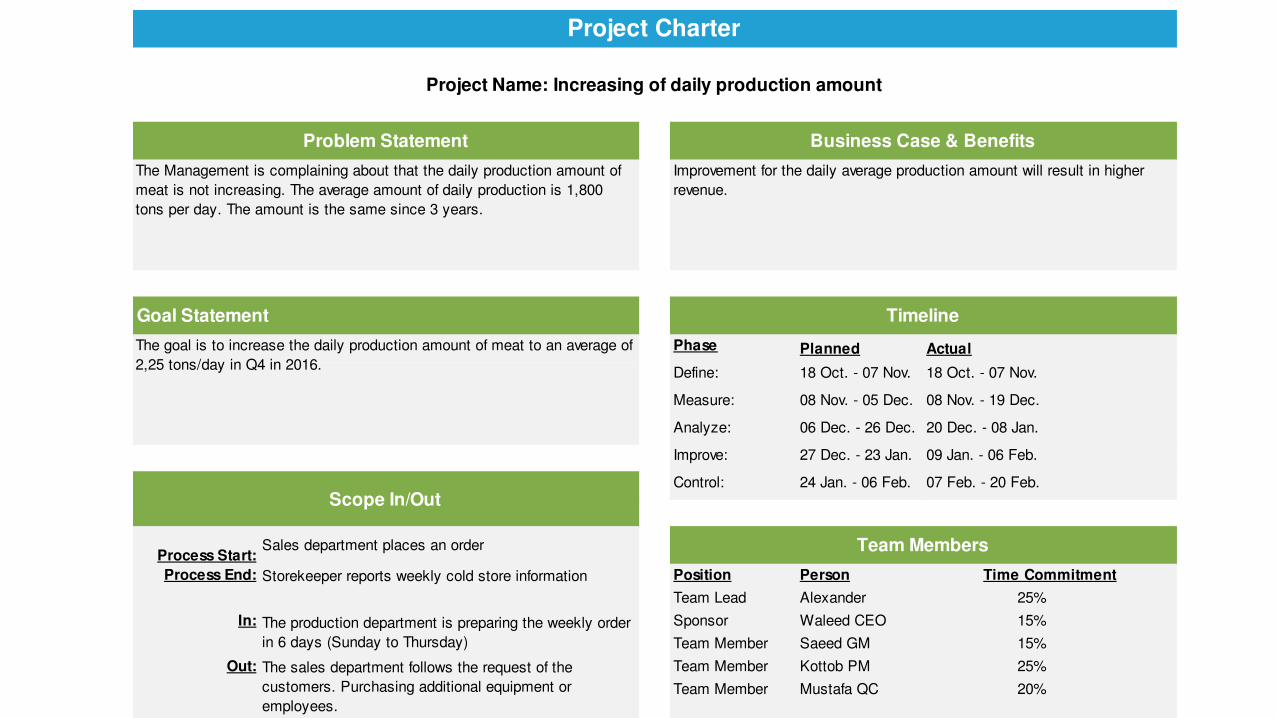
Phase Planned Actual
Define: 18 Oct. - 07 Nov. 18 Oct. - 07 Nov.
Measure: 08 Nov. - 05 Dec. 08 Nov. - 19 Dec.
Analyze: 06 Dec. - 26 Dec. 20 Dec. - 08 Jan.
Improve: 27 Dec. - 23 Jan. 09 Jan. - 06 Feb.
Control: 24 Jan. - 06 Feb. 07 Feb. - 20 Feb.
Process Start:
Process End: Position Person
Team Lead Alexander 25%
In: Sponsor Waleed CEO 15%
Team Member Saeed GM 15%
Out: Team Member Kottob PM 25%
Team Member Mustafa QC 20%
Project Charter
The Management is complaining about that the daily production amount of
meat is not increasing. The average amount of daily production is 1,800
tons per day. The amount is the same since 3 years.
Improvement for the daily average production amount will result in higher
revenue.
Problem Statement
Goal Statement
Business Case & Benefits
Timeline
The production department is preparing the weekly order
in 6 days (Sunday to Thursday)
The sales department follows the request of the
customers. Purchasing additional equipment or
employees.
Project Name: Increasing of daily production amount
Scope In/Out
Sales department places an order
Storekeeper reports weekly cold store information
The goal is to increase the daily production amount of meat to an average of
2,25 tons/day in Q4 in 2016.
Team Members
Time Commitment

Key Take Away: The production of meat need to increase in order to be financial breakeven
Customer Comment
(What Are They Saying?)
Gathering More Understanding
(Why Are They Saying it?)
Customer Requirement
(What Do They Want?)
The storage area is too small Loosing revenue because of limited spaceImprovement of storage capacity and inventory
management
The equipment is out of order too many times The equipment isn't up to dateThe maintenance time should be max. 5% per year
(117 hrs/ano)
The customer sends products back Poor quality of packaging Improve packaging standard
The production isn't increasing The daily operation costs are higher than income 2,25 tons per day is necessary for break even
Voice Of the Customer Translation Matrix
Too much overtime Operation costs are too high Reduce the overtime to max. + 5% per week
Too many external products Loosing of production time Produce external products in spare time
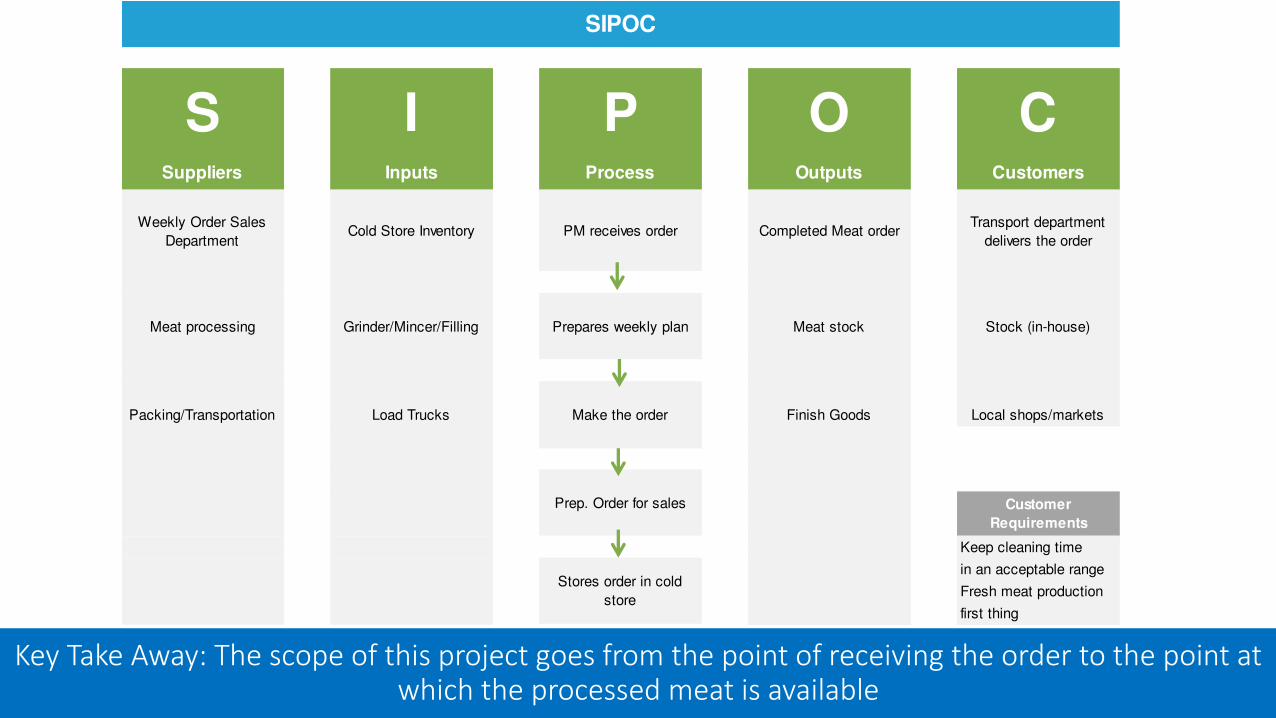
Key Take Away: The scope of this project goes from the point of receiving the order to the point at which the processed meat is available
S I P O CSuppliers Inputs Process Outputs Customers
Weekly Order Sales
DepartmentCold Store Inventory Completed Meat order
Transport department
delivers the order
Meat processing Grinder/Mincer/Filling Meat stock Stock (in-house)
Packing/Transportation Load Trucks Finish Goods Local shops/markets
Keep cleaning time
in an acceptable range
Fresh meat production
first thing
Stores order in cold
store
Customer
Requirements
SIPOC
PM receives order
Prepares weekly plan
Make the order
Prep. Order for sales

Key Take Away: The QC manager was largely responsible for all data collection The data got collected in format hh:mm. The PM adjusted job duties to accommodate.
Therefore, a MSA is not necessary.
Measure Data Type Operational DefinitionStratification
FactorsSampling Notes Who and How
Data Collection Planning
Pick-Up Time
for Material
from Cold
Store
Continuous
Cycle Time in minutes from the moment a
process request material to the moment the
meat is delivered
by flicker
by oven
by saw
by filling machine
sample every other pick-
up for the equipment
QC notes all information
and keep a log during
QC notes all information
and keep a log during
Cleaning
Time of
Equipment
ContinuousCycle time in minutes for each cleaning
process of the equipmentall equipments
sample every work day
for one month
QC notes all information
and keep a log during
Running Time
of EquipmentContinuous
Cycle Time in minutes from the moment the
meat processing starts until handover to the
next step
all equipmentssample every other pick-
up for the equipment
QC notes all information
and keep a log during
Failure Mode
Time of
Equipment
ContinuousCycle time in minutes from the beginning until
the restart of the single equipmentall equipments
sample every work day
for one month
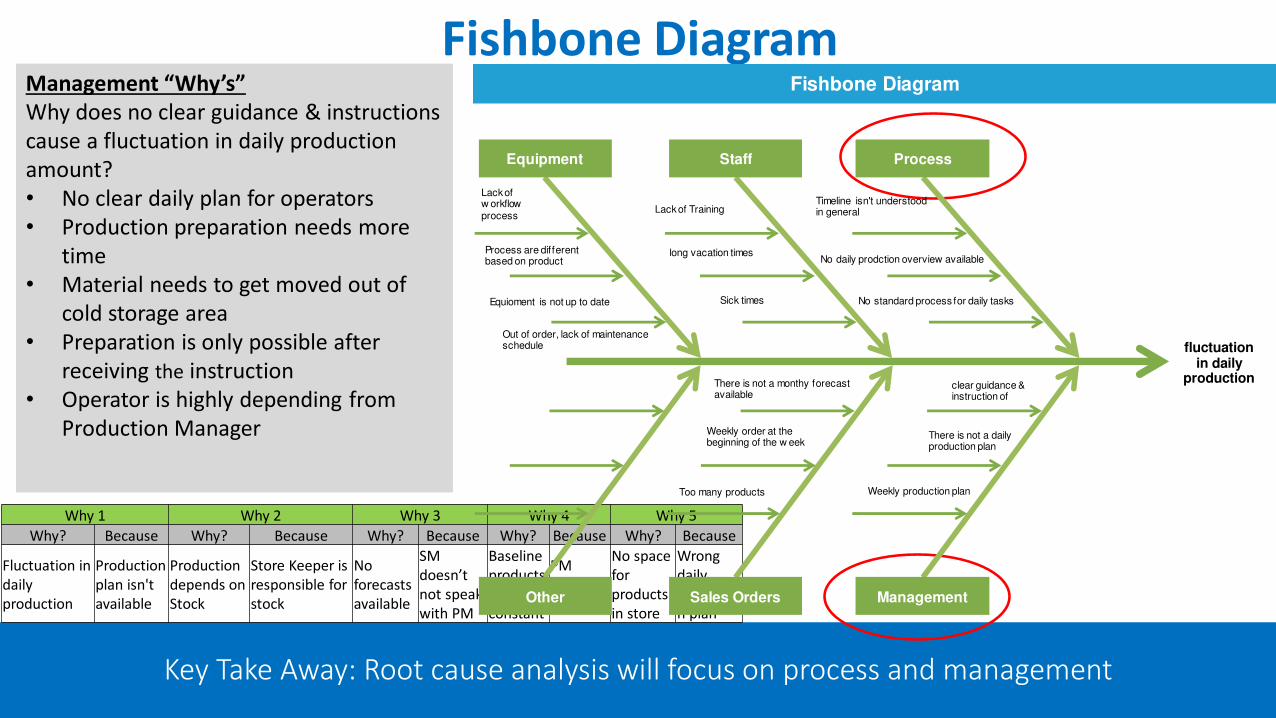
Key Take Away: Root cause analysis will focus on process and management
Fishbone Diagram
Why 1 Why 2 Why 3 Why 4 Why 5
Why? Because Why? Because Why? Because Why? Because Why? Because
Fluctuation in
daily
production
Production
plan isn't
available
Production
depends on
Stock
Store Keeper is
responsible for
stock
No
forecasts
available
SM
doesn’t not speak
with PM
Baseline
products
aren't
constant
PM
doesn’t plan
No space
for
products
in store
Wrong
daily
productio
n plan
Ma age e t Why’sWhy does no clear guidance & instructions
cause a fluctuation in daily production
amount?
• No clear daily plan for operators
• Production preparation needs more
time
• Material needs to get moved out of
cold storage area
• Preparation is only possible after
receiving the instruction
• Operator is highly depending from
Production Manager
Fishbone Diagram
Equipment
Lackof w orkflow process
Process are different based on product
Equioment is not up to date
Staff
Lackof Training
long vacation times
Sick times
Process
Timeline isn't understood in general
No daily prodction overview available
No standard process for daily tasks
There is not a monthy forecast available
Weekly order at the beginning of the w eek
Too many products
clear guidance &instruction of
There is not a daily production plan
Weekly production plan
Other Sales Orders Management
fluctuation in daily
production
Out of order, lack of maintenance schedule
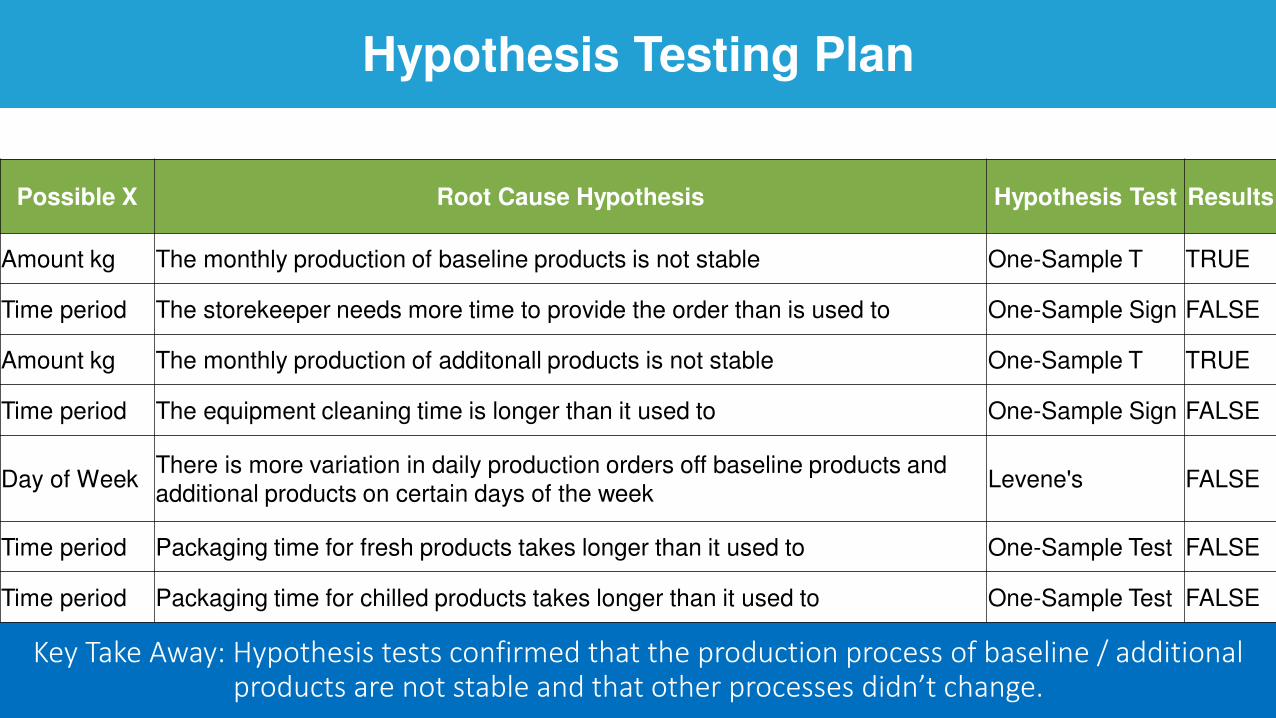
Key Take Away: Hypothesis tests confirmed that the production process of baseline / additional produ ts are not sta le and that other pro esses didn’t hange.
Hypothesis Testing Plan
Possible X Root Cause Hypothesis Hypothesis Test Results
Amount kg The monthly production of baseline products is not stable One-Sample T TRUE
Time period The storekeeper needs more time to provide the order than is used to One-Sample Sign FALSE
Amount kg The monthly production of additonall products is not stable One-Sample T TRUE
Time period The equipment cleaning time is longer than it used to One-Sample Sign FALSE
Day of WeekThere is more variation in daily production orders off baseline products and
additional products on certain days of the weekLevene's FALSE
Time period Packaging time for fresh products takes longer than it used to One-Sample Test FALSE
Time period Packaging time for chilled products takes longer than it used to One-Sample Test FALSE
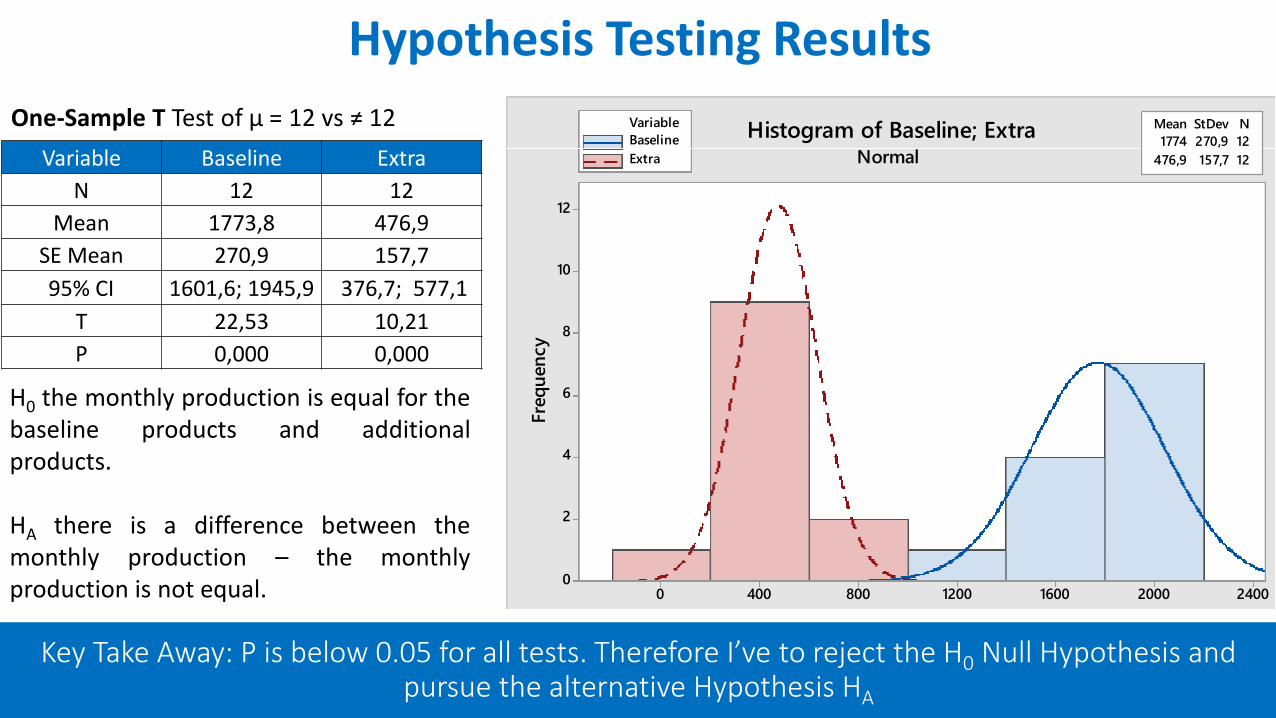
Hypothesis Testing Results
Key Take A ay: P is elo 0.05 for all tests. Therefore I’ e to reje t the H0 Null Hypothesis and pursue the alternative Hypothesis HA
One-Sample T Test of μ = vs ≠ Variable Baseline Extra
N 12 12
Mean 1773,8 476,9
SE Mean 270,9 157,7
95% CI 1601,6; 1945,9 376,7; 577,1
T 22,53 10,21
P 0,000 0,000
H0 the monthly production is equal for the
baseline products and additional
products.
HA there is a difference between the
monthly production – the monthly
production is not equal. 20
2
4
6
8
01
21
0 004 008 0021 0061 0002 004
1774 270,9 12
476,9 157,7 12
Mean StDev N
Fy
cn
eu
qer
B
elbairaV
artxE
enilesaH
lamroN
artxE ;enilesaB fo margotsi
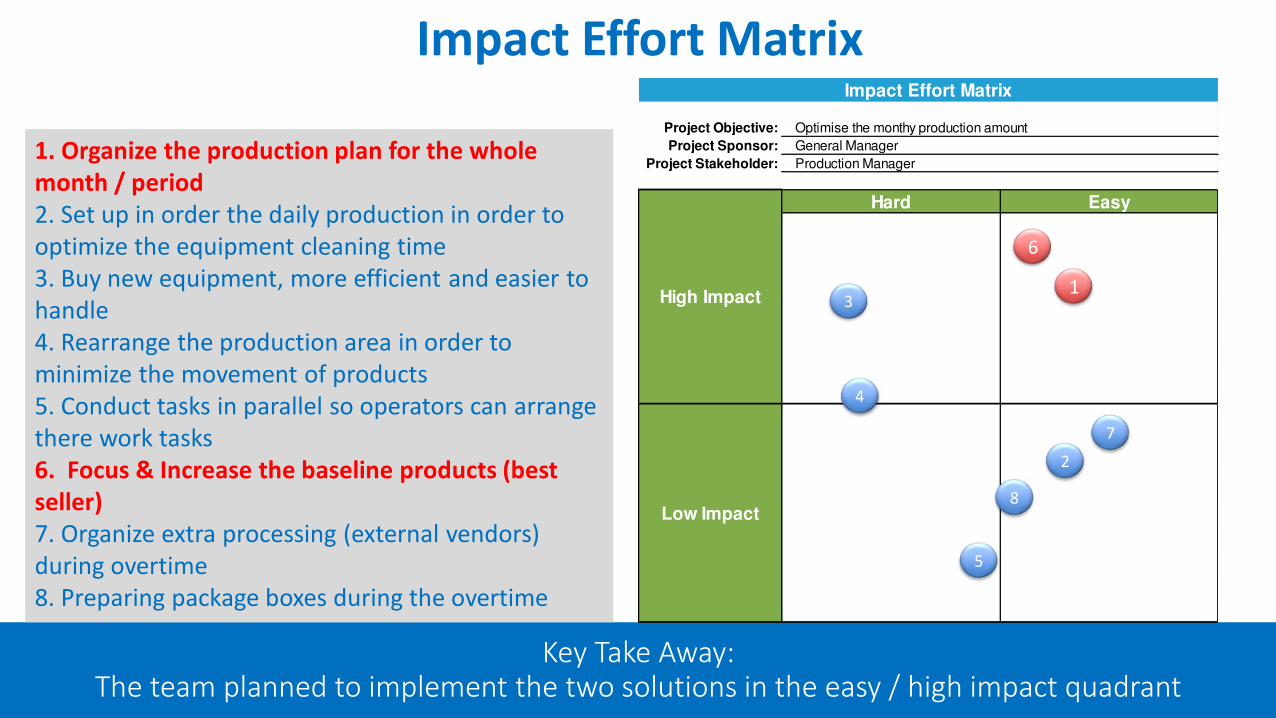
Impact Effort Matrix
Key Take Away: The team planned to implement the two solutions in the easy / high impact quadrant
1. Organize the production plan for the whole
month / period
2. Set up in order the daily production in order to
optimize the equipment cleaning time
3. Buy new equipment, more efficient and easier to
handle
4. Rearrange the production area in order to
minimize the movement of products
5. Conduct tasks in parallel so operators can arrange
there work tasks
6. Focus & Increase the baseline products (best
seller)
7. Organize extra processing (external vendors)
during overtime
8. Preparing package boxes during the overtime
Project Objective:
Project Sponsor:
Project Stakeholder:
Hard Easy
Low Impact
High Impact
Impact Effort Matrix
Optimise the monthy production amount
General Manager
Production Manager
1
2
3
4
5
6
7
8

Key Take Away: Cross-Training mitigated the risk of wrong planning for the daily minced meat production
Risk Management Plan
Jan 12th, 2017 (Rev.):
Process
Step/Input
Potential
Failure Mode
Potential
Failure
Effects
Potential
Causes
Current
Controls
Action
RecommendedResp.
Actions
Taken
Daily fresh
minced meat
production
under-
production
(less than
450 kg/d)
don’t reach the daily
goal
8
not enough
raw material
in store
10
cold store
inventory
and stock
order
process
5 400
proper planning
of monthly
prodcution,
cross train of
SM & PM
GM 19. Jan 10 8 1 80
OC
CU
RR
EN
CE
(1
- 1
0)
DE
TE
CT
ION
(1
- 1
0)
RP
N
What is the
process step
and input under
investigation?
In w hat w ays
does the Key
Input go
w rong?
What is the
impact on the
Key Output
Variables
(Customer
Requirements)
?
What causes
the Key Input to
go w rong?
What controls
and
procedures
exist that
prevent the
cause or the
Failure Mode?
What are the
actions for
reducing the
occurrence of the
cause or
improving
detection?
What are the
completed
action taken
w ith the
recalculated
RPN?
SE
VE
RIT
Y (1
- 1
0)
OC
CU
RR
EN
CE
(1
- 1
0)
DE
TE
CT
ION
(1
- 1
0)
RP
N
SE
VE
RIT
Y (1
- 1
0)
FMEA Form
Process/Product Name:
Responsible: FMEA Date (Orig.):
Prepared By:Baseline Product Production
Production Manager
Team

Key Take Away: The PM is responsible for monthly production plan. The PM gets the forecast from the SM. The storekeeper is responsible for the stock of materials
(define min & max amount)
To Be Map
Operator
Swimlane Map
Storekeeper
Sales
Manager
Production
Manager
Requests
Products for
the Month
Plans Monthly
Production
Check Stock
inventory
Send Order to
Operator
Requests
Material from
Store
Produces
Daily Order
Responsible
for Stock AMT
Updates
Ready Stock

Key Take Away: Implemented solutions decreased variation of baseline products and achieved project goal of 1,800 kg/d
Before & After Time Data
1.500,6
1.791,71.769,8
1.923,5
1.400,0
1.500,0
1.600,0
1.700,0
1.800,0
1.900,0
2.000,0
NOV-15 DEC-15 JAN-16 FEB-16
Nov-15 to Feb-16 Baseline Products [kg/d]
1.543,4
1.774,41.798,1
1.864,6
NOV-16 DEC-16 JAN-17 FEB-17
Nov-16 to Feb-17 Baseline Products [kg/d]

Key Take Away: The monitoring plan factors the leading indicators of daily production of baseline products, cold store inventory and total daily production amount
Monitoring & Response Plan
MeasureInput, Process
or Output?
Trigger Measures
(Control Limits/Specs)
Method of
MeasurementChecking Frequency Who is Responsible
Production of Baseline Products Output Less than 15% Daily production Report Daily Production Manager
Cold Store Inventory Input 40% of stock available Daily Stock inventory Weekly GM
Daily Production Amount Process Less than 2,0 tons per day Daily production Report Weekly Production Manager
Monitoring Plan
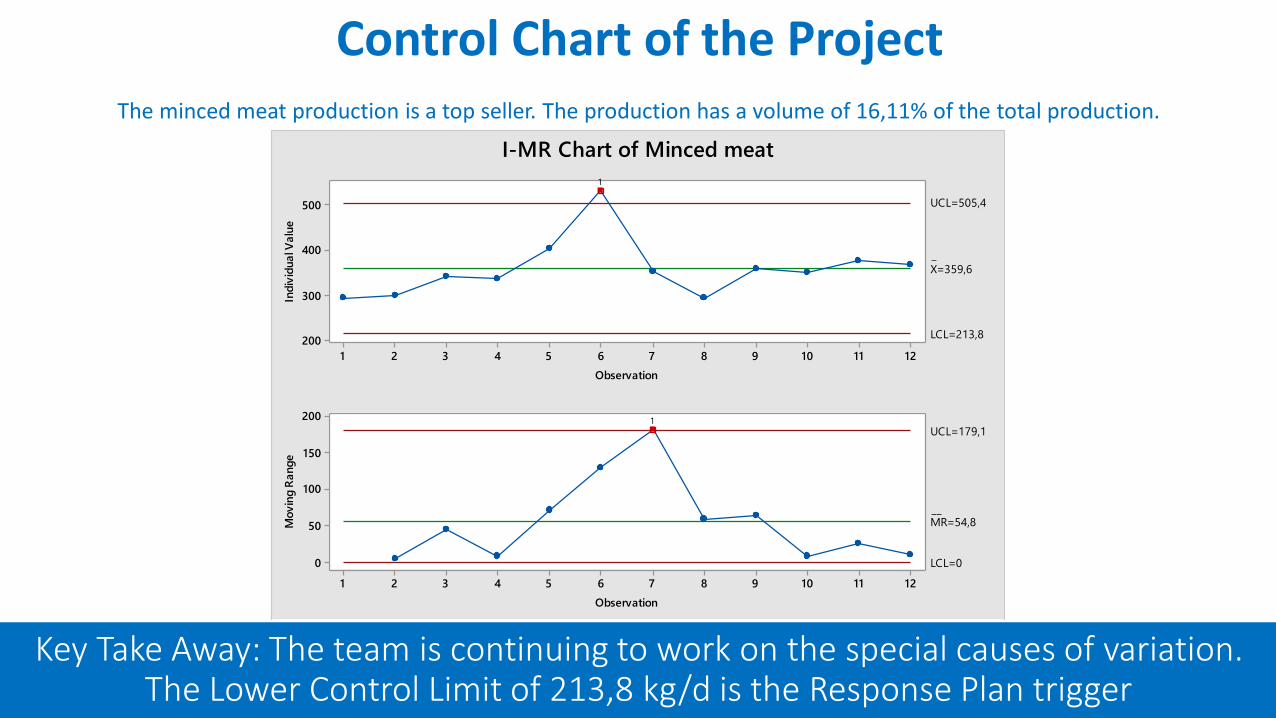
Control Chart of the Project
Key Take Away: The team is continuing to work on the special causes of variation. The Lower Control Limit of 213,8 kg/d is the Response Plan trigger
121110987654321
500
400
300
200
Observation
Ind
ivid
ua
l Va
lue
_
X=359,6
UCL=505,4
LCL=213,8
121110987654321
200
150
100
50
0
Observation
Mo
vin
g R
an
ge
__
MR=54,8
UCL=179,1
LCL=0
1
1
I-MR Chart of Minced meat
The minced meat production is a top seller. The production has a volume of 16,11% of the total production.
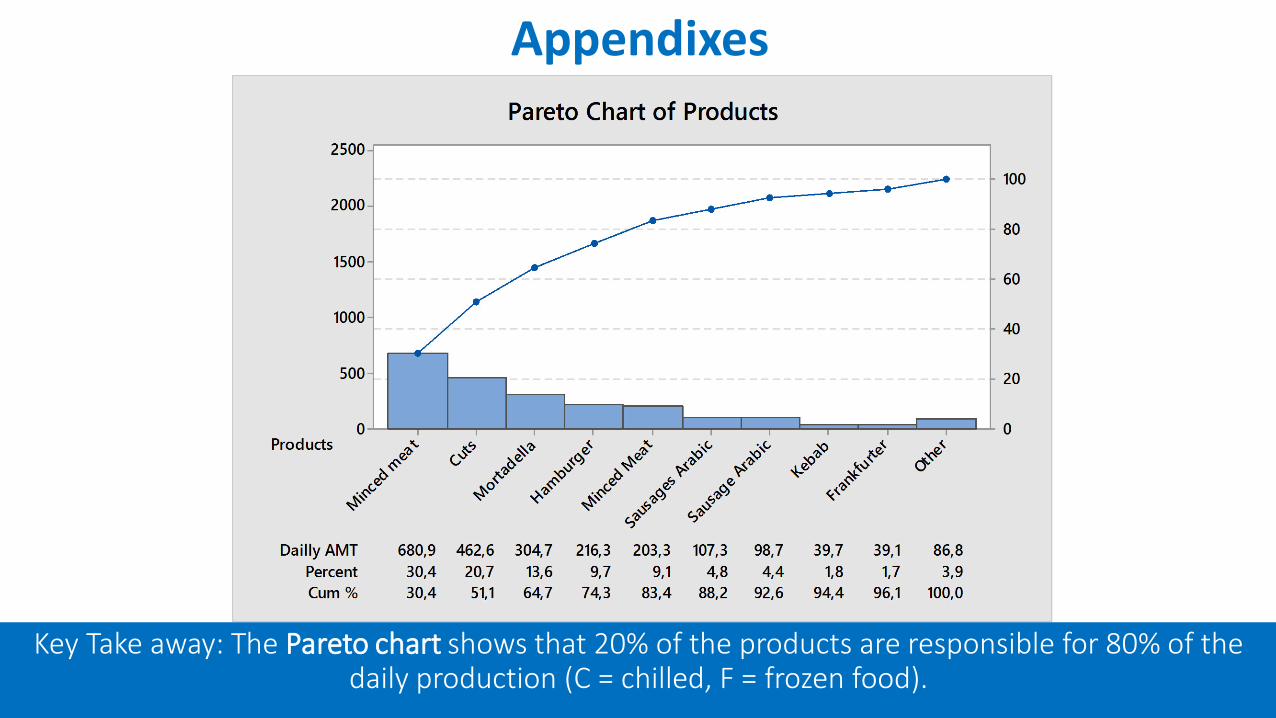
Key Take away: The Pareto chart shows that 20% of the products are responsible for 80% of the daily production (C = chilled, F = frozen food).
Appendixes

Key Take Away: The daily average production amount is not equal for the year 2016. Improvement focused on the production management process.
One-Sample T-Test
300027002400210018001500
4
3
2
1
0
Daily Average [kg]
There have been complaints from management of Al-Mawarid Company. One hypothesis from the GM is that the
daily amount of production is equal each month of the year. Let us see if the data and test supports this hypothesis.
Let us look at the average production amount in kg/d.
Variable C1
N 12
Mean 2250,7
StDev 316,7
SE Mean 91,4
95%; CI 2049,4 ; 2451,9
T 24,61
P 0,000
Test of μ = 0,95 vs ≠ 0,95One-Sample T: C1

Stakeholder/
Stakeholder
Group
Impact Level Level of SupportReason for
Resistance or Support
Action(s) to Address
This Stakeholder
Group
Contact
Waleed
(Sponsor)Decision Authority Supportive He is aware of the problem
Wants to be in the loop for
the outcomesEmail
Saeed (GM) Impacts Neutral LSS is a new experienceKeep informed before daily
actionMeetings
Yahia (Finance
Manager)Affected Supportive
He is responsible for the
financesKeep informed Email
Mustafa
(Quality
Control)
Affected Resistant Job SafetyKeep informed before daily
actionMeetings
Kottob
(Production
Manager)
Affected Resistant Job Safety Briefings before action Meetings
Stakeholder Analysis (Advanced)
Key Take Away: The production manager has a key responsibility for a successful project. Therefore, the communication plan is very important (dead lock).
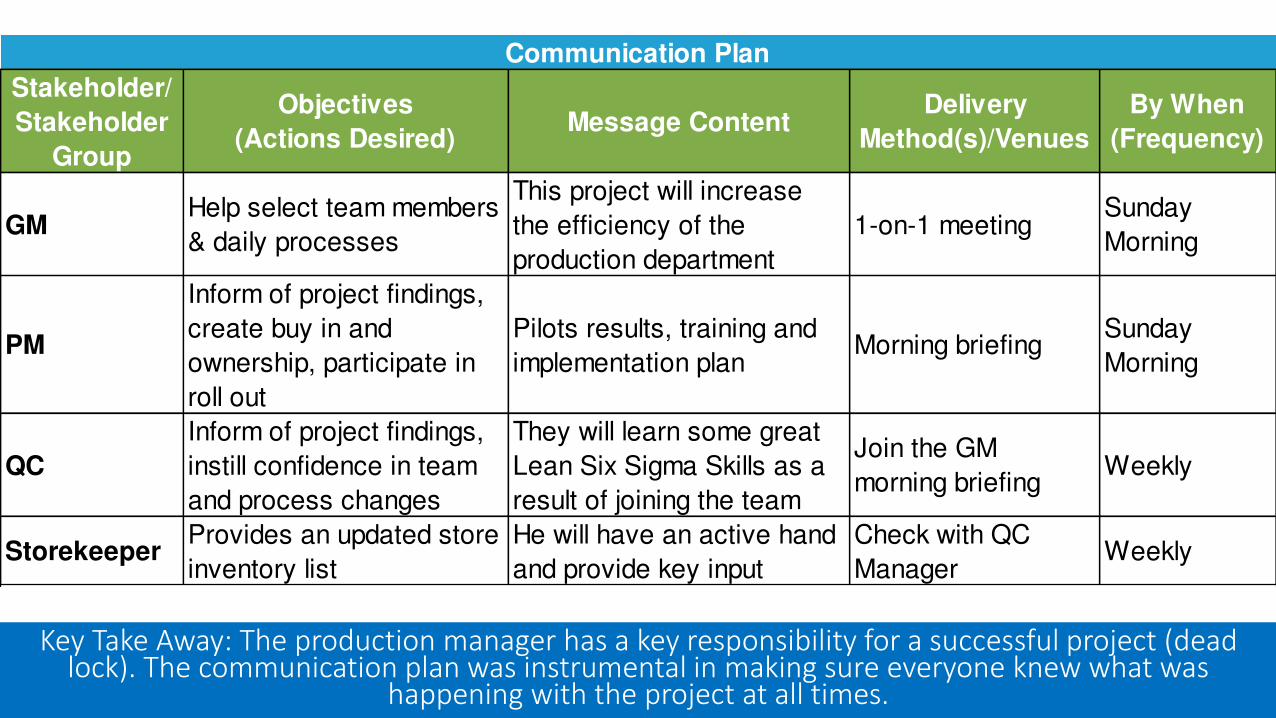
Key Take Away: The production manager has a key responsibility for a successful project (dead lock). The communication plan was instrumental in making sure everyone knew what was
happening with the project at all times.
Stakeholder/
Stakeholder
Group
Objectives
(Actions Desired)Message Content
Delivery
Method(s)/Venues
By When
(Frequency)
GMHelp select team members
& daily processes
This project will increase
the efficiency of the
production department
1-on-1 meetingSunday
Morning
PM
Inform of project findings,
create buy in and
ownership, participate in
roll out
Pilots results, training and
implementation planMorning briefing
Sunday
Morning
QC
Inform of project findings,
instill confidence in team
and process changes
They will learn some great
Lean Six Sigma Skills as a
result of joining the team
Join the GM
morning briefingWeekly
StorekeeperProvides an updated store
inventory list
He will have an active hand
and provide key input
Check with QC
ManagerWeekly
Communication Plan

EFFORT IMPACT
Results of Weighted Criteria Matrix
Project Title:
Leverage the Amount of Daily Meat Production
Notice where the project falls in the
Impact/Effort Matrix:
Low Effort and High Impact are
"Top Picks"
High Impact and High Effort are
projects to "Consider"
Low Effort and Low Impact
might be "Potential
Investments"
High Effort and Low Impact are
the "Least Likely" projects to
pursue
3,8 7,0
3,8
0,0
1,0
2,0
3,0
4,0
5,0
6,0
7,0
8,0
9,0
10,0
0,0 1,0 2,0 3,0 4,0 5,0 6,0 7,0 8,0 9,0 10,0
Imp
ac
t
Effort
Impact/Effort Matrix
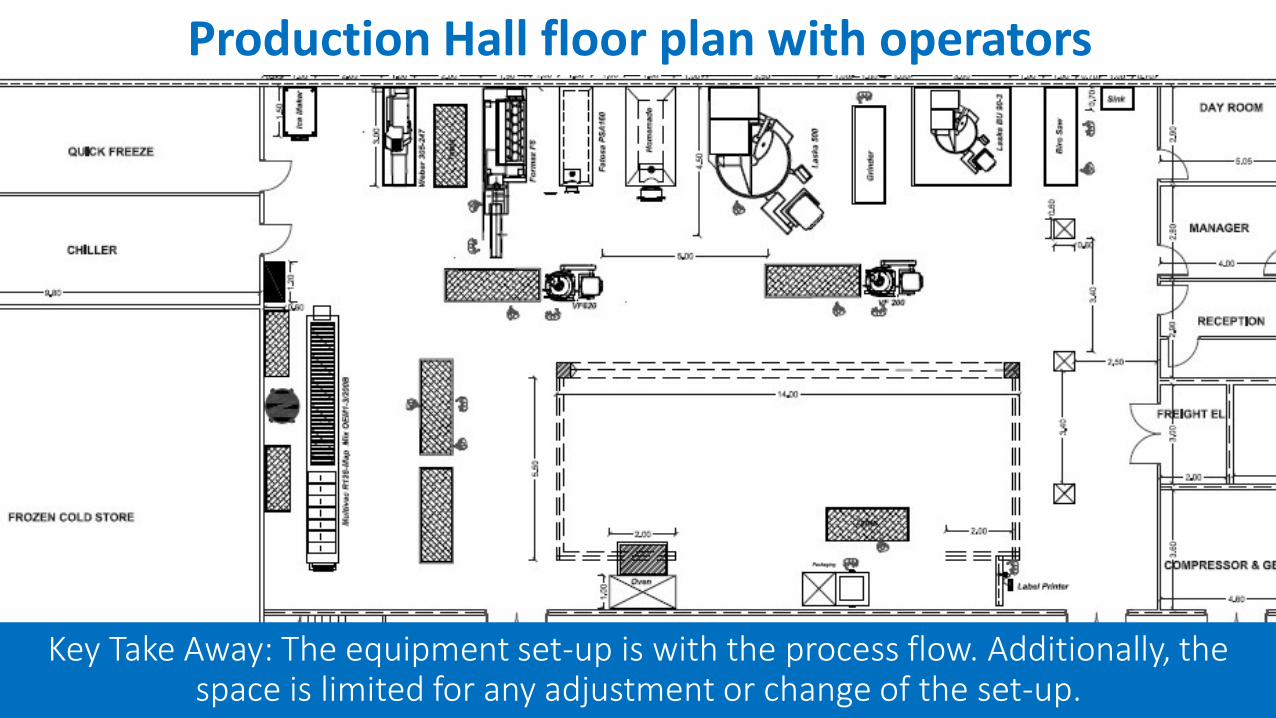
Production Hall floor plan with operators
Key Take Away: The equipment set-up is with the process flow. Additionally, the space is limited for any adjustment or change of the set-up.
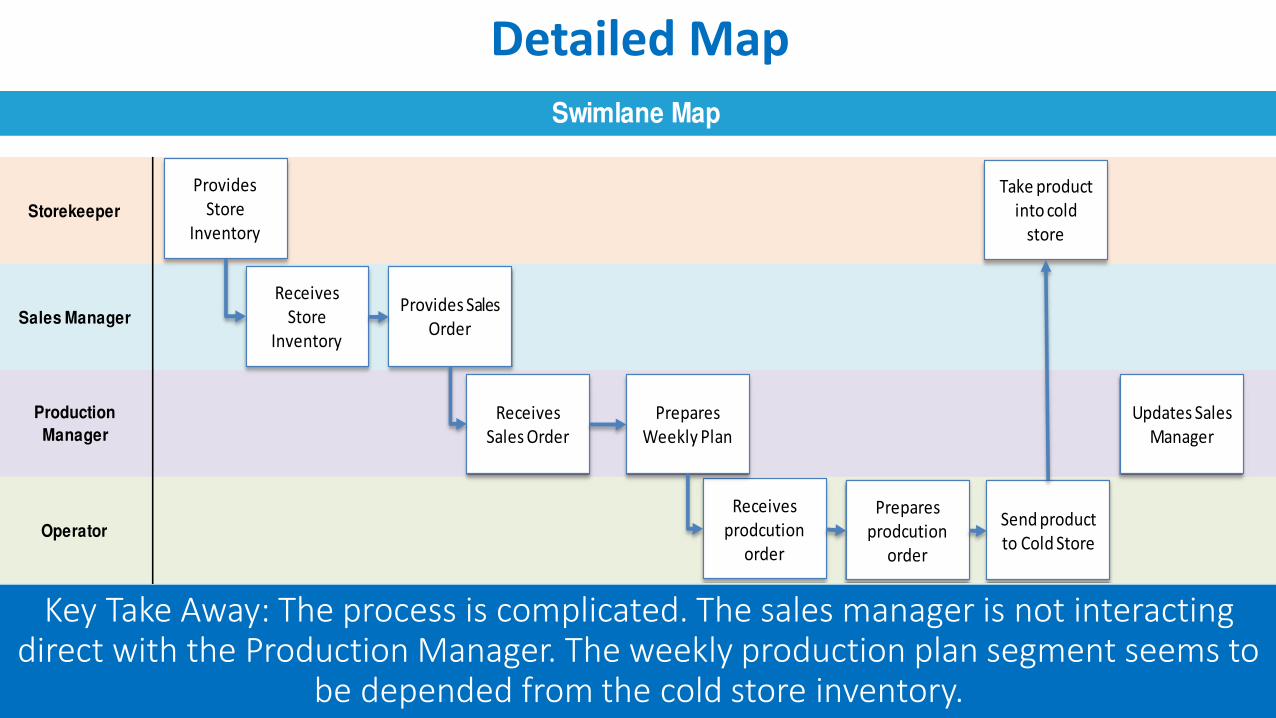
Key Take Away: The process is complicated. The sales manager is not interacting direct with the Production Manager. The weekly production plan segment seems to
be depended from the cold store inventory.
Storekeeper
Sales Manager
Production
Manager
Operator
Swimlane Map
Receives
prodcution
order
Prepares
prodcution
order
Send product
to Cold Store
Take product
into cold
store
Updates Sales
Manager
Prepares
Weekly Plan
Receives
Sales Order
Provides Sales
Order
Receives
Store
Inventory
Provides
Store
Inventory
Detailed Map

Work Space:
Process or Activity:
Process StepTime
Mins
Distance
Walked
Storekeeper receiving Order 5
Collecting items cold store 10 50
Operator picks up the order 5 25
1st step grinder 30
2nd step Laska 30 12
Collecting spices out of spice room 5 20
3rd step adding spices 5
4th step mincer 30 10
preparation packaging area 5
- balance
- packaging material
- man power
5th step packaging 75 20
6th step preparing for transport 30 10
MAWARID Production Area Alexander Paselk
Oct. 20th, 2016
Spaghetti Map
Workplace Layout
(add equipment and furniture)
Name:
Date:Minced Meat Production (Chilled)
Key Take Away: The production map shows that the equipment set-up is with the process flow and the walking distance is optimal between the process steps.
Project Specific Map

Key Take Away: The team will update the processes before adjusting the production. The GM and PM will
implement guidelines and protocols. Visual management will be available for the operators.
Implementation Plan
Action Item
(List steps required to implement solutions)
Responsible
(List person(s)
responsible for action
steps)
Due Date
(Indicate when
action items must be
completed)
Update cold store inventar list (add min. & max.) GM Jan 12
Coordinate monthly production plan with PM Sales Manager Jan 17
Design visual management for production area Quality Manager Jan 31
Train production manager in new planning process GM Jan 15
Monitor daily production process Quality Manager Jan 24
Increase production of baseline products GM, PM Feb 01
Minimize non value added production of products Production Manager Feb 01
Establish bi-weekly meetings in order to update the process GM, PM, SM, QC Jan 29
New Production Management Plan
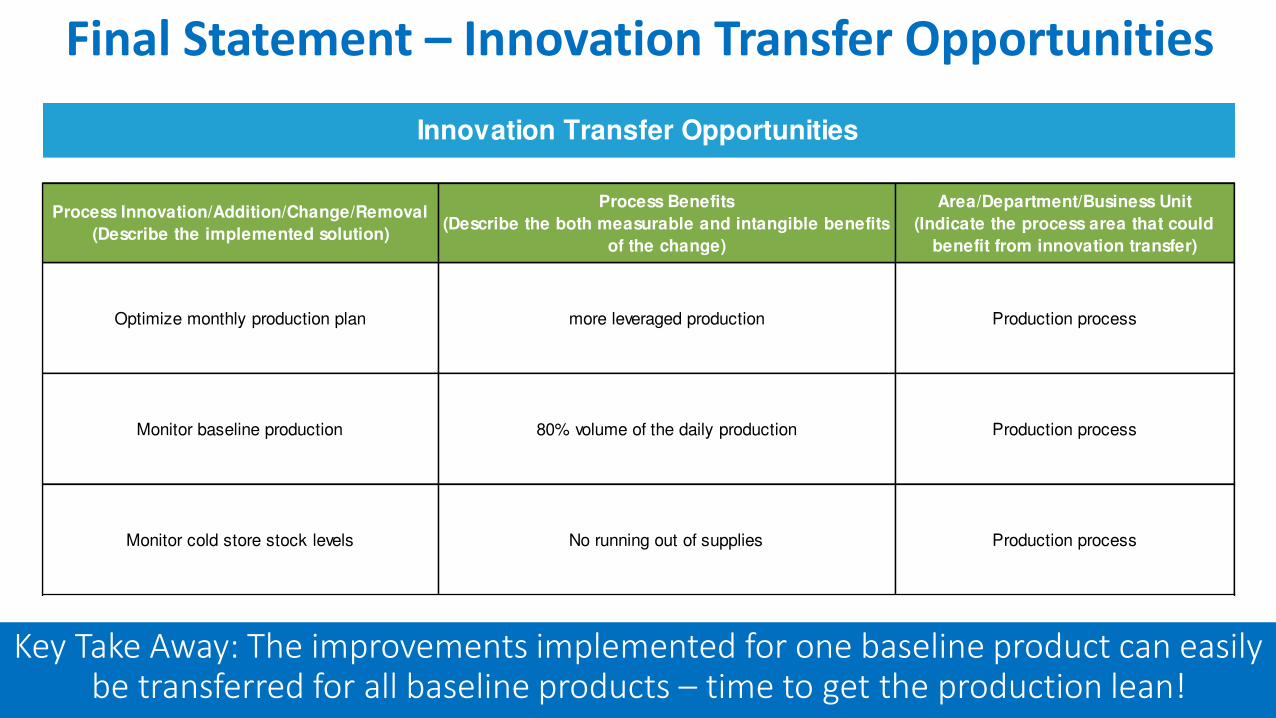
Key Take Away: The improvements implemented for one baseline product can easily be transferred for all baseline products – time to get the production lean!
Final Statement – Innovation Transfer Opportunities
Process Innovation/Addition/Change/Removal
(Describe the implemented solution)
Process Benefits
(Describe the both measurable and intangible benefits
of the change)
Area/Department/Business Unit
(Indicate the process area that could
benefit from innovation transfer)
Optimize monthly production plan more leveraged production Production process
Monitor baseline production 80% volume of the daily production Production process
Monitor cold store stock levels No running out of supplies Production process
Innovation Transfer Opportunities
Related Documents