1 Project Statement of Work for California Air Resources Board December 2, 2011 Data Collection, Testing and Analysis of Hybrid Electric Trucks and Buses Operating in California Fleets Principal Investigator National Renewable Energy Laboratory 1617 Cole Blvd. Golden, CO 80401 http://www.nrel.gov Contact: Kevin Walkowicz Phone: 303.275.4492 Fax: 303.275.2765 E-mail: [email protected]

Welcome message from author
This document is posted to help you gain knowledge. Please leave a comment to let me know what you think about it! Share it to your friends and learn new things together.
Transcript

1
Project Statement of Work for California Air Resources Board
December 2, 2011
Data Collection, Testing and Analysis of Hybrid Electric
Trucks and Buses Operating in California Fleets
Principal Investigator National Renewable Energy Laboratory
1617 Cole Blvd.
Golden, CO 80401
http://www.nrel.gov
Contact: Kevin Walkowicz
Phone: 303.275.4492
Fax: 303.275.2765
E-mail: [email protected]
2
Project Background and Objective
Medium and heavy duty commercial fleet vehicles are good candidates for deployment of
low emission and fuel efficient advanced technologies, specifically hybrid technology.
These vehicles are good candidates due to their large population; high vehicle miles
traveled (VMT) and fuel consumption; operation in urban areas; central fueling and
maintenance facilities; and consistent operation and routes.
Many commercial fleets in California are utilizing the California Hybrid Truck and Bus
Voucher Incentive Project (HVIP) to deploy vehicles. This is a program funded by the
California Air Resources Board (CARB), and according to the HVIP website, it is ‘a
program to help speed the early market introduction of clean, low-carbon hybrid trucks.
HVIP accomplishes this by addressing the biggest barrier for fleet purchase of medium-
and heavy-duty hybrids: the high incremental cost of these vehicles in the early market
years when production volumes are still low. HVIP provides a meaningful "kick-start" to
the low-emission hybrid truck and bus industry; it could help deploy up to 1200 vehicles,
potentially growing the nation's early market hybrid truck volumes by 50 percent.’
In addition to the HVIP vehicles planned or already funded, there are many other
vocations and/or applications in California that are ready for hybrid deployment but have
not yet applied for or received funding from HVIP but would be eligible.
Previous efforts to intelligently deploy or place vehicles into fleets, including testing and
analysis conducted by the National Renewable Energy Laboratory (NREL) and the U.S.
Department of Energy (DOE), have illustrated the relationship between duty cycle, fuel
economy, and emissions. This initial work has shown that knowledge of ‘real world’
vocational drive cycles and vehicle operation is key in selecting the right technology for
the given application. Gathering this data is critical in understanding the performance of
various technologies under different operating conditions. Without this fundamental data,
chassis dynamometer derived emissions and fuel economy results may not be
representative of real world performance, and vehicle and/or deployment models cannot
be optimized for real-world vocational conditions. NREL and the U.S. DOE have
initiated a project called ‘Fleet DNA’ to capture and characterize data from various
vocations for further vehicle design and strategic deployment.
It is the intention of this project to utilize this existing ‘Fleet DNA’ framework and data
set to supplement this ‘California specific’ study and effectively provide CARB, original
equipment manufacturers (OEM’s) producing hybrid vehicles and the various fleets that
are purchasing vehicles in California information on the effectiveness of the technology
in real world conditions. Specifically, the objectives of this project are to:
1) Obtain the necessary data for HVIP eligible vehicles (and their diesel equivalent)
on relevant vehicle usages/vocations in California.
2) Provide testing and analysis showing the performance of technology on the
measured usage/vocation.

3
3) Provide a framework, dataset and methodology to estimate fuel consumption and
emissions of current and future deployments of HVIP vehicles or other advanced
technology vehicles in California.
Project Summary
This project represents a new effort in outlined the collaborative agreement between
NREL and CARB.
The specific objective of this study is to better understand the utilization of medium- and
heavy-duty vehicles in California by estimating the real world benefits of the
implementation of advanced technology. This effort will allow CARB and other
California state agencies to strategically match advanced propulsion systems and duty
cycles to optimize for fuel economy, emissions reductions, and return on grant funding or
capital investment.
This project will utilize:
1. Chassis dynamometer based testing of vehicles over a focused set of duty cycles
which will yield more relevant data, aiding in estimation of vocational emissions
inventories and fuel consumption metrics.
2. A methodology developed which will output simulated fuel economy values
based on specific vocational duty cycles. This will provide additional estimation
capabilities for future deployments.
3. Data collection activities to further define a database to capture known and
specific characteristics of vocational duty cycles that will allow for improved
assessment of power train trade offs (e.g. energy storage capacity, component
sizing).
This project will provide CARB data to:
Characterize the relative emissions contribution of various medium- and heavy-
duty vocations operating in California.
Develop a methodology to create a ‘strategic roadmap’ for the initiation of
research, development, demonstration and deployment programs which will
deploy the highest impact low emissions vehicle technology within the most
appropriate fleet vocations and duty cycles or routes.
Strategically achieve the largest criteria and GHG emissions reductions when
utilizing deployment funding.
More accurately forecast vocational emissions inventories in California.
Anticipated project partners/collaborations:
University of California (UC) Riverside Center for Environmental Research and
Technology (CE-CERT): heavy-duty chassis dynamometer and testing activities.

4
CALSTART: Coordination and collaboration with Hybrid Truck Users Forum
(HTUF) fleets.
DOE’s Clean Cities ‘National Clean Fleet Partners’ Program: Coordination and
collaboration with partner fleets.
Task Descriptions
1. Coordination and Implementation of Fleet Partner Agreements
NREL shall coordinate third party fleet activities and contributions to the overall project
for the benefit of the project. Likely contributors are to be determined (TBD) dominant
CA fleets within the study vocations that have implemented or are interested in
implementing advanced technology in their fleet. A preliminary analysis to determine
vocations that could potentially displace the most petroleum or maximize emissions
reductions will be completed prior to selection. Targeted fleets will also be fleets that
have participated in both the HVIP program as well as the DOE National Clean Fleet
Partners Program. Key vocations targeted are:
Class 4-6 package delivery fleets
Class 4-6 service vans
Class 7-8 tractor/trailer beverage delivery fleets
Class 7-8 intercity tractor/trailer fleets
School bus fleets
Class 8 refuse vehicle fleets
Class 8 transit bus fleets
Class 6-7 intercity box truck fleets
Class 8 intercity delivery tractor/trailer
Class 6-7 shuttle bus fleets
Class 3 delivery vans
It is anticipated that a minimum of 4 of the above targeted vocations will be selected and
available for data collection efforts. In coordination, CARB and NREL will prioritize the
above vocations. CARB will have final decision in vocation selections.
Key Outcome/Deliverable: Enlist and document the support of third party project
partners to establish the necessary data collection plans for drive cycle data. Project
partners and selected fleet selection will be based on vocational census statistics (vehicle
miles traveled, or VMT, and number of vehicles in operation in CA).
2. Drive Cycle Data Collection
Utilizing existing data collection hardware supplied from NREL, data will be collected
from the above selected vocations at TBD fleet locations. Prior to start of work, NREL
will provide ARB with a work plan describing the target fleets, number and types of
vehicles, vehicle locations, and description of equipment to be used. Priority will be

5
given to data collection on model year 2010 or newer engines. Specific data set collected
on each vehicle will include the following metrics:
Vehicle speed (1hz)
Engine speed (1hz)
Average cargo load
Road grade / elevation (1hz)
Aftertreatment exhaust temperatures (optional based on availability of proprietary
data)
Weather data
SAE J1939 broadcast data listed in ‘Appendix A’.
For hybrid vehicles, current measurement in/out of the battery pack or other
energy storage device. If proprietary data is unavailable, then a clamp-on probe
will be used to instrument a percentage of vehicles to be determined by CARB
and NREL.
Vehicle description- including, at a minimum, laden and unladen gross vehicle
weight, engine make, engine model year, engine displacement, engine horsepower
rating, transmission type and number of forward speeds, tire size, rear axle ratio.
Hybrid system description- including, at a minimum, manufacturer, model year,
model, motor, motor controller, transmission, energy storage information, and
system voltage.
It is anticipated that instrumentation of the vehicles will be non-intrusive and will last for
duration of approximately 3 weeks per vehicle. A statistically significant number of
vehicles from various locations will be chosen to be instrumented and recorded. It is
anticipated that no less than 30 individual vehicles from 3 separate locations/depots will
be selected from each vocation. The priority will be to get the most set of vehicles within
the selected vocations. To achieve this, NREL will attempt to obtain vehicles from
multiple fleets within each vocation, but at a minimum one fleet and three locations per
vocation. This will result in approximately 450 days of operation from a breadth of
operations which will be used to characterize each vocation. If a wide range of
operational metrics are observed, it may be determined to instrument additional vehicles
to provide better statistical confidence. After instrumentation of the first 3-5 vehicles,
NREL will provide ARB the requested detailed data for review prior to continuing data
collection. ARB will provide any comments back to NREL within one week to ensure
that the project timeline is not affected.
Key Outcome: Large dataset of vocationally based drive cycles (speed, load and grade)
and engine information will be collected at a minimum of 1hz. Approximately 450
days/shifts of operation (approximately 8 hrs each) will be collected and stored for future
use. Detailed second- by-second (1 Hz) data in engineering units will be provided to
ARB in a mutually agreed upon format. For any proprietary data collected by NREL, the
appropriate authorizations must be given by the original equipment manufacturer prior to
distribution to CARB. Data may be processed to protect the anonymity of the
participating fleets. This data will include the following metrics:
Engine speed

6
Actual engine- percent torque
Nominal friction- percent torque
Actual maximum available engine- percent torque
Reference torque
Hybrid battery system current measurement
Wheel-based vehicle speed
Engine intake manifold #1 pressure
Engine intake manifold #1 temperature
Engine coolant temperature
Engine exhaust gas temperature
Engine oil temperature 1
Engine fuel rate
DPF status
DPF regeneration
SCR status
3. Fleet Drive Cycle Analysis and Characterization
Utilizing the data collected in Task 2 (above), NREL will use existing in-house software
and data analysis capabilities to analyze the ‘real world’ drive characteristics and vehicle
operation data to produce statistically significant vehicle performance metrics and
representative drive cycles. These metrics to be generated for each set of vocational data
are listed in Appendix ‘B’. From these metrics, and using existing tools, NREL will
select several (4) representative drive cycles (already existing), or develop a custom duty
cycle(s) for use in Tasks 4 and 5 based on the data collected. It is anticipated that the
drive cycles selected will ‘bracket’ the range or operation expected from each vocation
and enable testing to explore the range of performance of the new technology. NREL’s
Drive-cycle Rapid Investigation, Visualization and Evaluation Tool (DRIVE) will be
utilized for this exercise. The DRIVE Tool will be updated to include the non-power take
off drive cycle for hybrid powertrains defined in the US Environmental Protection
Agency and National Highway Traffic and Safety Administration Final Rulemaking to
Establish Greenhouse Gas Emission Standards and Fuel Efficiency Standards for
Medium- and Heavy-Duty Engines and Vehicles found in 76 FR 57247 prior to this
analysis. An example of some of the metrics and datasets to be created from this task is
shown in Appendix ‘B’.
Key Outcome: Analysis of drive cycle data from a representative subset of vehicles.
Identify 4 vocationally relevant duty cycles for testing and analysis in Tasks 4 and 5.
4. Chassis Dynamometer Emissions and Fuel Economy Measurement
NREL will coordinate the procurement, transportation and testing of one vehicle from
each vocational set and one conventional vehicle to which it is being compared to. It is
assumed that all vehicles can be obtained from a local fleet. Prior to start of work,
NREL will provide ARB with a test plan describing, at a minimum, the vehicles to be
tested, drive cycles, analytes, instrumentation, and quality assurance/quality control

7
procedures. NREL will consult with ARB on selection of drive cycles prior to starting
chassis testing. All chassis dynamometer testing will be completed on vehicles with
model year 2010 or newer engines using SAE J2711 test procedures. Priority will be
given for vehicles equipped with similar engines. Vehicles will be transported to the UC
Riverside’s CE-CERT laboratory in Riverside, CA for chassis dynamometer testing or
NREL’s ReFUEL laboratory in Golden, CO.
Each vehicle will be tested over 4 duty cycles identified in Task 3, and fuel economy,
gaseous emissions (including NO, NO2, CO, CO2, HC, CH4, and N2O) and particulate
matter (PM) by gravimetric filter analysis, per the CFR Part 1065. Gaseous emissions
will be measured in real time as well as bag analysis. If possible, PM mass will be
measured gravimetrically as well as size-segregated particle concentrations by electric
mobility size distribution. Ammonia will be measured if the selected laboratory has the
capability readily available. Exhaust temperature will be measured with the temperature
monitors placed at a distance of no greater than 6” ahead of the first catalytic
aftertreatment and not more than 6” after the last aftertreatment device. In addition,
current measurement in/out of the battery pack will be measured on the hybrid vehicles.
CARB ultra-low sulfur diesel will be used during testing.
Key Outcome: Measured fuel economy and emissions from each vehicle over four drive
cycles which will characterize the possible performance of the advanced technology as
compared to a conventional vehicle. Detailed second- by-second (1 Hz) data in
engineering units will be provided to ARB in a mutually agreed upon format. Data may
be processed to protect the anonymity of the participating fleets. This data will include
the metrics identified in Task 2 as well as the gaseous and particulate emissions identified
in this Task.
5. Portable Emissions and Fuel Economy Measurements
In order to supplement laboratory test results, NREL will coordinate actual on-road
testing under real-world driving and environmental conditions of one hybrid vehicle and
one conventional vehicle from the highest priority vocational sets. Utilizing NREL’s
SEMTECH DS unit and data collected from fleets in Task 2, approximately 3 days of
‘simulated’ on-road operation will be tested on each vehicle. The results will be
compared to the results obtained in the laboratory to ensure full improvements of the
hybrid systems are being represented by the laboratory testing.
Prior to start of work, NREL will provide ARB with a test plan describing, at a
minimum, the vehicles to be tested, drive cycles, analysis, instrumentation, and quality
assurance/quality control procedures. All testing will be completed on vehicles with
model year 2010 or newer engines. Vehicle testing will occur on similar routes as what
was measured in Task 2 but will be conducted with NREL or contracted drivers to
accurately represent an entire days worth of operation. Gaseous emissions only will be
collected. Exhaust temperatures, hybrid system data will be recorded as available from
OEM’s.

8
Key Outcome: Measured fuel economy and emissions from each vehicle type on a
typical day of operation which will confirm if laboratory drive cycles were accurate
in predicting the performance of the vehicles in operation as well as predicting the
performance improvements of the hybrids compared to the diesel equivalents.
Detailed second-by-second (1hz) data will be provided to ARB in a mutually agreed
upon format. Data may be processed to protect the anonymity of the participating
fleets.
6. Vocational Analysis & Methodology Development
NREL will apply measured fuel usage and emissions data (Task 4) to vocational census
data (Task 1) to develop weighted vocational emissions and fuel consumption inventory
estimates for current HVIP and other major deployments of medium and heavy duty
hybrid electric vehicles in CA.
A Methodology will be developed and validated using the initial results gathered here
which will enable future projections to be made of additional technology, vocations and
fleet characteristics.
Key Outcomes: Estimate vocational emissions based on sampled test results, observed
driving patterns and VMT reported. NREL data analysis will provide CARB with the
ability to further evaluate impact of strategically deployed low emissions technologies.
1. NREL will estimate the emissions and fuel consumption reduction potential of
low emissions technologies deployed on appropriate routes (drive cycles).
2. NREL will develop vocational correlations between duty cycle kinetic intensity,
fuel economy, daily VMT, and criteria emissions.
3. NREL will develop a methodology for future analysis of technology options
versus variable vocations and drive cycles.
7. Reporting
NREL will prepare and submit monthly progress reports in tandem with monthly
invoices. In addition, NREL will assemble and submit a Final Project Report at the
conclusion of the project which will include a final assembly of data and methodology.
All data must be submitted in a manner that clearly and logically identifies, labels, and
organizes data files. In addition, the methodology must document what was done to the
data files as well as include a ‘data dictionary’. NREL and any subcontractors must make
all attempts for data files to be compatible.

9
Project Schedule:
Month 1 2 3 4 5 6 7 8 9 10 11 12
Task 1
Task 2
Task 3
Task 4
Task 5
Task 6
Task 7 (Reporting)

10
Estimated Cost by Task:
Task Labor Subcont, Consult
Equip Travel, Subsist
EDP Copy/
Mail Phone
Fax
Matr and
Supplies
Analys Misc.
Employee Fringe
Benefits
Overhead Fee or Profit
Total
1 $ 20,555 $ 6,000 $ 6,865 $ 36,471 $ 1,763 $ 71,654
2 $ 14,476 $10,000 $ 4,835 $ 28,872 $ 1,468 $ 59,651
3 $ 33,500 $ 11,189 $ 54,045 $ 2,490 $ 101,224
4 $ 29,163 $179,309 $3,000 $5,000 $ 9,740 $ 64,006 $ 7,320 $297,538
5 $ 29,163 $8,000 $1,000 $ 9,740 $ 52,016 $ 2,520 $ 102,439
6 $ 3,924 $ 1,311 $ 6,329 $ 292 $ 11,856
7 $ 16,820 $3,000 $ 5,618 $ 28,791 $ 1,368 $ 55,597
$147,601 $179,309 $30,000 $ 6,000 $49,298 $270,530 $17,221
Grand Total:
$ 699,959

11
Appendix A- J1939 broadcast data points
Name Type Acronym PGN pos
SPN length SPN
Engine Intercooler Temperature CAN Input ET1 65262 7
8 52
Wheel-Based Vehicle Speed CAN Output CCVS 65265 2
16 84
Accelerator Pedal Position 1 CAN Input EEC2 61443 2
8 91
Engine Percent Load At Current Speed CAN Input EEC2 61443 3
8 92
Engine Fuel Delivery Pressure CAN Input EFL/P1 65263 1
8 94
Engine Oil Pressure CAN Input EFL/P1 65263 4
8 100
Engine Intake Manifold #1 Pressure CAN Input IC1 65270 2
8 102
Engine Intake Manifold 1 Temperature CAN Input IC1 65270 3
8 105
Engine Air Intake Pressure CAN Input IC1 65270 4
8 106
Barometric Pressure CAN Input AMB 65269 1
8 108
Engine Coolant Temperature CAN Input ET1 65262 1
8 110
Net Battery Current CAN Input VEP1 65271 1
8 114
Engine Intake Air Mass Flow Rate CAN Input EGF1 61450 3
16 132
Transmission Input Shaft Speed CAN Input ETC1 61442 6
16 161
Battery Potential / Power Input 1 CAN Input VEP1 65271 5
16 168
Ambient Air Temperature CAN Input AMB 65269 4
16 171
Engine Air Intake Temperature CAN Input AMB 65269 6
8 172
Engine Exhaust Gas Temperature CAN Input IC1 65270 6
16 173
Engine Fuel Temperature 1 CAN Input ET1 65262 2
8 174
Engine Oil Temperature 1 CAN Input ET1 65262 3
16 175
Engine Fuel Rate CAN Input LFE 65266 1
16 183
Engine Speed CAN Input EEC1 61444 4
16 190
Transmission Output Shaft Speed CAN Input ETC1 61442 2
16 191
Driver's Demand Engine - Percent Torque CAN Input EEC1 61444 2
8 512
Actual Engine - Percent Torque CAN Input EEC1 61444 3
8 513
Nominal Friction - Percent Torque CAN Input EEC3 65247 1
8 514
Transmission Current Gear CAN Input ETC2 61445 4
8 523
Transmission Selected Gear CAN Input ETC2 61445 1
8 524
Brake Switch CAN Output CCVS 65265 4
2 597
Red Stop Lamp (engine) CAN Input
DM01-eng 65226 1
2 623
Amber Warning Lamp (engine) CAN Input
DM01-eng 65226 1
2 624
Engine Exhaust Gas Recirculation 1 (EGR1) Mass Flow Rate CAN Input EGF1 61450 1
16 2659
Aftertreatment 1 Diesel Particulate Filter Outlet Gas Temperature CAN Input AT1OG2 64947 3
16 3246
Actual Maximum Available Engine - Percent Torque CAN Input EEC2 61443 7
8 3357
Diesel Particulate Filter Lamp Command CAN Input DPFC1 64892 1
3 3697
Exhaust System High Temperature Lamp Command CAN Input DPFC1 64892 7
3 3698

12
Diesel Particulate Filter Passive Regeneration Status CAN Input DPFC1 64892 2
2 3699
Diesel Particulate Filter Active Regeneration Status CAN Input DPFC1 64892 2
2 3700
Diesel Particulate Filter Status CAN Input DPFC1 64892 2
3 3701
Diesel Particulate Filter Active Regeneration Forced Status CAN Input DPFC1 64892 7
3 4175
All SCR monitoring data points
Referenced Torque

13
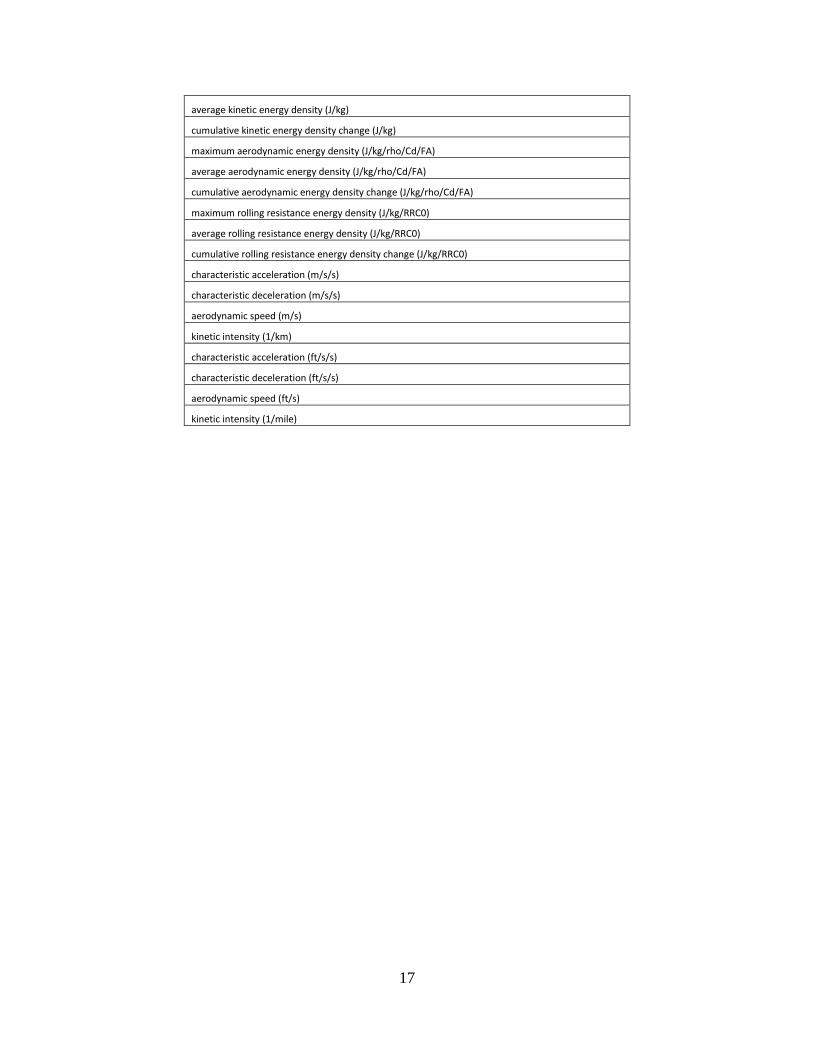
Appendix B – metrics obtained from drive cycle set
absolute time duration (hrs)
speed data time duration (hrs)
non-recorded time (hrs)
data vs. absolute time ratio
maximum driving speed (mph)
total average speed over cycle (mph)
average driving speed (speed > 0, mph)
variance of speed (mph)
standard deviation of speed (mph)
zero speed time (s)
0+ - 5 mph time (s)
5+ - 10 mph time (s)
10+ - 15 mph time (s)
15+ - 20 mph time (s)
20+ - 25 mph time (s)
25+ - 30 mph time (s)
30+ - 35 mph time (s)
35+ - 40 mph time (s)
40+ - 45 mph time (s)
45+ - 50 mph time (s)
50+ - 55 mph time (s)
55+ - 60 mph time (s)
60+ - 65 mph time (s)
65+ - 70 mph time (s)
70+ - 75 mph time (s)
75+ mph time (s)
zero speed time (%)
0+ - 5 mph time (%)
5+ - 10 mph time (%)
10+ - 15 mph time (%)
15+ - 20 mph time (%)
20+ - 25 mph time (%)
25+ - 30 mph time (%)
30+ - 35 mph time (%)
35+ - 40 mph time (%)
40+ - 45 mph time (%)
45+ - 50 mph time (%)

14
50+ - 55 mph time (%)
55+ - 60 mph time (%)
60+ - 65 mph time (%)
65+ - 70 mph time (%)
70+ - 75 mph time (%)
75+ mph time (%)
total percentage
0+ - 5 mph distance traveled (miles)
5+ - 10 mph distance traveled (miles)
10+ - 15 mph distance traveled (miles)
15+ - 20 mph distance traveled (miles)
20+ - 25 mph distance traveled (miles)
25+ - 30 mph distance traveled (miles)
30+ - 35 mph distance traveled (miles)
35+ - 40 mph distance traveled (miles)
40+ - 45 mph distance traveled (miles)
45+ - 50 mph distance traveled (miles)
50+ - 55 mph distance traveled (miles)
55+ - 60 mph distance traveled (miles)
60+ - 65 mph distance traveled (miles)
65+ - 70 mph distance traveled (miles)
70+ - 75 mph distance traveled (miles)
75+ mph distance traveled (miles)
total distance traveled (miles)
0+ - 5 mph distance (%)
5+ - 10 mph distance (%)
10+ - 15 mph distance (%)
15+ - 20 mph distance (%)
20+ - 25 mph distance (%)
25+ - 30 mph distance (%)
30+ - 35 mph distance (%)
35+ - 40 mph distance (%)
40+ - 45 mph distance (%)
45+ - 50 mph distance (%)
50+ - 55 mph distance (%)
55+ - 60 mph distance (%)
60+ - 65 mph distance (%)
65+ - 70 mph distance (%)
70+ - 75 mph distance (%)
75+ mph distance (%)
total distance traveled (%)

15
maximum acceleration (ft/s/s)
maximum deceleration (ft/s/s)
average acceleration (ft/s/s)
average deceleration (ft/s/s)
time spent accelerating (s)
time spent decelerating (s)
percent of time spent accelerating (%)
percent of time spent decelerating (%)
total number of acceleration events
total number of deceleration events
number of acceleration events per mile
number of deceleration events per mile
average time duration per acceleration event
average time duration per deceleration event
total number of stops
number of stops 0+ - 30 seconds
number of stops 30+ - 60 seconds
number of stops 60+ seconds
number of stops per mile
number of stops 0+ - 30 seconds per mile
number of stops 30+ - 60 seconds per mile
number of stops 60+ seconds per mile
average stop duration (s)
maximum stop duration (s)
minimum stop duration (s)
variance of stops (s)
standard deviation of stops (s)
total elevation gained (ft)
total elevation lost (ft)
maximum elevation (ft)
minimum elevation (ft)
average absolute elevation rate of change (ft/s)
maximum climbing rate (ft/s)
average climbing rate (ft/s)
maximum descending rate (ft/s)
average descending rate (ft/s)
difference in start and end elevation (ft)
cumulative elevation change over cycle (ft)
maximum kinetic power density demand (W/kg)
total kinetic power demand (W/kg)
average kinetic power demand (W/kg)

16
variance of kinetic power demand (W/kg)
standard deviation of kinetic power demanded (W/kg)
maximum kinetic power density regen (W/kg)
total kinetic power regen (W/kg)
average kinetic power regen (W/kg)
variance of kinetic power regen (W/kg)
standard deviation of kinetic power regen (W/kg)
maximum potential power density demand (W/kg)
total potential power demand (W/kg)
average potential power demand (W/kg)
variance of potential power demand (W/kg)
standard deviation of potential power demanded (W/kg)
maximum potential power_density regen (W/kg)
total potential power regen (W/kg)
average potential power regen (W/kg)
variance of potential power regen (W/kg)
standard deviation of potential power regen (W/kg)
maximum aerodynamic power density demand (W/rho/CD/FA)
total aerodynamic power demand (W/rho/CD/FA)
average aerodynamic power demand (W/rho/CD/FA)
variance of aerodynamic power demand (W/rho/CD/FA)
standard deviation of aerodynamic power demanded (W/rho/CD/FA)
maximum aerodynamic power density regen (W/rho/CD/FA)
total aerodynamic power regen (W/rho/CD/FA)
average aerodynamic power regen (W/rho/CD/FA)
variance of aerodynamic power regen (W/rho/CD/FA)
standard deviation of aerodynamic power regen (W/rho/CD/FA)
maximum rolling power density demand (W/kg/RRC0)
total rolling power demand (W/kg/RRC0)
average rolling power demand (W/kg/RRC0)
variance of rolling power demand (W/kg/RRC0)
standard deviation of rolling power demanded (W/kg/RRC0)
maximum rolling power density regen (W/kg/RRC0)
total rolling power regen (W/kg/RRC0)
average rolling power regen (W/kg/RRC0)
variance of rolling power regen (W/kg/RRC0)
standard deviation of rolling power regen (W/kg/RRC0)
maximum potential energy density (J/kg)
average potential energy density (J/kg)
cumulative potential energy density change (J/kg)
maximum kinetic energy density (J/kg)
17
average kinetic energy density (J/kg)
cumulative kinetic energy density change (J/kg)
maximum aerodynamic energy density (J/kg/rho/Cd/FA)
average aerodynamic energy density (J/kg/rho/Cd/FA)
cumulative aerodynamic energy density change (J/kg/rho/Cd/FA)
maximum rolling resistance energy density (J/kg/RRC0)
average rolling resistance energy density (J/kg/RRC0)
cumulative rolling resistance energy density change (J/kg/RRC0)
characteristic acceleration (m/s/s)
characteristic deceleration (m/s/s)
aerodynamic speed (m/s)
kinetic intensity (1/km)
characteristic acceleration (ft/s/s)
characteristic deceleration (ft/s/s)
aerodynamic speed (ft/s)
kinetic intensity (1/mile)

18
Appendix B
Example of Dataset metrics by vocation
y = 2182.6x-2.324
R² = 0.7533
0
1
2
3
4
5
6
0 10 20 30 40 50 60
KI
(1/
mil
e)
Average Driving Speed (mph)
School Bus Data Average Driving Speed vs. Kinetic Intensity
Lake Washington Adams County Schenectedy Power (Aggregate Data)
Related Documents