Project report on CCOP-GSJ/AIST-MONRE Groundwater Project Phase II Meeting 26-28 February 2013, Hanoi, Vietnam COORDINATING COMMITTEE FOR GEOSCIENCE PROGRAMMES IN EAST AND SOUTHEAST ASIA (CCOP) In cooperation with GEOLOGICAL SURVEY OF JAPAN (GSJ), AIST Published by CCOP Technical Secretariat Bangkok, Thailand Youhei Uchida (Chief Editor) GW-3

Welcome message from author
This document is posted to help you gain knowledge. Please leave a comment to let me know what you think about it! Share it to your friends and learn new things together.
Transcript
Project report on
CCOP-GSJ/AIST-MONRE Groundwater Project Phase II Meeting
26-28 February 2013, Hanoi, Vietnam
COORDINATING COMMITTEE FOR GEOSCIENCE PROGRAMMES
IN EAST AND SOUTHEAST ASIA (CCOP)
In cooperation with
GEOLOGICAL SURVEY OF JAPAN (GSJ), AIST
Published by
CCOP Technical Secretariat
Bangkok, Thailand
Youhei Uchida (Chief Editor)
GW-3

EDITORIAL BOARD
Chief Editor:
Youhei UCHIDA
Associate Editors:
Yusaku TAGUCHI
Kyoko NAKAYAMA
Geological Survey of Japan, AIST,
Tsukuba, Ibaraki, 305-8567 JAPAN
Authors (CCOP-GSJ/AIST Groundwater Project)
Mr. ChoupSokuntheara
Dr. Li Tiefeng
Mr. HaryadiTirtimihardjo
Dr. Youhei Uchida
Dr. Kyoochul Ha
Mr. QalamA’Zad Role
Mr. Win Myint
Mr. Simon Egara
Mr. Lutgardo S. Larano
Mr. AdisaiCharuratna
Mr. Francisco Xavier Pereira Sico
Dr. Nguyen Thi Ha
PREFACE
Since the establishment of the CCOP in 1966, geological and geophysical surveys
have been carried out by the CCOP under the cooperative schemes in the East and Southeast
Asia for offshore natural resources. These data have been distributedto member countries as
printed maps and publications.As for the first groundwater project, “Groundwater database in
East and Southeast Asia”had been compiled under the DCGM Phase IV project of CCOP from
2001 to 2004.
Groundwater is one of the limited natural resources of the world. Because of the lack a
feeling of importance of groundwater, especially, in the late 20th century, groundwater has been
significantly damaged by human activities, resulting in groundwater issues, such as land
subsidence, seawater intrusion, and groundwater pollution by toxic substances, that have
become remarkable problems in everywhere in the world. The countries in the East and
Southeast Asia have been also faced the many groundwater problems which are needed
international cooperation to be solved.
The GW meeting has country reports of each member country and edit for CCOP
Project Report. Title of the first country report was “Introduction of groundwater issues in each
country”, and the second was “Ground water Pollution and Risk Management”.The third
meeting of Phase II for the CCOP-GSJ/AIST-CWRP Groundwater project was held on 26-28
February 2013, Hanoi, Vietnam.Title of country report on the 3rd GW meeting had been set in
each member country and we had deep discussion and confirmed that these reports showed
individualproblems of pollution and method of risk management for groundwater in each
country. I believe that CCOP member countries will be able to have some solutions about
groundwater management from the country reports.
I am very grateful to the authors for their invaluable contributions and to the
organizations to which the authors belong for their permission to publish those important reports.
I am indebted to Dr. Yusaku Taguchi, Ms. Kyoko Nakayama, Dr. Nguyen Thi Minh Ngoc,
andCCOP Technical Secretariat for constructive suggestions and editing.
Youhei UCHIDA
Chief Editor

CONTENTS
Country Report
1. Land Subsidence in Angkor Wat Area 1
2. Investigation and Monitoring of Land Subsidence in Yangtze River Delta Area of China 14
3. Saltwater Intrusion Issues for Groundwater in the Jakarta Plain 22
4. Hydro-Environmental Groundwater Survey in the Kanto Plain, Japan 35
5. Groundwater Temperature Survey in Korea 40
6. Land Collapse Issues in and around Kuala Lumpur 51
7. Groundwater Resources Development in Myanmar 70
8. Groundwater in Papua New Guinea 84
9. Water Resource Assessment for Prioritized Areas 95
10. Application of Isotope Hydrology for Solving Nitrate Contamination in Groundwater
in Northeastern Part of Thailand 123
11.Groundwater Resources in Timor-Leste 133
12.Groundwater Resources in Red River Delta 142

Land Subsidence in Angkor Wat Area
Choup Sokuntheara Deputy Director of Department of Geology, GDMR
Ministry of Industry Mines and Energy 1. Geological Setting
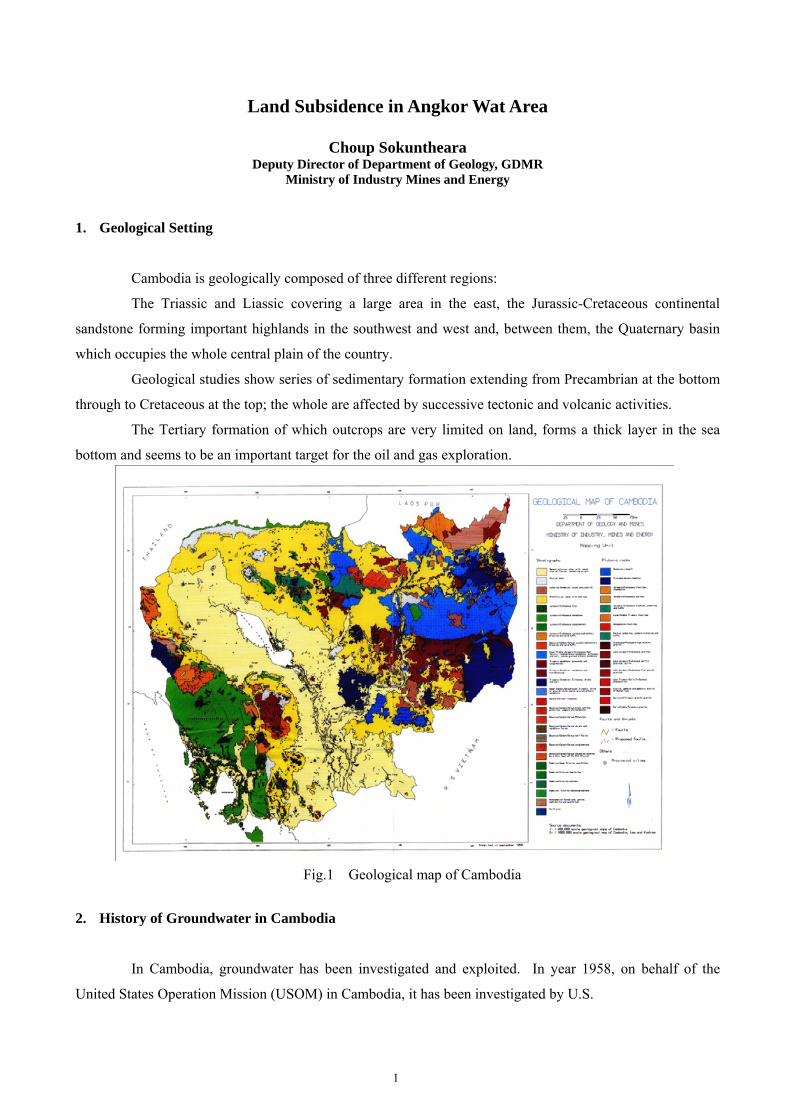
Cambodia is geologically composed of three different regions:
The Triassic and Liassic covering a large area in the east, the Jurassic-Cretaceous continental
sandstone forming important highlands in the southwest and west and, between them, the Quaternary basin
which occupies the whole central plain of the country.
Geological studies show series of sedimentary formation extending from Precambrian at the bottom
through to Cretaceous at the top; the whole are affected by successive tectonic and volcanic activities.
The Tertiary formation of which outcrops are very limited on land, forms a thick layer in the sea
bottom and seems to be an important target for the oil and gas exploration.
Fig.1 Geological map of Cambodia
2. History of Groundwater in Cambodia
In Cambodia, groundwater has been investigated and exploited. In year 1958, on behalf of the
United States Operation Mission (USOM) in Cambodia, it has been investigated by U.S.
1
Geological Survey (USGS), R.V. Cushman. The main purpose could be for agriculture economic
for irrigation was available during dry season from December to May. The result of this program had been
collected for all the data needed and carried out for the groundwater used in the future. During 1960-63,
1,103 holes were drilled of which 795 of approximately 72 percent productive wells at rates were ranging
from 1.1 to 2,967 l/min. The productive wells ranged in depth from 2 to 209.4 m and were 23.2 m deep on the
average.
Mr. Rasmussen studied the subsurface geology of Cambodia in considerable detail by examining
drillings logs and constructing nine geologic cross sections.
The principal aquifer tapped by drilled wells in Cambodia is the old Alluvium. In many places,
however, dug wells and a few shallow drilled wells obtain water from the young Alluvium. Sandstone of the
Jurassic - Cretaceuos formation yields is moderate to small quantities of water to wells in a number of places.
Also, numbers of wells tapping water bearing basalt have a small to moderate yield.
The quality of water is recorded in only a few analyses. The dissolved-solids concentrations appear
to be generally low so that the water is usable for most purposes without treatment. Some well waters are
high in iron and would have to be filtered before use. From May 2009 to August 2011, MIME and SRWSA
and JICA, had undertaken a preparatory study on the Siem Reap Water Supply Expansion Project.
3. The Study Area
3.1 Location of the Study Area in Siem Reap City
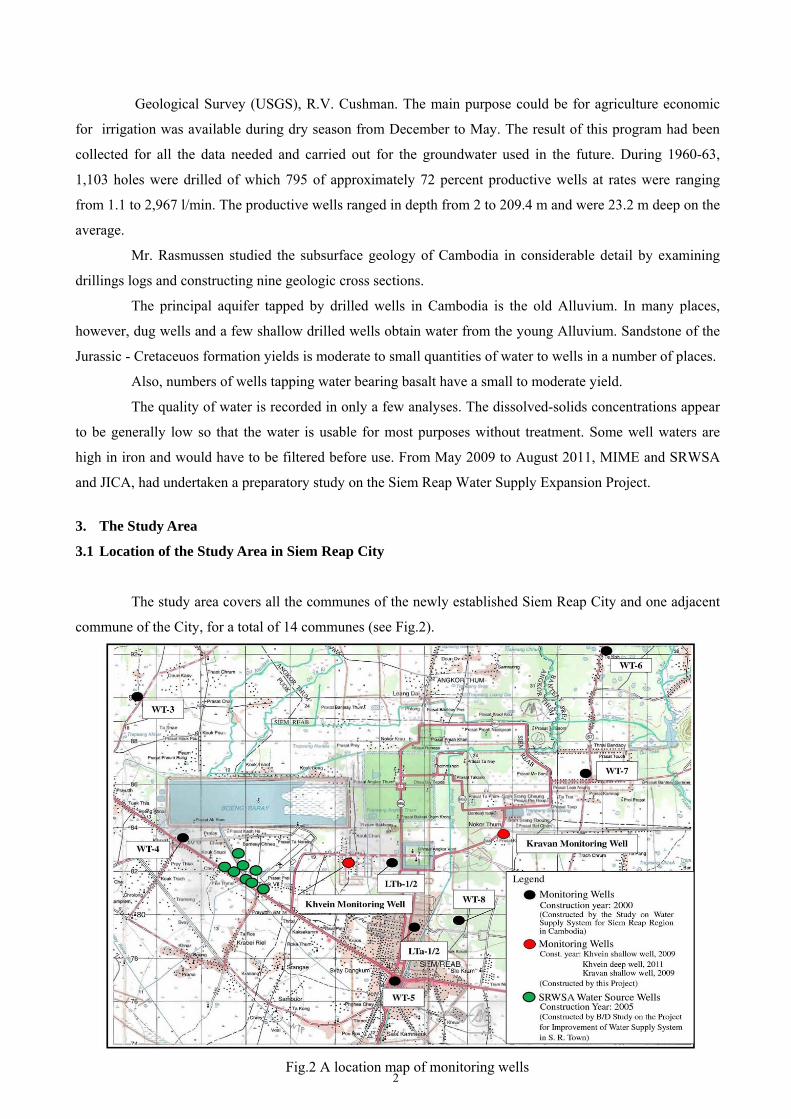
The study area covers all the communes of the newly established Siem Reap City and one adjacent
commune of the City, for a total of 14 communes (see Fig.2).
Fig.2 A location map of monitoring wells 2
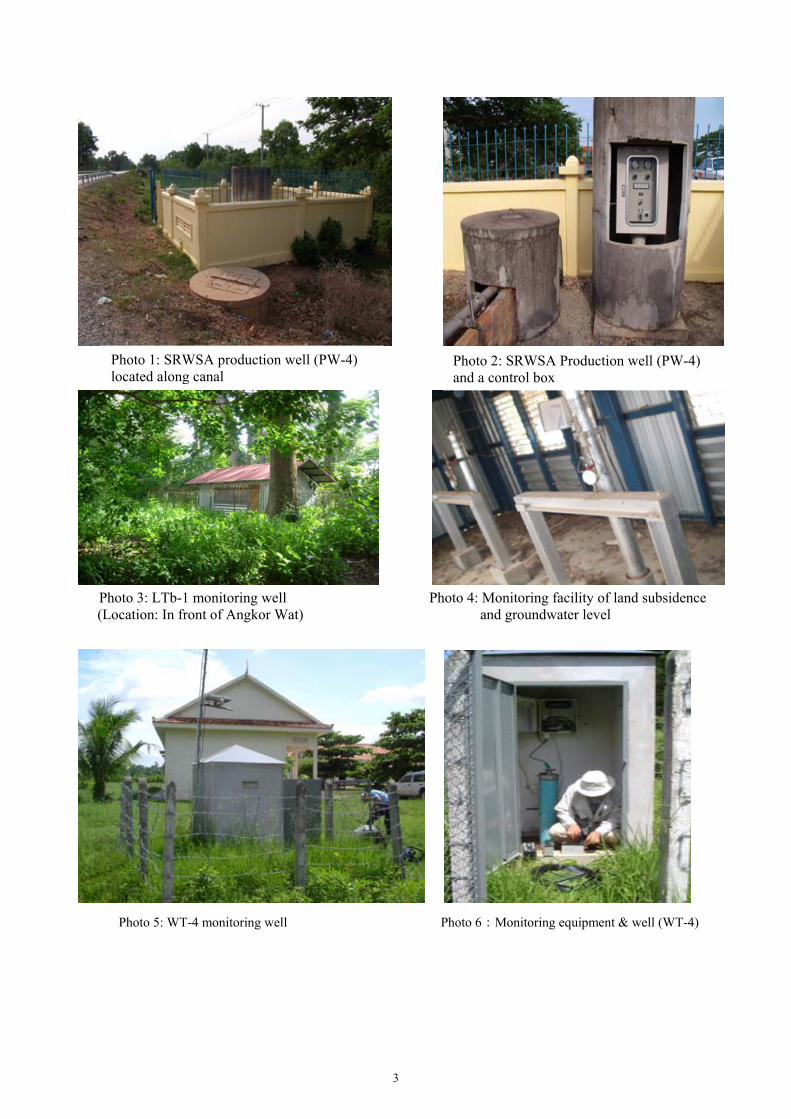
Photo 3: LTb-1 monitoring well Photo 4: Monitoring facility of land subsidence (Location: In front of Angkor Wat) and groundwater level Photo 5: WT-4 monitoring well Photo 6:Monitoring equipment & well (WT-4)
Photo 1: SRWSA production well (PW-4) located along canal
Photo 2: SRWSA Production well (PW-4) and a control box
3
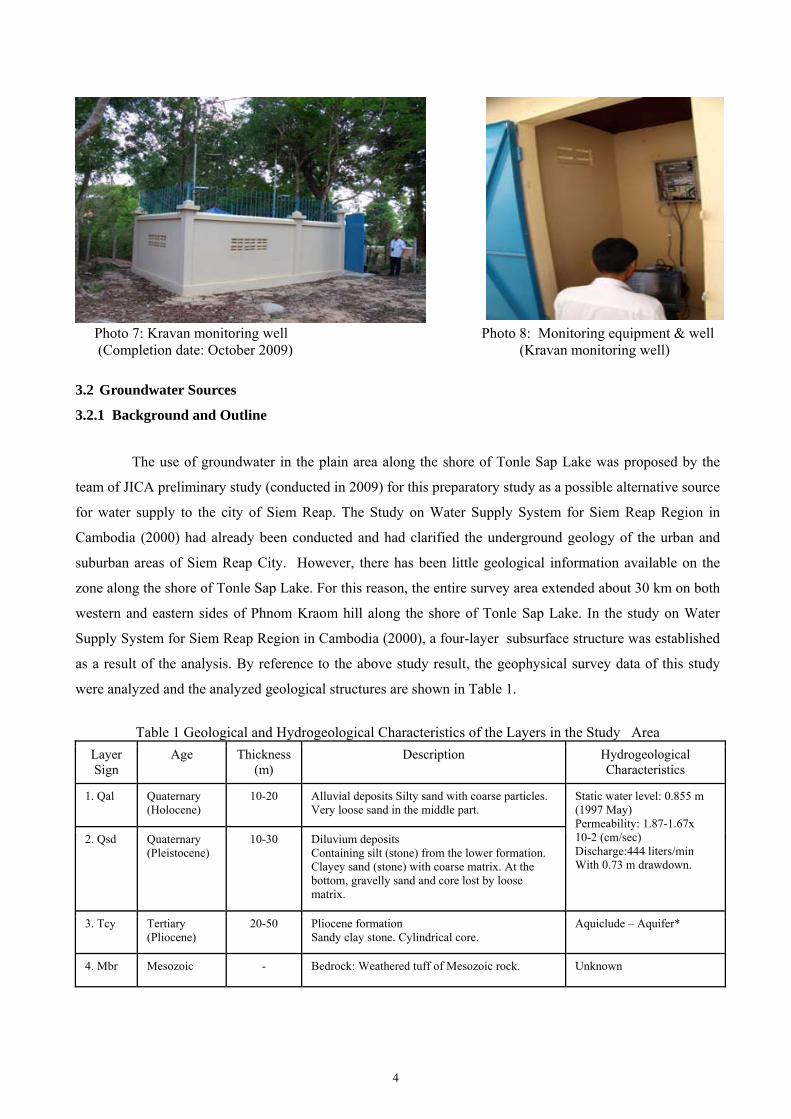
Photo 7: Kravan monitoring well Photo 8: Monitoring equipment & well (Completion date: October 2009) (Kravan monitoring well)
3.2 Groundwater Sources
3.2.1 Background and Outline
The use of groundwater in the plain area along the shore of Tonle Sap Lake was proposed by the
team of JICA preliminary study (conducted in 2009) for this preparatory study as a possible alternative source
for water supply to the city of Siem Reap. The Study on Water Supply System for Siem Reap Region in
Cambodia (2000) had already been conducted and had clarified the underground geology of the urban and
suburban areas of Siem Reap City. However, there has been little geological information available on the
zone along the shore of Tonle Sap Lake. For this reason, the entire survey area extended about 30 km on both
western and eastern sides of Phnom Kraom hill along the shore of Tonle Sap Lake. In the study on Water
Supply System for Siem Reap Region in Cambodia (2000), a four-layer subsurface structure was established
as a result of the analysis. By reference to the above study result, the geophysical survey data of this study
were analyzed and the analyzed geological structures are shown in Table 1.
Table 1 Geological and Hydrogeological Characteristics of the Layers in the Study Area
Layer Sign
Age Thickness (m)
Description Hydrogeological Characteristics
1. Qal Quaternary (Holocene)
10-20 Alluvial deposits Silty sand with coarse particles. Very loose sand in the middle part.
Static water level: 0.855 m (1997 May) Permeability: 1.87-1.67x 10⁻² (cm/sec) Discharge:444 liters/min With 0.73 m drawdown.
2. Qsd Quaternary (Pleistocene)
10-30 Diluvium deposits Containing silt (stone) from the lower formation. Clayey sand (stone) with coarse matrix. At the bottom, gravelly sand and core lost by loose matrix.
3. Tcy Tertiary (Pliocene)
20-50 Pliocene formation Sandy clay stone. Cylindrical core.
Aquiclude – Aquifer*
4. Mbr Mesozoic - Bedrock: Weathered tuff of Mesozoic rock. Unknown
4
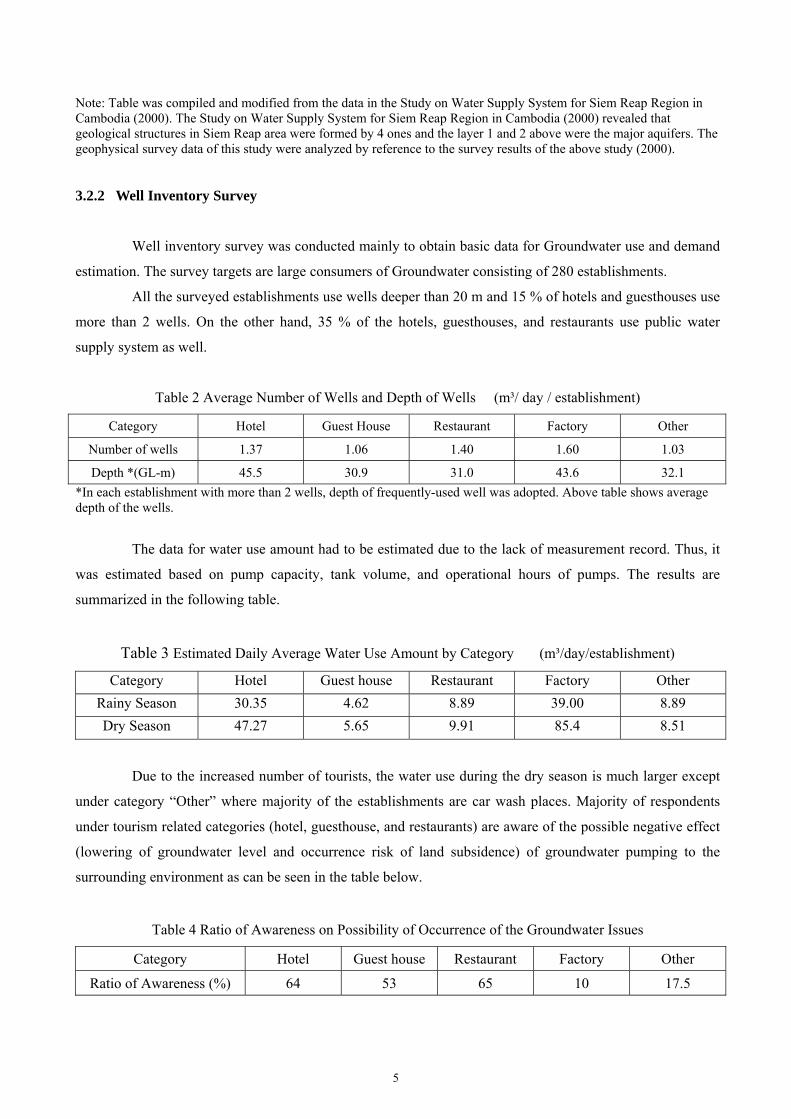
Note: Table was compiled and modified from the data in the Study on Water Supply System for Siem Reap Region in Cambodia (2000). The Study on Water Supply System for Siem Reap Region in Cambodia (2000) revealed that geological structures in Siem Reap area were formed by 4 ones and the layer 1 and 2 above were the major aquifers. The geophysical survey data of this study were analyzed by reference to the survey results of the above study (2000). 3.2.2 Well Inventory Survey
Well inventory survey was conducted mainly to obtain basic data for Groundwater use and demand
estimation. The survey targets are large consumers of Groundwater consisting of 280 establishments.
All the surveyed establishments use wells deeper than 20 m and 15 % of hotels and guesthouses use
more than 2 wells. On the other hand, 35 % of the hotels, guesthouses, and restaurants use public water
supply system as well.
Table 2 Average Number of Wells and Depth of Wells (m³/ day / establishment)
Category Hotel Guest House Restaurant Factory Other
Number of wells 1.37 1.06 1.40 1.60 1.03
Depth *(GL-m) 45.5 30.9 31.0 43.6 32.1
*In each establishment with more than 2 wells, depth of frequently-used well was adopted. Above table shows average depth of the wells.
The data for water use amount had to be estimated due to the lack of measurement record. Thus, it
was estimated based on pump capacity, tank volume, and operational hours of pumps. The results are
summarized in the following table.
Table 3 Estimated Daily Average Water Use Amount by Category (m³/day/establishment)
Category Hotel Guest house Restaurant Factory Other
Rainy Season 30.35 4.62 8.89 39.00 8.89
Dry Season 47.27 5.65 9.91 85.4 8.51
Due to the increased number of tourists, the water use during the dry season is much larger except
under category “Other” where majority of the establishments are car wash places. Majority of respondents
under tourism related categories (hotel, guesthouse, and restaurants) are aware of the possible negative effect
(lowering of groundwater level and occurrence risk of land subsidence) of groundwater pumping to the
surrounding environment as can be seen in the table below.
Table 4 Ratio of Awareness on Possibility of Occurrence of the Groundwater Issues
Category Hotel Guest house Restaurant Factory Other
Ratio of Awareness (%) 64 53 65 10 17.5
5
Many of the surveyed establishments are willing to connect to the public supply system when it
becomes available. The main reason is to cut down the operational cost of current groundwater pumping
system.
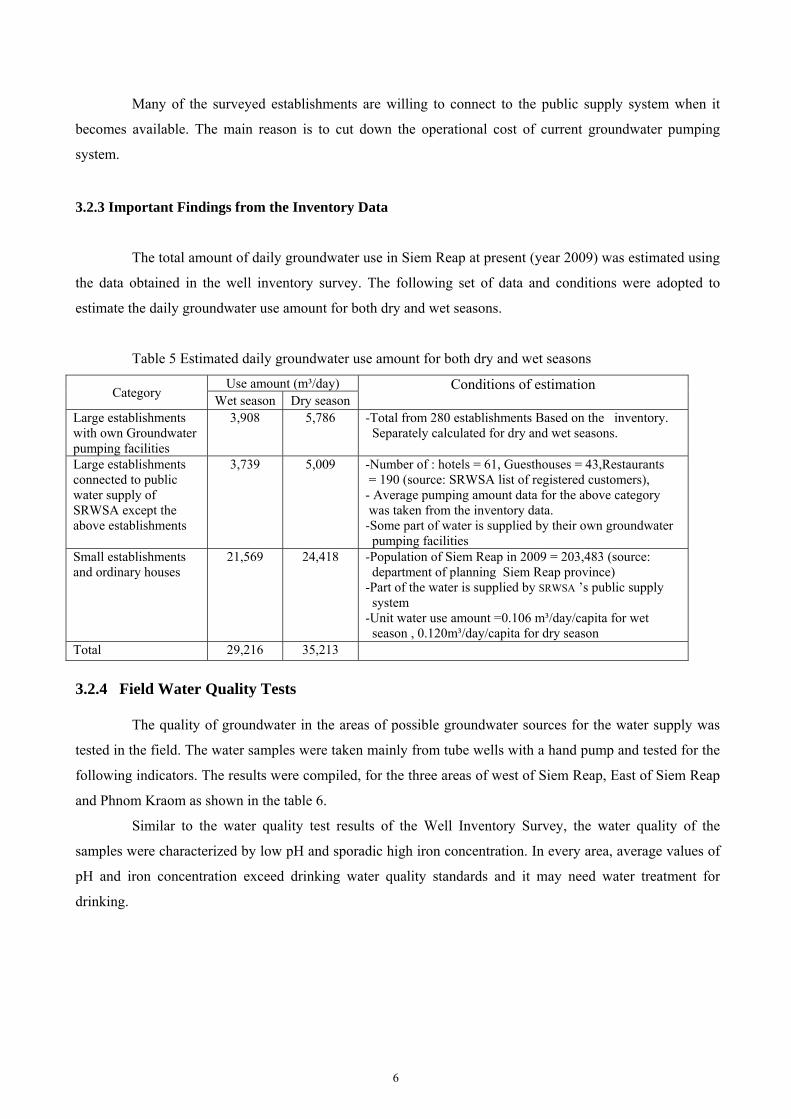
3.2.3 Important Findings from the Inventory Data
The total amount of daily groundwater use in Siem Reap at present (year 2009) was estimated using
the data obtained in the well inventory survey. The following set of data and conditions were adopted to
estimate the daily groundwater use amount for both dry and wet seasons.
Table 5 Estimated daily groundwater use amount for both dry and wet seasons
Category Use amount (m³/day) Conditions of estimation
Wet season Dry season Large establishments with own Groundwater pumping facilities
3,908 5,786 -Total from 280 establishments Based on the inventory. Separately calculated for dry and wet seasons.
Large establishments connected to public water supply of SRWSA except the above establishments
3,739 5,009 -Number of : hotels = 61, Guesthouses = 43,Restaurants = 190 (source: SRWSA list of registered customers), - Average pumping amount data for the above category was taken from the inventory data. -Some part of water is supplied by their own groundwater pumping facilities
Small establishments and ordinary houses
21,569 24,418 -Population of Siem Reap in 2009 = 203,483 (source: department of planning Siem Reap province) -Part of the water is supplied by SRWSA ’s public supply system -Unit water use amount =0.106 m³/day/capita for wet season , 0.120m³/day/capita for dry season
Total 29,216 35,213 3.2.4 Field Water Quality Tests
The quality of groundwater in the areas of possible groundwater sources for the water supply was
tested in the field. The water samples were taken mainly from tube wells with a hand pump and tested for the
following indicators. The results were compiled, for the three areas of west of Siem Reap, East of Siem Reap
and Phnom Kraom as shown in the table 6.
Similar to the water quality test results of the Well Inventory Survey, the water quality of the
samples were characterized by low pH and sporadic high iron concentration. In every area, average values of
pH and iron concentration exceed drinking water quality standards and it may need water treatment for
drinking.
6
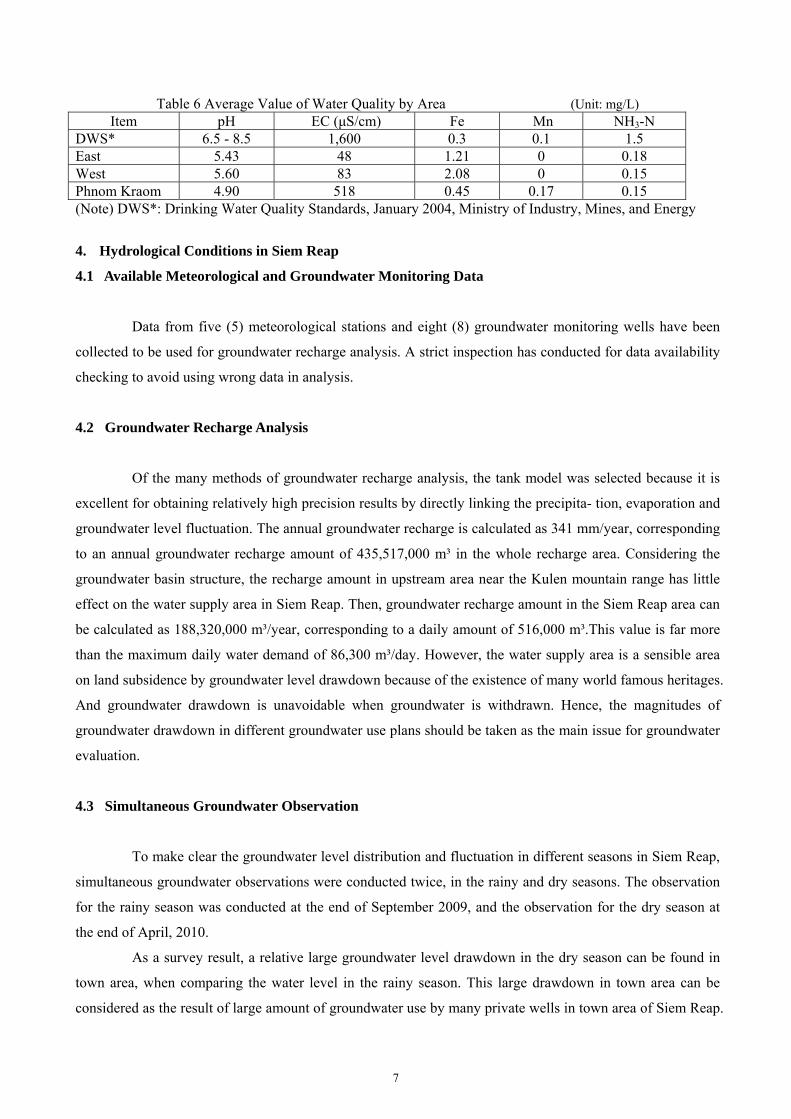
Table 6 Average Value of Water Quality by Area (Unit: mg/L) Item pH EC (μS/cm) Fe Mn NH3-N
DWS* 6.5 - 8.5 1,600 0.3 0.1 1.5 East 5.43 48 1.21 0 0.18 West 5.60 83 2.08 0 0.15 Phnom Kraom 4.90 518 0.45 0.17 0.15 (Note) DWS*: Drinking Water Quality Standards, January 2004, Ministry of Industry, Mines, and Energy
4. Hydrological Conditions in Siem Reap
4.1 Available Meteorological and Groundwater Monitoring Data
Data from five (5) meteorological stations and eight (8) groundwater monitoring wells have been
collected to be used for groundwater recharge analysis. A strict inspection has conducted for data availability
checking to avoid using wrong data in analysis.
4.2 Groundwater Recharge Analysis
Of the many methods of groundwater recharge analysis, the tank model was selected because it is
excellent for obtaining relatively high precision results by directly linking the precipita- tion, evaporation and
groundwater level fluctuation. The annual groundwater recharge is calculated as 341 mm/year, corresponding
to an annual groundwater recharge amount of 435,517,000 m³ in the whole recharge area. Considering the
groundwater basin structure, the recharge amount in upstream area near the Kulen mountain range has little
effect on the water supply area in Siem Reap. Then, groundwater recharge amount in the Siem Reap area can
be calculated as 188,320,000 m³/year, corresponding to a daily amount of 516,000 m³.This value is far more
than the maximum daily water demand of 86,300 m³/day. However, the water supply area is a sensible area
on land subsidence by groundwater level drawdown because of the existence of many world famous heritages.
And groundwater drawdown is unavoidable when groundwater is withdrawn. Hence, the magnitudes of
groundwater drawdown in different groundwater use plans should be taken as the main issue for groundwater
evaluation.
4.3 Simultaneous Groundwater Observation
To make clear the groundwater level distribution and fluctuation in different seasons in Siem Reap,
simultaneous groundwater observations were conducted twice, in the rainy and dry seasons. The observation
for the rainy season was conducted at the end of September 2009, and the observation for the dry season at
the end of April, 2010.
As a survey result, a relative large groundwater level drawdown in the dry season can be found in
town area, when comparing the water level in the rainy season. This large drawdown in town area can be
considered as the result of large amount of groundwater use by many private wells in town area of Siem Reap.
7
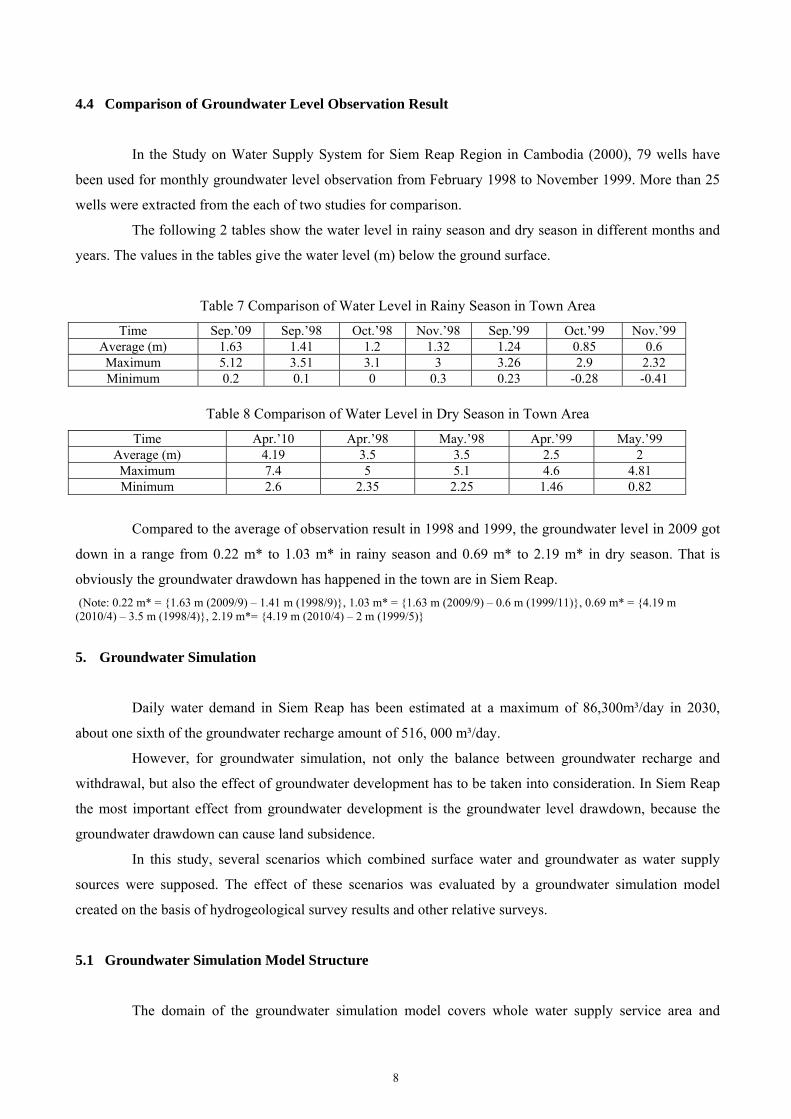
4.4 Comparison of Groundwater Level Observation Result
In the Study on Water Supply System for Siem Reap Region in Cambodia (2000), 79 wells have
been used for monthly groundwater level observation from February 1998 to November 1999. More than 25
wells were extracted from the each of two studies for comparison.
The following 2 tables show the water level in rainy season and dry season in different months and
years. The values in the tables give the water level (m) below the ground surface.
Table 7 Comparison of Water Level in Rainy Season in Town Area
Time Sep.’09 Sep.’98 Oct.’98 Nov.’98 Sep.’99 Oct.’99 Nov.’99 Average (m) 1.63 1.41 1.2 1.32 1.24 0.85 0.6 Maximum 5.12 3.51 3.1 3 3.26 2.9 2.32 Minimum 0.2 0.1 0 0.3 0.23 -0.28 -0.41
Table 8 Comparison of Water Level in Dry Season in Town Area
Time Apr.’10 Apr.’98 May.’98 Apr.’99 May.’99 Average (m) 4.19 3.5 3.5 2.5 2 Maximum 7.4 5 5.1 4.6 4.81 Minimum 2.6 2.35 2.25 1.46 0.82
Compared to the average of observation result in 1998 and 1999, the groundwater level in 2009 got
down in a range from 0.22 m* to 1.03 m* in rainy season and 0.69 m* to 2.19 m* in dry season. That is
obviously the groundwater drawdown has happened in the town are in Siem Reap.
(Note: 0.22 m* = {1.63 m (2009/9) – 1.41 m (1998/9)}, 1.03 m* = {1.63 m (2009/9) – 0.6 m (1999/11)}, 0.69 m* = {4.19 m (2010/4) – 3.5 m (1998/4)}, 2.19 m*= {4.19 m (2010/4) – 2 m (1999/5)}
5. Groundwater Simulation
Daily water demand in Siem Reap has been estimated at a maximum of 86,300m³/day in 2030,
about one sixth of the groundwater recharge amount of 516, 000 m³/day.
However, for groundwater simulation, not only the balance between groundwater recharge and
withdrawal, but also the effect of groundwater development has to be taken into consideration. In Siem Reap
the most important effect from groundwater development is the groundwater level drawdown, because the
groundwater drawdown can cause land subsidence.
In this study, several scenarios which combined surface water and groundwater as water supply
sources were supposed. The effect of these scenarios was evaluated by a groundwater simulation model
created on the basis of hydrogeological survey results and other relative surveys.
5.1 Groundwater Simulation Model Structure
The domain of the groundwater simulation model covers whole water supply service area and
8
surrounding area, with a extent of 39 km in the west-east direction and 46.5 km in the north-south direction.
5.2 Layer Specification
5 layers area is specified in the model: Layer 1 and Layer 2: shallow aquifer / Layer 3: aquiclude
/Layer 4: deep aquifer /Layer 5: basement rock. (Note: as shown in “Table 1 Geological and hydrological
characteristics of Geophysical survey”, a part of Tertiary formation forms aquifer. Thus, Tertiary formation in
this simulation model is supposed to divide into an aquiclude of 3rd layer and a deep aquifer of 4th layer. As
a result, the model including basement rocks (5th layer) assumed 5 layers as groundwater basin structures).
5.3 Boundary Condition Specification
Therefore the following features were specified into the model as constant water boundaries. Siem Reap
River/Angkor Wat Moat/West Baray (Reservoir) and its channels for water conveyance in its upstream and
downstream sides/Tonle Sap Lake.
5.4 Parameter Specification
Hydraulic conductivities are specified for each layer based on the pumping test results of the Study
on Water Supply System for Siem Reap Region in Cambodia (2000). Other parameters are specified for
Storage Coefficient, Effective Porosity, and Specific Yield based on empirical values.
5.5 Model Calibration
1) Steady Flow Simulation: Steady flow simulation is conducted for model convergence and general
parameter’s specification confirmation.
2) Transient Flow Simulation: Transient flow simulation is conducted for parameter calibration by using
the last 3 years (2006-2008) relative data of precipitation, evaporation, groundwater withdrawal amount.
5.6 Model Specification for Groundwater Prediction
1) Specification of External Factors
Precipitation and Evaporation: The last 20 years of observation results from 1989 to 2008 in meteorological
station Siem Reap City were taken for precipitation specification. Water Head for Constant Head Boundary:
The result of hydrological observation and the last 10 years water level observation results of Tonle Sap Lake
were used for constant head boundary specifications.
2) Specification of Scenarios
9
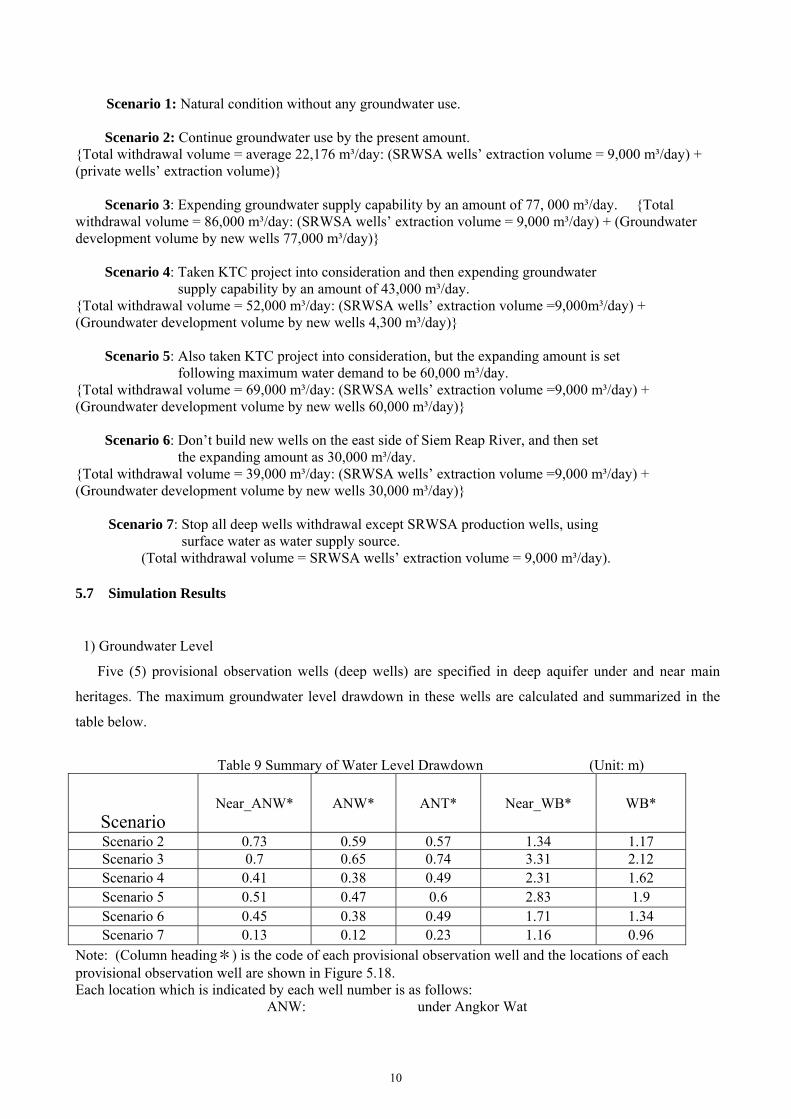
Scenario 1: Natural condition without any groundwater use. Scenario 2: Continue groundwater use by the present amount. {Total withdrawal volume = average 22,176 m³/day: (SRWSA wells’ extraction volume = 9,000 m³/day) + (private wells’ extraction volume)} Scenario 3: Expending groundwater supply capability by an amount of 77, 000 m³/day. {Total withdrawal volume = 86,000 m³/day: (SRWSA wells’ extraction volume = 9,000 m³/day) + (Groundwater development volume by new wells 77,000 m³/day)} Scenario 4: Taken KTC project into consideration and then expending groundwater supply capability by an amount of 43,000 m³/day. {Total withdrawal volume = 52,000 m³/day: (SRWSA wells’ extraction volume =9,000m³/day) + (Groundwater development volume by new wells 4,300 m³/day)} Scenario 5: Also taken KTC project into consideration, but the expanding amount is set following maximum water demand to be 60,000 m³/day. {Total withdrawal volume = 69,000 m³/day: (SRWSA wells’ extraction volume =9,000 m³/day) + (Groundwater development volume by new wells 60,000 m³/day)} Scenario 6: Don’t build new wells on the east side of Siem Reap River, and then set the expanding amount as 30,000 m³/day. {Total withdrawal volume = 39,000 m³/day: (SRWSA wells’ extraction volume =9,000 m³/day) + (Groundwater development volume by new wells 30,000 m³/day)} Scenario 7: Stop all deep wells withdrawal except SRWSA production wells, using surface water as water supply source. (Total withdrawal volume = SRWSA wells’ extraction volume = 9,000 m³/day). 5.7 Simulation Results
1) Groundwater Level
Five (5) provisional observation wells (deep wells) are specified in deep aquifer under and near main
heritages. The maximum groundwater level drawdown in these wells are calculated and summarized in the
table below.
Table 9 Summary of Water Level Drawdown (Unit: m)
Scenario Near_ANW* ANW* ANT* Near_WB* WB*
Scenario 2 0.73 0.59 0.57 1.34 1.17 Scenario 3 0.7 0.65 0.74 3.31 2.12 Scenario 4 0.41 0.38 0.49 2.31 1.62 Scenario 5 0.51 0.47 0.6 2.83 1.9 Scenario 6 0.45 0.38 0.49 1.71 1.34 Scenario 7 0.13 0.12 0.23 1.16 0.96
Note: (Column heading*) is the code of each provisional observation well and the locations of each provisional observation well are shown in Figure 5.18. Each location which is indicated by each well number is as follows: ANW: under Angkor Wat
10
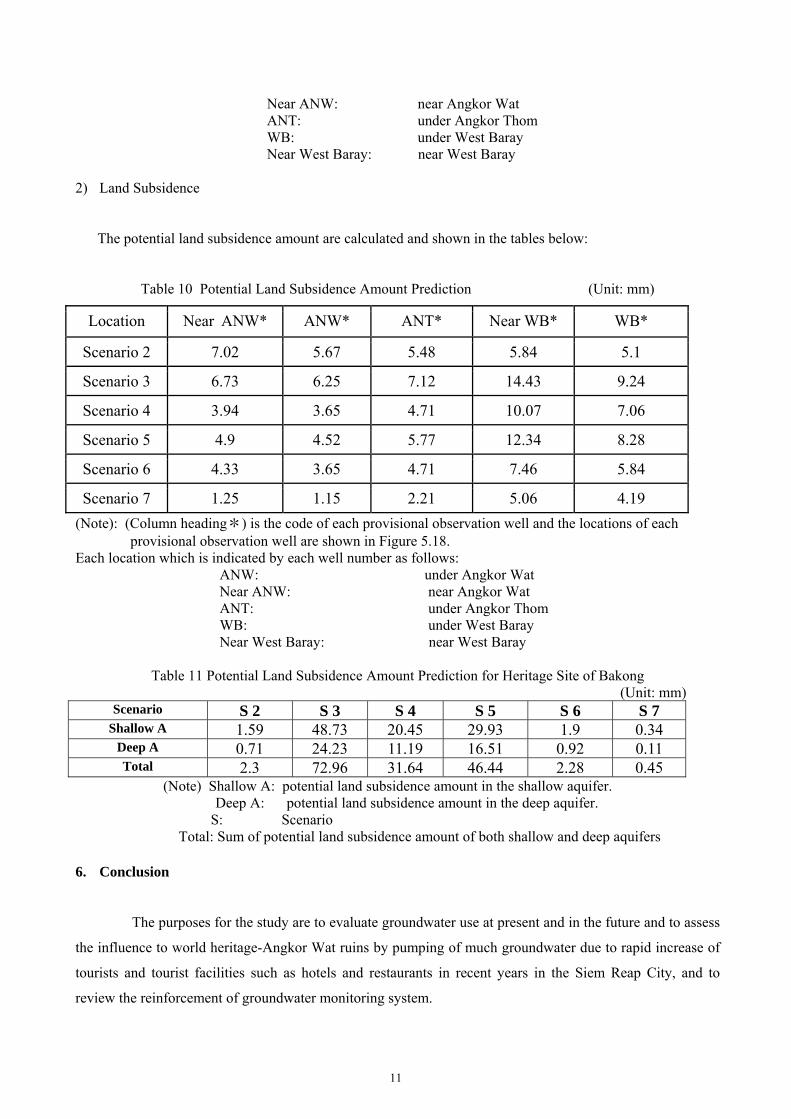
Near ANW: near Angkor Wat ANT: under Angkor Thom WB: under West Baray Near West Baray: near West Baray 2) Land Subsidence
The potential land subsidence amount are calculated and shown in the tables below:
Table 10 Potential Land Subsidence Amount Prediction (Unit: mm)
Location Near ANW* ANW* ANT* Near WB* WB*
Scenario 2 7.02 5.67 5.48 5.84 5.1
Scenario 3 6.73 6.25 7.12 14.43 9.24
Scenario 4 3.94 3.65 4.71 10.07 7.06
Scenario 5 4.9 4.52 5.77 12.34 8.28
Scenario 6 4.33 3.65 4.71 7.46 5.84
Scenario 7 1.25 1.15 2.21 5.06 4.19
(Note): (Column heading*) is the code of each provisional observation well and the locations of each provisional observation well are shown in Figure 5.18. Each location which is indicated by each well number as follows: ANW: under Angkor Wat Near ANW: near Angkor Wat ANT: under Angkor Thom WB: under West Baray Near West Baray: near West Baray
Table 11 Potential Land Subsidence Amount Prediction for Heritage Site of Bakong (Unit: mm) Scenario S 2 S 3 S 4 S 5 S 6 S 7
Shallow A 1.59 48.73 20.45 29.93 1.9 0.34 Deep A 0.71 24.23 11.19 16.51 0.92 0.11 Total 2.3 72.96 31.64 46.44 2.28 0.45
(Note) Shallow A: potential land subsidence amount in the shallow aquifer. Deep A: potential land subsidence amount in the deep aquifer.
S: Scenario Total: Sum of potential land subsidence amount of both shallow and deep aquifers
6. Conclusion
The purposes for the study are to evaluate groundwater use at present and in the future and to assess
the influence to world heritage-Angkor Wat ruins by pumping of much groundwater due to rapid increase of
tourists and tourist facilities such as hotels and restaurants in recent years in the Siem Reap City, and to
review the reinforcement of groundwater monitoring system.
11
Evaluation of Groundwater use at Present and in the Future
In Siem Reap City area, current status of groundwater use of large establishments was surveyed by
well inventory survey. As a result, the survey revealed that there were 280 establishments of tourist facilities
such as hotels and public facilities including schools and factories in the city area and they withdraw of a
groundwater bout 5,786 m³/day in the dry season. In addition, SRWSA pumps up of a groundwater bout
9,000 m³/day for water supply and ordinary houses use of groundwater about 24,000m³/day by shallow wells.
Thus, it is estimated that groundwater of 38,000 m³/day is presently at least extracted in the city area.
On the other hand, a part of world heritage ruins are located near the city center area and many
tourist facilities such as hotels are also concentrated in the area. If in the future, a large number of tourist
facilities are continuously constructed in the city center area and withdrawal volume of groundwater increases,
it is supposed that groundwater level (hydraulic head) in the area is lowered and land subsidence by
consolidation may be caused and they may have an impact to world heritage.
To identify this phenomenon, monitoring data of groundwater level of existing observation wells
were analyzed. As a result, in monitoring data, small fluctuation of groundwater level influenced by pumping
wells near monitoring wells was identified but constant and large drawdown of groundwater level was not
observed. In addition, lowering of groundwater level by pumping of SRWSA production wells in WT-4
monitoring well was not observed.
WT-4 well is located along National Road No.6 and apart about 2.6 km from SRWSA wells. As a
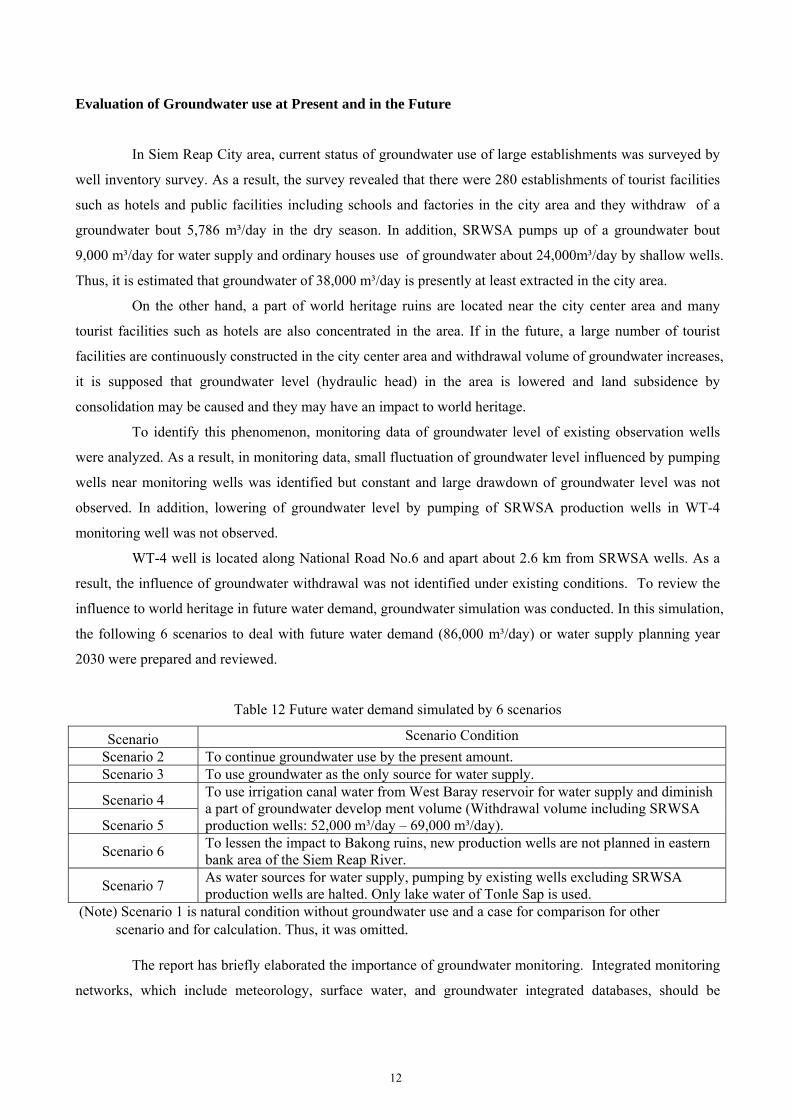
result, the influence of groundwater withdrawal was not identified under existing conditions. To review the
influence to world heritage in future water demand, groundwater simulation was conducted. In this simulation,
the following 6 scenarios to deal with future water demand (86,000 m³/day) or water supply planning year
2030 were prepared and reviewed.
Table 12 Future water demand simulated by 6 scenarios
Scenario Scenario Condition
Scenario 2 To continue groundwater use by the present amount. Scenario 3 To use groundwater as the only source for water supply.
Scenario 4 To use irrigation canal water from West Baray reservoir for water supply and diminish a part of groundwater develop ment volume (Withdrawal volume including SRWSA production wells: 52,000 m³/day – 69,000 m³/day). Scenario 5
Scenario 6 To lessen the impact to Bakong ruins, new production wells are not planned in eastern bank area of the Siem Reap River.
Scenario 7 As water sources for water supply, pumping by existing wells excluding SRWSA production wells are halted. Only lake water of Tonle Sap is used.
(Note) Scenario 1 is natural condition without groundwater use and a case for comparison for other scenario and for calculation. Thus, it was omitted.
The report has briefly elaborated the importance of groundwater monitoring. Integrated monitoring
networks, which include meteorology, surface water, and groundwater integrated databases, should be
12
introduced as one of the strategies for better and sustainable long term water resources planning and
management.
Referrences 1. Geographic map of Cambodia. 2. Atlas of Mineral Resources of the ESCAP Region, volume 10. 3. A Report on a Program of Groundwater Investigations for Cambodia by R. V. USHMAN, U. S. Geological Survey, June 1958. 4. Groundwater Resources of Cambodia by W. C. RASMUSSEN and G. M.BRANDFORD, Geological Survey Water-Supply paper 1608-P, Government of Cambodia under the auspices of
the United States Agency for International Development, USGS-1977. 5. Final Report of: The Study on Groundwater Development in Southern Cambodia by JICA with
the Ministry of Rural Development of the Kingdom of Cambodia, January 2002.
13
Investigation and Monitoring of Land Subsidence in Yangtze River Delta Area of China
Li Tiefeng1 and Shi Yujin2
1, China Geological Survey, Beijing 100037 P.R.China;
2, Shanghai Institute of Geological Survey, Shanghai 200072 P.R.China
Abstract: Land subsidence is one of the main geological disasters in China, which makes great effect on city
planning, flooding prevention, and municipal infrastructure. This paper is intended to present a brief review
on the current situation of land subsidence and its investigation,monitoring and remedial works made in
Yangtze River Delta area. Investigation has shown that land subsidence has been caused primarily by
extensive pumping of groundwater. With the restriction of groundwater mining, prevention and cure of land
subsidence has been acquired a favorable effect since 1960s. However, with the developing of massive
construction and increasing of shallow groundwater mining during excavation, land subsidence had presented
some new peculiarities in recent years. In order to strengthen the work in guarding against land subsidence,
China government adopted various integrative methods about groundwater resources utilization, city planning,
engineering measures and municipal infrastructure, and also established multi-provinces land subsidence
management information system. A control for land subsidence control gets primary effect, which provides a
safeguard for the sustaining development of the city.
Key Words: land subsidence, present situation, groundwater, monitoring network, cause, prevention
1. Introduction
In China, land subsidence is mainly distributed in the coastal cities. In Yangtze River Delta area,
Shanghai was one city which of land subsidence the first discovered in the 1920s and impaction was most
prominent. Land subsidence has long-term and variously impact on the development of city. From the 1970s,
land subsidence also occurred in major cities along the Yangtze River Delta Plain such as Suzhou, Wuxi,
Hangzhou, and Huzhou. Since the 1980s, the range of land affected by subsidence extended from cities to
rural areas, accompanied with ground fissures, which showed that the disaster of land subsidence had become
more serious.
At present, the land subsidence area of the Yangtze River Delta Plain where the cumulative amount
of subsidence exceeds 200mm is approximately 10,000km2, where, in the subsidence centers such as the
downtown of Shanghai and Wuxi of Jiangsu Province, the maximum cumulative amount of subsidence
exceeds 2,500mm. Ground fissures have occurred in this area due to differential subsidence.
China government has paid much attention to the prevention and control of land subsidence. In
14
recent years, investigation, monitoring and prevention on land subsidence have achieved great progress. As a
result of these efforts, the control of land subsidence has achieved initial success. However, the gradual
worsening of land subsidence has not been effectively controlled. There are still severe problems to be solved
and hard prevention tasks to be accomplished.
2. Present Situation and Cause of Land Subsidence
2.1 Present Situation of Land Subsidence in Yangtze River Delta Area
1.1.1 Present Situation of Land Subsidence in Shanghai City
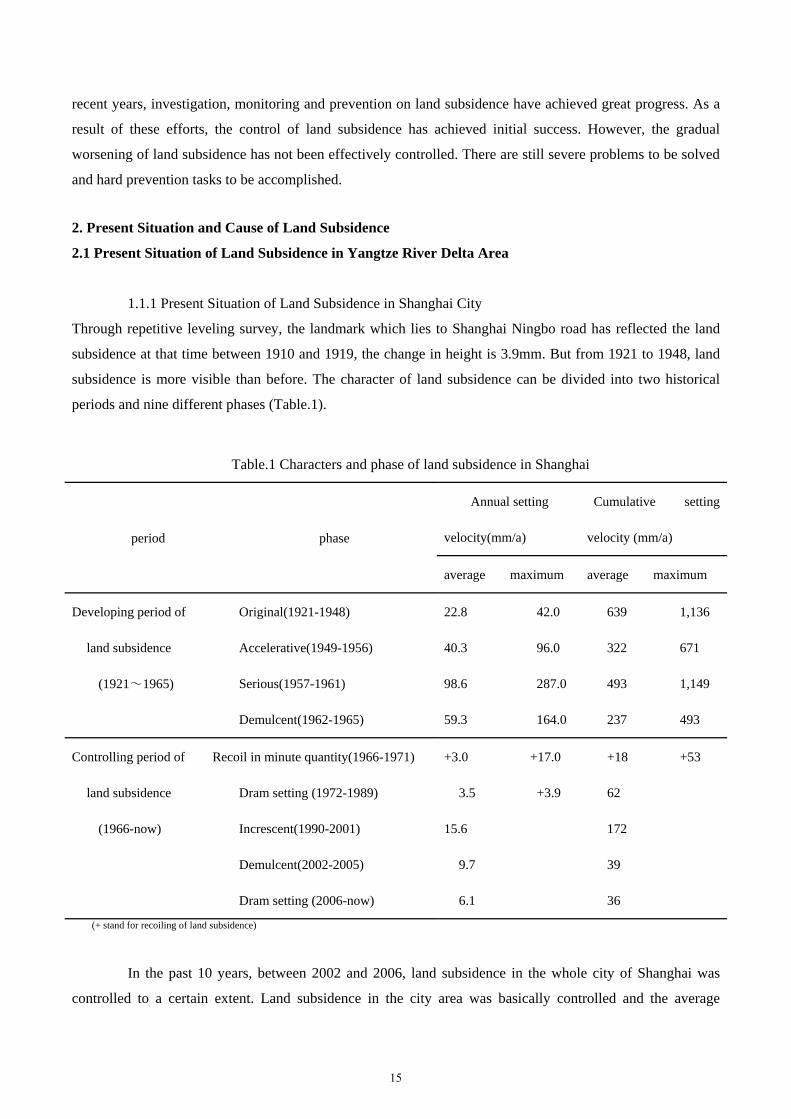
Through repetitive leveling survey, the landmark which lies to Shanghai Ningbo road has reflected the land
subsidence at that time between 1910 and 1919, the change in height is 3.9mm. But from 1921 to 1948, land
subsidence is more visible than before. The character of land subsidence can be divided into two historical
periods and nine different phases (Table.1).
Table.1 Characters and phase of land subsidence in Shanghai
period phase
Annual setting
velocity(mm/a)
Cumulative setting
velocity (mm/a)
average maximum average maximum
Developing period of
land subsidence
(1921~1965)
Original(1921-1948) 22.8 42.0 639 1,136
Accelerative(1949-1956) 40.3 96.0 322 671
Serious(1957-1961) 98.6 287.0 493 1,149
Demulcent(1962-1965) 59.3 164.0 237 493
Controlling period of
land subsidence
(1966-now)
Recoil in minute quantity(1966-1971) +3.0 +17.0 +18 +53
Dram setting (1972-1989) 3.5 +3.9 62
Increscent(1990-2001) 15.6 172
Demulcent(2002-2005) 9.7 39
Dram setting (2006-now) 6.1 36
(+ stand for recoiling of land subsidence)
In the past 10 years, between 2002 and 2006, land subsidence in the whole city of Shanghai was
controlled to a certain extent. Land subsidence in the city area was basically controlled and the average
15
sinking rate for the city area was 12.7mm/a. Then between 2006 and 2010, the cumulative subsidence amount
of most areas, except some local areas where there were subsidence cones, was relatively small, between 0
and 25mm.
However, land subsidence in Shanghai presents asymmetric features. Statistical data present the
index of land subsidence in every district at different periods. Take standard deviation as an example, the
more the standard deviated, the more the data dispersed. The data of subsidence separated from each other
seriously, what indicated the difference for sedimentation. The standard deviation of maximum cumulative
sedimentation is 20.4mm from 1986 to 1990, which is 49.9mm from 1991 to 1995, and which is 64.3mm from
1996 to 2000, those indicated that maximum sedimentation separated from each other seriously in every
district as the time pass by. The minimum and average sedimentation deviation increased more along with the
time going. From 1996 to 2000, the maximum of falling velocity in space reach to 112mm/km.
1.1.2 Present Situation of Land Subsidence in Suzhou, Wuxi and Changzhou City
On August 26, 2000, the Decision to Prohibit Extraction of Groundwater in Suzhou, Wuxi and Changzhou
was reviewed and accepted at the 18th meeting of the 9th NPC Standing Committee of Jiangsu. It regulated
that the prohibition on groundwater extraction should be fully achieved within 5 years. Within the 10
following years, the regional geological environment changed a lot. Due to the prohibition on groundwater
extraction, the conditions of land subsidence in Suzhou, Wuxi and Changzhou improved significantly and the
situation of the whole area was relieved to various degrees.
1.1.3 Present Situation of Land Subsidence in Hangzhou, Jiaxing and Huzhou City
Since 2006, with the promotion of the prohibition and restraint of groundwater mining, the rate of land
subsidence was reduced to a certain extent and thus the advancement of subsidence was effectively contained.
By 2010, areas of subsiding rate larger than 30mm/a had disappeared. Those areas of subsiding rate larger
than 10mm/a were 195km2, reduced by 92% as compared with 2005. Also, the land slightly rose in many
areas.
2.2 Analysis on Causes of Land Subsidence
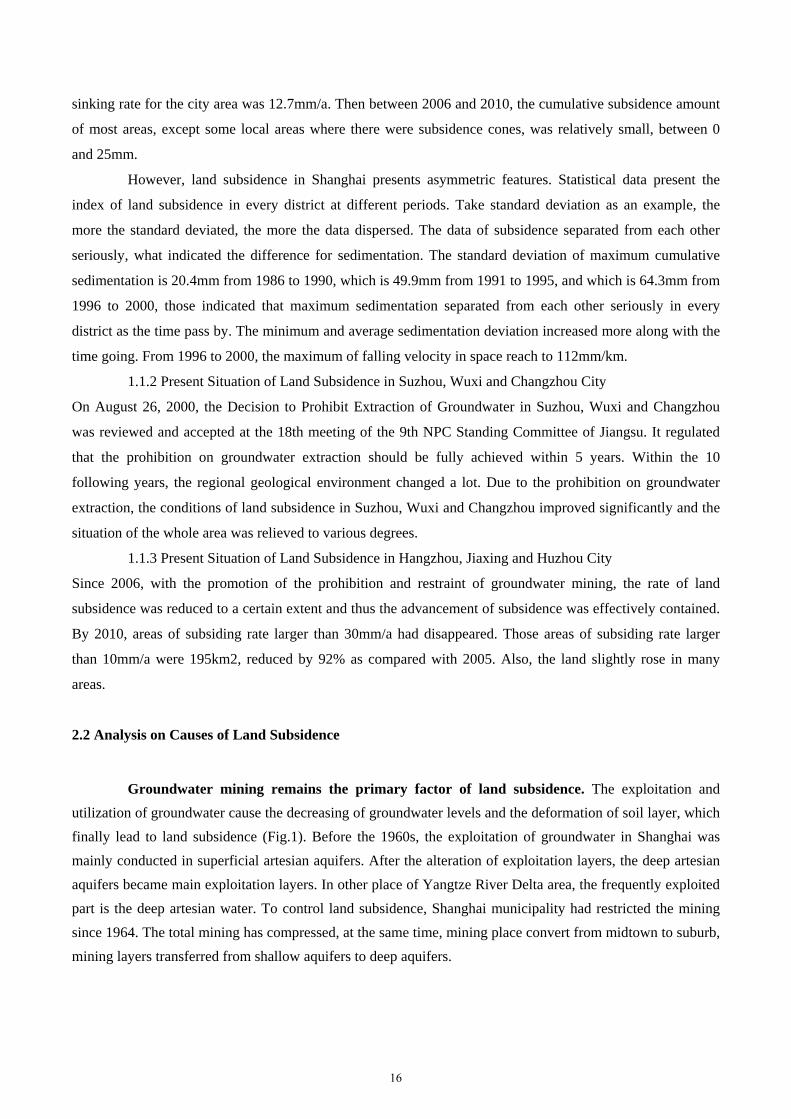
Groundwater mining remains the primary factor of land subsidence. The exploitation and
utilization of groundwater cause the decreasing of groundwater levels and the deformation of soil layer, which
finally lead to land subsidence (Fig.1). Before the 1960s, the exploitation of groundwater in Shanghai was
mainly conducted in superficial artesian aquifers. After the alteration of exploitation layers, the deep artesian
aquifers became main exploitation layers. In other place of Yangtze River Delta area, the frequently exploited
part is the deep artesian water. To control land subsidence, Shanghai municipality had restricted the mining
since 1964. The total mining has compressed, at the same time, mining place convert from midtown to suburb,
mining layers transferred from shallow aquifers to deep aquifers.
16
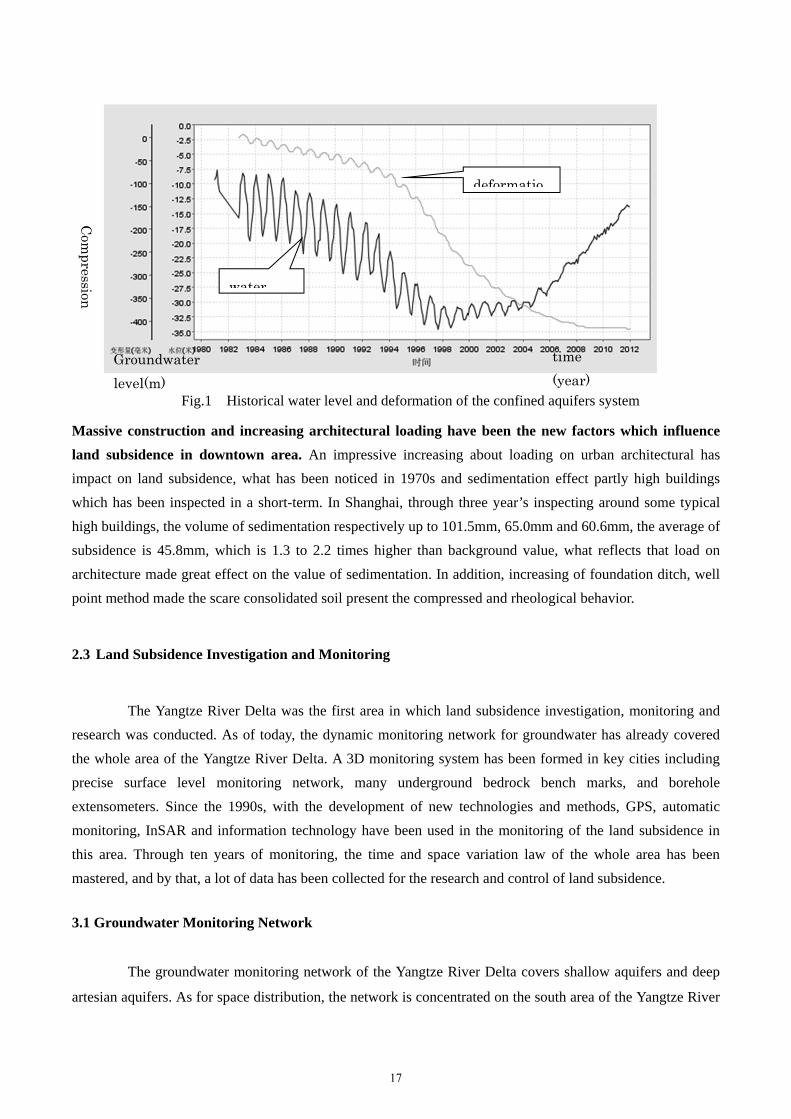
Fig.1 Historical water level and deformation of the confined aquifers system
Massive construction and increasing architectural loading have been the new factors which influence
land subsidence in downtown area. An impressive increasing about loading on urban architectural has
impact on land subsidence, what has been noticed in 1970s and sedimentation effect partly high buildings
which has been inspected in a short-term. In Shanghai, through three year’s inspecting around some typical
high buildings, the volume of sedimentation respectively up to 101.5mm, 65.0mm and 60.6mm, the average of
subsidence is 45.8mm, which is 1.3 to 2.2 times higher than background value, what reflects that load on
architecture made great effect on the value of sedimentation. In addition, increasing of foundation ditch, well
point method made the scare consolidated soil present the compressed and rheological behavior.
2.3 Land Subsidence Investigation and Monitoring
The Yangtze River Delta was the first area in which land subsidence investigation, monitoring and
research was conducted. As of today, the dynamic monitoring network for groundwater has already covered
the whole area of the Yangtze River Delta. A 3D monitoring system has been formed in key cities including
precise surface level monitoring network, many underground bedrock bench marks, and borehole
extensometers. Since the 1990s, with the development of new technologies and methods, GPS, automatic
monitoring, InSAR and information technology have been used in the monitoring of the land subsidence in
this area. Through ten years of monitoring, the time and space variation law of the whole area has been
mastered, and by that, a lot of data has been collected for the research and control of land subsidence.
3.1 Groundwater Monitoring Network
The groundwater monitoring network of the Yangtze River Delta covers shallow aquifers and deep
artesian aquifers. As for space distribution, the network is concentrated on the south area of the Yangtze River
time
(year)
Groundwater
level(m)
Com
pression
water
deformatio
17
and scattered in the north area. Until 2010, there had been 625 groundwater monitoring wells and 285
groundwater quality monitoring wells. Manual and automatic methods were combined to perform the
groundwater monitoring. There had been a total number of 72 automatic monitoring points by 2010.
3.2 Local Land Subsidence Monitoring Network
The land subsidence monitoring network is mainly composed of GPS monitoring points,
underground bedrock bench marks and borehole extensometers (groups). The distribution of Grade I and II
GPS monitoring points is balanced, but in the south area of the Yangtze River, Grade II points are more
concentrated. The distribution of the bedrock bench marks and borehole extensometers in Shanghai, Wuxi and
Changzhou is concentrated, and in other areas, distributed. By 2010, there were 72 bedrock bench marks, 83
borehole extensometers, 8 ground fissure monitoring points, 554 Grade I and II GPS monitoring points, 12
permanent tracking stations and 72 automatic monitoring points (including monitoring stations).
Through the InSAR land subsidence monitoring since 2007 in the Yangtze River Delta, the land
subsidence information of about 66.9 thousand km2 has been obtained, including about 44.8 thousand km2 of
fluvial plains (accounting for 94.36% of the actual area) and central Jiangsu (north of Yangtze River) and
coastal areas where there are not enough investigation on land subsidence.
3.3 Engineering Land Subsidence Monitoring Network in Urban Areas
To obtain the information of the land subsidence along railways and overhead roads and provide it
for the prevention of engineering land subsidence, Shanghai deployed facilities like leveling nodes, borehole
extensometers and bedrock bench marks in different geological formation areas along project lines. In key
engineering areas during the 11th Five Year Plan, a land subsidence backbone network was formed, which is
independent but still tightly associated with the leveling network of the central city.
4. Prevention and Control of Land Subsidence
China government has paid much attention to the prevention and control of the land subsidence in
coastal cities. In recent years, important accomplishments have been achieved in land subsidence investigation,
monitoring and groundwater control. The prevention has begun to take effect.
A coordination system for local land subsidence prevention has been basically established. In May 2004,
Shanghai, Jiangsu and Zhejiang jointly established a joint conference system for local cooperation in land
subsidence areas of the Yangtze River, by which the overall coordination for land subsidence monitoring in
the Yangtze River Delta was achieved. This laid a good foundation for the monitoring network construction
18
and comprehensive prevention of land subsidence across the areas.
Significant results have been gained in groundwater exploitation control and over-exploitation
governance. To solve the problems caused by the over-exploitation of groundwater and the land subsidence
thereby, provinces (districts and cities involved) focused on the exploitation control and over-exploitation
governance, strengthened the management of groundwater resources, controlled the overall amount of
groundwater exploitation, set the groundwater over-exploitation areas, regulated the range of exploitation
prohibition and limitation, and implemented prohibition and limitation of groundwater extraction. The
exploitation amount of groundwater in Shanghai was decreased from 94.59 million km3 in 2000 to 30 million
km3 in 2009. As a result of Jiangsu's NPC issued the Decision to Prohibit Exploitation of Groundwater in a
Limited Period in Suzhou, Wuxi and Changzhou, the exploitation of groundwater was generally prohibited in
these three cities. In Hangzhou, Jiaxing and Huzhou of Zhejiang as well as the coastal plains, efforts to
prohibit and limit groundwater exploitation were also carried out.
Significant results have been gained from the comprehensive prevention of land subsidence. By the
exploitation limitation and artificial recharge to groundwater, Shanghai has controlled the yearly subsidence to
below 10mm/a. After the 2000's groundwater exploitation prohibition, in Suzhou, Wuxi and Changzhou of
Jiangsu, the land subsidence in downtowns has been controlled. The decreasing amplitude exceeds 20mm,
compared with the figures before the prohibition. After the prohibition, in Hangzhou, Jiaxing and Huzhou of
Zhejiang, the yearly land subsidence in some downtown area has been decreased to 10mm.
5. Land Subsidence Information Management System
China adapted GIS into its land subsidence research later than others, but it developed fast. Land
subsidence workers have made many effective efforts in exploration. For example, in Suzhou, Wuxi and
Changzhou, a land subsidence management information system based on the ArcGIS platform was established,
relevant data of basic geology, hydrogeology and environmental geology have been sorted, summarized and
summed up. A multi-source geological information spatial database has been built, and a 3D visual model of
bedrock structure, Quaternary deposits and underground aquifer systems have been set up by using ArcGIS
platform and GMS. Based on that, scientific forecasting and management for the land subsidence have been
developed through the use of the ArcGIS system. Many statistic methods are also used to forecast the land
subsidence. The spatial analysis method and the Analsis Hierarchy Process (AHP) method have been used to
build the warning and evaluation system, sub-system of land subsidence database and sub-system of the land
subsidence model method.
Shanghai established databases of basic geology, hydrogeology and engineering geological structure
and spatial data, as well as the geological environment monitoring and land subsidence remedial database.
19
7,588 pieces of geological data, including 438 thousand drills, 123 thousand geological drill databases, 500
geological drawings and 1,500 thousand pieces of land subsidence monitoring data have been achieved. The
overall data amount has reached 800G. Through deep studying using 3D geological models, 3D geological
models of different specialties and details have been established. With these models, the analysis and
evaluation of land subsidence can be conducted in a more comprehensive and deep way, and so the level of
forecasting and scientific management of land subsidence in Shanghai has been improved.
The establishment of Shanghai's geological information platform has helped the deep analysis and
comprehensive research on the past land subsidence data and research results and can also help the adjustment
of the exploitation layout of groundwater and the research and control of the development of land subsidence.
In this way, they may promote the positive development of geological environment, which can be used to
make auxiliary decisions and used for reference of urban construction and development planning. In addition,
by fast query and search methods, data collecting and sorting can be done for the future researches on land
subsidence and other subjects, so as to reduce the working load of researches, shorten the period of research
and save on costs. Meanwhile, when the system is successfully established, the current data and results may
be fully used to provide consulting services for the society.
Conclusion
The land subsidence in Yangtze River Delta area has experienced several phrases since 1960, and
now land subsidence value gradually comes down. However, land subsidence presents asymmetric features,
and the influenced factors vary in a different period. In recent years, massive construction, especially
groundwater pumping during excavation construction, has been the new factor inducing the land subsidence.
The uneven land subsidence has a big impact on municipal infrastructure, such as subway, flood prevention
wall, highway road, underground pipeline, and so on. China government has carried out a series of measures
to prevent and cure land subsidence, and get highly effective achievement. But land subsidence is very
complicated in mechanics, monitoring and control, we still need to look for the new method and technique to
deeply study land subsidence, and provide the suggestions on the municipal safety.
20
References:
Zhang, Agen, Wei Zinxin, et al. (2005): Land subsidence in China. Shanghai Scientific and Technical
Publishers. (in Chinese)
Wei Zixin (2005): Stress-strain characteristics of the confined aquifer system and land subsidence controlling
countermeasures in Shanghai. The Chinese Journal of Geological Hazard and Control. no.1
Zhu Xing-Xian and Zhu Jin-Qi (1997): Subsidence hazard in Suzhou-Wuxi-Changzhou area and economic
analysis of its damnification expense. Hydrogeology and Engineering Geology. 24(3) .
Gong Shi-Liang (1999): The environmental geological problems and its effects to flood control engineering in
the middle and lower reaches of the Yangtze River. The Chinese Journal of Geological Hazard and Control.
Hou Yan-sheng, Zheng Xian-Xin, and Ying Yu-Fei (2000): Sustainable development strategy and systematic
control on land subsidence in coastal regions of China. Chinese Journal of Geological Hazard and Control
(in Chinese), 11(2).
Zhang Wei-Ran, Duan Zheng-Liang, Zeng Zheng-Qiang (2003): Methods to control or arrest land subsidence
and their economic benefit in Shanghai. Journal of Tongji University.
Ye Weimin, Zhu Hehua and Tang Yiqun (1999): Foundation pits and geological environmental problems
related to excavation in soft clay. Sino-Japan Geotechnical Development, Hongkong.
Wei Zixin (2002): The analysis of stress-strain about 4th confined aquifer in Shanghai.
Wei Zixin and Zeng Zhengqiang (2003): Shanghai flooding and water-logging hazards caused by land
subsidence factor and its long-term impact.
Zhang Agen and Wei Zixin (2002): Past, present and future research on land subsidence in Shanghai City.
Hydrogeology and Engineering Geology.
21
Saltwater Intrusion Issues for Groundwater in the Jakarta Plain
Haryadi Tirtomihardjo Center of Groundwater Resource and Environmental Geology, Geological Agency, Ministry of Energy and Mineral Resources
Abstract: Since the last three decades, intensive groundwater abstraction due to an explosive economic and
population growth in Jakarta area had led to negative impacts, particularly on degradation of groundwater
conditions, both quantity and quality. Degradation of groundwater quantity as shown by lowering of
groundwater heads as affected by large quantity of water pumped from deep aquifer system is the main cause
of the contamination problems, mainly due to increasing of groundwater salinity at the aquifer system that
may related to saltwater intrusion phenomenon. Laboratory analysis of groundwater samples taken in
December 2011 at 18 wells represented for shallow aquifer system and 8 wells represented for deep aquifer
system. Hydrochemical analysis results showed that saltwater intrusion for free groundwater might occur at
some places in North Jakarta area (Ancol, Penjaringan, and Cilincing) and West Jakarta area
(Kapuk-Cengkareng). Meanwhile, saltwater intrusion for artesian groundwater might occur at some places in
North Jakarta area (Pademangan and Penjaringan) and West Jakarta area (Kapuk and surrounding). In future,
comprehensive research is urgently required which is comprising of set-up monitoring system for monitoring
fresh-saline interface movements (monitoring well density, frequences of monitoring, components, and tools),
and also applying transport model for saltwater intrusion in order to decide strategies for controlling saltwater
intrusion.
Keywords: Groundwater abstraction, groundwater quantity, groundwater quality, shallow aquifer system,
deep aquifer system, saltwater intrusion
1. Introduction
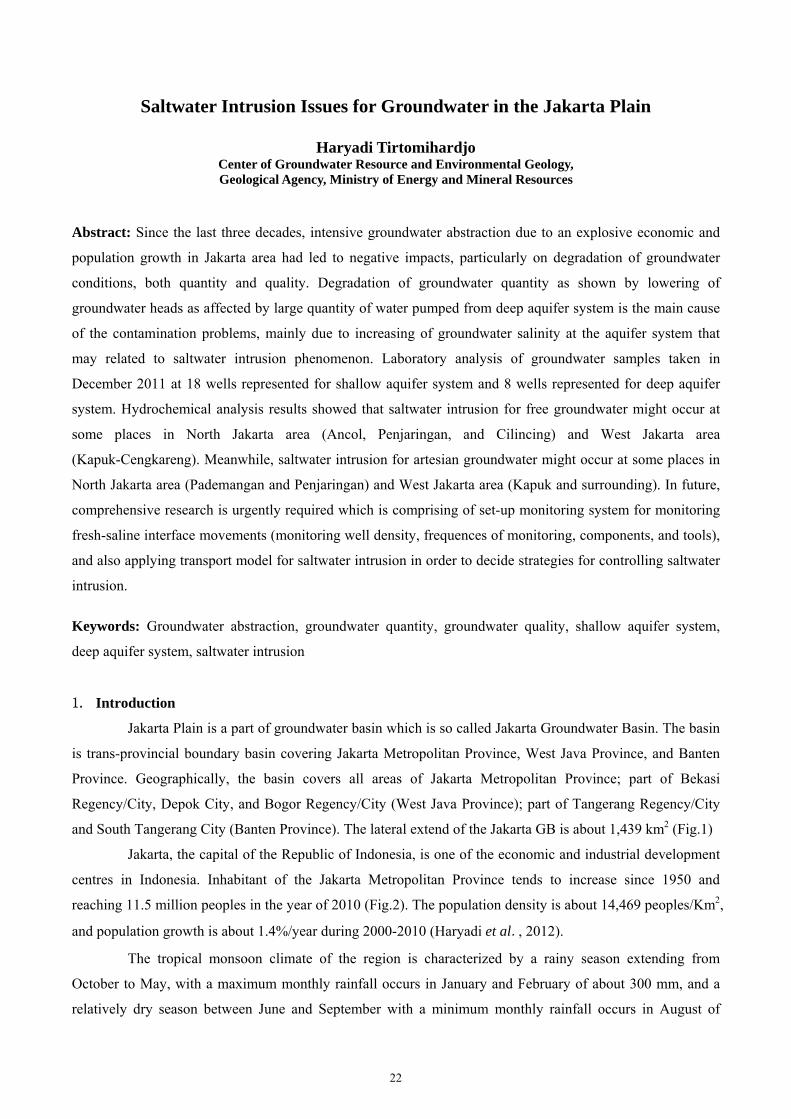
Jakarta Plain is a part of groundwater basin which is so called Jakarta Groundwater Basin. The basin
is trans-provincial boundary basin covering Jakarta Metropolitan Province, West Java Province, and Banten
Province. Geographically, the basin covers all areas of Jakarta Metropolitan Province; part of Bekasi
Regency/City, Depok City, and Bogor Regency/City (West Java Province); part of Tangerang Regency/City
and South Tangerang City (Banten Province). The lateral extend of the Jakarta GB is about 1,439 km2 (Fig.1)
Jakarta, the capital of the Republic of Indonesia, is one of the economic and industrial development
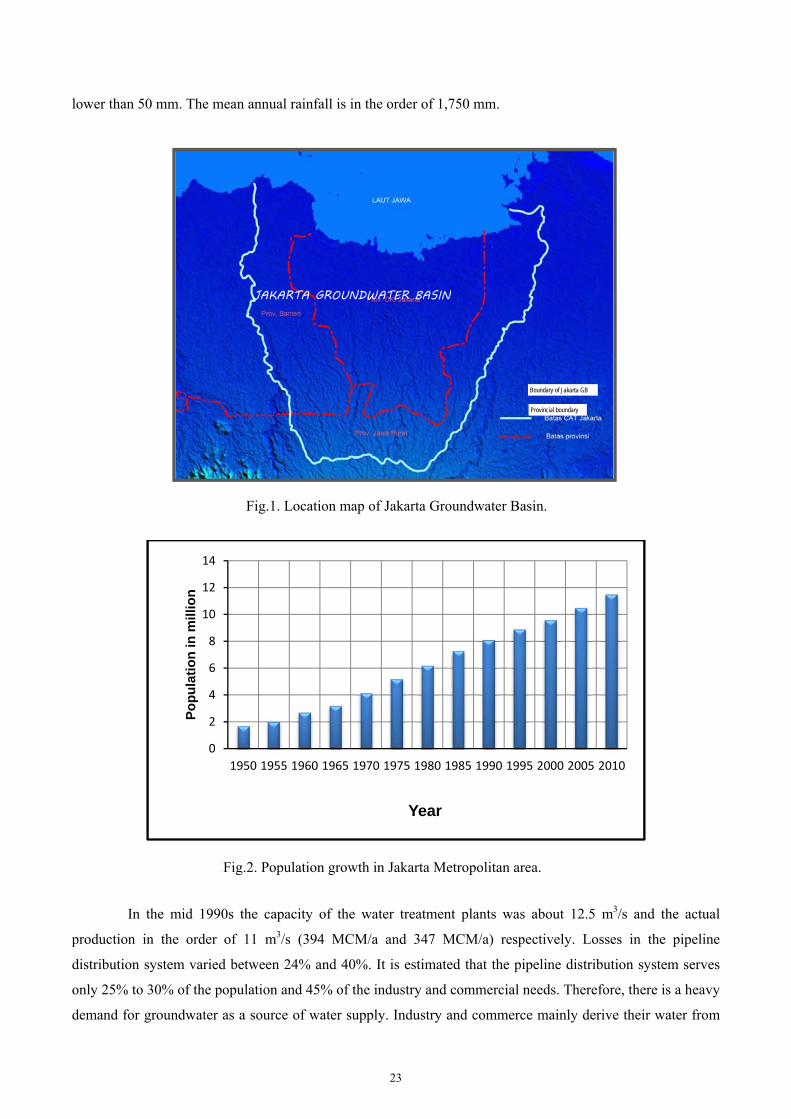
centres in Indonesia. Inhabitant of the Jakarta Metropolitan Province tends to increase since 1950 and
reaching 11.5 million peoples in the year of 2010 (Fig.2). The population density is about 14,469 peoples/Km2,
and population growth is about 1.4%/year during 2000-2010 (Haryadi et al., 2012).
The tropical monsoon climate of the region is characterized by a rainy season extending from
October to May, with a maximum monthly rainfall occurs in January and February of about 300 mm, and a
relatively dry season between June and September with a minimum monthly rainfall occurs in August of
22
lower than 50 mm. The mean annual rainfall is in the order of 1,750 mm.
In the mid 1990s the capacity of the water treatment plants was about 12.5 m3/s and the actual
production in the order of 11 m3/s (394 MCM/a and 347 MCM/a) respectively. Losses in the pipeline
distribution system varied between 24% and 40%. It is estimated that the pipeline distribution system serves
only 25% to 30% of the population and 45% of the industry and commercial needs. Therefore, there is a heavy
demand for groundwater as a source of water supply. Industry and commerce mainly derive their water from
0
2
4
6
8
10
12
14
1950 1955 1960 1965 1970 1975 1980 1985 1990 1995 2000 2005 2010
Po
pu
lati
on
in m
illio
n
Year
Fig.2. Population growth in Jakarta Metropolitan area.
Fig.1. Location map of Jakarta Groundwater Basin.
JAKARTA GROUNDWATER BASIN
Boundary of Jakarta GB
Provincial boundary
23
deep wells. Recorded abstraction from registered deep wells was about 1 m3/s (31.5 MCM) in 1994, but actual
withdrawals are estimated to be in the range 2 to 4 m3/s (63 to 126 MCM/a) (Maathuis et al., 2000).
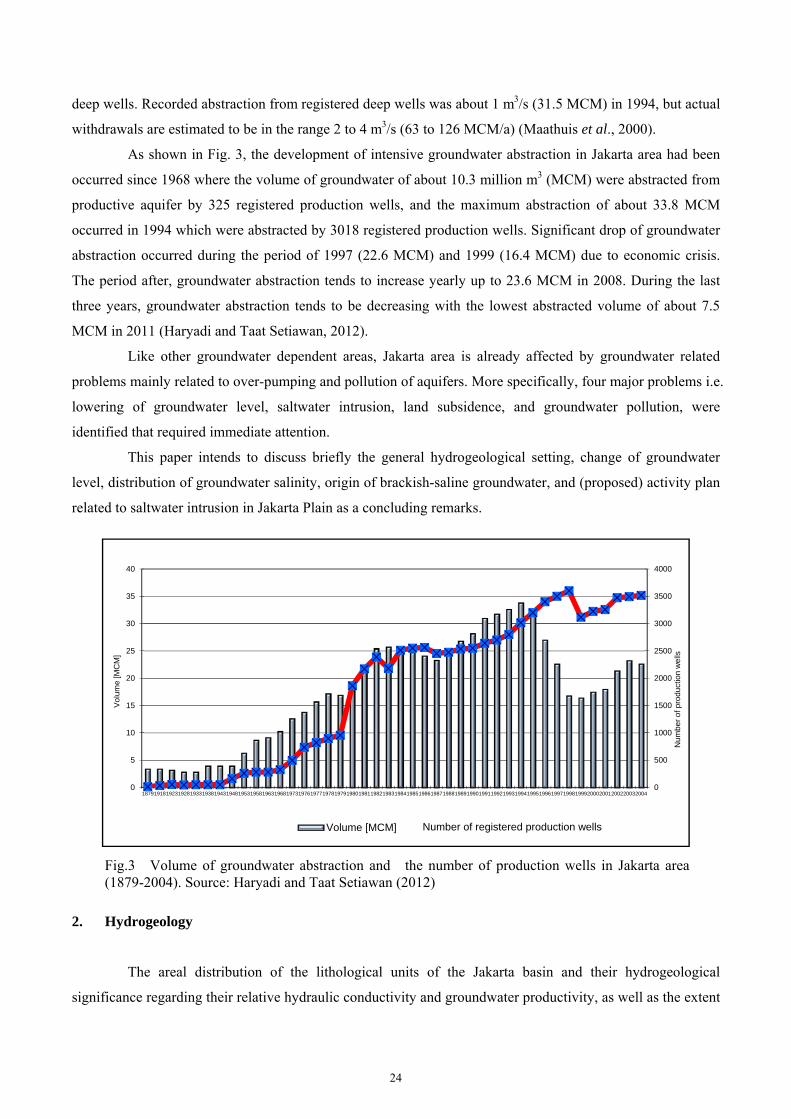
As shown in Fig. 3, the development of intensive groundwater abstraction in Jakarta area had been
occurred since 1968 where the volume of groundwater of about 10.3 million m3 (MCM) were abstracted from
productive aquifer by 325 registered production wells, and the maximum abstraction of about 33.8 MCM
occurred in 1994 which were abstracted by 3018 registered production wells. Significant drop of groundwater
abstraction occurred during the period of 1997 (22.6 MCM) and 1999 (16.4 MCM) due to economic crisis.
The period after, groundwater abstraction tends to increase yearly up to 23.6 MCM in 2008. During the last
three years, groundwater abstraction tends to be decreasing with the lowest abstracted volume of about 7.5
MCM in 2011 (Haryadi and Taat Setiawan, 2012).
Like other groundwater dependent areas, Jakarta area is already affected by groundwater related
problems mainly related to over-pumping and pollution of aquifers. More specifically, four major problems i.e.
lowering of groundwater level, saltwater intrusion, land subsidence, and groundwater pollution, were
identified that required immediate attention.
This paper intends to discuss briefly the general hydrogeological setting, change of groundwater
level, distribution of groundwater salinity, origin of brackish-saline groundwater, and (proposed) activity plan
related to saltwater intrusion in Jakarta Plain as a concluding remarks.
2. Hydrogeology
The areal distribution of the lithological units of the Jakarta basin and their hydrogeological
significance regarding their relative hydraulic conductivity and groundwater productivity, as well as the extent
0
500
1000
1500
2000
2500
3000
3500
4000
0
5
10
15
20
25
30
35
40
187919181923192819331938194319481953195819631968197319761977197819791980198119821983198419851986198719881989199019911992199319941995199619971998199920002001200220032004
Nu
mb
er
of
pro
du
ctio
n w
ells
Vo
lum
e [M
CM
]
Volume [MCM] 系列1Number of registered production wells
Fig.3 Volume of groundwater abstraction and the number of production wells in Jakarta area(1879-2004). Source: Haryadi and Taat Setiawan (2012)
24
of the zone under artesian pressure and zone of heavy groundwater exploitation in the early 1980s are shown
on the Hydrogeological Map of Indonesia, scale 1:250,000, Jakarta Quadrangle (DEG 1986).
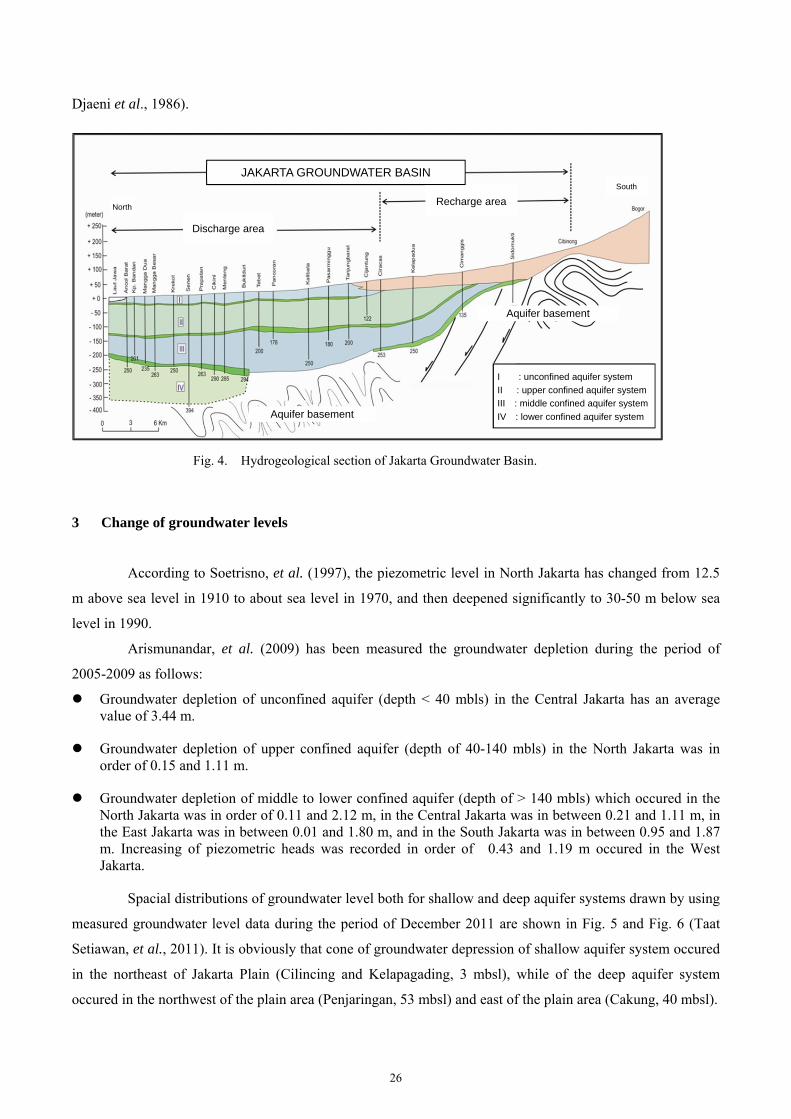
In terms of hydrogeological units, the aquitard formed by the Holocene deposits and the aquifer
formed by the Upper Pleistocene Volcanic Fan deposits are perhaps the only units which can be identified
with some measure of confidence. It is not possible to identify individual aquifer and aquitard units within the
underlying sequence of marine and non-marine Quaternary sediments. Consequently, this sequence forms an
undifferentiated, very complex aquifer-aquitard system. Despite the fact that a classical differentiation
between aquifers and aquitards is not possible, for practical reasons, it has become standard practice to
subdivide the Quaternary sequence into hydrogeological horizons. The hydrogeological horizons that
commonly used are 0-40, 40-140, and 140-250 m below ground level as shown in Fig. 4 (Soekardi, 1987).
The bottom of the aquifer-aquitard system is formed by Miocene sediments which crop out at its
southern boundary. The basin fill consists of Quartenary sediments up to 300 m in thickness. The thickness of
the individual mainly fine-sandy aquifer layers intercalated within a predominantly silty to clayey sequence
ranges from only 1 to 5 m, totalling only some 20% of the entire sequence. The transmissivity of the entire
Quaternary sequence of 250 m thickness is thought to decrease northward from 500 m2/day near the hinge
line to 250 m2/day near the coast. Based on modelling, JWRMS (1994) suggested that the transmissivity
might be less than this by a factor of 2. The mean transmissivity of the Pliocene sequence cropping out in the
western part of the model area is lower than that of the Quaternary sequence. The horizontal hydraulic
conductivity (KH) has a mean value of 1.3 m/day (1.5×10‐5 m/s) ranging from 0.4 to 2.1 m/day (5×10⁻⁶ to
2.5×10⁻⁵ m/s). The vertical hydraulic conductivity (KV) has a mean value of 2×10⁻⁴ m/day (2×10⁻⁹ m/s). Thus,
the an-isotropy factor (KH/KV ratio) is in the order of 5000 for large parts of the aquifer system near the coast.
The KH/KV ratio may amount to 500 or 100 in the uppermost part of the aquifer or in the southern part of the
model area, respectively. The storativity of the deep aquifer system is between 10-4 and 10-6, typical for a
confined aquifer (Soefner et al. 1986, Schmidt & Soehner, 1988).
Under natural flow conditions, the recharge area of the deep aquifer system was situated in the
southern hilly area at altitudes of between 25 to 200 masl. Discharge from the confined aquifer system to the
natural base level of the flat coastal area occurred predominantly by upward leakage, evapotranspiration and
outflow into the surface water system. During the last few decades, recharge into the deep aquifer system,
apart from horizontal inflow, may originate from downward leakage throughout the city, as piezometric heads
of the confined system dropped regionally below that of the water table of the unconfined shallow aquifer.
The shallow aquifer was fully replenished during normal rainfall years at least until 1985. Discharge from the
deep aquifer system in 1985 was almost exclusively maintained by groundwater abstraction by deep wells.
The 1985 groundwater abstraction of 47 MCM/a from the deep aquifer system was not counterbalanced by the
horizontal inflow across the hinge line of an estimated volume of 15 MCM/a and by vertical leakage from the
shallow aquifer. In response to over-exploitation, water levels in the confined deep aquifer system declined by
1 to 7 m/a from 1983 to 1985 and were at -20 to -30 m asl during that period of time (Soefner et al., 1986,
25
Djaeni et al., 1986).
3 Change of groundwater levels
According to Soetrisno, et al. (1997), the piezometric level in North Jakarta has changed from 12.5
m above sea level in 1910 to about sea level in 1970, and then deepened significantly to 30-50 m below sea
level in 1990.
Arismunandar, et al. (2009) has been measured the groundwater depletion during the period of
2005-2009 as follows:
Groundwater depletion of unconfined aquifer (depth < 40 mbls) in the Central Jakarta has an average value of 3.44 m.
Groundwater depletion of upper confined aquifer (depth of 40-140 mbls) in the North Jakarta was in order of 0.15 and 1.11 m.
Groundwater depletion of middle to lower confined aquifer (depth of > 140 mbls) which occured in the North Jakarta was in order of 0.11 and 2.12 m, in the Central Jakarta was in between 0.21 and 1.11 m, in the East Jakarta was in between 0.01 and 1.80 m, and in the South Jakarta was in between 0.95 and 1.87 m. Increasing of piezometric heads was recorded in order of 0.43 and 1.19 m occured in the West Jakarta.
Spacial distributions of groundwater level both for shallow and deep aquifer systems drawn by using
measured groundwater level data during the period of December 2011 are shown in Fig. 5 and Fig. 6 (Taat
Setiawan, et al., 2011). It is obviously that cone of groundwater depression of shallow aquifer system occured
in the northeast of Jakarta Plain (Cilincing and Kelapagading, 3 mbsl), while of the deep aquifer system
occured in the northwest of the plain area (Penjaringan, 53 mbsl) and east of the plain area (Cakung, 40 mbsl).
JAKARTA GROUNDWATER BASIN
Recharge area
Discharge area
North
South
Aquifer basement
Aquifer basement
Fig. 4. Hydrogeological section of Jakarta Groundwater Basin.
I : unconfined aquifer system
II : upper confined aquifer system
III : middle confined aquifer system
IV : lower confined aquifer system
26
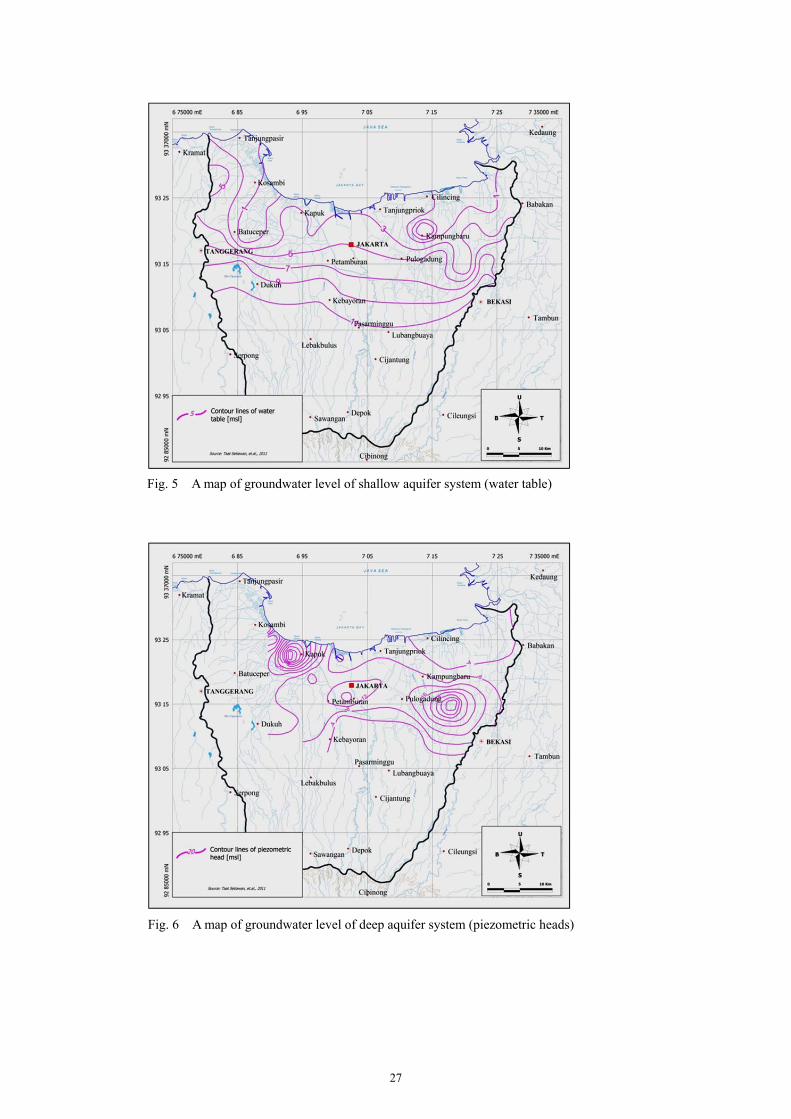
Fig. 5 A map of groundwater level of shallow aquifer system (water table)
Fig. 6 A map of groundwater level of deep aquifer system (piezometric heads)
27
4. Distribution of groundwater salinity
Up till around 1970, a considerable volume of groundwater discharged into the Java Sea since the
hydraulic gradient was predominantly directed towards the coast. After 1970, when major groundwater
development commenced in Jakarta city, the hydraulic gradient reversed and consequently sea water started to
slightly intrude into the aquifer system. The volume of intruding seawater was in the order of 2 MCM per year
in the mid 1980s (Schmidt & Soefner, 1988).
The salinity of shallow groundwater gradually increases from below 500 μS/cm in the south up to
2,500 μS/cm in the north in the general direction of groundwater flow. In the coastal zone, the salinity of
groundwater may rise up to 10,000 μS/cm. The Ca-Na-HCO3 water type prevails, gradually changing to the
Na-Cl water type with increasing salinity.
Within the confined aquifer system, three zones of deep groundwater quality may be distinguished:
1. low groundwater salinity (EC < 500 μS/cm) and predominance of bicarbonate in the south,
2. intermediate groundwater salinity (EC: 500-1,500 μS/cm) and Na-HCO3 water type within a small zone
between latitude 93.15 an 93.20 in central Jakarta,
3. highly variable groundwater salinity in the coastal zone:
brackish groundwater with chloride predominance at depths above -100 m asl,
relatively fresh groundwater with EC ranging from 500-1,500 μS/cm and Na-HCO3 water type at depths of
between -100 to -200 masl, groundwater with increasing salinity (EC>1,500 μS/cm) at depths below -200
masl.
Taat Setiawan, et al., (2011) had been delineated the distribution of groundwater salinity both for
free groundwater (at shallow aquifer system, depth 0-40 mbls) and artesian groundwater (at deep aquifer
system, depth 40-140 mbls) based on electrical conductivity (EC) of the water, total dissolved solids (TDS)
and chloride content (Cl-) within the water.
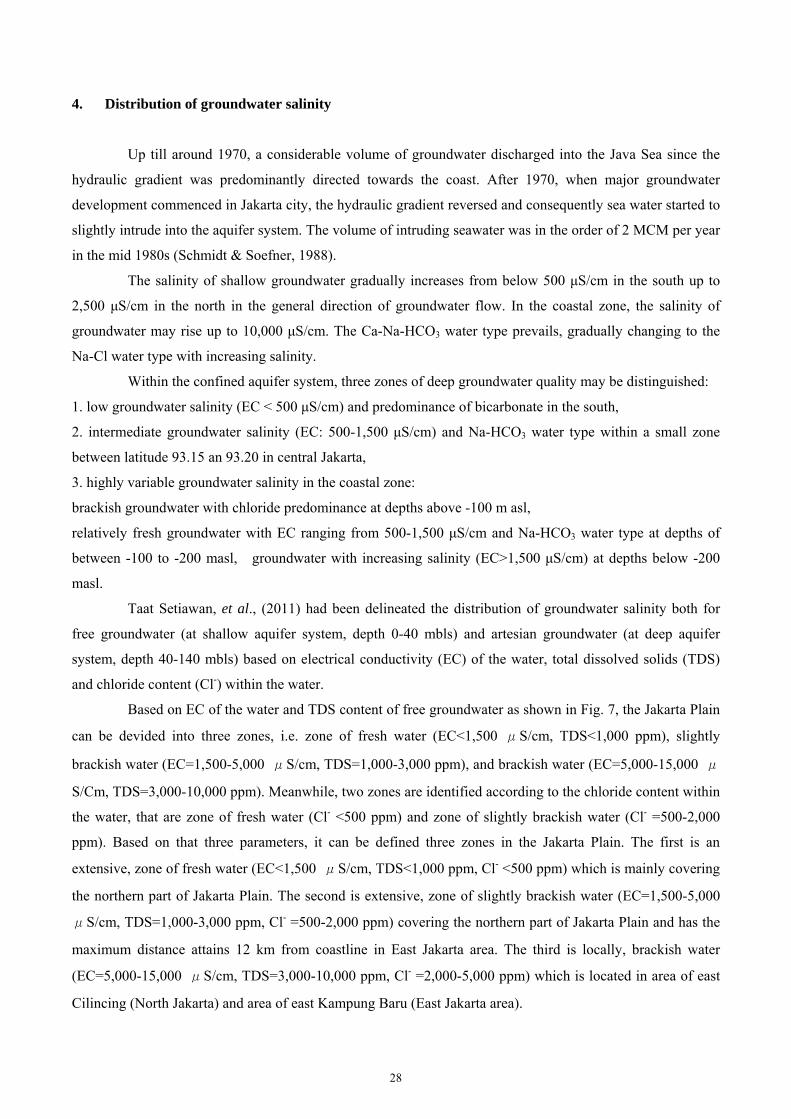
Based on EC of the water and TDS content of free groundwater as shown in Fig. 7, the Jakarta Plain
can be devided into three zones, i.e. zone of fresh water (EC<1,500 μS/cm, TDS<1,000 ppm), slightly
brackish water (EC=1,500-5,000 μS/cm, TDS=1,000-3,000 ppm), and brackish water (EC=5,000-15,000 μ
S/Cm, TDS=3,000-10,000 ppm). Meanwhile, two zones are identified according to the chloride content within
the water, that are zone of fresh water (Cl- <500 ppm) and zone of slightly brackish water (Cl- =500-2,000
ppm). Based on that three parameters, it can be defined three zones in the Jakarta Plain. The first is an
extensive, zone of fresh water (EC<1,500 μS/cm, TDS<1,000 ppm, Cl- <500 ppm) which is mainly covering
the northern part of Jakarta Plain. The second is extensive, zone of slightly brackish water (EC=1,500-5,000
μS/cm, TDS=1,000-3,000 ppm, Cl- =500-2,000 ppm) covering the northern part of Jakarta Plain and has the
maximum distance attains 12 km from coastline in East Jakarta area. The third is locally, brackish water
(EC=5,000-15,000 μS/cm, TDS=3,000-10,000 ppm, Cl- =2,000-5,000 ppm) which is located in area of east
Cilincing (North Jakarta) and area of east Kampung Baru (East Jakarta area).
28
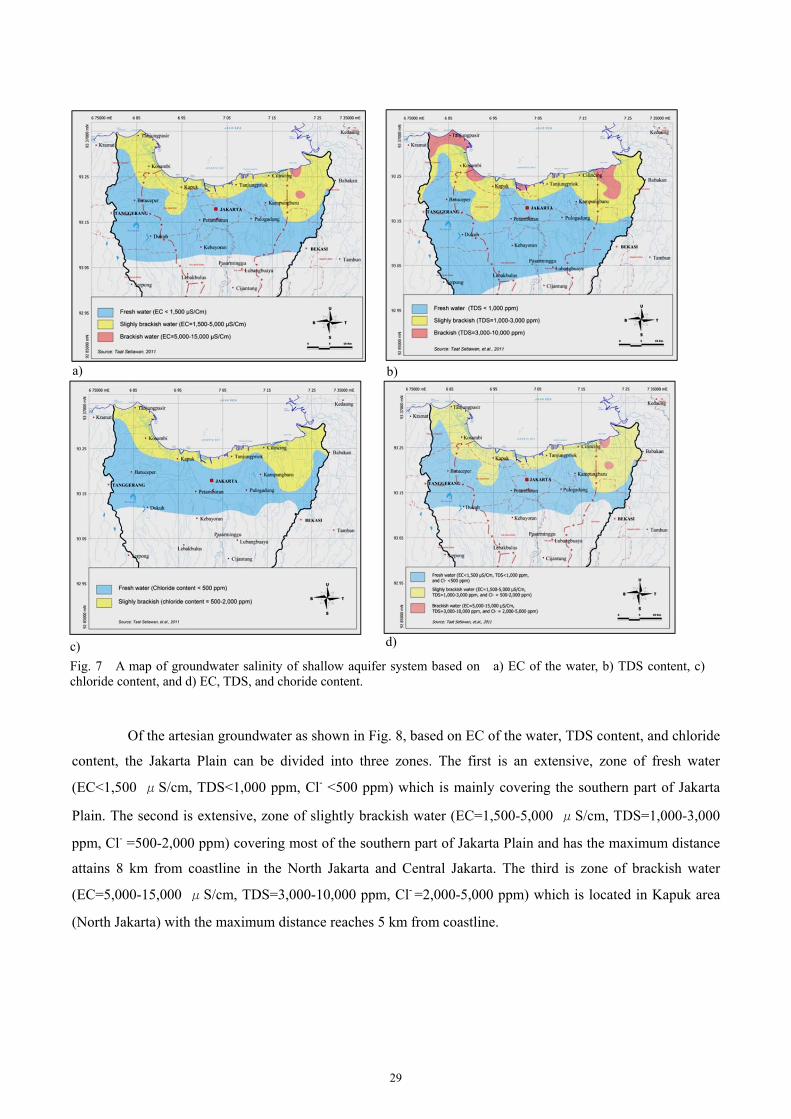
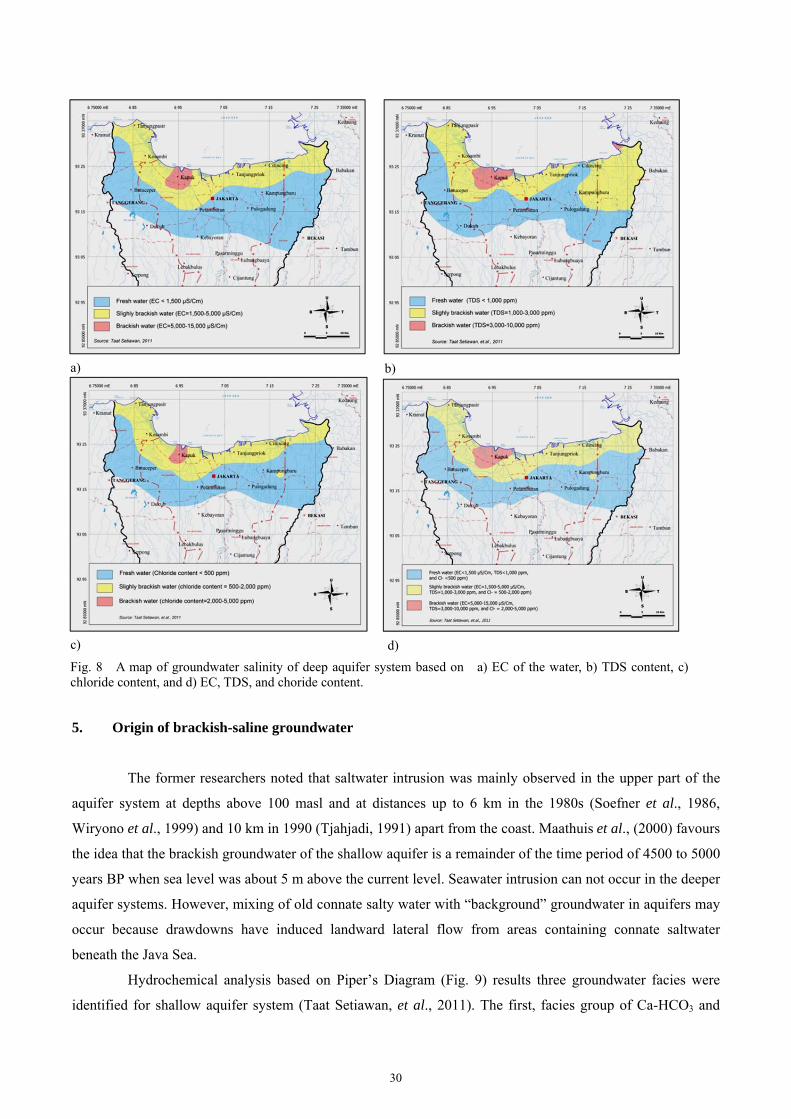
Of the artesian groundwater as shown in Fig. 8, based on EC of the water, TDS content, and chloride
content, the Jakarta Plain can be divided into three zones. The first is an extensive, zone of fresh water
(EC<1,500 μS/cm, TDS<1,000 ppm, Cl- <500 ppm) which is mainly covering the southern part of Jakarta
Plain. The second is extensive, zone of slightly brackish water (EC=1,500-5,000 μS/cm, TDS=1,000-3,000
ppm, Cl- =500-2,000 ppm) covering most of the southern part of Jakarta Plain and has the maximum distance
attains 8 km from coastline in the North Jakarta and Central Jakarta. The third is zone of brackish water
(EC=5,000-15,000 μS/cm, TDS=3,000-10,000 ppm, Cl- =2,000-5,000 ppm) which is located in Kapuk area
(North Jakarta) with the maximum distance reaches 5 km from coastline.
Fig. 7 A map of groundwater salinity of shallow aquifer system based on a) EC of the water, b) TDS content, c) chloride content, and d) EC, TDS, and choride content.
a) b)
c) d)
29
5. Origin of brackish-saline groundwater
The former researchers noted that saltwater intrusion was mainly observed in the upper part of the
aquifer system at depths above 100 masl and at distances up to 6 km in the 1980s (Soefner et al., 1986,
Wiryono et al., 1999) and 10 km in 1990 (Tjahjadi, 1991) apart from the coast. Maathuis et al., (2000) favours
the idea that the brackish groundwater of the shallow aquifer is a remainder of the time period of 4500 to 5000
years BP when sea level was about 5 m above the current level. Seawater intrusion can not occur in the deeper
aquifer systems. However, mixing of old connate salty water with “background” groundwater in aquifers may
occur because drawdowns have induced landward lateral flow from areas containing connate saltwater
beneath the Java Sea.
Hydrochemical analysis based on Piper’s Diagram (Fig. 9) results three groundwater facies were
identified for shallow aquifer system (Taat Setiawan, et al., 2011). The first, facies group of Ca-HCO3 and
a) b)
c) d)
Fig. 8 A map of groundwater salinity of deep aquifer system based on a) EC of the water, b) TDS content, c) chloride content, and d) EC, TDS, and choride content.
30
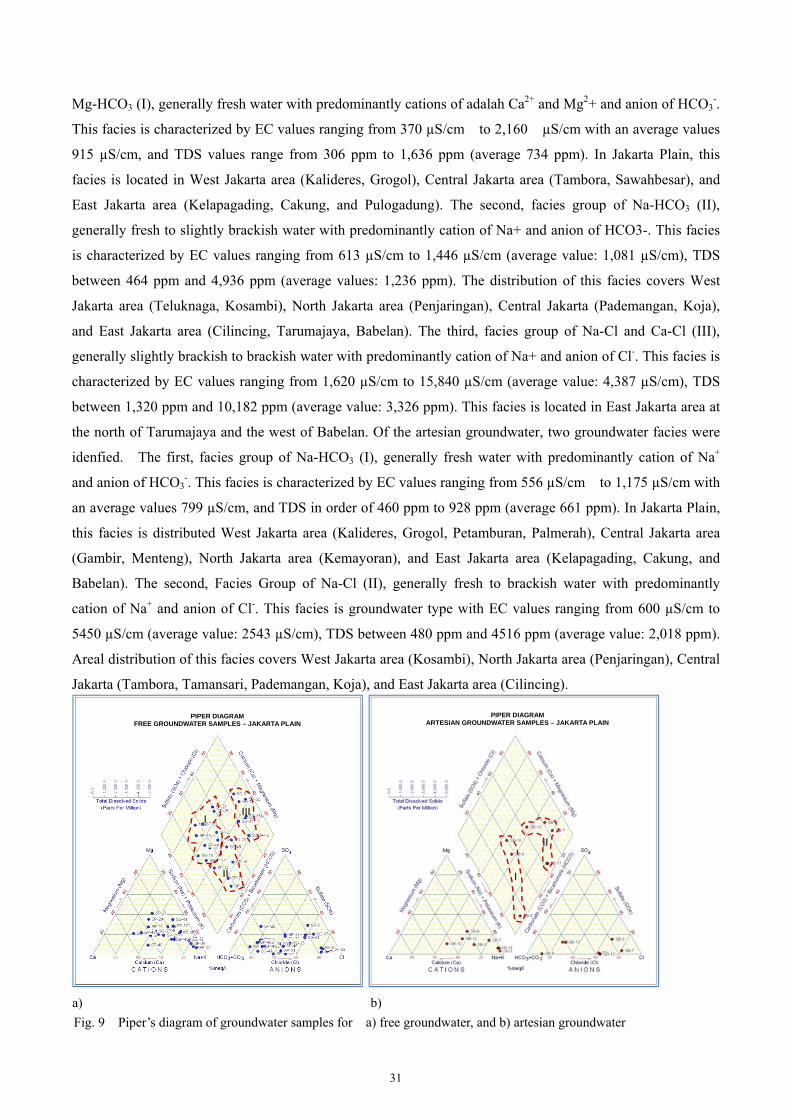
Mg-HCO3 (I), generally fresh water with predominantly cations of adalah Ca2+ and Mg2+ and anion of HCO3-.
This facies is characterized by EC values ranging from 370 µS/cm to 2,160 µS/cm with an average values
915 µS/cm, and TDS values range from 306 ppm to 1,636 ppm (average 734 ppm). In Jakarta Plain, this
facies is located in West Jakarta area (Kalideres, Grogol), Central Jakarta area (Tambora, Sawahbesar), and
East Jakarta area (Kelapagading, Cakung, and Pulogadung). The second, facies group of Na-HCO3 (II),
generally fresh to slightly brackish water with predominantly cation of Na+ and anion of HCO3-. This facies
is characterized by EC values ranging from 613 µS/cm to 1,446 µS/cm (average value: 1,081 µS/cm), TDS
between 464 ppm and 4,936 ppm (average values: 1,236 ppm). The distribution of this facies covers West
Jakarta area (Teluknaga, Kosambi), North Jakarta area (Penjaringan), Central Jakarta (Pademangan, Koja),
and East Jakarta area (Cilincing, Tarumajaya, Babelan). The third, facies group of Na-Cl and Ca-Cl (III),
generally slightly brackish to brackish water with predominantly cation of Na+ and anion of Cl-. This facies is
characterized by EC values ranging from 1,620 µS/cm to 15,840 µS/cm (average value: 4,387 µS/cm), TDS
between 1,320 ppm and 10,182 ppm (average value: 3,326 ppm). This facies is located in East Jakarta area at
the north of Tarumajaya and the west of Babelan. Of the artesian groundwater, two groundwater facies were
idenfied. The first, facies group of Na-HCO3 (I), generally fresh water with predominantly cation of Na+
and anion of HCO3-. This facies is characterized by EC values ranging from 556 µS/cm to 1,175 µS/cm with
an average values 799 µS/cm, and TDS in order of 460 ppm to 928 ppm (average 661 ppm). In Jakarta Plain,
this facies is distributed West Jakarta area (Kalideres, Grogol, Petamburan, Palmerah), Central Jakarta area
(Gambir, Menteng), North Jakarta area (Kemayoran), and East Jakarta area (Kelapagading, Cakung, and
Babelan). The second, Facies Group of Na-Cl (II), generally fresh to brackish water with predominantly
cation of Na+ and anion of Cl-. This facies is groundwater type with EC values ranging from 600 µS/cm to
5450 µS/cm (average value: 2543 µS/cm), TDS between 480 ppm and 4516 ppm (average value: 2,018 ppm).
Areal distribution of this facies covers West Jakarta area (Kosambi), North Jakarta area (Penjaringan), Central
Jakarta (Tambora, Tamansari, Pademangan, Koja), and East Jakarta area (Cilincing).
PIPER DIAGRAMARTESIAN GROUNDWATER SAMPLES – JAKARTA PLAIN
PIPER DIAGRAMFREE GROUNDWATER SAMPLES – JAKARTA PLAIN
a) b)
Fig. 9 Piper’s diagram of groundwater samples for a) free groundwater, and b) artesian groundwater
I
II
III
III
31
According to Mandel, S. and Shiftan, Z.L. (1981), hydrochemical interpretation for saline
groundwater is not really easy due to related processes causing saline groundwater. The most simply
application of ratio of some ions (in meq/l) that can be used for interpretation of hydrochemical process within
the groundwater. Some methods related to degree of groundwater salinity are ratio of Na/Cl and ratio of
Cl/(CO3+HCO3).
Revelle (1941) stated that R=Cl/(CO3+HCO3) in relation with identifying saltwater intrusion is
shown in Table 1.
Table 1 Relationship between R and degree of saltwater intrusion
R value Degree of saltwater intrusion < 0.5 Fresh water
0.5 – 1.3 Slightly saltwater intrusion 1.3 – 2.8 Moderately saltwater intrusion 2.8 – 6.6 Slightly high saltwater intrusion
6.6 – 15.5 High saltwater intrusion 15.5 – 20 Seawater
Based on ratio of Na/Cl, Mandel and Shiftan (1981) subdivides into two category, i.e groundwater
with Na/Cl > 1 indicates ion exchange process where Ca and Mg substituted by Na, whereas Na/Cl < 1
indicates mixing process between seawater and fresh water which is commonly taken place in coastal aquifer
system or that is of seawater intrusion process.
Based on the above two ratio methods and measured values of EC of the water, TDS and chloride
contents within the water, interpretation of saltwater intrusion taken place in Jakarta Plain is shown as in
Table 2.
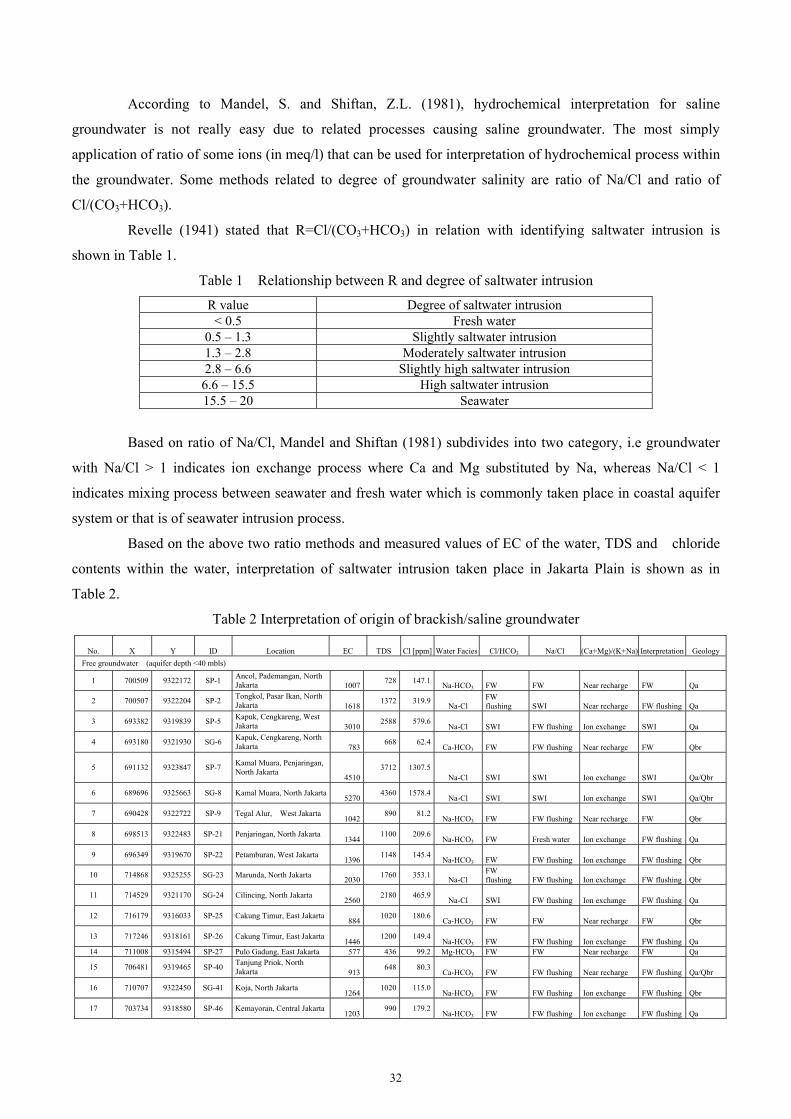
Table 2 Interpretation of origin of brackish/saline groundwater
No. X Y ID Location EC TDS Cl [ppm] Water Facies Cl/HCO3 Na/Cl (Ca+Mg)/(K+Na) Interpretation Geology
Free groundwater (aquifer depth <40 mbls)
1 700509 9322172 SP-1 Ancol, Pademangan, North Jakarta 1007
728 147.1Na-HCO3 FW FW Near recharge FW Qa
2 700507 9322204 SP-2 Tongkol, Pasar Ikan, North Jakarta 1618
1372 319.9Na-Cl
FW flushing SWI Near recharge FW flushing Qa
3 693382 9319839 SP-5 Kapuk, Cengkareng, West Jakarta 3010
2588 579.6Na-Cl SWI FW flushing Ion exchange SWI Qa
4 693180 9321930 SG-6 Kapuk, Cengkareng, North Jakarta 783
668 62.4Ca-HCO3 FW FW flushing Near recharge FW Qbr
5 691132 9323847 SP-7 Kamal Muara, Penjaringan, North Jakarta
45103712 1307.5
Na-Cl SWI SWI Ion exchange SWI Qa/Qbr
6 689696 9325663 SG-8 Kamal Muara, North Jakarta 5270
4360 1578.4Na-Cl SWI SWI Ion exchange SWI Qa/Qbr
7 690428 9322722 SP-9 Tegal Alur, West Jakarta 1042
890 81.2Na-HCO3 FW FW flushing Near recharge FW Qbr
8 698513 9322483 SP-21 Penjaringan, North Jakarta 1344
1100 209.6Na-HCO3 FW Fresh water Ion exchange FW flushing Qa
9 696349 9319670 SP-22 Petamburan, West Jakarta 1396
1148 145.4Na-HCO3 FW FW flushing Ion exchange FW flushing Qbr
10 714868 9325255 SG-23 Marunda, North Jakarta 2030
1760 353.1Na-Cl
FW flushing FW flushing Ion exchange FW flushing Qbr
11 714529 9321170 SG-24 Cilincing, North Jakarta 2560
2180 465.9Na-Cl SWI FW flushing Ion exchange FW flushing Qa
12 716179 9316033 SP-25 Cakung Timur, East Jakarta 884
1020 180.6Ca-HCO3 FW FW Near recharge FW Qbr
13 717246 9318161 SP-26 Cakung Timur, East Jakarta 1446
1200 149.4Na-HCO3 FW FW flushing Ion exchange FW flushing Qa
14 711008 9315494 SP-27 Pulo Gadung, East Jakarta 577 436 99.2 Mg-HCO3 FW FW Near recharge FW Qa
15 706481 9319465 SP-40 Tanjung Priok, North Jakarta 913
648 80.3Ca-HCO3 FW FW flushing Near recharge FW flushing Qa/Qbr
16 710707 9322450 SG-41 Koja, North Jakarta 1264
1020 115.0Na-HCO3 FW FW flushing Ion exchange FW flushing Qbr
17 703734 9318580 SP-46 Kemayoran, Central Jakarta 1203
990 179.2Na-HCO3 FW FW flushing Ion exchange FW flushing Qa
32
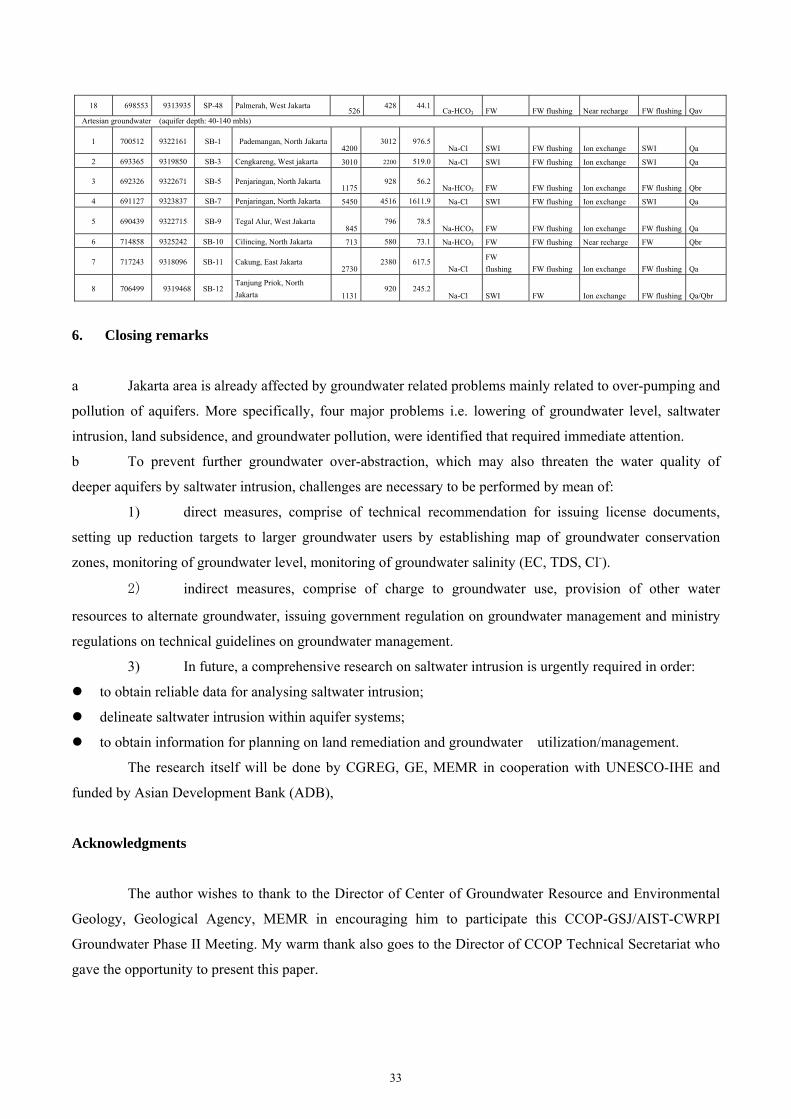
18 698553 9313935 SP-48 Palmerah, West Jakarta 526
428 44.1Ca-HCO3 FW FW flushing Near recharge FW flushing Qav
Artesian groundwater (aquifer depth: 40-140 mbls)
1 700512 9322161 SB-1 Pademangan, North Jakarta4200
3012 976.5Na-Cl SWI FW flushing Ion exchange SWI Qa
2 693365 9319850 SB-3 Cengkareng, West jakarta 3010 2200 519.0 Na-Cl SWI FW flushing Ion exchange SWI Qa
3 692326 9322671 SB-5 Penjaringan, North Jakarta 1175
928 56.2Na-HCO3 FW FW flushing Ion exchange FW flushing Qbr
4 691127 9323837 SB-7 Penjaringan, North Jakarta 5450 4516 1611.9 Na-Cl SWI FW flushing Ion exchange SWI Qa
5 690439 9322715 SB-9 Tegal Alur, West Jakarta 845
796 78.5Na-HCO3 FW FW flushing Ion exchange FW flushing Qa
6 714858 9325242 SB-10 Cilincing, North Jakarta 713 580 73.1 Na-HCO3 FW FW flushing Near recharge FW Qbr
7 717243 9318096 SB-11 Cakung, East Jakarta 2730
2380 617.5Na-Cl
FW
flushing FW flushing Ion exchange FW flushing Qa
8 706499 9319468 SB-12 Tanjung Priok, North
Jakarta 1131920 245.2
Na-Cl SWI FW Ion exchange FW flushing Qa/Qbr
6. Closing remarks
a Jakarta area is already affected by groundwater related problems mainly related to over-pumping and
pollution of aquifers. More specifically, four major problems i.e. lowering of groundwater level, saltwater
intrusion, land subsidence, and groundwater pollution, were identified that required immediate attention.
b To prevent further groundwater over-abstraction, which may also threaten the water quality of
deeper aquifers by saltwater intrusion, challenges are necessary to be performed by mean of:
1) direct measures, comprise of technical recommendation for issuing license documents,
setting up reduction targets to larger groundwater users by establishing map of groundwater conservation
zones, monitoring of groundwater level, monitoring of groundwater salinity (EC, TDS, Cl-).
2) indirect measures, comprise of charge to groundwater use, provision of other water
resources to alternate groundwater, issuing government regulation on groundwater management and ministry
regulations on technical guidelines on groundwater management.
3) In future, a comprehensive research on saltwater intrusion is urgently required in order:
to obtain reliable data for analysing saltwater intrusion;
delineate saltwater intrusion within aquifer systems;
to obtain information for planning on land remediation and groundwater utilization/management.
The research itself will be done by CGREG, GE, MEMR in cooperation with UNESCO-IHE and
funded by Asian Development Bank (ADB),
Acknowledgments
The author wishes to thank to the Director of Center of Groundwater Resource and Environmental
Geology, Geological Agency, MEMR in encouraging him to participate this CCOP-GSJ/AIST-CWRPI
Groundwater Phase II Meeting. My warm thank also goes to the Director of CCOP Technical Secretariat who
gave the opportunity to present this paper.
33
References
Arismunandar dan Arief, S. (2009): Penyelidikan konservasi air tanah Cekungan Air Tanah Jakarta. Pusat
Lingkungan Geologi, Bandung.
Bemmelen, R. W., van (1949): The Geology of Indonesia, Government Printing Office, The Hague, 732 p.
Shivakoti, B.R. (2013): Summary of Inception Meeting of the Project - Comparative Research of
Groundwater Management in the Coastal Areas in Southeast Asia, Strategies (IGES) – Groundwater
Knowledge Hub, Japan.
Hadipurwo,S. (1999): Groundwater in coastplan Jakarta Bay Project, Coastal Environmental Geology of the
Jakarta Reclamation Project and Adjacent Areas, CCOP COASTPLAN Case Study Report, no. 2,
Jakarta/Bangkok, pp. 39 - 49.
Haryadi, T. and Taat Setiawan (2012): Groundwater study in Jakarta coastal area, inception workshop on
comparative rearch of groundwater management in the coastal areas in Southeast Asia, UNESCO-IHE,
Delft, The Netherlands.
Maathuis, H., Yong, R.N, Adi, S., Prawiradisastra, S. (1996): Development of groundwater management
strategies in the coastal region of Jakarta, Indonesia. International Development Research Centre, Ottawa,
Canada.
Matahelumual, B.C., and Dadi Harnandi (2010): Pemantauan kuantitas dan kualitas air tanah di Cekungan Air
Tanah Jakarta, Badan Geologi.
Poespowardoyo, S. (1986): Hydrogeological map of Jakarta Quadrangle scale 1:250,000, Directorate of
Envireonmental Geology, Bandung.
Schmidt, G., Haryadi, T., and Koehler, G. (1985): Jakarta Groundwater Study – Groundwater Modeling,
Volume 7 (HAG 116), Directorate of Environmental Geology (Bandung) – Federal Institute of
Geosciences and Natural Resources (Hannover).
Setiawan, T., Wayan Mudiana, dan Matahelumual, B.C. (2011): Penelitian intrusi air laut daerah pantai utara
pada CAT Jakarta dan CAT Bekasi-Karawang Pusat Sumber Daya Tanah dan Geologi Lingkungan,
Bandung.
Turkandi, T., Sidarto, D.A., Agustiyanto, dan Purbohadiwidjo (1992): Peta geologi skala 1:100.000 Lembar
Jakarta dan Kepulauan Seribu Pusat Penelitian dan Pengembangan Geologi, Bandung.
Wandowo (2000): Natural isotope technology for evaluating of hydrodynamic of groundwater – study on
recharge and seawater intrusion in Jakarta area National Nuclear Agency, Jakarta.
Schmidt, G. and Butkuss (2004): Groundwater Modeling in the Greater Jakarta Area, Indonesia Symposium
CCOP, Tsukuba, Japan.
Shaw, E.M. (1983): Hydrology in Practice, Van Nostrand Reinhold (UK)
Soekardi, P. (1986): Peta Hidrogeologi Indonesia Skala 1:250.000, Lembar Jakarta Direktorat Geologi Tata
Lingkungan, Bandung.
34
Hydro-Environmental Groundwater Survey in the Kanto Plain, Japan
Youhei Uchida
Geological Survey of Japan, AIST
Abstract: The Kanto Plain is the largest plain in Japan and there are a lot of large cities such as Tokyo.
Groundwater in the Kanto Plain has been used since the 20th century. There were some studies of
groundwater flow system in the Kanto Plain, but almost all of studies was treated only in the local part of the
Kanto Plain, not the whole area of it. The purpose of this study is to clarify the regional groundwater flow
system of the Kanto Plain from the distribution of the hydraulic heads and the subsurface temperature.
1. Introduction
One of main tasks of the Groundwater Research Group, Geological Survey of Japan, AIST is to
publish a series of the water environment map of Japan. In this map series, we especially attempt to apply a
multi-tracer technique to analyze regional groundwater flow systems. The technique is based on the data
combination of groundwater level, water chemistry (quality), stable isotopes and subsurface ground
temperature as tracers. Although each tracer has both advantages and disadvantages in water flow analysis,
application of multiple tracers may compensate disadvantages of each tracer.
The Kanto Plain is the largest plain in Japan and there are a lot of large cities such as Tokyo.
Groundwater in the Kanto Plain has been used especially since the 20th century. There are some studies of
groundwater flow system in the Kanto Plain, but all of studies is limited only in a small part of the Kanto
Plain, not the whole area of it. This report showed the previous studies (Miyakoshi et al., 2003; Geological
Survey of Japan, AIST, 2005) that clarified the regional groundwater flow system of the Kanto Plain from the
distribution of the hydraulic heads and the subsurface temperature.
2. Groundwater flow system and their subsurface thermal regime
It is known that subsurface temperature distribution is generally affected not only by thermal
conduction but also by advection owing to groundwater flow (Uchida et al., 2003). The effect of thermal
advection is especially large in a shallow sedimentary layer with high groundwater flux.
Groundwater temperature measured in the observation well is assumed to be identical to
subsurface temperature, because there exists thermal equilibrium between the water in a borehole
and its surrounding subsurface layers. Temperature profiles are one-dimensional sequential data
arrays so that areally-distributed temperature profiles provide three-dimensional subsurface
information. Fig.1 shows groundwater flow system and subsurface thermal regime (modified from
Domenico and Palciauskas, 1973). If there is no groundwater flow or a static groundwater
condition (Fig.1a), subsurface thermal regime is governed only by thermal conduction and
35
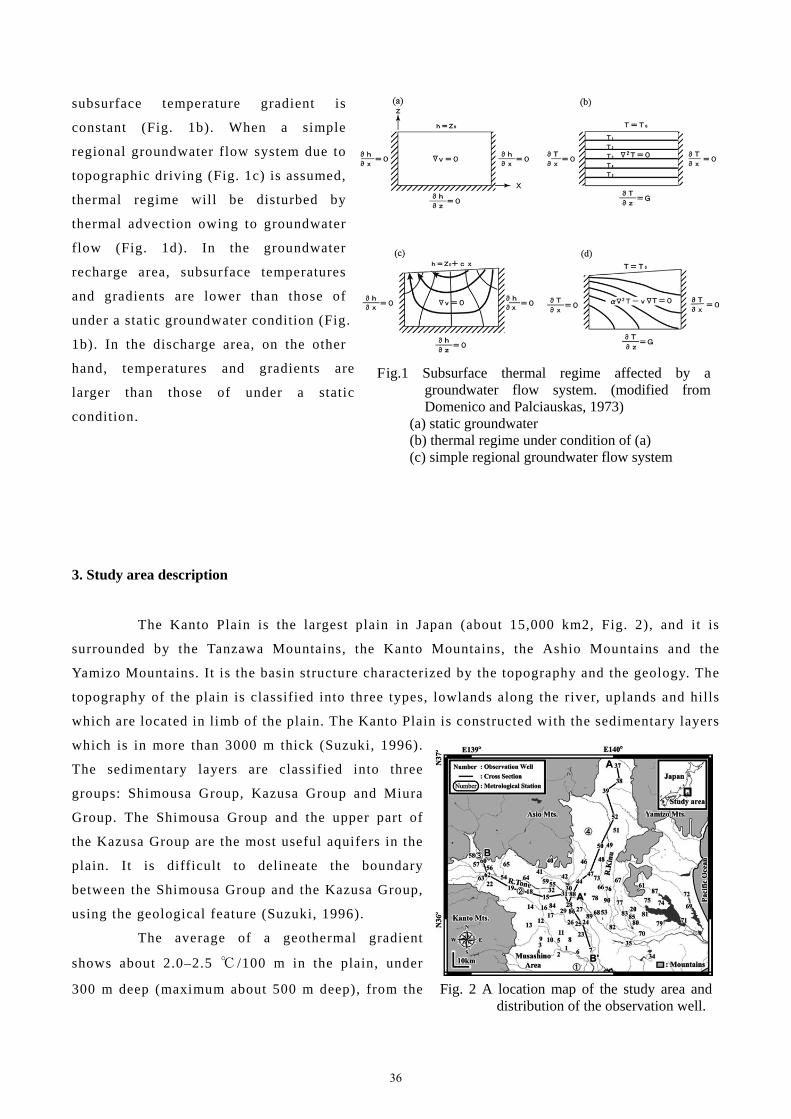
subsurface temperature gradient is
constant (Fig. 1b). When a simple
regional groundwater flow system due to
topographic driving (Fig. 1c) is assumed,
thermal regime will be disturbed by
thermal advection owing to groundwater
flow (Fig. 1d). In the groundwater
recharge area, subsurface temperatures
and gradients are lower than those of
under a static groundwater condition (Fig.
1b). In the discharge area, on the other
hand, temperatures and gradients are
larger than those of under a static
condition.
3. Study area description
The Kanto Plain is the largest plain in Japan (about 15,000 km2, Fig. 2), and it is
surrounded by the Tanzawa Mountains, the Kanto Mountains, the Ashio Mountains and the
Yamizo Mountains. It is the basin structure characterized by the topography and the geology. The
topography of the plain is classified into three types, lowlands along the river, uplands and hills
which are located in limb of the plain. The Kanto Plain is constructed with the sedimentary layers
which is in more than 3000 m thick (Suzuki, 1996).
The sedimentary layers are classified into three
groups: Shimousa Group, Kazusa Group and Miura
Group. The Shimousa Group and the upper part of
the Kazusa Group are the most useful aquifers in the
plain. It is difficult to delineate the boundary
between the Shimousa Group and the Kazusa Group,
using the geological feature (Suzuki, 1996).
The average of a geothermal gradient
shows about 2.0–2.5 ℃ /100 m in the plain, under
300 m deep (maximum about 500 m deep), from the Fig. 2 A location map of the study area anddistribution of the observation well.
Fig.1 Subsurface thermal regime affected by a groundwater flow system. (modified from Domenico and Palciauskas, 1973)
(a) static groundwater (b) thermal regime under condition of (a) (c) simple regional groundwater flow system
36
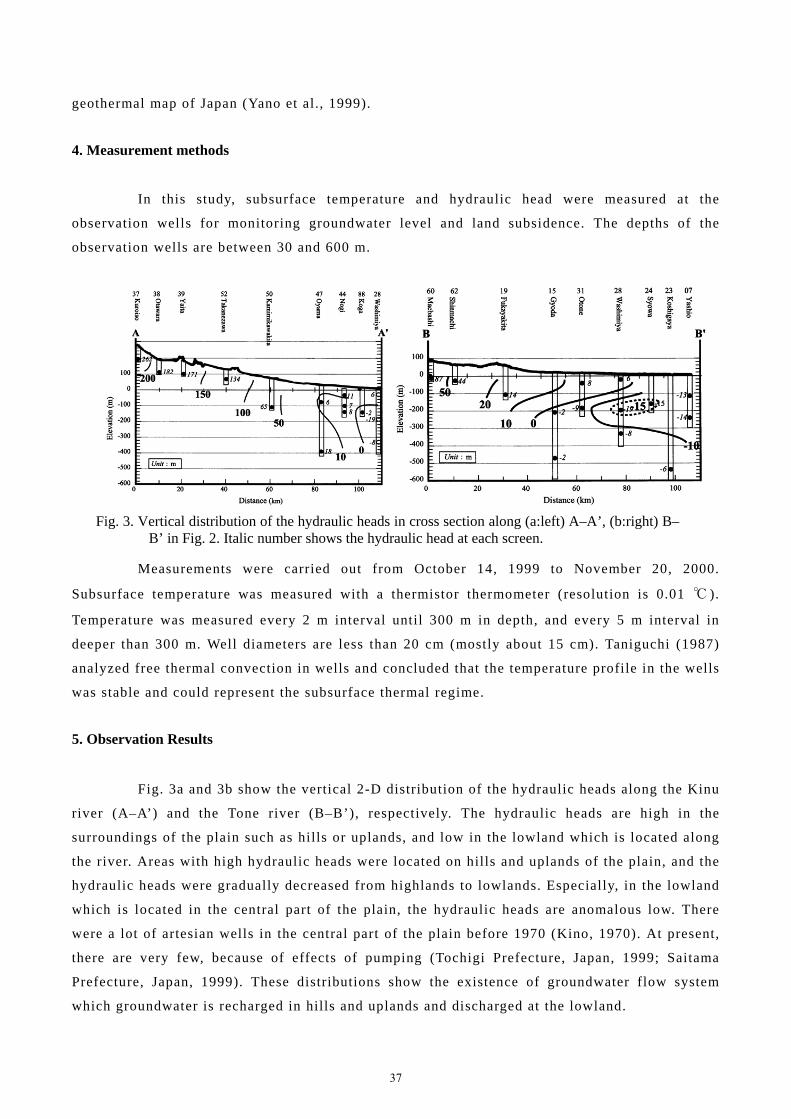
geothermal map of Japan (Yano et al., 1999).
4. Measurement methods
In this study, subsurface temperature and hydraulic head were measured at the
observation wells for monitoring groundwater level and land subsidence. The depths of the
observation wells are between 30 and 600 m.
Measurements were carried out from October 14, 1999 to November 20, 2000.
Subsurface temperature was measured with a thermistor thermometer (resolution is 0.01 ℃ ).
Temperature was measured every 2 m interval until 300 m in depth, and every 5 m interval in
deeper than 300 m. Well diameters are less than 20 cm (mostly about 15 cm). Taniguchi (1987)
analyzed free thermal convection in wells and concluded that the temperature profile in the wells
was stable and could represent the subsurface thermal regime.
5. Observation Results
Fig. 3a and 3b show the vertical 2-D distribution of the hydraulic heads along the Kinu
river (A–A’) and the Tone river (B–B’), respectively. The hydraulic heads are high in the
surroundings of the plain such as hills or uplands, and low in the lowland which is located along
the river. Areas with high hydraulic heads were located on hills and uplands of the plain, and the
hydraulic heads were gradually decreased from highlands to lowlands. Especially, in the lowland
which is located in the central part of the plain, the hydraulic heads are anomalous low. There
were a lot of artesian wells in the central part of the plain before 1970 (Kino, 1970). At present,
there are very few, because of effects of pumping (Tochigi Prefecture, Japan, 1999; Saitama
Prefecture, Japan, 1999). These distributions show the existence of groundwater flow system
which groundwater is recharged in hills and uplands and discharged at the lowland.
Fig. 3. Vertical distribution of the hydraulic heads in cross section along (a:left) A–A’, (b:right) B–B’ in Fig. 2. Italic number shows the hydraulic head at each screen.
37
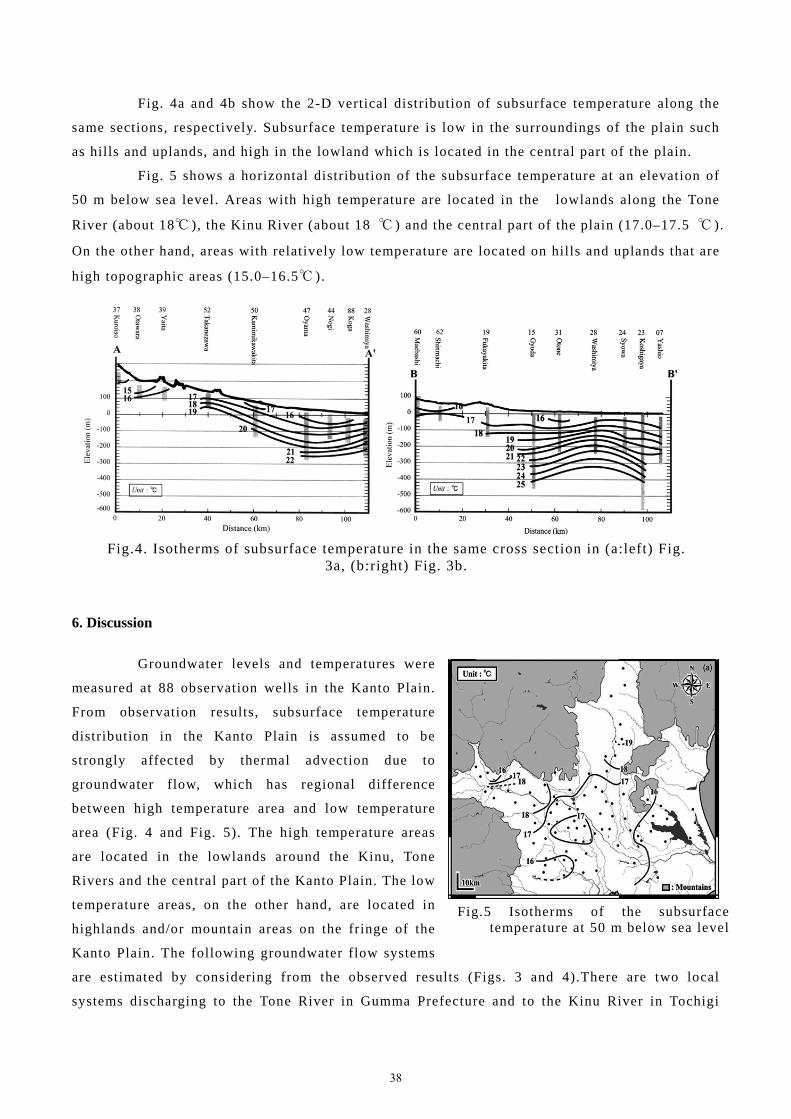
Fig. 4a and 4b show the 2-D vertical distribution of subsurface temperature along the
same sections, respectively. Subsurface temperature is low in the surroundings of the plain such
as hills and uplands, and high in the lowland which is located in the central part of the plain.
Fig. 5 shows a horizontal distribution of the subsurface temperature at an elevation of
50 m below sea level. Areas with high temperature are located in the lowlands along the Tone
River (about 18℃ ), the Kinu River (about 18 ℃ ) and the central part of the plain (17.0–17.5 ℃ ).
On the other hand, areas with relatively low temperature are located on hills and uplands that are
high topographic areas (15.0–16.5℃ ).
6. Discussion
Groundwater levels and temperatures were
measured at 88 observation wells in the Kanto Plain.
From observation results, subsurface temperature
distribution in the Kanto Plain is assumed to be
strongly affected by thermal advection due to
groundwater flow, which has regional difference
between high temperature area and low temperature
area (Fig. 4 and Fig. 5). The high temperature areas
are located in the lowlands around the Kinu, Tone
Rivers and the central part of the Kanto Plain. The low
temperature areas, on the other hand, are located in
highlands and/or mountain areas on the fringe of the
Kanto Plain. The following groundwater flow systems
are estimated by considering from the observed results (Figs. 3 and 4).There are two local
systems discharging to the Tone River in Gumma Prefecture and to the Kinu River in Tochigi
Fig.5 Isotherms of the subsurfacetemperature at 50 m below sea level
Fig.4. Isotherms of subsurface temperature in the same cross section in (a:left) Fig. 3a, (b:right) Fig. 3b.
38
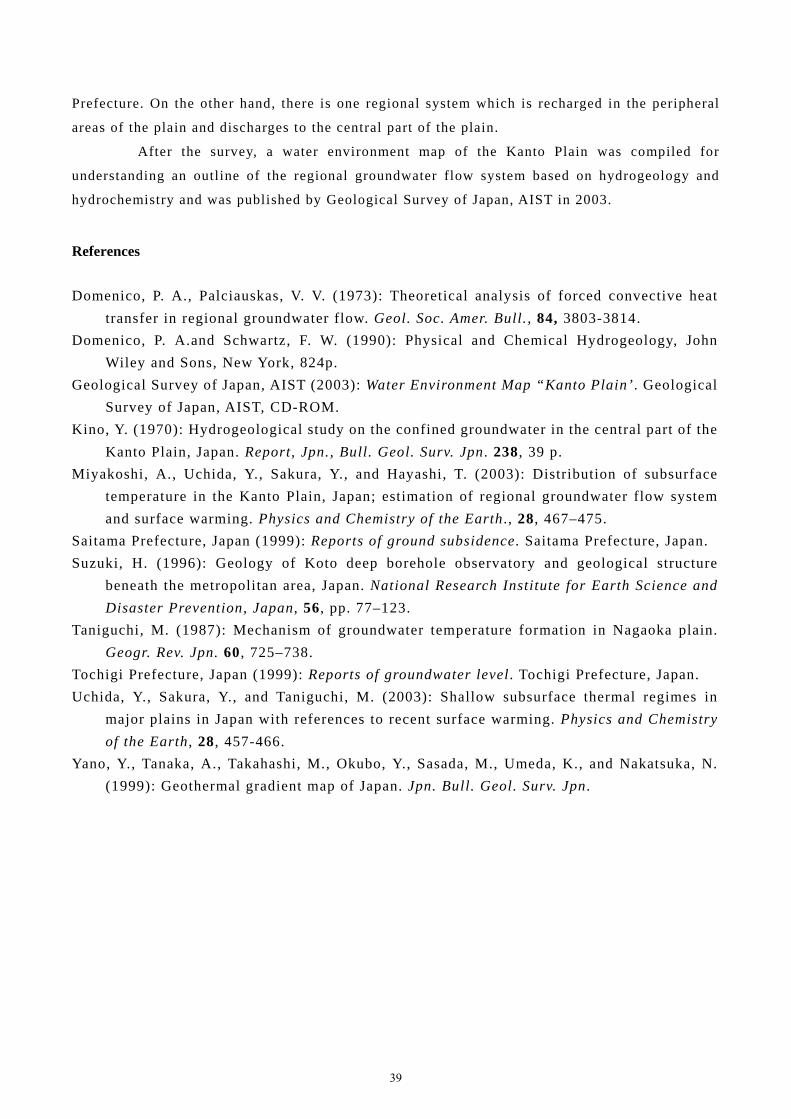
Prefecture. On the other hand, there is one regional system which is recharged in the peripheral
areas of the plain and discharges to the central part of the plain.
After the survey, a water environment map of the Kanto Plain was compiled for
understanding an outline of the regional groundwater flow system based on hydrogeology and
hydrochemistry and was published by Geological Survey of Japan, AIST in 2003.
References
Domenico, P. A., Palciauskas, V. V. (1973): Theoretical analysis of forced convective heat
transfer in regional groundwater flow. Geol. Soc. Amer. Bull., 84, 3803-3814.
Domenico, P. A.and Schwartz, F. W. (1990): Physical and Chemical Hydrogeology, John
Wiley and Sons, New York, 824p.
Geological Survey of Japan, AIST (2003): Water Environment Map “Kanto Plain’ . Geological
Survey of Japan, AIST, CD-ROM.
Kino, Y. (1970): Hydrogeological study on the confined groundwater in the central part of the
Kanto Plain, Japan. Report, Jpn., Bull. Geol. Surv. Jpn . 238 , 39 p.
Miyakoshi, A., Uchida, Y., Sakura, Y., and Hayashi, T. (2003): Distribution of subsurface
temperature in the Kanto Plain, Japan; estimation of regional groundwater flow system
and surface warming. Physics and Chemistry of the Earth ., 28, 467–475.
Saitama Prefecture, Japan (1999): Reports of ground subsidence. Saitama Prefecture, Japan.
Suzuki, H. (1996): Geology of Koto deep borehole observatory and geological structure
beneath the metropolitan area, Japan. National Research Institute for Earth Science and
Disaster Prevention, Japan, 56, pp. 77–123.
Taniguchi, M. (1987): Mechanism of groundwater temperature formation in Nagaoka plain.
Geogr. Rev. Jpn. 60 , 725–738.
Tochigi Prefecture, Japan (1999): Reports of groundwater level . Tochigi Prefecture, Japan.
Uchida, Y., Sakura, Y., and Taniguchi, M. (2003): Shallow subsurface thermal regimes in
major plains in Japan with references to recent surface warming. Physics and Chemistry
of the Earth , 28 , 457-466.
Yano, Y., Tanaka, A., Takahashi, M., Okubo, Y., Sasada, M., Umeda, K., and Nakatsuka, N.
(1999): Geothermal gradient map of Japan. Jpn. Bull. Geol. Surv. Jpn.
39
Groundwater Temperature Survey in Korea
Kyoochul Ha1, Jin-Yong Lee2, Yu-Chul Park2
1, Korea Institute of Geoscience and Mineral Resources (KIGAM), 124 Gwahang-no Yuseong-gu Daejeon, Republic of Korea
2, Department of Geology, College of Natural Sciences, Kangwon National University, Chuncheon 200-701, Republic of Korea
1. Introduction
Groundwater is seriously considered as a heat source for heating and cooling as well as water
resources in the country. This paper introduced groundwater temperature distribution in Korea using
the data obtained from the 266 Korean National Groundwater Monitoring Network (NGMN) stations
distributed in all the country. The MLTM (Ministry of Land, Transport and Maritime Affairs) and
KWATER (Korea Water Resources Corporation) publish an annual report on groundwater monitoring
every year, including all these groundwater data from the national groundwater monitoring stations. In
this paper, groundwater temperature data obtained from the 266 national groundwater monitoring
stations (including 128 shallow monitoring wells and 236 deep monitoring wells) were analyzed.
Period for data analysis ranged from 1995 to 2004 but it somewhat differs according to the installation
year of each station.
2. Groundwater temperature analyses using MGMNs
National Groundwater Monitoring Stations
KWATER (Korea Water Resources Corporation), an affiliated organization of the MLTM
(Ministry of Land, Transport and Maritime Affairs), is in charge of the establishment and operation of
this network. By 2004, 293 stations were completed. For each monitoring station, two separate wells
are newly installed. One well, with an average depth of 11.7 m, is used to monitor shallow
groundwater (alluvial aquifer) and the other, with an average depth of 69.8 m, is used to monitor deep
groundwater (bedrock aquifer). To protect the monitoring wells and monitoring devices, an outer
facility using bricks or steel is constructed. All the stations except some ones have two separate
monitoring wells, a data logger, a remote terminal unit (RTU), and a solar energy system for
supplying electricity used for groundwater data acquisition and data transfer. An integrated probe
measuring water level, water temperature and electrical conductivity (EC) is installed at each
monitoring well. The measuring probes were installed at average depths of 9.9 m and 21.4 m (below
the groundwater surface) for shallow and deep wells, respectively.
There are two main aquifers in Korea. They are shallow alluvial aquifers and relatively deep
40
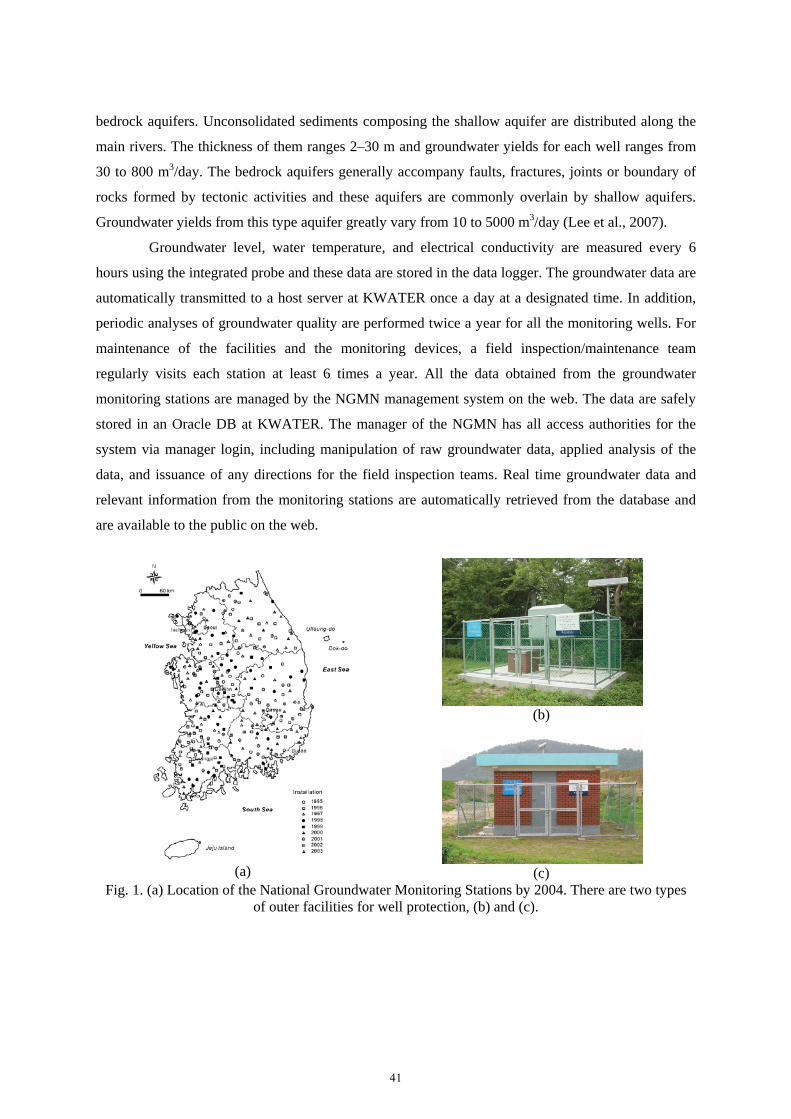
bedrock aquifers. Unconsolidated sediments composing the shallow aquifer are distributed along the
main rivers. The thickness of them ranges 2–30 m and groundwater yields for each well ranges from
30 to 800 m3/day. The bedrock aquifers generally accompany faults, fractures, joints or boundary of
rocks formed by tectonic activities and these aquifers are commonly overlain by shallow aquifers.
Groundwater yields from this type aquifer greatly vary from 10 to 5000 m3/day (Lee et al., 2007).
Groundwater level, water temperature, and electrical conductivity are measured every 6
hours using the integrated probe and these data are stored in the data logger. The groundwater data are
automatically transmitted to a host server at KWATER once a day at a designated time. In addition,
periodic analyses of groundwater quality are performed twice a year for all the monitoring wells. For
maintenance of the facilities and the monitoring devices, a field inspection/maintenance team
regularly visits each station at least 6 times a year. All the data obtained from the groundwater
monitoring stations are managed by the NGMN management system on the web. The data are safely
stored in an Oracle DB at KWATER. The manager of the NGMN has all access authorities for the
system via manager login, including manipulation of raw groundwater data, applied analysis of the
data, and issuance of any directions for the field inspection teams. Real time groundwater data and
relevant information from the monitoring stations are automatically retrieved from the database and
are available to the public on the web.
(a)
(b)
(c)
Fig. 1. (a) Location of the National Groundwater Monitoring Stations by 2004. There are two types of outer facilities for well protection, (b) and (c).
41
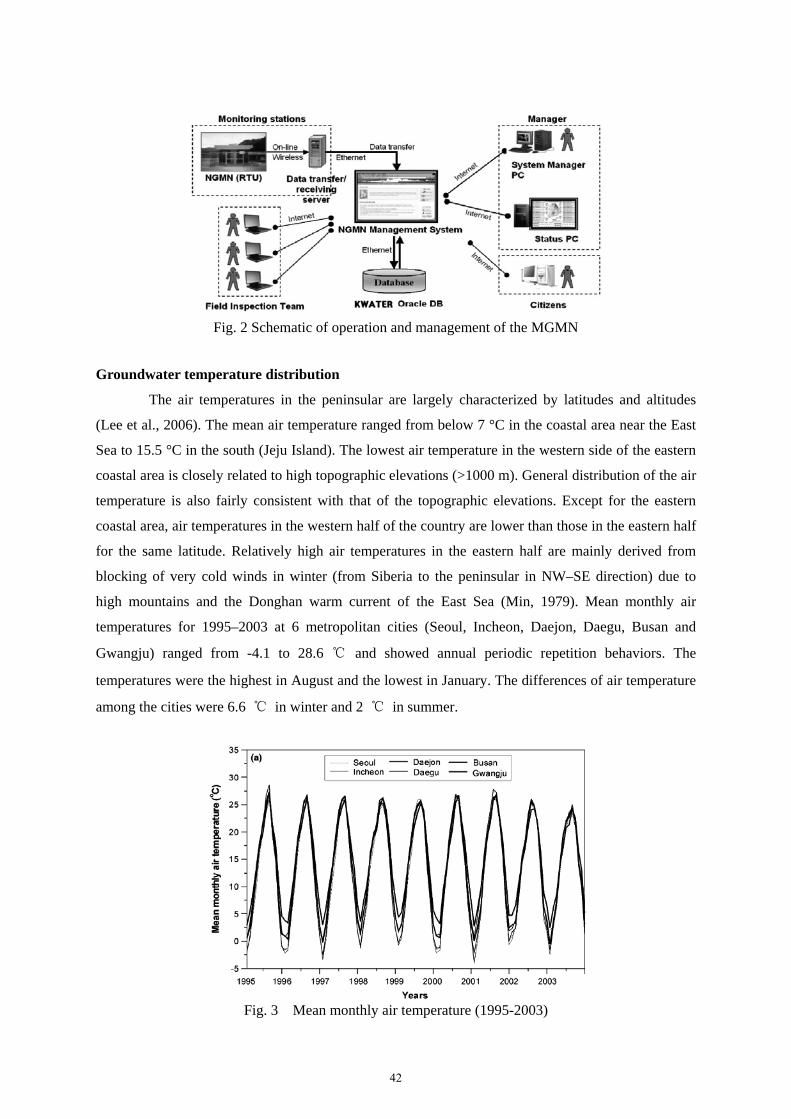
Fig. 2 Schematic of operation and management of the MGMN
Groundwater temperature distribution
The air temperatures in the peninsular are largely characterized by latitudes and altitudes
(Lee et al., 2006). The mean air temperature ranged from below 7 °C in the coastal area near the East
Sea to 15.5 °C in the south (Jeju Island). The lowest air temperature in the western side of the eastern
coastal area is closely related to high topographic elevations (>1000 m). General distribution of the air
temperature is also fairly consistent with that of the topographic elevations. Except for the eastern
coastal area, air temperatures in the western half of the country are lower than those in the eastern half
for the same latitude. Relatively high air temperatures in the eastern half are mainly derived from
blocking of very cold winds in winter (from Siberia to the peninsular in NW–SE direction) due to
high mountains and the Donghan warm current of the East Sea (Min, 1979). Mean monthly air
temperatures for 1995–2003 at 6 metropolitan cities (Seoul, Incheon, Daejon, Daegu, Busan and
Gwangju) ranged from -4.1 to 28.6 ℃ and showed annual periodic repetition behaviors. The
temperatures were the highest in August and the lowest in January. The differences of air temperature
among the cities were 6.6 ℃ in winter and 2 ℃ in summer.
Fig. 3 Mean monthly air temperature (1995-2003)
42
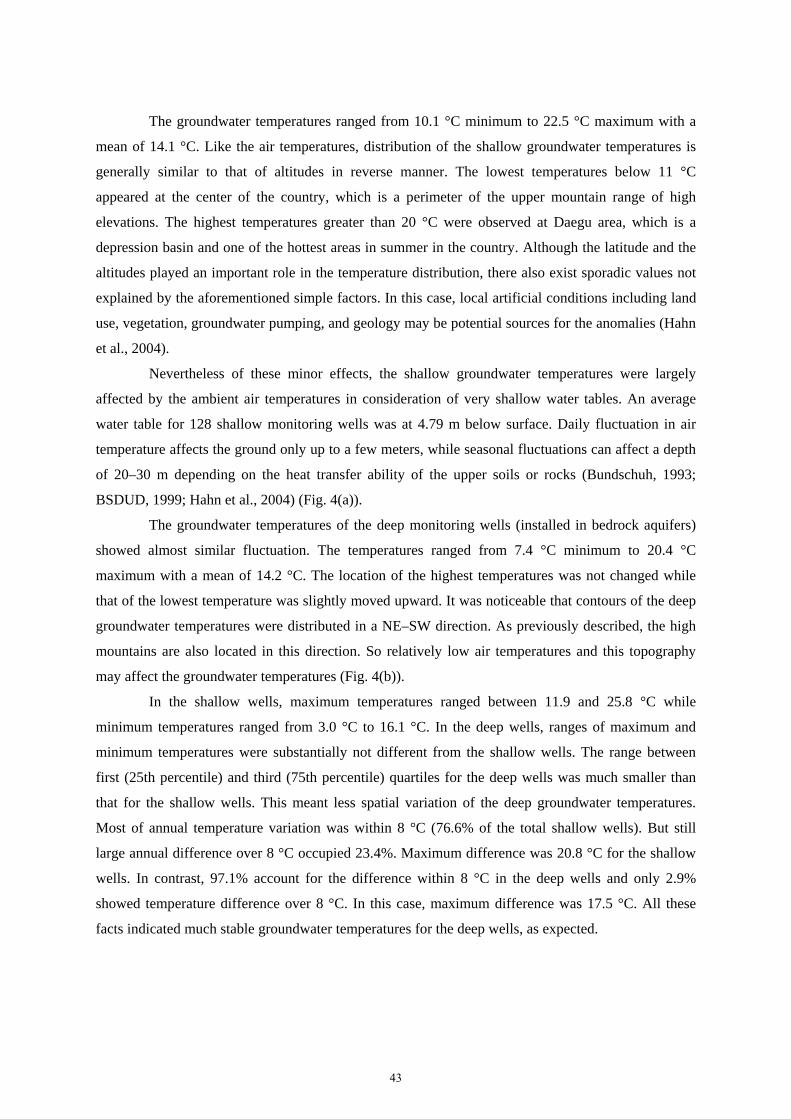
The groundwater temperatures ranged from 10.1 °C minimum to 22.5 °C maximum with a
mean of 14.1 °C. Like the air temperatures, distribution of the shallow groundwater temperatures is
generally similar to that of altitudes in reverse manner. The lowest temperatures below 11 °C
appeared at the center of the country, which is a perimeter of the upper mountain range of high
elevations. The highest temperatures greater than 20 °C were observed at Daegu area, which is a
depression basin and one of the hottest areas in summer in the country. Although the latitude and the
altitudes played an important role in the temperature distribution, there also exist sporadic values not
explained by the aforementioned simple factors. In this case, local artificial conditions including land
use, vegetation, groundwater pumping, and geology may be potential sources for the anomalies (Hahn
et al., 2004).
Nevertheless of these minor effects, the shallow groundwater temperatures were largely
affected by the ambient air temperatures in consideration of very shallow water tables. An average
water table for 128 shallow monitoring wells was at 4.79 m below surface. Daily fluctuation in air
temperature affects the ground only up to a few meters, while seasonal fluctuations can affect a depth
of 20–30 m depending on the heat transfer ability of the upper soils or rocks (Bundschuh, 1993;
BSDUD, 1999; Hahn et al., 2004) (Fig. 4(a)).
The groundwater temperatures of the deep monitoring wells (installed in bedrock aquifers)
showed almost similar fluctuation. The temperatures ranged from 7.4 °C minimum to 20.4 °C
maximum with a mean of 14.2 °C. The location of the highest temperatures was not changed while
that of the lowest temperature was slightly moved upward. It was noticeable that contours of the deep
groundwater temperatures were distributed in a NE–SW direction. As previously described, the high
mountains are also located in this direction. So relatively low air temperatures and this topography
may affect the groundwater temperatures (Fig. 4(b)).
In the shallow wells, maximum temperatures ranged between 11.9 and 25.8 °C while
minimum temperatures ranged from 3.0 °C to 16.1 °C. In the deep wells, ranges of maximum and
minimum temperatures were substantially not different from the shallow wells. The range between
first (25th percentile) and third (75th percentile) quartiles for the deep wells was much smaller than
that for the shallow wells. This meant less spatial variation of the deep groundwater temperatures.
Most of annual temperature variation was within 8 °C (76.6% of the total shallow wells). But still
large annual difference over 8 °C occupied 23.4%. Maximum difference was 20.8 °C for the shallow
wells. In contrast, 97.1% account for the difference within 8 °C in the deep wells and only 2.9%
showed temperature difference over 8 °C. In this case, maximum difference was 17.5 °C. All these
facts indicated much stable groundwater temperatures for the deep wells, as expected.
43
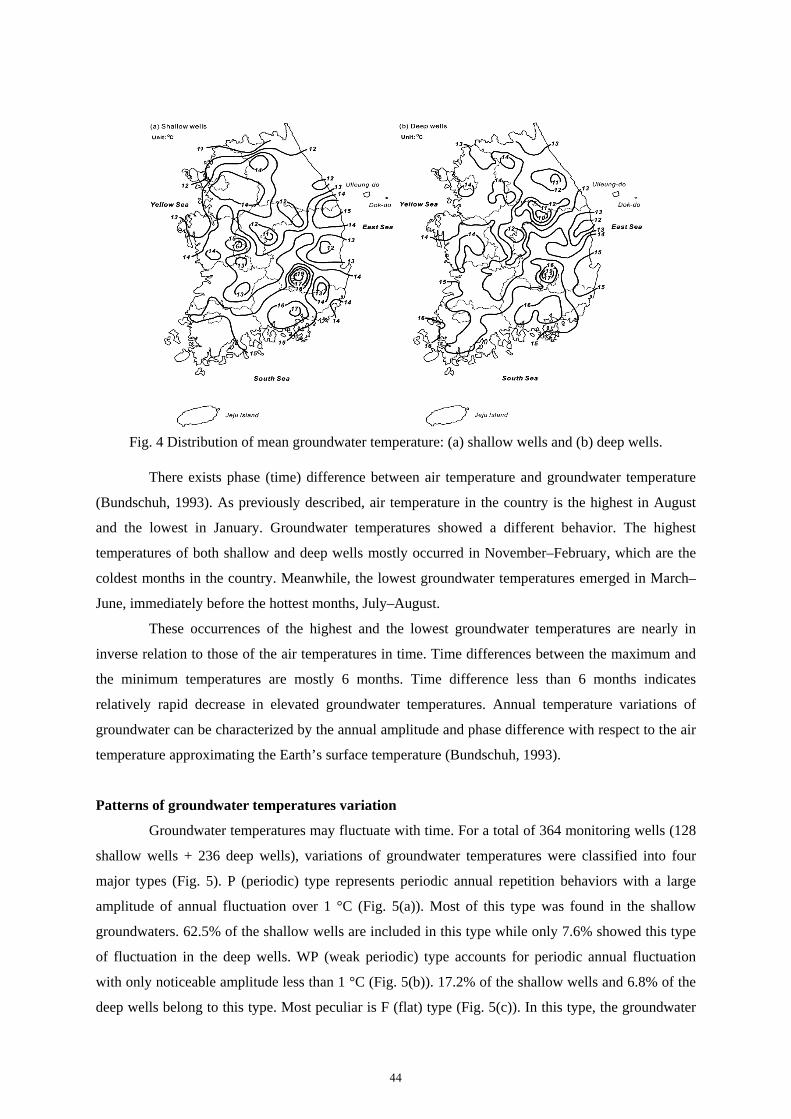
Fig. 4 Distribution of mean groundwater temperature: (a) shallow wells and (b) deep wells.
There exists phase (time) difference between air temperature and groundwater temperature
(Bundschuh, 1993). As previously described, air temperature in the country is the highest in August
and the lowest in January. Groundwater temperatures showed a different behavior. The highest
temperatures of both shallow and deep wells mostly occurred in November–February, which are the
coldest months in the country. Meanwhile, the lowest groundwater temperatures emerged in March–
June, immediately before the hottest months, July–August.
These occurrences of the highest and the lowest groundwater temperatures are nearly in
inverse relation to those of the air temperatures in time. Time differences between the maximum and
the minimum temperatures are mostly 6 months. Time difference less than 6 months indicates
relatively rapid decrease in elevated groundwater temperatures. Annual temperature variations of
groundwater can be characterized by the annual amplitude and phase difference with respect to the air
temperature approximating the Earth’s surface temperature (Bundschuh, 1993).
Patterns of groundwater temperatures variation
Groundwater temperatures may fluctuate with time. For a total of 364 monitoring wells (128
shallow wells + 236 deep wells), variations of groundwater temperatures were classified into four
major types (Fig. 5). P (periodic) type represents periodic annual repetition behaviors with a large
amplitude of annual fluctuation over 1 °C (Fig. 5(a)). Most of this type was found in the shallow
groundwaters. 62.5% of the shallow wells are included in this type while only 7.6% showed this type
of fluctuation in the deep wells. WP (weak periodic) type accounts for periodic annual fluctuation
with only noticeable amplitude less than 1 °C (Fig. 5(b)). 17.2% of the shallow wells and 6.8% of the
deep wells belong to this type. Most peculiar is F (flat) type (Fig. 5(c)). In this type, the groundwater
44
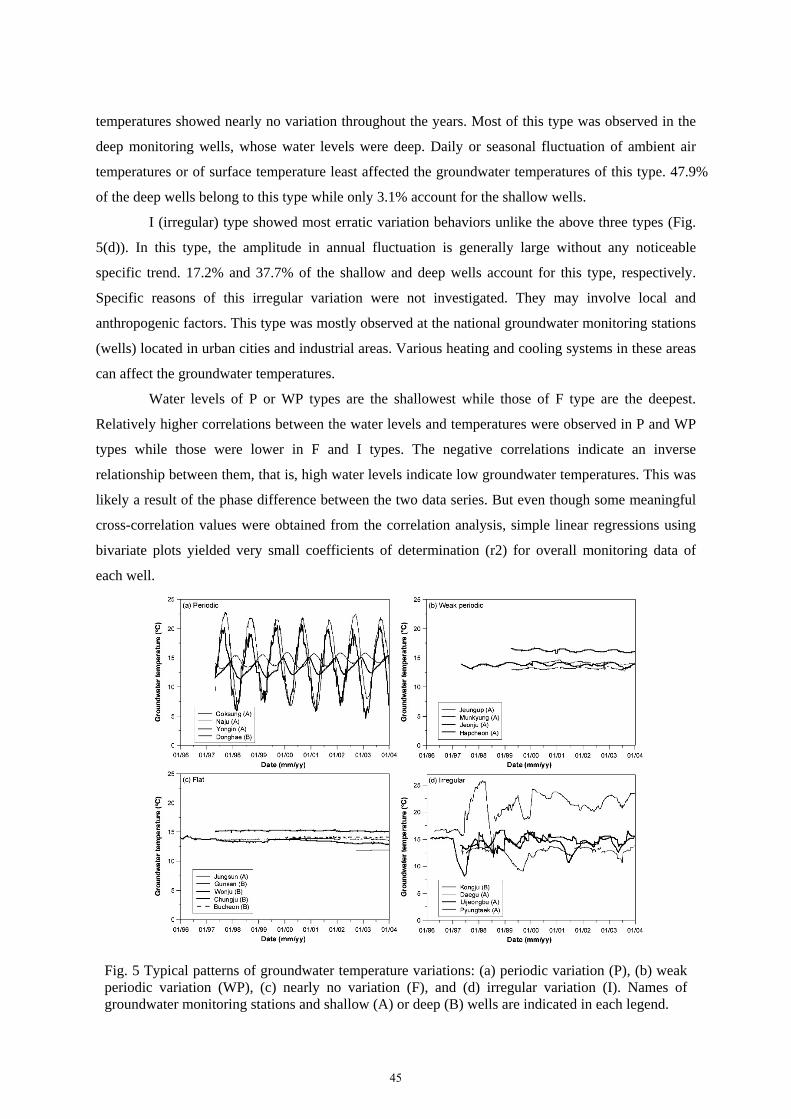
temperatures showed nearly no variation throughout the years. Most of this type was observed in the
deep monitoring wells, whose water levels were deep. Daily or seasonal fluctuation of ambient air
temperatures or of surface temperature least affected the groundwater temperatures of this type. 47.9%
of the deep wells belong to this type while only 3.1% account for the shallow wells.
I (irregular) type showed most erratic variation behaviors unlike the above three types (Fig.
5(d)). In this type, the amplitude in annual fluctuation is generally large without any noticeable
specific trend. 17.2% and 37.7% of the shallow and deep wells account for this type, respectively.
Specific reasons of this irregular variation were not investigated. They may involve local and
anthropogenic factors. This type was mostly observed at the national groundwater monitoring stations
(wells) located in urban cities and industrial areas. Various heating and cooling systems in these areas
can affect the groundwater temperatures.
Water levels of P or WP types are the shallowest while those of F type are the deepest.
Relatively higher correlations between the water levels and temperatures were observed in P and WP
types while those were lower in F and I types. The negative correlations indicate an inverse
relationship between them, that is, high water levels indicate low groundwater temperatures. This was
likely a result of the phase difference between the two data series. But even though some meaningful
cross-correlation values were obtained from the correlation analysis, simple linear regressions using
bivariate plots yielded very small coefficients of determination (r2) for overall monitoring data of
each well.
Fig. 5 Typical patterns of groundwater temperature variations: (a) periodic variation (P), (b) weak periodic variation (WP), (c) nearly no variation (F), and (d) irregular variation (I). Names of groundwater monitoring stations and shallow (A) or deep (B) wells are indicated in each legend.
45
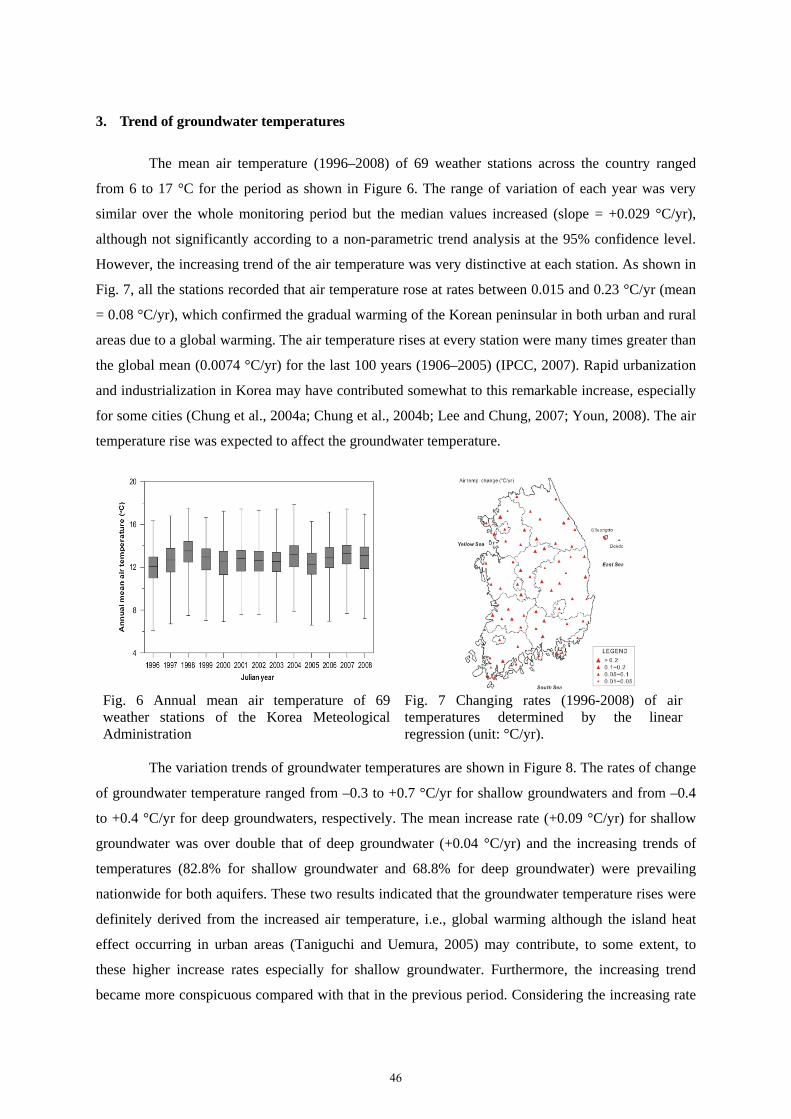
3. Trend of groundwater temperatures
The mean air temperature (1996–2008) of 69 weather stations across the country ranged
from 6 to 17 °C for the period as shown in Figure 6. The range of variation of each year was very
similar over the whole monitoring period but the median values increased (slope = +0.029 °C/yr),
although not significantly according to a non-parametric trend analysis at the 95% confidence level.
However, the increasing trend of the air temperature was very distinctive at each station. As shown in
Fig. 7, all the stations recorded that air temperature rose at rates between 0.015 and 0.23 °C/yr (mean
= 0.08 °C/yr), which confirmed the gradual warming of the Korean peninsular in both urban and rural
areas due to a global warming. The air temperature rises at every station were many times greater than
the global mean (0.0074 °C/yr) for the last 100 years (1906–2005) (IPCC, 2007). Rapid urbanization
and industrialization in Korea may have contributed somewhat to this remarkable increase, especially
for some cities (Chung et al., 2004a; Chung et al., 2004b; Lee and Chung, 2007; Youn, 2008). The air
temperature rise was expected to affect the groundwater temperature.
Fig. 6 Annual mean air temperature of 69 weather stations of the Korea Meteological Administration
Fig. 7 Changing rates (1996-2008) of air temperatures determined by the linear regression (unit: °C/yr).
The variation trends of groundwater temperatures are shown in Figure 8. The rates of change
of groundwater temperature ranged from –0.3 to +0.7 °C/yr for shallow groundwaters and from –0.4
to +0.4 °C/yr for deep groundwaters, respectively. The mean increase rate (+0.09 °C/yr) for shallow
groundwater was over double that of deep groundwater (+0.04 °C/yr) and the increasing trends of
temperatures (82.8% for shallow groundwater and 68.8% for deep groundwater) were prevailing
nationwide for both aquifers. These two results indicated that the groundwater temperature rises were
definitely derived from the increased air temperature, i.e., global warming although the island heat
effect occurring in urban areas (Taniguchi and Uemura, 2005) may contribute, to some extent, to
these higher increase rates especially for shallow groundwater. Furthermore, the increasing trend
became more conspicuous compared with that in the previous period. Considering the increasing rate
46
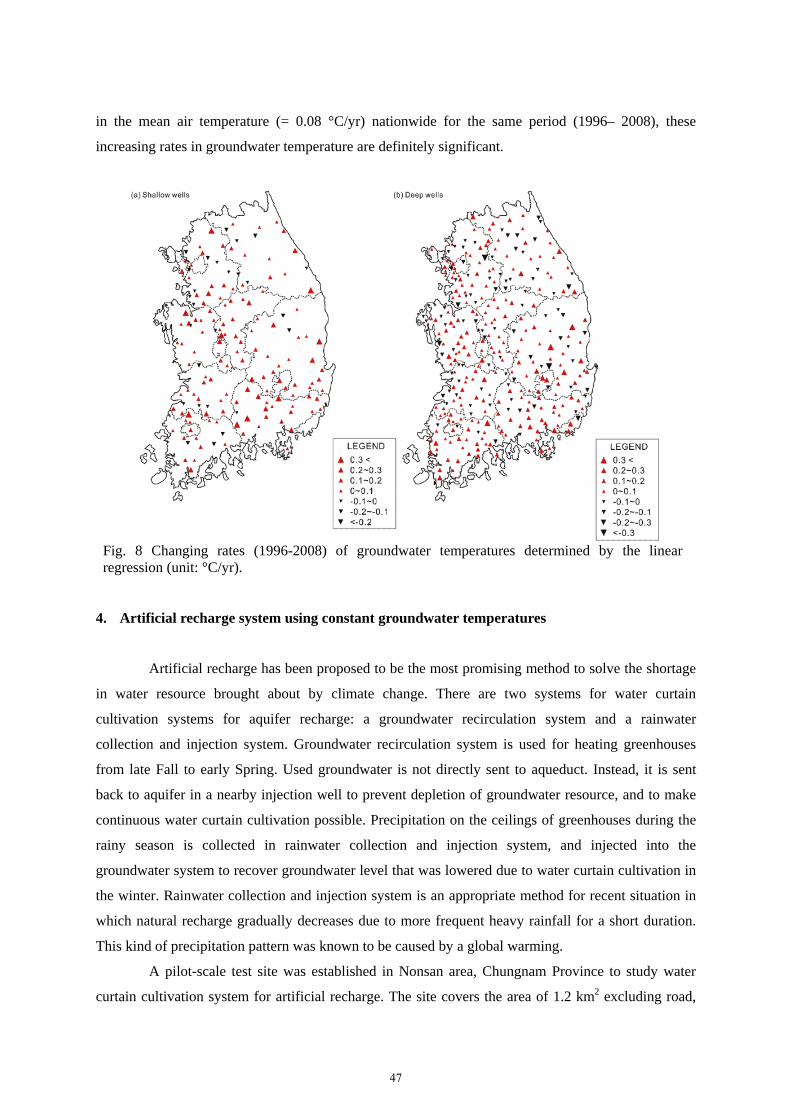
in the mean air temperature (= 0.08 °C/yr) nationwide for the same period (1996– 2008), these
increasing rates in groundwater temperature are definitely significant.
Fig. 8 Changing rates (1996-2008) of groundwater temperatures determined by the linear regression (unit: °C/yr).
4. Artificial recharge system using constant groundwater temperatures
Artificial recharge has been proposed to be the most promising method to solve the shortage
in water resource brought about by climate change. There are two systems for water curtain
cultivation systems for aquifer recharge: a groundwater recirculation system and a rainwater
collection and injection system. Groundwater recirculation system is used for heating greenhouses
from late Fall to early Spring. Used groundwater is not directly sent to aqueduct. Instead, it is sent
back to aquifer in a nearby injection well to prevent depletion of groundwater resource, and to make
continuous water curtain cultivation possible. Precipitation on the ceilings of greenhouses during the
rainy season is collected in rainwater collection and injection system, and injected into the
groundwater system to recover groundwater level that was lowered due to water curtain cultivation in
the winter. Rainwater collection and injection system is an appropriate method for recent situation in
which natural recharge gradually decreases due to more frequent heavy rainfall for a short duration.
This kind of precipitation pattern was known to be caused by a global warming.
A pilot-scale test site was established in Nonsan area, Chungnam Province to study water
curtain cultivation system for artificial recharge. The site covers the area of 1.2 km2 excluding road,
47
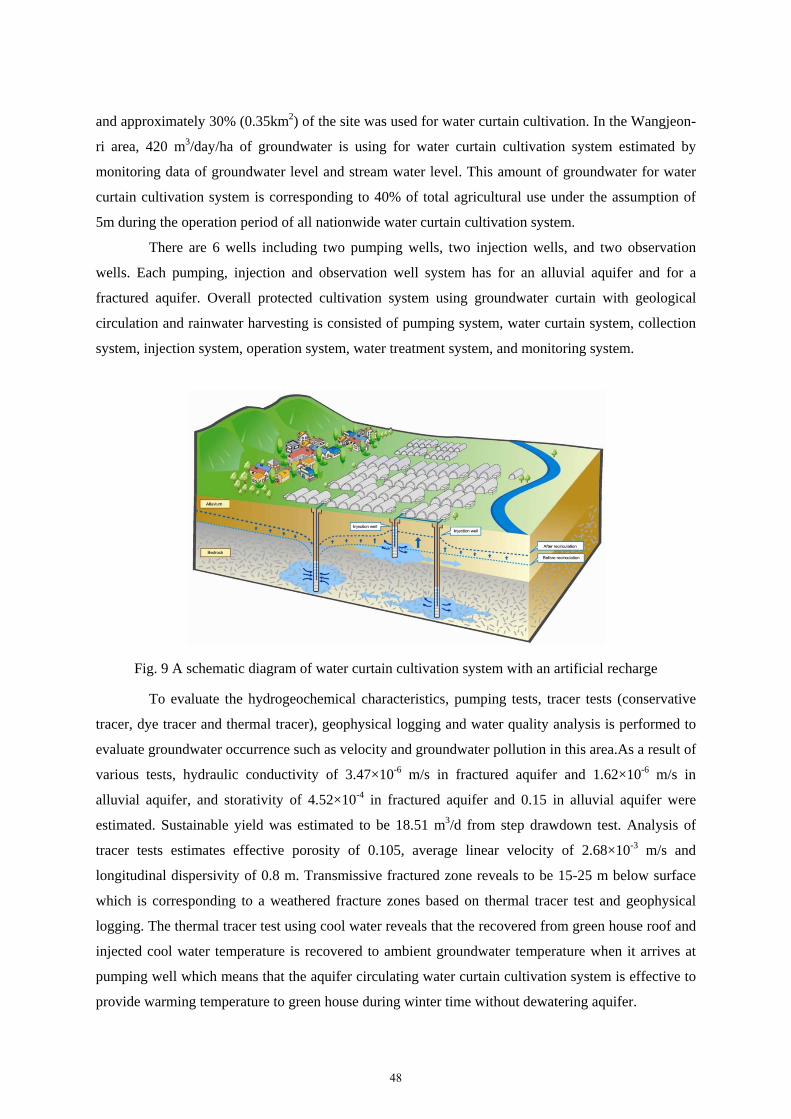
and approximately 30% (0.35km2) of the site was used for water curtain cultivation. In the Wangjeon-
ri area, 420 m3/day/ha of groundwater is using for water curtain cultivation system estimated by
monitoring data of groundwater level and stream water level. This amount of groundwater for water
curtain cultivation system is corresponding to 40% of total agricultural use under the assumption of
5m during the operation period of all nationwide water curtain cultivation system.
There are 6 wells including two pumping wells, two injection wells, and two observation
wells. Each pumping, injection and observation well system has for an alluvial aquifer and for a
fractured aquifer. Overall protected cultivation system using groundwater curtain with geological
circulation and rainwater harvesting is consisted of pumping system, water curtain system, collection
system, injection system, operation system, water treatment system, and monitoring system.
Fig. 9 A schematic diagram of water curtain cultivation system with an artificial recharge
To evaluate the hydrogeochemical characteristics, pumping tests, tracer tests (conservative
tracer, dye tracer and thermal tracer), geophysical logging and water quality analysis is performed to
evaluate groundwater occurrence such as velocity and groundwater pollution in this area.As a result of
various tests, hydraulic conductivity of 3.47×10⁻⁶ m/s in fractured aquifer and 1.62×10⁻⁶ m/s in
alluvial aquifer, and storativity of 4.52×10⁻⁴ in fractured aquifer and 0.15 in alluvial aquifer were
estimated. Sustainable yield was estimated to be 18.51 m3/d from step drawdown test. Analysis of
tracer tests estimates effective porosity of 0.105, average linear velocity of 2.68×10⁻³ m/s and
longitudinal dispersivity of 0.8 m. Transmissive fractured zone reveals to be 15-25 m below surface
which is corresponding to a weathered fracture zones based on thermal tracer test and geophysical
logging. The thermal tracer test using cool water reveals that the recovered from green house roof and
injected cool water temperature is recovered to ambient groundwater temperature when it arrives at
pumping well which means that the aquifer circulating water curtain cultivation system is effective to
provide warming temperature to green house during winter time without dewatering aquifer.
48
Geothermal modeling was performed to study temperature recovery characteristics from
pumping and injection in water curtain cultivation system for artificial recharge. Appropriate
hydrological and geothermal parameters were applied to FEFLOW software to numerically model
changes in pumping temperature with changing distance between pumping and injection wells, and
effect of pumping temperature on overall system. Appropriate assumptions were made on the depth of
aquifer, and hydrological and thermal variables. The system was modeled at distances of 15, 30, and
50 m. Thermal interference was not observed at the distance of 50m, and thermal content of the
system after 2 year operation was found to be at least 134 kW.
A preliminary operation of the pilot system during the hot season using hot condition instead
of cold condition resulted in the fact that geological circulating water curtain cultivation system is
better than non-circulating system in terms of groundwater level, pumping rate, groundwater
temperature recovery efficiency. During the practical operation during winter time in 2010, 6,100
m3/yr of groundwater re-injected to the aquifer and if this kind of facility is expanded to the whole
green house in the test basin, it will be 0.66 million m3/yr of water can be recharged. If we assume
that at least 50% of rainwater is collected and injected to injection well through the system, 4,750 m3
of water can be estimated to inject into one injection well for a year.
49
References:
BSDUD (Berlin Senate Department of Urban Development) (1999): Groundwater Temperature.
Berlin Digital Environmental Atlas, Berlin, Germany, 8 pp (chapter 02.14). Bundschuh, J. (1993): Modeling annual variations of spring and groundwater temperatures associated
with shallow aquifer systems. J. Hydrol. 142, 427-444. Chung, U., Choi, J., and Yun, J.I. (2004a): Urbanization effect on the observed change in mean
monthly temperatures between 1951–1980 and 1971–2000 in Korea. Climate Change, 66, 127-136.
Chung, Y.S., Yoon, M.B., and Kim, H.S. (2006): On climate variations and changes observed in south
Korea. Climate Change, 66, 151-161. Hahn, J.S., Hahn, G.S., Hahn, H.S., Hahn, C.(2004): Geothermal Heat Pump, Heating and Cooling
Systems. Hanrimwon, Seoul, Korea. IPCC (International Panel on Climate Change) (2007): Climate Change 2007: Synthesis Report. IPCC,
Geneva, Switzerland, 104 p. Lee, K.S. and Chung, E.S. (2007): Hydrological effects of climate change, groundwater withdrawal,
and land use in a small Korean watershed. Hydrological Processes, 21, 3046-3056. Lee, J.Y., Won, J.H., Hahn, J.S. (2006): Evaluation of hydrogeologic conditions for groundwater heat
pumps: analysis with data from national groundwater monitoring stations. Geosci. J. 10, 91-99. Lee, J.Y., Yi, M.J., Yoo, Y.K., Ahn, K.H., Kim, G.B., Won, J.H. (2007): A review of national
groundwater monitoring network (NGMN) in Korea. Hydrol. Process., 21, 907-917 Min, B.O. (1979): A study on the climatic type in Korea by the characteristics of temperature
distribution. J. Kor. Soc. Oceanogr. 3, 29–46. Taniguchi, M. and Uemura, T. (2005): Effects of urbanization and groundwater flow in the subsurface
temperature in Osaka, Japan. Physics of the Earth and Planetary Interiors, 152, 305-313. Youn, Y.H. (2008): The climate variabilities of air temperature around the Korean Peninsular.
Advances in Atmospheric Sciences, 22, 575–584.
50
Land Collapse Issues in and around Kuala Lumpur
Qalam A’zad Rosle and Zakaria Mohamad Minerals and Geoscience Department Malaysia (JMG)
Abstract: Kuala Lumpur and its vicinity which located in the Klang Valley areas are a fast growing city in
Malaysia. Located in a region with a rather complex geological setting, it is underlain by number of
geological formations ranging from Mid-Upper Silurian to Quaternary in age. The stratigraphic
succession consist of the Kuala Lumpur Limestone Formation and Hawthorden Formation (Mid-Upper
Silurian), the Kajang Formation (Mid-Upper Silurian – Devonian?), the Kenny Hill Formation (Permian-
Carboniferous? – Triassic?), granite and its differentiates (Triassic-younger), the Batu Arang Basin (Tertiary)
and alluvium (Quaternary). In the Kuala Lumpur city and its vicinity, the younger alluvium occupies the low
lying area over the predominant Kuala Lumpur Limestone bedrock and were once the source of placer tin
until into the early 1980’s. Subsequent development of the city was conducted over these terrains of disturbed
alluvium and the underlying limestone bedrock with its karstic features. Land collapsed or land
subsidence issues remain as the main concerns to the public as well as the Local Authorities and numerous
environmental NGO’s. Technical agencies such as JMG as one of the technical department in governing the
usage and monitoring the associated impacts of groundwater abstraction are keeping the watch. During past
decades, land collapsed occurrence resulting in the formation of sinkholes due to mining activities. Vast
existences of underground workings in form of tunnels, adits and shafts in the once active coal mining area of
Batu Arang contributed to the occurrence of land subsidences and sinkholes formation. Recently, the ground
subsidences were also encountered because of construction activities particularly during the excavation of the
dual function SMART tunnel. While rapid development, agricultural and sand mining activities resulting in
the dewatering of the peat swamp areas may also contribute to the occurrence of ground settlement or
subsidence within the area. Ongoing hydrogeological study is undertaken by JMG as to ascertain the possible
cause of ground settlement or subsidence. Study indicates that the coastal plain of the Langat Basin experience
widespread ground surface settlement in the range of 0.02-0.20 meter from initial level. This however, has no
probable direct linkage to the groundwater abstraction activities within the basin.
1. Introduction
This report is presenting the issues of land collapsed that is limited to the occurrence of sinkholes
and land subsidence in Kuala Lumpur and its surrounding in relation to the geological, hydrogeological
condition and groundwater abstraction. The author is also referring the Langat basin and the Batu Arang basin
as part of the discussions related to the issues. The former which is a vast alluvial plain is located
southwesterly from Kuala Lumpur in the district of Kuala Langat. Whereas, the latter is located to the
northwest of the city in the district of Kuala Selangor at which both basins are located in the State of Selangor.
As the capital city of Malaysia, Kuala Lumpur which is located in Klang valley is a fast developing metropolis
51
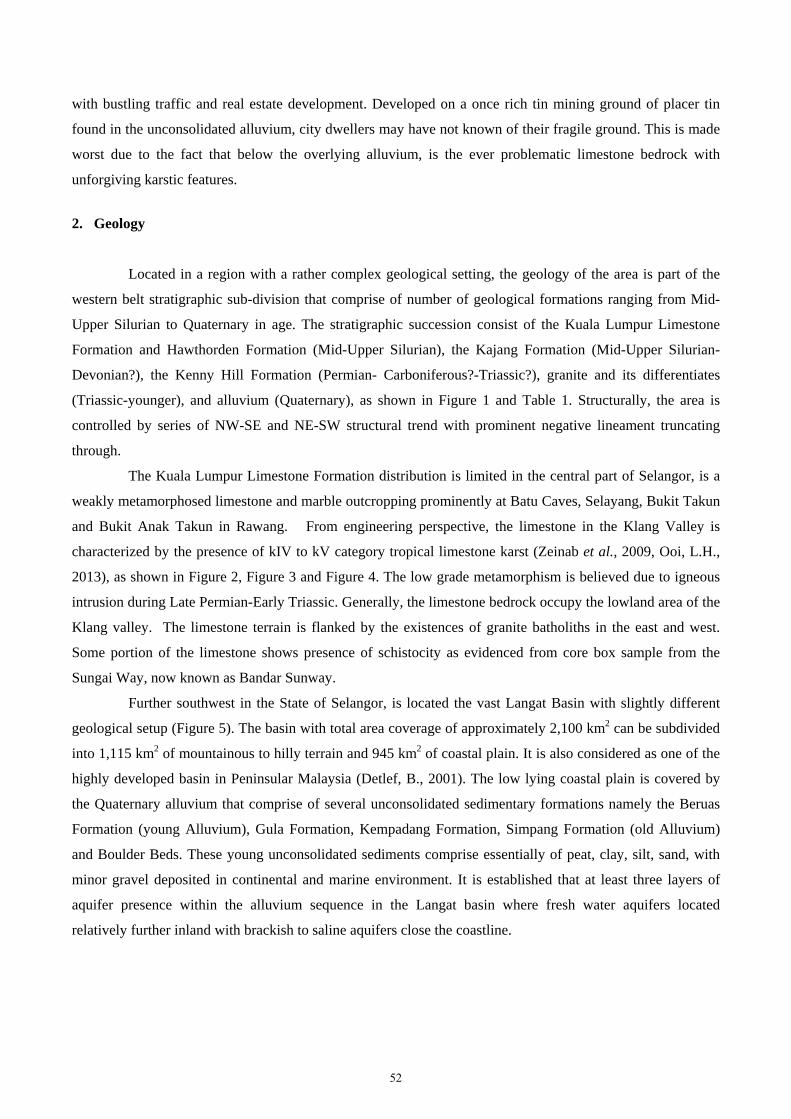
with bustling traffic and real estate development. Developed on a once rich tin mining ground of placer tin
found in the unconsolidated alluvium, city dwellers may have not known of their fragile ground. This is made
worst due to the fact that below the overlying alluvium, is the ever problematic limestone bedrock with
unforgiving karstic features.
2. Geology
Located in a region with a rather complex geological setting, the geology of the area is part of the
western belt stratigraphic sub-division that comprise of number of geological formations ranging from Mid-
Upper Silurian to Quaternary in age. The stratigraphic succession consist of the Kuala Lumpur Limestone
Formation and Hawthorden Formation (Mid-Upper Silurian), the Kajang Formation (Mid-Upper Silurian-
Devonian?), the Kenny Hill Formation (Permian- Carboniferous?-Triassic?), granite and its differentiates
(Triassic-younger), and alluvium (Quaternary), as shown in Figure 1 and Table 1. Structurally, the area is
controlled by series of NW-SE and NE-SW structural trend with prominent negative lineament truncating
through.
The Kuala Lumpur Limestone Formation distribution is limited in the central part of Selangor, is a
weakly metamorphosed limestone and marble outcropping prominently at Batu Caves, Selayang, Bukit Takun
and Bukit Anak Takun in Rawang. From engineering perspective, the limestone in the Klang Valley is
characterized by the presence of kIV to kV category tropical limestone karst (Zeinab et al., 2009, Ooi, L.H.,
2013), as shown in Figure 2, Figure 3 and Figure 4. The low grade metamorphism is believed due to igneous
intrusion during Late Permian-Early Triassic. Generally, the limestone bedrock occupy the lowland area of the
Klang valley. The limestone terrain is flanked by the existences of granite batholiths in the east and west.
Some portion of the limestone shows presence of schistocity as evidenced from core box sample from the
Sungai Way, now known as Bandar Sunway.
Further southwest in the State of Selangor, is located the vast Langat Basin with slightly different
geological setup (Figure 5). The basin with total area coverage of approximately 2,100 km2 can be subdivided
into 1,115 km2 of mountainous to hilly terrain and 945 km2 of coastal plain. It is also considered as one of the
highly developed basin in Peninsular Malaysia (Detlef, B., 2001). The low lying coastal plain is covered by
the Quaternary alluvium that comprise of several unconsolidated sedimentary formations namely the Beruas
Formation (young Alluvium), Gula Formation, Kempadang Formation, Simpang Formation (old Alluvium)
and Boulder Beds. These young unconsolidated sediments comprise essentially of peat, clay, silt, sand, with
minor gravel deposited in continental and marine environment. It is established that at least three layers of
aquifer presence within the alluvium sequence in the Langat basin where fresh water aquifers located
relatively further inland with brackish to saline aquifers close the coastline.
52
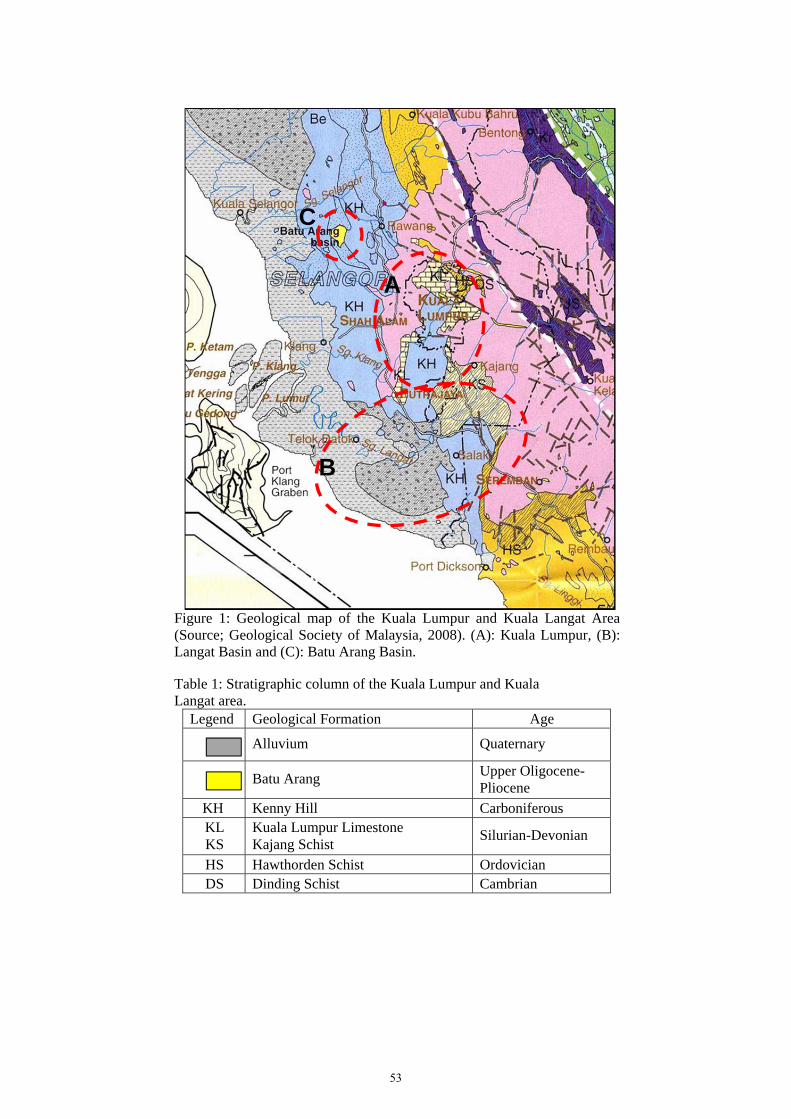
C
A
B
Figure 1: Geological map of the Kuala Lumpur and Kuala Langat Area (Source; Geological Society of Malaysia, 2008). (A): Kuala Lumpur, (B): Langat Basin and (C): Batu Arang Basin.
Table 1: Stratigraphic column of the Kuala Lumpur and Kuala Langat area.
Legend Geological Formation Age Alluvium Quaternary
Batu Arang Upper Oligocene-
Pliocene
KH Kenny Hill Carboniferous KL KS
Kuala Lumpur Limestone Kajang Schist
Silurian-Devonian
HS Hawthorden Schist Ordovician DS Dinding Schist Cambrian
53
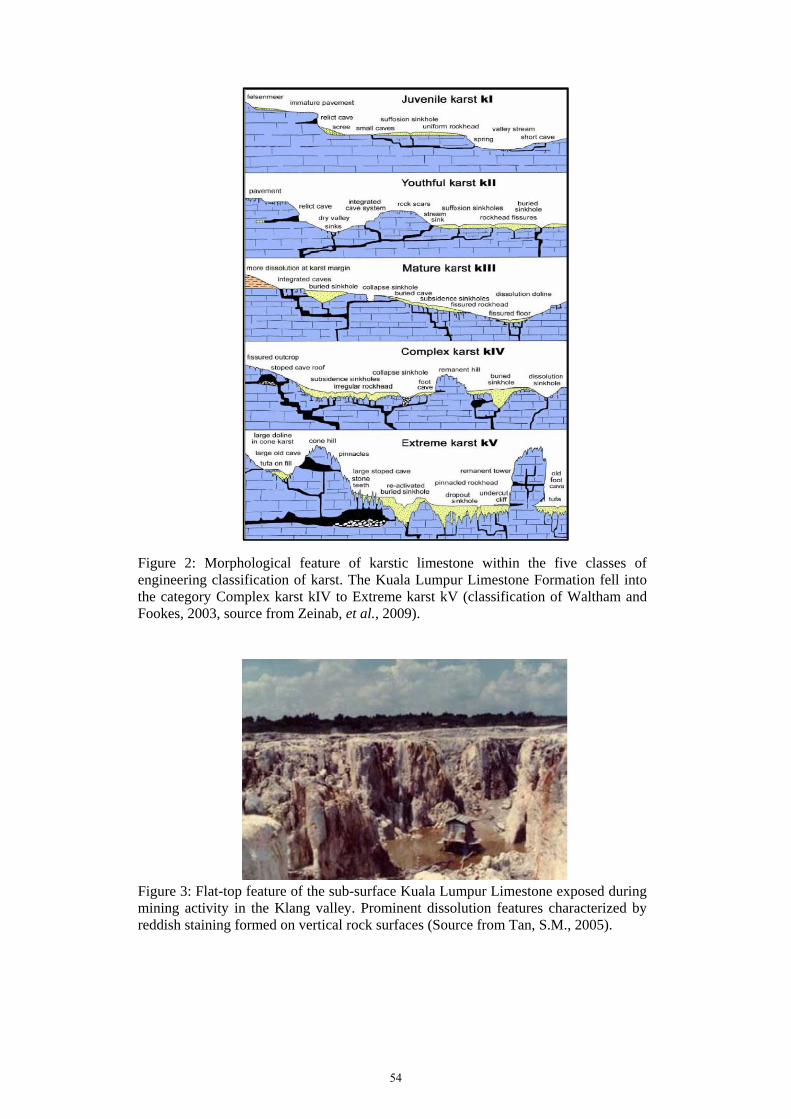
Figure 2: Morphological feature of karstic limestone within the five classes of engineering classification of karst. The Kuala Lumpur Limestone Formation fell into the category Complex karst kIV to Extreme karst kV (classification of Waltham and Fookes, 2003, source from Zeinab, et al., 2009).
Figure 3: Flat-top feature of the sub-surface Kuala Lumpur Limestone exposed during mining activity in the Klang valley. Prominent dissolution features characterized by reddish staining formed on vertical rock surfaces (Source from Tan, S.M., 2005).
54
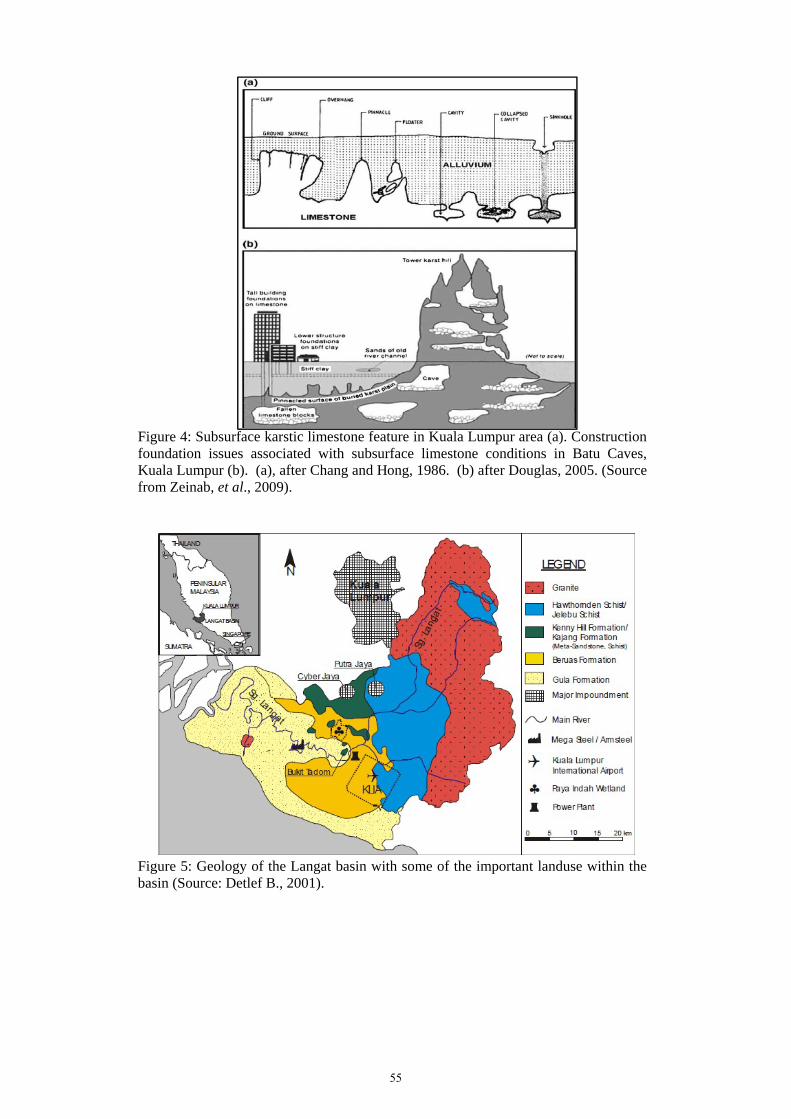
Figure 4: Subsurface karstic limestone feature in Kuala Lumpur area (a). Construction foundation issues associated with subsurface limestone conditions in Batu Caves, Kuala Lumpur (b). (a), after Chang and Hong, 1986. (b) after Douglas, 2005. (Source from Zeinab, et al., 2009).
Figure 5: Geology of the Langat basin with some of the important landuse within the basin (Source: Detlef B., 2001).
55
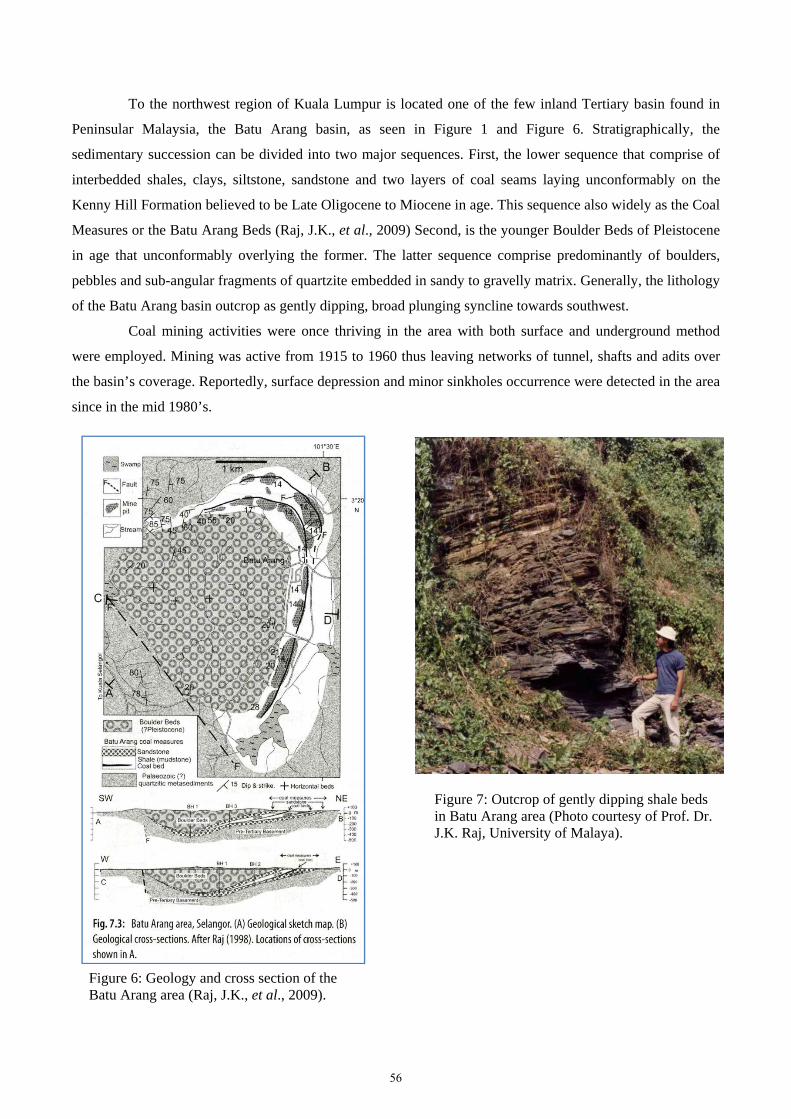
To the northwest region of Kuala Lumpur is located one of the few inland Tertiary basin found in
Peninsular Malaysia, the Batu Arang basin, as seen in Figure 1 and Figure 6. Stratigraphically, the
sedimentary succession can be divided into two major sequences. First, the lower sequence that comprise of
interbedded shales, clays, siltstone, sandstone and two layers of coal seams laying unconformably on the
Kenny Hill Formation believed to be Late Oligocene to Miocene in age. This sequence also widely as the Coal
Measures or the Batu Arang Beds (Raj, J.K., et al., 2009) Second, is the younger Boulder Beds of Pleistocene
in age that unconformably overlying the former. The latter sequence comprise predominantly of boulders,
pebbles and sub-angular fragments of quartzite embedded in sandy to gravelly matrix. Generally, the lithology
of the Batu Arang basin outcrop as gently dipping, broad plunging syncline towards southwest.
Coal mining activities were once thriving in the area with both surface and underground method
were employed. Mining was active from 1915 to 1960 thus leaving networks of tunnel, shafts and adits over
the basin’s coverage. Reportedly, surface depression and minor sinkholes occurrence were detected in the area
since in the mid 1980’s.
Figure 7: Outcrop of gently dipping shale beds in Batu Arang area (Photo courtesy of Prof. Dr. J.K. Raj, University of Malaya).
Figure 6: Geology and cross section of the Batu Arang area (Raj, J.K., et al., 2009).
56
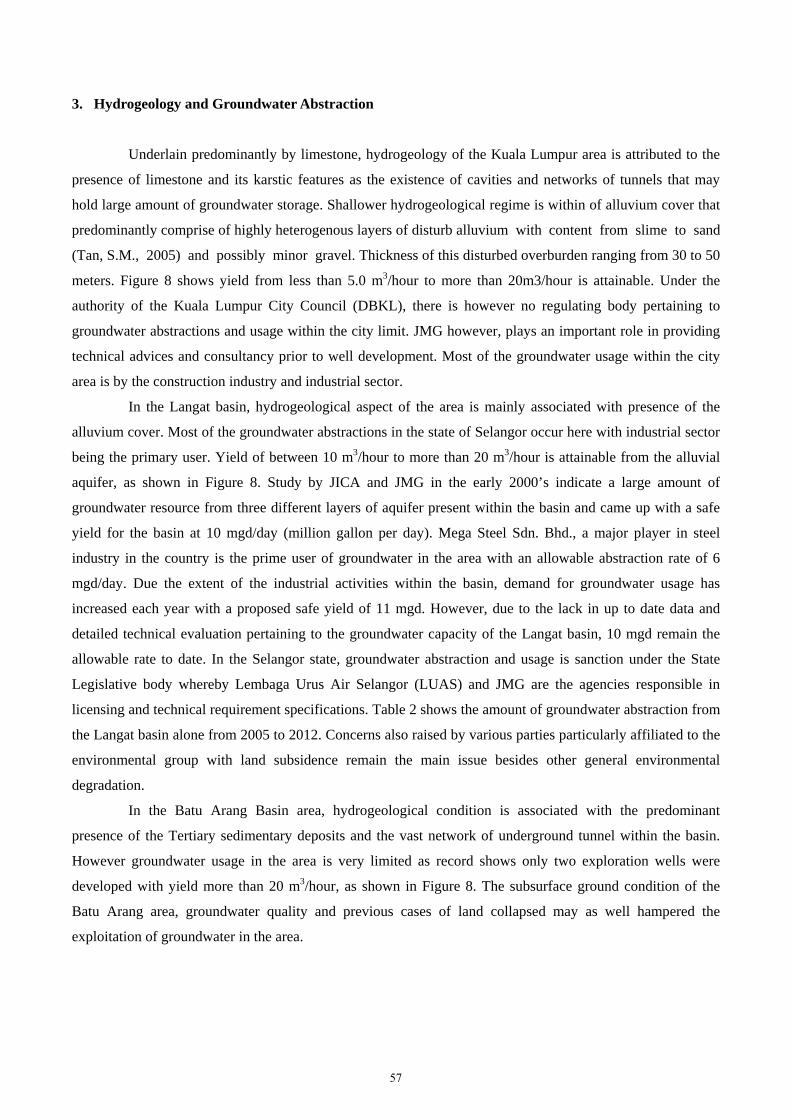
3. Hydrogeology and Groundwater Abstraction
Underlain predominantly by limestone, hydrogeology of the Kuala Lumpur area is attributed to the
presence of limestone and its karstic features as the existence of cavities and networks of tunnels that may
hold large amount of groundwater storage. Shallower hydrogeological regime is within of alluvium cover that
predominantly comprise of highly heterogenous layers of disturb alluvium with content from slime to sand
(Tan, S.M., 2005) and possibly minor gravel. Thickness of this disturbed overburden ranging from 30 to 50
meters. Figure 8 shows yield from less than 5.0 m3/hour to more than 20m3/hour is attainable. Under the
authority of the Kuala Lumpur City Council (DBKL), there is however no regulating body pertaining to
groundwater abstractions and usage within the city limit. JMG however, plays an important role in providing
technical advices and consultancy prior to well development. Most of the groundwater usage within the city
area is by the construction industry and industrial sector.
In the Langat basin, hydrogeological aspect of the area is mainly associated with presence of the
alluvium cover. Most of the groundwater abstractions in the state of Selangor occur here with industrial sector
being the primary user. Yield of between 10 m3/hour to more than 20 m3/hour is attainable from the alluvial
aquifer, as shown in Figure 8. Study by JICA and JMG in the early 2000’s indicate a large amount of
groundwater resource from three different layers of aquifer present within the basin and came up with a safe
yield for the basin at 10 mgd/day (million gallon per day). Mega Steel Sdn. Bhd., a major player in steel
industry in the country is the prime user of groundwater in the area with an allowable abstraction rate of 6
mgd/day. Due the extent of the industrial activities within the basin, demand for groundwater usage has
increased each year with a proposed safe yield of 11 mgd. However, due to the lack in up to date data and
detailed technical evaluation pertaining to the groundwater capacity of the Langat basin, 10 mgd remain the
allowable rate to date. In the Selangor state, groundwater abstraction and usage is sanction under the State
Legislative body whereby Lembaga Urus Air Selangor (LUAS) and JMG are the agencies responsible in
licensing and technical requirement specifications. Table 2 shows the amount of groundwater abstraction from
the Langat basin alone from 2005 to 2012. Concerns also raised by various parties particularly affiliated to the
environmental group with land subsidence remain the main issue besides other general environmental
degradation.
In the Batu Arang Basin area, hydrogeological condition is associated with the predominant
presence of the Tertiary sedimentary deposits and the vast network of underground tunnel within the basin.
However groundwater usage in the area is very limited as record shows only two exploration wells were
developed with yield more than 20 m3/hour, as shown in Figure 8. The subsurface ground condition of the
Batu Arang area, groundwater quality and previous cases of land collapsed may as well hampered the
exploitation of groundwater in the area.
57
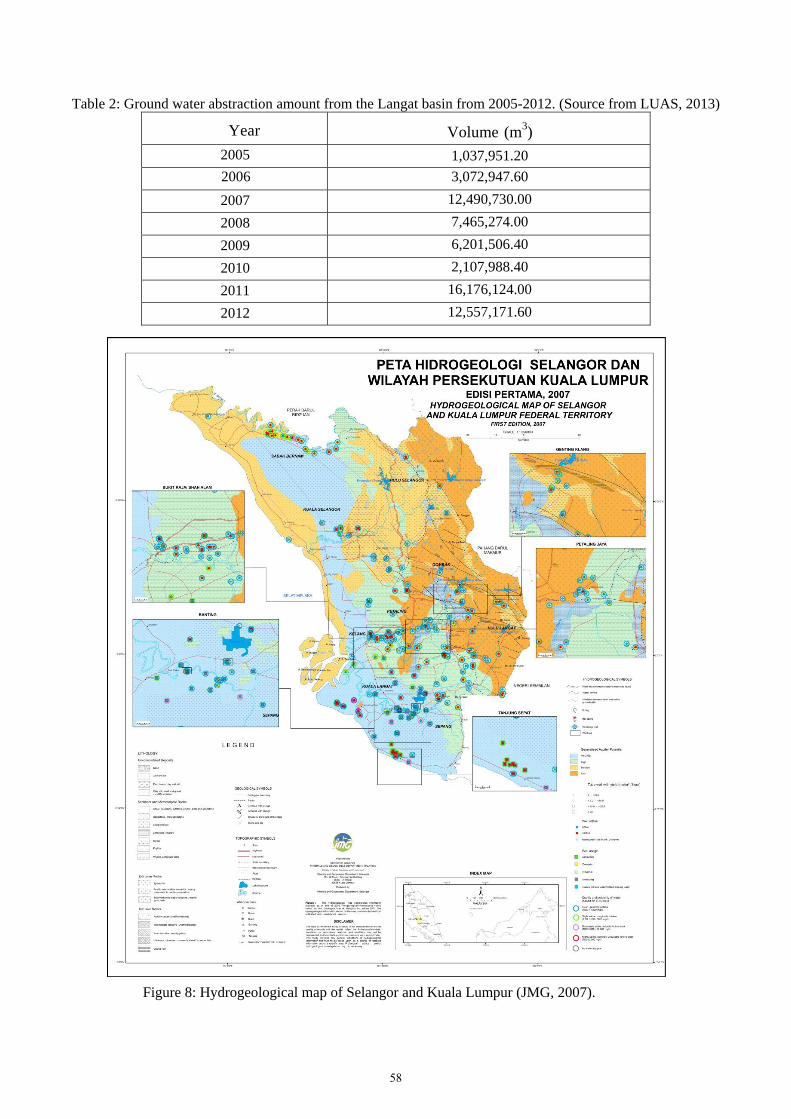
Table 2: Ground water abstraction amount from the Langat basin from 2005-2012. (Source from LUAS, 2013)
Year Volume (m3)
2005 1,037,951.20
2006 3,072,947.60
2007 12,490,730.00
2008 7,465,274.00
2009 6,201,506.40
2010 2,107,988.40
2011 16,176,124.00
2012 12,557,171.60
Figure 8: Hydrogeological map of Selangor and Kuala Lumpur (JMG, 2007).
58
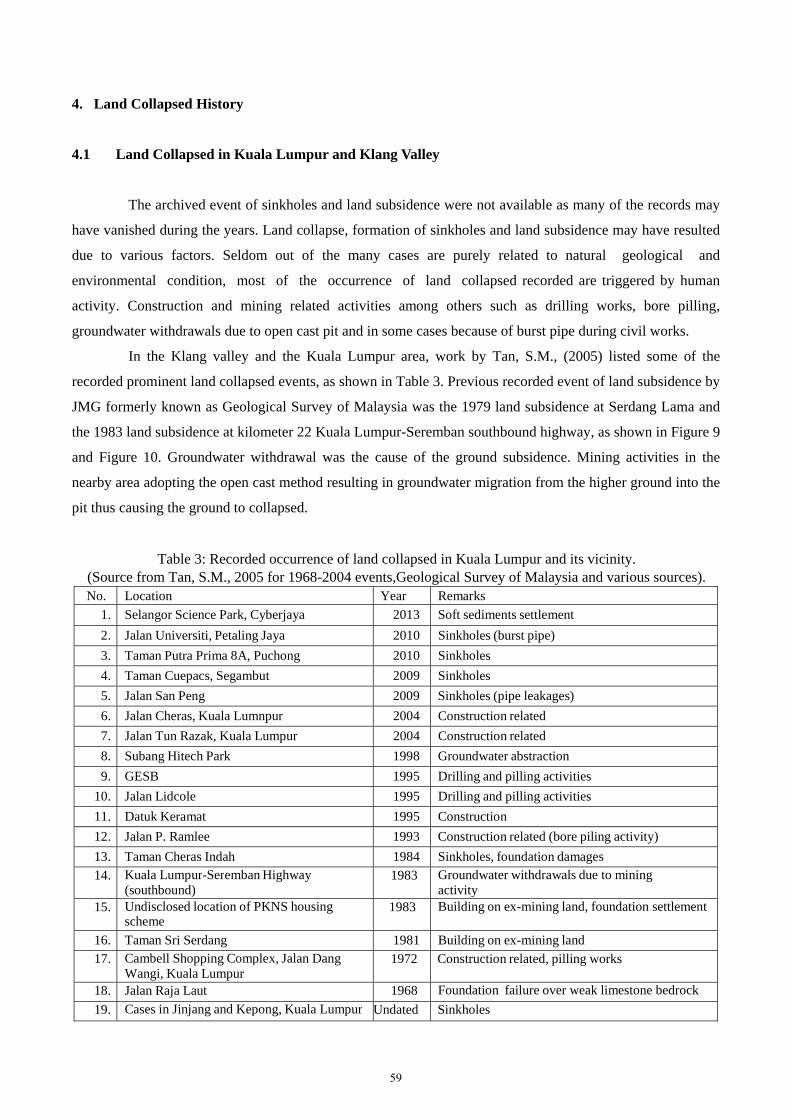
4. Land Collapsed History
4.1 Land Collapsed in Kuala Lumpur and Klang Valley
The archived event of sinkholes and land subsidence were not available as many of the records may
have vanished during the years. Land collapse, formation of sinkholes and land subsidence may have resulted
due to various factors. Seldom out of the many cases are purely related to natural geological and
environmental condition, most of the occurrence of land collapsed recorded are triggered by human
activity. Construction and mining related activities among others such as drilling works, bore pilling,
groundwater withdrawals due to open cast pit and in some cases because of burst pipe during civil works.
In the Klang valley and the Kuala Lumpur area, work by Tan, S.M., (2005) listed some of the
recorded prominent land collapsed events, as shown in Table 3. Previous recorded event of land subsidence by
JMG formerly known as Geological Survey of Malaysia was the 1979 land subsidence at Serdang Lama and
the 1983 land subsidence at kilometer 22 Kuala Lumpur-Seremban southbound highway, as shown in Figure 9
and Figure 10. Groundwater withdrawal was the cause of the ground subsidence. Mining activities in the
nearby area adopting the open cast method resulting in groundwater migration from the higher ground into the
pit thus causing the ground to collapsed.
Table 3: Recorded occurrence of land collapsed in Kuala Lumpur and its vicinity. (Source from Tan, S.M., 2005 for 1968-2004 events,Geological Survey of Malaysia and various sources).
No. Location Year Remarks
1. Selangor Science Park, Cyberjaya 2013 Soft sediments settlement
2. Jalan Universiti, Petaling Jaya 2010 Sinkholes (burst pipe)
3. Taman Putra Prima 8A, Puchong 2010 Sinkholes
4. Taman Cuepacs, Segambut 2009 Sinkholes
5. Jalan San Peng 2009 Sinkholes (pipe leakages)
6. Jalan Cheras, Kuala Lumnpur 2004 Construction related
7. Jalan Tun Razak, Kuala Lumpur 2004 Construction related
8. Subang Hitech Park 1998 Groundwater abstraction
9. GESB 1995 Drilling and pilling activities
10. Jalan Lidcole 1995 Drilling and pilling activities
11. Datuk Keramat 1995 Construction
12. Jalan P. Ramlee 1993 Construction related (bore piling activity)
13. Taman Cheras Indah 1984 Sinkholes, foundation damages
14. Kuala Lumpur-Seremban Highway (southbound)
1983 Groundwater withdrawals due to mining activity
15. Undisclosed location of PKNS housingscheme
1983 Building on ex-mining land, foundation settlement
16. Taman Sri Serdang 1981 Building on ex-mining land
17. Cambell Shopping Complex, Jalan DangWangi, Kuala Lumpur
1972 Construction related, pilling works
18. Jalan Raja Laut 1968 Foundation failure over weak limestone bedrock
19. Cases in Jinjang and Kepong, Kuala Lumpur Undated Sinkholes
59
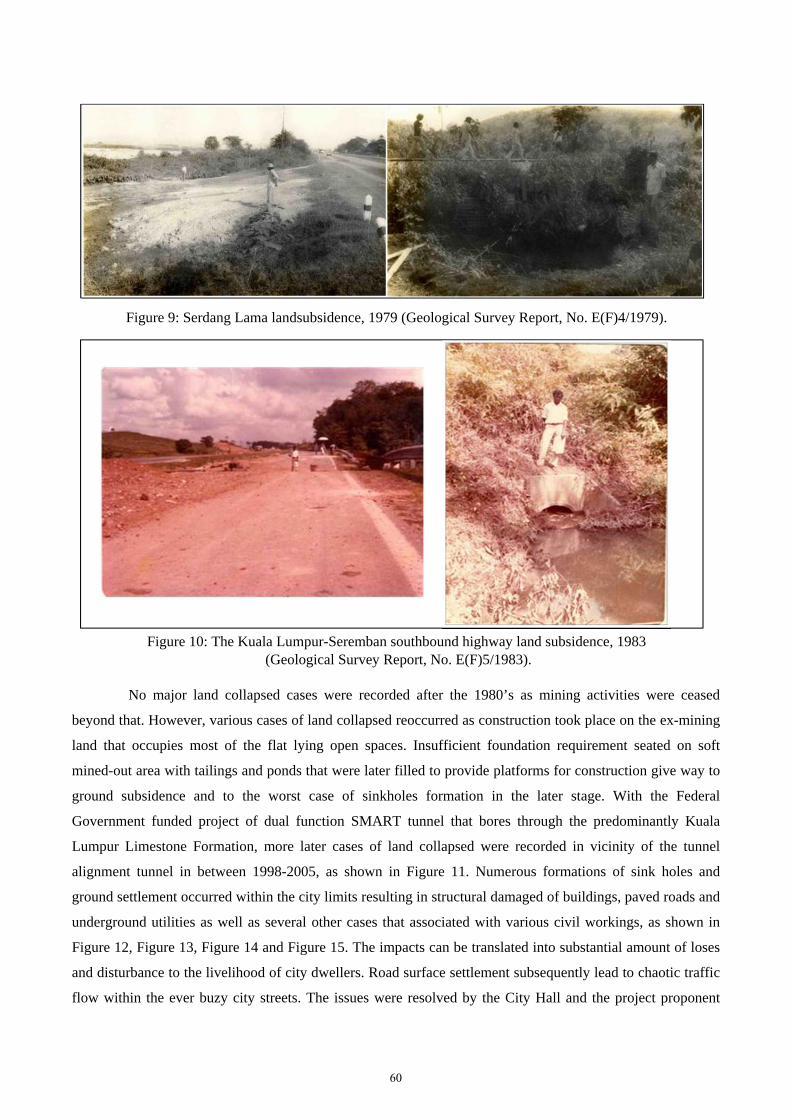
Figure 9: Serdang Lama landsubsidence, 1979 (Geological Survey Report, No. E(F)4/1979).
Figure 10: The Kuala Lumpur-Seremban southbound highway land subsidence, 1983 (Geological Survey Report, No. E(F)5/1983).
No major land collapsed cases were recorded after the 1980’s as mining activities were ceased
beyond that. However, various cases of land collapsed reoccurred as construction took place on the ex-mining
land that occupies most of the flat lying open spaces. Insufficient foundation requirement seated on soft
mined-out area with tailings and ponds that were later filled to provide platforms for construction give way to
ground subsidence and to the worst case of sinkholes formation in the later stage. With the Federal
Government funded project of dual function SMART tunnel that bores through the predominantly Kuala
Lumpur Limestone Formation, more later cases of land collapsed were recorded in vicinity of the tunnel
alignment tunnel in between 1998-2005, as shown in Figure 11. Numerous formations of sink holes and
ground settlement occurred within the city limits resulting in structural damaged of buildings, paved roads and
underground utilities as well as several other cases that associated with various civil workings, as shown in
Figure 12, Figure 13, Figure 14 and Figure 15. The impacts can be translated into substantial amount of loses
and disturbance to the livelihood of city dwellers. Road surface settlement subsequently lead to chaotic traffic
flow within the ever buzy city streets. The issues were resolved by the City Hall and the project proponent
60
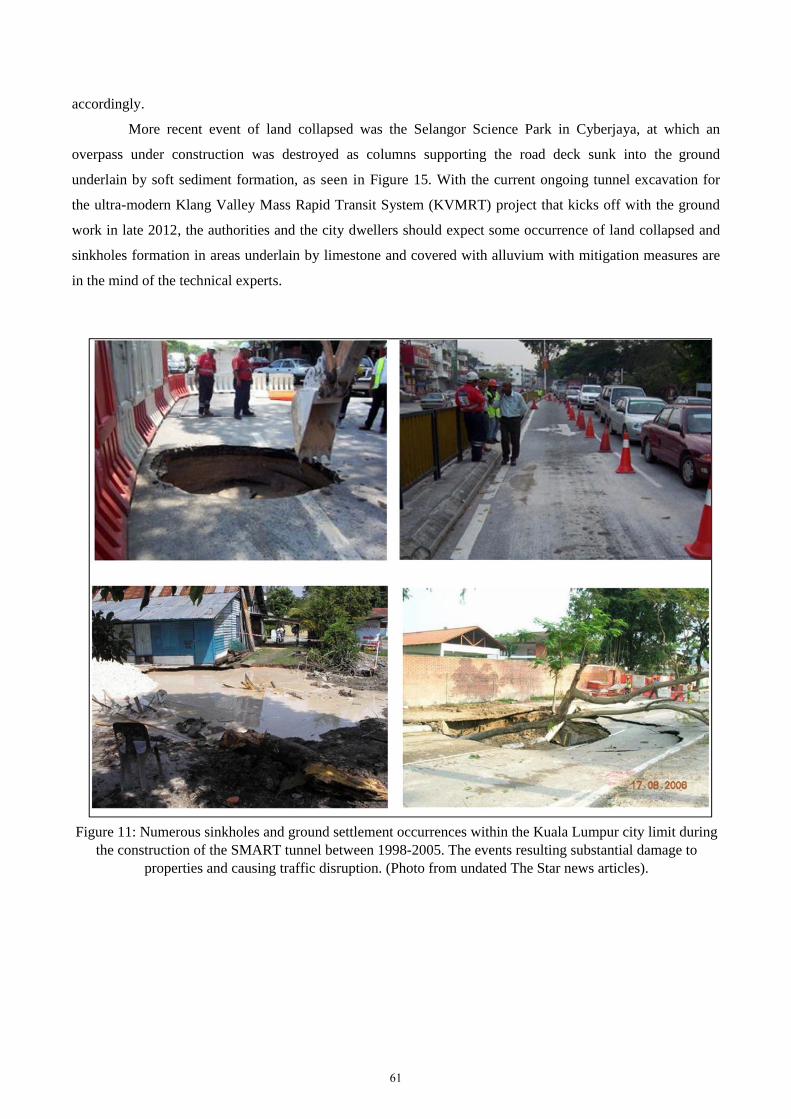
accordingly.
More recent event of land collapsed was the Selangor Science Park in Cyberjaya, at which an
overpass under construction was destroyed as columns supporting the road deck sunk into the ground
underlain by soft sediment formation, as seen in Figure 15. With the current ongoing tunnel excavation for
the ultra-modern Klang Valley Mass Rapid Transit System (KVMRT) project that kicks off with the ground
work in late 2012, the authorities and the city dwellers should expect some occurrence of land collapsed and
sinkholes formation in areas underlain by limestone and covered with alluvium with mitigation measures are
in the mind of the technical experts.
Figure 11: Numerous sinkholes and ground settlement occurrences within the Kuala Lumpur city limit during
the construction of the SMART tunnel between 1998-2005. The events resulting substantial damage to properties and causing traffic disruption. (Photo from undated The Star news articles).
61
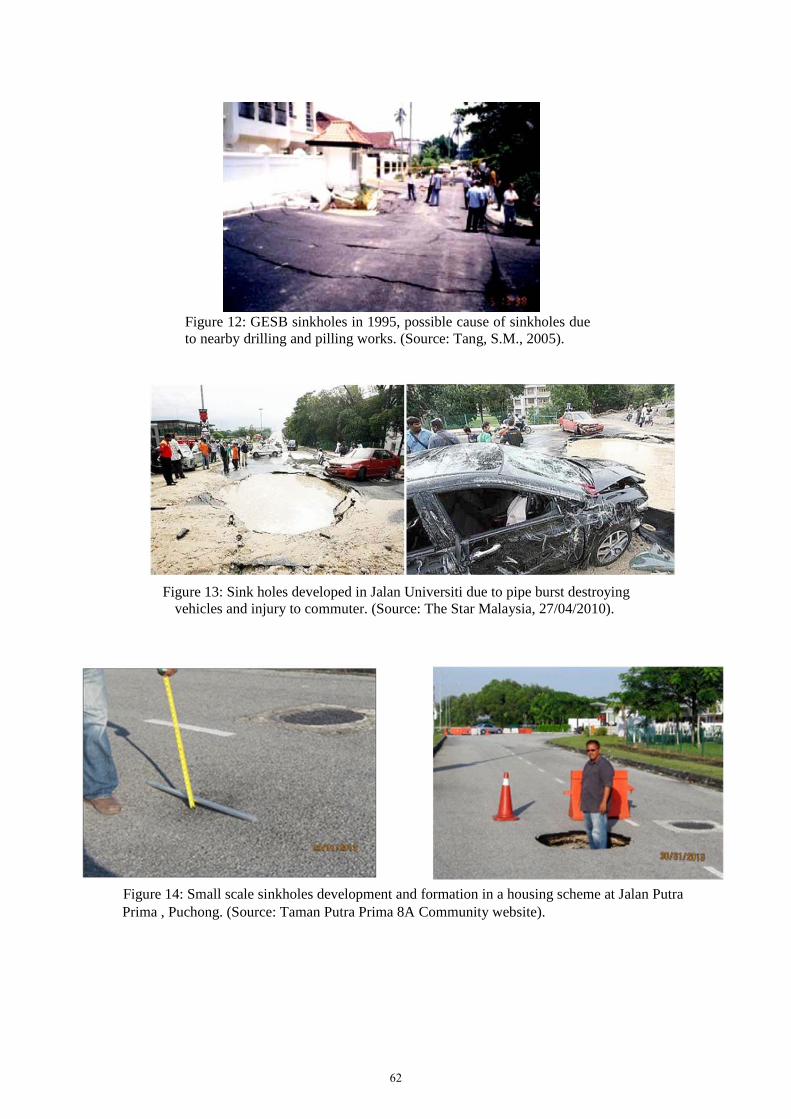
Figure 12: GESB sinkholes in 1995, possible cause of sinkholes due to nearby drilling and pilling works. (Source: Tang, S.M., 2005).
Figure 13: Sink holes developed in Jalan Universiti due to pipe burst destroying vehicles and injury to commuter. (Source: The Star Malaysia, 27/04/2010).
Figure 14: Small scale sinkholes development and formation in a housing scheme at Jalan Putra Prima , Puchong. (Source: Taman Putra Prima 8A Community website).
62
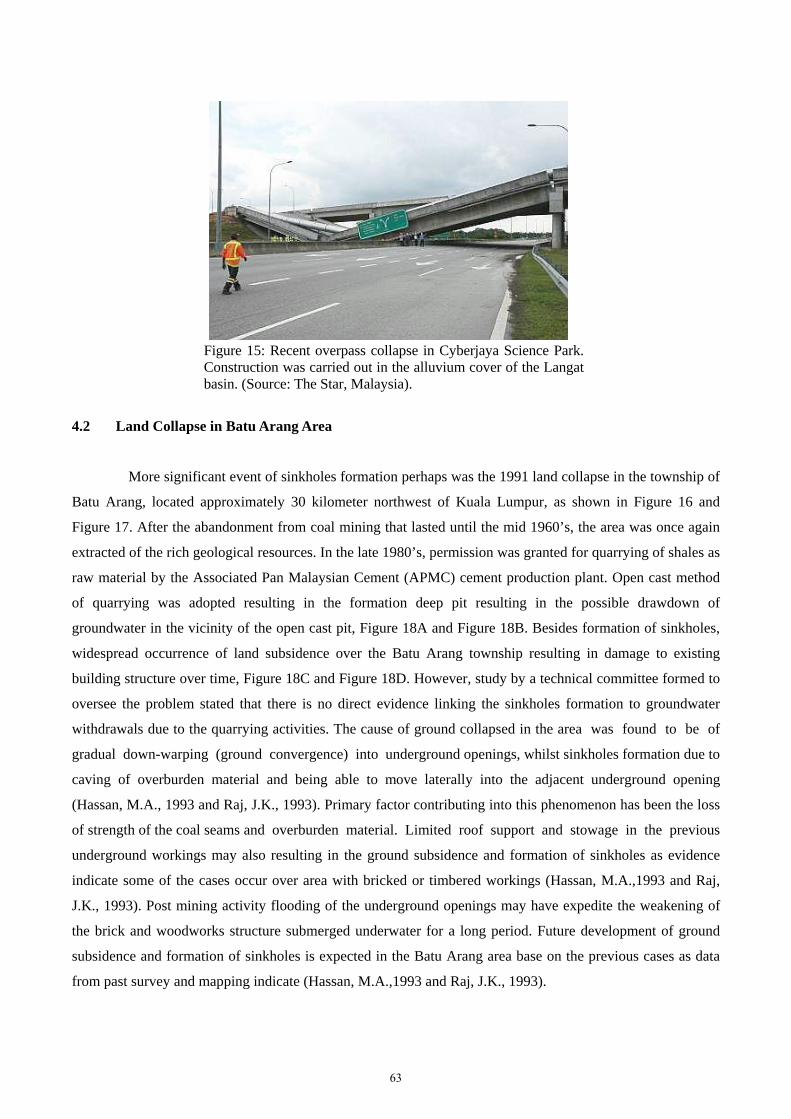
Figure 15: Recent overpass collapse in Cyberjaya Science Park. Construction was carried out in the alluvium cover of the Langat basin. (Source: The Star, Malaysia).
4.2 Land Collapse in Batu Arang Area
More significant event of sinkholes formation perhaps was the 1991 land collapse in the township of
Batu Arang, located approximately 30 kilometer northwest of Kuala Lumpur, as shown in Figure 16 and
Figure 17. After the abandonment from coal mining that lasted until the mid 1960’s, the area was once again
extracted of the rich geological resources. In the late 1980’s, permission was granted for quarrying of shales as
raw material by the Associated Pan Malaysian Cement (APMC) cement production plant. Open cast method
of quarrying was adopted resulting in the formation deep pit resulting in the possible drawdown of
groundwater in the vicinity of the open cast pit, Figure 18A and Figure 18B. Besides formation of sinkholes,
widespread occurrence of land subsidence over the Batu Arang township resulting in damage to existing
building structure over time, Figure 18C and Figure 18D. However, study by a technical committee formed to
oversee the problem stated that there is no direct evidence linking the sinkholes formation to groundwater
withdrawals due to the quarrying activities. The cause of ground collapsed in the area was found to be of
gradual down-warping (ground convergence) into underground openings, whilst sinkholes formation due to
caving of overburden material and being able to move laterally into the adjacent underground opening
(Hassan, M.A., 1993 and Raj, J.K., 1993). Primary factor contributing into this phenomenon has been the loss
of strength of the coal seams and overburden material. Limited roof support and stowage in the previous
underground workings may also resulting in the ground subsidence and formation of sinkholes as evidence
indicate some of the cases occur over area with bricked or timbered workings (Hassan, M.A.,1993 and Raj,
J.K., 1993). Post mining activity flooding of the underground openings may have expedite the weakening of
the brick and woodworks structure submerged underwater for a long period. Future development of ground
subsidence and formation of sinkholes is expected in the Batu Arang area base on the previous cases as data
from past survey and mapping indicate (Hassan, M.A.,1993 and Raj, J.K., 1993).
63
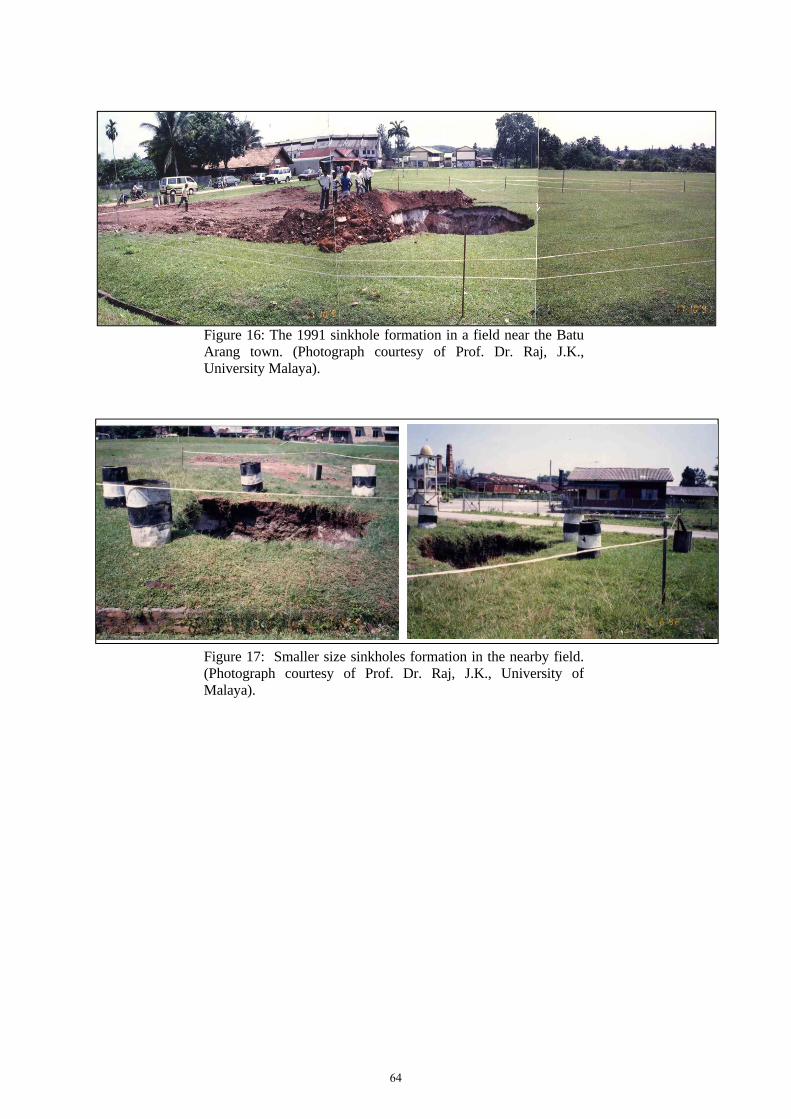
Figure 16: The 1991 sinkhole formation in a field near the Batu Arang town. (Photograph courtesy of Prof. Dr. Raj, J.K., University Malaya). Figure 17: Smaller size sinkholes formation in the nearby field. (Photograph courtesy of Prof. Dr. Raj, J.K., University of Malaya).
64
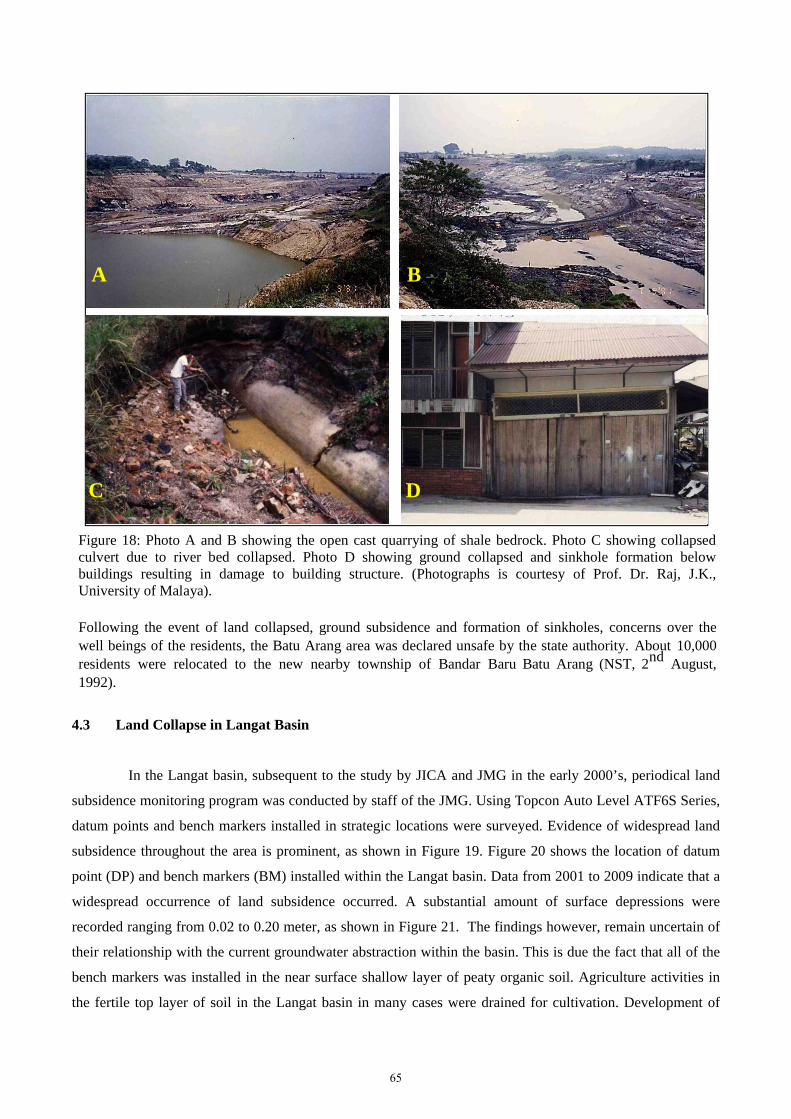
A B
C D
Figure 18: Photo A and B showing the open cast quarrying of shale bedrock. Photo C showing collapsed culvert due to river bed collapsed. Photo D showing ground collapsed and sinkhole formation below buildings resulting in damage to building structure. (Photographs is courtesy of Prof. Dr. Raj, J.K., University of Malaya). Following the event of land collapsed, ground subsidence and formation of sinkholes, concerns over the well beings of the residents, the Batu Arang area was declared unsafe by the state authority. About 10,000 residents were relocated to the new nearby township of Bandar Baru Batu Arang (NST, 2nd August, 1992).
4.3 Land Collapse in Langat Basin
In the Langat basin, subsequent to the study by JICA and JMG in the early 2000’s, periodical land
subsidence monitoring program was conducted by staff of the JMG. Using Topcon Auto Level ATF6S Series,
datum points and bench markers installed in strategic locations were surveyed. Evidence of widespread land
subsidence throughout the area is prominent, as shown in Figure 19. Figure 20 shows the location of datum
point (DP) and bench markers (BM) installed within the Langat basin. Data from 2001 to 2009 indicate that a
widespread occurrence of land subsidence occurred. A substantial amount of surface depressions were
recorded ranging from 0.02 to 0.20 meter, as shown in Figure 21. The findings however, remain uncertain of
their relationship with the current groundwater abstraction within the basin. This is due the fact that all of the
bench markers was installed in the near surface shallow layer of peaty organic soil. Agriculture activities in
the fertile top layer of soil in the Langat basin in many cases were drained for cultivation. Development of
65
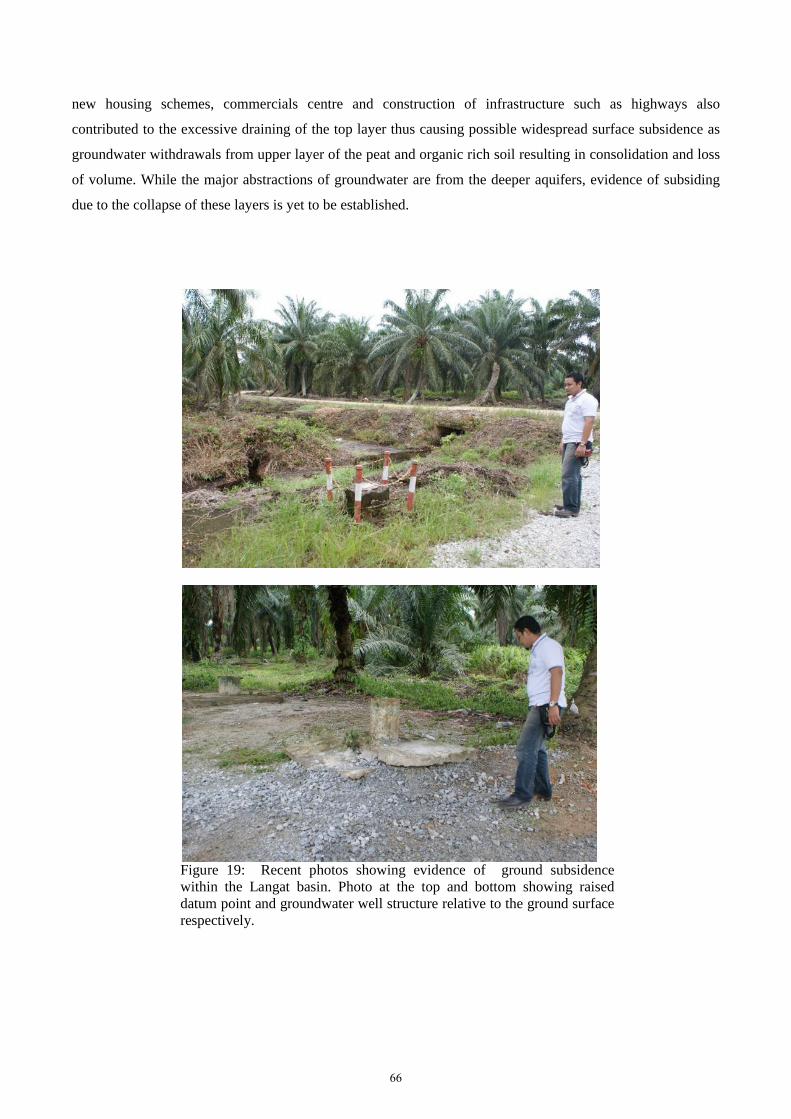
new housing schemes, commercials centre and construction of infrastructure such as highways also
contributed to the excessive draining of the top layer thus causing possible widespread surface subsidence as
groundwater withdrawals from upper layer of the peat and organic rich soil resulting in consolidation and loss
of volume. While the major abstractions of groundwater are from the deeper aquifers, evidence of subsiding
due to the collapse of these layers is yet to be established.
Figure 19: Recent photos showing evidence of ground subsidence within the Langat basin. Photo at the top and bottom showing raised datum point and groundwater well structure relative to the ground surface respectively.
66
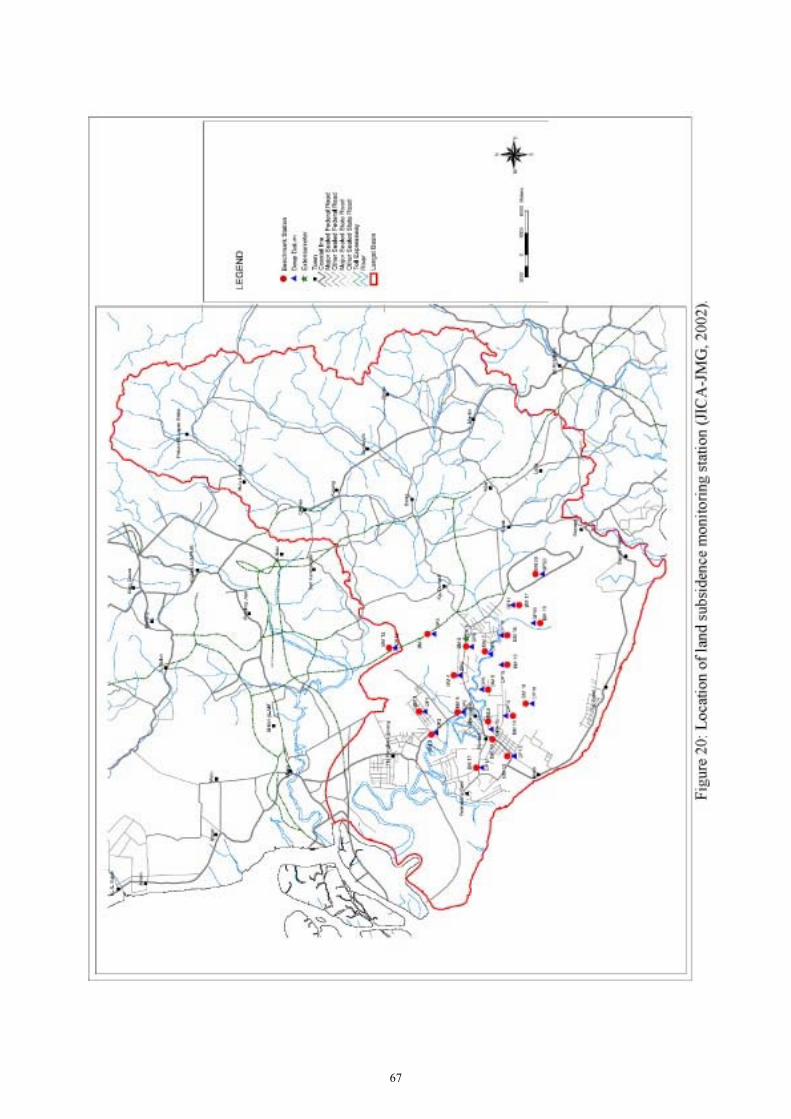
67
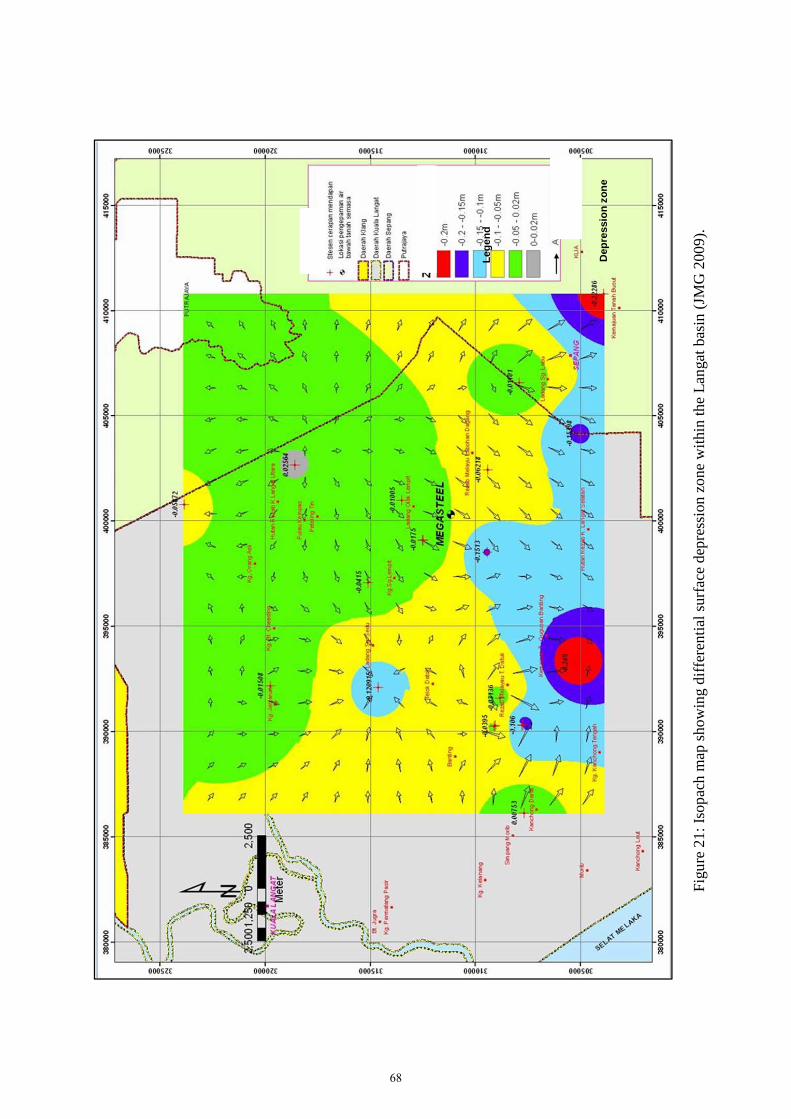
L
egen
d
D
epre
ssio
n z
on
e
Figu
re 2
1: I
sopa
ch m
ap s
how
ing
diff
eren
tial
sur
face
dep
ress
ion
zone
wit
hin
the
Lan
gat b
asin
(JM
G 2
009)
.
68
5. Conclusions
Land collapsed issues or land subsidence within the Kuala Lumpur in particular and the Klang
valley in general had been attributed to the presence of the limestone bedrock in the area. Presence of
layer of disturbed alluvium cover contributed further to the fragile ground condition resulting in the
occurrence of ground subsidence and the formation of sinkholes that commonly triggered by lowering of
groundwater table due to civil works. Past mining activity in the Batu Arang area, resulting in the
formation of vast network of underground working thus creating an unstable ground condition that is
prone to eventual land collapsed. As for the Langat basin, while development and agricultural activities
contributed to the draining of the peaty soil layer, groundwater abstraction may play and important role
too in contributing the current issue of widespread land subsidence in the area at which further detail
study is necessary to establish the condition. While development is thriving in the Klang Valley and
Selangor in general, activities on these fragile ground must be well regulated, with land collapsed issues
amongst to be taken into the hands of the authority and technical experts as to safeguard the environment
and the inhabitants.
References: Detlef, B. ( 2001): Groundwater exploration adjacent to the Kuala Lumpur International
Airport/Malaysia-challenges and chances of exploring a fractured rock aquifer. Coffey Geotechnics Pty Ltd, Australia.
Hutchison, C.S and Tan, D.N.K. (2009): Geology of Peninsular Malaysia. The University of Malaya and The Geological Society of Malaysia.
Ooi, L.H. ( 2013): Geology is Important - The Art & Science of Underground Works in Karst - 29-30 Jan 2013. IGM Outreach Program 2013.
Mohamad Ali Hassan (1993): Subsidence history and future subsidence in the Batu Arang area, Selangor Darul Ehsan-some further thoughts. Ann. Conf. Geol. Soc. Malaysia.
News Straits Times, August 2nd 1991. Raj, J.K. ( 1993): Coal mining and ground surface subsidence at Batu Arang, Negeri Selangor
Darul Ehsan. Ann. Conf. Geol. Soc. Malaysia. Shu, Y.K. (1983): Subsidence at 22 KM, Kuala Lumpur-Seremban Highway. Geological Survey Report,
E(F)5. Shu, Y.K. and Chow, W.S. (1979): Land Subsidence at Serdang Lama, Selangor Volume I.
Geological Survey Report, E(F)4 Tan, B.K. ( 2006): Urban Geology of Kuala Lumpur and Ipoh, MalaysiaEnvironmental. IAEG2006
Paper, 24. Tan, S.M. (2005): Karstic Features of Kuala Lumpur Limestone. Bulettin IEM. Zeinab, B. et al., (1996): An Overview of Subsurface Karst Features Associated with Geological
Studies in Malaysia. Mountainous Terrain Development Research Center Department of Civil Engineering and Faculty of Engineering, University Putra Malaysia.
69
Groundwater Resources Development in Myanmar
Win Myint
Department of Geological Survey and Mineral Exploration, Ministry of Mines,
the Republic of the Union of Myanmar
1. Introduction
Myanmar is situated in Sourth-East Asia between latitudes 9° 32' and 28° 31' N and longitudes 92°
10' and 101° 11' E and has a total land area of 676, 577 sq.km (261, 227 Sq mi). It extends 1,931 km (1,200 mi)
north to south and 925 km (575 mi) east to west. It has a total coastline of 2,276 km (1,414 mi) and total
international land borders of 5,858 km (3,641 mi) with five countries as follows: China (2,185 km, 1,357 mi),
Thailand (1,799 km, 1,118 mi), India (1,403 km, 872 mi), Laos DPR (238 km, 148 mi) and Bangladesh (233
km, 145 mi). Most of the land frontiers are defined by mountains.
1.1 Population
The present population of Myanmar is estimated at 54.3 million and rural population is about 70% of
total. The projection for 2015 will become 63.4 million and it is expected to increase by around 50% by the
year 2025. The present average population density of the country is nearly one person per hectare.
1.2 Country Economy
Myanmar is an agro-based country, and agricultural sector is the back bone of its economy.
Agricultural sector contributes 43% of GDP, 15% of total export earnings, and employs 63% of the labour
force.
1.3 Land Utilization
Twenty five percent of the total area of the country is a culturable land. Presently, there are about
26.89 m acres (1.88 m ha) of net sown area in Mynmar. Expansion of new agricultural land, remaining 0.89
million acres (0.36 m ha) fallow land and 15.22 million acres (6.16 m ha) cultivable land is being encouraged.
The following is some data for land utilization in Myanmar (2005-2006).
Land Utilization in Myanmar (2005-2006) (m ha)
Net sown area 10.88
Fallow land 0.36
70
Cultivable waste land 6.16
Reserved forests 16.72
Other forests 16.88
Others 16.65
Total 67.65
1.4 Administrative Regions
The administrative regions of the country consists of seven States Divisions as follows:
1. Kachin State 8. Magway Region
2. Kayah State 9. Mandalay Region
3. Kayin State 10. Mon Region
4. Chin State 11. Rakhine State
5. Sagaing Region 12. Yangon Region
6. Tanintharyi Region 13. Shan State
7. Bago Region 14. Ayeyarwady Region
2. General Geology
Myanmar relative to its size, possesses an impressive record of rocks representing practieally as the
standard periods of the geologic column. It is conveniently divisible into four geological regions each of
which by its own right is a geotectonic belt possessing a separate stratigraphic succession and a deformational
history. They are from east to west: the Eastern Highlands, the Central Belt, the Western Ranges, and the
Rakhine Coastal Belt.
2.1 Eastern Highlands
The Eastern Highlands which include the northern and eastern mountainous tract of the
Kachin State in the north, the Shan Plateau in the middle, and the Tanintharyi ranges in the south. The
presence of Precambrian orthogneisses and low-grade meta-sedimentary rocks (Chaung Magyi Group),
Paleozoic and Mesozoic carbonates, clastics, and igneous rocks enable this province to remain as a highland,
locally with Karst topography in the limesones areas. The Chaung Magyi sediments were laid down probably
in a eugeosyline, the Paleozoic carbonates and clastics in a shallow sea, and Mesozoic clastics and evaporates
in enclosed and intermontane the opirogenic movements at the end of Mesozoic. Since then, it has been a
fairly stable block. Large linear granitoid plutons of mainly Upper Mesozoic and Lower Tertiary ages intruded
along the western marginal zone of this province. These plutons were subduction-related igneous bodies that
71
intruded along the weak junction zone between the tectonic provinces during late Mesozoic and Early Tertiary.
2.2 Central Lowlands or Central Cenozoic Belt
The Shan Plateau and Western Mountains were uplifted during late Cretaceous and early Tertiary
times. The Central Belt was then a subsiding trough which was gradually infilled with vest thickness of
sediments possibly exceeding 75,000 feet. Fluviatile and deltaic sedimentation continually advanced to the
south. In general, the northen portion of the Central Belt is characterized by the continental sedimentation
whereas the southern part is marine. In the late Tertiary, tectonic movements resulted in broad folding and
occasionally thrusting of the Tertiary sediments (general north-northwest strike for folds; north-northwest and
north-east fault systems); the Bago Yoma hills were uplifted during this period and divided the southern part
of the Central Belt into two alluvial valleys. Recently, the Ayeyarwaddy/Chidwin system has built up a huge
alluvial delta to the Andaman Sea. Earth movements have continued and have affected the deposition of the
Quaternary alluvium.
The General type area for the Tertiary sediments is the Minbu Basin in the Central Myanmar. Here,
the Eocenes, Peguan and Irrawaddian Series are separated from one another by unconformities. The Central
Volcanic Line has divided this province into two halves since about Miocene. This igneous line starts from the
Jade Mines area in the north, through the Wuntho igneous mass, Lower Chidwin Volcanoes, Salingyi,
Shinmadaung, Mt. Popa, east of Zegon and Tharyarwady, to Myaungmya area in the south. The well-known
Sagaing Fault, a right-lateral strike-slip fault, that runs north-south for a distance of nearly 600 miles is located
near the eastern edge of the province.
2.3 Western Ranges or Indo-Burma Ranges
It comprises Naga Hills, Chin Hills and Rakhine Yoma. They are underlain by a thick, mildly
deformed, tightly folded and weakly metamorphosed sequence of flysch type deposits, which apparently were
deposited in as subduction trench that lay between the Eurasian plate and northeastward-subducting Indian
plate. Exotic limestone ranging in size from tiny blocks to mappable units, ophiolites and metamorphic
tectonites are locally present within the disrupted flysch deposits. The Western Ranges arose as the results of
folding, over thrusting and uplifting during the Early Himalayan Orogeny at the close of Eocene.
2.4 Rakhine Coastal Belt
The Rakhine Coastal lowland is underlain by Upper Creataceous type deposits and lower Tertiary
rocks in the south and by Upper Tertiary clastic sedimentary rocks of molassic character in the north. The
strata are tightly folded and form chains of low hills. It is the southern continuation of the Assam Basin in
northeastern India where a thick Tertiary succession is also present. The Minbu and Assam Basins are fairly
72
similar not only stratigraphy and lithology, but also in the occurrence of oil and gas, especially in the
Oligocene and Miocene formations.
3. Physiography and Drainage
The physiography of Myanmar closely reflects its geology. Then the country can be divided into
four physiographic units corresponding to the geological units listed in the previous section. Major drainage
lines in Myanmar are from north to south.
The deeply dissected Shan Plateau rises to an average elevation of about 914 m (3,000 ft) above sea
level. The western edge is clearly marked off from the Central Belt by a north-south cliff or fault scarp, which
often rises 610 m (2,000 ft) in a single step. Much of the surface of this plateau is of a steeply rolling, hilly
nature. In other parts mountain masses rise abruptly to heights of 1,829 m (6,000 ft) or more. Several of the
shorter streams in this plateau flow sluggishly throurgh broad valleys, but the largest river, the Thanlwin, is
deeply entrenched. It flows as series of rapids and waterfalls through, steep, narrow valleys.
To the south towards the Isthmus of Kra, the ranges of the Malay Peninsula are repeated northward
to merge with the plateau. This area, roughly corresponding to the tail of kite, is sometimes treated as a
separate region. It is, however, topographically associated with the Shan Plateau.
The major part of the Central Belt is composed of ancient valleys that have been covered by deep,
alluvial deposits through which the Ayeyarwaddy, its tributary the Chindwin, and the Sittoung rivers flow.
The lower valeys of the Ayeyarwaddy and Sittoung rivers form a vast low lying delta area of about 25,900
sq.km (10,000 sq.mi). The Delta continues to move seaward at a rate of 5 km (3 mi)per century because of the
heavy silting brought down by the rivers. The relief of the northern portion of the Central Belt where the
ridges of the Himalayan Mountains curve southward and become the mountain system of Myanmar eastern
frontier. These mountains are very high and rugged and Hkakabo Razi on the northern frontier, which rises to
almost 6,096 m (20,000 ft) and is the highest peak in the nation. Mount Saramati on the India border at 3,810
m (12,500 ft) is the second highest.
The Western Mountain Belt is composed of ranges that originates in the northern mountains and
continues southward to the extreme southern corner of the country. Here they disappear under the sea only to
reappear some 322 km (200 mi) offshore as India’s Andaman Islands. These ranges are known by several
names along the Myanmar-Assam border, but in the nouthern of the belt, where they lie entirely within
Myanmar, they are known as the Rakhine Mountains. As in the Shan Plateau, the landscape is dominated by a
series of parallel ridges separated by streams flowing in the restricted valleys. Here, however, the slopes are
very steep, and the mountains are far more rugged than any in the Shan Plateau. Mount Victoria, for example,
rising to about 3,048m (10,000 ft), is the highest peak in the Rakhine Mountains and the third highest in the
nation.
The Rakhine Coastal Strip is a narrow, predominantly alluvial belt lying between the Rakhine
Mountains and the Bay of Bengal. In its northern portion, there is a broad area of level land formed by flood
73
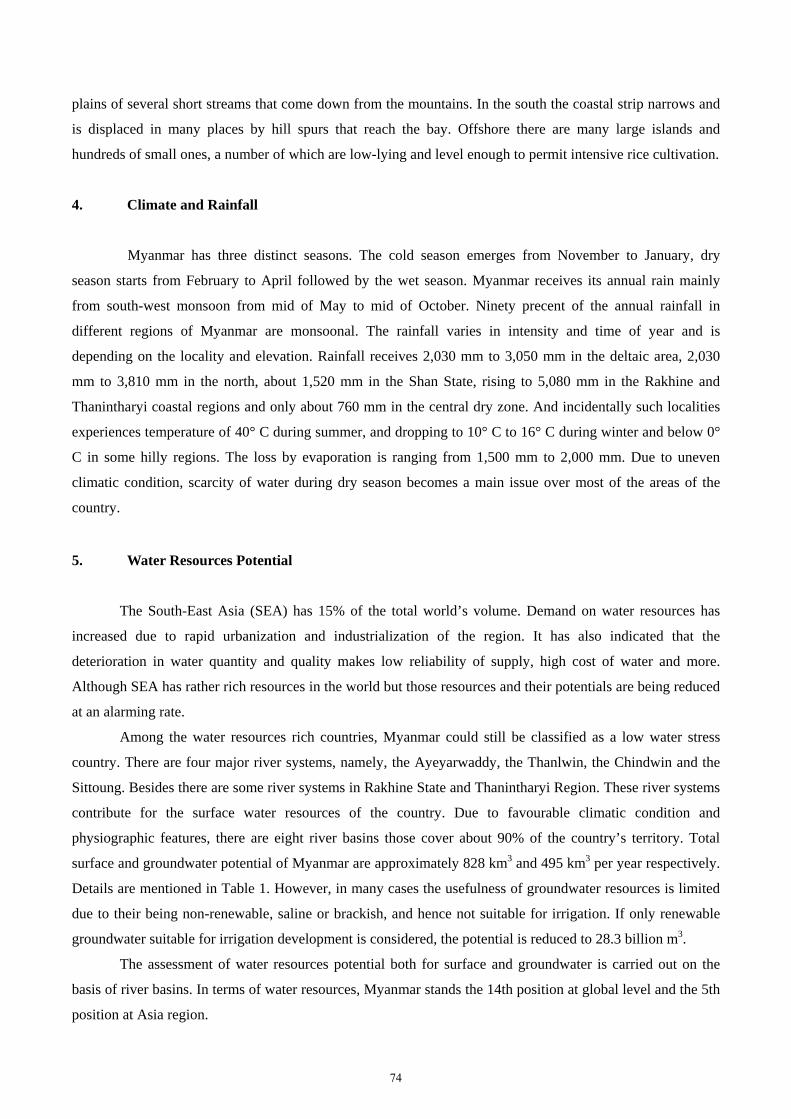
plains of several short streams that come down from the mountains. In the south the coastal strip narrows and
is displaced in many places by hill spurs that reach the bay. Offshore there are many large islands and
hundreds of small ones, a number of which are low-lying and level enough to permit intensive rice cultivation.
4. Climate and Rainfall
Myanmar has three distinct seasons. The cold season emerges from November to January, dry
season starts from February to April followed by the wet season. Myanmar receives its annual rain mainly
from south-west monsoon from mid of May to mid of October. Ninety precent of the annual rainfall in
different regions of Myanmar are monsoonal. The rainfall varies in intensity and time of year and is
depending on the locality and elevation. Rainfall receives 2,030 mm to 3,050 mm in the deltaic area, 2,030
mm to 3,810 mm in the north, about 1,520 mm in the Shan State, rising to 5,080 mm in the Rakhine and
Thanintharyi coastal regions and only about 760 mm in the central dry zone. And incidentally such localities
experiences temperature of 40° C during summer, and dropping to 10° C to 16° C during winter and below 0°
C in some hilly regions. The loss by evaporation is ranging from 1,500 mm to 2,000 mm. Due to uneven
climatic condition, scarcity of water during dry season becomes a main issue over most of the areas of the
country.
5. Water Resources Potential
The South-East Asia (SEA) has 15% of the total world’s volume. Demand on water resources has
increased due to rapid urbanization and industrialization of the region. It has also indicated that the
deterioration in water quantity and quality makes low reliability of supply, high cost of water and more.
Although SEA has rather rich resources in the world but those resources and their potentials are being reduced
at an alarming rate.
Among the water resources rich countries, Myanmar could still be classified as a low water stress
country. There are four major river systems, namely, the Ayeyarwaddy, the Thanlwin, the Chindwin and the
Sittoung. Besides there are some river systems in Rakhine State and Thanintharyi Region. These river systems
contribute for the surface water resources of the country. Due to favourable climatic condition and
physiographic features, there are eight river basins those cover about 90% of the country’s territory. Total
surface and groundwater potential of Myanmar are approximately 828 km3 and 495 km3 per year respectively.
Details are mentioned in Table 1. However, in many cases the usefulness of groundwater resources is limited
due to their being non-renewable, saline or brackish, and hence not suitable for irrigation. If only renewable
groundwater suitable for irrigation development is considered, the potential is reduced to 28.3 billion m3.
The assessment of water resources potential both for surface and groundwater is carried out on the
basis of river basins. In terms of water resources, Myanmar stands the 14th position at global level and the 5th
position at Asia region.
74
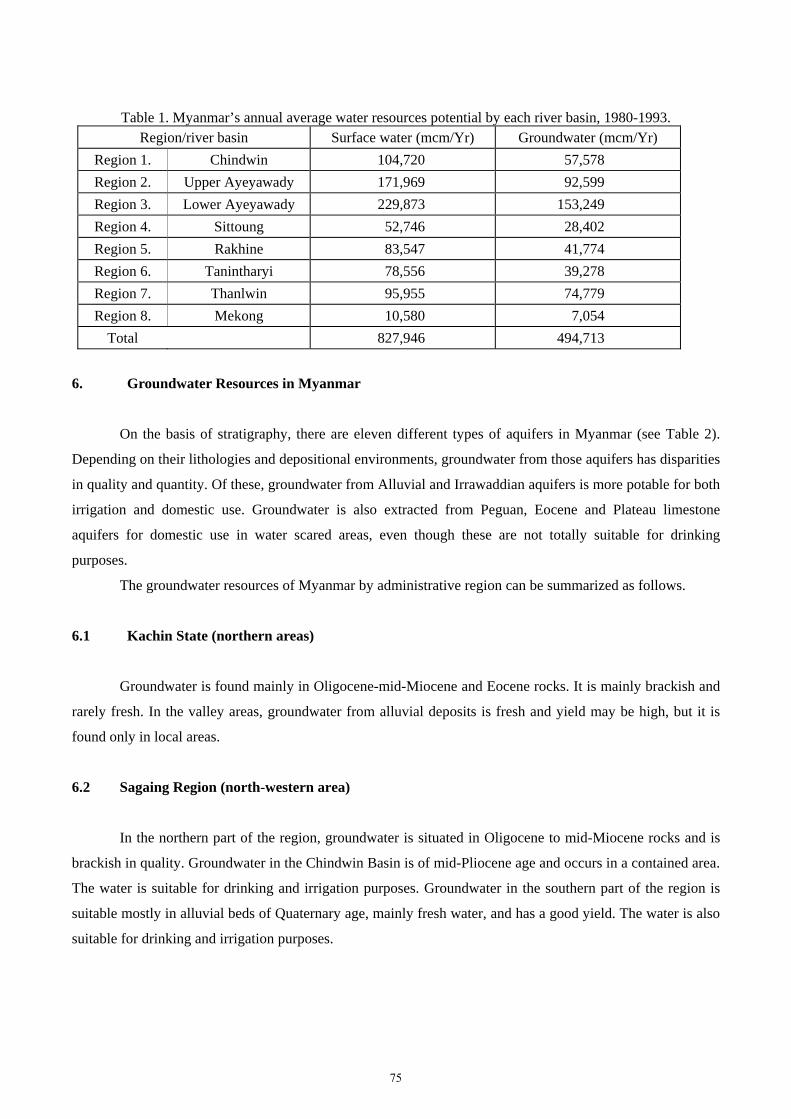
Table 1. Myanmar’s annual average water resources potential by each river basin, 1980-1993. Region/river basin Surface water (mcm/Yr) Groundwater (mcm/Yr)
Region 1. Chindwin 104,720 57,578
Region 2. Upper Ayeyawady 171,969 92,599
Region 3. Lower Ayeyawady 229,873 153,249
Region 4. Sittoung 52,746 28,402
Region 5. Rakhine 83,547 41,774
Region 6. Tanintharyi 78,556 39,278
Region 7. Thanlwin 95,955 74,779
Region 8. Mekong 10,580 7,054
Total 827,946 494,713
6. Groundwater Resources in Myanmar
On the basis of stratigraphy, there are eleven different types of aquifers in Myanmar (see Table 2).
Depending on their lithologies and depositional environments, groundwater from those aquifers has disparities
in quality and quantity. Of these, groundwater from Alluvial and Irrawaddian aquifers is more potable for both
irrigation and domestic use. Groundwater is also extracted from Peguan, Eocene and Plateau limestone
aquifers for domestic use in water scared areas, even though these are not totally suitable for drinking
purposes.
The groundwater resources of Myanmar by administrative region can be summarized as follows.
6.1 Kachin State (northern areas)
Groundwater is found mainly in Oligocene-mid-Miocene and Eocene rocks. It is mainly brackish and
rarely fresh. In the valley areas, groundwater from alluvial deposits is fresh and yield may be high, but it is
found only in local areas.
6.2 Sagaing Region (north-western area)
In the northern part of the region, groundwater is situated in Oligocene to mid-Miocene rocks and is
brackish in quality. Groundwater in the Chindwin Basin is of mid-Pliocene age and occurs in a contained area.
The water is suitable for drinking and irrigation purposes. Groundwater in the southern part of the region is
suitable mostly in alluvial beds of Quaternary age, mainly fresh water, and has a good yield. The water is also
suitable for drinking and irrigation purposes.
75
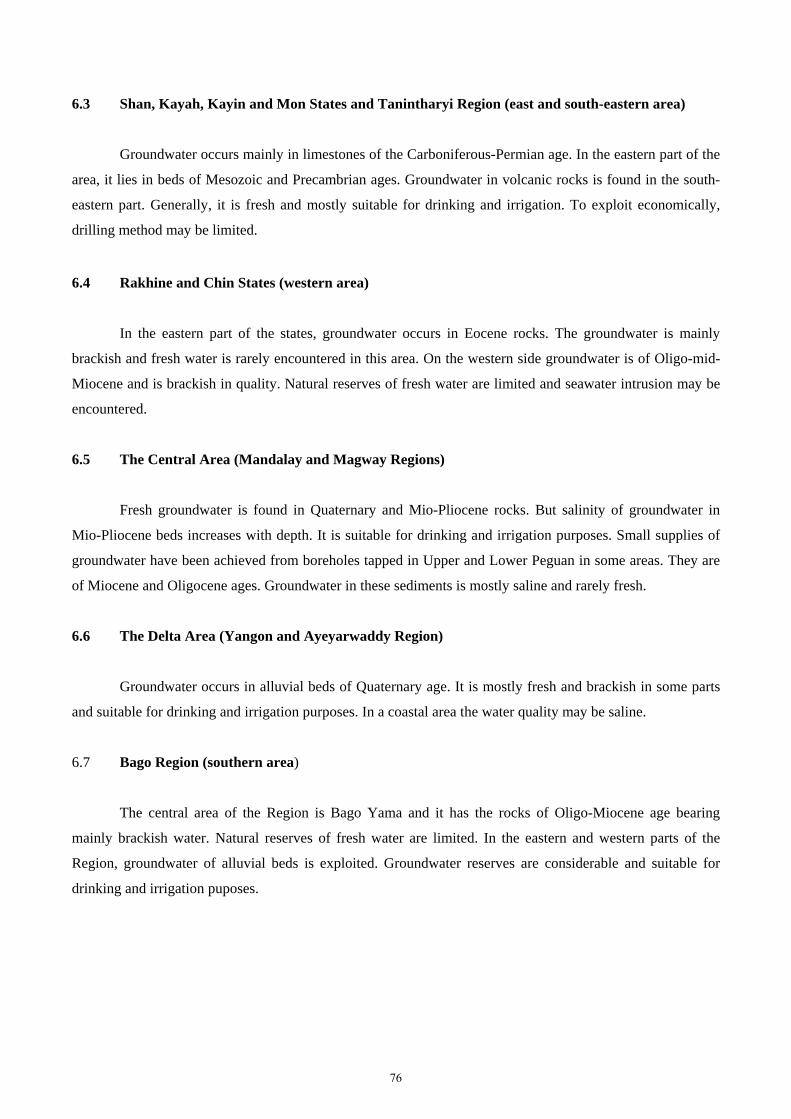
6.3 Shan, Kayah, Kayin and Mon States and Tanintharyi Region (east and south-eastern area)
Groundwater occurs mainly in limestones of the Carboniferous-Permian age. In the eastern part of the
area, it lies in beds of Mesozoic and Precambrian ages. Groundwater in volcanic rocks is found in the south-
eastern part. Generally, it is fresh and mostly suitable for drinking and irrigation. To exploit economically,
drilling method may be limited.
6.4 Rakhine and Chin States (western area)
In the eastern part of the states, groundwater occurs in Eocene rocks. The groundwater is mainly
brackish and fresh water is rarely encountered in this area. On the western side groundwater is of Oligo-mid-
Miocene and is brackish in quality. Natural reserves of fresh water are limited and seawater intrusion may be
encountered.
6.5 The Central Area (Mandalay and Magway Regions)
Fresh groundwater is found in Quaternary and Mio-Pliocene rocks. But salinity of groundwater in
Mio-Pliocene beds increases with depth. It is suitable for drinking and irrigation purposes. Small supplies of
groundwater have been achieved from boreholes tapped in Upper and Lower Peguan in some areas. They are
of Miocene and Oligocene ages. Groundwater in these sediments is mostly saline and rarely fresh.
6.6 The Delta Area (Yangon and Ayeyarwaddy Region)
Groundwater occurs in alluvial beds of Quaternary age. It is mostly fresh and brackish in some parts
and suitable for drinking and irrigation purposes. In a coastal area the water quality may be saline.
6.7 Bago Region (southern area)
The central area of the Region is Bago Yama and it has the rocks of Oligo-Miocene age bearing
mainly brackish water. Natural reserves of fresh water are limited. In the eastern and western parts of the
Region, groundwater of alluvial beds is exploited. Groundwater reserves are considerable and suitable for
drinking and irrigation puposes.
76
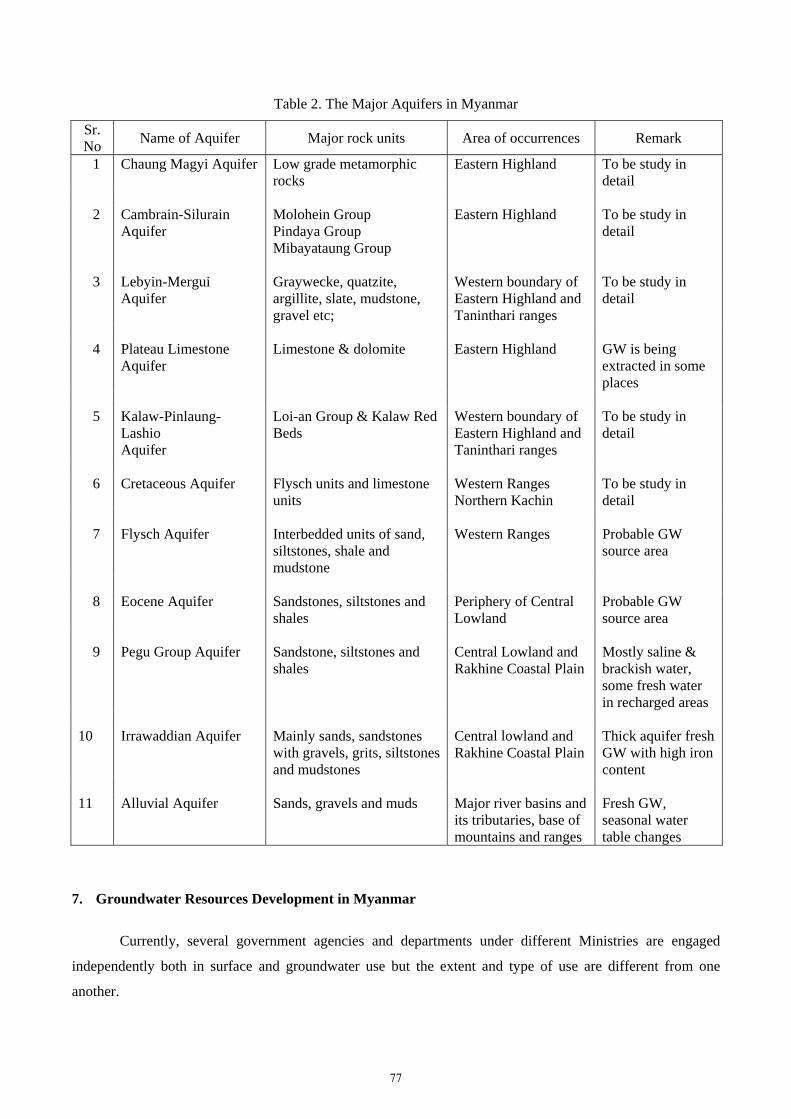
Table 2. The Major Aquifers in Myanmar
Sr. No
Name of Aquifer Major rock units Area of occurrences Remark
1 Chaung Magyi Aquifer Low grade metamorphic rocks
Eastern Highland To be study in detail
2 Cambrain-Silurain
Aquifer Molohein Group Pindaya Group Mibayataung Group
Eastern Highland To be study in detail
3 Lebyin-Mergui
Aquifer Graywecke, quatzite, argillite, slate, mudstone, gravel etc;
Western boundary of Eastern Highland and Taninthari ranges
To be study in detail
4 Plateau Limestone
Aquifer Limestone & dolomite Eastern Highland GW is being
extracted in some places
5 Kalaw-Pinlaung-
Lashio Aquifer
Loi-an Group & Kalaw Red Beds
Western boundary of Eastern Highland and Taninthari ranges
To be study in detail
6 Cretaceous Aquifer Flysch units and limestone
units Western Ranges Northern Kachin
To be study in detail
7 Flysch Aquifer Interbedded units of sand,
siltstones, shale and mudstone
Western Ranges Probable GW source area
8 Eocene Aquifer Sandstones, siltstones and
shales Periphery of Central Lowland
Probable GW source area
9 Pegu Group Aquifer Sandstone, siltstones and
shales Central Lowland and Rakhine Coastal Plain
Mostly saline & brackish water, some fresh water in recharged areas
10 Irrawaddian Aquifer Mainly sands, sandstones
with gravels, grits, siltstones and mudstones
Central lowland and Rakhine Coastal Plain
Thick aquifer fresh GW with high ironcontent
11 Alluvial Aquifer Sands, gravels and muds Major river basins and
its tributaries, base of mountains and ranges
Fresh GW, seasonal water table changes
7. Groundwater Resources Development in Myanmar
Currently, several government agencies and departments under different Ministries are engaged
independently both in surface and groundwater use but the extent and type of use are different from one
another.
77
7.1 Tube wells for Domestic Water Supply
Groundwater is the principal source of domestic water supply in Myanmar. There are a large number
of shallow dug wells throughout the country except in hilly regions. Most of them dry up in the hot season
though.
According to the records, the first tube well of Myanmar was drilled in 1889. However, rural water
supply works were started in Myanmar in 1952. Between 1952 and 1976, RWSD (predecessor of WRUD)
constructed 6,261 tube wells serving some 4.5 million rural people. These works were funded by the
Government. Negotiations initiated in 1976 with resulted in the fourmulation of a tube well programme in the
dry zone which comprised the construction of 3,100 tube wells for the three divisions of Sagaing, Mandalay
and Magway. This programme was implemented in 1977/78 with the combined resources of the Government
and external agencies, namely, WHO, UNICEF and ADB.
So far, WRUD (successor of RWSD) has completed 23,513 shallow tube wells and 14,375 deep tube
wells serving nearly 15 million rural people since 1952. The domain of rural water supply activities by
WRUD and its predecessors, with its own national resources or external resources, UNICEF in particular,
covered nationwide installation of water supply facilities such as shallow and deep tube wells, piped water
reticulation systems, river water pumping stations, gravity flow systems and improvements of ponds and dug
wells and so on.
DDA has also gained tangible achievements since its intervention in this sector in 1997. Urban and
rural development tasks are carried out by 285 township committees and 42 urban development affairs
committees under the supervision of DDA. Measures have also been taken to ensure water supply for 4,023
villages (in 2000/01 to 2002/03) out of the targeted 8,042 villages in Sagaing, Mandalay and Magway Regions
under a ten-year project, but no accurate and comprehensive data have yet been compiled.
7.2 Tube Wells for Irrigation
The use of groundwater for irrigation started only recently in Myanmar. In 1989, the Irrigation
Department (ID) of the Ministry of Agriculture and Forests (now MOAI) started the groundwater irrigation
project in Monywa District, Sagaing Region funded by UNDP and IDA. Since 1991, this project has irrigated
a total area of 8,094 hectares (20,000 acres).
In 1992, RWSD of the Agricultural Mechanization Department (AMD), Ministry of Agriculture (now
MOAI) started the drilling programme for groundwater irrigation, mainly for double paddy cropping in the
dry season.
During the fiscal year 1992/1993, a total of 93 bored wells in 14 townships irrigated 1,370 acres (554
ha) of no-monsoon paddy land in Yangon and Bago Region as a result of AMD programme and of
cooperation with local farmers. Local farmers bore the expense of 85 bored wells which irrigated 910 acres
78
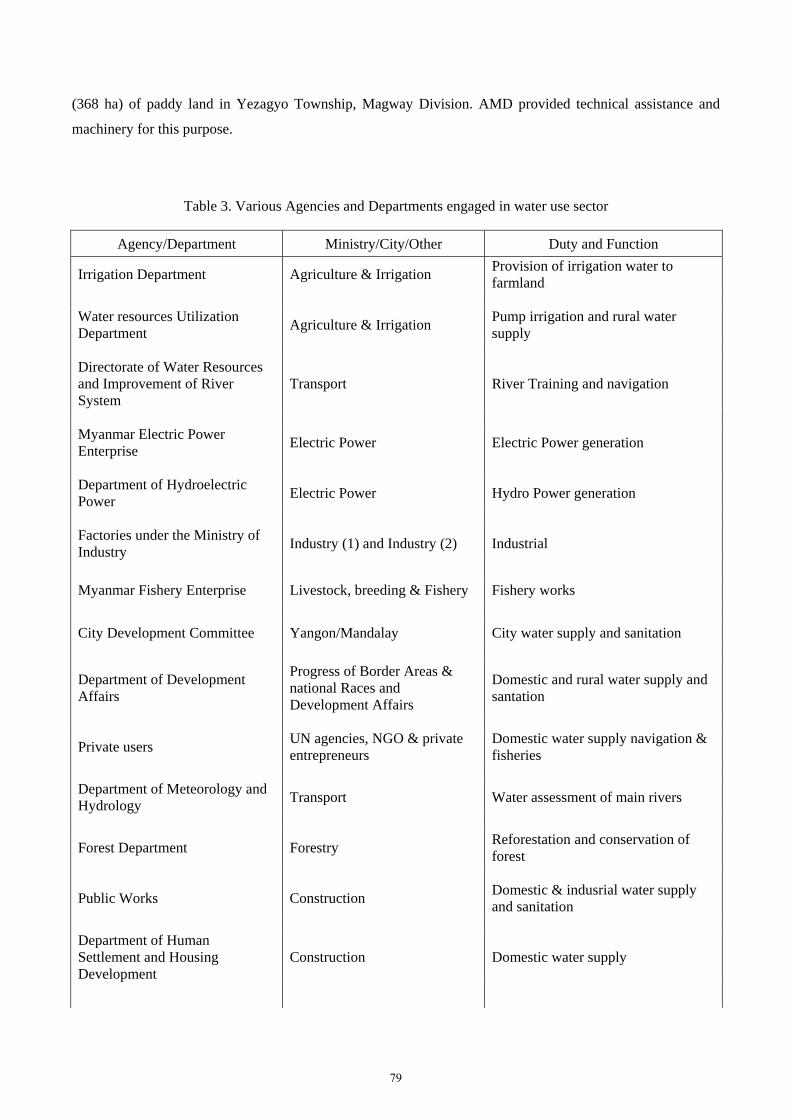
(368 ha) of paddy land in Yezagyo Township, Magway Division. AMD provided technical assistance and
machinery for this purpose.
Table 3. Various Agencies and Departments engaged in water use sector
Agency/Department Ministry/City/Other Duty and Function
Irrigation Department Agriculture & Irrigation Provision of irrigation water to farmland
Water resources Utilization Department
Agriculture & Irrigation Pump irrigation and rural water supply
Directorate of Water Resources and Improvement of River System
Transport River Training and navigation
Myanmar Electric Power Enterprise
Electric Power Electric Power generation
Department of Hydroelectric Power
Electric Power Hydro Power generation
Factories under the Ministry of Industry
Industry (1) and Industry (2) Industrial
Myanmar Fishery Enterprise Livestock, breeding & Fishery Fishery works
City Development Committee Yangon/Mandalay City water supply and sanitation
Department of Development Affairs
Progress of Border Areas & national Races and Development Affairs
Domestic and rural water supply and santation
Private users UN agencies, NGO & private entrepreneurs
Domestic water supply navigation & fisheries
Department of Meteorology and Hydrology
Transport Water assessment of main rivers
Forest Department Forestry Reforestation and conservation of forest
Public Works Construction Domestic & indusrial water supply and sanitation
Department of Human Settlement and Housing Development
Construction Domestic water supply
79
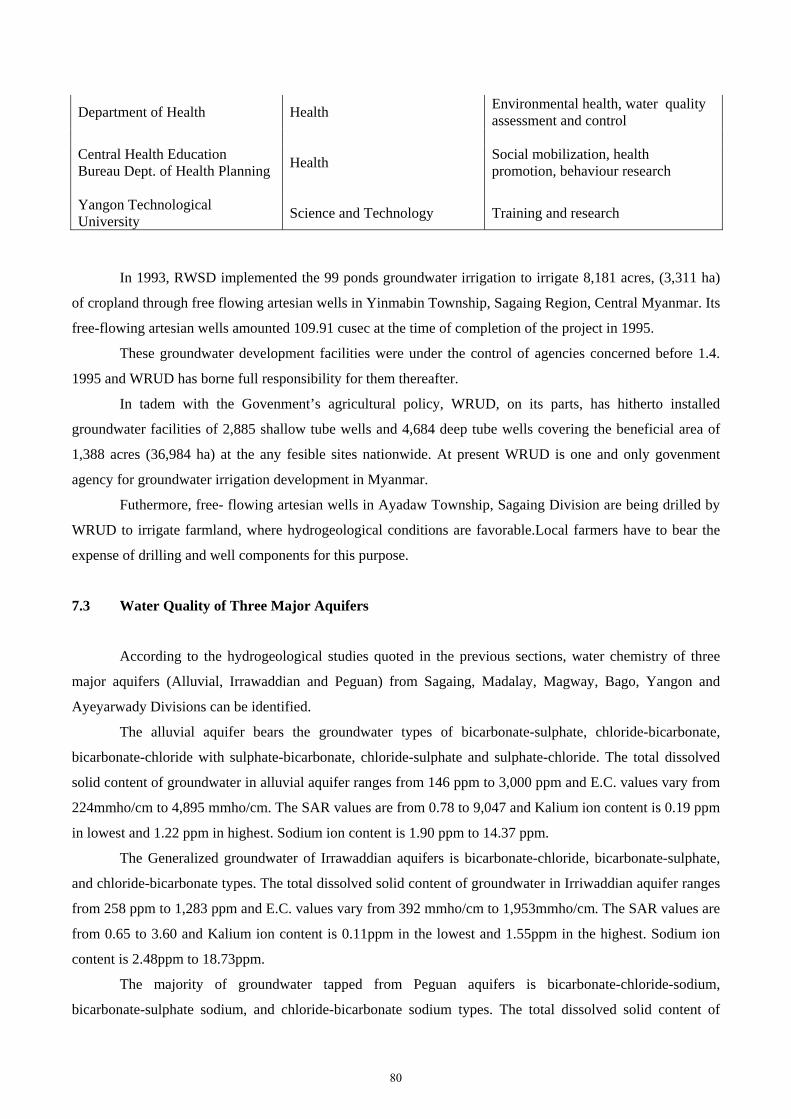
Department of Health Health Environmental health, water quality assessment and control
Central Health Education Bureau Dept. of Health Planning
Health Social mobilization, health promotion, behaviour research
Yangon Technological University
Science and Technology Training and research
In 1993, RWSD implemented the 99 ponds groundwater irrigation to irrigate 8,181 acres, (3,311 ha)
of cropland through free flowing artesian wells in Yinmabin Township, Sagaing Region, Central Myanmar. Its
free-flowing artesian wells amounted 109.91 cusec at the time of completion of the project in 1995.
These groundwater development facilities were under the control of agencies concerned before 1.4.
1995 and WRUD has borne full responsibility for them thereafter.
In tadem with the Govenment’s agricultural policy, WRUD, on its parts, has hitherto installed
groundwater facilities of 2,885 shallow tube wells and 4,684 deep tube wells covering the beneficial area of
1,388 acres (36,984 ha) at the any fesible sites nationwide. At present WRUD is one and only govenment
agency for groundwater irrigation development in Myanmar.
Futhermore, free- flowing artesian wells in Ayadaw Township, Sagaing Division are being drilled by
WRUD to irrigate farmland, where hydrogeological conditions are favorable.Local farmers have to bear the
expense of drilling and well components for this purpose.
7.3 Water Quality of Three Major Aquifers
According to the hydrogeological studies quoted in the previous sections, water chemistry of three
major aquifers (Alluvial, Irrawaddian and Peguan) from Sagaing, Madalay, Magway, Bago, Yangon and
Ayeyarwady Divisions can be identified.
The alluvial aquifer bears the groundwater types of bicarbonate-sulphate, chloride-bicarbonate,
bicarbonate-chloride with sulphate-bicarbonate, chloride-sulphate and sulphate-chloride. The total dissolved
solid content of groundwater in alluvial aquifer ranges from 146 ppm to 3,000 ppm and E.C. values vary from
224mmho/cm to 4,895 mmho/cm. The SAR values are from 0.78 to 9,047 and Kalium ion content is 0.19 ppm
in lowest and 1.22 ppm in highest. Sodium ion content is 1.90 ppm to 14.37 ppm.
The Generalized groundwater of Irrawaddian aquifers is bicarbonate-chloride, bicarbonate-sulphate,
and chloride-bicarbonate types. The total dissolved solid content of groundwater in Irriwaddian aquifer ranges
from 258 ppm to 1,283 ppm and E.C. values vary from 392 mmho/cm to 1,953mmho/cm. The SAR values are
from 0.65 to 3.60 and Kalium ion content is 0.11ppm in the lowest and 1.55ppm in the highest. Sodium ion
content is 2.48ppm to 18.73ppm.
The majority of groundwater tapped from Peguan aquifers is bicarbonate-chloride-sodium,
bicarbonate-sulphate sodium, and chloride-bicarbonate sodium types. The total dissolved solid content of
80
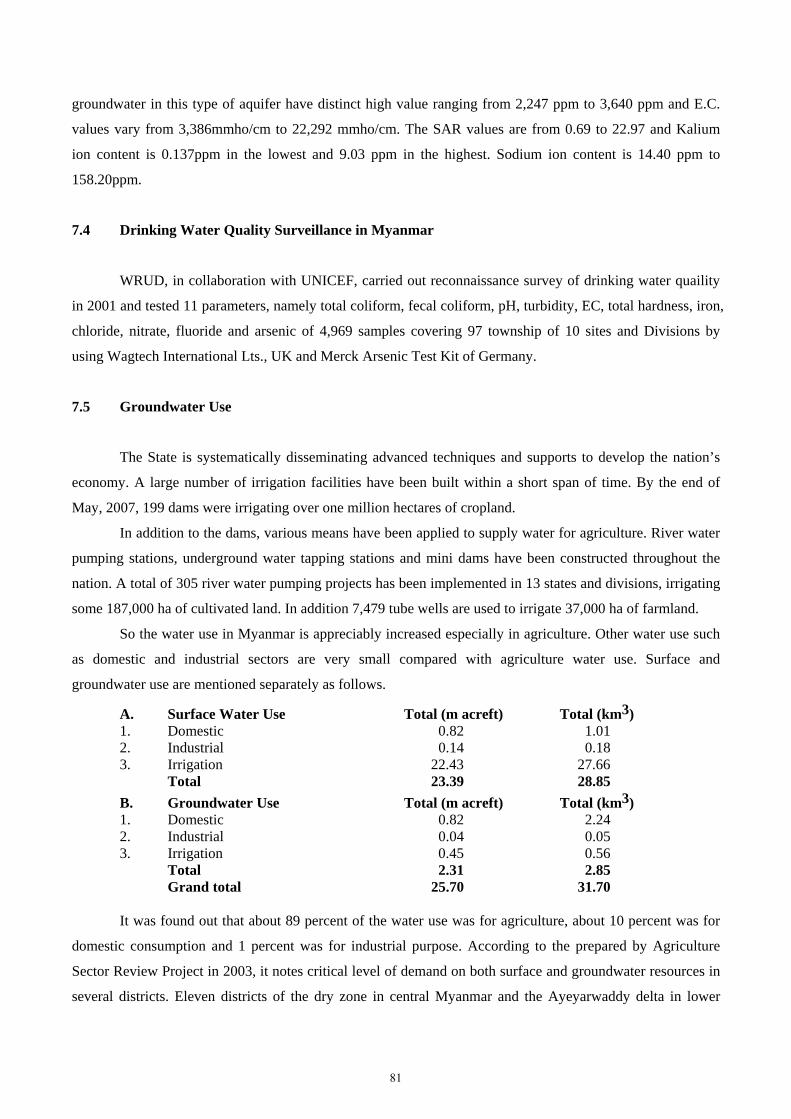
groundwater in this type of aquifer have distinct high value ranging from 2,247 ppm to 3,640 ppm and E.C.
values vary from 3,386mmho/cm to 22,292 mmho/cm. The SAR values are from 0.69 to 22.97 and Kalium
ion content is 0.137ppm in the lowest and 9.03 ppm in the highest. Sodium ion content is 14.40 ppm to
158.20ppm.
7.4 Drinking Water Quality Surveillance in Myanmar
WRUD, in collaboration with UNICEF, carried out reconnaissance survey of drinking water quaility
in 2001 and tested 11 parameters, namely total coliform, fecal coliform, pH, turbidity, EC, total hardness, iron,
chloride, nitrate, fluoride and arsenic of 4,969 samples covering 97 township of 10 sites and Divisions by
using Wagtech International Lts., UK and Merck Arsenic Test Kit of Germany.
7.5 Groundwater Use
The State is systematically disseminating advanced techniques and supports to develop the nation’s
economy. A large number of irrigation facilities have been built within a short span of time. By the end of
May, 2007, 199 dams were irrigating over one million hectares of cropland.
In addition to the dams, various means have been applied to supply water for agriculture. River water
pumping stations, underground water tapping stations and mini dams have been constructed throughout the
nation. A total of 305 river water pumping projects has been implemented in 13 states and divisions, irrigating
some 187,000 ha of cultivated land. In addition 7,479 tube wells are used to irrigate 37,000 ha of farmland.
So the water use in Myanmar is appreciably increased especially in agriculture. Other water use such
as domestic and industrial sectors are very small compared with agriculture water use. Surface and
groundwater use are mentioned separately as follows.
A. Surface Water Use Total (m acreft) Total (km3) 1. Domestic 0.82 1.01 2. Industrial 0.14 0.18 3. Irrigation 22.43 27.66 Total 23.39 28.85
B. Groundwater Use Total (m acreft) Total (km3) 1. Domestic 0.82 2.24 2. Industrial 0.04 0.05 3. Irrigation 0.45 0.56 Total 2.31 2.85 Grand total 25.70 31.70 It was found out that about 89 percent of the water use was for agriculture, about 10 percent was for
domestic consumption and 1 percent was for industrial purpose. According to the prepared by Agriculture
Sector Review Project in 2003, it notes critical level of demand on both surface and groundwater resources in
several districts. Eleven districts of the dry zone in central Myanmar and the Ayeyarwaddy delta in lower
81
Myanmar are found to be medium to severse-scarce according to UN criteria levels of water scarcity with the
respect to groundwater use.
8. Recommendation and conclusion
8.1 Recommendation for action at the national and international level for the promotion of water
conservation
1. It is imperative to give adequate importance to the water conservation in the development process at
the highest level of the government. There was a greater need for more emphasis to be made on the
importance of water conservation in the socio-economic and sustainable development of water
resources. And water conservation issue should be accorded high priority in the policy making process
of national government and concerned international organizations.
2. National workshop, particularly at policy making level, should be organized to raise public awareness
and promote better understanding among all stakeholders to be affected by policies and regulations on
water conservation.
3. Government should strengthen its institutional, legal and technical capabilities and make full use of
economic principles with the assistance of regional and international organization to enhance water
conservation in the country.
4. International organization should provide assistance to the country in conduction national training
workshop on the use of best knowledge and practices of water conservation.
5. United Nation Organizations and other international organization should assist member countries in
strengthening its own capabilities to achieve better system of water conservation, through the
provision of advisories services.
8.2 Conclusions
Although Myanmar has abundant water resources for sufficiency of her nation, parts of the country,
especially in large cities, has suffered shortage of fresh water. In the near future Myanmar may reach the stage
in which water becomes the scarce resource due to the increase of water demand brought about by rapid
population growth, expansion of irrigation and industrial production. Given the finite amount of renewable
fresh water resources available, shortage of fresh water supply would become a major constraint for
development and social well being unless due attention for equitable and economically efficient utilization
and conservation policies could be developed to satisfy the water demand of various competing water use
sectors.
Conflict of interest will become more among such competing users as urban water supply, power
generation, flood control and inland navigation. As the competition of water could only become more intense
in the future, it would be useful to country to address efficient water use technologies and water conservation
82
measures for the sustainability of its resources. Effect of population on fresh water, both surface and
underground, results in reduction of water avail in reduction of water availability for various uses.
It is the national concern, regarding the depth of monitoring systems on law enforcement on
protecting water resources from industrial and agricultural effluents to keep the extent resources intact. Frugal
consumption using efficient utilization of water is a prudent technology that should apply extensively in the
country. Insufficient facilities for treatment of industrial effluents, particularly toxic chemicals, pose a threat
to the nation’s health, environment including eco-systems.
Despite the government encouragement on utilizing bio-fertilizers, availability of such less
hazardous are limited and chemical fertilizers are unavoidably used extensively for boosting crop
production. Stringent laws and regulation should be imposed to handle the risk of industrial effluents and
wastewater. The government and incumbent agencies should realize the essences of efficient water utilization
and water conservation comprehensively and impart that knowledge to the users or consumers. Accordingly to
instill them impart this consensus to safeguarding national resources. Currently, national practices on efficient
utilization and water conservation measures are inadequate and thus it is the national causes to harness the
danger of deteriorating water resources through collective efforts of suppliers, users, the policy makers and
international co-operation as a whole.
83
Groundwater in Papua New Guinea
Simon Egara Mineral Resources Authority
1. Physical Outline
Mainland of Papua New Guinea is approximately 1,250 km long decreasing in width from 730 km is
the west along the Irian Jaya border to 50 km at its eastern tip. To the north and north- east lie the island
groups of the Bismarck Archipelago, and the North Solomon Islands, with the smaller archipelagos of the
Trobriands, d’Entrecasteaux and Louisiades off the eastern end of the mainland.
The principal topographic features of the mainland, the Bismarck Archipelago and North Solomons
are the highly dissected mountain ranges reaching 4,500 meters in elevation on the mainland and punctuated
by numerous intramontain basins. In addition the western hall of the mainland includes the extensive lowland
plains and swamps of the Sepik/Ramu and Fly rivers respectively north and south of the main mountain
ranges.
The eastern end of the mainland and many of the island groups are bordered by coral islands, reefs
and raised fossil coral terraces.
1.1 Highland Areas
The Highland areas are dominated by massive ridge and valley land-forms. The area may be
conveniently be classified by two physiographic characteristics: Local relief and altitude. The northern part
forms a belt of uniform mountainous country, and extends from the Thurnwald Ranges in the west to the
Bismarck Ranges in the east. It includes the highest, most rugged and remote areas in Papua New Guinea.
The central part, extending to the Goroka – Kainantu area in the east, is characterized by relatively low local
relief, a succession of intramontain plains and broad upland valleys and contains several huge strato-volcanoes.
The eastern part of the highlands comprises the Owen Stanley Range and its flanking ranges, running the
entire length of east Papua New Guinea. It is similar to the northern part, and can in fact be regarded as its
eastern extension. It is dominated by massive ridge and valley land forms.
Highland land forms are also found in the Papua New Guinea islands, namely the d’Entrecasteaux,
New Britain, New Ireland and Bougainville islands.
Due to high slopes in the highland regions a relatively small fraction of the precipitation is usually
available for infiltration into the soil. Most of it either evaporates or quickly discharges into streams and
rivers as surface runoff. The steep slopes also imply that, where there are potentially aquiferous rocks, the
water table is only accessible near rivers where it approaches the surface.
84
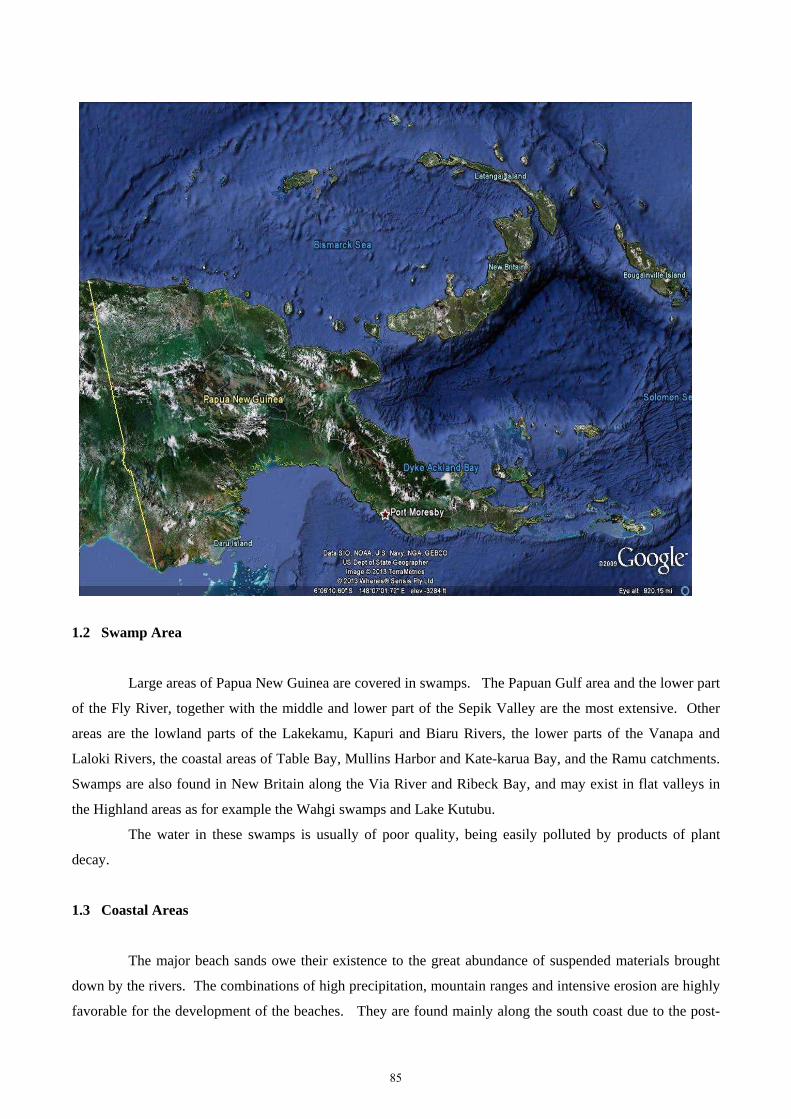
1.2 Swamp Area
Large areas of Papua New Guinea are covered in swamps. The Papuan Gulf area and the lower part
of the Fly River, together with the middle and lower part of the Sepik Valley are the most extensive. Other
areas are the lowland parts of the Lakekamu, Kapuri and Biaru Rivers, the lower parts of the Vanapa and
Laloki Rivers, the coastal areas of Table Bay, Mullins Harbor and Kate-karua Bay, and the Ramu catchments.
Swamps are also found in New Britain along the Via River and Ribeck Bay, and may exist in flat valleys in
the Highland areas as for example the Wahgi swamps and Lake Kutubu.
The water in these swamps is usually of poor quality, being easily polluted by products of plant
decay.
1.3 Coastal Areas
The major beach sands owe their existence to the great abundance of suspended materials brought
down by the rivers. The combinations of high precipitation, mountain ranges and intensive erosion are highly
favorable for the development of the beaches. They are found mainly along the south coast due to the post-
85
glacial differential rise in sea level. Along the south coast it led to drowning of river inlets, reduction of stream
velocities in the lower reaches and formation of embayment which provided ideal locations for deposition.
The aquifers are found on beach ridges, beach plains, tidal flats and raised coral reefs. The north coast was
largely unaffected by this sea level rise because of its steepness and active uplift. The Sepik plain and Cape
Vogel basin were exceptions to the general trend.
Fossil coral reefs are uplifted coral reefs and terraces. They occur in great numbers along the south
coast of New Britain, the east coast of New Ireland, the northern part of Bougainville, the Trobriand and
Marshall Bennett Islands, and also along the Sialum and Madang coasts. These reefs are ample evidence of
the relative movement of land and sea.
1.4 Volcanic Areas
Papua New Guinea has a great variety of volcanic landforms. On the mainland, they occur in two
irregular clusters. The largest is centrally located within and south of the central highlands region. A smaller
one occurs in south-eastern part of the Cape Vogel basins. A third cluster is on the d’Entrecasteaux Islands.
In addition, there are two chains of volcanoes in the Bismarck Sea.
These volcanic areas present special problems for groundwater development. The volcanic ash is
extremely permeable, with the result that a great part of the precipitation infiltrates the soil, and rapidly drains
the volcanic area.
1.5 Karst Regions
Three areas in Papua New Guinea are dominated by karstic landforms. These are a belt from the
Gulf of Papua in the south-east to the Irian Jaya border in the north-west on the mainland, the western
and eastern part of New Britain, and the north-western part of New Ireland. Besides these, several smaller
occurrences of karsts are found in the highlands, the Saruwaged Range and the western most part of the
northern coastal ranges.
The upper part of Alice River (Ok Tedi) drains an area characterized by limestone. An investigation
of this catchments for hydropower potential revealed considerable uncertainties about some of the sub-
catchments areas. In the earlier part of that study, it was apparent that the runoff was much greater than the
rainfall in some places, and less in others. This was ascribed to inaccurate maps, subsurface leakage to or
from other catchments, or errors in the estimation of the mean catchments rainfall.
When more accurate maps and more data are available, it became clear than because of the very high
rainfall in this area (from 6,000 to 8,000 mm yearly) and the absence of any lakes, the areas drain into the
surrounding catchments via sink holes, solution cavities etc., in the limestone which underlies the area.
In this region, the Hindenburg Wall also complicates the assessment of the drainage area because of
numerous springs that issue from its base and scarp, due to chemical weathering of the limestone area above
86
the Wall.
1.6 Markham Valley
Mountain Rivers often carry heavy loads of sediment. Where these rivers reach the low-lying flood
plain of a valley or the coast, the stream velocity is suddenly reduced, leading to the deposition of sediments.
The result is the formation of alluvial fans. The rivers will have gradients similar to the fans, and flow in
highly unstable, wide, braided flood-plains with constantly shifting sand bars and channels. Active fan
building takes place under the present humid tropical rain forest conditions and is widespread in the
tectonically most active part of Papua New Guinea.
Extensive fan building is found in the Markham-Ramu Valleys south of the actively rising
Saruwaged and Finisterre Ranges and along the coastal areas between the Huon Peninsula and Astrolabe Bay
to the north of these ranges. Other important fan areas are the Angabunga River, the Fly River and the Sepik
River.
Numerous streams from the Saruwaged Range discharge into the valley, forming a series of fans. A
significant portion of the river and stream water is lost by seepage and infiltration into the groundwater
reservoir. Since, the sediment yielded by these mountains contains a large coarse fraction and makes a good
aquifer.
2. Vegetation
One of the outstanding characteristics of the country is the extensive coverage of forest vegetation.
Paijmans (1976) recognizes seven major vegetational environments; four coastal and lowland zones below
(1,000m) account for 28% of the coverage and are controlled by drainage conditions, water regime and type of
water; three other zones (72% cover) are controlled principally by climatic changes with increasing altitude.
About 15-20 percent of the total vegetation cover comprises climax and disclimax savanna. Climax
savanna is a reflection of seasonal rainfall conditions in the Markham Valley an along parts of the south coast
of the mainland particularly the south west corner of the Gulf of Papua coast between Kerema and Kwikila.
In the highland areas savanna is the result of local climatic and soil conditions.
Disclimax savanna has been created extensively in the central highland areas of the mainland and
along coastal stretches of the mainland and islands as a result of human pressure in particular the traditional
practice of shifting agriculture.
3. Climate
Since the country lies between 0° and 12° south latitude under Koeppen’s classification the climate
may be generally described as rainy tropical (Af). Geographic location, altitude and aspect may vary this
87
generalization to give savanna (Aw), temperate (Cf) and other more local climatic types.
The seasonal movement of the Intertropical Convergence zone with its associated tropical air masses
control the two principal wind directions which strongly influence the rainfall patterns of the country. From
May to October, the south-east trades predominate whereas from December to March, prevailing winds are
from the north-west. The high mountain barriers across the path of these winds, whose fetch covers
thousands of kilometers over tropical seas, induces regular heavy orographic convective rainfall or northern
and southern slopes and in the mountains themselves. Thermal convective rainfall is characteristic of the Fly
and Sepik lowlands. Mean rainfall figures on the mainland range from less than 2,000 mm along the coast to
over 8,000 mm in some mountain areas. The island groups to the north and north- east incur rainfall between
3,000 and 7,000 mm annually.
Areas with less than 2,000 mm lie south-west of the Fly river; west of Lae in the Markham Valley
lying in the rain shadow of the Finnisterre – Saruwaged mountains to the north and the main central ranges to
the south; and south-east parts of the north coast where the coast lies parallel to south-easterly and north-
westerly wind directions and local topography affects wind flow. The least rainfall, less than 1,000 mm, falls
in the Port Moresby coastal area where the coastline runs parallel to the south-east Trade winds and lies in the
lee of the Owen Stanley range during the north-westerly period.
Seasonal variation of rainfall generally reflects location with reference to the prevailing wind, and
local topography. North coast maxima tend towards the period of north-west winds, south coast maxima
during the south-east trades.
Evaporation rates range from less than 1,000 mm to over 2,000 mm annually depending on
temperature and humidity regimes. Areas of highest evaporation rates are coincident with those of lowest
rainfall and vice-versa. Annual evaporation rates based on adjusted class A pan values range from 1,250 mm
in western highland areas to over 2,000 mm in the Markham Valley, Goodenough Bay and the Port Moresby
region.
Mean daily temperature range between 34°C and 21°C for coastal and lowland locations to sub- zero
values above 3,000m. Seasonal variations are small.
4. Surface Water
The coincidence of high and precipitous mountain ranges and high rainfall leads to high runoff over
most of the country. Rivers are often steep and actively involved in fluvial erosional processes. The young
mountain ranges are deeply incised by rapidly down-cutting streams whose sediment load is deposited as
alluvial fans or in the swamps and deltas of the Sepik, Ramu, Fly, Kikori and Purari rivers and the
depositional plains along the south east coast. Large volumes of surface water are retained in the Sepik
and Fly swamps. Extensive limestone and karst areas exist in the Kikori-Lake Kutubu area of the southern
fold mountains, the Victor Emmannual fold belt, the Saruwaged range, New Britain and New Ireland. There
is little surface drainage in these areas despite high annual rainfall.
88
Runoff has been estimated for areas above 900m elevation at 2,500 mm, 800 – 1,300 mm and 2,100
mm. At present there is now generally reliable estimate of runoff for the country as a whole.
5. Groundwater
5.1 Historical
Groundwater investigations at a professional level started in the mid 1960’s. From 1974
hydrogeological services have been provided by the Geological Survey on a regular basis. Lack of staff has
not allowed for general hydrogeological studies. Most work is in an advisory capacity, field studies being
carried out at the request of public and private developers and then on an ordinary consulting basis.
Investigations provide the developer with information regarding the potential and quality of sub-surface
waters and aquifers. Wells and well-fields are designed and construction monitoring and testing of wells is
undertaken.
Data on wells and bores are stored in a well-archive, ad comprise identifications for well location
and ownership, data on drilling and well capacities. Data on water quality will normally only be collected
if such is needed for ensuring health standards for public water supply. For small wells, the owner may decide
that chemical analysis is not worth the costs. All wells that Geological Survey knows about are registered.
Minor wells drilled by plantations and settlement may be known only occasionally to the Survey. Today,
close on 5,000 wells are registered.
Continuous data recording, from special observation wells are not made, but plans exist to include
such time-series data from a few wells. Because the existing data archive is relatively small, no efforts have
been made to store the hydrogeological data in a computer archive.
5.2 Prospecting Methods
Geophysical techniques are the principal prospecting methods, supplemented by local geological
investigations. Electric log methods (self potential and point resistivity) are commonly used. Resivitity is
particularly useful in coastal areas where the high porosity and permeability of coral limestone permit
intrusion of saline water. Occasionally refraction seismic sounding may be used.
5.3 Main Aquifers
Five broad hydrogeological units may be defined:
a) Pre-Quaternary bedrock b) Volcanic rocks
c) Limestone karst
d) Coastal sediments
e) Unconsolidated sediments
89
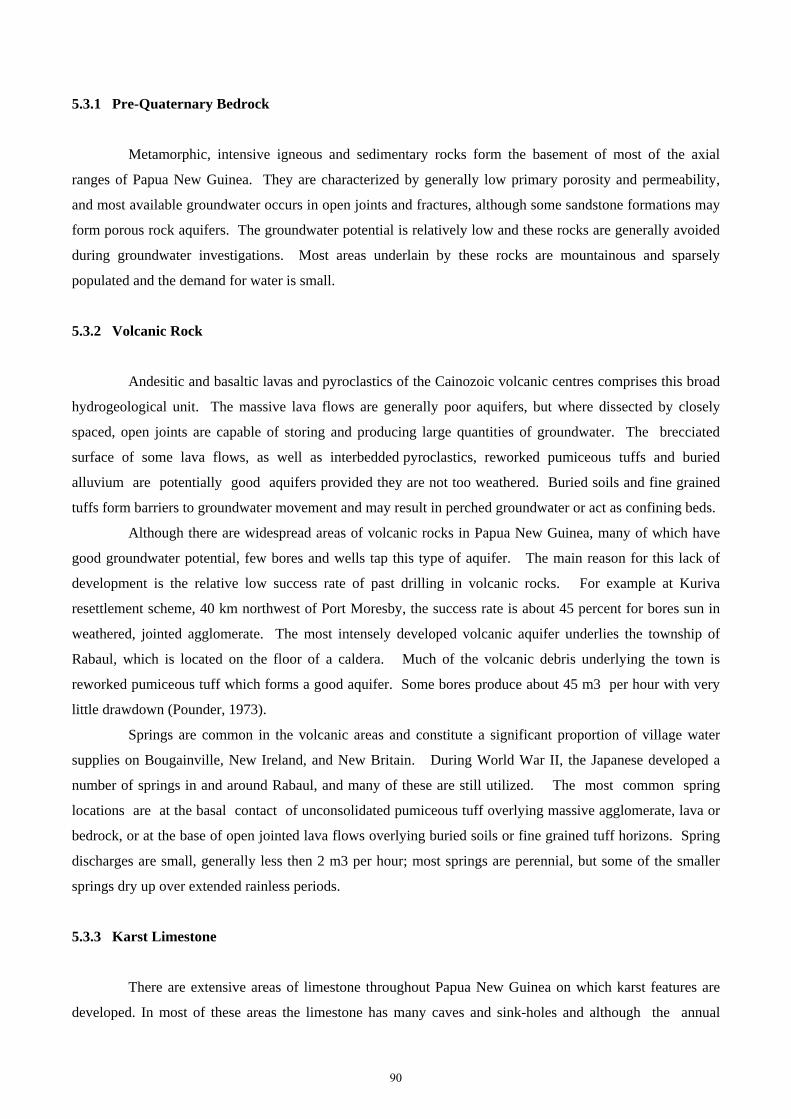
5.3.1 Pre-Quaternary Bedrock
Metamorphic, intensive igneous and sedimentary rocks form the basement of most of the axial
ranges of Papua New Guinea. They are characterized by generally low primary porosity and permeability,
and most available groundwater occurs in open joints and fractures, although some sandstone formations may
form porous rock aquifers. The groundwater potential is relatively low and these rocks are generally avoided
during groundwater investigations. Most areas underlain by these rocks are mountainous and sparsely
populated and the demand for water is small.
5.3.2 Volcanic Rock
Andesitic and basaltic lavas and pyroclastics of the Cainozoic volcanic centres comprises this broad
hydrogeological unit. The massive lava flows are generally poor aquifers, but where dissected by closely
spaced, open joints are capable of storing and producing large quantities of groundwater. The brecciated
surface of some lava flows, as well as interbedded pyroclastics, reworked pumiceous tuffs and buried
alluvium are potentially good aquifers provided they are not too weathered. Buried soils and fine grained
tuffs form barriers to groundwater movement and may result in perched groundwater or act as confining beds.
Although there are widespread areas of volcanic rocks in Papua New Guinea, many of which have
good groundwater potential, few bores and wells tap this type of aquifer. The main reason for this lack of
development is the relative low success rate of past drilling in volcanic rocks. For example at Kuriva
resettlement scheme, 40 km northwest of Port Moresby, the success rate is about 45 percent for bores sun in
weathered, jointed agglomerate. The most intensely developed volcanic aquifer underlies the township of
Rabaul, which is located on the floor of a caldera. Much of the volcanic debris underlying the town is
reworked pumiceous tuff which forms a good aquifer. Some bores produce about 45 m3 per hour with very
little drawdown (Pounder, 1973).
Springs are common in the volcanic areas and constitute a significant proportion of village water
supplies on Bougainville, New Ireland, and New Britain. During World War II, the Japanese developed a
number of springs in and around Rabaul, and many of these are still utilized. The most common spring
locations are at the basal contact of unconsolidated pumiceous tuff overlying massive agglomerate, lava or
bedrock, or at the base of open jointed lava flows overlying buried soils or fine grained tuff horizons. Spring
discharges are small, generally less then 2 m3 per hour; most springs are perennial, but some of the smaller
springs dry up over extended rainless periods.
5.3.3 Karst Limestone
There are extensive areas of limestone throughout Papua New Guinea on which karst features are
developed. In most of these areas the limestone has many caves and sink-holes and although the annual
90
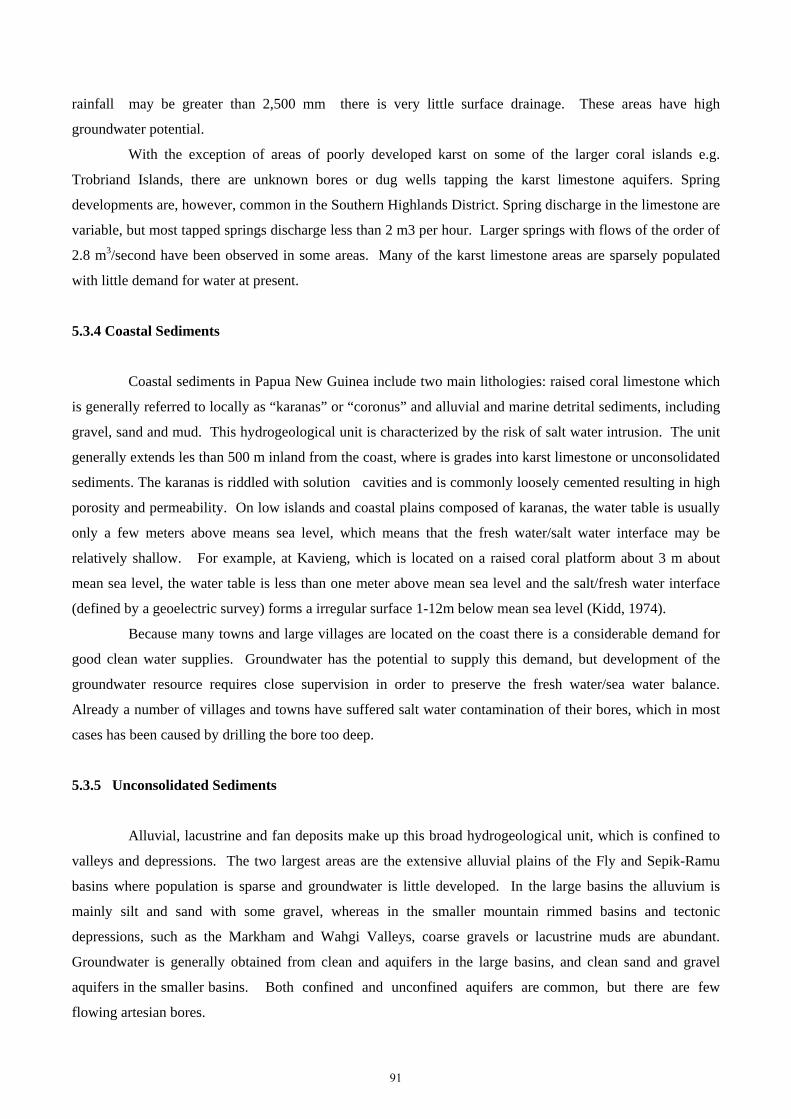
rainfall may be greater than 2,500 mm there is very little surface drainage. These areas have high
groundwater potential.
With the exception of areas of poorly developed karst on some of the larger coral islands e.g.
Trobriand Islands, there are unknown bores or dug wells tapping the karst limestone aquifers. Spring
developments are, however, common in the Southern Highlands District. Spring discharge in the limestone are
variable, but most tapped springs discharge less than 2 m3 per hour. Larger springs with flows of the order of
2.8 m3/second have been observed in some areas. Many of the karst limestone areas are sparsely populated
with little demand for water at present.
5.3.4 Coastal Sediments
Coastal sediments in Papua New Guinea include two main lithologies: raised coral limestone which
is generally referred to locally as “karanas” or “coronus” and alluvial and marine detrital sediments, including
gravel, sand and mud. This hydrogeological unit is characterized by the risk of salt water intrusion. The unit
generally extends les than 500 m inland from the coast, where is grades into karst limestone or unconsolidated
sediments. The karanas is riddled with solution cavities and is commonly loosely cemented resulting in high
porosity and permeability. On low islands and coastal plains composed of karanas, the water table is usually
only a few meters above means sea level, which means that the fresh water/salt water interface may be
relatively shallow. For example, at Kavieng, which is located on a raised coral platform about 3 m about
mean sea level, the water table is less than one meter above mean sea level and the salt/fresh water interface
(defined by a geoelectric survey) forms a irregular surface 1-12m below mean sea level (Kidd, 1974).
Because many towns and large villages are located on the coast there is a considerable demand for
good clean water supplies. Groundwater has the potential to supply this demand, but development of the
groundwater resource requires close supervision in order to preserve the fresh water/sea water balance.
Already a number of villages and towns have suffered salt water contamination of their bores, which in most
cases has been caused by drilling the bore too deep.
5.3.5 Unconsolidated Sediments
Alluvial, lacustrine and fan deposits make up this broad hydrogeological unit, which is confined to
valleys and depressions. The two largest areas are the extensive alluvial plains of the Fly and Sepik-Ramu
basins where population is sparse and groundwater is little developed. In the large basins the alluvium is
mainly silt and sand with some gravel, whereas in the smaller mountain rimmed basins and tectonic
depressions, such as the Markham and Wahgi Valleys, coarse gravels or lacustrine muds are abundant.
Groundwater is generally obtained from clean and aquifers in the large basins, and clean sand and gravel
aquifers in the smaller basins. Both confined and unconfined aquifers are common, but there are few
flowing artesian bores.
91
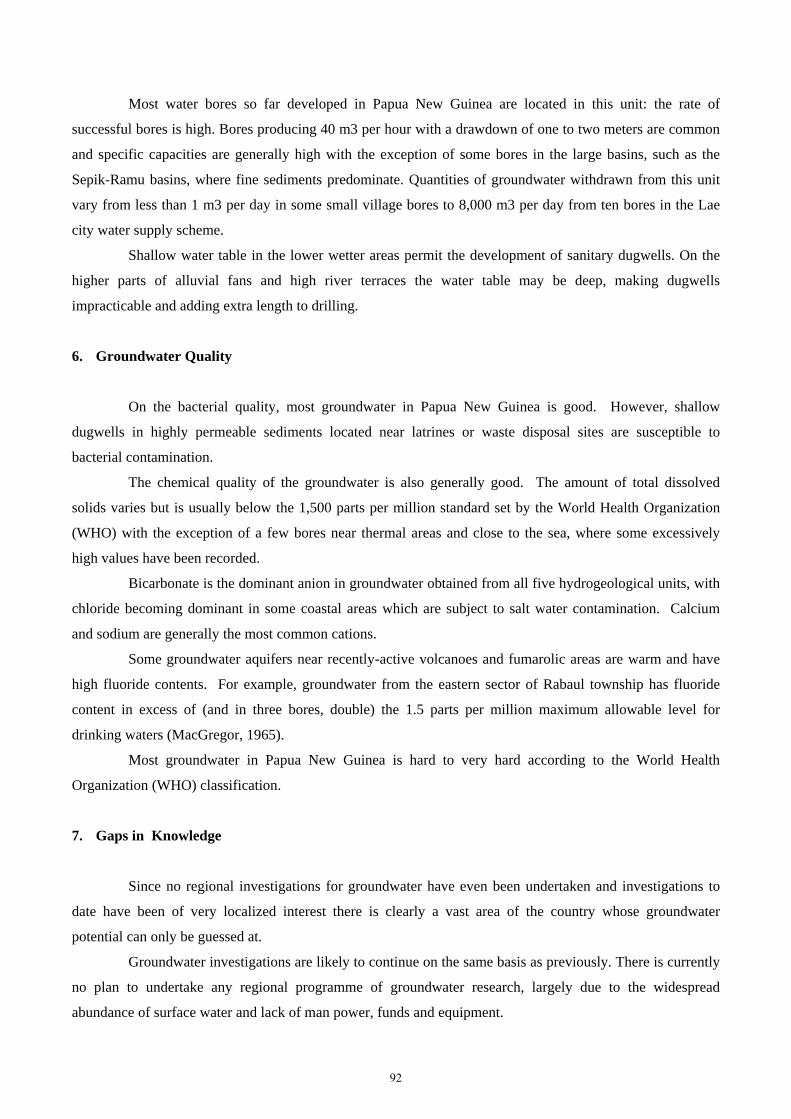
Most water bores so far developed in Papua New Guinea are located in this unit: the rate of
successful bores is high. Bores producing 40 m3 per hour with a drawdown of one to two meters are common
and specific capacities are generally high with the exception of some bores in the large basins, such as the
Sepik-Ramu basins, where fine sediments predominate. Quantities of groundwater withdrawn from this unit
vary from less than 1 m3 per day in some small village bores to 8,000 m3 per day from ten bores in the Lae
city water supply scheme.
Shallow water table in the lower wetter areas permit the development of sanitary dugwells. On the
higher parts of alluvial fans and high river terraces the water table may be deep, making dugwells
impracticable and adding extra length to drilling.
6. Groundwater Quality
On the bacterial quality, most groundwater in Papua New Guinea is good. However, shallow
dugwells in highly permeable sediments located near latrines or waste disposal sites are susceptible to
bacterial contamination.
The chemical quality of the groundwater is also generally good. The amount of total dissolved
solids varies but is usually below the 1,500 parts per million standard set by the World Health Organization
(WHO) with the exception of a few bores near thermal areas and close to the sea, where some excessively
high values have been recorded.
Bicarbonate is the dominant anion in groundwater obtained from all five hydrogeological units, with
chloride becoming dominant in some coastal areas which are subject to salt water contamination. Calcium
and sodium are generally the most common cations.
Some groundwater aquifers near recently-active volcanoes and fumarolic areas are warm and have
high fluoride contents. For example, groundwater from the eastern sector of Rabaul township has fluoride
content in excess of (and in three bores, double) the 1.5 parts per million maximum allowable level for
drinking waters (MacGregor, 1965).
Most groundwater in Papua New Guinea is hard to very hard according to the World Health
Organization (WHO) classification.
7. Gaps in Knowledge
Since no regional investigations for groundwater have even been undertaken and investigations to
date have been of very localized interest there is clearly a vast area of the country whose groundwater
potential can only be guessed at.
Groundwater investigations are likely to continue on the same basis as previously. There is currently
no plan to undertake any regional programme of groundwater research, largely due to the widespread
abundance of surface water and lack of man power, funds and equipment.
92
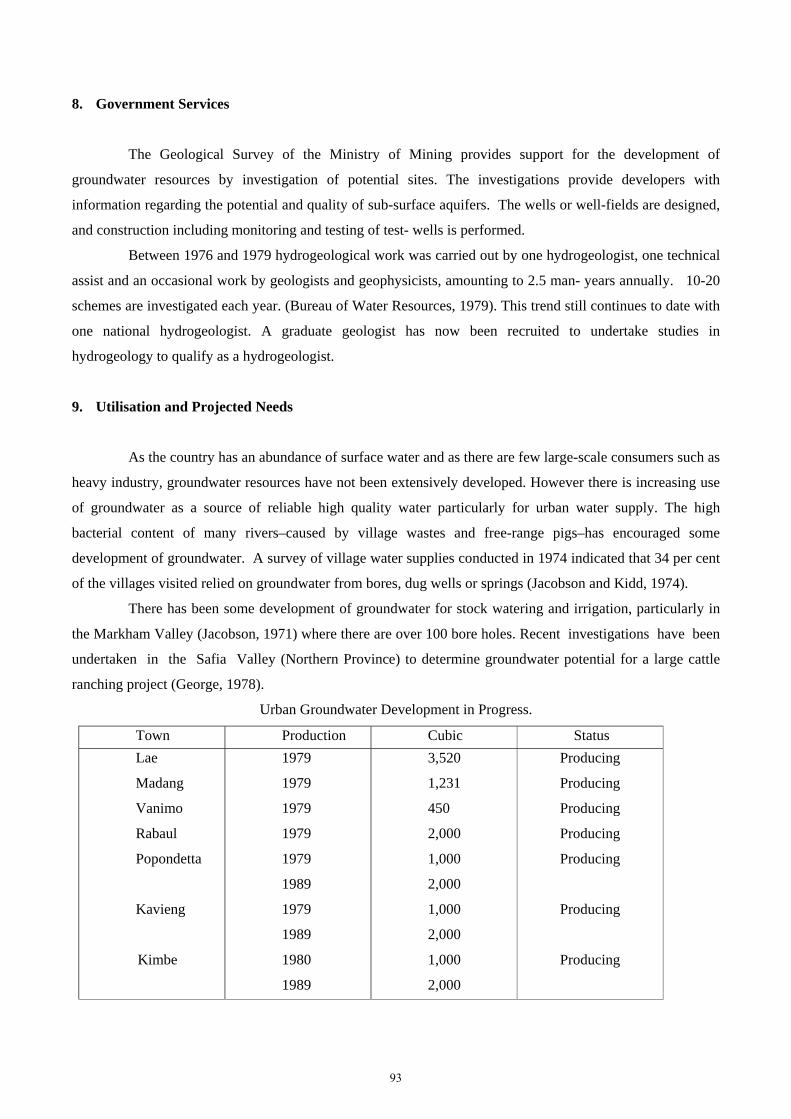
8. Government Services
The Geological Survey of the Ministry of Mining provides support for the development of
groundwater resources by investigation of potential sites. The investigations provide developers with
information regarding the potential and quality of sub-surface aquifers. The wells or well-fields are designed,
and construction including monitoring and testing of test- wells is performed.
Between 1976 and 1979 hydrogeological work was carried out by one hydrogeologist, one technical
assist and an occasional work by geologists and geophysicists, amounting to 2.5 man- years annually. 10-20
schemes are investigated each year. (Bureau of Water Resources, 1979). This trend still continues to date with
one national hydrogeologist. A graduate geologist has now been recruited to undertake studies in
hydrogeology to qualify as a hydrogeologist.
9. Utilisation and Projected Needs
As the country has an abundance of surface water and as there are few large-scale consumers such as
heavy industry, groundwater resources have not been extensively developed. However there is increasing use
of groundwater as a source of reliable high quality water particularly for urban water supply. The high
bacterial content of many rivers–caused by village wastes and free-range pigs–has encouraged some
development of groundwater. A survey of village water supplies conducted in 1974 indicated that 34 per cent
of the villages visited relied on groundwater from bores, dug wells or springs (Jacobson and Kidd, 1974).
There has been some development of groundwater for stock watering and irrigation, particularly in
the Markham Valley (Jacobson, 1971) where there are over 100 bore holes. Recent investigations have been
undertaken in the Safia Valley (Northern Province) to determine groundwater potential for a large cattle
ranching project (George, 1978).
Urban Groundwater Development in Progress.
Town Production Cubic Status
Lae
Madang
Vanimo
Rabaul
Popondetta
Kavieng
Kimbe
1979
1979
1979
1979
1979
1989
1979
1989
1980
1989
3,520
1,231
450
2,000
1,000
2,000
1,000
2,000
1,000
2,000
Producing
Producing
Producing
Producing
Producing
Producing
Producing
93
The Asian Development Bank is currently undertaking a feasibility study of alternative schemes for
a long term rural and urban water supply development throughout the country. The adoption of all or part of
the recommendations may require development of high quality groundwater resources.
10. Economic Factors in Groundwater Development
Difficult drilling conditions and high costs of mobilization, casing and transport make commercial
groundwater development in Papua New Guinea expensive. An average shallow bore and hand-pump-
installed by a commercial driller costs more than K15,000, while bores in areas of deep aquifers (deeper than
30 m) may cost over K50,000. These are high costs for a Local Level Government budget in which water
supply very likely has low priority. Costs to the local authority can be reduced by as much as 50
percent if drilling is undertaken by Government owned rigs under the direction of the Geological Survey,
provided that the drilling program is sufficient to warrant the expense of transporting equipment into the area.
A sanitary dugwell or spring development may cost less than K30,000 complete with hand pump, and
thus is preferred to drilling wherever possible. Funding for groundwater development may become
available if the realizes the importance of it.
Abundance of surface water is likely to satisfy most rural requirements and large scale
enterprises in most areas for the foreseeable future.
94
Water Resource Assessment for Prioritized Areas
Lutgardo S. Laraño Senior Science Research Specialist, Mines and Geoscience Bureau (MGB)
1. Introduction
1.1 The History of Water Resource Assessment
The National Water Resources Board (NWRB) and the Mines and Geosciences Bureau (MGB) are
both government agencies mandated with powers in regulation, exploitation, development and conservation
and protection of the country’s water and mineral resources. In its regulatory functions, NWRB assess the
available resources as basis for allocation and granting of water permits for various uses. while, MGB
collaborates with NWRB in connection with the hydrological and geological aspects and requirement in
assessing the available water resources.
In the 1980’s, a groundwater resources study was conducted by the National Water Resource
Council and the National Hydraulic Research Center. The study aims at quantifying the amount of
groundwater available. This will allow proper allocation of the resource to users and determine the densities of
well advisable in a particular area. One of the outputs of those projects is the groundwater availability map for
the different provinces. In addition, the entire water management area was divided into sub-areas wherein safe
yield, groundwater mining yield and withdrawal discharge density were calculated. The computed safe yield
in each sub-area was used as a basis for groundwater allocation in the province.
Currently, extraction of groundwater in some areas in the country has already exceeded the
allowable extraction rate or safe yield. Unrestrained utilization of groundwater thru additional allocations of
groundwater in these areas would result in further deterioration of water quality, decline in piezometric level,
saline intrusion and possible land subsidence. Considered to be in critical condition are the areas of
Metropolitan Manila and Cebu and their adjoining municipalities as granted permits in these areas had already
reached mining yield level. This prompted a moratorium on granting of water permits in these areas.
For validation, the water resource assessment study for these two critical areas was proposed and
be part of the Institutional Strengthening of NWRB, one of the activities of Water Resource Development
Project (WRDP) funded by the World Bank.
1.2 Purpose and Objectives
This assessment of water resources in Metro Manila and Metro Cebu will be applied as a tool for
water use regulation. This will be replicated in other critical areas in subsequent studies.
The specific objectives of the project are as follows:
(1) Inventory and updating of water related data and information.
95
1
(2) Mapping of updated water resources data and information.
(3) Evaluation of available water in prioritized critical areas of rapid growth expansion using modern
techniques for evaluation; and
(4) Upgrading of capability of NWRB staff, through on-the-job training on water resources assessment, which
include water balance computation and groundwater modeling, pumping test analysis, and earth electrical
resistivity survey and interpretation.
The study was made following the sequence of activities below:
(1) Collection review and critiquing of available data and information;
(2) Field investigation and verification;
(3) Definition of aquifer geometry and characteristics;
(4) Groundwater modeling
(5) Calibration of groundwater model; and
(6) Training of NWRB staff on the use of the model, conduct of earth resistivity survey and interpretation of
results, use of geographic information system in groundwater study, and conduct of pumping test and analysis
of results.
2. Data Collection and Review
Prior to collection of data and information, coordinating meetings with concerned agencies were
made. This is to inform and explain to these offices the necessary data and information needed in the study
and to seek permission to enter into their properties, particularly well pumping stations. Other agencies were
approached through writings. Among the government agencies coordinated were MWSS, MGB, LWUA,
PAGASA and WELDAPHIL.
Secondary data and information obtained can be classified as reports, maps and drawings, well
inventory data, water quality data, climatic data and hydrologic data.
Primary data were obtained through field investigations. A well inventory was conducted basically
to acquire information on the current water level and water quality. For each well inventoried, the location
(geographic coordinates), static water level and water quality were recorded. Among the water quality
parameters examined on-site are electrical conductivity and total dissolved solids. Geo- resistivity surveys
were conducted both in Metro Manila and Metro Cebu.
3. The Study Area
3.1 Geographic Setting
The study area is situated within the latitudes 14º 06’ 07.54’’ to 14º 56’ 46.88” north and longitudes
120º 49’ 57.60” and 121º 17’ 20.98” east in Luzon Island, Philippines. From north to south, includes the
following: the southern fringe of the Central Plain of Luzon that covers some towns of the Province of
96
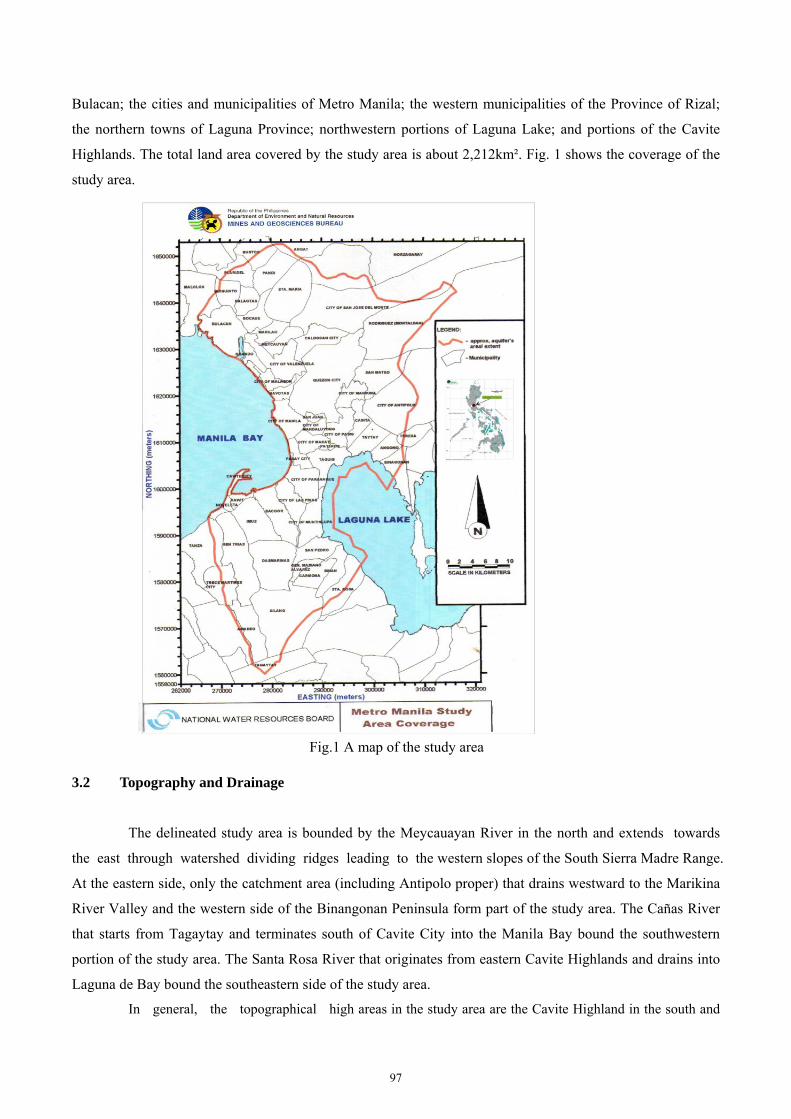
Bulacan; the cities and municipalities of Metro Manila; the western municipalities of the Province of Rizal;
the northern towns of Laguna Province; northwestern portions of Laguna Lake; and portions of the Cavite
Highlands. The total land area covered by the study area is about 2,212km². Fig. 1 shows the coverage of the
study area.
Fig.1 A map of the study area 3.2 Topography and Drainage
The delineated study area is bounded by the Meycauayan River in the north and extends towards
the east through watershed dividing ridges leading to the western slopes of the South Sierra Madre Range.
At the eastern side, only the catchment area (including Antipolo proper) that drains westward to the Marikina
River Valley and the western side of the Binangonan Peninsula form part of the study area. The Cañas River
that starts from Tagaytay and terminates south of Cavite City into the Manila Bay bound the southwestern
portion of the study area. The Santa Rosa River that originates from eastern Cavite Highlands and drains into
Laguna de Bay bound the southeastern side of the study area.
In general, the topographical high areas in the study area are the Cavite Highland in the south and
97
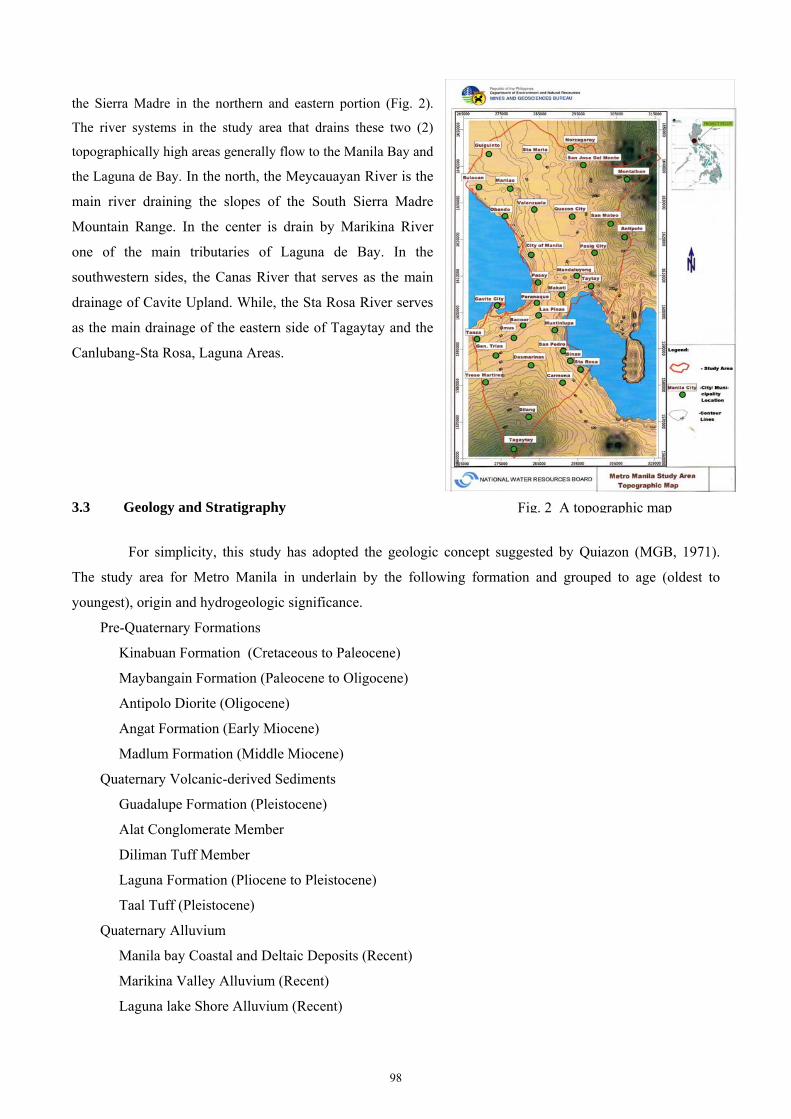
the Sierra Madre in the northern and eastern portion (Fig. 2).
The river systems in the study area that drains these two (2)
topographically high areas generally flow to the Manila Bay and
the Laguna de Bay. In the north, the Meycauayan River is the
main river draining the slopes of the South Sierra Madre
Mountain Range. In the center is drain by Marikina River
one of the main tributaries of Laguna de Bay. In the
southwestern sides, the Canas River that serves as the main
drainage of Cavite Upland. While, the Sta Rosa River serves
as the main drainage of the eastern side of Tagaytay and the
Canlubang-Sta Rosa, Laguna Areas.
3.3 Geology and Stratigraphy
For simplicity, this study has adopted the geologic concept suggested by Quiazon (MGB, 1971).
The study area for Metro Manila in underlain by the following formation and grouped to age (oldest to
youngest), origin and hydrogeologic significance.
Pre-Quaternary Formations
Kinabuan Formation (Cretaceous to Paleocene)
Maybangain Formation (Paleocene to Oligocene)
Antipolo Diorite (Oligocene)
Angat Formation (Early Miocene)
Madlum Formation (Middle Miocene)
Quaternary Volcanic-derived Sediments
Guadalupe Formation (Pleistocene)
Alat Conglomerate Member
Diliman Tuff Member
Laguna Formation (Pliocene to Pleistocene)
Taal Tuff (Pleistocene)
Quaternary Alluvium
Manila bay Coastal and Deltaic Deposits (Recent)
Marikina Valley Alluvium (Recent)
Laguna lake Shore Alluvium (Recent)
Fig. 2 A topographic map
98
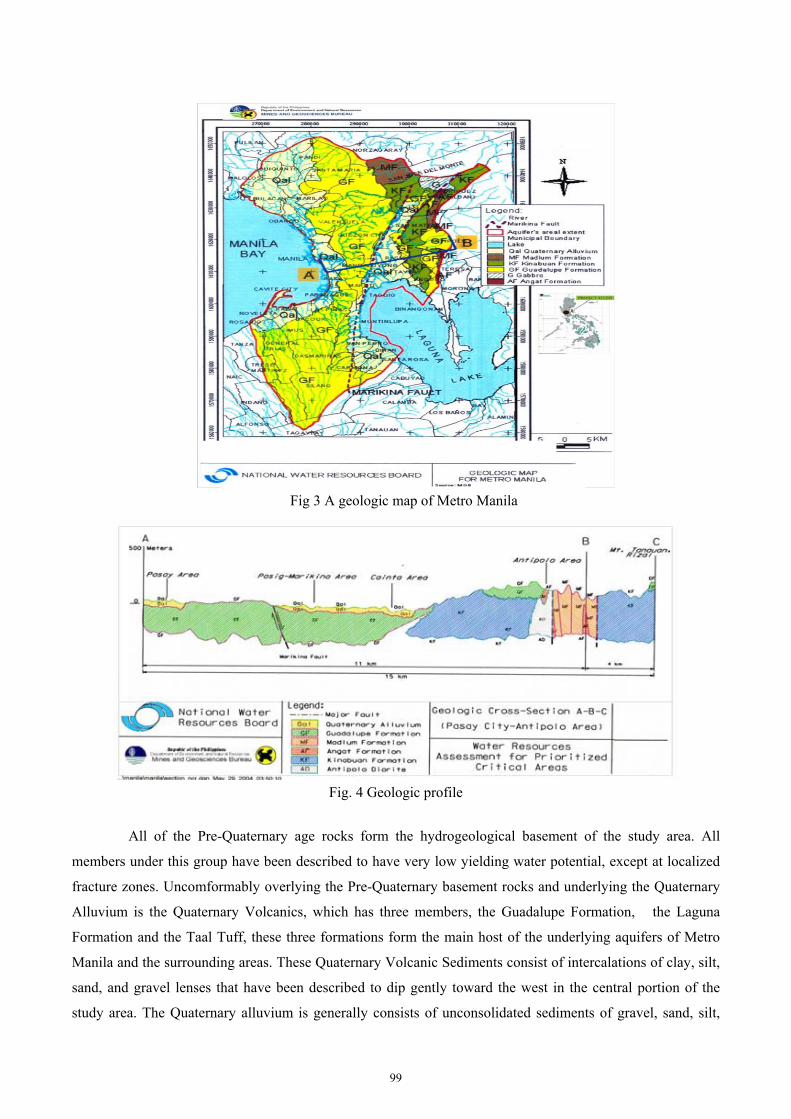
Fig. 4 Geologic profile
All of the Pre-Quaternary age rocks form the hydrogeological basement of the study area. All
members under this group have been described to have very low yielding water potential, except at localized
fracture zones. Uncomformably overlying the Pre-Quaternary basement rocks and underlying the Quaternary
Alluvium is the Quaternary Volcanics, which has three members, the Guadalupe Formation, the Laguna
Formation and the Taal Tuff, these three formations form the main host of the underlying aquifers of Metro
Manila and the surrounding areas. These Quaternary Volcanic Sediments consist of intercalations of clay, silt,
sand, and gravel lenses that have been described to dip gently toward the west in the central portion of the
study area. The Quaternary alluvium is generally consists of unconsolidated sediments of gravel, sand, silt,
Fig 3 A geologic map of Metro Manila
99
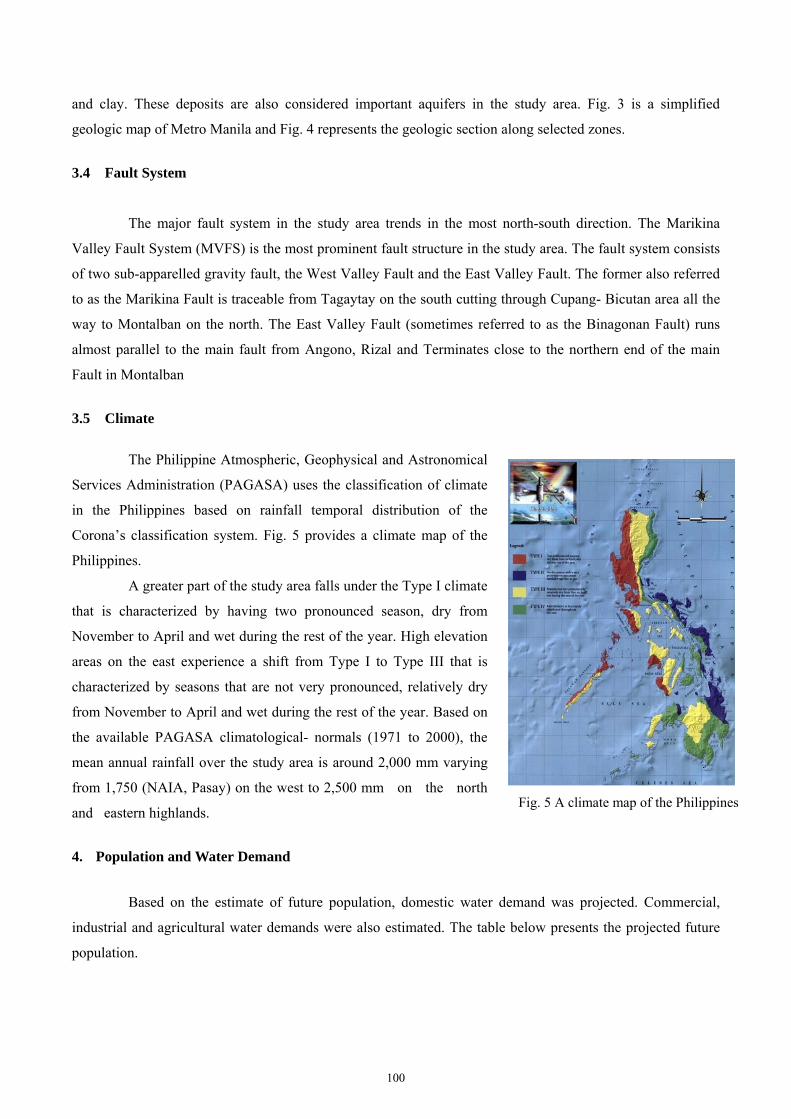
and clay. These deposits are also considered important aquifers in the study area. Fig. 3 is a simplified
geologic map of Metro Manila and Fig. 4 represents the geologic section along selected zones.
3.4 Fault System
The major fault system in the study area trends in the most north-south direction. The Marikina
Valley Fault System (MVFS) is the most prominent fault structure in the study area. The fault system consists
of two sub-apparelled gravity fault, the West Valley Fault and the East Valley Fault. The former also referred
to as the Marikina Fault is traceable from Tagaytay on the south cutting through Cupang- Bicutan area all the
way to Montalban on the north. The East Valley Fault (sometimes referred to as the Binagonan Fault) runs
almost parallel to the main fault from Angono, Rizal and Terminates close to the northern end of the main
Fault in Montalban
3.5 Climate
The Philippine Atmospheric, Geophysical and Astronomical
Services Administration (PAGASA) uses the classification of climate
in the Philippines based on rainfall temporal distribution of the
Corona’s classification system. Fig. 5 provides a climate map of the
Philippines.
A greater part of the study area falls under the Type I climate
that is characterized by having two pronounced season, dry from
November to April and wet during the rest of the year. High elevation
areas on the east experience a shift from Type I to Type III that is
characterized by seasons that are not very pronounced, relatively dry
from November to April and wet during the rest of the year. Based on
the available PAGASA climatological- normals (1971 to 2000), the
mean annual rainfall over the study area is around 2,000 mm varying
from 1,750 (NAIA, Pasay) on the west to 2,500 mm on the north
and eastern highlands.
4. Population and Water Demand
Based on the estimate of future population, domestic water demand was projected. Commercial,
industrial and agricultural water demands were also estimated. The table below presents the projected future
population.
Fig. 5 A climate map of the Philippines
100
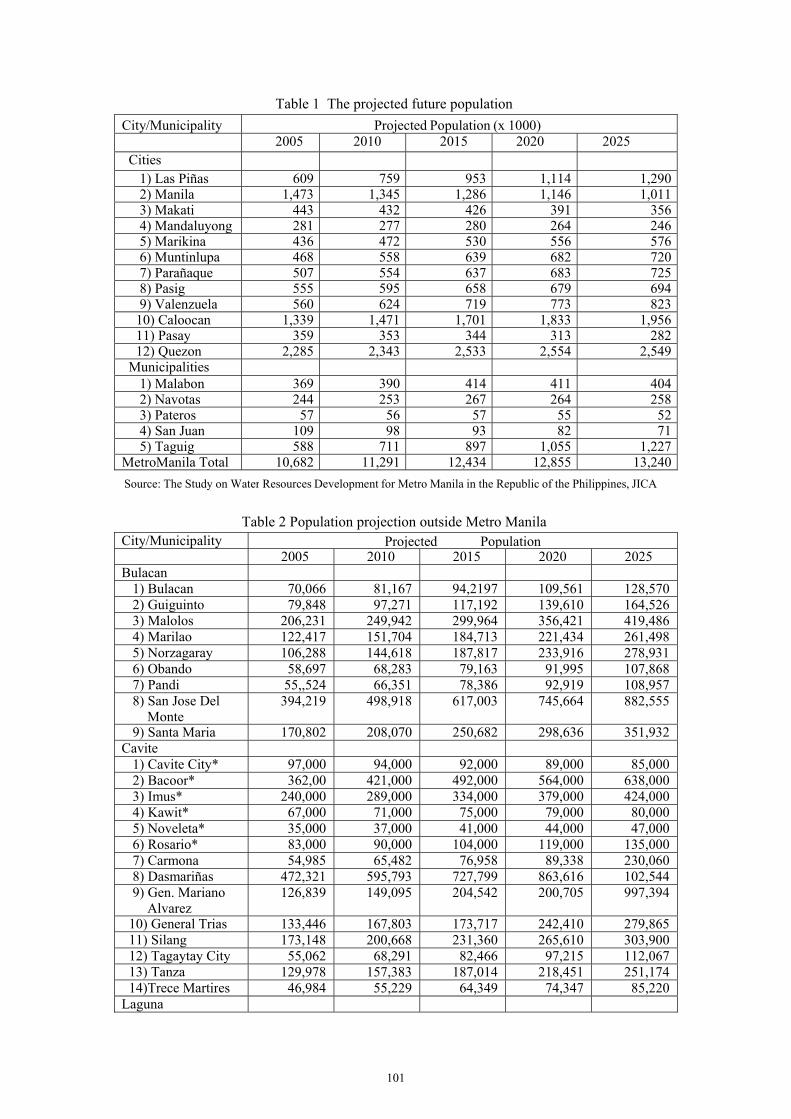
Table 1 The projected future population
City/Municipality Projected Population (x 1000) 2005 2010 2015 2020 2025 Cities
1) Las Piñas 609 759 953 1,114 1,2902) Manila 1,473 1,345 1,286 1,146 1,0113) Makati 443 432 426 391 3564) Mandaluyong 281 277 280 264 2465) Marikina 436 472 530 556 5766) Muntinlupa 468 558 639 682 7207) Parañaque 507 554 637 683 7258) Pasig 555 595 658 679 6949) Valenzuela 560 624 719 773 823
10) Caloocan 1,339 1,471 1,701 1,833 1,95611) Pasay 359 353 344 313 28212) Quezon 2,285 2,343 2,533 2,554 2,549
Municipalities 1) Malabon 369 390 414 411 4042) Navotas 244 253 267 264 2583) Pateros 57 56 57 55 524) San Juan 109 98 93 82 715) Taguig 588 711 897 1,055 1,227
MetroManila Total 10,682 11,291 12,434 12,855 13,240
Table 2 Population projection outside Metro Manila City/Municipality Projected Population
2005 2010 2015 2020 2025 Bulacan
1) Bulacan 70,066 81,167 94,2197 109,561 128,5702) Guiguinto 79,848 97,271 117,192 139,610 164,5263) Malolos 206,231 249,942 299,964 356,421 419,4864) Marilao 122,417 151,704 184,713 221,434 261,4985) Norzagaray 106,288 144,618 187,817 233,916 278,9316) Obando 58,697 68,283 79,163 91,995 107,8687) Pandi 55,,524 66,351 78,386 92,919 108,9578) San Jose Del
Monte 394,219 498,918 617,003 745,664 882,555
9) Santa Maria 170,802 208,070 250,682 298,636 351,932Cavite
1) Cavite City* 97,000 94,000 92,000 89,000 85,0002) Bacoor* 362,00 421,000 492,000 564,000 638,0003) Imus* 240,000 289,000 334,000 379,000 424,0004) Kawit* 67,000 71,000 75,000 79,000 80,0005) Noveleta* 35,000 37,000 41,000 44,000 47,0006) Rosario* 83,000 90,000 104,000 119,000 135,0007) Carmona 54,985 65,482 76,958 89,338 230,0608) Dasmariñas 472,321 595,793 727,799 863,616 102,5449) Gen. Mariano
Alvarez 126,839 149,095 204,542 200,705 997,394
10) General Trias 133,446 167,803 173,717 242,410 279,86511) Silang 173,148 200,668 231,360 265,610 303,90012) Tagaytay City 55,062 68,291 82,466 97,215 112,06713) Tanza 129,978 157,383 187,014 218,451 251,17414)Trece Martires 46,984 55,229 64,349 74,347 85,220
Laguna
Source: The Study on Water Resources Development for Metro Manila in the Republic of the Philippines, JICA
101
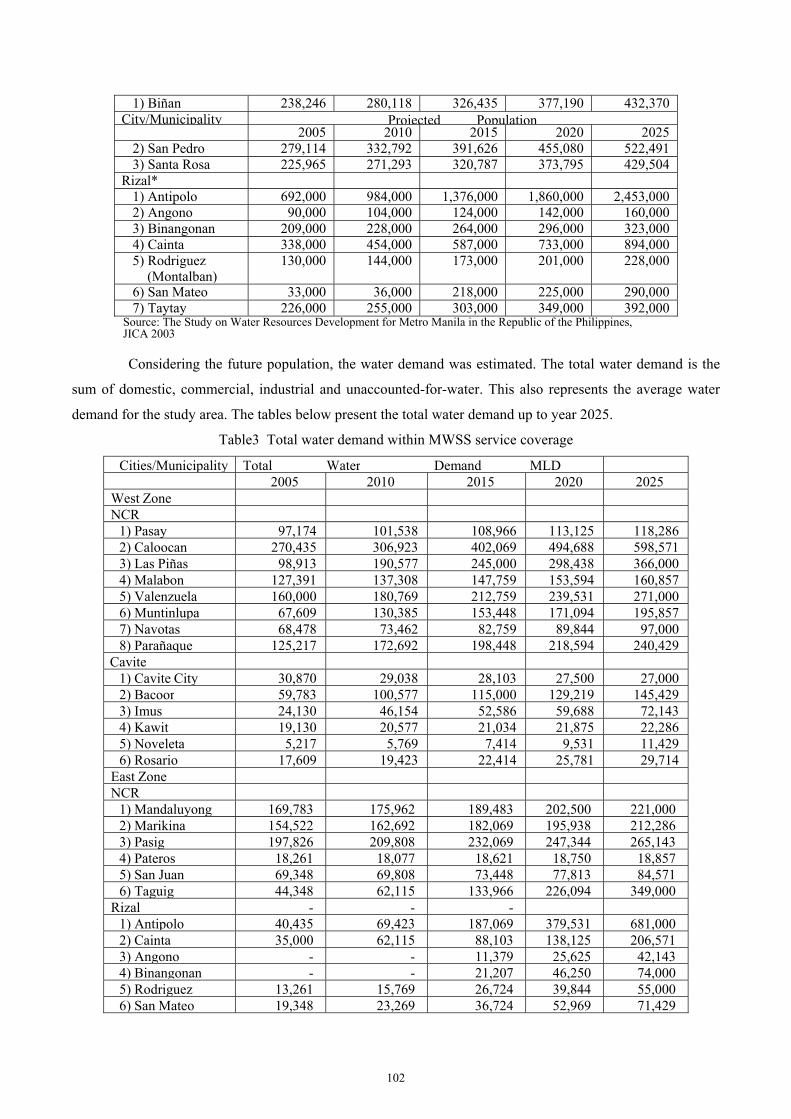
1) Biñan 238,246 280,118 326,435 377,190 432,370City/Municipality Projected Population
2005 2010 2015 2020 20252) San Pedro 279,114 332,792 391,626 455,080 522,4913) Santa Rosa 225,965 271,293 320,787 373,795 429,504
Rizal* 1) Antipolo 692,000 984,000 1,376,000 1,860,000 2,453,0002) Angono 90,000 104,000 124,000 142,000 160,0003) Binangonan 209,000 228,000 264,000 296,000 323,0004) Cainta 338,000 454,000 587,000 733,000 894,0005) Rodriguez
(Montalban) 130,000 144,000 173,000 201,000 228,000
6) San Mateo 33,000 36,000 218,000 225,000 290,0007) Taytay 226,000 255,000 303,000 349,000 392,000
Source: The Study on Water Resources Development for Metro Manila in the Republic of the Philippines, JICA 2003
Considering the future population, the water demand was estimated. The total water demand is the
sum of domestic, commercial, industrial and unaccounted-for-water. This also represents the average water
demand for the study area. The tables below present the total water demand up to year 2025.
Table3 Total water demand within MWSS service coverage
Cities/Municipality Total Water Demand MLD 2005 2010 2015 2020 2025West Zone NCR
1) Pasay 97,174 101,538 108,966 113,125 118,2862) Caloocan 270,435 306,923 402,069 494,688 598,5713) Las Piñas 98,913 190,577 245,000 298,438 366,0004) Malabon 127,391 137,308 147,759 153,594 160,8575) Valenzuela 160,000 180,769 212,759 239,531 271,0006) Muntinlupa 67,609 130,385 153,448 171,094 195,8577) Navotas 68,478 73,462 82,759 89,844 97,0008) Parañaque 125,217 172,692 198,448 218,594 240,429
Cavite 1) Cavite City 30,870 29,038 28,103 27,500 27,0002) Bacoor 59,783 100,577 115,000 129,219 145,4293) Imus 24,130 46,154 52,586 59,688 72,1434) Kawit 19,130 20,577 21,034 21,875 22,2865) Noveleta 5,217 5,769 7,414 9,531 11,4296) Rosario 17,609 19,423 22,414 25,781 29,714
East Zone NCR
1) Mandaluyong 169,783 175,962 189,483 202,500 221,0002) Marikina 154,522 162,692 182,069 195,938 212,2863) Pasig 197,826 209,808 232,069 247,344 265,1434) Pateros 18,261 18,077 18,621 18,750 18,8575) San Juan 69,348 69,808 73,448 77,813 84,5716) Taguig 44,348 62,115 133,966 226,094 349,000
Rizal - - - 1) Antipolo 40,435 69,423 187,069 379,531 681,0002) Cainta 35,000 62,115 88,103 138,125 206,5713) Angono - - 11,379 25,625 42,1434) Binangonan - - 21,207 46,250 74,0005) Rodriguez 13,261 15,769 26,724 39,844 55,0006) San Mateo 19,348 23,269 36,724 52,969 71,429
102
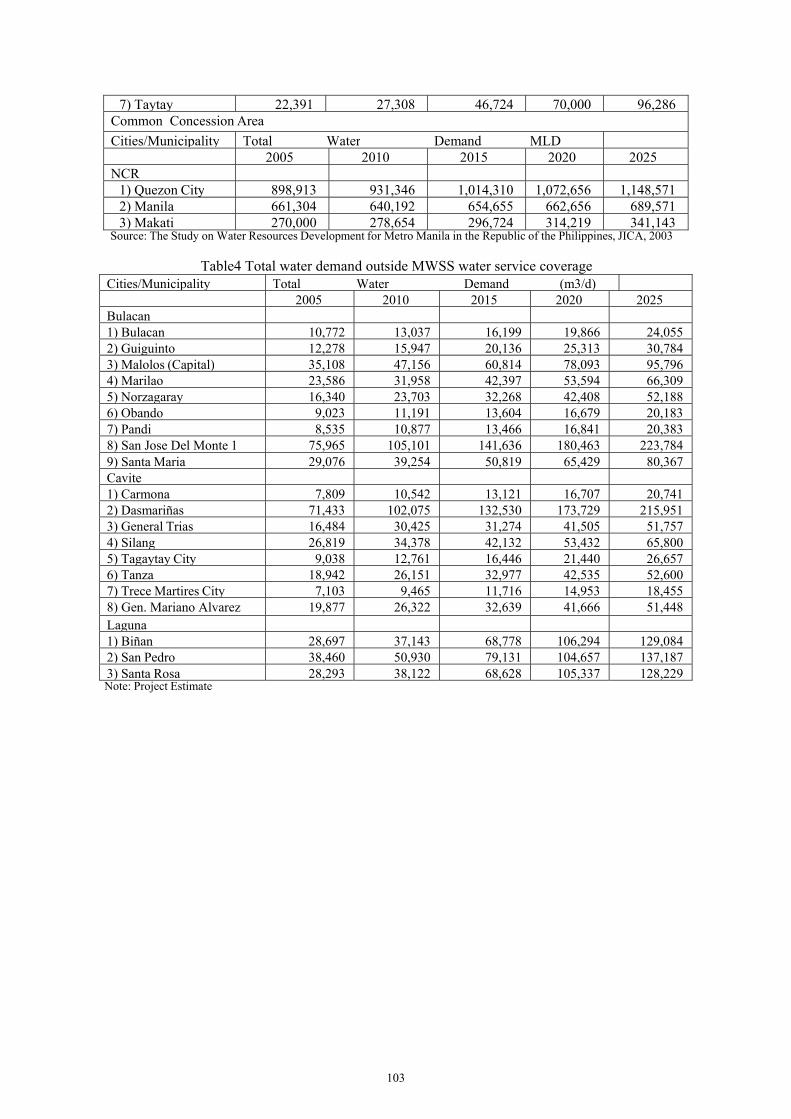
7) Taytay 22,391 27,308 46,724 70,000 96,286Common Concession Area
Cities/Municipality Total Water Demand MLD 2005 2010 2015 2020 2025NCR
1) Quezon City 898,913 931,346 1,014,310 1,072,656 1,148,5712) Manila 661,304 640,192 654,655 662,656 689,5713) Makati 270,000 278,654 296,724 314,219 341,143
Source: The Study on Water Resources Development for Metro Manila in the Republic of the Philippines, JICA, 2003
Table4 Total water demand outside MWSS water service coverage Cities/Municipality Total Water Demand (m3/d)
2005 2010 2015 2020 2025Bulacan 1) Bulacan 10,772 13,037 16,199 19,866 24,0552) Guiguinto 12,278 15,947 20,136 25,313 30,7843) Malolos (Capital) 35,108 47,156 60,814 78,093 95,7964) Marilao 23,586 31,958 42,397 53,594 66,3095) Norzagaray 16,340 23,703 32,268 42,408 52,1886) Obando 9,023 11,191 13,604 16,679 20,1837) Pandi 8,535 10,877 13,466 16,841 20,3838) San Jose Del Monte 1 75,965 105,101 141,636 180,463 223,7849) Santa Maria 29,076 39,254 50,819 65,429 80,367Cavite 1) Carmona 7,809 10,542 13,121 16,707 20,7412) Dasmariñas 71,433 102,075 132,530 173,729 215,9513) General Trias 16,484 30,425 31,274 41,505 51,7574) Silang 26,819 34,378 42,132 53,432 65,8005) Tagaytay City 9,038 12,761 16,446 21,440 26,6576) Tanza 18,942 26,151 32,977 42,535 52,6007) Trece Martires City 7,103 9,465 11,716 14,953 18,4558) Gen. Mariano Alvarez 19,877 26,322 32,639 41,666 51,448Laguna 1) Biñan 28,697 37,143 68,778 106,294 129,0842) San Pedro 38,460 50,930 79,131 104,657 137,1873) Santa Rosa 28,293 38,122 68,628 105,337 128,229Note: Project Estimate
103
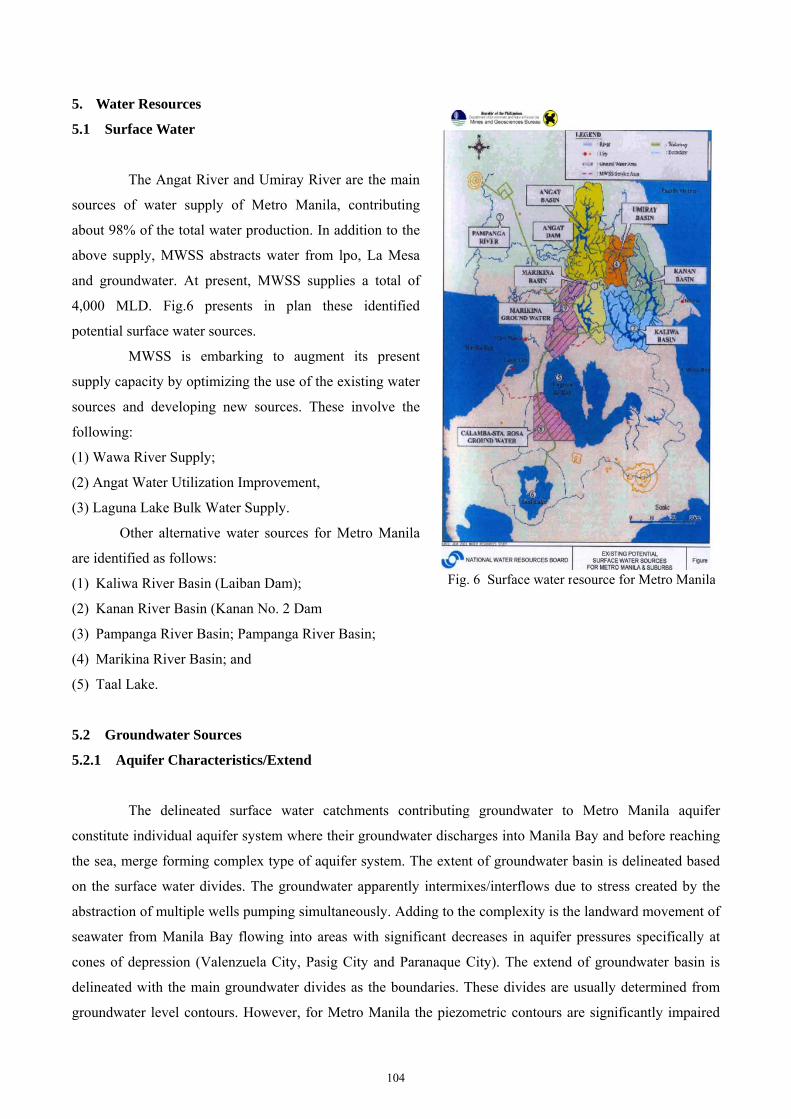
5. Water Resources
5.1 Surface Water
The Angat River and Umiray River are the main
sources of water supply of Metro Manila, contributing
about 98% of the total water production. In addition to the
above supply, MWSS abstracts water from lpo, La Mesa
and groundwater. At present, MWSS supplies a total of
4,000 MLD. Fig.6 presents in plan these identified
potential surface water sources.
MWSS is embarking to augment its present
supply capacity by optimizing the use of the existing water
sources and developing new sources. These involve the
following:
(1) Wawa River Supply;
(2) Angat Water Utilization Improvement,
(3) Laguna Lake Bulk Water Supply.
Other alternative water sources for Metro Manila
are identified as follows:
(1) Kaliwa River Basin (Laiban Dam);
(2) Kanan River Basin (Kanan No. 2 Dam
(3) Pampanga River Basin; Pampanga River Basin;
(4) Marikina River Basin; and
(5) Taal Lake.
5.2 Groundwater Sources
5.2.1 Aquifer Characteristics/Extend
The delineated surface water catchments contributing groundwater to Metro Manila aquifer
constitute individual aquifer system where their groundwater discharges into Manila Bay and before reaching
the sea, merge forming complex type of aquifer system. The extent of groundwater basin is delineated based
on the surface water divides. The groundwater apparently intermixes/interflows due to stress created by the
abstraction of multiple wells pumping simultaneously. Adding to the complexity is the landward movement of
seawater from Manila Bay flowing into areas with significant decreases in aquifer pressures specifically at
cones of depression (Valenzuela City, Pasig City and Paranaque City). The extend of groundwater basin is
delineated with the main groundwater divides as the boundaries. These divides are usually determined from
groundwater level contours. However, for Metro Manila the piezometric contours are significantly impaired
Fig. 6 Surface water resource for Metro Manila
104
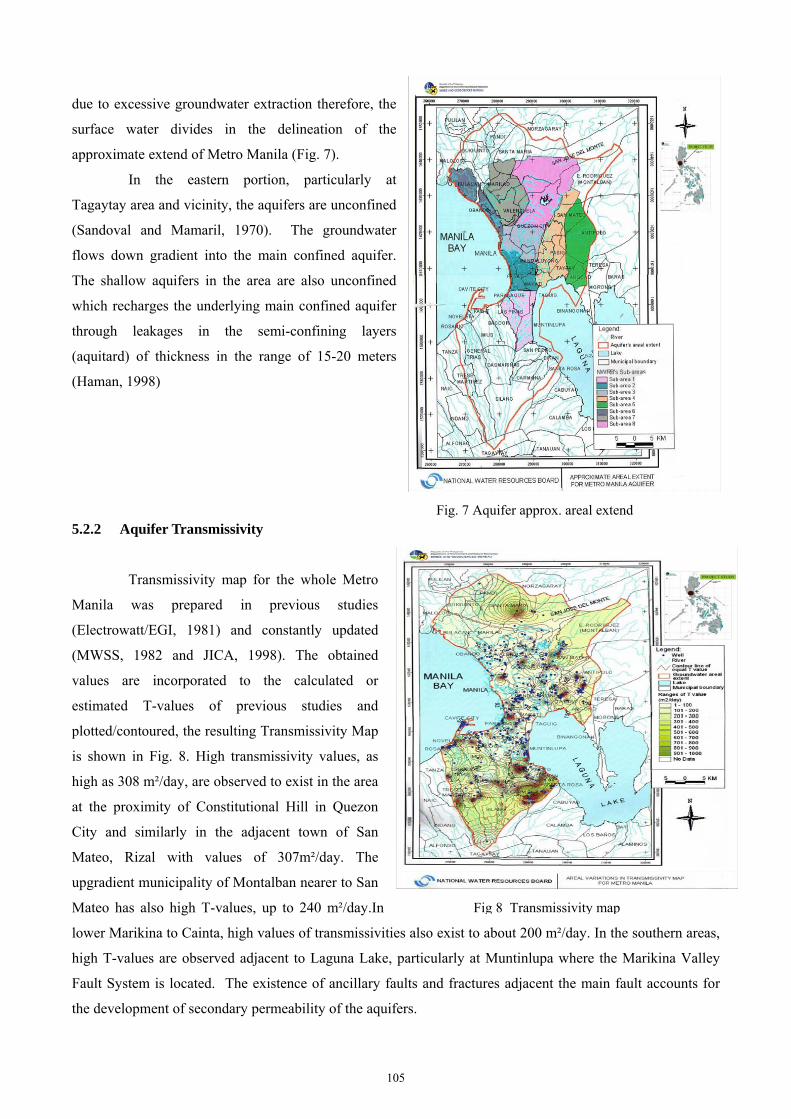
due to excessive groundwater extraction therefore, the
surface water divides in the delineation of the
approximate extend of Metro Manila (Fig. 7).
In the eastern portion, particularly at
Tagaytay area and vicinity, the aquifers are unconfined
(Sandoval and Mamaril, 1970). The groundwater
flows down gradient into the main confined aquifer.
The shallow aquifers in the area are also unconfined
which recharges the underlying main confined aquifer
through leakages in the semi-confining layers
(aquitard) of thickness in the range of 15-20 meters
(Haman, 1998)
Fig. 7 Aquifer approx. areal extend 5.2.2 Aquifer Transmissivity
Transmissivity map for the whole Metro
Manila was prepared in previous studies
(Electrowatt/EGI, 1981) and constantly updated
(MWSS, 1982 and JICA, 1998). The obtained
values are incorporated to the calculated or
estimated T-values of previous studies and
plotted/contoured, the resulting Transmissivity Map
is shown in Fig. 8. High transmissivity values, as
high as 308 m²/day, are observed to exist in the area
at the proximity of Constitutional Hill in Quezon
City and similarly in the adjacent town of San
Mateo, Rizal with values of 307m²/day. The
upgradient municipality of Montalban nearer to San
Mateo has also high T-values, up to 240 m²/day.In
lower Marikina to Cainta, high values of transmissivities also exist to about 200 m²/day. In the southern areas,
high T-values are observed adjacent to Laguna Lake, particularly at Muntinlupa where the Marikina Valley
Fault System is located. The existence of ancillary faults and fractures adjacent the main fault accounts for
the development of secondary permeability of the aquifers.
Fig 8 Transmissivity map
105
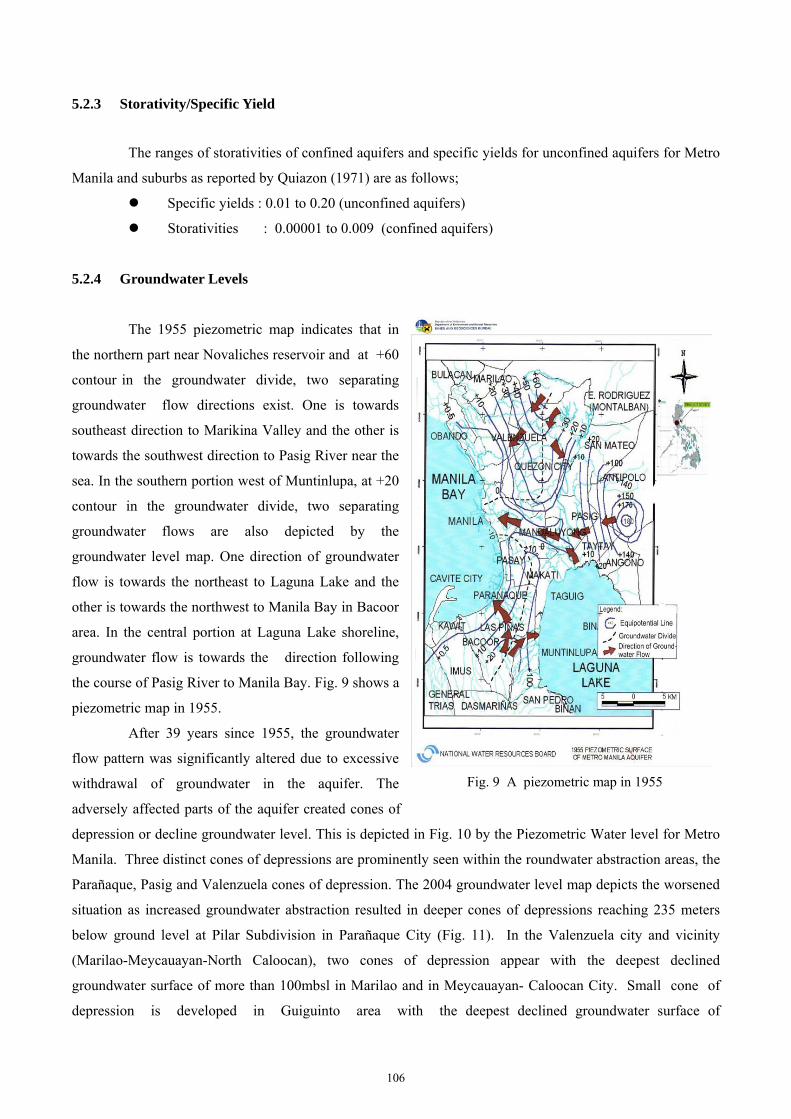
5.2.3 Storativity/Specific Yield
The ranges of storativities of confined aquifers and specific yields for unconfined aquifers for Metro
Manila and suburbs as reported by Quiazon (1971) are as follows;
Specific yields : 0.01 to 0.20 (unconfined aquifers)
Storativities : 0.00001 to 0.009 (confined aquifers)
5.2.4 Groundwater Levels
The 1955 piezometric map indicates that in
the northern part near Novaliches reservoir and at +60
contour in the groundwater divide, two separating
groundwater flow directions exist. One is towards
southeast direction to Marikina Valley and the other is
towards the southwest direction to Pasig River near the
sea. In the southern portion west of Muntinlupa, at +20
contour in the groundwater divide, two separating
groundwater flows are also depicted by the
groundwater level map. One direction of groundwater
flow is towards the northeast to Laguna Lake and the
other is towards the northwest to Manila Bay in Bacoor
area. In the central portion at Laguna Lake shoreline,
groundwater flow is towards the direction following
the course of Pasig River to Manila Bay. Fig. 9 shows a
piezometric map in 1955.
After 39 years since 1955, the groundwater
flow pattern was significantly altered due to excessive
withdrawal of groundwater in the aquifer. The
adversely affected parts of the aquifer created cones of
depression or decline groundwater level. This is depicted in Fig. 10 by the Piezometric Water level for Metro
Manila. Three distinct cones of depressions are prominently seen within the roundwater abstraction areas, the
Parañaque, Pasig and Valenzuela cones of depression. The 2004 groundwater level map depicts the worsened
situation as increased groundwater abstraction resulted in deeper cones of depressions reaching 235 meters
below ground level at Pilar Subdivision in Parañaque City (Fig. 11). In the Valenzuela city and vicinity
(Marilao-Meycauayan-North Caloocan), two cones of depression appear with the deepest declined
groundwater surface of more than 100mbsl in Marilao and in Meycauayan- Caloocan City. Small cone of
depression is developed in Guiguinto area with the deepest declined groundwater surface of
Fig. 9 A piezometric map in 1955
106
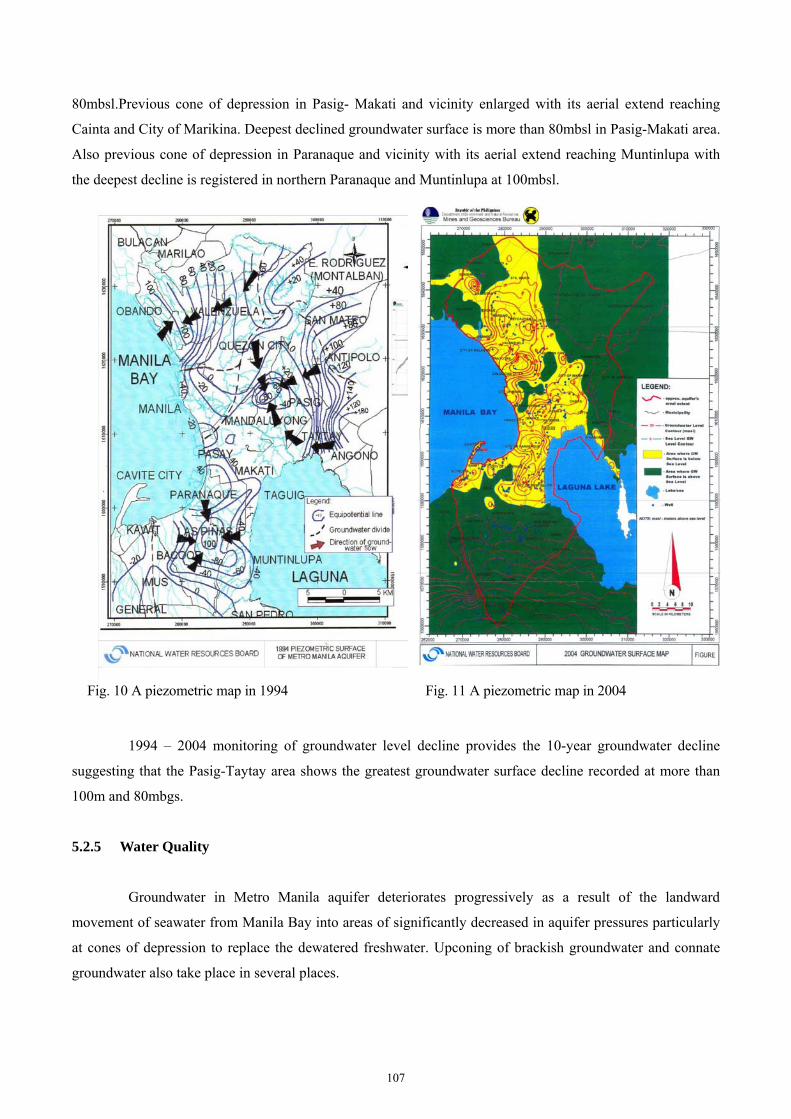
80mbsl.Previous cone of depression in Pasig- Makati and vicinity enlarged with its aerial extend reaching
Cainta and City of Marikina. Deepest declined groundwater surface is more than 80mbsl in Pasig-Makati area.
Also previous cone of depression in Paranaque and vicinity with its aerial extend reaching Muntinlupa with
the deepest decline is registered in northern Paranaque and Muntinlupa at 100mbsl.
Fig. 10 A piezometric map in 1994 Fig. 11 A piezometric map in 2004
1994 – 2004 monitoring of groundwater level decline provides the 10-year groundwater decline
suggesting that the Pasig-Taytay area shows the greatest groundwater surface decline recorded at more than
100m and 80mbgs.
5.2.5 Water Quality
Groundwater in Metro Manila aquifer deteriorates progressively as a result of the landward
movement of seawater from Manila Bay into areas of significantly decreased in aquifer pressures particularly
at cones of depression to replace the dewatered freshwater. Upconing of brackish groundwater and connate
groundwater also take place in several places.
107
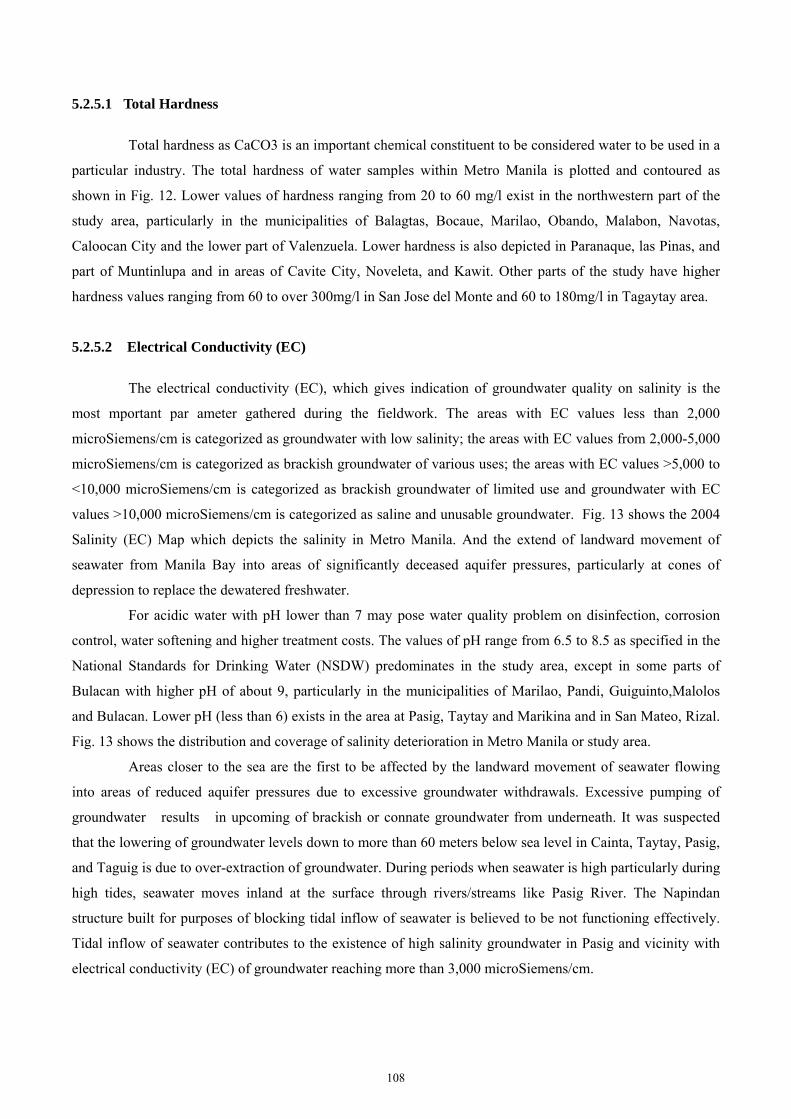
5.2.5.1 Total Hardness
Total hardness as CaCO3 is an important chemical constituent to be considered water to be used in a
particular industry. The total hardness of water samples within Metro Manila is plotted and contoured as
shown in Fig. 12. Lower values of hardness ranging from 20 to 60 mg/l exist in the northwestern part of the
study area, particularly in the municipalities of Balagtas, Bocaue, Marilao, Obando, Malabon, Navotas,
Caloocan City and the lower part of Valenzuela. Lower hardness is also depicted in Paranaque, las Pinas, and
part of Muntinlupa and in areas of Cavite City, Noveleta, and Kawit. Other parts of the study have higher
hardness values ranging from 60 to over 300mg/l in San Jose del Monte and 60 to 180mg/l in Tagaytay area.
5.2.5.2 Electrical Conductivity (EC)
The electrical conductivity (EC), which gives indication of groundwater quality on salinity is the
most mportant par ameter gathered during the fieldwork. The areas with EC values less than 2,000
microSiemens/cm is categorized as groundwater with low salinity; the areas with EC values from 2,000-5,000
microSiemens/cm is categorized as brackish groundwater of various uses; the areas with EC values >5,000 to
<10,000 microSiemens/cm is categorized as brackish groundwater of limited use and groundwater with EC
values >10,000 microSiemens/cm is categorized as saline and unusable groundwater. Fig. 13 shows the 2004
Salinity (EC) Map which depicts the salinity in Metro Manila. And the extend of landward movement of
seawater from Manila Bay into areas of significantly deceased aquifer pressures, particularly at cones of
depression to replace the dewatered freshwater.
For acidic water with pH lower than 7 may pose water quality problem on disinfection, corrosion
control, water softening and higher treatment costs. The values of pH range from 6.5 to 8.5 as specified in the
National Standards for Drinking Water (NSDW) predominates in the study area, except in some parts of
Bulacan with higher pH of about 9, particularly in the municipalities of Marilao, Pandi, Guiguinto,Malolos
and Bulacan. Lower pH (less than 6) exists in the area at Pasig, Taytay and Marikina and in San Mateo, Rizal.
Fig. 13 shows the distribution and coverage of salinity deterioration in Metro Manila or study area.
Areas closer to the sea are the first to be affected by the landward movement of seawater flowing
into areas of reduced aquifer pressures due to excessive groundwater withdrawals. Excessive pumping of
groundwater results in upcoming of brackish or connate groundwater from underneath. It was suspected
that the lowering of groundwater levels down to more than 60 meters below sea level in Cainta, Taytay, Pasig,
and Taguig is due to over-extraction of groundwater. During periods when seawater is high particularly during
high tides, seawater moves inland at the surface through rivers/streams like Pasig River. The Napindan
structure built for purposes of blocking tidal inflow of seawater is believed to be not functioning effectively.
Tidal inflow of seawater contributes to the existence of high salinity groundwater in Pasig and vicinity with
electrical conductivity (EC) of groundwater reaching more than 3,000 microSiemens/cm.
108
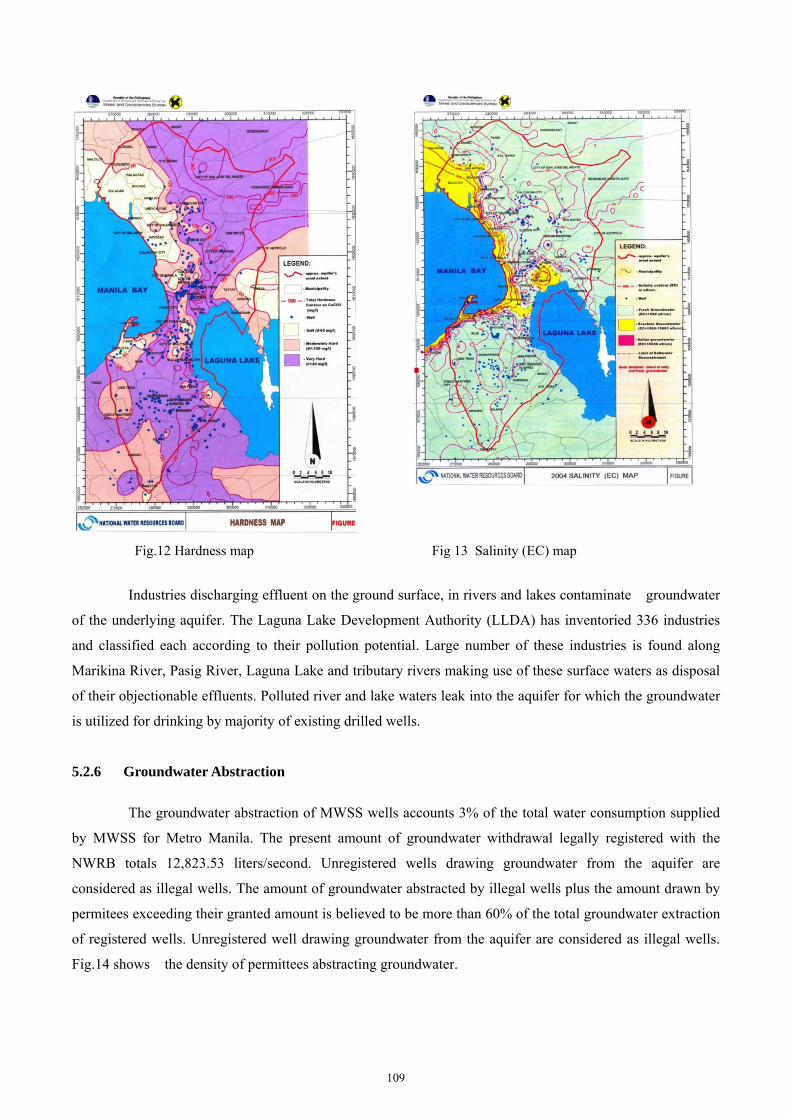
Fig.12 Hardness map Fig 13 Salinity (EC) map
Industries discharging effluent on the ground surface, in rivers and lakes contaminate groundwater
of the underlying aquifer. The Laguna Lake Development Authority (LLDA) has inventoried 336 industries
and classified each according to their pollution potential. Large number of these industries is found along
Marikina River, Pasig River, Laguna Lake and tributary rivers making use of these surface waters as disposal
of their objectionable effluents. Polluted river and lake waters leak into the aquifer for which the groundwater
is utilized for drinking by majority of existing drilled wells.
5.2.6 Groundwater Abstraction
The groundwater abstraction of MWSS wells accounts 3% of the total water consumption supplied
by MWSS for Metro Manila. The present amount of groundwater withdrawal legally registered with the
NWRB totals 12,823.53 liters/second. Unregistered wells drawing groundwater from the aquifer are
considered as illegal wells. The amount of groundwater abstracted by illegal wells plus the amount drawn by
permitees exceeding their granted amount is believed to be more than 60% of the total groundwater extraction
of registered wells. Unregistered well drawing groundwater from the aquifer are considered as illegal wells.
Fig.14 shows the density of permittees abstracting groundwater.
109
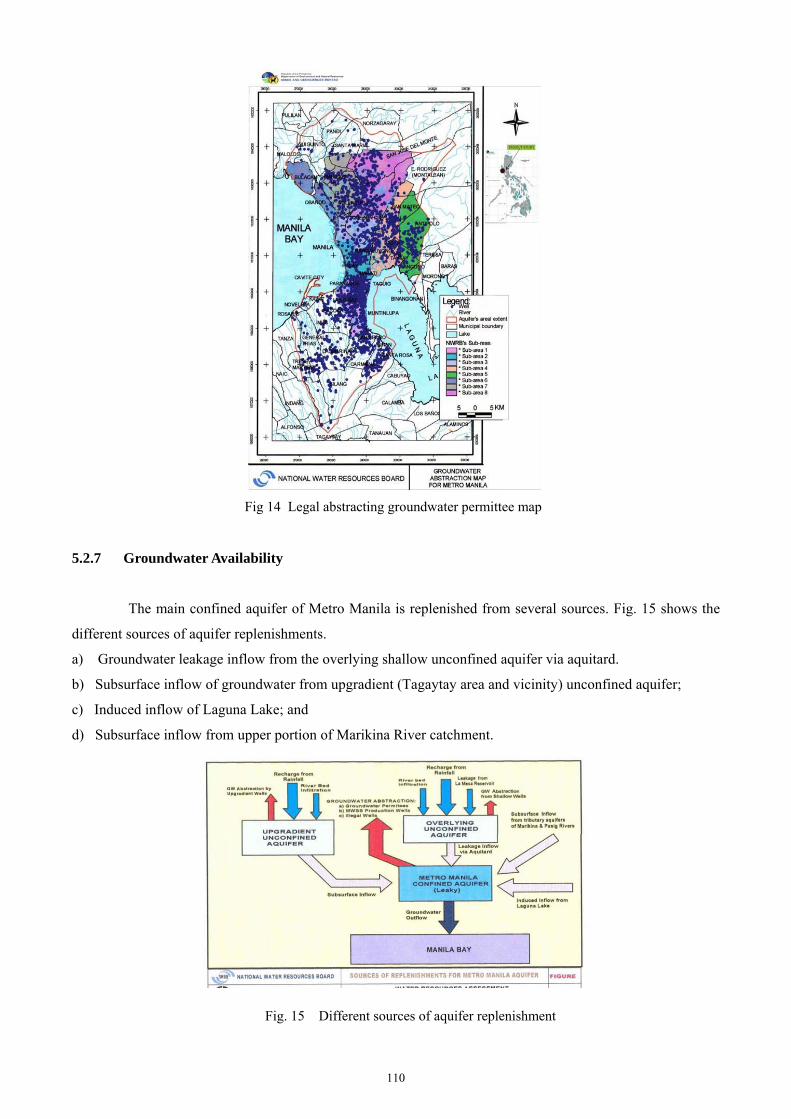
Fig 14 Legal abstracting groundwater permittee map
5.2.7 Groundwater Availability
The main confined aquifer of Metro Manila is replenished from several sources. Fig. 15 shows the
different sources of aquifer replenishments.
a) Groundwater leakage inflow from the overlying shallow unconfined aquifer via aquitard.
b) Subsurface inflow of groundwater from upgradient (Tagaytay area and vicinity) unconfined aquifer;
c) Induced inflow of Laguna Lake; and
d) Subsurface inflow from upper portion of Marikina River catchment.
Fig. 15 Different sources of aquifer replenishment
110
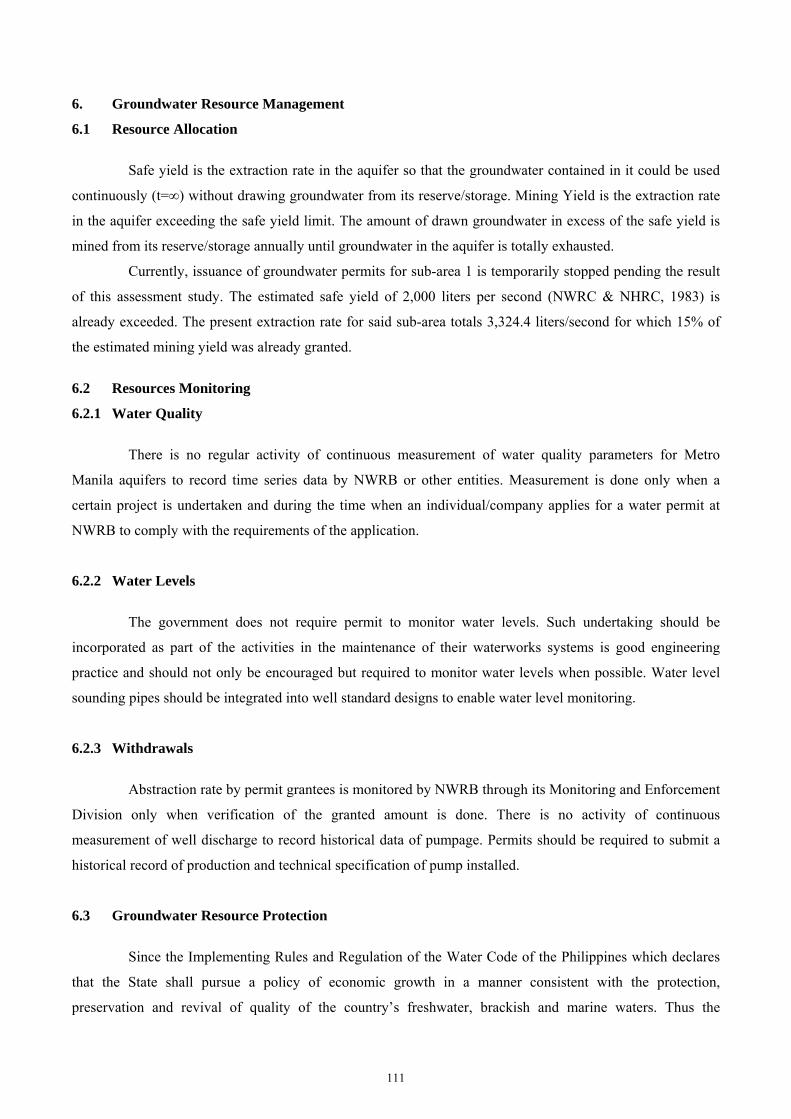
6. Groundwater Resource Management
6.1 Resource Allocation
Safe yield is the extraction rate in the aquifer so that the groundwater contained in it could be used
continuously (t=∞) without drawing groundwater from its reserve/storage. Mining Yield is the extraction rate
in the aquifer exceeding the safe yield limit. The amount of drawn groundwater in excess of the safe yield is
mined from its reserve/storage annually until groundwater in the aquifer is totally exhausted.
Currently, issuance of groundwater permits for sub-area 1 is temporarily stopped pending the result
of this assessment study. The estimated safe yield of 2,000 liters per second (NWRC & NHRC, 1983) is
already exceeded. The present extraction rate for said sub-area totals 3,324.4 liters/second for which 15% of
the estimated mining yield was already granted.
6.2 Resources Monitoring
6.2.1 Water Quality
There is no regular activity of continuous measurement of water quality parameters for Metro
Manila aquifers to record time series data by NWRB or other entities. Measurement is done only when a
certain project is undertaken and during the time when an individual/company applies for a water permit at
NWRB to comply with the requirements of the application.
6.2.2 Water Levels
The government does not require permit to monitor water levels. Such undertaking should be
incorporated as part of the activities in the maintenance of their waterworks systems is good engineering
practice and should not only be encouraged but required to monitor water levels when possible. Water level
sounding pipes should be integrated into well standard designs to enable water level monitoring.
6.2.3 Withdrawals
Abstraction rate by permit grantees is monitored by NWRB through its Monitoring and Enforcement
Division only when verification of the granted amount is done. There is no activity of continuous
measurement of well discharge to record historical data of pumpage. Permits should be required to submit a
historical record of production and technical specification of pump installed.
6.3 Groundwater Resource Protection
Since the Implementing Rules and Regulation of the Water Code of the Philippines which declares
that the State shall pursue a policy of economic growth in a manner consistent with the protection,
preservation and revival of quality of the country’s freshwater, brackish and marine waters. Thus the
111
protection of our water system that includes the sealing of abandoned wells by plugging or sealing of
abandoned wells, proper location of refuse dumpsite, graveyard, septic tank and proper appropriation /
allocation of groundwater.
7. Groundwater Modeling/Water Balance
Models or simulations may be used to estimate the hydraulic response of an aquifer, at complied
conditions at some future point in time. The predictive simulations must be viewed as estimates, not
certainties, to aid the decision-making process. The MODFLOW groundwater modeling software originally
developed by McDonald and Harbaugh (1988) of the U.S. Geological Survey is used. The MODFLOW model
is based on finite-difference method and designed for three-dimensional (3D) saturated groundwater flow.
One major task in groundwater modeling especially, 3-dimensional models, is the creation of the
groundwater grid system based on the hydrogeological concept model. The grid file was prepared using Surfer
graphic software over the study area. Having the same grid coordinate limits, this grid was then overlaid on
the digitized geological maps to be able to assign geological codes at the surface. This particular grid system
consists of 4,743 block-centered nodes (51 columns from west to east; 93 rows from south to north) with a
square size of 1 km by 1 km. There are 2,350 active nodes in which 2, 182 nodes are land boundaries, 65
nodes represents Manila Bay boundary conditions and 103 nodes represent Laguna Lake boundary conditions.
The remaining 2,393 nodes are inactive nodes, which are outside the physical boundary.
For the development of the aquifer geometry, the same grid was used and geologic codes were
assigned to the grid cells based projections made from the surface geology and available subsurface eology.
Geologically coded grid level maps, having the same grid limits, were prepared for zero (0) levation (mean
low, low sea level) and every 30 meters above masl up to the highest known elevation and projected every
30 below sea level to elevation of -210 m.
The model finite-difference grid consists of 18 layers with thickness of 30 meters with 6 layers
below mean low, low water (MLLW) sea level and 11 layers above MLLW. It may be noted that for the code
maps of layers above MLLW, the blank areas are inactive nodes representing the above ground surface grids.
In the coded maps for each layer, the finite-difference grid system has been classified into 10 types of
soil/geologic characteristics. Each type of soil has a unique hydraulic conductivity, porosity and storage
coefficient. The specific groundwater properties used in this study are discussed next.
Considering the given geology of the study area, the main sedimentary components are clay, silt,
sand gravel, basaltic igneous rock (in varying degrees of fracturing) and minor limestone deposits. Based on
the examined well logs of the Philippine Groundwater Database of NWRB, the components of sedimentary
formations in the main aquifer present themselves as well as sorted and mixed textures. To facilitate simplicity
in the description of the formations, terminologies pertaining to origin such as “tuff”, “tuffaceous”, “adobe”
were treated as an equivalent of silt, based on the consultant’s experience in checking drillers log on-site and
local description of adobe. Only textural terminologies pertaining to grain size using the Wentworth scale of
112
sedimentary grain-size were adopted.
There are several boundary (including interior boundary) conditions that must be in the model. It is
important to properly define these boundary conditions since they govern the groundwater flows. These are
the rainfall boundary condition including evapotranspitation. Another major recharge to the groundwater
system are the river leakages. There are 328 nodes with river boundary conditions. Another major discharge
boundary conditions in the model are the pumping wells. There are a total of 2,206 registered pumping wells
in the NWRB database. Two major head boundary conditions are specified in the model. These are Laguna
Lake water levels and Manila Bay water levels. Another head boundary that being considered is the
Novaliches Reservoir (lake leakage).
7.1 Model Calibration and Testing
Model calibration consists of changing values of model input parameters in an attempt to match field
conditions within some acceptable criteria. This requires that field conditions at a site are properly
characterized. Lack of proper site characterization may result in a model that is calibrated to a set of
conditions, which are not representative of actual field conditions. The calibration process typically involves
calibrating to steady-state and transient conditions. With steady-state simulations, there are no observed
changes in hydraulic head with time for the field conditions being modelled. Models may be calibrated
without simulating steady-state flow conditions, but not without some difficulty. At a minimum, model
calibration should include comparisons between model- simulated (computed) conditions and field (measured)
conditions for the following data:
• Hydraulic head data;
• Groundwater-flow direction;
• Hydraulic-head gradient; and
• Water mass balance.
A calibrated model uses selected values of hydrogeologic parameters, sources and sinks and
boundary conditions to match field conditions for selected calibration time periods (either steady-state or
transient). However, the choice of the parameter values and boundary conditions used in the calibrated model
is not unique, and other combinations of parameter values and boundary conditions may give very similar
model results. History matching uses the calibrated model to reproduce a set of historic field conditions.
In the case of the Metro Manila model, there is only one area with observation wells, in Las Piñas,
that have a hydrograph available. It would have been ideal to have had a period of monitoring, say three years
prior to the start of this project, with many observation wells distributed around the study area for water table
measurements as historical basis for the model verification.
Not withstanding the situation was the model would need some degree of calibration for its verity,
the Metro Manila model could be calibrated using the transient method. Transient simulations involve the
change in hydraulic head with time (e.g. aquifer test, an aquifer stressed by a well-filled, or a migrating
113
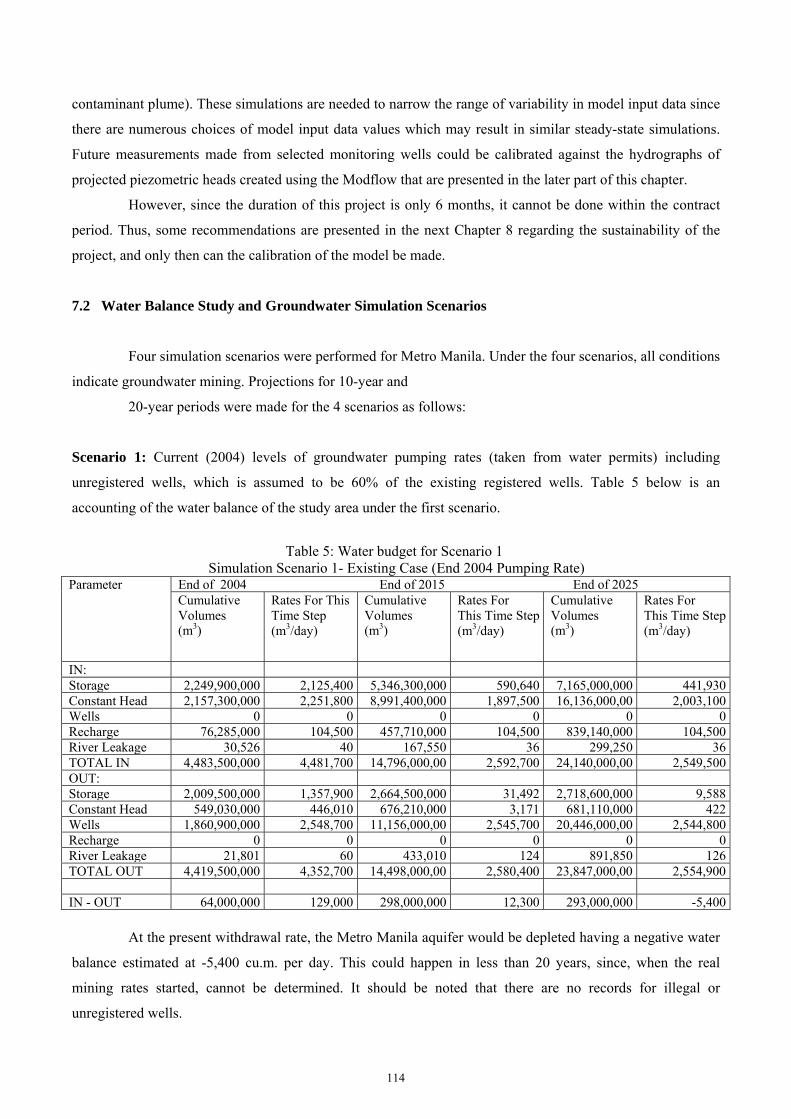
contaminant plume). These simulations are needed to narrow the range of variability in model input data since
there are numerous choices of model input data values which may result in similar steady-state simulations.
Future measurements made from selected monitoring wells could be calibrated against the hydrographs of
projected piezometric heads created using the Modflow that are presented in the later part of this chapter.
However, since the duration of this project is only 6 months, it cannot be done within the contract
period. Thus, some recommendations are presented in the next Chapter 8 regarding the sustainability of the
project, and only then can the calibration of the model be made.
7.2 Water Balance Study and Groundwater Simulation Scenarios
Four simulation scenarios were performed for Metro Manila. Under the four scenarios, all conditions
indicate groundwater mining. Projections for 10-year and
20-year periods were made for the 4 scenarios as follows:
Scenario 1: Current (2004) levels of groundwater pumping rates (taken from water permits) including
unregistered wells, which is assumed to be 60% of the existing registered wells. Table 5 below is an
accounting of the water balance of the study area under the first scenario.
Table 5: Water budget for Scenario 1
Simulation Scenario 1- Existing Case (End 2004 Pumping Rate) Parameter End of 2004 End of 2015 End of 2025
Cumulative Volumes (m3)
Rates For This Time Step (m3/day)
Cumulative Volumes (m3)
Rates For This Time Step(m3/day)
Cumulative Volumes (m3)
Rates For This Time Step(m3/day)
IN: Storage 2,249,900,000 2,125,400 5,346,300,000 590,640 7,165,000,000 441,930Constant Head 2,157,300,000 2,251,800 8,991,400,000 1,897,500 16,136,000,00 2,003,100Wells 0 0 0 0 0 0Recharge 76,285,000 104,500 457,710,000 104,500 839,140,000 104,500River Leakage 30,526 40 167,550 36 299,250 36TOTAL IN 4,483,500,000 4,481,700 14,796,000,00 2,592,700 24,140,000,00 2,549,500OUT: Storage 2,009,500,000 1,357,900 2,664,500,000 31,492 2,718,600,000 9,588Constant Head 549,030,000 446,010 676,210,000 3,171 681,110,000 422Wells 1,860,900,000 2,548,700 11,156,000,00 2,545,700 20,446,000,00 2,544,800Recharge 0 0 0 0 0 0River Leakage 21,801 60 433,010 124 891,850 126TOTAL OUT 4,419,500,000 4,352,700 14,498,000,00 2,580,400 23,847,000,00 2,554,900
IN - OUT 64,000,000 129,000 298,000,000 12,300 293,000,000 -5,400
At the present withdrawal rate, the Metro Manila aquifer would be depleted having a negative water
balance estimated at -5,400 cu.m. per day. This could happen in less than 20 years, since, when the real
mining rates started, cannot be determined. It should be noted that there are no records for illegal or
unregistered wells.
114
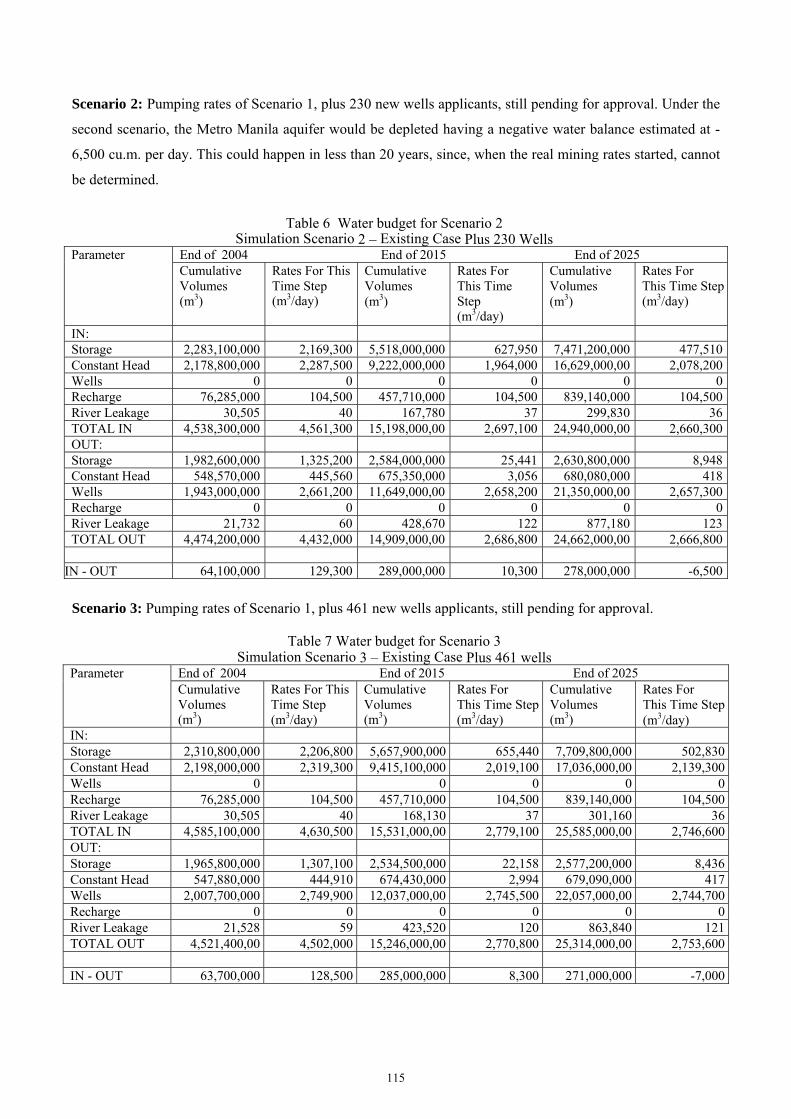
Scenario 2: Pumping rates of Scenario 1, plus 230 new wells applicants, still pending for approval. Under the
second scenario, the Metro Manila aquifer would be depleted having a negative water balance estimated at -
6,500 cu.m. per day. This could happen in less than 20 years, since, when the real mining rates started, cannot
be determined.
Table 6 Water budget for Scenario 2
Simulation Scenario 2 – Existing Case Plus 230 Wells Parameter End of 2004 End of 2015 End of 2025
Cumulative Volumes (m3)
Rates For This Time Step (m3/day)
Cumulative Volumes (m3)
Rates For This Time Step (m3/day)
Cumulative Volumes (m3)
Rates For This Time Step(m3/day)
IN: Storage 2,283,100,000 2,169,300 5,518,000,000 627,950 7,471,200,000 477,510Constant Head 2,178,800,000 2,287,500 9,222,000,000 1,964,000 16,629,000,00 2,078,200Wells 0 0 0 0 0 0Recharge 76,285,000 104,500 457,710,000 104,500 839,140,000 104,500River Leakage 30,505 40 167,780 37 299,830 36TOTAL IN 4,538,300,000 4,561,300 15,198,000,00 2,697,100 24,940,000,00 2,660,300OUT: Storage 1,982,600,000 1,325,200 2,584,000,000 25,441 2,630,800,000 8,948Constant Head 548,570,000 445,560 675,350,000 3,056 680,080,000 418Wells 1,943,000,000 2,661,200 11,649,000,00 2,658,200 21,350,000,00 2,657,300Recharge 0 0 0 0 0 0River Leakage 21,732 60 428,670 122 877,180 123TOTAL OUT 4,474,200,000 4,432,000 14,909,000,00 2,686,800 24,662,000,00 2,666,800
IN - OUT 64,100,000 129,300 289,000,000 10,300 278,000,000 -6,500
Scenario 3: Pumping rates of Scenario 1, plus 461 new wells applicants, still pending for approval.
Table 7 Water budget for Scenario 3 Simulation Scenario 3 – Existing Case Plus 461 wells
Parameter End of 2004 End of 2015 End of 2025 Cumulative Volumes (m3)
Rates For This Time Step (m3/day)
Cumulative Volumes (m3)
Rates For This Time Step(m3/day)
Cumulative Volumes (m3)
Rates For This Time Step(m3/day)
IN: Storage 2,310,800,000 2,206,800 5,657,900,000 655,440 7,709,800,000 502,830Constant Head 2,198,000,000 2,319,300 9,415,100,000 2,019,100 17,036,000,00 2,139,300Wells 0 0 0 0 0Recharge 76,285,000 104,500 457,710,000 104,500 839,140,000 104,500River Leakage 30,505 40 168,130 37 301,160 36TOTAL IN 4,585,100,000 4,630,500 15,531,000,00 2,779,100 25,585,000,00 2,746,600OUT: Storage 1,965,800,000 1,307,100 2,534,500,000 22,158 2,577,200,000 8,436Constant Head 547,880,000 444,910 674,430,000 2,994 679,090,000 417Wells 2,007,700,000 2,749,900 12,037,000,00 2,745,500 22,057,000,00 2,744,700Recharge 0 0 0 0 0 0River Leakage 21,528 59 423,520 120 863,840 121TOTAL OUT 4,521,400,00 4,502,000 15,246,000,00 2,770,800 25,314,000,00 2,753,600 IN - OUT 63,700,000 128,500 285,000,000 8,300 271,000,000 -7,000
115
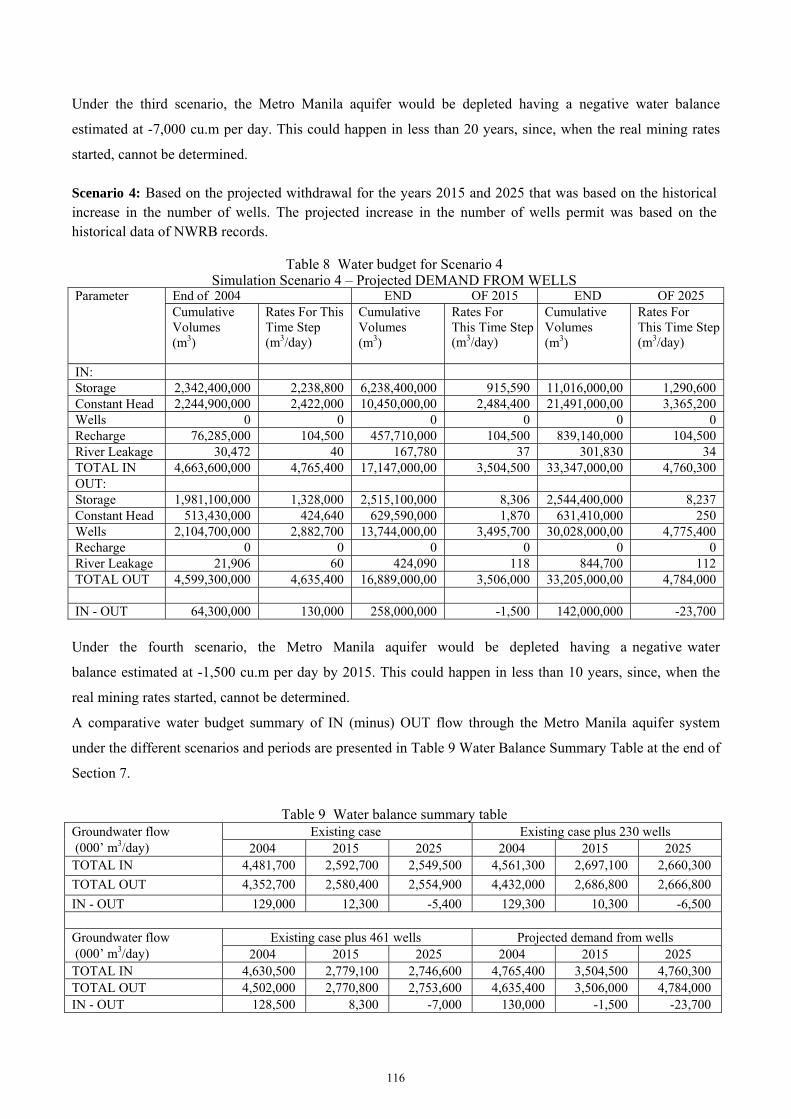
Under the third scenario, the Metro Manila aquifer would be depleted having a negative water balance
estimated at -7,000 cu.m per day. This could happen in less than 20 years, since, when the real mining rates
started, cannot be determined.
Scenario 4: Based on the projected withdrawal for the years 2015 and 2025 that was based on the historical increase in the number of wells. The projected increase in the number of wells permit was based on the historical data of NWRB records.
Table 8 Water budget for Scenario 4 Simulation Scenario 4 – Projected DEMAND FROM WELLS
Parameter End of 2004 END OF 2015 END OF 2025 Cumulative Volumes (m3)
Rates For This Time Step (m3/day)
Cumulative Volumes (m3)
Rates For This Time Step(m3/day)
Cumulative Volumes (m3)
Rates For This Time Step(m3/day)
IN: Storage 2,342,400,000 2,238,800 6,238,400,000 915,590 11,016,000,00 1,290,600Constant Head 2,244,900,000 2,422,000 10,450,000,00 2,484,400 21,491,000,00 3,365,200Wells 0 0 0 0 0 0Recharge 76,285,000 104,500 457,710,000 104,500 839,140,000 104,500River Leakage 30,472 40 167,780 37 301,830 34TOTAL IN 4,663,600,000 4,765,400 17,147,000,00 3,504,500 33,347,000,00 4,760,300OUT: Storage 1,981,100,000 1,328,000 2,515,100,000 8,306 2,544,400,000 8,237Constant Head 513,430,000 424,640 629,590,000 1,870 631,410,000 250Wells 2,104,700,000 2,882,700 13,744,000,00 3,495,700 30,028,000,00 4,775,400Recharge 0 0 0 0 0 0River Leakage 21,906 60 424,090 118 844,700 112TOTAL OUT 4,599,300,000 4,635,400 16,889,000,00 3,506,000 33,205,000,00 4,784,000 IN - OUT 64,300,000 130,000 258,000,000 -1,500 142,000,000 -23,700 Under the fourth scenario, the Metro Manila aquifer would be depleted having a negative water
balance estimated at -1,500 cu.m per day by 2015. This could happen in less than 10 years, since, when the
real mining rates started, cannot be determined.
A comparative water budget summary of IN (minus) OUT flow through the Metro Manila aquifer system
under the different scenarios and periods are presented in Table 9 Water Balance Summary Table at the end of
Section 7.
Table 9 Water balance summary table
Groundwater flow (000’ m3/day)
Existing case Existing case plus 230 wells 2004 2015 2025 2004 2015 2025
TOTAL IN 4,481,700 2,592,700 2,549,500 4,561,300 2,697,100 2,660,300
TOTAL OUT 4,352,700 2,580,400 2,554,900 4,432,000 2,686,800 2,666,800
IN - OUT 129,000 12,300 -5,400 129,300 10,300 -6,500
Groundwater flow (000’ m3/day)
Existing case plus 461 wells Projected demand from wells 2004 2015 2025 2004 2015 2025
TOTAL IN 4,630,500 2,779,100 2,746,600 4,765,400 3,504,500 4,760,300TOTAL OUT 4,502,000 2,770,800 2,753,600 4,635,400 3,506,000 4,784,000IN - OUT 128,500 8,300 -7,000 130,000 -1,500 -23,700
116
7. 3 Results of Simulations Runs and Simulated Hydrographs
Results of simulation runs using Modflow were produced to create data and binary files that was
used to create map image of the predicted water level surface and plotted using Surfer to show depth and
lateral changes of the groundwater piezometric head under all scenarios described above.
In general the simulated hydrographs show a slight increase in water levels that should be considered
as a warm up period for the program. However, the graph towards the years 2015 and 2025 shows a general
decline in predicted water levels.
7.4 Final Remarks
The generated groundwater model is an initial step to having a quantified evaluation of the available
groundwater in the Metro Manila Aquifer. However, like any model, it should be updated to reflect
changes that are in process in a dynamic aquifer system.
The 1955 groundwater piezometric map of Metro Manila depicted water levels at 0.53 meters above
sea level. Ideally, in any well field, extraction rates should not exceed the recharge capacity of the aquifer.
A common adverse condition when the withdrawal rates exceed the groundwater potential is the lowering
of the piezometric head to levels below zero or sea level. The actual measured and simulated cones of
depressions in the Metro Manila Aquifer suggest a worsening situation that only confirms conclusion of
earlier studies (such as the 1991 JICA Study, 1994 UNDP-MWSS Study and the 1993 IDRC/NHRC).
Already, measured and simulated piezometric levels are critical in the range of -40 to -60 below sea
level. The Model still has to establish what would be the maximum allowable level for the piezometric heads
in the study area to which the decision makers in NWRB can use to decide as what permissible is. Such a
question arises, since the alternative water sources (to replace well sources) to supply the needs of the
metropolis still has to be developed and constructed. Should permitting for wells in the metropolis continue,
how deep should we allow the piezometric head to lower?
Aside from the physical manifestations of the abused aquifer, we could expect changes in water
quality to change or even deteriorate. There is no question as to whether it should become policy to allow
water to deteriorate or up what permissible levels contamination could be allowed. This is another parameter
of groundwater that the present model cannot address.
Hence, further studies and updating of the model should continue to establish what the physical and
chemical manifestations are in the groundwater resource of the study area and how can the model be used as
a tool to assist policymaking.
117
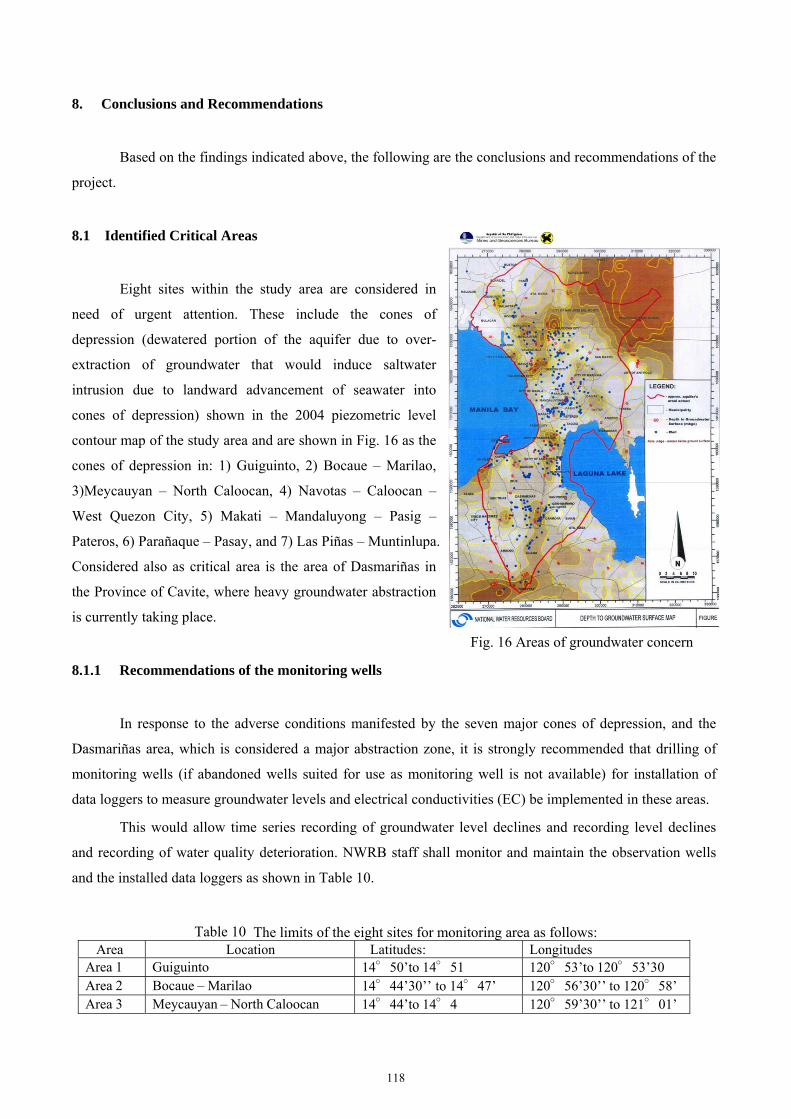
8. Conclusions and Recommendations
Based on the findings indicated above, the following are the conclusions and recommendations of the
project.
8.1 Identified Critical Areas
Eight sites within the study area are considered in
need of urgent attention. These include the cones of
depression (dewatered portion of the aquifer due to over-
extraction of groundwater that would induce saltwater
intrusion due to landward advancement of seawater into
cones of depression) shown in the 2004 piezometric level
contour map of the study area and are shown in Fig. 16 as the
cones of depression in: 1) Guiguinto, 2) Bocaue – Marilao,
3)Meycauyan – North Caloocan, 4) Navotas – Caloocan –
West Quezon City, 5) Makati – Mandaluyong – Pasig –
Pateros, 6) Parañaque – Pasay, and 7) Las Piñas – Muntinlupa.
Considered also as critical area is the area of Dasmariñas in
the Province of Cavite, where heavy groundwater abstraction
is currently taking place.
8.1.1 Recommendations of the monitoring wells
In response to the adverse conditions manifested by the seven major cones of depression, and the
Dasmariñas area, which is considered a major abstraction zone, it is strongly recommended that drilling of
monitoring wells (if abandoned wells suited for use as monitoring well is not available) for installation of
data loggers to measure groundwater levels and electrical conductivities (EC) be implemented in these areas.
This would allow time series recording of groundwater level declines and recording level declines
and recording of water quality deterioration. NWRB staff shall monitor and maintain the observation wells
and the installed data loggers as shown in Table 10.
Table 10 The limits of the eight sites for monitoring area as follows: Area Location Latitudes: Longitudes
Area 1 Guiguinto 14°50’to 14°51 120°53’to 120°53’30 Area 2 Bocaue – Marilao 14°44’30’’ to 14°47’ 120°56’30’’ to 120°58’ Area 3 Meycauyan – North Caloocan 14°44’to 14°4 120°59’30’’ to 121°01’
Fig. 16 Areas of groundwater concern
118
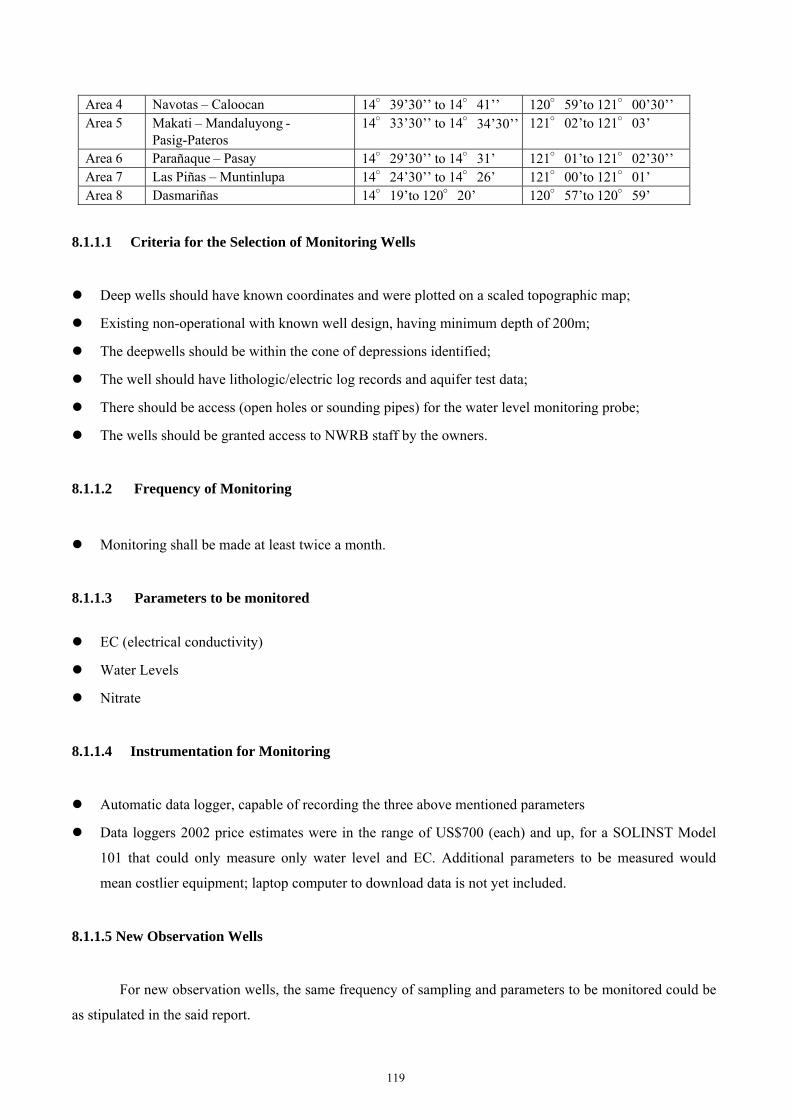
Area 4 Navotas – Caloocan 14°39’30’’ to 14°41’’ 120°59’to 121°00’30’’ Area 5 Makati – Mandaluyong -
Pasig-Pateros 14°33’30’’ to 14°34’30’’ 121°02’to 121°03’
Area 6 Parañaque – Pasay 14°29’30’’ to 14°31’ 121°01’to 121°02’30’’ Area 7 Las Piñas – Muntinlupa 14°24’30’’ to 14°26’ 121°00’to 121°01’ Area 8 Dasmariñas 14°19’to 120°20’ 120°57’to 120°59’
8.1.1.1 Criteria for the Selection of Monitoring Wells
Deep wells should have known coordinates and were plotted on a scaled topographic map;
Existing non-operational with known well design, having minimum depth of 200m;
The deepwells should be within the cone of depressions identified;
The well should have lithologic/electric log records and aquifer test data;
There should be access (open holes or sounding pipes) for the water level monitoring probe;
The wells should be granted access to NWRB staff by the owners.
8.1.1.2 Frequency of Monitoring
Monitoring shall be made at least twice a month.
8.1.1.3 Parameters to be monitored
EC (electrical conductivity)
Water Levels
Nitrate
8.1.1.4 Instrumentation for Monitoring
Automatic data logger, capable of recording the three above mentioned parameters
Data loggers 2002 price estimates were in the range of US$700 (each) and up, for a SOLINST Model
101 that could only measure only water level and EC. Additional parameters to be measured would
mean costlier equipment; laptop computer to download data is not yet included.
8.1.1.5 New Observation Wells
For new observation wells, the same frequency of sampling and parameters to be monitored could be
as stipulated in the said report.
119
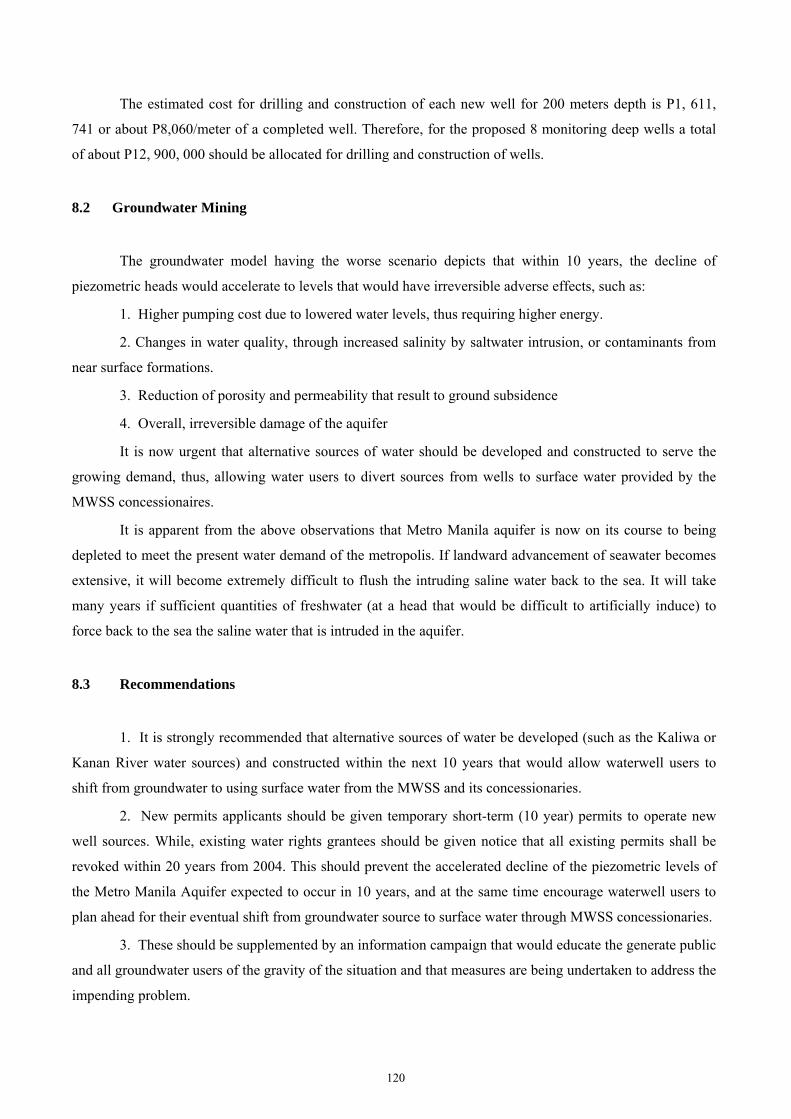
The estimated cost for drilling and construction of each new well for 200 meters depth is P1, 611,
741 or about P8,060/meter of a completed well. Therefore, for the proposed 8 monitoring deep wells a total
of about P12, 900, 000 should be allocated for drilling and construction of wells.
8.2 Groundwater Mining
The groundwater model having the worse scenario depicts that within 10 years, the decline of
piezometric heads would accelerate to levels that would have irreversible adverse effects, such as:
1. Higher pumping cost due to lowered water levels, thus requiring higher energy.
2. Changes in water quality, through increased salinity by saltwater intrusion, or contaminants from
near surface formations.
3. Reduction of porosity and permeability that result to ground subsidence
4. Overall, irreversible damage of the aquifer
It is now urgent that alternative sources of water should be developed and constructed to serve the
growing demand, thus, allowing water users to divert sources from wells to surface water provided by the
MWSS concessionaires.
It is apparent from the above observations that Metro Manila aquifer is now on its course to being
depleted to meet the present water demand of the metropolis. If landward advancement of seawater becomes
extensive, it will become extremely difficult to flush the intruding saline water back to the sea. It will take
many years if sufficient quantities of freshwater (at a head that would be difficult to artificially induce) to
force back to the sea the saline water that is intruded in the aquifer.
8.3 Recommendations
1. It is strongly recommended that alternative sources of water be developed (such as the Kaliwa or
Kanan River water sources) and constructed within the next 10 years that would allow waterwell users to
shift from groundwater to using surface water from the MWSS and its concessionaries.
2. New permits applicants should be given temporary short-term (10 year) permits to operate new
well sources. While, existing water rights grantees should be given notice that all existing permits shall be
revoked within 20 years from 2004. This should prevent the accelerated decline of the piezometric levels of
the Metro Manila Aquifer expected to occur in 10 years, and at the same time encourage waterwell users to
plan ahead for their eventual shift from groundwater source to surface water through MWSS concessionaries.
3. These should be supplemented by an information campaign that would educate the generate public
and all groundwater users of the gravity of the situation and that measures are being undertaken to address the
impending problem.
120
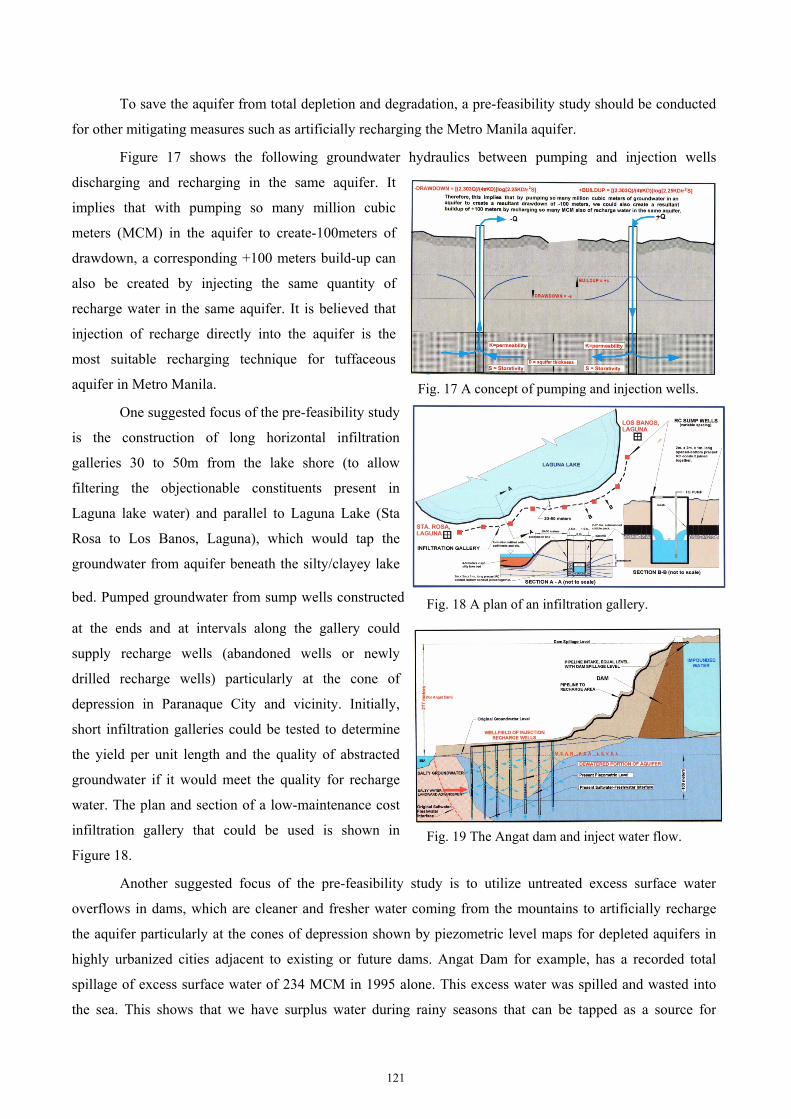
To save the aquifer from total depletion and degradation, a pre-feasibility study should be conducted
for other mitigating measures such as artificially recharging the Metro Manila aquifer.
Figure 17 shows the following groundwater hydraulics between pumping and injection wells
discharging and recharging in the same aquifer. It
implies that with pumping so many million cubic
meters (MCM) in the aquifer to create-100meters of
drawdown, a corresponding +100 meters build-up can
also be created by injecting the same quantity of
recharge water in the same aquifer. It is believed that
injection of recharge directly into the aquifer is the
most suitable recharging technique for tuffaceous
aquifer in Metro Manila.
One suggested focus of the pre-feasibility study
is the construction of long horizontal infiltration
galleries 30 to 50m from the lake shore (to allow
filtering the objectionable constituents present in
Laguna lake water) and parallel to Laguna Lake (Sta
Rosa to Los Banos, Laguna), which would tap the
groundwater from aquifer beneath the silty/clayey lake
bed. Pumped groundwater from sump wells constructed
at the ends and at intervals along the gallery could
supply recharge wells (abandoned wells or newly
drilled recharge wells) particularly at the cone of
depression in Paranaque City and vicinity. Initially,
short infiltration galleries could be tested to determine
the yield per unit length and the quality of abstracted
groundwater if it would meet the quality for recharge
water. The plan and section of a low-maintenance cost
infiltration gallery that could be used is shown in
Figure 18.
Another suggested focus of the pre-feasibility study is to utilize untreated excess surface water
overflows in dams, which are cleaner and fresher water coming from the mountains to artificially recharge
the aquifer particularly at the cones of depression shown by piezometric level maps for depleted aquifers in
highly urbanized cities adjacent to existing or future dams. Angat Dam for example, has a recorded total
spillage of excess surface water of 234 MCM in 1995 alone. This excess water was spilled and wasted into
the sea. This shows that we have surplus water during rainy seasons that can be tapped as a source for
Fig. 17 A concept of pumping and injection wells.
Fig. 18 A plan of an infiltration gallery.
Fig. 19 The Angat dam and inject water flow.
121
recharging the Metro Manila aquifer. The Angat dam was used as an example in Figure 19 which shows a
217m water pressure head to be used to inject water into the aquifer at the cone of depression in Valenzuela
and vicinity.
References JICA(2003): The Study on Water Resources Development for Metro Manila in the republic of the Philippines – 6 Volumes. JICA(1998): Master Plan on water Resource Management in the Republic of the Philippines – 4 Volumes. NWRC(1976): Philippine Water Resource Summary Data. NWRC and NHRC(1983): Groundwater Resource investigation for the Province of Rizal. NWRC: Metro Manila groundwater Areas Haman, Bruno, Z(1996): On Sustainability of Withdrawal from Metro Manila Groundwater System and Availability of additional groundwater Resources, Philwater International. PAGF(2002): Strengthening Management of Groundwater Resource with Local Government Units. NWRC(1983): Map of Metro Manila Groundwater A. JICA(1992): Study for the Groundwater Development in Metro Manila. Sandoval and Mamaril(1970): The hydrogeology of Central Luzon, Bureau of Mines. Ruser and Diomampo(1995): New Stratigraphic Information for Metro Manila and its Engineering Implication. VIII Annual Geologic Convention, Geological Society of the Philippines. Corby et at., ( 1951): Geology and Oil Possibilities of the Philippines, Department of Agriculture and natural Resources. Electrowatt Eng’g Services/Eng’g Geoscience Inc., MWSS (1981): Geologic Map of Metro Manila showing Fracture Patterns. IDRC/NHRC-UPRDFI/GRCMU(1993): Water Resource Management Model for Metro Manila. Electrowatt Eng’g Services, LTD, Zurich (1983): Groundwater Development Manila Water Supply Project II, Final Report. Lloyd, J.W. and Heathcote, J.A.: Natural Inorganic Hydrochemistry in relation to Groundwater. Dept of Geological Sciences, University of Bermingham, UK. Quiazon, Hernando P.( 1971): Groundwater Situation in Manila and Suburbs. Bureau of Mines, Manila. McDonal and Harbaugh A. (1988): Modular Three-Dimensional Finite Difference Groundwater Model. U.S. Geological Survey, Open File Report. NSO (1995): Census of Population, Report No. 4, Population, land Area and Density, 1995, 1980, 1990 and 1995. LWUA/JICA: Cavite Water Supply Development Study in the Republic of the Philippines.
122
Application of Isotope Hydrology for Solving Nitrate Contamination in Groundwater in Northeastern Part of Thailand
Adisai Charuratna and Dawruang Sukarawat
Department of Groundwater Resources, Thailand Abstract: As a result of provincially groundwater mapping in Northeastern region of Thailand during 1989-
1997, more than 10 percent of investigated existing wells found that nitrate contents in groundwater exceeded
unprecedentedly standard of drinking water or over 45 mg/l, particularly in 5 provinces –there are 20
provinces in this region. Principally, groundwater can be contaminated with nitrate by various sources in
terms of human activities and natural processes. Northeastern terrain of Thailand is a high plain or so called
“Khorat Plateau”. Generally, geological units are mostly consisted of sandstone, shale and rock salts. In 2009,
Department of Groundwater Resources (DGR) established a project to evaluate nitrate sources in groundwater
by using principle of isotope technique. More than 100 water samples were analyzed in term ofδ18O andδ15N
as well as 14C. Finally, nitrate contamination in this region can be definitely solved that leaching of domestic
cattle wastes and septic systems from households are mainly caused by having suitable geological conditions.
Keywords: Isotope technique, δ18O and δ15N, contamination
1. Introduction
Principally, nitrate contamination in groundwater is mostly associated with agricultural and human
activities, particularly in shallow aquifers. High level of nitrate in blood from drinking groundwater can cause
methemoglobinemia in infants or blue baby and can function as initiators of human carcinogenesis or cancer.
World Health Organization (WHO) has limited an amount of nitrate for drinking water as 10 ppm nitrate-N or
50 ppm of NO3- Significantly, sources of nitrate are actually distributed to groundwater by percolating from
septic systems, manure piles, waste water, fertilizers, natural precipitation, organic soils, etc. However, these
sources can be reasonably identified by analyzing isotopic composition of NO3- δ18ONO3 and δ15NNO3) and can
be discriminated schematic ranges of their values (Kendall, 1998).
The study area coverage a total of 59,768 km2 (Fig. 1) is partly located in Northeast Thailand or
Khorat Plateau. As a result of groundwater investigation during 1987-1997 for provincially hydrogeological
mapping, about 10 percent of existing wells having nitrate contents in groundwater were obviously high
exceeding 50 ppm (Table 1) whereas the other regions of Thailand were normally negligible amounts. Many
people working in groundwater aspect were anxiously to know scientifically the cause of the major sources. In
2009, Bureau of Groundwater Conservation and Restoration under DGR established a project to study by
using isotope techniques that water samples were analyzed by Thailand Institute of Nuclear Technology
(TINT).In order to explain their sources, more than 100 water samples in the subdistricts from previous study
that implied high nitrate potential were collected freezingly for isotropic analysis as δ18O and δ15N and some
123
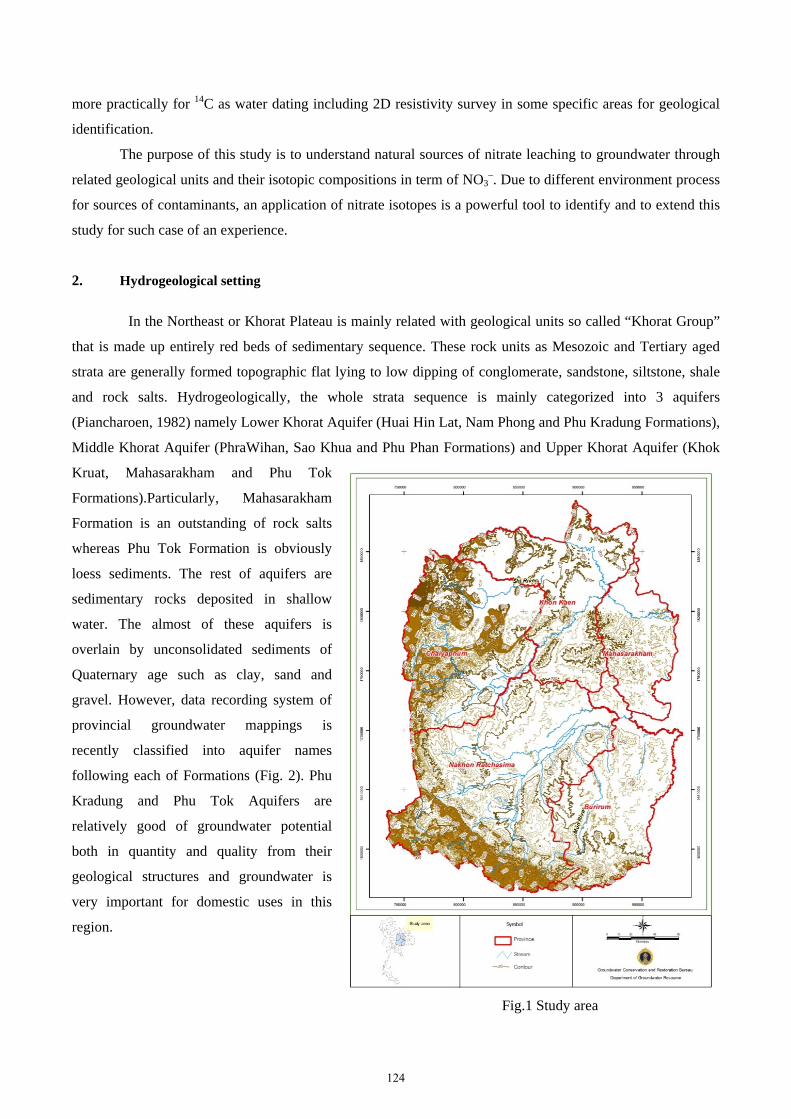
more practically for 14C as water dating including 2D resistivity survey in some specific areas for geological
identification.
The purpose of this study is to understand natural sources of nitrate leaching to groundwater through
related geological units and their isotopic compositions in term of NO3–. Due to different environment process
for sources of contaminants, an application of nitrate isotopes is a powerful tool to identify and to extend this
study for such case of an experience.
2. Hydrogeological setting
In the Northeast or Khorat Plateau is mainly related with geological units so called “Khorat Group”
that is made up entirely red beds of sedimentary sequence. These rock units as Mesozoic and Tertiary aged
strata are generally formed topographic flat lying to low dipping of conglomerate, sandstone, siltstone, shale
and rock salts. Hydrogeologically, the whole strata sequence is mainly categorized into 3 aquifers
(Piancharoen, 1982) namely Lower Khorat Aquifer (Huai Hin Lat, Nam Phong and Phu Kradung Formations),
Middle Khorat Aquifer (PhraWihan, Sao Khua and Phu Phan Formations) and Upper Khorat Aquifer (Khok
Kruat, Mahasarakham and Phu Tok
Formations).Particularly, Mahasarakham
Formation is an outstanding of rock salts
whereas Phu Tok Formation is obviously
loess sediments. The rest of aquifers are
sedimentary rocks deposited in shallow
water. The almost of these aquifers is
overlain by unconsolidated sediments of
Quaternary age such as clay, sand and
gravel. However, data recording system of
provincial groundwater mappings is
recently classified into aquifer names
following each of Formations (Fig. 2). Phu
Kradung and Phu Tok Aquifers are
relatively good of groundwater potential
both in quantity and quality from their
geological structures and groundwater is
very important for domestic uses in this
region.
Fig.1 Study area
124
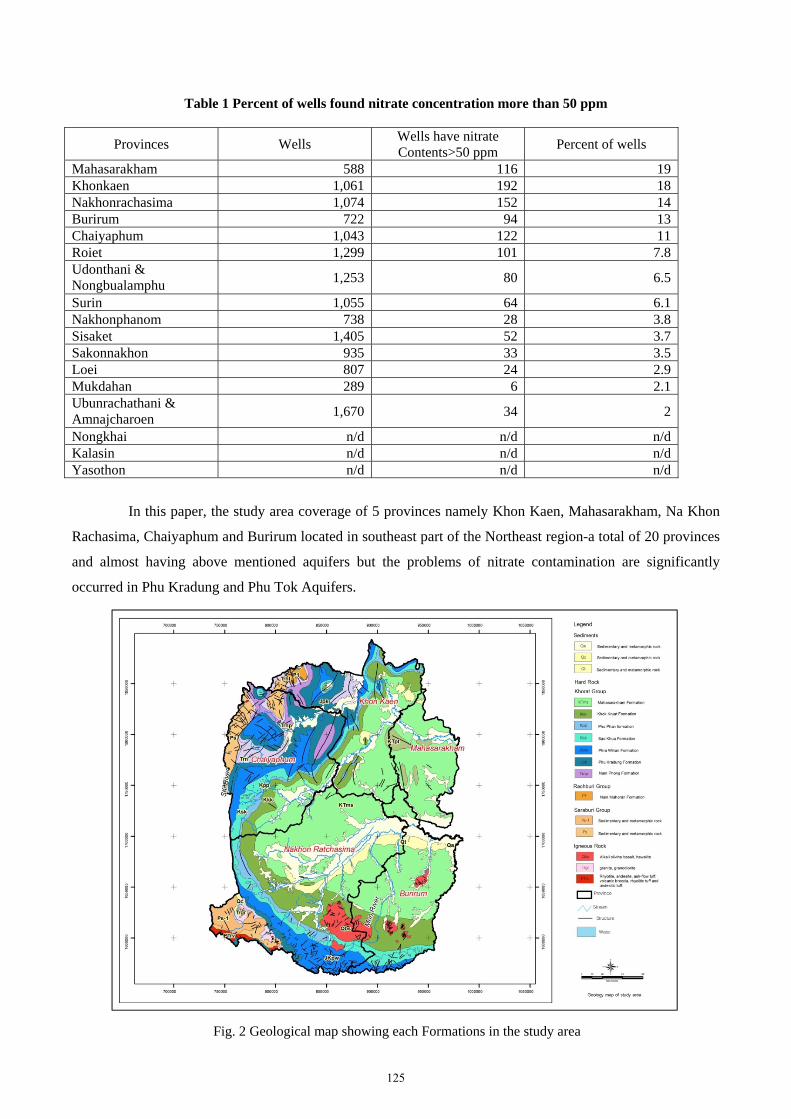
Table 1 Percent of wells found nitrate concentration more than 50 ppm
Provinces Wells Wells have nitrate Contents>50 ppm
Percent of wells
Mahasarakham 588 116 19Khonkaen 1,061 192 18Nakhonrachasima 1,074 152 14Burirum 722 94 13Chaiyaphum 1,043 122 11Roiet 1,299 101 7.8Udonthani & Nongbualamphu 1,253 80 6.5
Surin 1,055 64 6.1Nakhonphanom 738 28 3.8Sisaket 1,405 52 3.7Sakonnakhon 935 33 3.5Loei 807 24 2.9Mukdahan 289 6 2.1Ubunrachathani & Amnajcharoen
1,670 34 2
Nongkhai n/d n/d n/dKalasin n/d n/d n/dYasothon n/d n/d n/d
In this paper, the study area coverage of 5 provinces namely Khon Kaen, Mahasarakham, Na Khon
Rachasima, Chaiyaphum and Burirum located in southeast part of the Northeast region-a total of 20 provinces
and almost having above mentioned aquifers but the problems of nitrate contamination are significantly
occurred in Phu Kradung and Phu Tok Aquifers.
Fig. 2 Geological map showing each Formations in the study area
125
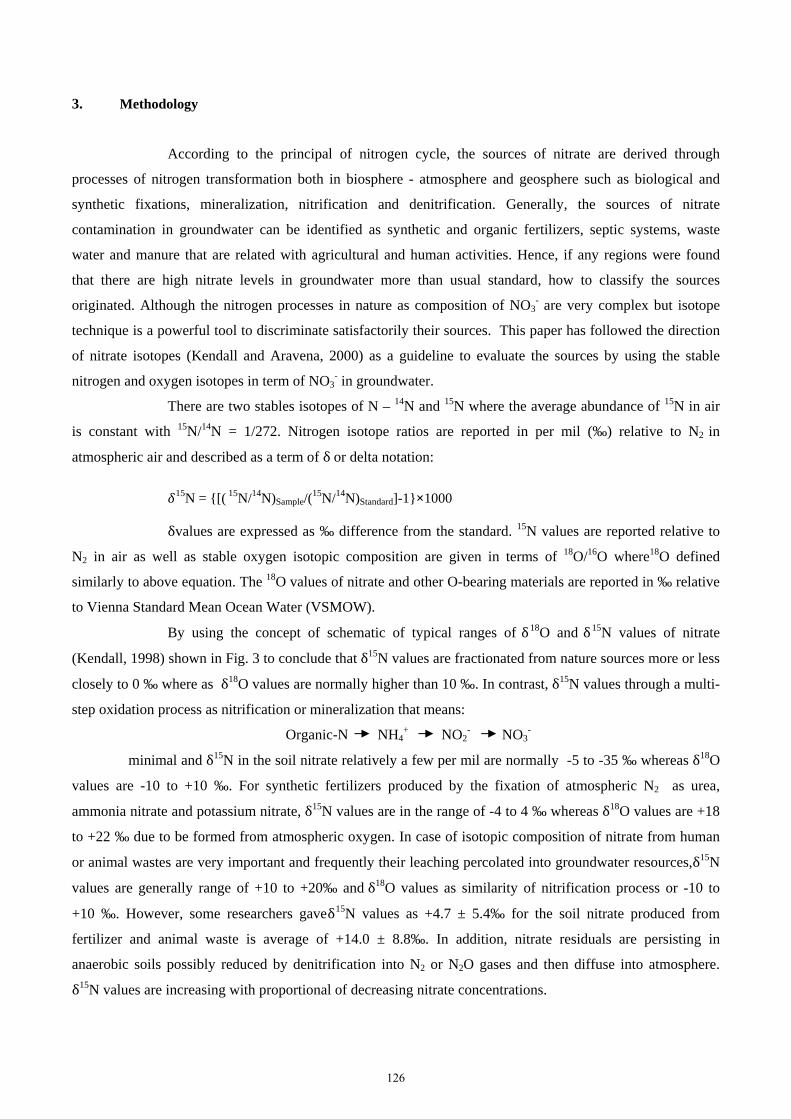
3. Methodology
According to the principal of nitrogen cycle, the sources of nitrate are derived through
processes of nitrogen transformation both in biosphere - atmosphere and geosphere such as biological and
synthetic fixations, mineralization, nitrification and denitrification. Generally, the sources of nitrate
contamination in groundwater can be identified as synthetic and organic fertilizers, septic systems, waste
water and manure that are related with agricultural and human activities. Hence, if any regions were found
that there are high nitrate levels in groundwater more than usual standard, how to classify the sources
originated. Although the nitrogen processes in nature as composition of NO3- are very complex but isotope
technique is a powerful tool to discriminate satisfactorily their sources. This paper has followed the direction
of nitrate isotopes (Kendall and Aravena, 2000) as a guideline to evaluate the sources by using the stable
nitrogen and oxygen isotopes in term of NO3- in groundwater.
There are two stables isotopes of N – 14N and 15N where the average abundance of 15N in air
is constant with 15N/14N = 1/272. Nitrogen isotope ratios are reported in per mil (‰) relative to N2 in
atmospheric air and described as a term of δor delta notation:
15N = {[( 15N/14N)Sample/(
15N/14N)Standard]-1}×1000
δvalues are expressed as ‰ difference from the standard. 15N values are reported relative to
N2 in air as well as stable oxygen isotopic composition are given in terms of 18O/16O where18O defined
similarly to above equation. The 18O values of nitrate and other O-bearing materials are reported in ‰ relative
to Vienna Standard Mean Ocean Water (VSMOW).
By using the concept of schematic of typical ranges of δ18O and δ15N values of nitrate
(Kendall, 1998) shown in Fig. 3 to conclude that δ15N values are fractionated from nature sources more or less
closely to 0 ‰ where as δ18O values are normally higher than 10 ‰. In contrast, δ15N values through a multi-
step oxidation process as nitrification or mineralization that means:
Organic-N NH4+ NO2
- NO3-
minimal and δ15N in the soil nitrate relatively a few per mil are normally -5 to -35 ‰ whereas δ18O
values are -10 to +10 ‰. For synthetic fertilizers produced by the fixation of atmospheric N2 as urea,
ammonia nitrate and potassium nitrate, δ15N values are in the range of -4 to 4 ‰ whereas δ18O values are +18
to +22 ‰ due to be formed from atmospheric oxygen. In case of isotopic composition of nitrate from human
or animal wastes are very important and frequently their leaching percolated into groundwater resources,δ15N
values are generally range of +10 to +20‰ and δ18O values as similarity of nitrification process or -10 to
+10 ‰. However, some researchers gaveδ15N values as +4.7 ± 5.4‰ for the soil nitrate produced from
fertilizer and animal waste is average of +14.0 ± 8.8‰. In addition, nitrate residuals are persisting in
anaerobic soils possibly reduced by denitrification into N2 or N2O gases and then diffuse into atmosphere.
δ15N values are increasing with proportional of decreasing nitrate concentrations.
126
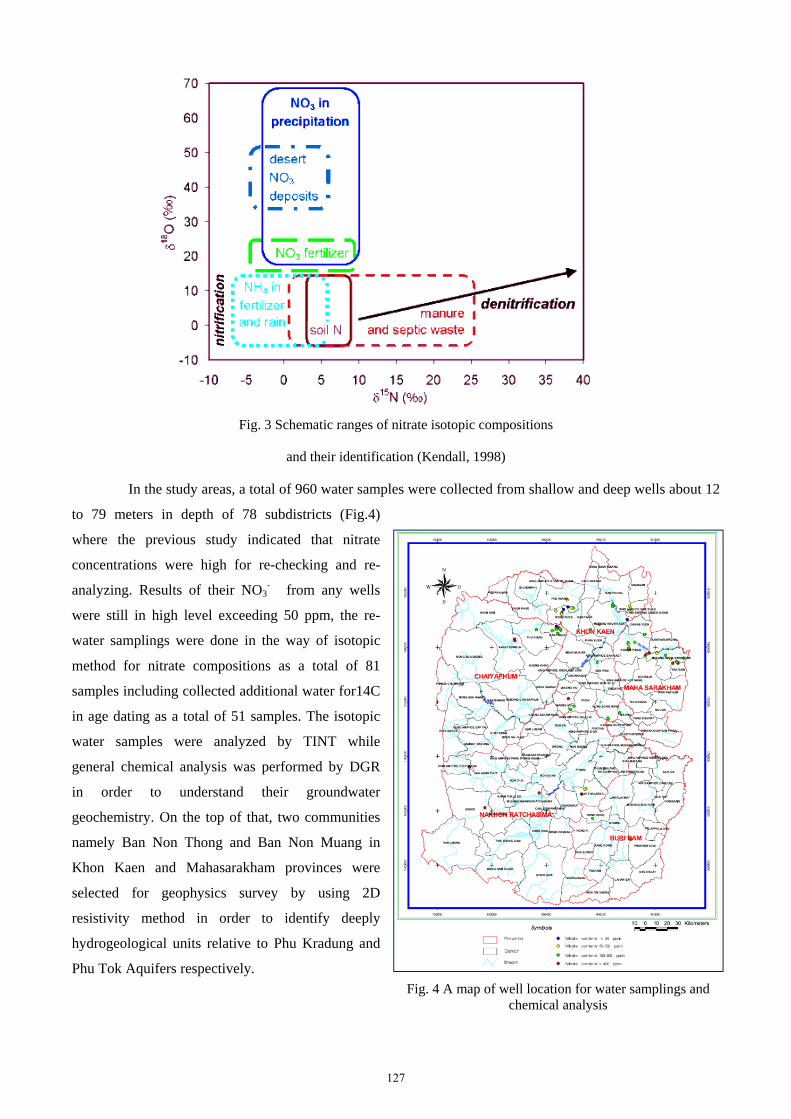
Fig. 3 Schematic ranges of nitrate isotopic compositions
and their identification (Kendall, 1998)
In the study areas, a total of 960 water samples were collected from shallow and deep wells about 12
to 79 meters in depth of 78 subdistricts (Fig.4)
where the previous study indicated that nitrate
concentrations were high for re-checking and re-
analyzing. Results of their NO3- from any wells
were still in high level exceeding 50 ppm, the re-
water samplings were done in the way of isotopic
method for nitrate compositions as a total of 81
samples including collected additional water for14C
in age dating as a total of 51 samples. The isotopic
water samples were analyzed by TINT while
general chemical analysis was performed by DGR
in order to understand their groundwater
geochemistry. On the top of that, two communities
namely Ban Non Thong and Ban Non Muang in
Khon Kaen and Mahasarakham provinces were
selected for geophysics survey by using 2D
resistivity method in order to identify deeply
hydrogeological units relative to Phu Kradung and
Phu Tok Aquifers respectively.
Fig. 4 A map of well location for water samplings and chemical analysis
127
4. Results and conclusion
The results of chemical and isotropic analysis have been shown in Table 2 and the schematic of
typical ranges of δ18O and δ15N values of nitrate is presented in Fig. 5. δ15N values of water samples in the
study area ranged from +2.4‰ to +15.4 ‰ and δ18O values ranged from +5.3‰ to +13.63‰. According to
the diagram, all of values are fallen in mainly in the large zone of manure and septic waste, some values are
inter-overlapping in the ranges of nitrogen soil and NH4 in fertilizer and rain possibly including in term of
denitrification that is identified by a line with slope of 1:2 (δ18O and δ15N). In order to solve the sources of
nitrate, each location has been evaluated case by case in the field. Unfortunately, some areas are ambiguously,
particularly in causes of NH4 fertilizer and natural organic soil. Prior to establish the project, some people
understood that probably some minerals would be associated with rock salts like NaNO3 or KNO3 to be the
sources of nitrate because of salty water common found in this region. Theoretically, both minerals are from
the nature thatδ18O values must be much higher than in the table and δ15N values have to be closely ± 0 as
well. Obviously, the distinguished sources derived from local septic systems and domestic animals feeding.
Traditionally, the lifestyles of people living in the Northeast are closely gathered with many families as a
community and generally have their livelihood by feeding cattle and keeping them nearby or under their
houses (Fig. 6). In addition, the unsuitable septic systems in densely population are the other significant
sources supporting directly nitrate contamination. The effluents of animal waste or excretory waste are
assumed to be NO3- concentration as 40 mg/l (Canter and Knox, 1986) that reasonably for general high nitrate
concentration and average δ15N is +8.9 ± 6.5 in this region similar to many concerned documentaries. δ18O
values are mostly less than +11.5 representing through process of nitrification.
Nevertheless, if the leaching and percolating processes are very important to conduct altered
organic-N to water table or aquifers, the characteristics of soil profiles and water-bearing rocks must be in
good conditions (Fig. 7). The results of 2D resistivity survey in two representing areas having high potential
of nitrate contamination showed that the fractured shale or siltstone as aquifers are overlain by thin layer of
loosely sand indicating high resistivity on the top layer – less than 6 meters (Figs. 8 and 9). The age dating of
water samples by 14C implied that they are young or recent water that NO3- concentration possibly attenuated
in shallow aquifer but isotopic compositions are stable if not directly mixing with NO3--bearing water or soils.
It is concluded that almost evidences of nitrate contamination in groundwater derived from septic
systems and domestic animal wastes in residential areas by considering plotted δ18O and δ15N values relative
to their perspective situation in the field. In particular, the cattle pens are mostly located nearby domestic
wells as well as several wells for water supplies are nearby households or toilets in temples. The littering from
domestic animals year by year could be the cause of permanently contaminated soils and already further
transformed by nitrification as nitrate in groundwater, denitrification as well. Thus, additional data of seasonal
variation of nitrate isotopic composition and concentration are required to deeply explain in mechanism of
nitrification, denitrication and even NH4 fertilizer could possibly occurred. However, some areas having
nitrate concentrations as high as hundreds of ppm are still used for water supplies by without any treatment
128
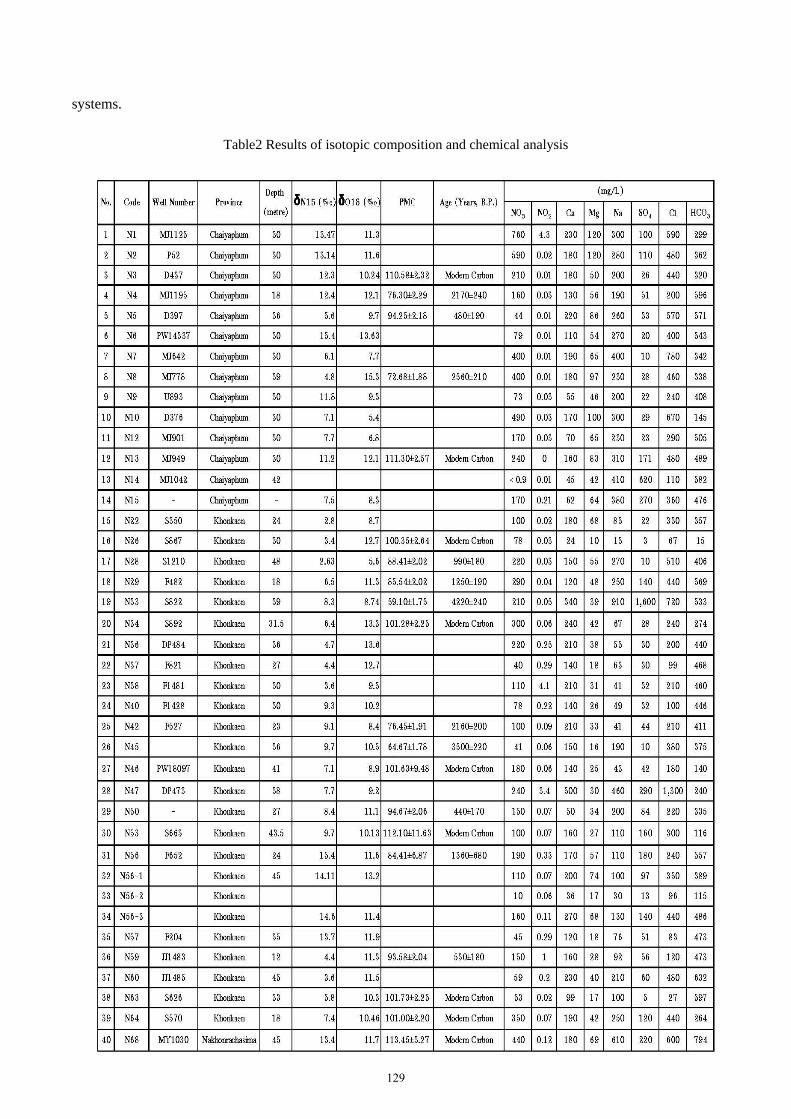
systems.
Table2 Results of isotopic composition and chemical analysis
129
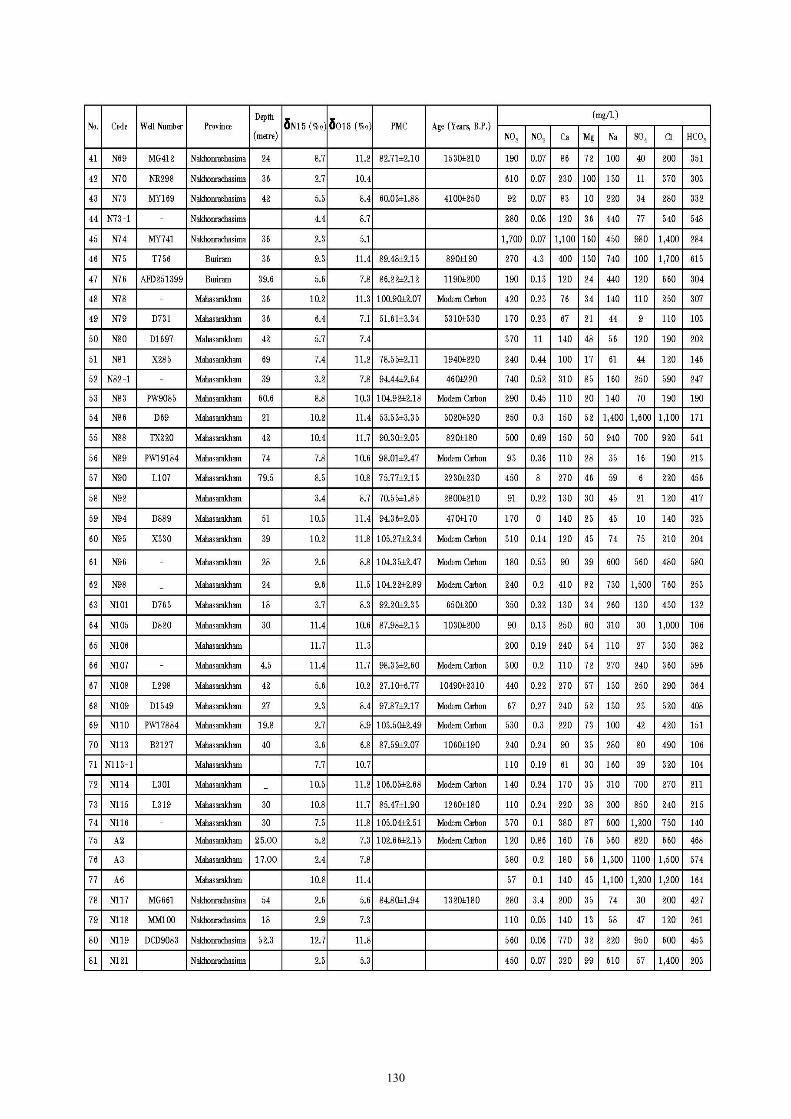
130
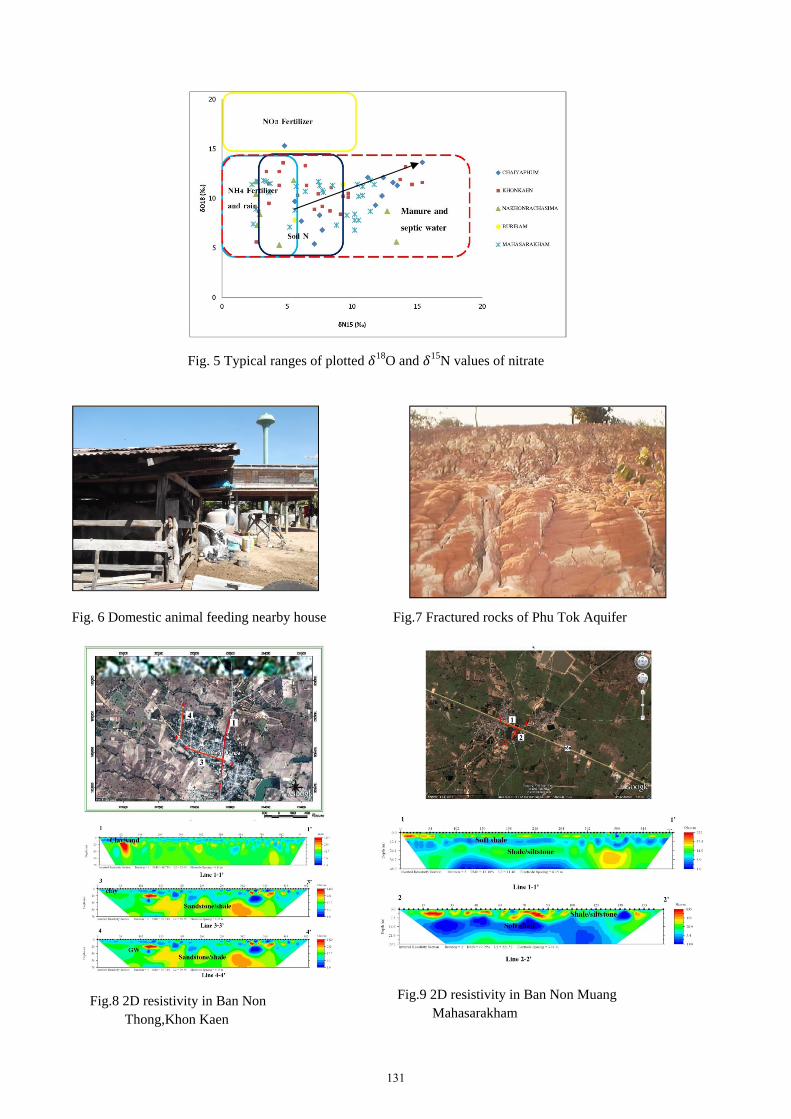
Fig. 5 Typical ranges of plotted 18O and 15N values of nitrate
Fig. 6 Domestic animal feeding nearby house Fig.7 Fractured rocks of Phu Tok Aquifer
Fig.8 2D resistivity in Ban Non Thong,Khon Kaen
Fig.9 2D resistivity in Ban Non Muang Mahasarakham
131
References Canter, L.W., Knox, R.C. (1986): Septic Tank System Effluents on Groundwater Quality. Lewis Publishers,
Chelsea, MI.
Kendall, C. (1998): Tracing sources and cycling of nitrate in catchments. In Isotope Tracers in Catchment
Hydrology, (eds. C. Kendall and J. J. McDonnell), pp. 519-576. Elsevier, Amsterdam.
Kendall, C., Aravena, R. (2000): Nitrate Isotopes in Groundwater Systems. Environmental Tracers
Subsurface Hydrology, 261-298.
Piancharoen, C. (1982): Hydrogeology and Groundwater Resources of Thailand. Department of Mineral
Resources, Ministry of Industry.
Seiler, R. L. (2005): Combined use of 15N and 18O of nitrate and 11B to evaluate nitrate contamination in
groundwater. Applied Geochemistry. 20, 1626-1636.
132
Groundwater Resources in Timor-Leste
Francisco Xavier Pereira Sico Ministry of Infrastructure
1. Background
1.1 Overview
The economy of Timor-Leste and the livelihood of its community are heavily dependent on
groundwater resources that are sensitive to climate change (Barnett, J. et al., 2007). Threats to water and food
security from variable rainfall, seawater intrusion into groundwater reserves, and groundwater contamination
from solid waste and sewage disposal present serious challenges to vulnerable communities throughout the
nation. Climate change, through changes in rainfall and temperature (potential evaporation), could cause
longer periods of drought or more intense rainfall, which may result in insufficient groundwater recharge and
reduced groundwater availability. Sea-level rise has the potential to drive seawater intrusion into freshwater
aquifers, causing changes in groundwater flow and salinisation of water used for drinking and agriculture
(Barnett, J. et al., 2007). These changes in groundwater flow can inturn exacerbate groundwater
contamination from solid waste and sewage. Climate change is expected to affect the availability and quality
of groundwater in Timor-Leste through changes in temperature, rainfall and sea level rise.
The current sustainability of groundwater use in Timor-Leste is largely unknown, as are the likely
effects of climate change on both the quantity and quality of available groundwater resources. Seawater
intrusion (resulting in degradation of groundwater quality) and reduced groundwater yields are both plausible
consequences of climate change; however, it is not possible to quantify the effects of climate change on
groundwater resources without first establishing a baseline understanding of how groundwater systems
operate under current climate conditions. A more detailed understanding is needed of how pressures from
climate change and groundwater pumping will influence the availability and quality of groundwater for
management into the future.
An assessment of the groundwater resources likely to be affected by climate change is required
immediately to enable the identification and prioritisation of adaptation options. To be most effective this
should initially involve a characterisation of groundwater systems and their vulnerability to climate change
impacts. This is followed by a participatory, capacity building program of knowledge transfer based on
practical case studies to develop monitoring and assessment capabilities. Such an approach will support the
Timor-Leste National Adaptation Programme of Action (NAPA) and will advance the science and current
knowledge that underpins the management of integrated groundwater resources, a key threat identified in
IPCC Fourth Assessment Report (IPCC, 2007) and by Barnett, et al. (2007).
To address some of these issues Geoscience Australia (GA) is undertaking a project ‘Assessment of
Climate Change Impacts on Groundwater in East Timor’ in partnership with the Government of Timor–
Leste’s National Directorate for Water Resource Management (DNGRA), other government agencies and
133
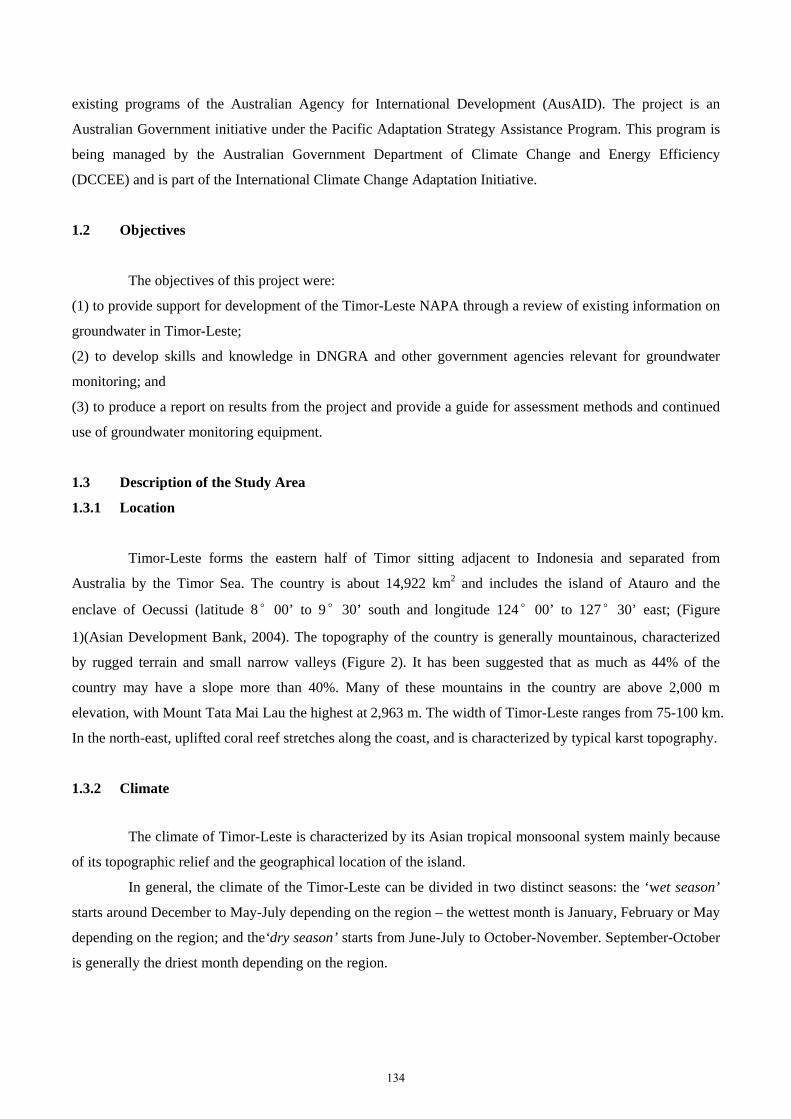
existing programs of the Australian Agency for International Development (AusAID). The project is an
Australian Government initiative under the Pacific Adaptation Strategy Assistance Program. This program is
being managed by the Australian Government Department of Climate Change and Energy Efficiency
(DCCEE) and is part of the International Climate Change Adaptation Initiative.
1.2 Objectives
The objectives of this project were:
(1) to provide support for development of the Timor-Leste NAPA through a review of existing information on
groundwater in Timor-Leste;
(2) to develop skills and knowledge in DNGRA and other government agencies relevant for groundwater
monitoring; and
(3) to produce a report on results from the project and provide a guide for assessment methods and continued
use of groundwater monitoring equipment.
1.3 Description of the Study Area
1.3.1 Location
Timor-Leste forms the eastern half of Timor sitting adjacent to Indonesia and separated from
Australia by the Timor Sea. The country is about 14,922 km2 and includes the island of Atauro and the
enclave of Oecussi (latitude 8°00’ to 9°30’ south and longitude 124°00’ to 127°30’ east; (Figure
1)(Asian Development Bank, 2004). The topography of the country is generally mountainous, characterized
by rugged terrain and small narrow valleys (Figure 2). It has been suggested that as much as 44% of the
country may have a slope more than 40%. Many of these mountains in the country are above 2,000 m
elevation, with Mount Tata Mai Lau the highest at 2,963 m. The width of Timor-Leste ranges from 75-100 km.
In the north-east, uplifted coral reef stretches along the coast, and is characterized by typical karst topography.
1.3.2 Climate
The climate of Timor-Leste is characterized by its Asian tropical monsoonal system mainly because
of its topographic relief and the geographical location of the island.
In general, the climate of the Timor-Leste can be divided in two distinct seasons: the ‘wet season’
starts around December to May-July depending on the region – the wettest month is January, February or May
depending on the region; and the‘dry season’ starts from June-July to October-November. September-October
is generally the driest month depending on the region.
134
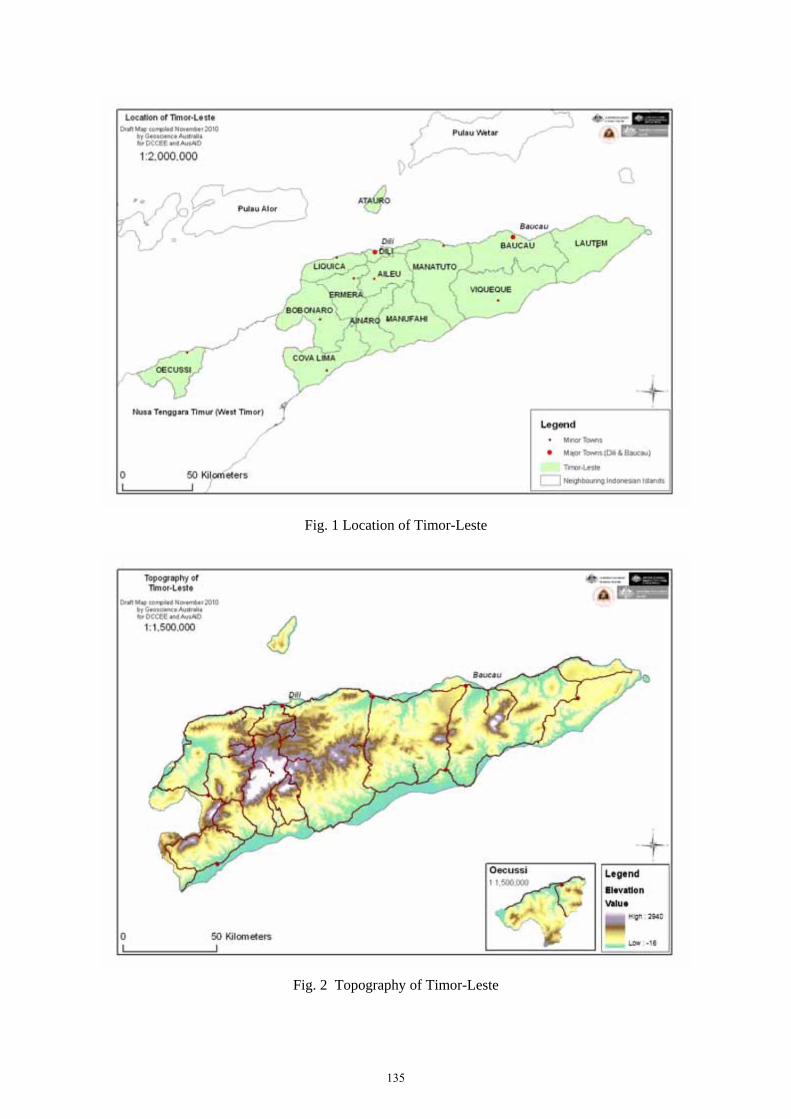
Fig. 1 Location of Timor-Leste
Fig. 2 Topography of Timor-Leste
135
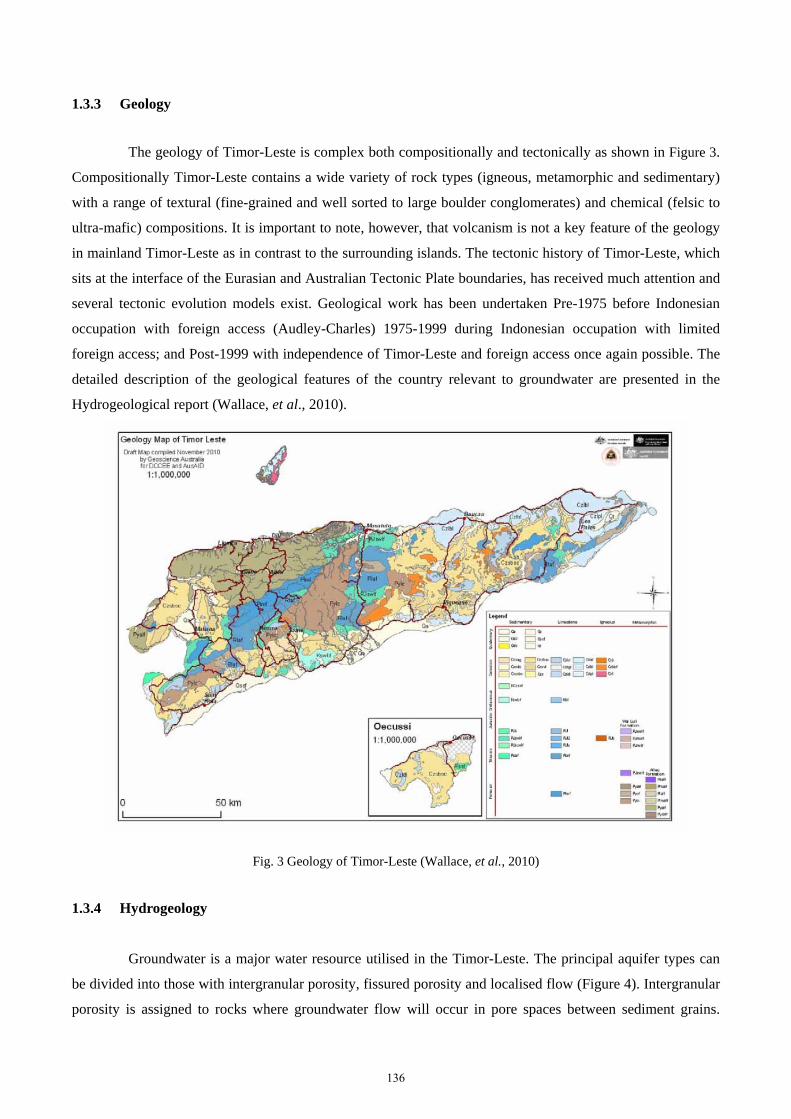
1.3.3 Geology
The geology of Timor-Leste is complex both compositionally and tectonically as shown in Figure 3.
Compositionally Timor-Leste contains a wide variety of rock types (igneous, metamorphic and sedimentary)
with a range of textural (fine-grained and well sorted to large boulder conglomerates) and chemical (felsic to
ultra-mafic) compositions. It is important to note, however, that volcanism is not a key feature of the geology
in mainland Timor-Leste as in contrast to the surrounding islands. The tectonic history of Timor-Leste, which
sits at the interface of the Eurasian and Australian Tectonic Plate boundaries, has received much attention and
several tectonic evolution models exist. Geological work has been undertaken Pre-1975 before Indonesian
occupation with foreign access (Audley-Charles) 1975-1999 during Indonesian occupation with limited
foreign access; and Post-1999 with independence of Timor-Leste and foreign access once again possible. The
detailed description of the geological features of the country relevant to groundwater are presented in the
Hydrogeological report (Wallace, et al., 2010).
Fig. 3 Geology of Timor-Leste (Wallace, et al., 2010)
1.3.4 Hydrogeology
Groundwater is a major water resource utilised in the Timor-Leste. The principal aquifer types can
be divided into those with intergranular porosity, fissured porosity and localised flow (Figure 4). Intergranular
porosity is assigned to rocks where groundwater flow will occur in pore spaces between sediment grains.
136
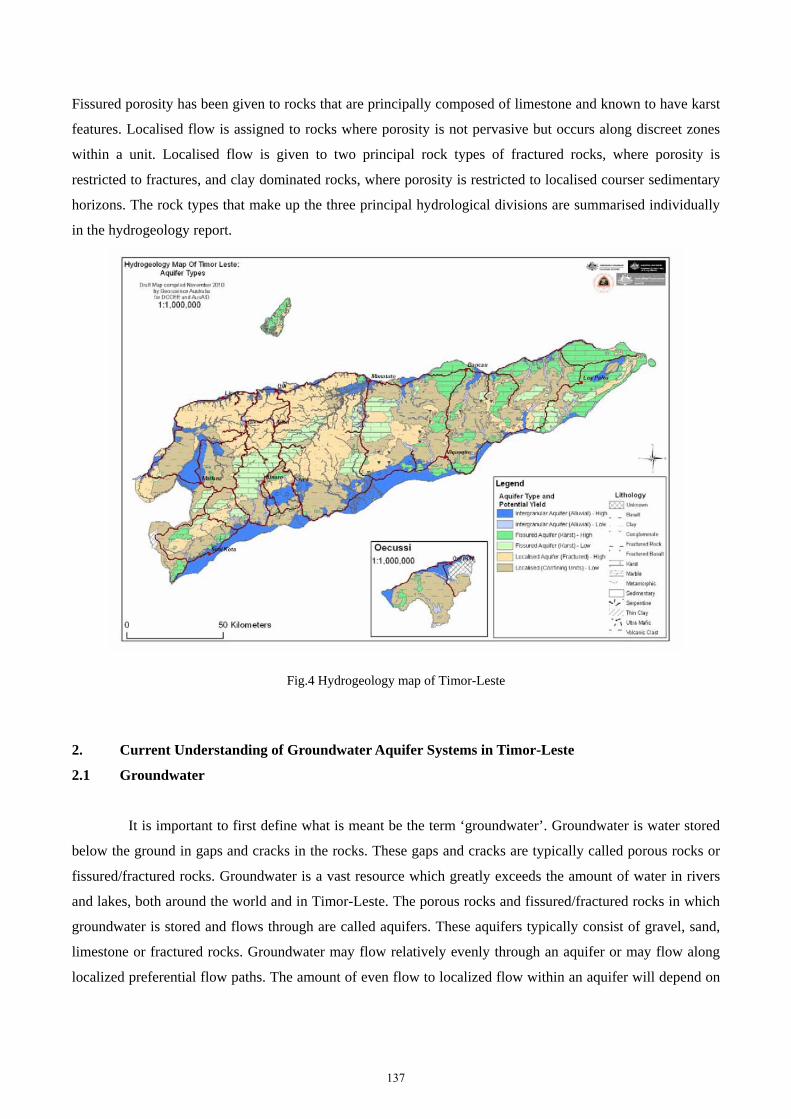
Fissured porosity has been given to rocks that are principally composed of limestone and known to have karst
features. Localised flow is assigned to rocks where porosity is not pervasive but occurs along discreet zones
within a unit. Localised flow is given to two principal rock types of fractured rocks, where porosity is
restricted to fractures, and clay dominated rocks, where porosity is restricted to localised courser sedimentary
horizons. The rock types that make up the three principal hydrological divisions are summarised individually
in the hydrogeology report.
Fig.4 Hydrogeology map of Timor-Leste
2. Current Understanding of Groundwater Aquifer Systems in Timor-Leste
2.1 Groundwater
It is important to first define what is meant be the term ‘groundwater’. Groundwater is water stored
below the ground in gaps and cracks in the rocks. These gaps and cracks are typically called porous rocks or
fissured/fractured rocks. Groundwater is a vast resource which greatly exceeds the amount of water in rivers
and lakes, both around the world and in Timor-Leste. The porous rocks and fissured/fractured rocks in which
groundwater is stored and flows through are called aquifers. These aquifers typically consist of gravel, sand,
limestone or fractured rocks. Groundwater may flow relatively evenly through an aquifer or may flow along
localized preferential flow paths. The amount of even flow to localized flow within an aquifer will depend on
137
the rock type. Some of the general properties of the typical aquifer types made of different types of rock are
discussed in the following sections.
2.2 Groundwater Aquifers in Timor-Leste
Very little information is currently available for the quantity and quality of groundwater in Timor-
Leste. No detailed national groundwater studies are available and few measurements have been made.
Groundwater is likely to be found beneath most land in Timor-Leste, however the groundwater resources will
be unevenly distributed and will vary in quality and quantity. A new hydrogeological map of Timor-Leste has
been developed as part of this project and the descriptions of the various aquifers and their characteristics
relevant to groundwater systems are presented in detail in the Hydrogeology report (Wallace, et al., 2010).
This hydrogeological mapping will be a valuable tool for managers, planners and groundwater users in better
understanding groundwater systems in Timor-Leste. In Timor-Leste groundwater resources can be classified
into three principle aquifer types: sedimentary porous rock aquifers with intergranular porosity associated with
river valleys and coastal low lands; fissured aquifers of karst formations within limestone rocks; and rocks
with localised flow comprised of fractured rocks and clay sediments, in alignment with international
classifications (Figure 4).
The occurrence of groundwater is controlled by the geology of a region. The geology of Timor-Leste
is diverse; therefore, there are different types of aquifers. These aquifer classifications are based on the
physical storage properties of the rocks. To understand why certain rock types have been classified as a
particular type of aquifer an understanding of the geology is necessary. Brief descriptions of the geology of
the different aquifer types are presented below.
2.2.1 Sedimentary Aquifers (Intergranular Porosity)
Sedimentary aquifers can potentially hold large amounts of groundwater. Sedimentary aquifers are
largely dominated by intergranular porosity. That is, groundwater within the sedimentary rocks flows between
the sedimentary grains. The amount of porosity, or pore space, that exists between the sedimentary grains
depends on a number of factors including how well-sorted the sediments are and the sediment grain-size.
Generally, the more well-sorted the sediments the greater the porosity is. This is because, in well-sorted
sediments, the pore spaces between grains are not taken up by smaller grains. Additionally, the smaller the
grain-size the greater the porosity is. That is, well-sorted sand will generally have greater porosity than well-
sorted gravel, but both will have high porosity if they are well-sorted. However, when the grain-size is smaller
than silt, such as clays and mud, the porosity of the sediments is effectively clogged by the fine particles and
groundwater cannot flow. This is known as low permeability (discussed further below in the Porosity and
Permeability section). A homogeneous sedimentary aquifer will have consistent porosity throughout where as
a heterogeneous sedimentary aquifer will have varied porosity at different locations. Likewise, sedimentary
138
aquifers at different locations may have similar porosity or may be substantially different. Differences or
similarities within aquifers, as well as between separate aquifers, are a result of how the sedimentary rock has
formed. Below some of the typical sedimentary environments found in Timor-Leste are discussed.
All sedimentary rocks are formed from the weathering of older rocks and subsequent sediment
deposition. Sedimentary materials may include particle sizes from clays to boulders and can be transported
greater or smaller distances by gravity, wind, ice or water. Sedimentary rocks can be classified as those that
form in: continental environments; at the boundary between continental and marine environments; and in
marine environments.
Continental sediments include all sediments formed on cotenants by the action of water (alluvial,
fluvial and lacustrine deposits), wind (eolian deposits), ice (glacial deposits) and gravity. Timor-Leste
contains a number of alluvial, glacial and gravity style deposits. The alluvial sediments have developed well-
sorted to poorly-sorted sediments in river valleys throughout the mountains and lowlands but are particularly
prominent along the coast where large sedimentary alluvial deposits have formed broad flat plains,
particularly on the south coast. Timor-Leste also contains a number of poorly-sorted sediments with large
grain-sizes (conglomerates and boulder-conglomerates) that may have formed by gravity slides or glacial
action. Many of the alluvial sediments of Timor-Leste have the potential to act as good aquifers.
Continental-marine boundary sediments, otherwise known as coastal sediments, develop where the
land meets the sea at the interface of continental and marine environments. Coastal sediments largely develop
by the action of water from a combination of rivers, waves and tide effects. The typical sedimentary
formations in coastal environments produced from these effects are deltas, estuaries, lagoons, tidal flats and
strandplains. Each of these coastal sediment formations may develop depending on the relative inputs from
rivers, waves and tides. Many of these coastal sedimentary formations are present throughout the coast of
Timor-Leste, particularly where rivers meet the ocean and along the south coast. These coastal formations
often accumulate sediments which build up both vertically and horizontally. Like the alluvial sediments,
which the coastal sediments are often associated with, the coastal sediments of Timor-Leste have the potential
to be good aquifers.
Marine sediments range from those on relatively shallow continental shelf to deep ocean. The
grainsize of marine sediments generally decreases from the sand sized grains near the coast to silts and clays
of deeper marine environments. Carbonate rocks (limestone) often form in deep ocean environments and, in
sub-tropical to tropical environments, can also form on the shallower continental shelf. Carbonate rocks are
discussed in more detail in the next section. A range of marine sediments are present throughout Timor-Leste,
exposed from under the ocean by the uplift of Timor. Many of the marine sediments in Timor-Leste are fine
grained clays and are not likely to be good aquifers.
Sedimentary aquifers have the potential to store large amounts of groundwater. Many sedimentary
aquifers are used around the world for their reliable groundwater resources. The groundwater storing capacity
of sediments depends on the type of environment in which the sediments formed, as discussed above. In
addition, the age of the sediments is important as over time the porosity of sediments can decrease due to
139
filling of the pore space, discussed further below under the Porosity and Permeability section. An
understanding of an aquifers sedimentary composition, structure, origin and history can allow for a more
detailed assessment of the aquifers groundwater potential.
2.2.2 Limestone Karstic Aquifers (Fissured Porosity)
Limestone can contain large amounts of groundwater. These rocks are largely made out of carbonate
minerals and for this reason limestone is also often called carbonate sediments or carbonate rocks. Limestone
often forms in deep marine settings or near the coast as reefs. Some groundwater can move through cracks and
around grains and rock fragments but the greatest amount of groundwater in carbonate rocks is stored in
fissures (holes, gaps and caves) formed over time by the movement of groundwater itself. Limestone that has
developed extensive fissures is described as ‘karst’ indicating the fissures are a prominent feature of the rock.
Karst is an evolutionary feature formed in limestone by the dissolution of the carbonate rocks over time
resulting in the gradual development of interconnected fissure systems of caves and smaller conduits. Initially,
diffuse flow can dominate groundwater movement with flow through small fractures and porosity. Over time,
a network of conduits begins to develop that carries an increasing proportion of the flow. In more mature karst
systems there can be almost no diffuse flow and groundwater is largely channelled through the fissures.
Sinkholes, large holes exposed at the grounds surface in limestone regions, are typical landform features of
karst terrains. Sinkholes allow direct access for rainfall and runoff into groundwater systems and further
enhance the formation and dominance of fissured groundwater flow.
Groundwater stored in karst aquifers is an important freshwater resource in Timor-Leste. Waters
from karst aquifers supply water for a number of communities in both mountain and coastal areas. The
groundwater from limestone areas, often the only source of freshwater, is generally of a very high quality and
is suitable for direct drinking water. Karst aquifers in limestone regions can contain considerably more
groundwater than fractured rock aquifers due to the dissolution of carbonate and enlargement of karst fissures.
Many limestone regions in Timor-Leste show the development of classic karst features, such as the Baucau
Limestone, where underground caves store and transmit large quantities of groundwater. The coral reef
limestone features of the Baucau Limestone indicates that in some places it is strongly recrystallised, but
elsewhere it remains highly porous. Thus, it is taken as having karst groundwater flow but also a proportion of
porous flow. Other limestone regions, such as the mountainous area around Maubisse, have formed from
uplift from the ocean floor rather than from the development of coastal reefs. These areas have also undergone
differing amounts of heating (metamorphism) which may affect the way groundwater flows through these
older limestones.
A common feature with the limestone regions is the presence of groundwater springs. Springs are a
more common source of water in these areas rather than water extracted by pumping. These springs rely
entirely on natural groundwater supply and therefore cannot be managed by changes in pumping rate. Karst
aquifers are also renowned for having complex uneven groundwater flow paths. This means that, whilst
140

groundwater is likely to be present in most limestone areas, the amount and flow rate may vary considerably.
Determining the flow direction and discharge rates of karst systems is very a difficult, usually relying on local
knowledge of karst features. Groundwater can also travel very quickly through the potentially large cave
systems. In some areas changes to the amount of groundwater recharge can relatively quickly affect the
amount of water coming out of some springs. Therefore, it is expected that the effects of climate change on
groundwater vulnerability can be observed in particular at karst springs in Timor-Leste.
141
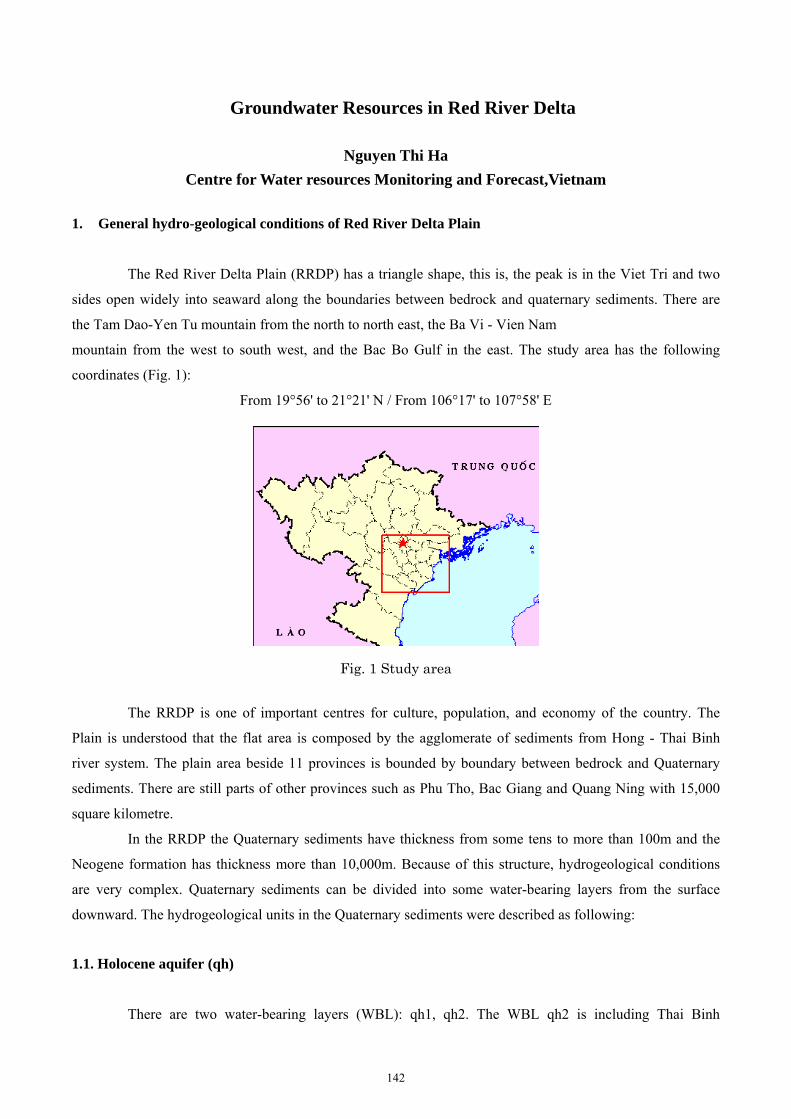
Groundwater Resources in Red River Delta
Nguyen Thi Ha
Centre for Water resources Monitoring and Forecast,Vietnam
1. General hydro-geological conditions of Red River Delta Plain
The Red River Delta Plain (RRDP) has a triangle shape, this is, the peak is in the Viet Tri and two
sides open widely into seaward along the boundaries between bedrock and quaternary sediments. There are
the Tam Dao-Yen Tu mountain from the north to north east, the Ba Vi - Vien Nam
mountain from the west to south west, and the Bac Bo Gulf in the east. The study area has the following
coordinates (Fig. 1):
From 19°56' to 21°21' N / From 106°17' to 107°58' E
Fig. 1 Study area
The RRDP is one of important centres for culture, population, and economy of the country. The
Plain is understood that the flat area is composed by the agglomerate of sediments from Hong - Thai Binh
river system. The plain area beside 11 provinces is bounded by boundary between bedrock and Quaternary
sediments. There are still parts of other provinces such as Phu Tho, Bac Giang and Quang Ning with 15,000
square kilometre.
In the RRDP the Quaternary sediments have thickness from some tens to more than 100m and the
Neogene formation has thickness more than 10,000m. Because of this structure, hydrogeological conditions
are very complex. Quaternary sediments can be divided into some water-bearing layers from the surface
downward. The hydrogeological units in the Quaternary sediments were described as following:
1.1. Holocene aquifer (qh)
There are two water-bearing layers (WBL): qh1, qh2. The WBL qh2 is including Thai Binh
142
sediment formation (Q23tb) with many different sources: alluvial, marine-alluvial, marine, bogy-marine,
alluvial-bogy-marine and windy marine. It's distributed almost plain area: along the rivers from centre to the
North West and covered the plain surface from centre to the South-East. The sediment contents are complex
including sand, sandy clay, silty clay, silt which changed with depths and on area. Thickness of the sediment
is from some tens to about 50m and most of them are ranges from 20m to 40m.
A Water-bearing layer (WBL) qh1 including the alluvial, marine sediment (amQ212-hh),
bogy-lake sediments (lbQ21-2hh) distributed in Hai Hung, Hai Phong, Thai Binh, Nam Ha, where its only
detected in wells. The sediment contents are fine sand, sandy silt, silty sand with vegetable remains, and the
thickness is from 15m- 20m.
The qh aquifer is the moderate water-bearing which may be satisfied in a medium or small scale for
water supply.
TDS and groundwater chemical contents are complex change in the aquifer. In general, the TDS is
increasing from some ten percent to more than 3 g/l from the top of the delta to the sea and from the edge to
the centre. It is recharged by rain, irrigation and seasonal river water. The aquifer is discharged by evaporation
and vegetable dispersion for underneath aquifers.
1.2. Confine aquifer - middle - upper Pleistocene sediments (qp)
The aquifer is cropped out in the edge such as Chi Linh, Dong Trieu, Hiep Hoa, Viet Yen, Lam Thao,
and Co Tiet. In the centre zone, it is completely covered as detected in wells. The sediments are consisted of
alluvial-marine sediment amQ12-3hn), alluvial sediment (aQ12-3), pluvial- alluvial (apQ12-3) and bottom of
the Vinh Phuc formation.
Lithological contents are two parts: the upper part is including sand and gravel, meanwhile the lower
is cobbles with gravels sandwiched by clay and sandy clay lens. The aquifer thickness is some tens to 85m,
increasing from West North to South East and from edge to the centre.
This is a confined aquifer, the water-bearing characters fairly homogeneous. It is divided into two
parts: the upper part is including sand and gravel, and the lower is cobbles with gravels sandwiched by clay
and sandy clay lens.
In the cropped out area, specific capacity (SC) of wells are only 0.2-0.5l/sm. The rest is divided in
two layers which are detailed studying Ha noi as follows: well SC is 0.9-4.9 l/sm and transitivity (T=Km) 120
m2/d-400 m2/d. The other area which is studied in the lower layer or for all aquifer, has small SC in the edge
(0.1-0.2 l/sm to very huge values more than 10 l/sm (in the centre). T values are from 50-100 to 2,000-3,000
m2/d. TDS is increased from 0.5 to more than 3 g/l in West North – South East direction. The TDS 1 g/l line
from the centre to Diem Dein commune whereas in the two edge areas it is spreading into onshore: to Hai
Duong, Bac Ninh in the East, to Phu Ly in the West. In Hai Phong existed 2 fresh water (FW) lens in salted
water area. In Hai Hau Nghia Hung the FW area developed from the West, North- West (Viet Tri) to some
districts of Thai Binh (Hung Ha). In the plain centre the FW area spread out to Hung Yen along the Luoc river
143
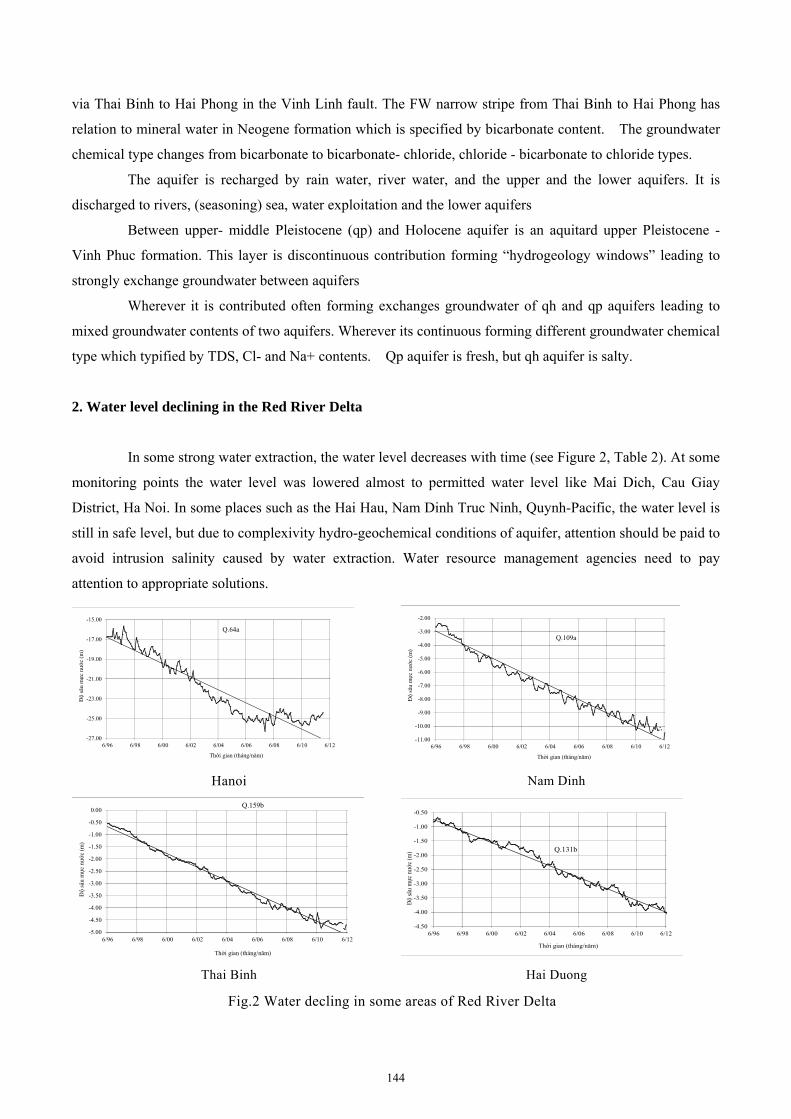
via Thai Binh to Hai Phong in the Vinh Linh fault. The FW narrow stripe from Thai Binh to Hai Phong has
relation to mineral water in Neogene formation which is specified by bicarbonate content. The groundwater
chemical type changes from bicarbonate to bicarbonate- chloride, chloride - bicarbonate to chloride types.
The aquifer is recharged by rain water, river water, and the upper and the lower aquifers. It is
discharged to rivers, (seasoning) sea, water exploitation and the lower aquifers
Between upper- middle Pleistocene (qp) and Holocene aquifer is an aquitard upper Pleistocene -
Vinh Phuc formation. This layer is discontinuous contribution forming “hydrogeology windows” leading to
strongly exchange groundwater between aquifers
Wherever it is contributed often forming exchanges groundwater of qh and qp aquifers leading to
mixed groundwater contents of two aquifers. Wherever its continuous forming different groundwater chemical
type which typified by TDS, Cl- and Na+ contents. Qp aquifer is fresh, but qh aquifer is salty.
2. Water level declining in the Red River Delta
In some strong water extraction, the water level decreases with time (see Figure 2, Table 2). At some
monitoring points the water level was lowered almost to permitted water level like Mai Dich, Cau Giay
District, Ha Noi. In some places such as the Hai Hau, Nam Dinh Truc Ninh, Quynh-Pacific, the water level is
still in safe level, but due to complexivity hydro-geochemical conditions of aquifer, attention should be paid to
avoid intrusion salinity caused by water extraction. Water resource management agencies need to pay
attention to appropriate solutions.
Hanoi
Nam Dinh
Thai Binh
Hai Duong
Fig.2 Water decling in some areas of Red River Delta
-27.00
-25.00
-23.00
-21.00
-19.00
-17.00
-15.00
6/96 6/98 6/00 6/02 6/04 6/06 6/08 6/10 6/12
Độ
sâu
mực
nướ
c (m
)
Thời gian (tháng/năm)
Q.64a
-11.00
-10.00
-9.00
-8.00
-7.00
-6.00
-5.00
-4.00
-3.00
-2.00
6/96 6/98 6/00 6/02 6/04 6/06 6/08 6/10 6/12
Độ
sâu
mực
nướ
c (m
)
Thời gian (tháng/năm)
Q.109a
-5.00
-4.50
-4.00
-3.50
-3.00
-2.50
-2.00
-1.50
-1.00
-0.50
0.00
6/96 6/98 6/00 6/02 6/04 6/06 6/08 6/10 6/12
Độ
sâu
mực
nướ
c (m
)
Thời gian (tháng/năm)
Q.159b
-4.50
-4.00
-3.50
-3.00
-2.50
-2.00
-1.50
-1.00
-0.50
6/96 6/98 6/00 6/02 6/04 6/06 6/08 6/10 6/12
Độ
sâu
mực
nướ
c (m
)
Thời gian (tháng/năm)
Q.131b
144
3. Forecast for water level in the Red River Delta
Based on the water level in long term we have drawn graph and estimated water level by using
statistic method. The results of estimation are presented in the Table 1.
Table1. Estimation of water level in a strong extraction area, qp1 aquifer
Well
Hmin
1995
(m)
Hmin
6/2012
(m)
Comparison
with Hcp, (%)
Estimated water
level, (m)
December 2012
Hcp
(m) Location
Q64a 16.66 24.36 38.06 25.06 64.00 Hanoi
Q109a 2.19 11.45 22.90 11.19 50.00 Nam Dinh
Q159b 0.52 4.90 9.79 4.96 50.00 Thai Binh
Q131b 1.26 4.01 8.02 4.05 50.00 Hai Duong
4. Groundwater quality in the Red River Delta Plain
4.1. Upper Holocene aquifer (qh2)
The analysed results from 33 water samples in dry season 2012 showed that average TDS value is
3,092mg/l. There are 11 samples having TDS higher than standard limitation (SL). The maximam value is
22,246 mg/l in well Q.111 (Hai Ly - Hai Hau - Nam Dinh); The Minimum value is 235 mg/l in well Q.115
(Ho town - Thuan Thanh - Bac Ninh).
The analysed results from 25 water samples in dry season 2012 showed that all sample having
ammonia higher than SL (>0.1mg/l in N). There are 8 very high samples, 4 high samples. The average
ammonia value is 71 time higher than SL. The maximum value is 44.18 mg/l in well Q.111 (Hai Ly - Hai Hau
- Nam Dinh).
4.2. Lower Pleistocene aquifer (qp1)
The analysed results from 49 water samples in dry season 2012 showed that average TDS value is
756mg/l.
There are 20 samples in 40 samples having maganese higher than SL. There are 6 samples in 40
samples having arsenic higher than SL. The maximum value is 0.4 mg/l in well Q.58a (Hoai Duc- Ha Noi), 8
time higher than SL; The other trace elements having values lower than SL.
The analysed results from 44 water samples in dry season 2012 showed that all sample having
ammonia higher than SL. There are 13 very high samples and 6 high samples. The average ammonia value is
145

73.2 time higher than SL. The maximum value is 44.18 mg/l in well Q.111 (Hai Ly - Hai Hau - Nam Dinh).
146
Related Documents