Project Paper On “Factors affecting the intention of UIU students for the usage of mobile banking services” Submitted To Dr. Md. Mohan Uddin Professor School of Business & Economics United International University Submitted By Najib Ahsan ID- 111 132 073 United International University Date of Submission: 28 October, 2019

Welcome message from author
This document is posted to help you gain knowledge. Please leave a comment to let me know what you think about it! Share it to your friends and learn new things together.
Transcript

Project Paper
On
“Factors affecting the intention of UIU students for the usage of mobile
banking services”
Submitted To
Dr. Md. Mohan Uddin
Professor
School of Business & Economics
United International University
Submitted By
Najib Ahsan
ID- 111 132 073
United International University
Date of Submission: 28 October, 2019

i | P a g e
Letter of Transmittal
September 30, 2019
Dr. Md. Mohan Uddin
Professor- Finance
School of Business & Economics
United International University
Subject: Submission of Project Report on “Factors effecting the
intention of UIU students for the usage of mobile banking
services”.
Dear Sir,
I am very pleasure to submit my project paper based on “Factors
effecting the intention of UIU students for the usage of mobile
banking services”. I have collected information from UIU students
by doing survey based on factors which are effecting UIU students
for usage of mobile banking services.
So, I, therefore pray and hope you would be kind enough for
accepting my project paper. I am also ready for providing more
information regarding this paper.
Sincerely Yours,
Najib Ahsan
ID-111 132 073
ii | P a g e
Acknowledgement
Firstly, I would like to express my gratitude to Almighty Allah who gives me
mental strength for completion of this project paper. This project paper is
prepared based on affecting the intention of UIU students about usage of
mobile banking services.
I would like to be thankful to my honorable supervisor also. He has
provided many important information for preparing this full project
paper. Without his contribution, it could be impossible for me to finish
this project paper properly.
I would like to thankful to my all teachers also. Without their contribution
not only project but also all other educational activities are impossible
for doing by me alone. I always get inspiration & support from them.
iii | P a g e
Executive Summary
In this report, Chapter 1 is discussed about Economy, Telecommunication,
Banking Sectors of Bangladesh, Objectives & Significance of the study.
Bangladesh is improving thoroughly in these sectors specially in Banking
Sectors. Important thing is mobile banking companies are successful for
attracting students customer by providing them benefit of using mobile
banking services.
Chapter 2 is discussed about variable measurement. In this part, two types of
variables are described which are- Independent & Dependent Variable. In
dependent variable, one variable is dependent upon another variable. In
independent variable, variables are influenced to dependent variables. Also,
process of collecting information from UIU students by taking survey based on
usage of mobile banking services is widely described.
Chapter-3 is discussed about findings. In this part, there are two data findings
discussed which are- Correlation & Regression Analysis. In correlation
analysis, data of independent variables are given with interpretation. In
regression analysis, data of regression statistics, anova table, co-efficient,
standard error, t-stat, p-value, lower 95% & upper 95% are given with
interpretation.

iv | P a g e
Chapter-4 is discussed about discussion which contains efficiency, importance,
technological materials, valuation, practice & achieving milestones by mobile
banking services. People are easily compatible with usage of mobile banking
services & importance of mobile banking service is increasing day by day.
Chapter-5 is discussed about conclusion & recommendation. In this part,
people’s reaction about using mobile banking services & future of mobile
banking services are described briefly.
v | P a g e
Table of Contents
Serial No.
Topics
Page No.
Chapter-1
Introduction
1-15
1.1
Background of the
Study
1
1.1.1
Economy of Bangladesh
1-5
1.1.2
Banking Sector in
Bangladesh
6-9
1.1.3
Telecommunication
Sector of Bangladesh
10-14
1.2
Objectives of the study
15
1.3
Significance of the study
15
Chapter-2
Research Methodology
16-22
2.1
Variable Measurement
16
vi | P a g e
2.1.1
Dependent Variable 16-17
2.1.2 Independent Variable 17-19
2.2 Questionnaire 19
2.3
Sample
20
2.4
Collection of Data
20
2.5
Data Preparation
21
2.6
Data Analysis
21
2.6.1
Data of Correlation
Analysis
22
2.6.2
Data of Regression
Analysis
22
Chapter-3
Findings
23-39
3.1
Findings
23
3.1.1
Correlation Analysis
23-25
3.1.2
Regression Analysis (Y1)
25-26
3.1.2.1
Regression Statistics 27

vii | P a g e
3.1.2.2
Anova Table
27-28
3.1.2.3 Co-efficient 29
3.1.2.4
Standard Error
30
3.1.2.5
t-stat
30
3.1.2.6
P-value
31
3.1.2.7
Lower 95%
32
3.1.2.8
Upper 95%
32
3.1.3
Regression Analysis (Y2)
33-34
3.1.3.1
Regression Statistics
35
3.1.3.2
Anova Table
35-36
3.1.3.3
Co-efficient
36-37
3.1.3.4
Standard Error
37
3.1.3.5
t-stat
37
viii | P a g e
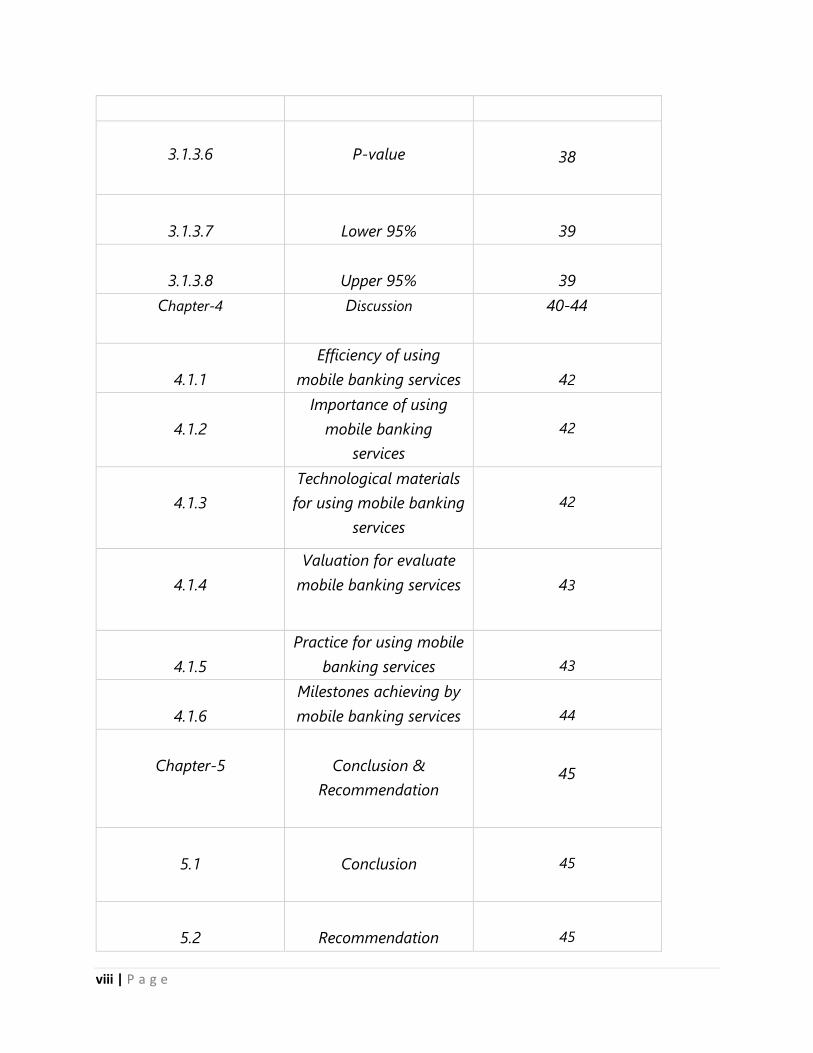
3.1.3.6
P-value
38
3.1.3.7
Lower 95%
39
3.1.3.8
Upper 95%
39
Chapter-4 Discussion 40-44
4.1.1
Efficiency of using
mobile banking services
42
4.1.2
Importance of using
mobile banking
services
42
4.1.3
Technological materials
for using mobile banking
services
42
4.1.4
Valuation for evaluate
mobile banking services
43
4.1.5
Practice for using mobile
banking services
43
4.1.6
Milestones achieving by
mobile banking services
44
Chapter-5
Conclusion &
Recommendation
45
5.1
Conclusion
45
5.2
Recommendation
45

ix | P a g e
1 | P a g e
Chapter-1: Introduction
1.1 Background of the study:
Basically, in this report, author is going to discuss about
Economy of Bangladesh, Banking Sector of Bangladesh &
Telecommunication Sector of Bangladesh. These elements
are essential for developing a country like Bangladesh.
1.1.1 Economy of Bangladesh:
Economy of Bangladesh is a free-market based. This is one of fastest
growing economy in the world. According to IMF, Bangladesh’s
economy is second largest growing economy of 2016. Since 2004, GDP
growth of Bangladesh stated as 6.5%. It has been running largely
based on readymade garments, remittances and domestic agricultural
sector.
The country has pursued export-oriented industrialization, with
its key export sectors include textiles, shipbuilding fish &
seafood, jute and leather goods. It has also developed
self-sufficient industries like pharmaceuticals, steel and food
processing. Government also promoting “Digital Bangladesh” to
develop technological sector which is part of project.

2 | P a g e
In 2019, Bangladesh’s GDP per capital income stated as per IMF data
is US $4992 at Purchasing Power Parity & US $1888 at nominal.
Overall GDP is $314.656 billion at nominal & $831.750 billion at PPP.
In 2018, GDP Rank was 41st at nominal & 30th at PPP. GDP growth
in 2016-17 was 7.3%, In 2017-18, it was 7.9%, In 2018-19, it is
estimated at 7.3.% & In 2019-20, it will be estimated at 7.4%.
In 2018, GDP Per Capita Rank was 144th at Nominal & 136th at PPP.
In 2018, estimated GDP at different sector was 14.23% in agriculture,
33.66% in industry, 52.11% in services. Estimated CPI was 5.564%.
Estimated poverty line was 7.1% which means 7.1% people living in
extreme poverty.
In 2016, according to World Bank, gini coefficient was 32.4 at
medium. In 2017, Human Development Index was 0.608 at medium
and position was 136th. IHDI was 0.462. In 2018, labor force was
68,371,792.
In 2017, estimated labor force by occupation was 40.6% at
agriculture, 20.4% at industry, 39.6% at services. In 2017,
estimated unemployment was overall 4.2%. Male was 3.1% &
Female was 6.7%.

3 | P a g e
In 2019, Ease-of-doing-business rank is 176th. In 2018-19, Exports
are estimated $46.87 billion. Exports goods are Textiles, Garments
(2nd largest exporter in the world), Leather & Leather Goods,
Pharmaceuticals and other Chemical products, Ceramic Products,
Bicycles, Jute & Jute Goods, IT, Agricultural Products, Frozen Food
(Fish and Seafood).
Main export partners are European Union, United States, Japan,
Canada, India, Australia, China, Southeast Asia & Others. 58.2% of
goods are exported to EU, 16.3% of goods are exported to US, 3.1% of
goods are exported to Japan, 3% of goods exported to Canada, 2.4% of
goods exported to India, 1.9% of goods are exported to both China &
Australia, 1.6% of goods are exported to Southeast Asia & 11.6% of
goods exported to Others.

4 | P a g e
Figure 1.2: Export Statistics of Bangladesh
In 2018, Imports are estimated $46.02 billion at fiscal year. Imports
goods are Textiles and Textile Articles, Machinery and Mechanical
Appliances, Electrical Equipment, Mineral Products, Vegetable
Products, Metal & metal products, Chemicals & Allied Products,
Vehicles & Aircraft.
58.20%
16.30%
3.10% 3% 2.40% 1.90% 1.90% 1.60%
11.60%
EUROPEAN UNION
UNITED STATES
JAPAN CANADA INDIA CHINA AUSTRALIA SOUTHEAST ASIA
OTHERS
Exports Column1 Column2

5 | P a g e
Figure 1.3: Import Statistics of Bangladesh
Main import partners are China, India, Singapore, European Union,
Hong Kong and Others. 21.5% of goods are imported from China,
12.2% of goods are imported from India, 9.2% of goods are imported
from Singapore, 6.2% of goods are imported from EU, 5.5% of goods
are imported from Hong Kong & 45.3% of goods are imported from
Others. In 2018, Revenues were $24.36 billion at fiscal year & In
2018-19, Expenses are $55.31 billion at fiscal year.
21.50%
12.20%9.20%
6.20% 5.50%
45.30%
CHINA INDIA SINGAPORE EUROPEAN UNION
HONG KONG OTHERS
Imports Column1 Column2
6 | P a g e
1.1.2 Banking Sector in Bangladesh:
Bangladesh is a developing country with improving banking sector,
particularly in terms of the services & customer care provided by the
government run banks. In recent times, private banks are trying to
simulate banking structures of most developed countries, but this
attempt often failed by inexpert or politically motivated government
policies execute by central bank of Bangladesh, which is Bangladesh
Bank.
Bangladesh has 8 Islamic banks, while several non-Islamic
banks provide Islamic banking services along with normal
operations. There are also some mobile bankings exists in
Bangladesh which provides many mobile banking facilities to
customers.
After the liberation of Bangladesh, the twelve Banking companies
who were doing business in Bangladesh, were nationalized by the
Government of the People's Republic of Bangladesh which are
mentioned in following table no.1.4.

7 | P a g e
Table 1.4: List of Nationalized and Foreign Commercial Bank
Nationalized
Bank Before Independence
Sonali Bank
National Bank of
Pakistan
Bank of
Bhawalpur
Premier Bank
Limited
Rupali Bank
Muslim Commercial
Bank
Australasia Bank
Limited
Standard Bank
Limited
Agrani Bank
Commerce Bank
Limited
Habib Bank
Limited
Janata Bank United Bank Limited Union Bank
Limited
Pubali Bank
Eastern Mercantile
Bank Limited
Uttara Bank
Eastern Banking
Corporation
8 | P a g e
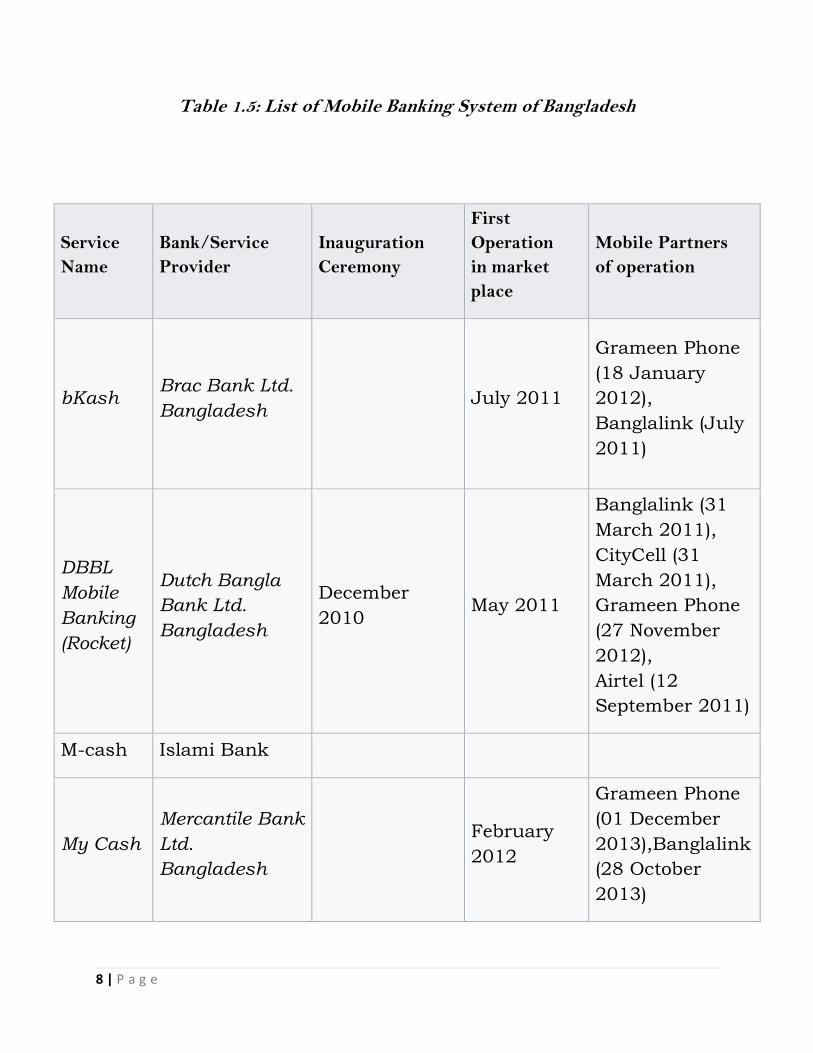
Table 1.5: List of Mobile Banking System of Bangladesh
Service
Name
Bank/Service
Provider
Inauguration
Ceremony
First
Operation
in market
place
Mobile Partners
of operation
bKash Brac Bank Ltd.
Bangladesh July 2011
Grameen Phone
(18 January
2012),
Banglalink (July
2011)
DBBL
Mobile
Banking
(Rocket)
Dutch Bangla
Bank Ltd.
Bangladesh
December
2010 May 2011
Banglalink (31
March 2011),
CityCell (31
March 2011),
Grameen Phone
(27 November
2012),
Airtel (12
September 2011)
M-cash Islami Bank
My Cash
Mercantile Bank
Ltd.
Bangladesh
February
2012
Grameen Phone
(01 December
2013),Banglalink
(28 October
2013)

9 | P a g e
Nagad Bangladesh
Post Office Ltd.
OK
Mobile
Banking
One Bank Ltd.
Bangladesh
October
2013
Grameen Phone
(05 October
2013)
Sure
Cash Rupali bank
T-cash Trust Bank Ltd.
Bangladesh
1 April
2018
UCash
United
Commercial
Bank Ltd.
Bangladesh
November
2013
Grameen Phone
(20 Jun 2014),
Banglalink
(March 2014)
10 | P a g e
1.1.3 Telecommunication Sector of Bangladesh:
The liberalization of Bangladesh’s Telecommunication started with
small steps in 1989 with issuance of license to a private operator for
provision of inter alia cellular mobile services competes with BTTB
(Bangladesh Telegraph & Telephone Board).
Telecommunication sector in Bangladesh is rapidly emerging.
Bangladesh Telecommunication Regulatory Commission (BTRC) is the
regulatory authority of Telecommunication Sector of Bangladesh.
Mobile Code of Bangladesh is +880. There are also some sub codes.
Landmarks of history of Telecommunication sector in Bangladesh are
given below:
1853: Telegraph branch under Posts and Telegraph Department,
British India.
1971: Reconstructed as Bangladesh Telegraph and Telephone
Department under Ministry of Posts and Telecommunications.
1975: Reconstructed as Telegraph and Telephone Board.
1979: Reconstructed as Bangladesh Telegraph and Telephone
Board (BTTB) with right to issue license for telecom and wireless
services.
11 | P a g e
1981: Digital Telex Exchange in Bangladesh.
1983: Automatic Digital ITX started in Dhaka.
1985: Coinbox Telephone service introduced in Bangladesh by
BTTB.
1989: GENTEX Telegraph messaging service introduced in
Bangladesh.
1989: Bangladesh Rural Telecom Authority got license to operate
exchanges in 200 upazila.
1989: Sheba Telecom got license to operate exchange is 199
upazila.
1989: Cellular mobile phone company Pacific Bangladesh
Telephone Limited and Bangladesh Telecom got license.
1995: Card Telephone service introduced in Bangladesh by BTTB
and TSS.
1995: Regulatory power of BTTB transferred to Ministry (MoPT).
1995: 2nd and 3rd ITX installed in Dhaka.
1996 : Grameenphone got cellular mobile Telephone license.
1996: Telecom Malaysia International Bangladesh got cellular
mobile license.
12 | P a g e
1998: Telecom Policy.
2000: Global Telecom Service (GTS) Telex Exchange venture with
British Telecom.
2001: Telecommunication Act, to establish Bangladesh
Telecommunication Regulatory Commission (BTRC).
2002: ICT Policy.
2004: Teletalk cellular mobile launched.
2005: Egypt-based Orascom acquired Sheba Telecom
2006: NGN introduced in BTTB.
2008: BTTB converted into Bangladesh Telecommunications
Company Limited (BTCL) with 100% shares owned by Government.
The Submarine Cable Project transformed into Bangladesh
Submarine Cable Company Limited (BSCCL).
2008: Japanese NTT DoCoMo bought 30 percent stake in Aktel
2009: Bharti Airtel acquired 70 percent stake in Warid Telecom
2009: Internet Protocol Telephony Service Provider (IPTSP)
Operators launched.
2010: Aktel rebranded to Robi Axiata Limited
2012: 3G mobile service is introduced by state owned Teletalk in
October.
2013: 3G auction held for private companies.
13 | P a g e
2014: 64 districts covered with 3G by
Teletalk, Grameenphone, Banglalink and Robi.
2016: Robi and Airtel were merged on November 16, 2016 &
Robi set sail as the merged company.
2018: 4G auction held for private companies
2018: on 19 February 4G mobile service is introduced.
There are 6 mobile phone operators in Bangladesh. Operators are- Airtel,
Grameenphone, Banglalink, Robi, Citycell & Teletalk. Numbers of mobile
phone subscribers are in Bangladesh as of April 2015 was 124.705
million.
On 25 February 2008 Bangladesh Telecommunication Regulatory
Commission provided licenses for two interconnection exchanges,
three international gateways and one international internet gateway.
After then on 12 April 2012 BTRC provided licenses for twenty-one
interconnection exchanges, twenty-two international gateways & thirty
international internet gateway.
There are some radio broadcast stations in Bangladesh which
are- AM 12, FM 12, shortwave 2, community radio 1, internet
radios. In 1997, users of radio were 6.15 million. Government
owned Betar-Radio Bangladesh operates from Dhaka and other
local districts. Recently, private fm radio channels are most
popular.
14 | P a g e
They provide entertainment and trying to attract radio listeners with
their several segments like- news, sports, music etc. Operating
private radio channels are- Dhaka FM 90.4FM, Radio Today 89.6FM,
Radio Foorti 88.0FM, Radio Amar 88.4FM, ABC Radio 89.2FM,
Peoples Radio 91.6FM.
Internet is most popular for communication system of Bangladesh.
First connectivity with Internet in Bangladesh was at 1996.
After few years, growth rate of internet users has been rapidly
increasing. Internet country code of Bangladesh is .bd. Since 2005,
more than 180 Internet Service Providers have been providing
internet services & facilities to internet users in Bangladesh.
These ISP’s are regulated by BTRC.
There are 6 satellite stations also in Bangladesh. Talimabad & Betbunia
are two of them. Some info states that now satellite stations reach onto 7.
Bangladesh has sent first satellite Bangabandhu-1 into space at May 11,
2018.

15 | P a g e
1.2 Objectives of the study:
The objective of this report is to identify the factors influencing the
intention of UIU students for the usage of mobile banking services.
1.3 Significance of the study:
Significance to prepare this report are: the findings of this report will
help the decision makers of both of these sectors particularly if they
want to attract more student customer & the findings of this report also
contribute to the knowledge related to mobile financial services in
Bangladesh.

16 | P a g e
Chapter-2: Research Methodology
2.1 Variable Measurement:
This is to say that variables are also defined by operational & conceptual
definitions. Measurement is the assignment of numerals to objects or
events according to rules. There are two types of measurement
of variables in the following below:
2.1.1 Dependent Variable:
If one variable depends upon or is a consequence of the other variable,
it is termed as a dependent variable. In this study, Y1 & Y2 are used to
indicate the dependent variables.
Here, Y1 indicates level of agreement with the following statements
which is question no.16 and statements of this questions are- If mobile
banking was more fun/enjoyable, I probably use it more often, if using
mobile banking would give me points, rewards, and prizes (like lower
transaction cost, reward points, cash back), I probably use it more often &
if mobile banking was more fun/enjoyable, I probably advise others to use
it.

17 | P a g e
Y2 indicates level of agreement with the following statements which is
question no.18 and statement of this questions are- I intend to continue
using mobile banking in the future, I will always try to use mobile
banking in my daily life & I plan to continue to use mobile banking
frequently.
2.1.2 Independent Variable:
Variables which are influenced to dependent variable are termed as
independent variable. In Excel, PE_5, EE_7, SI_8, FC_10, HM_11,
PV_13, HB_15 & BR_19 are independent variables.
PE_5 indicates level of agreement with the following statements in
question no. 5: I find mobile banking services useful in my daily life,
using mobile banking services increases my productivity, using mobile
banking services helps me accomplish things more quickly & using
mobile banking services increases my chances of achieving things
that are important to me.
EE_7 indicates level of agreement with the following statements in
question no.7: Learning how to use mobile banking services is easy for me,
my interaction with mobile banking services is clear & understandable, I
find mobile banking services easy to use, it is easy for me to become
skillful at using mobile banking services.
18 | P a g e
SI_8 indicates level of agreement with the following statements in
question no.8: People who are important to me think that I should use
mobile banking services, people who influence my behavior think that I
should use mobile banking services, mobile banking services use is a
status symbol in my environment.
FC_10 indicates level of agreement with the following statements in
question no.10: I have the resources necessary to use mobile banking
services, I have the knowledge necessary to use mobile banking services,
mobile banking is compatible with other technologies I use & I can get
help from others when I have difficulties using mobile banking services.
HM_11 indicates level of agreement with the following statements in
question no.11: using mobile banking services is fun, using mobile
banking services is enjoyable & using mobile banking services is
entertaining.
PV_13 indicates level of agreement with the following statements in
question no.13: Mobile banking services are reasonably priced, mobile
banking services are reasonably priced compared with other banking
channels, mobile banking services are a good value for the money &
at the current price, mobile banking services provide a good value.
19 | P a g e
HB_15 indicates level of agreement with the following statements in
question no.15: The use of mobile banking services has become a habit
for me, I am addicted to using mobile banking services, I must use
mobile banking services & using mobile banking has become natural to
me.
BR_19 indicates level of agreement with the following statements in
question no.19: The mobile banking service I use is well known,
the mobile banking service I use is the leading service in my country,
the mobile banking service I use is reputable & the mobile banking service
I use is easily recognizable.
2.2 Questionnaire:
The data related to each variable are collected using a questionnaire which
is given appropriately. This survey was full about some contents like age,
mobile banking experience, gender, actual frequency of use of mobile
banking services, major area of study, level of study, being university
student or not, area of higher secondary education, access to computing
device, religion & ten level of agreements with the following statements.
Author started to survey based on “Usage of Mobile Banking Services” in
UIU Campus. The questionnaire is attached in Appendix 1.
20 | P a g e
2.3 Sample:
There are more than 6000 Undergraduate & graduate students running
in UIU Campus. Out of them 100 students are considered in the sample
of this study based on convenience.
2.4 Collection of Data:
Data of Survey about usage of mobile banking services has collected in
different steps. Soft copy of anonymous survey questionnaire printed
out to get hard copy which was copied for 100 respondents. After that,
author numbered these survey copies from number 1 to number 100.
Author went to some students to collect data of survey about usage
of mobile banking services. They also became co-operative with me to
fill up these survey copies by providing information or data based on
usage of mobile banking services in Bangladesh. Most of the time
author take survey on students at Afternoon.
Author also went at evening at UIU campus to some MBA students for
taking survey based on this. It takes 20 days to collect data of 100 copies
of survey from UIU students. After taking survey from students of UIU
campus, author started to check if there would any information wrong or
misguided.
21 | P a g e
2.5 Data Preparation:
Author correct them and started to arrange orderly these copies of survey
and tied with ribbon. After working for collection of data, data of survey
about usage of mobile banking services were started to prepare.
Data of indicating level of agreement with the given statements were
found out by average. Others data were found out from students in UIU
campus. All of these data were copied in MS Excel.
Then, values of correlation were found out between variable Y1 and other
variables which are PE_5, EE_7, SI_8, FC_10, HM_11, PV_13, HB_15 &
BR_19. Also, values of correlation were found out between variable Y2
and these variables.
2.6 Data analysis:
Data analysis is the process of applying systematically statistical and/or
logical techniques to describe & illustrate, condense & recap, & evaluate
data. There are two types of data analyzed described in below:

22 | P a g e
2.6.1 Data of Correlation Analysis:
Correlation Analysis is a method of statistical evaluation used to study
the strength of a relationship between two numerically measured,
continuous variables.
For this study, the correlation analysis has been done by using
“CORREL” function into excel software.
2.6.2 Data of Regression Analysis:
Regression Analysis is a powerful statistical method that allows to
examine the relationship between two or more variables of interest.
For this study, the regression analysis has been done by using
“regression” function into excel software.

23 | P a g e
Chapter-3: Findings
3.1 Findings:
Findings are facts that have been found, especially by
academics studying something. There are two types of data
findings are given below.
3.1.1 Correlation Analysis:
Correlation analysis is a method of statistical evaluation
used to study the strength of a relationship between two,
numerically measured, continuous variables.
Values of Correlations are found out by CORREL function
between values of dependent variable Y1 which indicates
level of agreements in question no.16 and Y2 which
indicates level of agreement in question no.18 and each of
all values of independent variables respectively PE_5, EE_7,
SI_8, FC_10, HM_11, PV_13, HB_15 and BR_19 which
indicates their level of agreements with given statements
respectively in question no.5, question no.7, question no. 8,
question no.10, question no.11, question no. 13, question no.15
& question no.19.
24 | P a g e
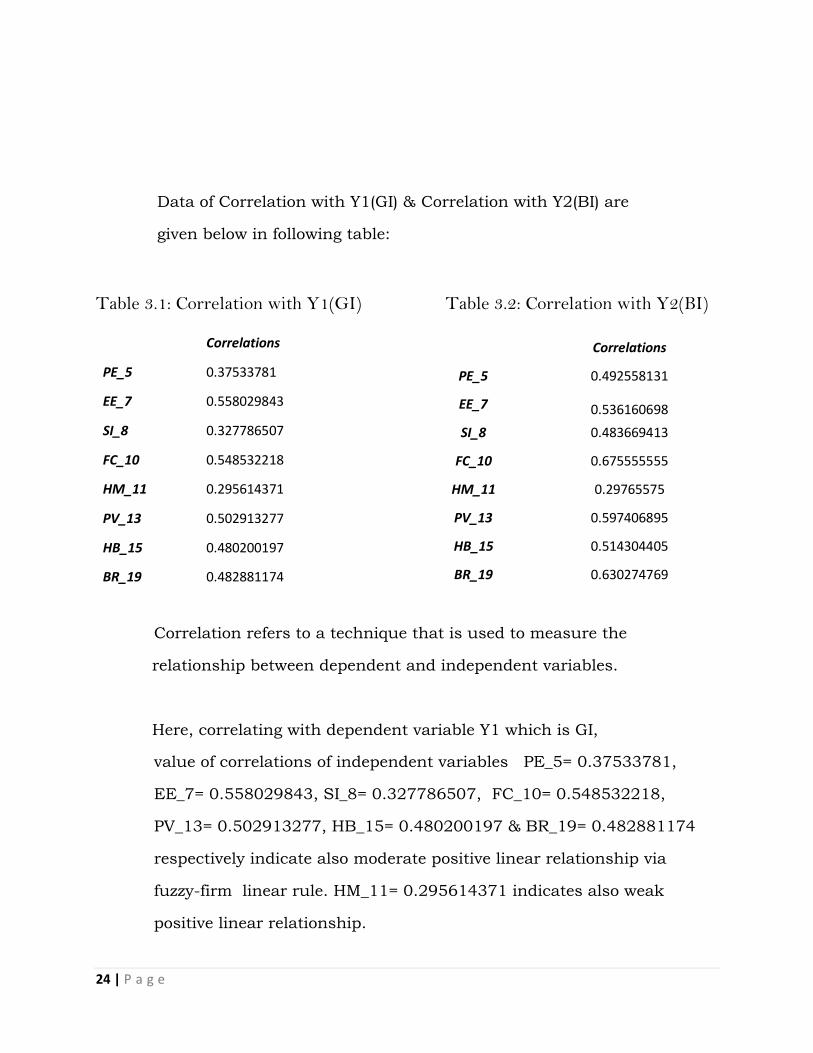
Data of Correlation with Y1(GI) & Correlation with Y2(BI) are
given below in following table:
Table 3.1: Correlation with Y1(GI) Table 3.2: Correlation with Y2(BI)
Correlations
PE_5 0.37533781
EE_7 0.558029843
SI_8 0.327786507
FC_10 0.548532218
HM_11 0.295614371
PV_13 0.502913277
HB_15 0.480200197
BR_19 0.482881174
Correlation refers to a technique that is used to measure the
relationship between dependent and independent variables.
Here, correlating with dependent variable Y1 which is GI,
value of correlations of independent variables PE_5= 0.37533781,
EE_7= 0.558029843, SI_8= 0.327786507, FC_10= 0.548532218,
PV_13= 0.502913277, HB_15= 0.480200197 & BR_19= 0.482881174
respectively indicate also moderate positive linear relationship via
fuzzy-firm linear rule. HM_11= 0.295614371 indicates also weak
positive linear relationship.
Correlations
PE_5 0.492558131
EE_7 0.536160698
SI_8 0.483669413
FC_10 0.675555555
HM_11 0.29765575
PV_13 0.597406895
HB_15 0.514304405
BR_19 0.630274769

25 | P a g e
On the other hand, correlating with dependent variable Y2 which is BI ,
value of correlations of independent variables PE_5= 0.492558131,
EE_7=0.536160698, SI_8=0.483669413, FC_10= 0.675555555,
PV_13=0.597406895, HB_15=0.514304405 & BR_19= 0.630274769
respectively indicate moderate positive linear relationship via fuzzy-firm
linear rule. Correlation of HM_11= 0.29765575 indicates a weak positive
linear relationship via shaky linear rule.
3.1.2 Regression Analysis for Y1:
Values of Regression analysis are defined by Regression
function between values of dependent variable Y1 which
indicates level of agreement mentioned by following
statements in question no.16 and independent variables.
Independent variables are PE_5, EE_7, SI_8, FC_10, HM_11,
PV_13, HB_15 and BR_19 which indicate their level of
agreement with the following statements respectively in
question no.5, question no.7, question no.8, question no.10,
question no.11, question no.13, question no.15 &
question no.19.

26 | P a g e
Table 3.1.2: Analysis of Linear Regression with GI
Regression with Y1
Regression Statistics
Multiple R 0.788106145 R Square 0.621111296
Adjusted R Square 0.587802399 Standard Error 0.746455174
Observations 100
ANOVA
df SS MS F Significance F Regression 8 83.12020926 10.39003 18.64701 2.95609E-16 Residual 91 50.70477474 0.557195
Total 99 133.824984
Coefficients Standard Error t Stat P-value Lower 95% Upper 95%
Intercept 0.519644454 0.409093571 1.270234 0.20724 -0.292969669 1.332258577
PE_5 -0.013001516 0.080113168 -0.16229 0.871438 -0.172136483 0.146133451
EE_7 -0.033470385 0.096573901 -0.34658 0.729709 -0.225302576 0.158361806
SI_8 0.140343269 0.075648842 1.855194 0.066806 -0.009923863 0.2906104
FC_10 0.225766739 0.115844033 1.948885 0.054389 -0.0043432 0.455876679
HM_11 -0.081613994 0.064272957 -1.2698 0.207392 -0.209284327 0.046056339
PV_13 0.185405088 0.08742842 2.12065 0.036671 0.011739272 0.359070904
HB_15 0.247615505 0.082455485 3.00302 0.003451 0.083827814 0.411403196
BR_19 0.314851868 0.088315416 3.565084 0.000582 0.139424143 0.490279592
27 | P a g e
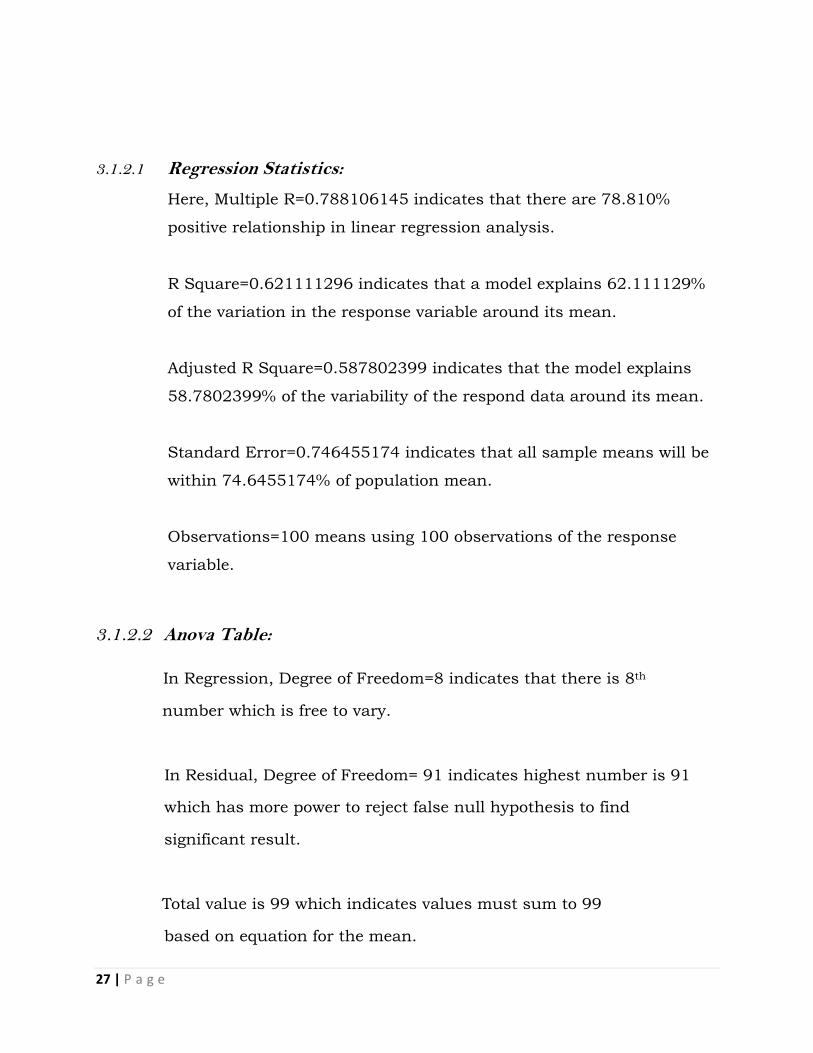
3.1.2.1 Regression Statistics:
Here, Multiple R=0.788106145 indicates that there are 78.810%
positive relationship in linear regression analysis.
R Square=0.621111296 indicates that a model explains 62.111129%
of the variation in the response variable around its mean.
Adjusted R Square=0.587802399 indicates that the model explains
58.7802399% of the variability of the respond data around its mean.
Standard Error=0.746455174 indicates that all sample means will be
within 74.6455174% of population mean.
Observations=100 means using 100 observations of the response
variable.
3.1.2.2 Anova Table:
In Regression, Degree of Freedom=8 indicates that there is 8th
number which is free to vary.
In Residual, Degree of Freedom= 91 indicates highest number is 91
which has more power to reject false null hypothesis to find
significant result.
Total value is 99 which indicates values must sum to 99
based on equation for the mean.

28 | P a g e
In Regression, Sum of Square (SS)=83.12020926 indicates
that 83.12020926 of variation are spread between each
individual value and mean.
In Residual, Sum of Square(SS)= 50.7047747 indicates that a
model is tight fit in 50.70477474 points to the data.
Total Sum of Square=133.824984 indicates that there is
133.824984 of variation in dependent variable.
In Regression, Mean Square (MS)=10.39003 indicates that
estimate value 10.39003 is used to determine whether model
is significant.
In Residual, Mean Square=0.557195 indicates that difference
between variation and regression line points is 0. 557195.
F=18.64701 indicates that F statistic of at least 18.64701 is
needed to reject the null hypothesis at an alpha level.
Significance F= 2.95609E-16 indicates that there are 2.95609E-16
probabilities that all the coefficients in regression output are actually
zero.
29 | P a g e
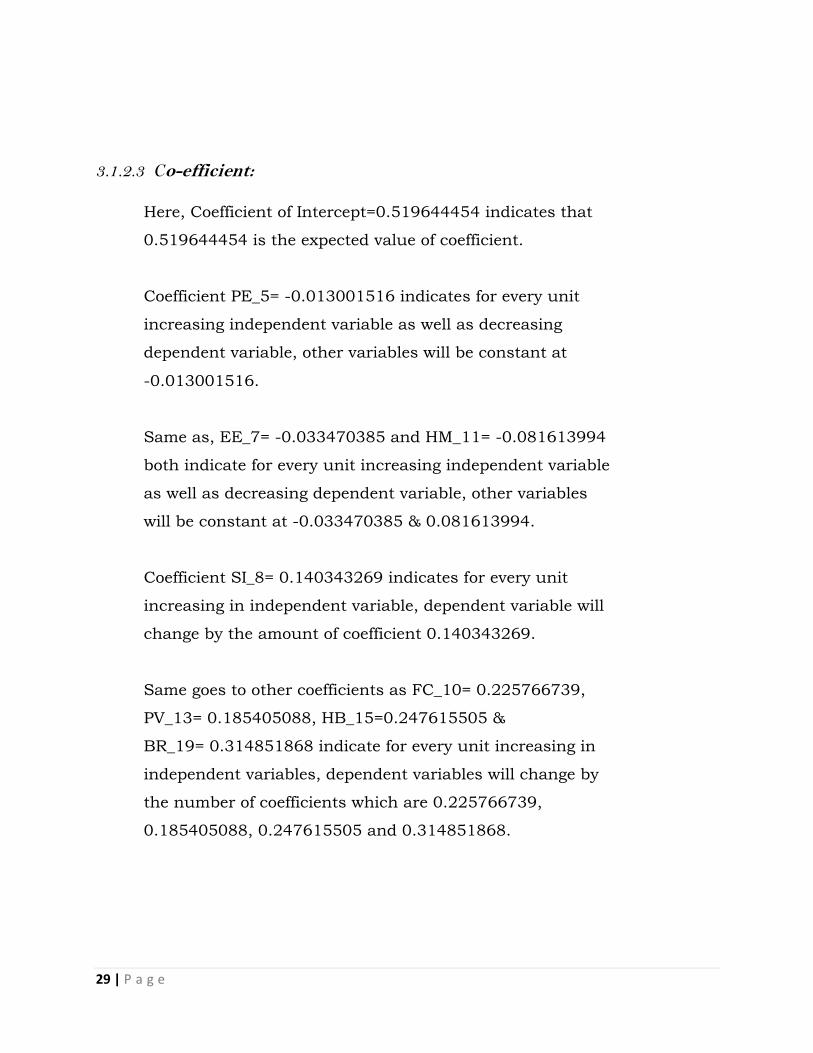
3.1.2.3 Co-efficient:
Here, Coefficient of Intercept=0.519644454 indicates that
0.519644454 is the expected value of coefficient.
Coefficient PE_5= -0.013001516 indicates for every unit
increasing independent variable as well as decreasing
dependent variable, other variables will be constant at
-0.013001516.
Same as, EE_7= -0.033470385 and HM_11= -0.081613994
both indicate for every unit increasing independent variable
as well as decreasing dependent variable, other variables
will be constant at -0.033470385 & 0.081613994.
Coefficient SI_8= 0.140343269 indicates for every unit
increasing in independent variable, dependent variable will
change by the amount of coefficient 0.140343269.
Same goes to other coefficients as FC_10= 0.225766739,
PV_13= 0.185405088, HB_15=0.247615505 &
BR_19= 0.314851868 indicate for every unit increasing in
independent variables, dependent variables will change by
the number of coefficients which are 0.225766739,
0.185405088, 0.247615505 and 0.314851868.

30 | P a g e
3.1.2.4 Standard Error:
Here, Standard Error of Intercept=0.409093571 indicates
that estimated intercept 0.409093571 is statistically
significant from specified value.
Standard Error of PE_5= 0.080113168, EE_7= 0.096573901,
SI_8= 0.075648842, FC_10= 0.115844033, HM_11= 0.06427,
PV_13= 0.08742842, HB_15= 0.082455485 & BR_19= 0.08831
indicate that these values are low standard error and all
sample mean within 8.0113168%, 9.6573901%, 7.5648842%,
11.5844033%, 6.4272957%, 8.742842%, 8.2455485%
& 8.8315416%.
3.1.2.5 t-stat:
Here, t -stat of intercept= 1.270234 indicates that sample
result is 1.270234 which is greater than zero and not equal
to null hypothesis.
t-stat of PE_5= -0.16229, EE_7= -0.34658 & HM_11= -1.2698
indicate that regression coefficient is less than hypothesized value
if t-values are -0.16229, -0.34658 and -1.2698.
t- stat of SI_8= 1.855194, FC_10= 1.948885, PV_13= 2.12065,
HB_15= 3.00302 and BR_19=3.565084 indicate that sample mean
is larger than hypothesized mean if t-values are 1.855194,
1.948885, 2.12065, 3.00302 and 3.565084.
31 | P a g e
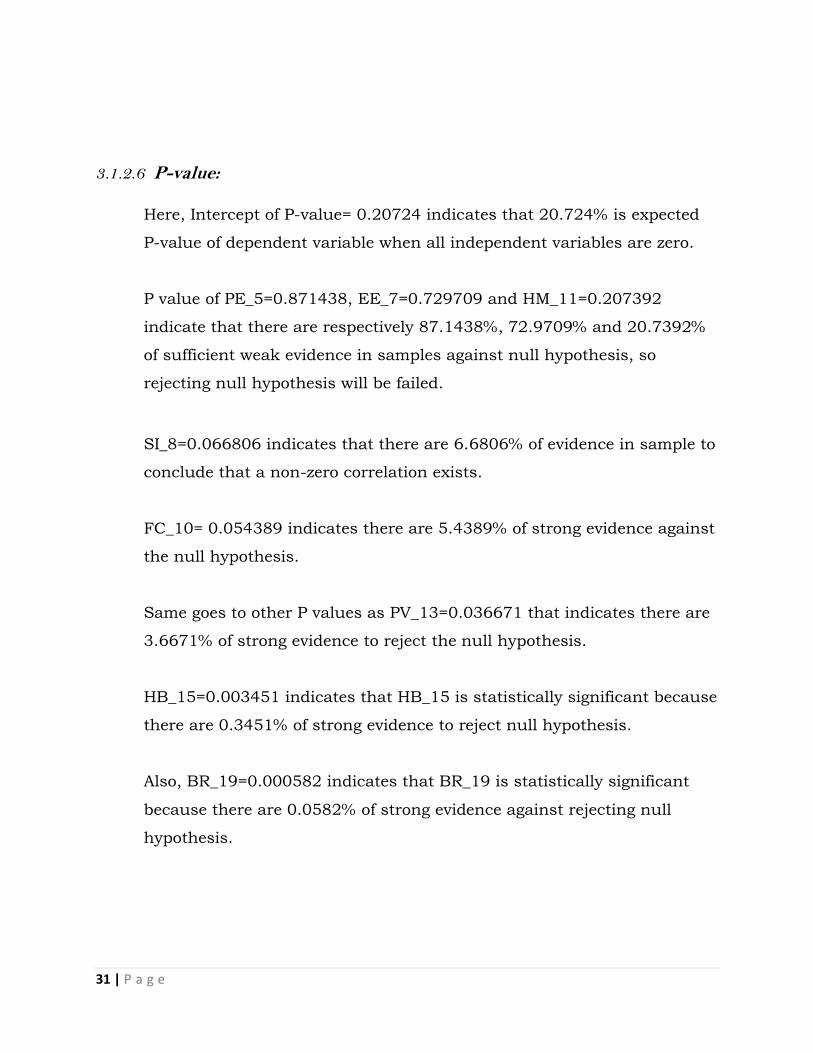
3.1.2.6 P-value:
Here, Intercept of P-value= 0.20724 indicates that 20.724% is expected
P-value of dependent variable when all independent variables are zero.
P value of PE_5=0.871438, EE_7=0.729709 and HM_11=0.207392
indicate that there are respectively 87.1438%, 72.9709% and 20.7392%
of sufficient weak evidence in samples against null hypothesis, so
rejecting null hypothesis will be failed.
SI_8=0.066806 indicates that there are 6.6806% of evidence in sample to
conclude that a non-zero correlation exists.
FC_10= 0.054389 indicates there are 5.4389% of strong evidence against
the null hypothesis.
Same goes to other P values as PV_13=0.036671 that indicates there are
3.6671% of strong evidence to reject the null hypothesis.
HB_15=0.003451 indicates that HB_15 is statistically significant because
there are 0.3451% of strong evidence to reject null hypothesis.
Also, BR_19=0.000582 indicates that BR_19 is statistically significant
because there are 0.0582% of strong evidence against rejecting null
hypothesis.

32 | P a g e
3.1.2.7 Lower 95%:
Here, Intercept of Lower 95%= -0.292969669 indicates that lower
confidence interval 0.292969669 is constant and negative and it is
smaller than alpha level which is 0.05.
SI_8= -0.009923863, FC_10= -0.0043432 & HM_11= -0.209284327
indicate lower confidence interval of 0.172136483, 0.225302576,
0.009923863, 0.0043432 & 0.209284327 are negative and smaller
than 0.05. In these cases, actual means are negative and sample is
large.
In Lower 95%, PV_13= 0.011739272, HB_15=0.083827814 &
BR_19=0.139424143 indicate that lower confidence interval of
0.011739272, 0.083827814 and 0.139424143 contain
population means.
3.1.2.8 Upper 95%:
Here, Intercept of Upper 95%= 1.332258577 indicates that
upper confidence interval is 1.332258577 and is greater than
alpha level which is 0.05.
Upper 95% of PE_5= 0.146133451, EE_7=0.158361806,
SI_8=0.2906104, FC_10= 0.455876679, PV_13= 0.359070904,
HB_15=0.411403196 & BR_19= 0.490279592 indicate that all upper
confidence intervals are greater than alpha level which is 0.05 &
HM_11=0.046056339 indicates upper confidence interval of
0.046056339 is lower than alpha level 0.05. In this case, 5% of
interval would not contain the population mean.

33 | P a g e
3.1.3 Regression Analysis for Y2:
Values of regression analysis are defined between Y2
which indicates level of agreement mentioned by following
statements in question no.18 and independent variables.
Independent variables are PE_5, EE_7, SI_8, FC_10, HM_11,
PV_13, HB_15 and BR_19 which indicate their level of
agreement with the following statements respectively in
question no.5, question no.7, question no.8, question no.10,
question no.11, question no.13, question no.15 &
question no.19.
34 | P a g e
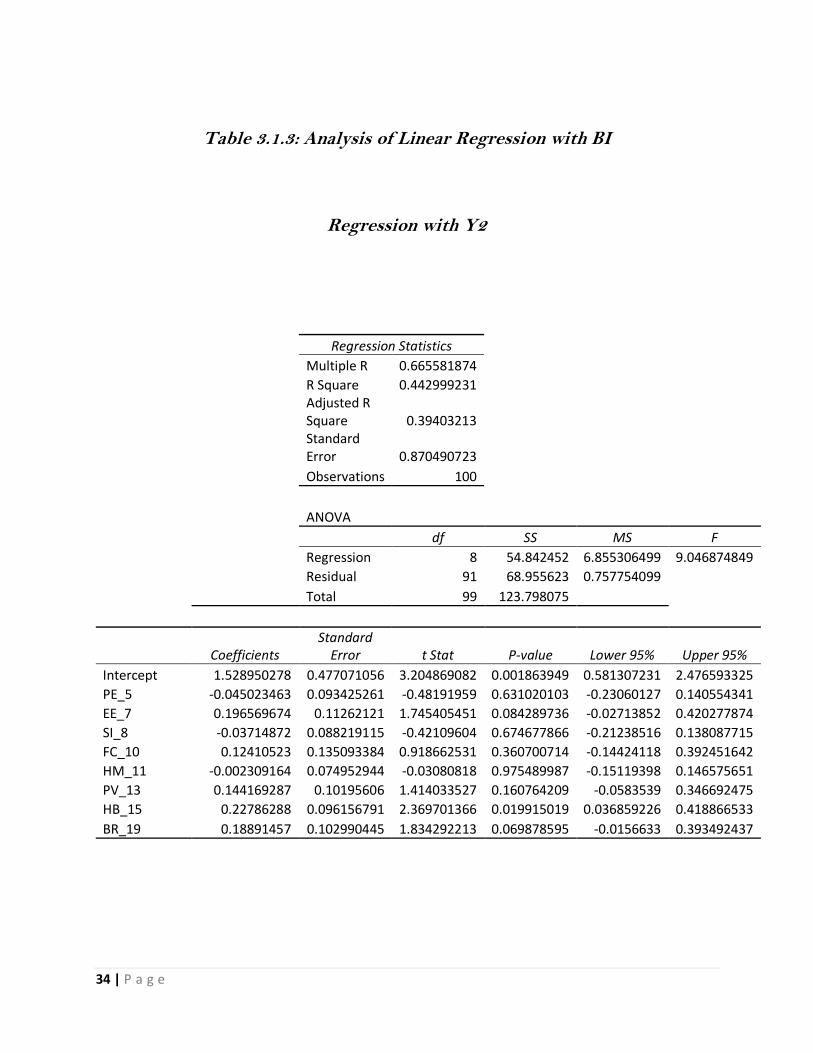
Table 3.1.3: Analysis of Linear Regression with BI
Regression with Y2
Regression Statistics
Multiple R 0.665581874
R Square 0.442999231
Adjusted R Square 0.39403213
Standard Error 0.870490723
Observations 100
ANOVA
df SS MS F
Regression 8 54.842452 6.855306499 9.046874849
Residual 91 68.955623 0.757754099
Total 99 123.798075
Coefficients Standard
Error t Stat P-value Lower 95% Upper 95% Intercept 1.528950278 0.477071056 3.204869082 0.001863949 0.581307231 2.476593325 PE_5 -0.045023463 0.093425261 -0.48191959 0.631020103 -0.23060127 0.140554341 EE_7 0.196569674 0.11262121 1.745405451 0.084289736 -0.02713852 0.420277874 SI_8 -0.03714872 0.088219115 -0.42109604 0.674677866 -0.21238516 0.138087715 FC_10 0.12410523 0.135093384 0.918662531 0.360700714 -0.14424118 0.392451642 HM_11 -0.002309164 0.074952944 -0.03080818 0.975489987 -0.15119398 0.146575651 PV_13 0.144169287 0.10195606 1.414033527 0.160764209 -0.0583539 0.346692475 HB_15 0.22786288 0.096156791 2.369701366 0.019915019 0.036859226 0.418866533 BR_19 0.18891457 0.102990445 1.834292213 0.069878595 -0.0156633 0.393492437

35 | P a g e
3.1.3.1 Regression Statistics:
Here, Multiple R= 0.665581874 indicates that there are 66.558%
positive relationship in linear regression analysis.
R Square= 0.442999231 indicates that a model explains 44.299%
of the variation in the response variable around its mean.
Adjusted R Square=0.39403213 indicates that the model explains
39.403213% of the variability of the respond data around its mean.
Standard Error= 0.870490723 indicates that all sample means will be
within 87.0490723% of population mean.
Observations= 100 means using 100 observations of the response
variables.
3.1.3.2 Anova Table:
In Regression, Degree of Freedom=8 indicates that there is 8th number
which is free to vary.
In Residual, Degree of Freedom=91 indicates highest number is 91 which
has more power to reject false null hypothesis and to find significant
result.
Total value is 99 which indicates values must sum to 99 based on
equation for the mean.

36 | P a g e
In Regression, Sum of Square (SS)= 54.842452 indicates that 54.842452
of variation are spread between each individual value and mean.
In Residual, Sum of Square (SS)= 68.955623 indicates that a model is
tight fit in 68.955623 points to the data.
Total Sum of Square=123.798075 indicates that there is 123.798075 of
variation in dependent variable.
In Regression, Mean Square (MS)= 6.8553065 indicates that estimated
value 6.8553065 is used to determine whether model is less significant.
In Residual, Mean Square= 0.7577541 indicates that difference between
variation and regression line points is 0.7577541.
F= 9.046874849 indicates that F statistic of at least 9.046874849 is
needed to reject the null hypothesis at an alpha level.
Significance F= 4.60282E-09 indicates that there are 4.60282E-09
probabilities that all the coefficients in regression output are actually
zero.
3.1.3.3 Co-efficient:
Here, Coefficient of Intercept= 1.52895 indicates that 1.52895
is the expected value of coefficient.
Coefficient PE_5= -0.045023463, SI_8= -0.03714872,
HM_11= -0.002309164 respectively indicate for every unit increasing
independent variable as well as decreasing dependent variable, other

37 | P a g e
variables will be constant at -0.045023463, -0.03714872 & -0.0023091.
EE_7= 0.196569674, FC_10= 0.12410523, PV_13= 0.144169287,
HB_15= 0.22786288 & BR_19= 0.18891457 respectively indicate for
every unit increasing independent variable as well as increasing
dependent variable, other variables will be constant at 0.196569674,
0.12410523, 0.144169287, 0.22786288 & 0.18891457.
3.1.3.4 Standard Error:
Here, Standard Error of Intercept= 0.477071056 indicates that estimated
intercept 0.477071056 is statistically significant from specified value.
Standard Error of PE_5=0.093425261, EE_7=0.11262121,
SI_8= 0.088219115, FC_10= 0.135093384, HM_11= 0.074952944,
PV_13= 0.10195606, HB_15= 0.096156791 & BR_19= 0.102990445
respectively indicate these values are low standard error & all sample
mean within 9.3425261%, 11.262121%, 8.8219115%, 13.5093384%,
7.4952944%, 10.195606%, 9.6156791% & 10.2990445%.
3.1.3.5 t-stat:
Here, t-stat of intercept= 3.204869082 indicates that sample result is
3.204869082 which is greater than zero and not equal to null hypothesis.
t-stat of PE_5= -0.481919588 , SI_8= -0.421096041 &
HM_11= -0.030808178 respectively indicate that regression coefficient
is less than hypothesized value if t-values are -0.481919588,
-0.421096041 & -0.030808178 and t-stat of EE_7= 1.745405451,
FC_10= 0.918662531, PV_13= 1.414033527, HB_15= 2.369701366

38 | P a g e
& BR_19=1.834292213 respectively all indicate that sample mean is
larger than hypothesized mean if t-values are 1.745405451,
0.918662531, 1.414033527, 2.369701366 & 1.834292213.
3.1.3.6 P-value:
Here, Intercept of P-value= 0.001863949 indicates that 0.1863949% is
expected P-value of dependent variable when all independent variables
are zero.
P value of PE_5=0.631020103, SI_8= 0.674677866,FC_10=0.360700714,
HM_11=0.975489987, PV_13= 0.160764209 respectively indicate that
there are respectively 63.1020103%, 67.4677866%, 36.0700714,
97.5489987% & 16.0764209% sufficient weak evidence in
samples against null hypothesis, so rejecting null hypothesis
will be failed.
EE_7=0.084289736 indicates that there are 8.4289736% of
evidence in sample to conclude that a non-zero correlation exists.
HB_15= 0.019915019 indicates there are 1.9915019% fewest strong
evidence against the null hypothesis.
Also, BR_19= 0.069878595 indicates that BR_19 is statistically
significant because there are 6.9878595% few strong evidences against
rejecting null hypothesis.
39 | P a g e
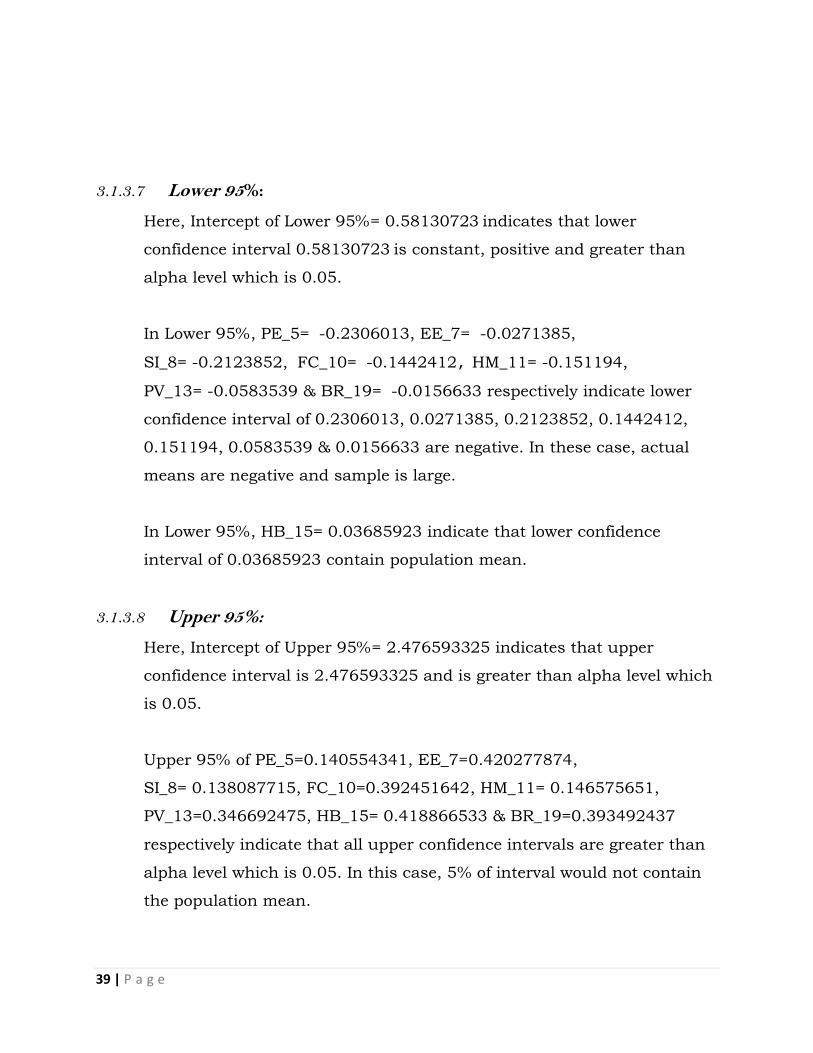
3.1.3.7 Lower 95%:
Here, Intercept of Lower 95%= 0.58130723 indicates that lower
confidence interval 0.58130723 is constant, positive and greater than
alpha level which is 0.05.
In Lower 95%, PE_5= -0.2306013, EE_7= -0.0271385,
SI_8= -0.2123852, FC_10= -0.1442412, HM_11= -0.151194,
PV_13= -0.0583539 & BR_19= -0.0156633 respectively indicate lower
confidence interval of 0.2306013, 0.0271385, 0.2123852, 0.1442412,
0.151194, 0.0583539 & 0.0156633 are negative. In these case, actual
means are negative and sample is large.
In Lower 95%, HB_15= 0.03685923 indicate that lower confidence
interval of 0.03685923 contain population mean.
3.1.3.8 Upper 95%:
Here, Intercept of Upper 95%= 2.476593325 indicates that upper
confidence interval is 2.476593325 and is greater than alpha level which
is 0.05.
Upper 95% of PE_5=0.140554341, EE_7=0.420277874,
SI_8= 0.138087715, FC_10=0.392451642, HM_11= 0.146575651,
PV_13=0.346692475, HB_15= 0.418866533 & BR_19=0.393492437
respectively indicate that all upper confidence intervals are greater than
alpha level which is 0.05. In this case, 5% of interval would not contain
the population mean.

40 | P a g e
Chapter-4: Discussion
The findings of the data analysis are summarized in Table 4.1 & 4.2:
Table 4.1: Summary of findings with Y1 (GI)
Y1
Variables
Correlation
Results
Regression
Result
(P value</=0.10)
PE_5
+
No Significant
Related
EE_7
+
No Significant
Related
SI_8
+
+
FC_10
+
+
HM_11
+
No Significant
Related
PV_13
+
+
HB_15
+
+
BR_19
+
+
41 | P a g e
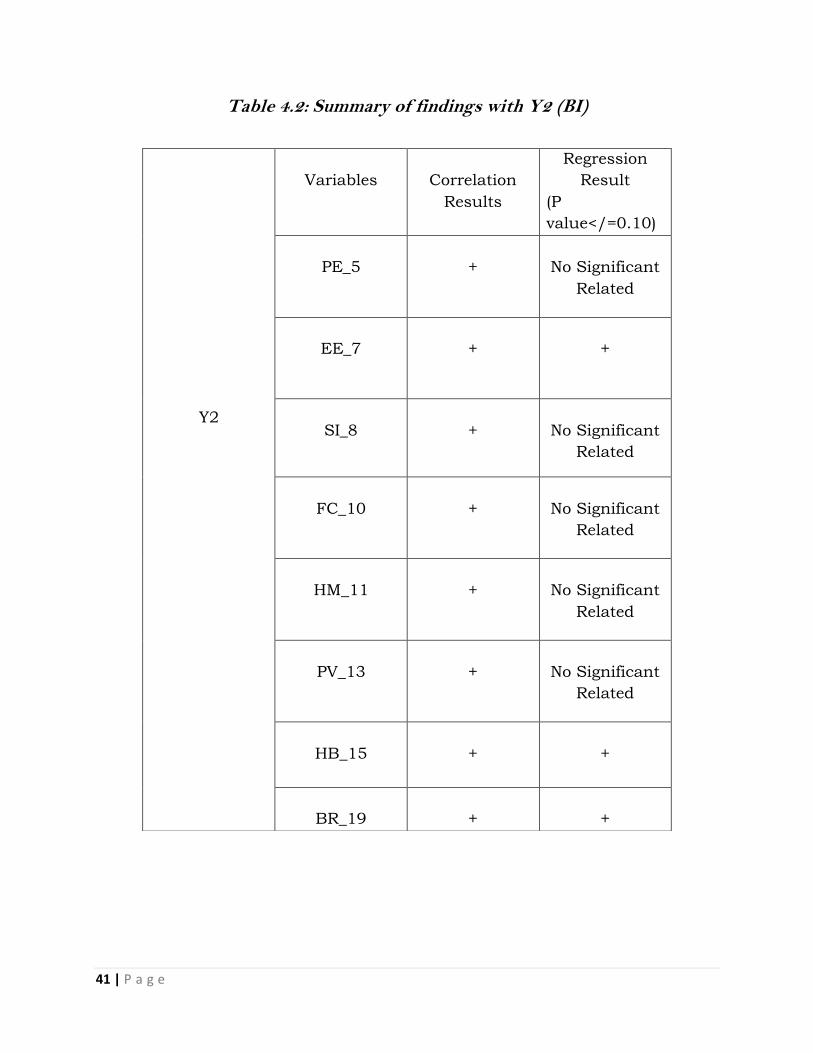
Table 4.2: Summary of findings with Y2 (BI)
Y2
Variables
Correlation
Results
Regression
Result
(P
value</=0.10)
PE_5
+
No Significant
Related
EE_7
+
+
SI_8
+
No Significant
Related
FC_10
+
No Significant
Related
HM_11
+
No Significant
Related
PV_13
+
No Significant
Related
HB_15
+
+
BR_19
+
+
42 | P a g e
4.1.1 Efficiency of using mobile banking services:
In Table 4.1.2 we see that, regression result of EE_7 is positive
which is summarized with Y2 that means learning about how to
use mobile banking services is becoming very easy for user,
user’s interaction with mobile banking services is becoming
clearer and understandable, finding mobile banking services
are easier to use for user & it is easier for user to become very
skillful at using mobile banking services.
4.1.2 Importance of using mobile banking services:
In Table 4.1.1 we see that, regression result of SI_8 is
positive which is summarized with Y1 that means people who
are important think more that user should use mobile
banking services, people influence more to user so that he
uses mobile banking services & using mobile banking
services become status symbol in environment.
4.1.3 Technological materials for using mobile banking services:
In Table 4.1.1 we see that, regression result of FC_10 is
positive which is summarized with Y1 that means user have
more resources which are more necessary to use mobile
banking services, user have more knowledge which are more
necessary to use mobile banking services, mobile banking is
more compatible with other technologies that user uses & user
can get more help from others when user have difficulties using
mobile banking services.
43 | P a g e
4.1.4 Valuation for evaluate mobile banking services:
In Table 4.1.1 we see that, regression result of PV_13 is
positive which is summarized with Y1 that states mobile
banking services are cheaper priced, mobile banking services
are cheaper priced compared with other banking channels,
mobile banking services are a better value for the money & at
the current price, mobile banking services provide a better
value.
4.1.5 Practice for using mobile banking services:
In Table 4.1.1 & 4.1.2 we see that, regression results of
HB_15 is positive in both cases which is summarized with
both Y1 & Y2.
Here, Y1 is mentioned as GI. In GI, HB_15 is positive that
states the use of mobile banking services has become much
addiction for user, user is much addicted to using mobile
banking services, user must use mobile banking services
more & using mobile banking has become very natural to
user.
Y2 is mentioned as BI. In BI, HB_15 is also positive that
means the use of mobile banking services has become
popular for user, user is used to using mobile banking
services, user must use mobile banking services daily &
using mobile banking has become passion to user.
44 | P a g e
4.1.6 Milestones achieving by mobile banking services:
In Table 4.1.1 & 4.1.2 we see that, regression results of BR_19
is positive in both cases which is summarized with both Y1 &
Y2.
Here, Y1 is mentioned as GI. In GI, BR_19 is positive that
means the mobile banking service user uses is very well
known, the mobile banking service user uses is bigger leading
service in user’s country, the mobile banking service user uses
is much reputable & the mobile banking service user uses is
much easily recognizable.
Y2 is mentioned as BI. In BI, BR_19 is positive that means the
mobile banking service user uses is much famous, the mobile
banking service user uses is the greatest leading service in
user’s country, the mobile banking service user uses is widely
reputable & the mobile banking service user uses is easily
recognizable as open eye.
45 | P a g e
Chapter-5: Conclusion & Recommendation
5.1 Conclusion: Finally, it can be said that people are getting more benefit by
using mobile banking services. In future, mobile banking services will
become highly renowned & reputable services in Bangladesh.
5.2 Recommendation: Mobile banking services are highly recommended for
policy makers, organizations which provide mobile banking services to
customers like people & students. These organizations create marketing
plan based on usage of mobile banking services to attract customers.
46 | P a g e
Usage of mobile banking services - Anonymous survey https://docs.google.com/forms/d/1lRNBvBI1xWrsoet-VPs8vqTvqDU...
Appendix-1:
Usage of mobile banking services- Anonymous survey
This anonymous survey is part of an academic study on the usage of mobile banking
services in Bangladesh. Your valuable responses will be used entirely for the knowledge
development purpose and your personal information (if any) will never be revealed to any
other person or organization.
* Required
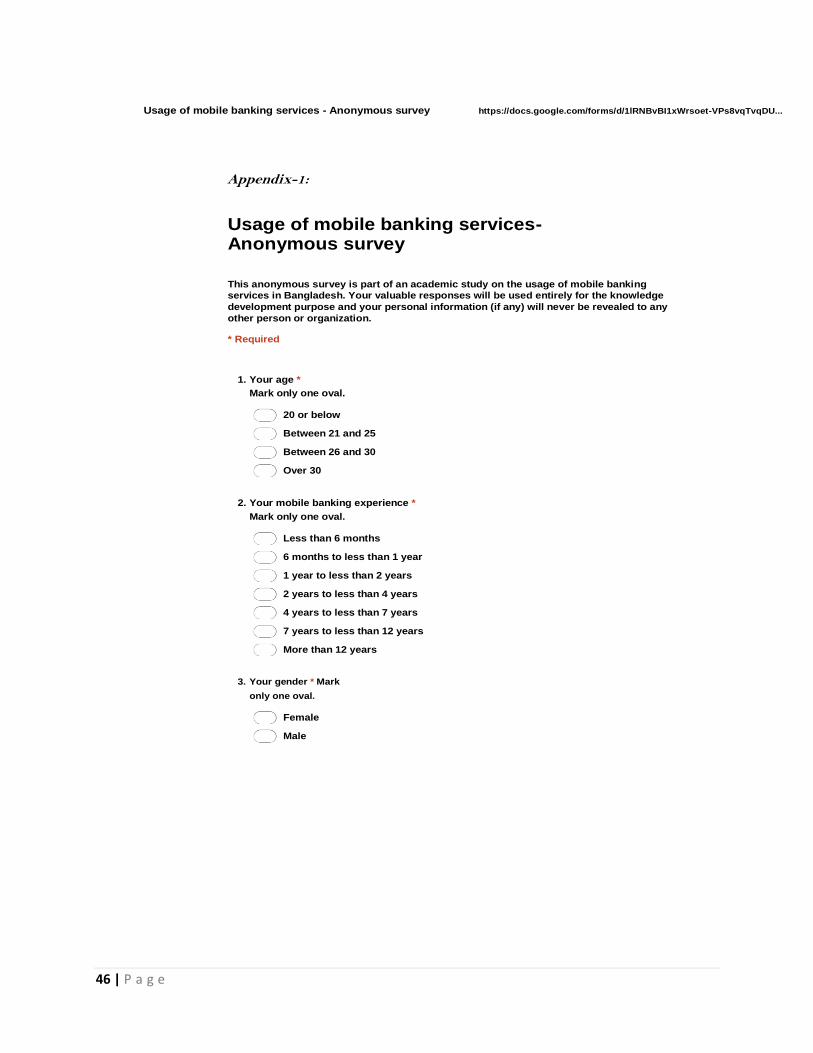
1. Your age *
Mark only one oval.
20 or below
Between 21 and 25
Between 26 and 30
Over 30
2. Your mobile banking experience *
Mark only one oval.
Less than 6 months
6 months to less than 1 year
1 year to less than 2 years
2 years to less than 4 years
4 years to less than 7 years
7 years to less than 12 years
More than 12 years
3. Your gender * Mark
only one oval.
Female
Male

47 | P a g e
Usage of mobile banking services - Anonymous survey https://docs.google.com/forms/d/1lRNBvBI1xWrsoet-VPs8vqTvqDU...
4. What is your actual frequency of use of mobile banking services? (UB) *
Mark only one oval.
Have not used yet
Once in a year
Once in six months
Once in three months
Once in a month
Once in a week
Once in 4-5 days
Once in 2-3 days
Almost every day
Every day
Several times a day
5. Please indicate your level of agreement with the following statements (PE) *
Mark only one oval per row.
Strongly
Somewhat Neither
Somewhat
Strongly Disagree agree or Agree Disagree Disagree disagree agree Agree
I find mobile banking services useful in my daily life. Using mobile banking services increases my productivity. Using mobile banking services helps me accomplish things more quickly. Using mobile banking services increases my chances of achieving things that are important to me.
6. Your major area of study *
Mark only one oval.
Human Resource Management
Marketing
Accounting
Finance
Haven't decided yet
48 | P a g e
Usage of mobile banking services - Anonymous survey https://docs.google.com/forms/d/1lRNBvBI1xWrsoet-VPs8vqTvqDU...
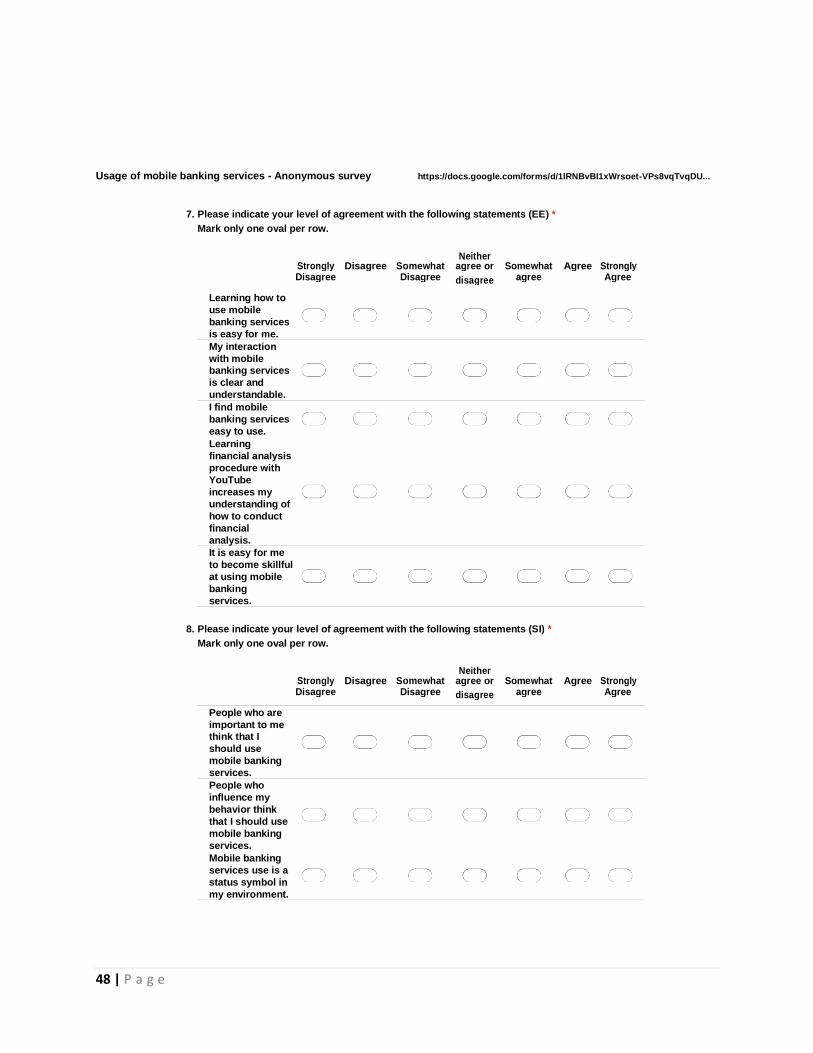
7. Please indicate your level of agreement with the following statements (EE) *
Mark only one oval per row.
Strongly
Somewhat Neither
Somewhat
Strongly Disagree agree or Agree Disagree Disagree disagree agree Agree
Learning how to use mobile banking services is easy for me. My interaction with mobile banking services is clear and understandable. I find mobile banking services easy to use. Learning financial analysis procedure with YouTube increases my understanding of how to conduct financial analysis. It is easy for me to become skillful at using mobile banking services.
8. Please indicate your level of agreement with the following statements (SI) *
Mark only one oval per row.
Strongly
Somewhat Neither
Somewhat
Strongly Disagree agree or Agree Disagree Disagree disagree agree Agree
People who are important to me think that I should use mobile banking services. People who influence my behavior think that I should use mobile banking services. Mobile banking services use is a status symbol in my environment.
49 | P a g e
Usage of mobile banking services - Anonymous survey https://docs.google.com/forms/d/1lRNBvBI1xWrsoet-VPs8vqTvqDU...
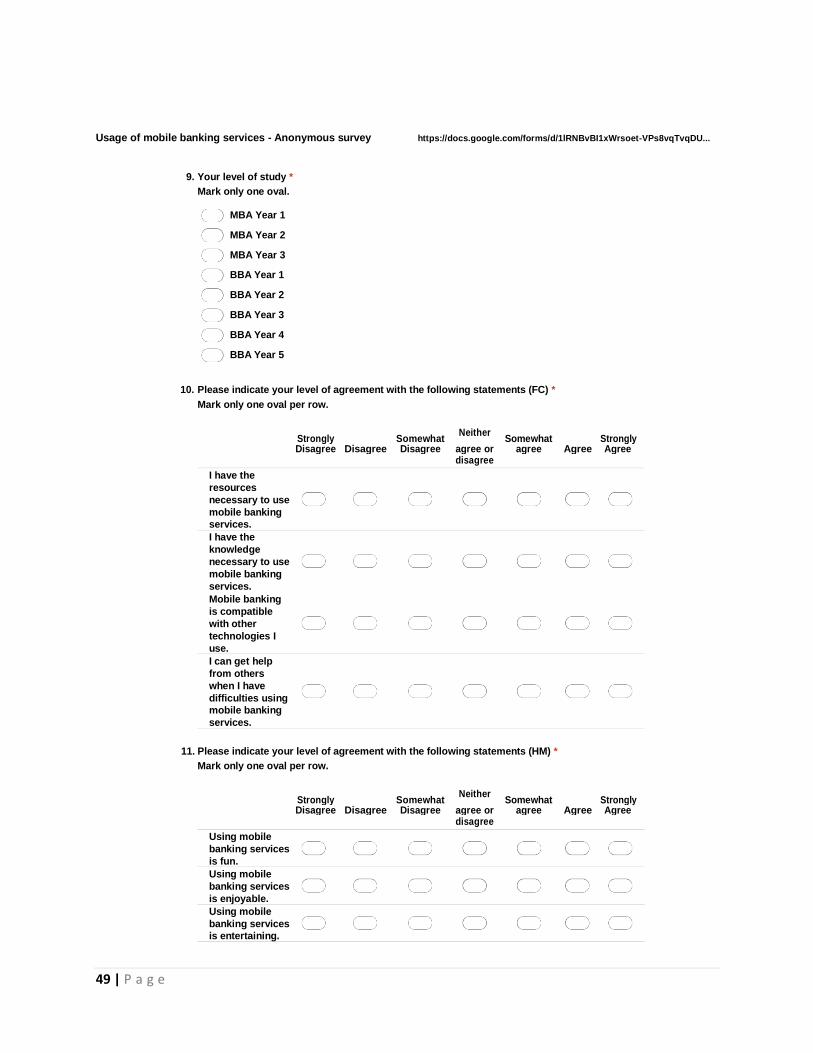
9. Your level of study *
Mark only one oval.
MBA Year 1
MBA Year 2
MBA Year 3
BBA Year 1
BBA Year 2
BBA Year 3
BBA Year 4
BBA Year 5
10. Please indicate your level of agreement with the following statements (FC) *
Mark only one oval per row.
Strongly
Somewhat Neither
Somewhat
Strongly Disagree agree or Agree Disagree Disagree agree Agree
disagree I have the resources necessary to use mobile banking services. I have the knowledge necessary to use mobile banking services. Mobile banking is compatible with other technologies I use. I can get help from others when I have difficulties using mobile banking services.
11. Please indicate your level of agreement with the following statements (HM) *
Mark only one oval per row.
Strongly
Somewhat Neither
Somewhat
Strongly Disagree agree or Agree Disagree Disagree agree Agree
disagree Using mobile banking services is fun. Using mobile banking services is enjoyable. Using mobile banking services is entertaining.

50 | P a g e
Usage of mobile banking services - Anonymous survey https://docs.google.com/forms/d/1lRNBvBI1xWrsoet-VPs8vqTvqDU...
12. Are you a university student? *
Mark only one oval.
Yes
No
13. Please indicate your level of agreement with the following statements (PV) *
Mark only one oval per row.
Strongly
Somewhat Neither
Somewhat
Strongly Disagree agree or Agree Disagree Disagree disagree agree Agree
Mobile banking services are reasonably priced. Mobile banking services are reasonably priced compared with other banking channels. Mobile banking services are a good value for the money. At the current price, mobile banking services provide a good value.
14. Your area of higher secondary (HSC) education. *
Mark only one oval.
Science
Commerce
Arts/humanities
Alim
Vocational
Other
51 | P a g e
Usage of mobile banking services - Anonymous survey https://docs.google.com/forms/d/1lRNBvBI1xWrsoet-VPs8vqTvqDU...
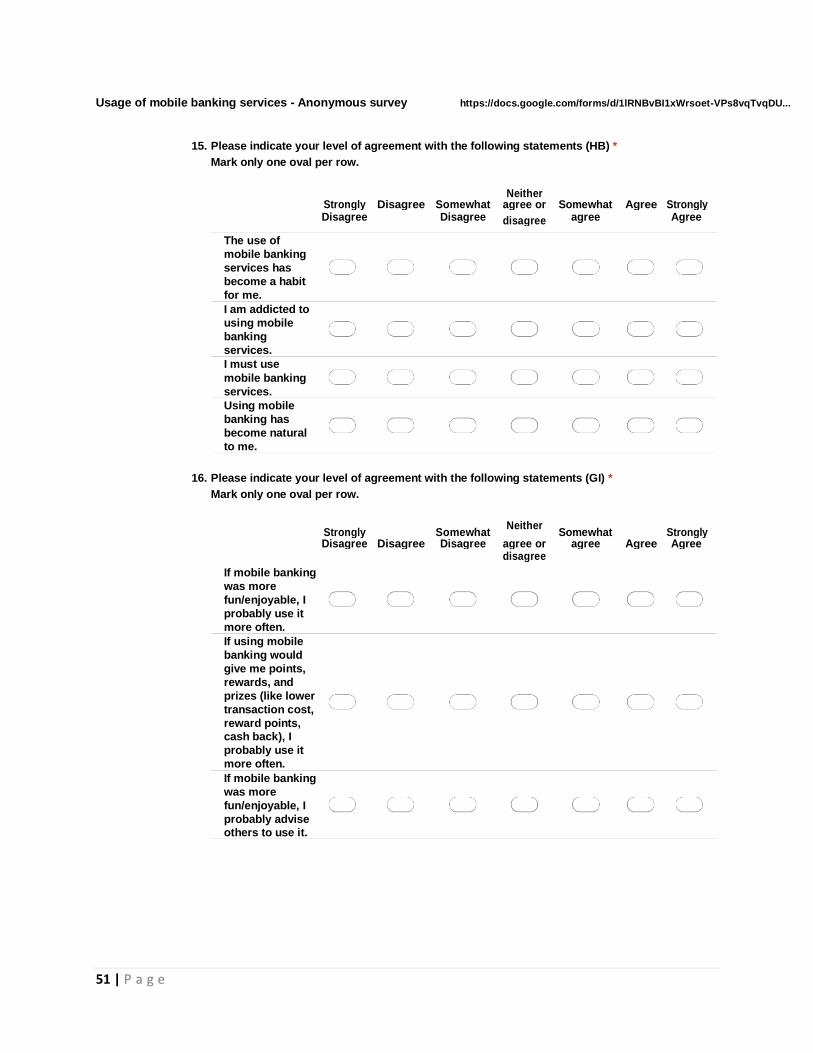
15. Please indicate your level of agreement with the following statements (HB) *
Mark only one oval per row.
Strongly
Somewhat Neither
Somewhat
Strongly Disagree agree or Agree Disagree Disagree disagree agree Agree
The use of mobile banking services has become a habit for me. I am addicted to using mobile banking services. I must use mobile banking services. Using mobile banking has become natural to me.
16. Please indicate your level of agreement with the following statements (GI) *
Mark only one oval per row.
Strongly
Somewhat Neither
Somewhat
Strongly Disagree agree or Agree Disagree Disagree agree Agree
disagree If mobile banking was more fun/enjoyable, I probably use it more often. If using mobile banking would give me points, rewards, and prizes (like lower transaction cost, reward points, cash back), I probably use it more often. If mobile banking was more fun/enjoyable, I probably advise others to use it.
52 | P a g e
Usage of mobile banking services - Anonymous survey https://docs.google.com/forms/d/1lRNBvBI1xWrsoet-VPs8vqTvqDU...
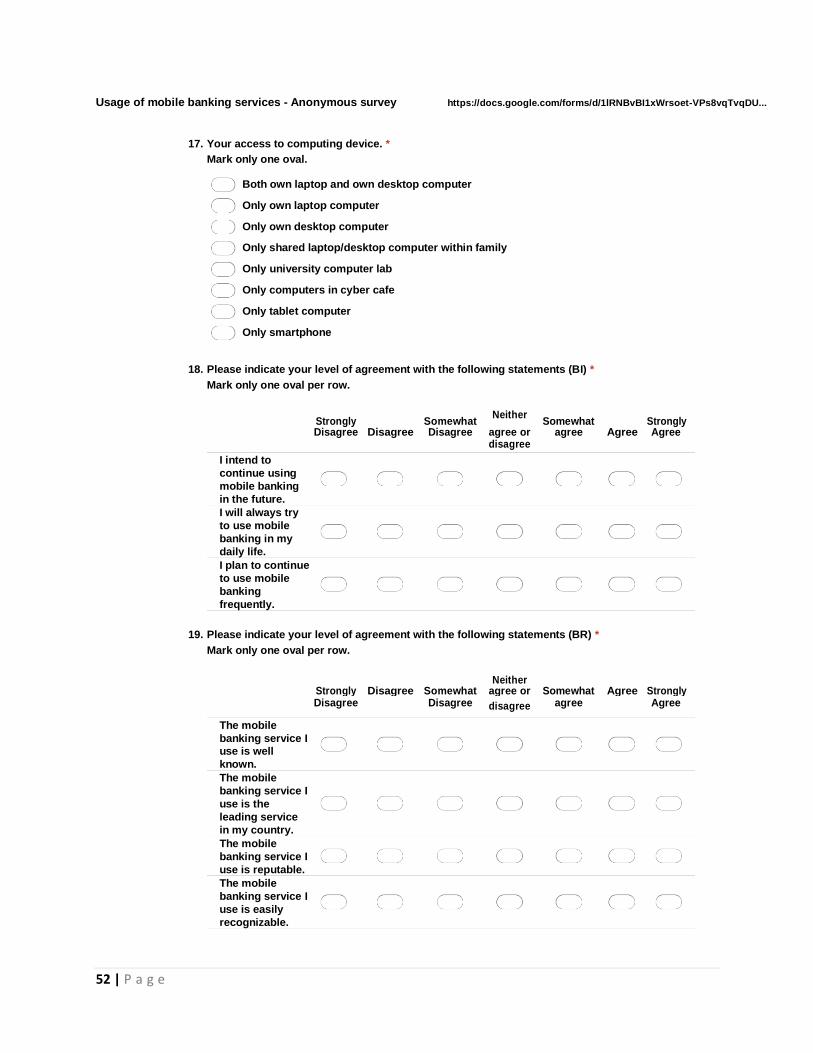
17. Your access to computing device. *
Mark only one oval.
Both own laptop and own desktop computer
Only own laptop computer
Only own desktop computer
Only shared laptop/desktop computer within family
Only university computer lab
Only computers in cyber cafe
Only tablet computer
Only smartphone
18. Please indicate your level of agreement with the following statements (BI) *
Mark only one oval per row.
Strongly
Somewhat Neither
Somewhat
Strongly Disagree agree or Agree Disagree Disagree agree Agree
disagree I intend to continue using mobile banking in the future. I will always try to use mobile banking in my daily life. I plan to continue to use mobile banking frequently.
19. Please indicate your level of agreement with the following statements (BR) *
Mark only one oval per row.
Strongly
Somewhat Neither
Somewhat
Strongly Disagree agree or Agree Disagree Disagree disagree agree Agree
The mobile banking service I use is well known. The mobile banking service I use is the leading service in my country. The mobile banking service I use is reputable. The mobile banking service I use is easily recognizable.

53 | P a g e
Usage of mobile banking services - Anonymous survey https://docs.google.com/forms/d/1lRNBvBI1xWrsoet-VPs8vqTvqDU...
20. Your religion *
Mark only one oval.
Islam
Other or I prefer not to answer
54 | P a g e
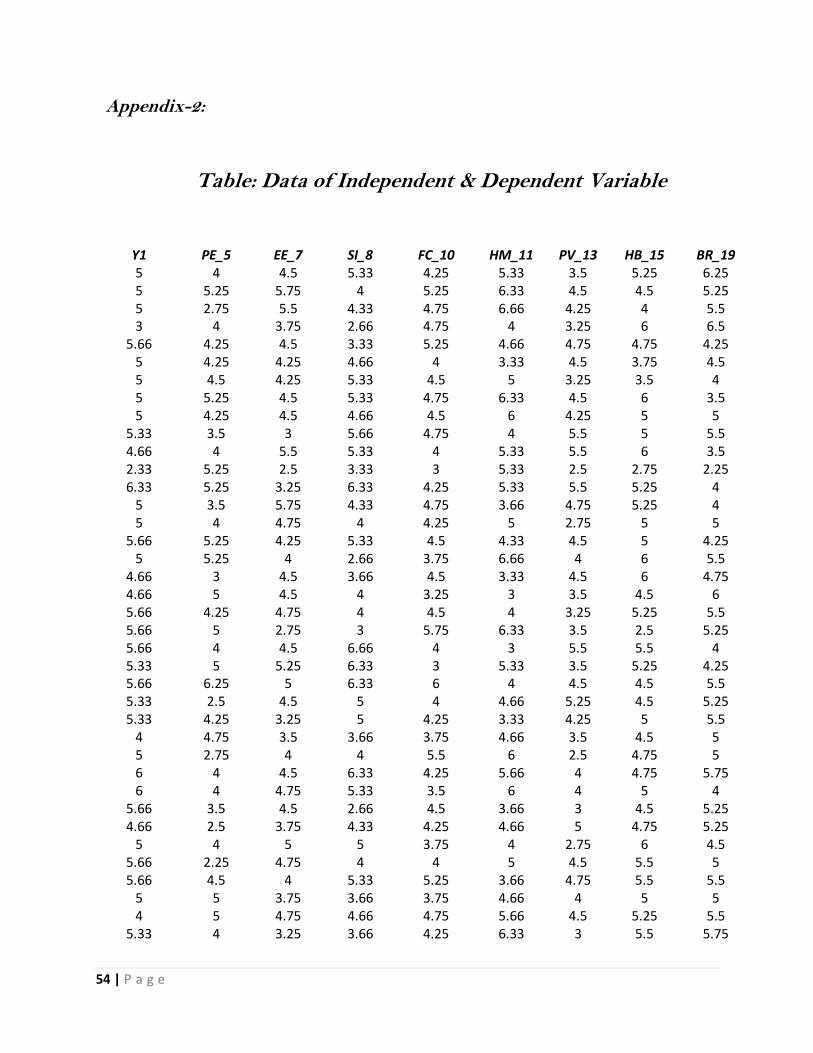
Appendix-2:
Table: Data of Independent & Dependent Variable
Y1 PE_5 EE_7 SI_8 FC_10 HM_11 PV_13 HB_15 BR_19 5 4 4.5 5.33 4.25 5.33 3.5 5.25 6.25 5 5.25 5.75 4 5.25 6.33 4.5 4.5 5.25 5 2.75 5.5 4.33 4.75 6.66 4.25 4 5.5 3 4 3.75 2.66 4.75 4 3.25 6 6.5
5.66 4.25 4.5 3.33 5.25 4.66 4.75 4.75 4.25 5 4.25 4.25 4.66 4 3.33 4.5 3.75 4.5 5 4.5 4.25 5.33 4.5 5 3.25 3.5 4 5 5.25 4.5 5.33 4.75 6.33 4.5 6 3.5 5 4.25 4.5 4.66 4.5 6 4.25 5 5
5.33 3.5 3 5.66 4.75 4 5.5 5 5.5 4.66 4 5.5 5.33 4 5.33 5.5 6 3.5 2.33 5.25 2.5 3.33 3 5.33 2.5 2.75 2.25 6.33 5.25 3.25 6.33 4.25 5.33 5.5 5.25 4
5 3.5 5.75 4.33 4.75 3.66 4.75 5.25 4 5 4 4.75 4 4.25 5 2.75 5 5
5.66 5.25 4.25 5.33 4.5 4.33 4.5 5 4.25 5 5.25 4 2.66 3.75 6.66 4 6 5.5
4.66 3 4.5 3.66 4.5 3.33 4.5 6 4.75 4.66 5 4.5 4 3.25 3 3.5 4.5 6 5.66 4.25 4.75 4 4.5 4 3.25 5.25 5.5 5.66 5 2.75 3 5.75 6.33 3.5 2.5 5.25 5.66 4 4.5 6.66 4 3 5.5 5.5 4 5.33 5 5.25 6.33 3 5.33 3.5 5.25 4.25 5.66 6.25 5 6.33 6 4 4.5 4.5 5.5 5.33 2.5 4.5 5 4 4.66 5.25 4.5 5.25 5.33 4.25 3.25 5 4.25 3.33 4.25 5 5.5
4 4.75 3.5 3.66 3.75 4.66 3.5 4.5 5 5 2.75 4 4 5.5 6 2.5 4.75 5 6 4 4.5 6.33 4.25 5.66 4 4.75 5.75 6 4 4.75 5.33 3.5 6 4 5 4
5.66 3.5 4.5 2.66 4.5 3.66 3 4.5 5.25 4.66 2.5 3.75 4.33 4.25 4.66 5 4.75 5.25
5 4 5 5 3.75 4 2.75 6 4.5 5.66 2.25 4.75 4 4 5 4.5 5.5 5 5.66 4.5 4 5.33 5.25 3.66 4.75 5.5 5.5
5 5 3.75 3.66 3.75 4.66 4 5 5 4 5 4.75 4.66 4.75 5.66 4.5 5.25 5.5
5.33 4 3.25 3.66 4.25 6.33 3 5.5 5.75

55 | P a g e
4 4.5 4 3.66 3.5 4 4 2.25 3.75 4.33 5 6 5.33 4.25 3 3.5 5.25 4.75 5.66 3.75 5.25 2.33 4.5 3 6 5.75 4.75 5.66 5 5 3.66 4.25 6.33 4 4.25 5.25 6.33 1.5 1.5 2.66 2.5 1 2.75 5.25 5.5
6 5 5.25 5 5.5 5.66 4.25 5.25 6.75 6 5.5 5.5 6.33 5 5.33 5.5 5.25 3
5.33 4.5 5.25 3.66 5.25 5 3.5 6 4.5 5 4.5 5 5.66 5.25 4.33 6.25 5.25 5.5
5.33 6 5.5 5.33 4.75 3 3.75 5 5.5 6 5.5 6 2 6 2.66 5.5 4 6
6.66 6.5 6.25 4.33 6.5 5.33 6 6.75 6.5 7 4 3.75 7 5.5 7 6.75 4 6 7 6.25 5.5 6 7 6 2.5 5.5 7
4.66 6 3.75 4 6.25 7 5.5 2 5.75 6 5.5 4.25 4.66 5.5 3 5.25 4.75 6
5.66 4.5 4 3.66 5.5 1.66 4.5 4 6.25 4 4.25 6 3.66 5.5 2.66 5.5 4 4.75 3 1.75 2 3 3 2.66 2 3.25 4.25
2.66 2 1.75 2 2.75 3 1.75 3.25 3 3 2.75 2.5 3 2.25 2 2.25 2.75 3
2.66 2.25 2.75 2.66 2.5 3 2.75 3.5 3.5 3 2 2.25 3 2.5 2.66 2.25 3.25 3.5
3.66 1.75 1.75 2 1.75 3 2.5 2.5 5 4.33 1 1.5 3 2.5 3 2 3.25 4
3 3 2.25 3 2.5 3 2.25 3.25 3.5 3 2 2 2 2 2 2 3 3.5
6.33 6.25 6.5 7 6.75 7 6.5 6.5 6.75 6 6.25 6.75 6.33 7 6 7 4 6 6 6.75 4.5 6 5.75 4.66 5.75 4.5 5.75
3.33 2.75 3 2.33 3.25 3 2.25 3.5 4 3.66 2.25 3.5 2.66 2.5 3 2.5 4.5 5.25 4.33 4.75 2.75 4.33 3 2.66 1.75 3.5 4.75 5.33 1.75 2.75 3.66 3.5 2.66 2.25 3.75 3.5 4.33 4.5 3.25 2 2.75 3 3.25 3.5 4.25
4 4.25 2.5 3 2.75 1.66 2.75 3.5 3.25 3.33 3.25 4 3.66 2.5 4 2.75 4.75 2 4.66 2 2.5 2.66 3.5 3.66 3.25 3.25 3.25
5 3.25 2.75 2.66 2.75 2 2 4.75 3.75 4.33 1.75 3.5 2.66 2.5 3.66 3 4 4 4.33 2.75 4.5 2.66 2 4 3.5 3.75 3.75 4.66 2.75 3.75 2 3.75 3.66 2 4.75 4.75 3.33 2.5 4.25 4 4 4.66 2.25 6 2 4.66 4 3.5 3.33 4.5 3 3.25 3.75 5.5 4.33 5.25 3.25 4 4.5 4.33 4.25 4.5 4.5 2.33 2.75 2.75 4.66 3.5 5 2.5 2.75 3.5
4 2.25 3.75 4.66 3 6 2.5 5 4.25 4 4 2.75 2.66 3.75 2.66 2.25 4.5 4.25
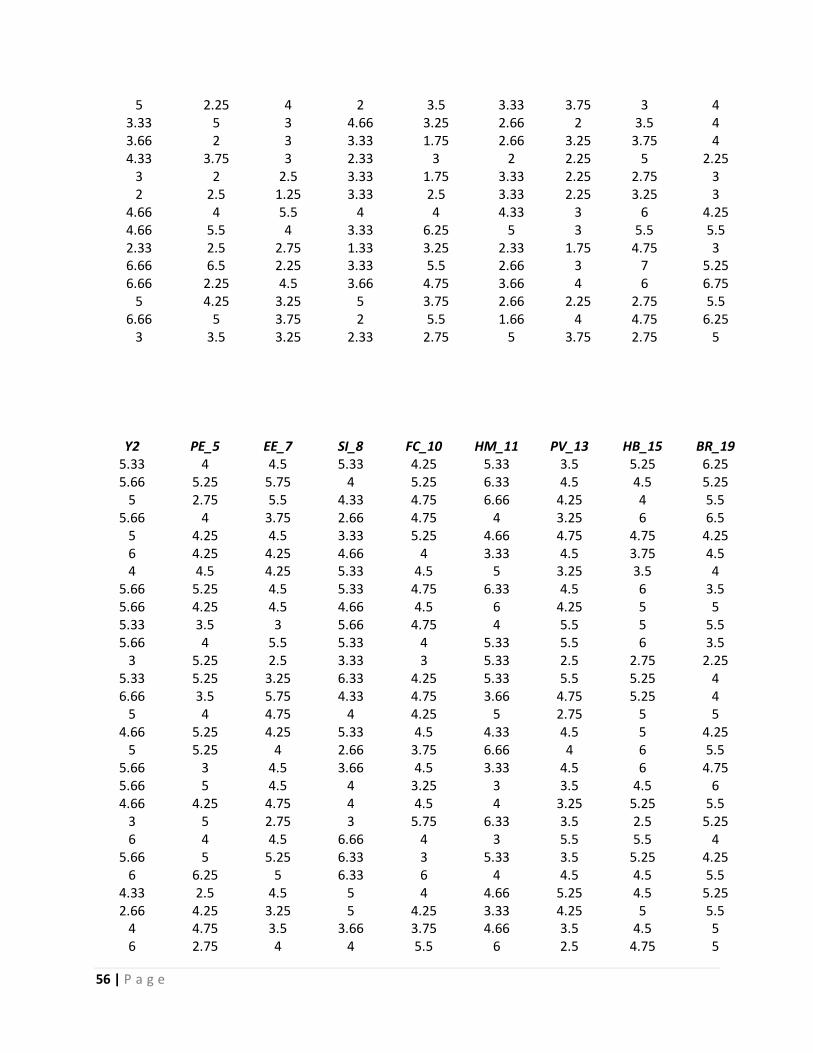
56 | P a g e
5 2.25 4 2 3.5 3.33 3.75 3 4 3.33 5 3 4.66 3.25 2.66 2 3.5 4 3.66 2 3 3.33 1.75 2.66 3.25 3.75 4 4.33 3.75 3 2.33 3 2 2.25 5 2.25
3 2 2.5 3.33 1.75 3.33 2.25 2.75 3 2 2.5 1.25 3.33 2.5 3.33 2.25 3.25 3
4.66 4 5.5 4 4 4.33 3 6 4.25 4.66 5.5 4 3.33 6.25 5 3 5.5 5.5 2.33 2.5 2.75 1.33 3.25 2.33 1.75 4.75 3 6.66 6.5 2.25 3.33 5.5 2.66 3 7 5.25 6.66 2.25 4.5 3.66 4.75 3.66 4 6 6.75
5 4.25 3.25 5 3.75 2.66 2.25 2.75 5.5 6.66 5 3.75 2 5.5 1.66 4 4.75 6.25
3 3.5 3.25 2.33 2.75 5 3.75 2.75 5
Y2 PE_5 EE_7 SI_8 FC_10 HM_11 PV_13 HB_15 BR_19 5.33 4 4.5 5.33 4.25 5.33 3.5 5.25 6.25 5.66 5.25 5.75 4 5.25 6.33 4.5 4.5 5.25
5 2.75 5.5 4.33 4.75 6.66 4.25 4 5.5 5.66 4 3.75 2.66 4.75 4 3.25 6 6.5
5 4.25 4.5 3.33 5.25 4.66 4.75 4.75 4.25 6 4.25 4.25 4.66 4 3.33 4.5 3.75 4.5 4 4.5 4.25 5.33 4.5 5 3.25 3.5 4
5.66 5.25 4.5 5.33 4.75 6.33 4.5 6 3.5 5.66 4.25 4.5 4.66 4.5 6 4.25 5 5 5.33 3.5 3 5.66 4.75 4 5.5 5 5.5 5.66 4 5.5 5.33 4 5.33 5.5 6 3.5
3 5.25 2.5 3.33 3 5.33 2.5 2.75 2.25 5.33 5.25 3.25 6.33 4.25 5.33 5.5 5.25 4 6.66 3.5 5.75 4.33 4.75 3.66 4.75 5.25 4
5 4 4.75 4 4.25 5 2.75 5 5 4.66 5.25 4.25 5.33 4.5 4.33 4.5 5 4.25
5 5.25 4 2.66 3.75 6.66 4 6 5.5 5.66 3 4.5 3.66 4.5 3.33 4.5 6 4.75 5.66 5 4.5 4 3.25 3 3.5 4.5 6 4.66 4.25 4.75 4 4.5 4 3.25 5.25 5.5
3 5 2.75 3 5.75 6.33 3.5 2.5 5.25 6 4 4.5 6.66 4 3 5.5 5.5 4
5.66 5 5.25 6.33 3 5.33 3.5 5.25 4.25 6 6.25 5 6.33 6 4 4.5 4.5 5.5
4.33 2.5 4.5 5 4 4.66 5.25 4.5 5.25 2.66 4.25 3.25 5 4.25 3.33 4.25 5 5.5
4 4.75 3.5 3.66 3.75 4.66 3.5 4.5 5 6 2.75 4 4 5.5 6 2.5 4.75 5

57 | P a g e
6 4 4.5 6.33 4.25 5.66 4 4.75 5.75 5 4 4.75 5.33 3.5 6 4 5 4 5 3.5 4.5 2.66 4.5 3.66 3 4.5 5.25 5 2.5 3.75 4.33 4.25 4.66 5 4.75 5.25
4.66 4 5 5 3.75 4 2.75 6 4.5 5.33 2.25 4.75 4 4 5 4.5 5.5 5 5.33 4.5 4 5.33 5.25 3.66 4.75 5.5 5.5
4 5 3.75 3.66 3.75 4.66 4 5 5 5 5 4.75 4.66 4.75 5.66 4.5 5.25 5.5 6 4 3.25 3.66 4.25 6.33 3 5.5 5.75
5.66 4.5 4 3.66 3.5 4 4 2.25 3.75 5 5 6 5.33 4.25 3 3.5 5.25 4.75
5.66 3.75 5.25 2.33 4.5 3 6 5.75 4.75 6 5 5 3.66 4.25 6.33 4 4.25 5.25
6.66 1.5 1.5 2.66 2.5 1 2.75 5.25 5.5 6.66 5 5.25 5 5.5 5.66 4.25 5.25 6.75 5.33 5.5 5.5 6.33 5 5.33 5.5 5.25 3 4.66 4.5 5.25 3.66 5.25 5 3.5 6 4.5 4.66 4.5 5 5.66 5.25 4.33 6.25 5.25 5.5
5 6 5.5 5.33 4.75 3 3.75 5 5.5 6 5.5 6 2 6 2.66 5.5 4 6
6.66 6.5 6.25 4.33 6.5 5.33 6 6.75 6.5 4 4 3.75 7 5.5 7 6.75 4 6 7 6.25 5.5 6 7 6 2.5 5.5 7
6.66 6 3.75 4 6.25 7 5.5 2 5.75 6 5.5 4.25 4.66 5.5 3 5.25 4.75 6 6 4.5 4 3.66 5.5 1.66 4.5 4 6.25 6 4.25 6 3.66 5.5 2.66 5.5 4 4.75 3 1.75 2 3 3 2.66 2 3.25 4.25
2.33 2 1.75 2 2.75 3 1.75 3.25 3 3 2.75 2.5 3 2.25 2 2.25 2.75 3
3.33 2.25 2.75 2.66 2.5 3 2.75 3.5 3.5 3 2 2.25 3 2.5 2.66 2.25 3.25 3.5
3.66 1.75 1.75 2 1.75 3 2.5 2.5 5 4.66 1 1.5 3 2.5 3 2 3.25 4 4.33 3 2.25 3 2.5 3 2.25 3.25 3.5
3 2 2 2 2 2 2 3 3.5 6.33 6.25 6.5 7 6.75 7 6.5 6.5 6.75 6.33 6.25 6.75 6.33 7 6 7 4 6 5.66 6.75 4.5 6 5.75 4.66 5.75 4.5 5.75 4.33 2.75 3 2.33 3.25 3 2.25 3.5 4 4.33 2.25 3.5 2.66 2.5 3 2.5 4.5 5.25 2.66 4.75 2.75 4.33 3 2.66 1.75 3.5 4.75 4.66 1.75 2.75 3.66 3.5 2.66 2.25 3.75 3.5 4.66 4.5 3.25 2 2.75 3 3.25 3.5 4.25 4.66 4.25 2.5 3 2.75 1.66 2.75 3.5 3.25
4 3.25 4 3.66 2.5 4 2.75 4.75 2 4.33 2 2.5 2.66 3.5 3.66 3.25 3.25 3.25

58 | P a g e
3.66 3.25 2.75 2.66 2.75 2 2 4.75 3.75 4.33 1.75 3.5 2.66 2.5 3.66 3 4 4
4 2.75 4.5 2.66 2 4 3.5 3.75 3.75 4 2.75 3.75 2 3.75 3.66 2 4.75 4.75
3.66 2.5 4.25 4 4 4.66 2.25 6 2 6.33 4 3.5 3.33 4.5 3 3.25 3.75 5.5
5 5.25 3.25 4 4.5 4.33 4.25 4.5 4.5 4.33 2.75 2.75 4.66 3.5 5 2.5 2.75 3.5
6 2.25 3.75 4.66 3 6 2.5 5 4.25 3 4 2.75 2.66 3.75 2.66 2.25 4.5 4.25
4.66 2.25 4 2 3.5 3.33 3.75 3 4 4 5 3 4.66 3.25 2.66 2 3.5 4
4.33 2 3 3.33 1.75 2.66 3.25 3.75 4 4.33 3.75 3 2.33 3 2 2.25 5 2.25 5.33 2 2.5 3.33 1.75 3.33 2.25 2.75 3 3.33 2.5 1.25 3.33 2.5 3.33 2.25 3.25 3 5.66 4 5.5 4 4 4.33 3 6 4.25 4.66 5.5 4 3.33 6.25 5 3 5.5 5.5 5.66 2.5 2.75 1.33 3.25 2.33 1.75 4.75 3
7 6.5 2.25 3.33 5.5 2.66 3 7 5.25 6.66 2.25 4.5 3.66 4.75 3.66 4 6 6.75 2.66 4.25 3.25 5 3.75 2.66 2.25 2.75 5.5 4.33 5 3.75 2 5.5 1.66 4 4.75 6.25
5 3.5 3.25 2.33 2.75 5 3.75 2.75 5

59 | P a g e

60 | P a g e
Related Documents


