Welcome message from author
This document is posted to help you gain knowledge. Please leave a comment to let me know what you think about it! Share it to your friends and learn new things together.
Transcript


By: Dr. Andreas H. Hermelink and Astrid Müller
Date: 1 December 2010
Project number: PDEMDE101646
This report was commissioned by Eurima - European Insulation Manufacturers Association
All views expressed in this report are those of the authors and not necessarily those of Eurima.
We would like to thank DENA (German Energy Agency) for their support.
Ecofys Germany GmbH, Stralauer Platz 34, 10243 Berlin, Germany
www.ecofys.de, Email: [email protected], Tel: +49 (0)30 297 735 79 0

I
Table of contents
1 Executive Summary .................................................................................................................. 1
2 Background ............................................................................................................................... 3
3 Methodology ............................................................................................................................. 4
3.1 Calculation of Cost per Saved kWh Final Energy ................................................................ 4
3.2 Illustrative Transfer of Results to other European Countries ............................................... 7
4 Selected Buildings from the “Low Energy Building Stock” Initiative ......................................... 10
5 Results .................................................................................................................................... 13
6 Conclusions ............................................................................................................................ 17
7 Annex – Selected excerpts from the EPBD recast.................................................................... 19
8 References .............................................................................................................................. 21
1
1 Executive Summary
In the current context of climate change, energy insecurity and rising energy prices, the EU is at the
crossroads for its future energy policy. It is widely accepted that bold action in energy efficiency is
key in order to respond to the multiple challenges.
Buildings are clearly perceived as the “low hanging fruit” with greater potential for cost-efficient
action in the energy efficiency field. In this context, the necessity of a wide campaign of deep
renovation of the existing EU building stock is often mentioned, but so far no EU-wide analysis of its
economic implications has been undertaken.
This study by Ecofys intends to provide a notion of the economic feasibility of deep renovations for
single and multi-family homes across the EU, taking a case-study analysis as basis.
Main findings of this study:
The time for deep renovation across Europe is now: The study concludes that deep
renovation has the potential to be the preferred solution from ecologic and economic point
of view, even without subsidies, for the necessary immediate action on the EU building
stock;
“Shallow” renovations significantly increase the risk to miss the climate targets: The study
points out that, if superficial renovations of buildings are undertaken on least performing
buildings, huge absolute savings remain untapped. The achievement of the EU’s long-
term energy savings and climate goals will be impossible if the current trend of ‘cream
skimming’ renovations is kept;
Spending on deep renovations is worth from the first day: For all studied EU countries,
energy related costs per saved kWh for deep renovation turned out to be equal or lower
than actual energy costs. We already have favourable market conditions across Europe
to make deep renovation a financially more attractive option than inaction (continue
paying higher energy consumption); the only exception is UK, where in the past gas
prices have been relatively low compared to continental Europe. This low-price period
might end soon as the UK imports more and more gas at higher continental Europe’s
price level. Thus even in the UK deep renovation is the right choice to be on the safe side.

2
Methodology:
Results were taken from case studies under the very ambitious “Low energy building
stock” (“Niedrigenergiehaus im Bestand”) deep renovation programme, managed by the
German Energy Agency (DENA). these results were extrapolated to other EU countries
using EUROSTAT data on price level indices, mortgage rates, inflation rates, energy
prices and heating degree days;
This study has been made under conservative assumptions regarding future energy
prices, and excluding any possible subsidy that would make the investment even more
advantageous.

3
2 Background
Buildings play the major role in achieving Europe’s very ambitious climate targets. On 19 May 2010
a milestone in European climate policy came into effect: the recast of the Directive on the Energy
Performance of Buildings (EPBD).
For new buildings the recast explicitly requires “nearly zero energy” being the standard by 2019
(public buildings) or 2021 respectively (all other buildings).
As to the building stock the recast requires Member States “to ensure that when buildings undergo
major renovation, the energy performance of the building or the renovated part thereof is upgraded
in order to meet minimum energy performance requirements … in so far as this is technically,
functionally and economically feasible [EP 2010].” Though even the term “nearly zero energy” used
for new buildings still needs further definitions on European and National level, obviously the
wording for major renovations of existing buildings leaves more uncertainty about the actual level of
energy performance that is spoken of. This uncertainty can be reduced by evidence from realized,
ambitious major renovations. A “major” renovation is accomplished when “total cost of renovation
relating to the building envelope or the technical building systems is higher than 25 % of the
building’s value or if more than 25 % of the surface of the building envelope undergoes renovation”.
The term “economically feasible” cited above refers to another novelty in the recast. The economic
feasibility is to be calculated within the context of a “comparative methodology framework for
calculating cost-optimal levels of minimum energy performance requirements”. Such framework
does not yet exist but is to be laid down by the Commission until 30 June 2011. Further details on
the EPBD recast’s relevant paragraphs are provided in the Annex of this paper.
Since 2004 a well documented series of progressive major renovations for residential buildings has
aimed at achieving at least new buildings’ energy performance under the umbrella of the ambitious
initiative “Low Energy Building Stock”, managed by the German Energy Agency (DENA). Due to
their high ambition these renovations belong to the category of “deep” (major) renovations in
contrast to “shallow” renovations only aiming at minor savings.
This paper discusses the economic feasibility of deep renovations for single and multi family homes
using the German “Low Energy Building Stock” programme as a case study. In order to put the
results into a European perspective, an estimation of the economics of such projects incl. a hint to
job creation potential for some selected European countries is included.
4
3 Methodology
3.1 Calculation of Cost per Saved kWh Final Energy
A “comparative methodology framework for calculating cost-optimal levels of minimum energy
performance requirements” is not yet available. Instead the economic calculations follow the
methodology being described by [Ecofys 2009]. The ultimate aim of that methodology is to
transform investments in “beyond the business as usual energy efficiency” into “Euro-ct per saved
kWh”. This enables a direct comparison between:
What does it cost to save one unit of energy? – and
What does it cost to buy one unit of energy?
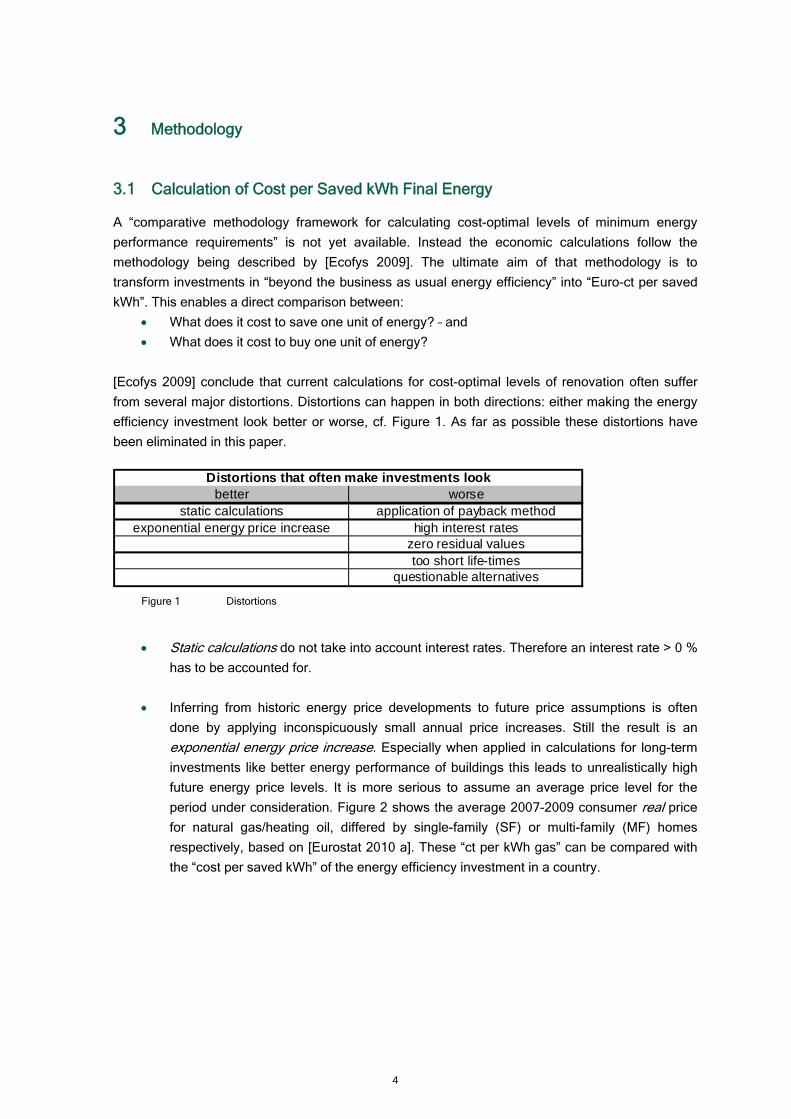
[Ecofys 2009] conclude that current calculations for cost-optimal levels of renovation often suffer
from several major distortions. Distortions can happen in both directions: either making the energy
efficiency investment look better or worse, cf. Figure 1. As far as possible these distortions have
been eliminated in this paper.
better worsestatic calculations application of payback method
exponential energy price increase high interest rateszero residual valuestoo short life-times
questionable alternatives
Distortions that often make investments look
Figure 1 Distortions
Static calculations do not take into account interest rates. Therefore an interest rate > 0 %
has to be accounted for.
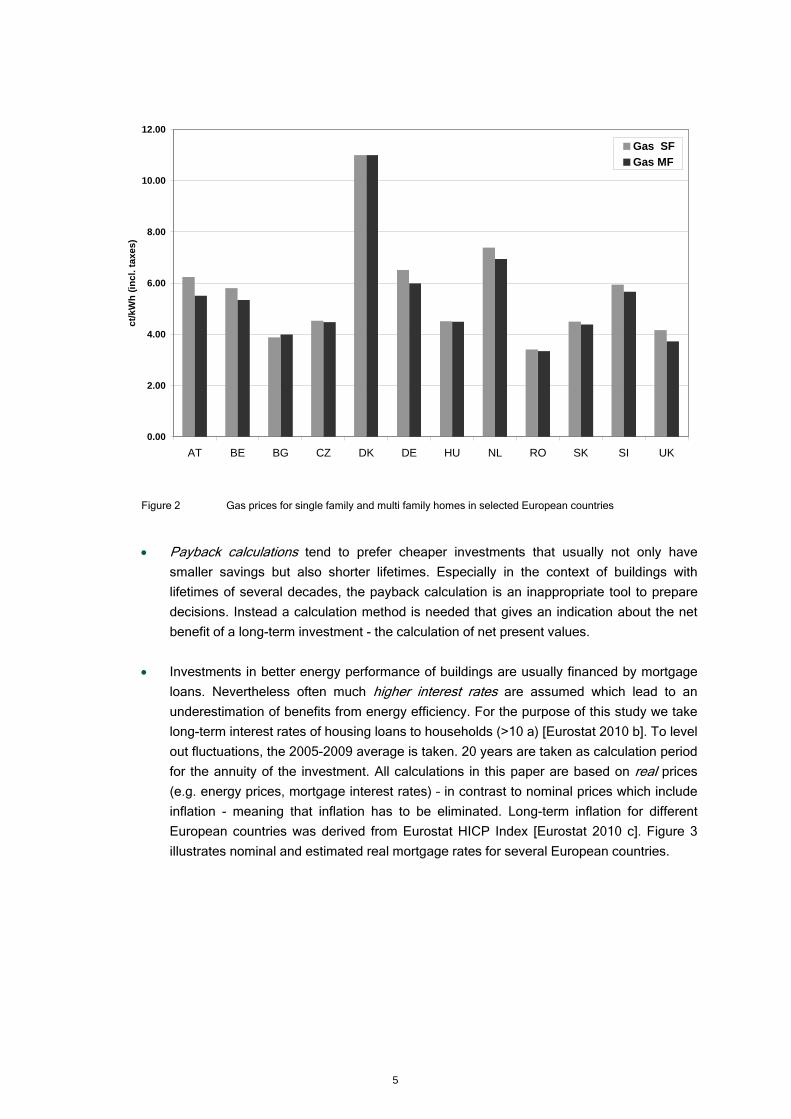
Inferring from historic energy price developments to future price assumptions is often
done by applying inconspicuously small annual price increases. Still the result is an
exponential energy price increase. Especially when applied in calculations for long-term
investments like better energy performance of buildings this leads to unrealistically high
future energy price levels. It is more serious to assume an average price level for the
period under consideration. Figure 2 shows the average 2007-2009 consumer real price
for natural gas/heating oil, differed by single-family (SF) or multi-family (MF) homes
respectively, based on [Eurostat 2010 a]. These “ct per kWh gas” can be compared with
the “cost per saved kWh” of the energy efficiency investment in a country.
5
Figure 2 Gas prices for single family and multi family homes in selected European countries
Payback calculations tend to prefer cheaper investments that usually not only have
smaller savings but also shorter lifetimes. Especially in the context of buildings with
lifetimes of several decades, the payback calculation is an inappropriate tool to prepare
decisions. Instead a calculation method is needed that gives an indication about the net
benefit of a long-term investment - the calculation of net present values.
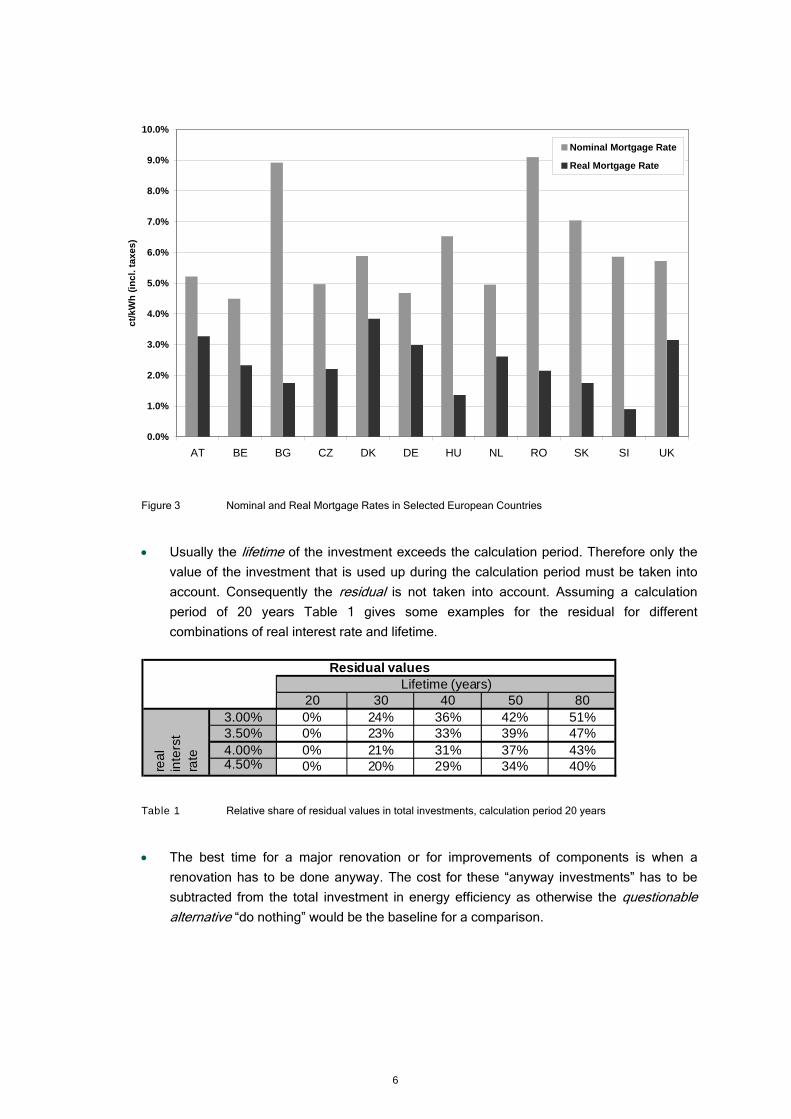
Investments in better energy performance of buildings are usually financed by mortgage
loans. Nevertheless often much higher interest rates are assumed which lead to an
underestimation of benefits from energy efficiency. For the purpose of this study we take
long-term interest rates of housing loans to households (>10 a) [Eurostat 2010 b]. To level
out fluctuations, the 2005-2009 average is taken. 20 years are taken as calculation period
for the annuity of the investment. All calculations in this paper are based on real prices
(e.g. energy prices, mortgage interest rates) – in contrast to nominal prices which include
inflation - meaning that inflation has to be eliminated. Long-term inflation for different
European countries was derived from Eurostat HICP Index [Eurostat 2010 c]. Figure 3
illustrates nominal and estimated real mortgage rates for several European countries.
0.00
2.00
4.00
6.00
8.00
10.00
12.00
AT BE BG CZ DK DE HU NL RO SK SI UK
ct/
kW
h (
inc
l. ta
xe
s)
Gas SF
Gas MF
6
Figure 3 Nominal and Real Mortgage Rates in Selected European Countries
Usually the lifetime of the investment exceeds the calculation period. Therefore only the
value of the investment that is used up during the calculation period must be taken into
account. Consequently the residual is not taken into account. Assuming a calculation
period of 20 years Table 1 gives some examples for the residual for different
combinations of real interest rate and lifetime.
Table 1 Relative share of residual values in total investments, calculation period 20 years
The best time for a major renovation or for improvements of components is when a
renovation has to be done anyway. The cost for these “anyway investments” has to be
subtracted from the total investment in energy efficiency as otherwise the questionable
alternative “do nothing” would be the baseline for a comparison.
0.0%
1.0%
2.0%
3.0%
4.0%
5.0%
6.0%
7.0%
8.0%
9.0%
10.0%
AT BE BG CZ DK DE HU NL RO SK SI UK
ct/
kW
h (
inc
l. ta
xe
s)
Nominal Mortgage Rate
Real Mortgage Rate
20 30 40 50 803.00% 0% 24% 36% 42% 51%3.50% 0% 23% 33% 39% 47%4.00% 0% 21% 31% 37% 43%4.50% 0% 20% 29% 34% 40%
Residual valuesLifetime (years)
rea
l in
ters
t ra
te
7
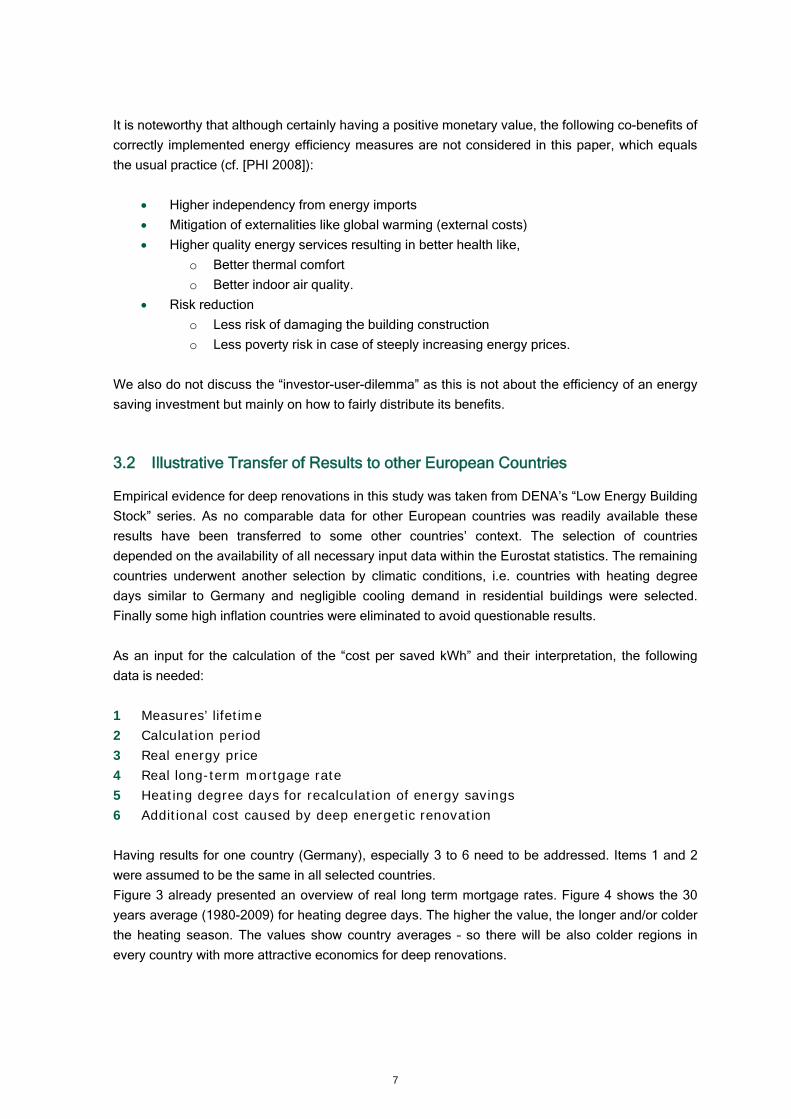
It is noteworthy that although certainly having a positive monetary value, the following co-benefits of
correctly implemented energy efficiency measures are not considered in this paper, which equals
the usual practice (cf. [PHI 2008]):
Higher independency from energy imports
Mitigation of externalities like global warming (external costs)
Higher quality energy services resulting in better health like,
o Better thermal comfort
o Better indoor air quality.
Risk reduction
o Less risk of damaging the building construction
o Less poverty risk in case of steeply increasing energy prices.
We also do not discuss the “investor-user-dilemma” as this is not about the efficiency of an energy
saving investment but mainly on how to fairly distribute its benefits.
3.2 Illustrative Transfer of Results to other European Countries
Empirical evidence for deep renovations in this study was taken from DENA’s “Low Energy Building
Stock” series. As no comparable data for other European countries was readily available these
results have been transferred to some other countries’ context. The selection of countries
depended on the availability of all necessary input data within the Eurostat statistics. The remaining
countries underwent another selection by climatic conditions, i.e. countries with heating degree
days similar to Germany and negligible cooling demand in residential buildings were selected.
Finally some high inflation countries were eliminated to avoid questionable results.
As an input for the calculation of the “cost per saved kWh” and their interpretation, the following
data is needed:
1 Measures’ lifetime 2 Calculation period 3 Real energy price 4 Real long-term mortgage rate 5 Heating degree days for recalculation of energy savings 6 Additional cost caused by deep energetic renovation
Having results for one country (Germany), especially 3 to 6 need to be addressed. Items 1 and 2
were assumed to be the same in all selected countries.
Figure 3 already presented an overview of real long term mortgage rates. Figure 4 shows the 30
years average (1980-2009) for heating degree days. The higher the value, the longer and/or colder
the heating season. The values show country averages – so there will be also colder regions in
every country with more attractive economics for deep renovations.

8
0
500
1,000
1,500
2,000
2,500
3,000
3,500
4,000
AT BE BG CZ DK DE HU NL RO SK SI UK
Kd
(K
elv
ind
ays)
Heating Degree Days
Figure 4 Heating degree days in selected European countries (30-year average)
The most critical transformation relates to item 6 – the additional cost caused by deep renovations
that we know from Germany to another country. Price Level Indices (PLI), which are available from
Eurostat’s Purchasing Power Parities data for different sectors [Eurostat 2008] were applied for this
transformation. As Eurostat does not provide a specific index for (deep) renovation of buildings, the
PLI for new residential buildings were taken as a proxy, see Figure 5. For a first indication on the
economics of deep renovation in Europe, this approach promises sufficient reliability. The EU 27
average has a PLI of 100. Lower values signal lower price level and vice versa.

9
0
20
40
60
80
100
120
140
160
180
200
AT BE BG CZ DK DE HU NL RO SK SI UK
PLI - Price Level Index
Figure 5 Price Level Indices for new residential buildings 2007
An estimation on job effects can be made by using a simplified method that neglects smaller effects
but still offers a good indication of possible employment related impacts of energy efficiency
measures: the assumed additional turnover from energy efficiency projects is divided by the
average turnover per employee in the construction sector (available from Eurostat) and multiplied
by a specific factor, a methodology that we already used in the impact assessment for the EPBD
recast.
Job_creation = (additional_turnover/turnover_per_employee)*factor
This factor depends on the specific labour intensity of the measures carried out. Depending on
exact kind of activities, this factor may vary between 0.5 (share of material costs of energy
efficiency measures twice as high as the usual mix of material and labour costs as presently
observed in the building industry of the EU27) and 1.0 (share of material costs according to usual
mix). In the present study the factor was assumed to be 0.7.
10
4 Selected Buildings from the “Low Energy Building Stock” Initiative
The pilot initiative “Low Energy Building Stock” of the German Energy Agency is designed to
produce best practice examples for deep renovations, e.g. by using components usually applied in
new very-low-energy buildings or Passive Houses in renovation. In fact the series anticipates
subsequent levels for funding by the federal German KfW bank. Up till know there have been
several project phases, of which the first three featured residential buildings, the renovation starting
between 2004 and 2007. Typical measures comprise:
Thermoskin, insulation thickness between 10-24 cm
Insulation of cellar ceiling, 5-20 cm
New windows, U-values 0.8-1.4 W/m²K
Roof insulation
Solar thermal collectors for Domestic Hot Water
Ventilation system with heat recovery or exhaust air only
Reduction of heat bridges.
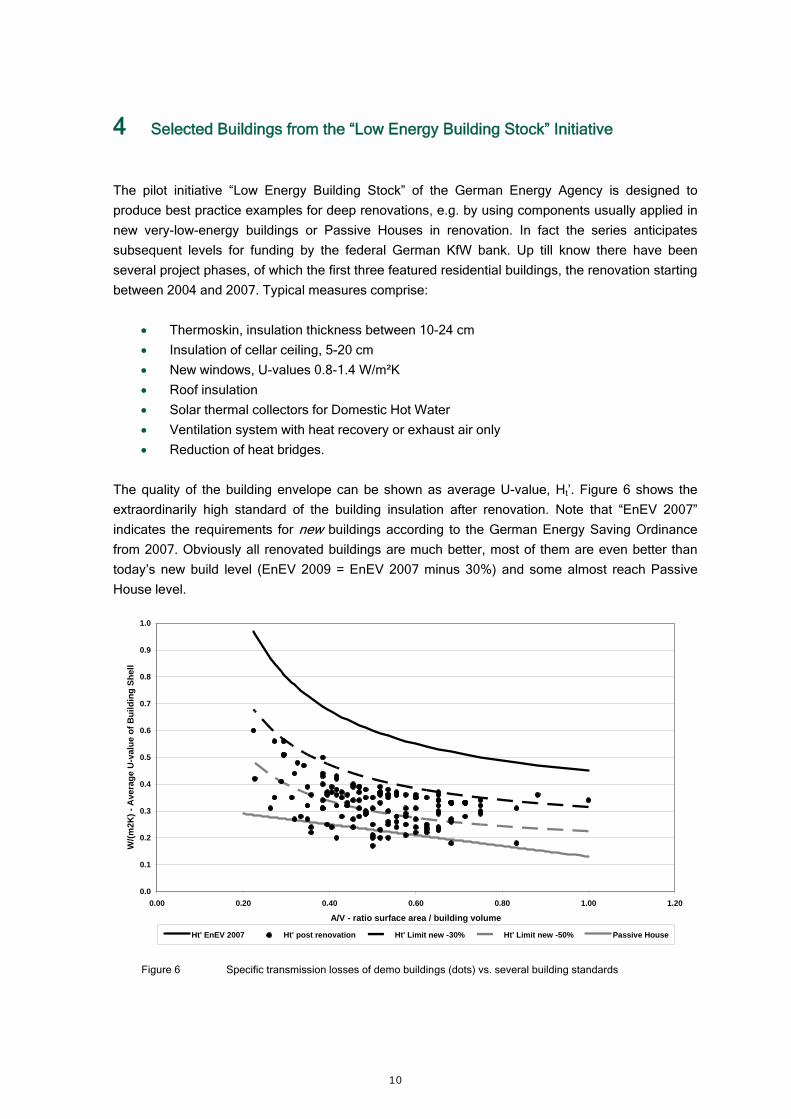
The quality of the building envelope can be shown as average U-value, Ht’. Figure 6 shows the
extraordinarily high standard of the building insulation after renovation. Note that “EnEV 2007”
indicates the requirements for new buildings according to the German Energy Saving Ordinance
from 2007. Obviously all renovated buildings are much better, most of them are even better than
today’s new build level (EnEV 2009 = EnEV 2007 minus 30%) and some almost reach Passive
House level.
0.0
0.1
0.2
0.3
0.4
0.5
0.6
0.7
0.8
0.9
1.0
0.00 0.20 0.40 0.60 0.80 1.00 1.20
A/V - ratio surface area / building volume
W/(
m2K
) -
Ave
rag
e U
-val
ue
of
Bu
ild
ing
Sh
ell
Ht' EnEV 2007 Ht' post renovation Ht' Limit new -30% Ht' Limit new -50% Passive House
Figure 6 Specific transmission losses of demo buildings (dots) vs. several building standards
11
For our study we picked several
Single family homes, vintage 1958-1978
Multi-family homes, vintage 1958-1969.
They represent the widest-spread residential buildings in Germany. As they are not the worst from
energetic point of view, even higher savings may be achieved in older vintages.
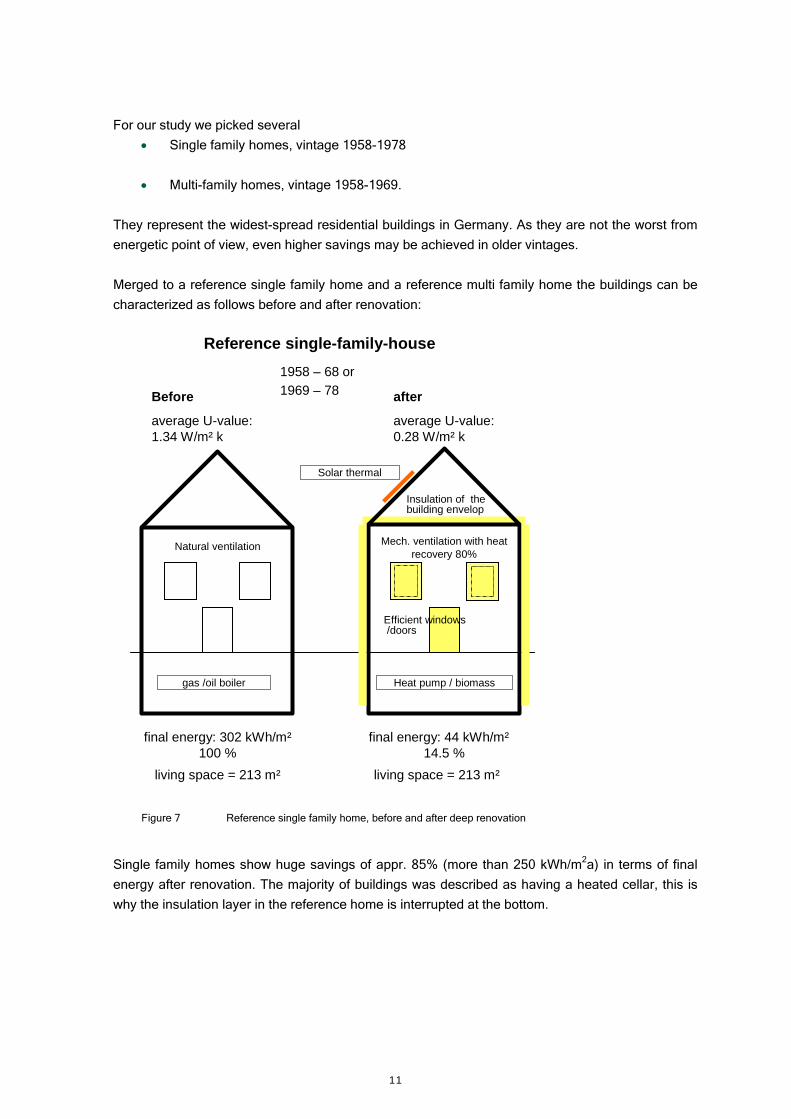
Merged to a reference single family home and a reference multi family home the buildings can be
characterized as follows before and after renovation:
Figure 7 Reference single family home, before and after deep renovation
Single family homes show huge savings of appr. 85% (more than 250 kWh/m2a) in terms of final
energy after renovation. The majority of buildings was described as having a heated cellar, this is
why the insulation layer in the reference home is interrupted at the bottom.
gas /oil boiler Heat pump / biomass
Before
average U-value: 1.34 W/m² k
1958 – 68 or
1969 – 78 after
average U-value: 0.28 W/m² k
Reference single-family-house
living space = 213 m² living space = 213 m²
final energy: 44 kWh/m²14.5 %
Natural ventilation
Solar thermal
Insulation of the building envelop
Efficient windows/doors
Mech. ventilation with heatrecovery 80%
final energy: 302 kWh/m²100 %

12
Figure 8 Reference multi-family home, before and after renovation
Multi family homes show huge savings of appr. 80% (more than 150 kWh/m2a) in terms of final
energy after renovation. The majority of buildings was described as having a heated cellar, this is
why the insulation layer in the reference home is interrupted at the bottom.
Prices for additional deep renovation expenditures were either derived from architects’ information
or from re-calculating the findings of [IWU 2010].
gas /oil boiler Biomass / CHP
before
average U-value: 1.31 W/m² k
1969 – 78
after
average U-value: 0.35 W/m² k
Reference multi-family-house
living space = 2400 m² living space = 2400 m²
final energy: 195 kWh/m²100 %
Efficient windows/doors
Natural ventilation Mech. ventilation
Insulation of the building envelop
final energy: 41 kWh/m²21 %
13
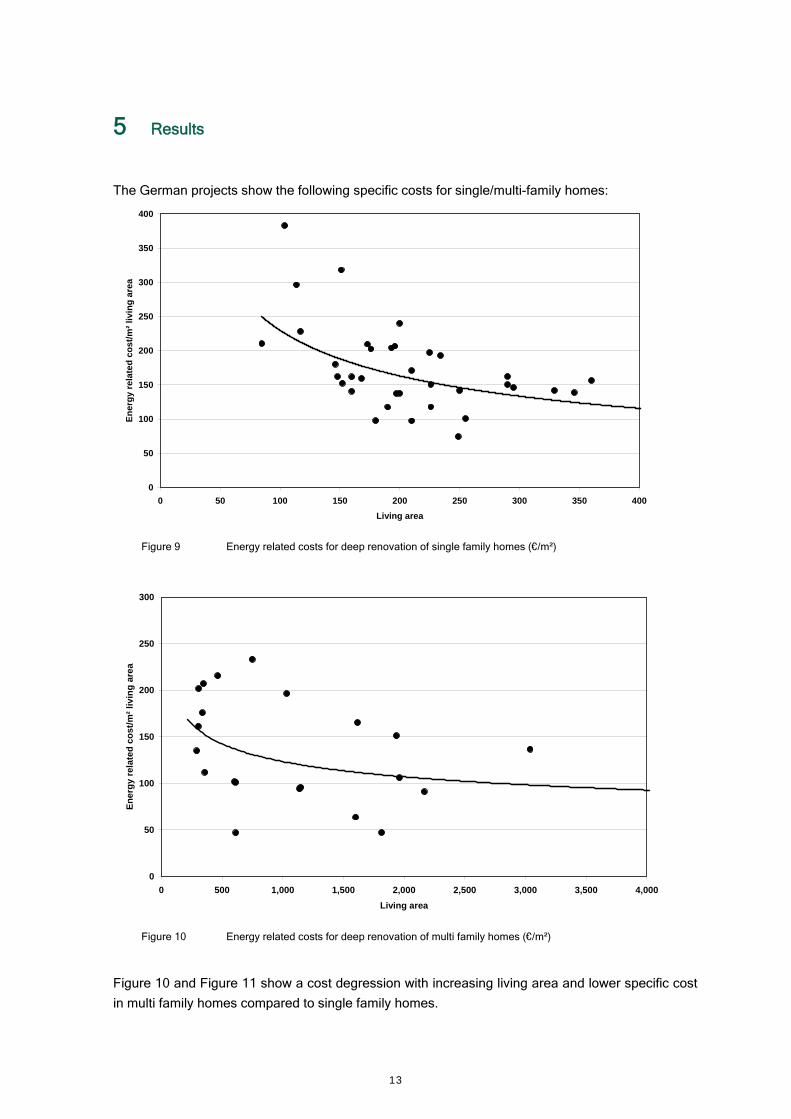
5 Results
The German projects show the following specific costs for single/multi-family homes:
0
50
100
150
200
250
300
350
400
0 50 100 150 200 250 300 350 400
Living area
En
erg
y r
elat
ed
co
st/
m²
livi
ng
are
a
Figure 9 Energy related costs for deep renovation of single family homes (€/m²)
0
50
100
150
200
250
300
0 500 1,000 1,500 2,000 2,500 3,000 3,500 4,000
Living area
En
erg
y r
ela
ted
co
st/
m²
liv
ing
are
a
Figure 10 Energy related costs for deep renovation of multi family homes (€/m²)
Figure 10 and Figure 11 show a cost degression with increasing living area and lower specific cost
in multi family homes compared to single family homes.
14
0.0
1.0
2.0
3.0
4.0
5.0
6.0
7.0
8.0
9.0
AT BE BG CZ DK DE HU NL RO SK SI UK
ct/k
Wh
SF, cost per saved kWhadjustedMF, cost per saved kWhadjusted
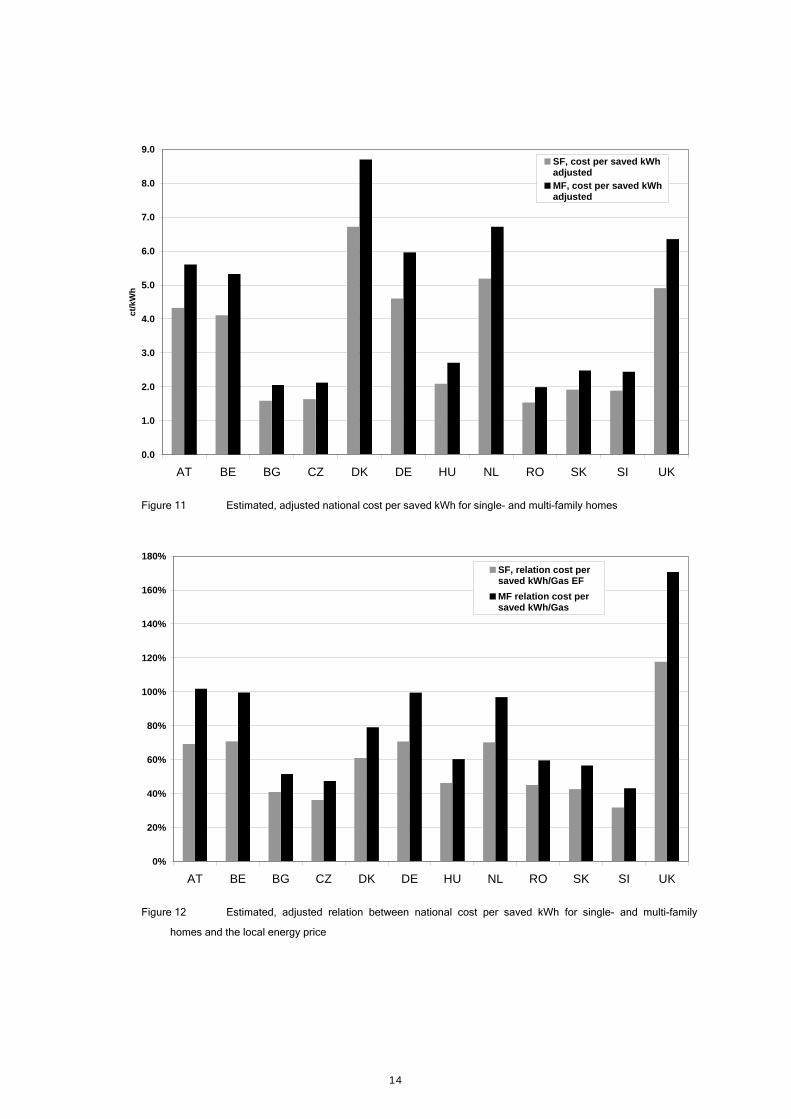
Figure 11 Estimated, adjusted national cost per saved kWh for single- and multi-family homes
0%
20%
40%
60%
80%
100%
120%
140%
160%
180%
AT BE BG CZ DK DE HU NL RO SK SI UK
SF, relation cost persaved kWh/Gas EF
MF relation cost persaved kWh/Gas
Figure 12 Estimated, adjusted relation between national cost per saved kWh for single- and multi-family
homes and the local energy price

15
These specific costs are transferred to average cost per saved kWh for the whole DENA sample,
separately for single- and multi-family homes. In Figure 11 these are the values of Germany (DE).
Applying the transformation steps explained before the German cost per saved kWh are transferred
to several selected European countries, see Figure 11. There is quite a big variety in costs per
saved kWh that can be expected for deep renovations which are comparable to the German
example in other European countries.
As explained before deep renovations are very attractive when the possible cost per saved kWh is
lower than the actual real energy price in a country. The relation between those can be shown by
dividing the national cost per saved kWh by the national energy price, see Figure 12.
Figure 12 needs some additional explanation to ensure proper interpretation:
Note, that all values are based on a German sample of deep renovations. The German
sample has been hypothetically transferred to a few European countries by means of
EUROSTAT data on price levels for energy and construction and climate. Therefore
Figure 11 and Figure 12 give an indication on what may be expected when the German
deep renovation examples would be implemented in these countries. Obviously evidence
from projects in these countries with comparable ambition would be welcome to get real
results.
The graph is based on a conservative assumption on future energy prices. The average
national household gas price for 2007-2009 has been taken without assuming further real
gas price increases over the calculation period of 20 years. Moreover no subsidies etc.
are included, which would lower the price per saved kWh.
The graph is based on energy related costs per saved kWh (Figure 11) for a sample of
very ambitious deep renovations, meaning that final energy consumption was cut by more
than 80% being in line with long-term climate targets. The energetic quality of the
renovated buildings in the German sample is appr. 50% better than what is currently
required for new buildings.
A value of 100% indicates that already at the mentioned conservative assumptions deep
renovation is financially equivalent to not investing in energy efficiency and paying for
high energy consumption. In other words: the energy savings alone pay for the additional
investment. Note that positive side effects of deep renovation like increased real estate
value, more comfort, lower vulnerability to energy price increases etc. are for free. A value
lower than 100% indicates that the energy savings over-compensate the additional
investment. 50% means savings twice as high as the additional investment.
Thus the overall picture is remarkably positive. Most countries show values of cost per
saved energy between appr. 40% and 100% of the local gas price.
UK is the only exception with values between 120% and 170%, the major reason being
the low gas prices presented in Figure 2. All other UK numbers in Figure 3, Figure 4 and
Figure 5 show values being very close to the German reference case. Assuming real
energy prices for the UK similar to Germany would get the UK numbers in Figure 12 close
to German level. In fact, there is reason to assume that the long period of UK gas prices
being significantly below the level of continental Western Europe might end soon. Few
16
years ago the UK became a net importer of energy, i.e. there is an increasing influence of
continental European gas prices on the UK market.
Thus Figure 11 not only shows the price per saved kWh but also the “break-even-gas-
price” where the avoided energy cost equal the additional investment in deep renovation.
For the UK case this means real gas prices at a still moderate level around 5-6 ct/kWh (as
average for the next 20 years) would suffice to make deep renovation “look good” (again:
ignoring the value of all positive side effects in order to follow the usual practice).
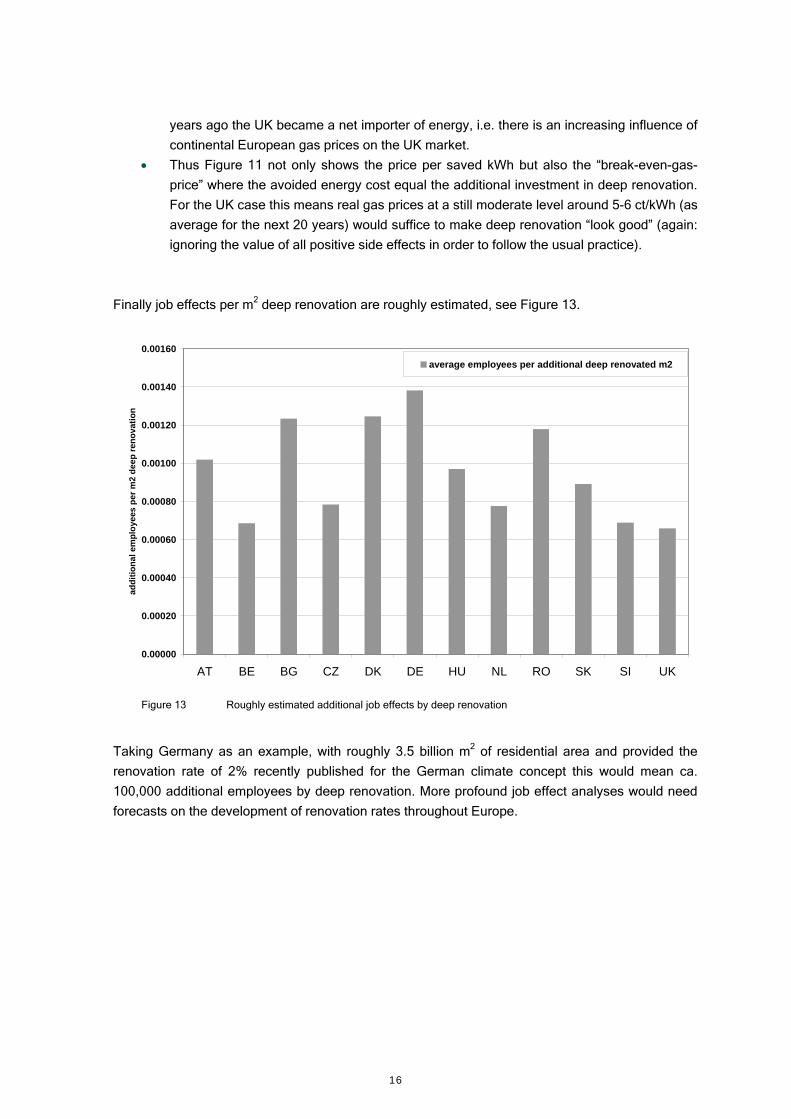
Finally job effects per m2 deep renovation are roughly estimated, see Figure 13.
0.00000
0.00020
0.00040
0.00060
0.00080
0.00100
0.00120
0.00140
0.00160
AT BE BG CZ DK DE HU NL RO SK SI UK
add
itio
nal
em
plo
yees
per
m2
dee
p r
eno
vati
on
average employees per additional deep renovated m2
Figure 13 Roughly estimated additional job effects by deep renovation
Taking Germany as an example, with roughly 3.5 billion m2 of residential area and provided the
renovation rate of 2% recently published for the German climate concept this would mean ca.
100,000 additional employees by deep renovation. More profound job effect analyses would need
forecasts on the development of renovation rates throughout Europe.
17
6 Conclusions
Currently the discussion starts on the “adequate” energetic level for renovation. Based on empirical
evidence from the German Energy Agency (DENA) administered program “Low Energy Building
Stock” the results presented here indicate that in Europe deep renovation has the potential to be
the preferred solution from ecologic and economic point of view even without subsidies. Further
evidence should be derived from real deep renovation projects all over Europe.
Due to lack of such evidence, we adjusted prices and savings from the German experience by
applying Eurostat Price Level Indices, mortgage rates, inflation rates, energy prices and heating
degree days. This means the values presented here should be interpreted as an indication and
tendency for what should be expected when such projects would be realized in other European
countries.
Note that the often heard argument “let’s use the available annual budget for many cheap, shallow
renovations saving 30-50% instead of using it for fewer, more expensive deep renovations saving
70%-90%” may lead to unwanted, irreversible long-term consequences. Dynamic simulations for
future building stock scenarios have clearly shown, that “deep renovation at reasonable speed” is a
more promising strategy to reach the 2050 climate targets than “shallow renovation at high speed” -
shallow meaning that current national requirements for renovation are just met [Ecofys 2010]. It is
important to do projections till 2050, as projections till only 2020 may be misleading and suggest an
inadequate strategy. As the schematic paths in Figure 14 show, at the interim milestone 2020 a
“shallow renovation” strategy might look better than a “deep renovation” strategy, while surprisingly
failing to achieve the crucial 2050 target. The usually performed short-term projections contain a
severe risk of getting irreversibly caught in this “speed trap of shallow renovation”: usually
renovations with the best investment/saving ratio are done at the start of a nation’s renovation
program. These are the buildings having the highest absolute saving potential. When these
buildings are renovated “shallow”, huge absolute savings remain untapped. This loss cannot be
compensated any more later on by buildings with lower saving potential, - an important finding that
was confirmed by [Ürge-Vorsatz 2010].

18
Figure 14 The “speed trap” of shallow renovation
Deep renovation path
2050 climate target
Today 2020 2050
Shallow renovation path

19
7 Annex – Selected excerpts from the EPBD recast
(Preamble)
(14) “The Commission should lay down a comparative methodology framework for
calculating cost-optimal levels of minimum energy performance requirements.” …
(15) “Buildings have an impact on long-term energy consumption. Given the long
renovation cycle for existing buildings, new, and existing buildings that are subject to major
renovation, should therefore meet minimum energy performance requirements adapted to
the local climate.”
(16) “Major renovations of existing buildings, regardless of their size, provide an opportunity
to take cost-effective measures to enhance energy performance.”
(Article 2) "For the purpose of this Directive, the following definitions shall apply:
…
(10) "‘major renovation’ means the renovation of a building where:”
(a) the total cost of the renovation relating to the building envelope or the technical
building systems is higher than 25 % of the value of the building, excluding the
value of the land upon which the building is situated;
or
(b) more than 25 % of the surface of the building envelope undergoes renovation;
…”
(14) “‘cost-optimal level’ means the energy performance level which leads to the lowest
cost during the estimated economic lifecycle, …”
(Article 4 - Setting of minimum energy performance requirements)
1. “Member States shall take the necessary measures to ensure that minimum energy
performance requirements for buildings or building units are set with a view to achieving
cost-optimal levels. … A Member State shall not be required to set minimum energy
performance requirements which are not cost-effective over the estimated economic
lifecycle.”
(Article 7 – Existing Buildings)
"Member States shall take the necessary measures to ensure that when buildings undergo
major renovation, the energy performance of the building or the renovated part thereof is
upgraded in order to meet minimum energy performance requirements … in so far as this is
technically, functionally and economically feasible. Those requirements shall be applied to
the renovated building or building unit as a whole.” …
20
(Article 10 – Financial Barriers and Market Incentives)
6. Member States shall take account of the cost-optimal levels of energy performance when
providing incentives for the construction or major renovation of buildings. …
(Annex - III Comparative methodology framework to identify cost-optimal levels of energy
performance requirements for buildings and building elements)
The comparative methodology framework shall require Member States to:
define reference buildings that are characterised by and representative of their functionality and geographic location, including indoor and outdoor climate conditions. The reference buildings shall cover residential and non-residential buildings, both new and existing ones,
define energy efficiency measures to be assessed for the reference buildings. These may be measures for individual buildings as a whole, for individual building elements, or for a combination of building elements,
assess the final and primary energy need of the reference buildings and the reference buildings with the defined energy efficiency measures applied,
calculate the costs (i.e. the net present value) of the energy efficiency measures (as referred to in the second indent) during the expected economic lifecycle applied to the reference buildings (as referred to in the first indent) by applying the comparative methodology framework principles.
21
8 References
[EP 2010] Directive 2010/31/EU of the European Parliament and of the Council of 19 May 2010 on
the energy performance of buildings (recast).
[Eurostat 2008] Eurostat. Wide spread in construction prices across Europe in 2007.
[Eurostat 2010 a] Eurostat. Table nrg_pc_202-Gas - Domestic consumers - half-yearly prices - New
methodology from 2007 onwards, update from 28 September 2010.
[Eurostat 2010 b] Eurostat. Table irt_rtl_lhh_a - MFI interest rates - Loans to households - Monthly
data, update from 28 September 2010.
[Eurostat 2010 c] Eurostat. Table prc_hicp_aind- HICP (2005=100) - Annual Data (average index
and rate of change), update from 15 September 2010.
[Eurostat 2010 d] Eurostat. Table sbs_na_4a_co-Annual detailed enterprise statistics on
construction (Nace Rev.1.1 F), update from 28 September 2010.
[Ecofys 2010] Hermelink, A., Bettgenhäuser, K., Schüler, V., 2010: Basisgutachten
Zum Masterplan Klimaschutz für Hamburg, Ergänzungsgutachten: Wärmebedarf der Gebäude.
Report commissioned by BSU Hamburg. Above all, see page 7.
http://klima.hamburg.de/contentblob/2581046/data/ergaenzungsgutachen.pdf
[Ecofys 2009] Hermelink, A., 2009. How Deep to Go: Remarks on How to Find the Cost-Optimal
Level for Building Renovation. Report commissioned by ECEEE, the European Council for a
Energy Efficient Economy.
[IWU 2009] Institut Wohnen und Umwelt. Untersuchung zur weiteren Verschärfung der
energetischen Anforderungen an Wohngebäude mit der EnEV 2012, Teil 1 - Kosten
energierelevanter Bau- und Anlagenteile in der energetischen Modernisierung von Altbauten, 3.
Zwischenbericht; commissioned by Bundesinstitut für Bau-, Stadt- und Raumforschung (BBSR) im
Bundesamt für Bauwesen und Raumordnung (BBR).
[PHI 2008] Passivhaus Institut. Bewertung energetischer Anforderungen im Lichte steigender
Energiepreise für die EnEV und die KfW-Förderung, by order of German Agency of Building and
Urban Development, December 2008
[Ürge-Vorsatz 2010] Ürge-Vorsatz, D. et al. Employment Impacts of a Large-Scale Deep Building
Energy Retrofit Programme in Hungary. Report prepared for the European Climate Foundation.
June 2010

22
NOTES:

23
Related Documents


![Project Number: MAJ 0000 - University of Strathclyde€¦ · [Project Title] Project Execution Plan (PEP) PMP T09 Project Number: MAJ 0000](https://static.cupdf.com/doc/110x72/5adc4ced7f8b9ae1408b5cfd/project-number-maj-0000-university-of-strathclyde-project-title-project-execution.jpg)