Report Pottinger, Tom; Katsiadaki, Ioanna; Juergens, Monika; Cook, Alastair; Abel, David; Sanders, Matthew. 2008 Endocrine Disruption in Catchments: EDCAT 5: Second Annual Report, January 2008. Centre for Ecology and Hydrology, 24pp. (CEH Project Number: C03052) Copyright © 2008, NERC/Centre for Ecology & Hydrology This version available at http://nora.nerc.ac.uk/2281/ NERC has developed NORA to enable users to access research outputs wholly or partially funded by NERC. Copyright and other rights for material on this site are retained by the authors and/or other rights owners. Users should read the terms and conditions of use of this material at http://nora.nerc.ac.uk/policies.html#access This report is an official document prepared under contract between the customer and the Natural Environment Research Council. It should not be quoted without the permission of both the Centre for Ecology and Hydrology and the customer. Contact CEH NORA team at [email protected]

Welcome message from author
This document is posted to help you gain knowledge. Please leave a comment to let me know what you think about it! Share it to your friends and learn new things together.
Transcript

Report Pottinger, Tom; Katsiadaki, Ioanna; Juergens, Monika; Cook, Alastair; Abel, David; Sanders, Matthew. 2008 Endocrine Disruption in Catchments: EDCAT 5: Second Annual Report, January 2008. Centre for Ecology and Hydrology, 24pp. (CEH Project Number: C03052)
Copyright © 2008, NERC/Centre for Ecology & Hydrology
This version available at http://nora.nerc.ac.uk/2281/ NERC has developed NORA to enable users to access research outputs wholly or partially funded by NERC. Copyright and other rights for material on this site are retained by the authors and/or other rights owners. Users should read the terms and conditions of use of this material at http://nora.nerc.ac.uk/policies.html#access This report is an official document prepared under contract between the customer and the Natural Environment Research Council. It should not be quoted without the permission of both the Centre for Ecology and Hydrology and the customer.
Contact CEH NORA team at [email protected]
Endocrine Disruption in Catchments (EDCAT) Second Annual Report, January 2008 Project Name: EDCAT 5 Project Personnel and Affiliations: Tom Pottinger (CEH Lancaster) David Abel (CEH Lancaster) Monika Juergens (CEH Wallingford) Ioanna Katsiadaki (Cefas Weymouth) Alastair Cook (Cefas Weymouth) Matthew Sanders (Cefas Weymouth) Summary of Progress:
• The eight sample sites were visited on five occasions during 2007 (April, May, July, September and November) resulting in the collection of approximately 600 fish.
• Dissection of all samples, including those carried over from 2006, was
completed. Where required, kidney and heart samples were despatched to Cefas Weymouth for spiggin and vitellogenin determinations. For each fish, the remaining tissue was homogenised in preparation for biochemical analysis.
• The somatic data summary and preliminary statistical analysis confirm that
there are differences between the two rivers, and between sites within each river. Fish from the Ray are significantly larger than those from the Ock/Childrey Brook.
• The ongoing analysis of VTG and spiggin data continued to indicate that there
is no evidence that fish within the Ray are adversely affected by estrogenic contaminants originating from the STW at Rodbourne.
• Completion of the protein analysis of liver preparations assayed for
biotransforming activity (EROD) in 2007 confirm that fish from the Ray exhibited higher activities of the enzyme than fish from the Ock. We assume that this equates to the fish (at this site) in the Ray being exposed to higher concentrations of organic contaminants than fish in the Ock.
• Preliminary examination of the response of fish from the two rivers to a
confinement stressor indicated that fish from the Ray exhibit an attenuated response compared to those from the Ock. Although preliminary, the data may
be consistent with that from other sources which indicate that exposure to chemical stressors can attenuate the adaptive response to additional stressors.
Methods Site selection: The sample sites employed during 2007 were as described in the First Annual Report. Fish capture methods: The primary requirement of the sampling exercise is to provide sufficient fish from the selected sites to provide adequate material for biochemical analysis, while not impacting too severely on the populations themselves. As described in the previous Annual Report, the most consistently successful method of fish capture has proved to be the use of a large hand net (45 cm x 36 cm; 0.5 cm mesh; 160 cm handle) combined with wading. On occasions when the water level was too high to safely enter the river, fish were captured by hand-netting areas immediately adjacent to the bankside. This was most successful where trailing and emergent vegetation was present. The distribution of fish on both river systems is extremely patchy and we believe this confounds any attempt that might be made to assess abundance by conventional quantitative methods (electric fishing, mark-recapture). Fish processing: Following capture, fish were held temporarily in a small volume of water in buckets, and latterly in plastic bottles, before being transferred to sedative/anaesthetic (2-phenoxyethanol, 1:2000). When unresponsive to a tail pinch with forceps each fish was transferred to a labelled, capped, 12 ml polypropylene centrifuge tubes, bagged, and placed in a dry shipper for transfer to CEH Lancaster. Here the fish were transferred to a freezer (-20oC) for storage until required for dissection. Fish were weighed and measured, and heart and kidney tissue was dissected from partially thawed fish, under additional illumination and with the aid of a magnifier. The sex of each fish was recorded. Each kidney was transferred directly to a labelled 1.8 ml screw-topped cryovial. Heart tissue was transferred to a 1.5 ml capped conical centrifuge tube which was tared to 0 in order to record the weight of heart tissue collected from each fish. Heart and kidney tissue was stored frozen until being transferred to Cefas Weymouth on dry ice for VTG and spiggin analysis. The carcass remaining from each fish after dissection was minced with single-edged razor blade in glass petri dish and transferred to a volume of buffer (4:1 volume:weight; 0.05M Tris-HCl, pH 8.0, containing 0.1 M NaCl and 0.01 M EDTA). The tissue was dispersed using an Ultra-Turrax TP18/10 homogeniser with stainless steel dispersing tool (S25 N–8 G). Homogenate was cooled on ice between bursts and stored frozen in a labelled plastic tube (12 ml polypropylene centrifuge tube). Vitellogenin and spiggin analysis: Heart and kidney samples were assayed for VTG and spiggin respectively at Cefas Weymouth, using stickleback-specific ELISAs (Hahlbeck et al., 2004; Katsiadaki et al., 2002a,b). EROD: Activity of the cytochrome P450 1A monooxygenase, ethoxyresorufin–O-deethylase (EROD), was measured in liver tissue from a sub-sample of fish collected during September 2006. EROD is a reliable biomarker of exposure to polyaromatic hydrocarbons (PAHs) and polychlorinated biphenyls (PCBs). A microplate kinetic
assay requiring small amounts of tissue was adopted, based on that described by Hodson et al. (1996). The assay method fluorimetrically detect the conversion of 7-ethoxyresorufin to resorufin, the rate of conversion being proportional to the activity of the enzyme. Livers were dissected from frozen sticklebacks, weighed, and homogenized in a constant volume of 400 μl phosphate buffer (pH 7.4; 80.2 ml 1.0 M K2HPO4; 19.8 ml 1.0 M KH2PO4; 700 ml distilled water; 200 ml glycerol = 252.4 g) containing 1 mM EDTA and 1 mM dithiothreitol in a 1.5 ml capped centrifuge tube, using a motor-driven pestle. Homogenates were centrifuged at 4oC for 15 minutes. The assay was carried out in 96-well plates in a Fluoroskan Ascent plate reader with excitation at 530 nm and emission at 590 nm. For the unknowns, each well of the plate contained 50 μl liver homogenate supernatant and 50 μl of 10.0 μM 7-ethoxyresorufin in homogenisation buffer. Each sample was measured in triplicate. In addition, an eight point standard curve was included on each plate, comprising serial dilutions from 100 μl of a 50.0 μM solution of resorufin in methanol, in duplicate (50 μl resorufin + 50 μl buffer in successive wells). The plates were incubated at room temperature for 10 mins. The reaction was initiated by the addition of 10 μl of a 24 mM solution of NADPH in buffer. Each plate was scanned immediately and at 2 minute intervals for 30 minutes. Protein concentrations in the liver homogenates were determined using the method of Lorenzen (1993). A series of eight dilutions of bovine serum albumin (BSA) ranging from 0 to 1000 µg/ml using phosphate buffered saline (PBS) pH 7.4 as the diluent was carried out in duplicate in the first two rows of the plate (75 – 1.2 µg/well). To the first and 7th well in rows D-H 140 µl dw was pipetted, giving a total volume in these wells of 290 µl. A 10 µl aliquot of sample was added to the first and 7th wells in these rows (total 10 unknowns per plate). A serial dilution of each sample was accomplished by transferring 150 µl from the first well to the second and so on, to the 6th. The 150 µl remaining in the pipette was discarded. A 50 µl aliquot of 1.08 mM (3 mg/ml) fluorescamine dissolved in acetone was added to each well using a repeater pipette. Following the addition of fluorescamine the plate was shaken for one minute. Fluorescence was determined using a plate reader (Thermo Fluoroskan Ascent FL) with a 355 nm excitation filter and a 460 nm emission filter. Enzyme activity in each sample was calculated from the gradient of the fluorescence curves (change in FU/min). FU/min was converted to molarity by reference to the resorufin standard curve and normalised for protein concentration in each liver sample to give specific activity as picomoles resorufin produced per mg protein per minute. Whole-body cortisol concentrations: Corticosteroids were quantified by measurement of solvent-extractable immunoreactivity in whole-body homogenates after direct homogenization of minced stickleback tissue in ethyl acetate (5:1 volume:body weight (Pottinger and Carrick, 2001; Pottinger et al, 2002). Homogenates were centrifuged and an aliquot of each extract (10 μl) was transferred to labelled 3.5 ml polypropylene assay tubes. A standard curve was constructed by adding to a series of assay tubes, in duplicate, aliquots of ethyl acetate containing between 12.5 and 800 pg of inert cortisol (Sigma Aldrich). Blank tubes received ethyl acetate alone. A 50 μl aliquot of ethyl acetate containing 20,000 dpm of [1,2,6,7-3H]cortisol (Amersham
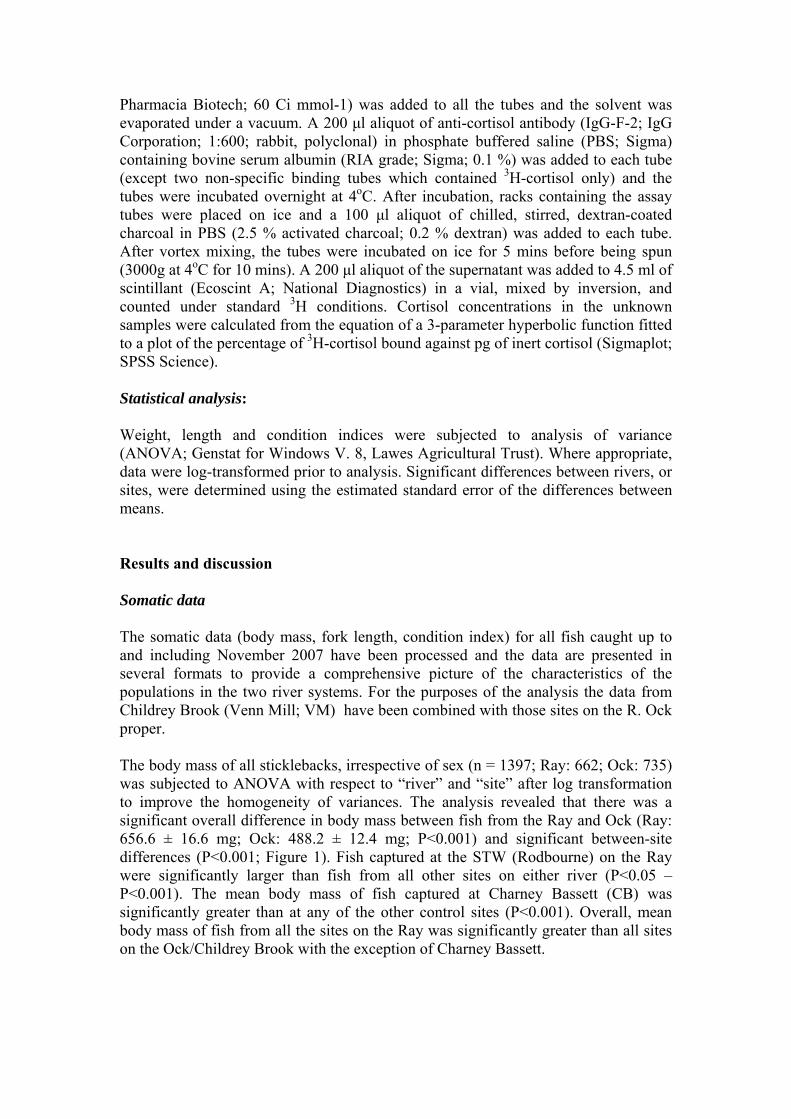
Pharmacia Biotech; 60 Ci mmol-1) was added to all the tubes and the solvent was evaporated under a vacuum. A 200 μl aliquot of anti-cortisol antibody (IgG-F-2; IgG Corporation; 1:600; rabbit, polyclonal) in phosphate buffered saline (PBS; Sigma) containing bovine serum albumin (RIA grade; Sigma; 0.1 %) was added to each tube (except two non-specific binding tubes which contained 3H-cortisol only) and the tubes were incubated overnight at 4oC. After incubation, racks containing the assay tubes were placed on ice and a 100 μl aliquot of chilled, stirred, dextran-coated charcoal in PBS (2.5 % activated charcoal; 0.2 % dextran) was added to each tube. After vortex mixing, the tubes were incubated on ice for 5 mins before being spun (3000g at 4oC for 10 mins). A 200 μl aliquot of the supernatant was added to 4.5 ml of scintillant (Ecoscint A; National Diagnostics) in a vial, mixed by inversion, and counted under standard 3H conditions. Cortisol concentrations in the unknown samples were calculated from the equation of a 3-parameter hyperbolic function fitted to a plot of the percentage of 3H-cortisol bound against pg of inert cortisol (Sigmaplot; SPSS Science). Statistical analysis: Weight, length and condition indices were subjected to analysis of variance (ANOVA; Genstat for Windows V. 8, Lawes Agricultural Trust). Where appropriate, data were log-transformed prior to analysis. Significant differences between rivers, or sites, were determined using the estimated standard error of the differences between means. Results and discussion Somatic data The somatic data (body mass, fork length, condition index) for all fish caught up to and including November 2007 have been processed and the data are presented in several formats to provide a comprehensive picture of the characteristics of the populations in the two river systems. For the purposes of the analysis the data from Childrey Brook (Venn Mill; VM) have been combined with those sites on the R. Ock proper. The body mass of all sticklebacks, irrespective of sex (n = 1397; Ray: 662; Ock: 735) was subjected to ANOVA with respect to “river” and “site” after log transformation to improve the homogeneity of variances. The analysis revealed that there was a significant overall difference in body mass between fish from the Ray and Ock (Ray: 656.6 ± 16.6 mg; Ock: 488.2 ± 12.4 mg; P<0.001) and significant between-site differences (P<0.001; Figure 1). Fish captured at the STW (Rodbourne) on the Ray were significantly larger than fish from all other sites on either river (P<0.05 – P<0.001). The mean body mass of fish captured at Charney Bassett (CB) was significantly greater than at any of the other control sites (P<0.001). Overall, mean body mass of fish from all the sites on the Ray was significantly greater than all sites on the Ock/Childrey Brook with the exception of Charney Bassett.
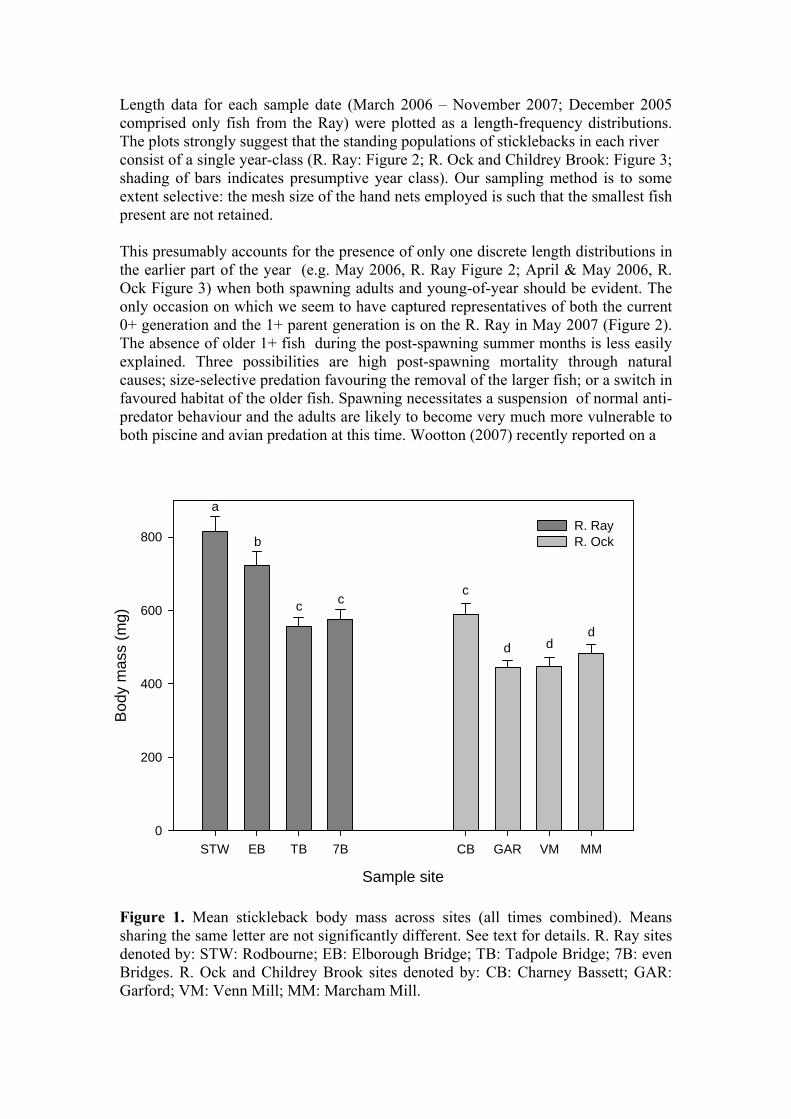
Length data for each sample date (March 2006 – November 2007; December 2005 comprised only fish from the Ray) were plotted as a length-frequency distributions. The plots strongly suggest that the standing populations of sticklebacks in each river consist of a single year-class (R. Ray: Figure 2; R. Ock and Childrey Brook: Figure 3; shading of bars indicates presumptive year class). Our sampling method is to some extent selective: the mesh size of the hand nets employed is such that the smallest fish present are not retained. This presumably accounts for the presence of only one discrete length distributions in the earlier part of the year (e.g. May 2006, R. Ray Figure 2; April & May 2006, R. Ock Figure 3) when both spawning adults and young-of-year should be evident. The only occasion on which we seem to have captured representatives of both the current 0+ generation and the 1+ parent generation is on the R. Ray in May 2007 (Figure 2). The absence of older 1+ fish during the post-spawning summer months is less easily explained. Three possibilities are high post-spawning mortality through natural causes; size-selective predation favouring the removal of the larger fish; or a switch in favoured habitat of the older fish. Spawning necessitates a suspension of normal anti-predator behaviour and the adults are likely to become very much more vulnerable to both piscine and avian predation at this time. Wootton (2007) recently reported on a
Figure 1. Mean stickleback body mass across sites (all times combined). Means sharing the same letter are not significantly different. See text for details. R. Ray sites denoted by: STW: Rodbourne; EB: Elborough Bridge; TB: Tadpole Bridge; 7B: even Bridges. R. Ock and Childrey Brook sites denoted by: CB: Charney Bassett; GAR: Garford; VM: Venn Mill; MM: Marcham Mill.
Sample site
STW EB TB 7B CB GAR VM MM
Bod
y m
ass
(mg)
0
200
400
600
800R. RayR. Ock
a
b
c cc
d dd
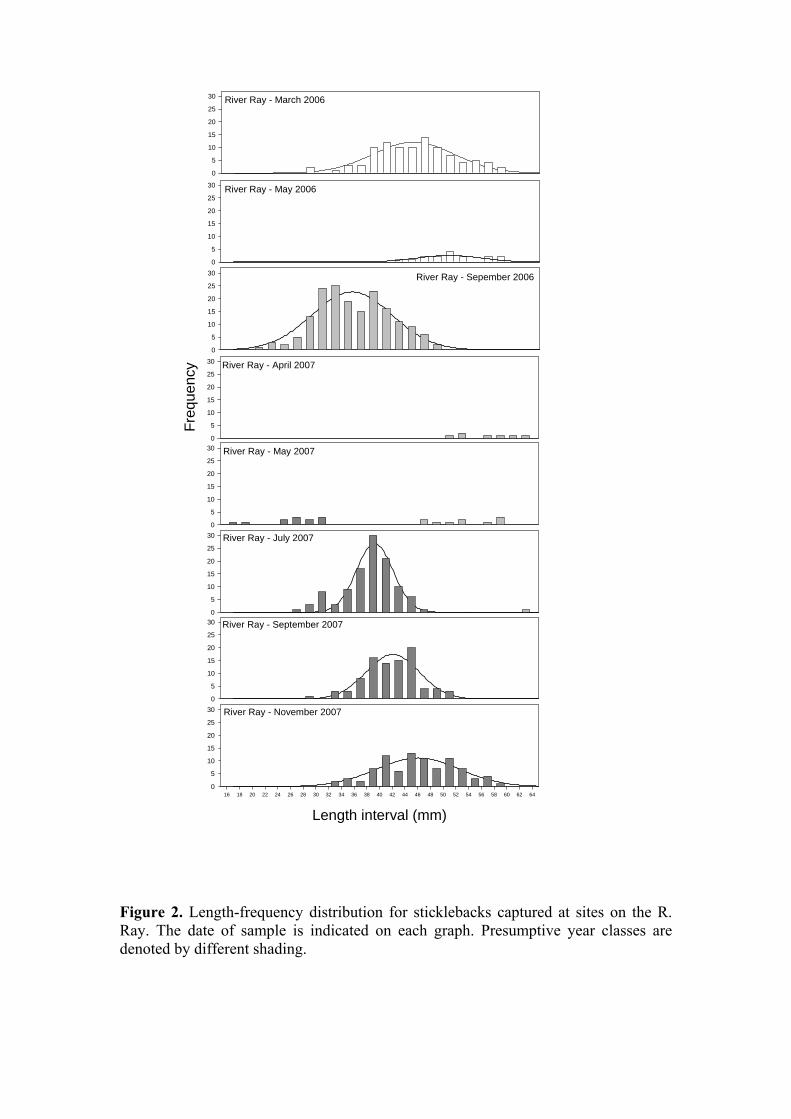
Figure 2. Length-frequency distribution for sticklebacks captured at sites on the R. Ray. The date of sample is indicated on each graph. Presumptive year classes are denoted by different shading.
River Ray - March 2006
0
5
10
15
20
25
30
River Ray - September 2007
0
5
10
15
20
25
30
River Ray - July 2007
0
5
10
15
20
25
30
River Ray - May 2007
0
5
10
15
20
25
30
River Ray - April 2007
Freq
uenc
y
0
5
10
15
20
25
30
River Ray - Sepember 2006
0
5
10
15
20
25
30
River Ray - May 2006
0
5
10
15
20
25
30
River Ray - November 2007
Length interval (mm)16 18 20 22 24 26 28 30 32 34 36 38 40 42 44 46 48 50 52 54 56 58 60 62 64
0
5
10
15
20
25
30
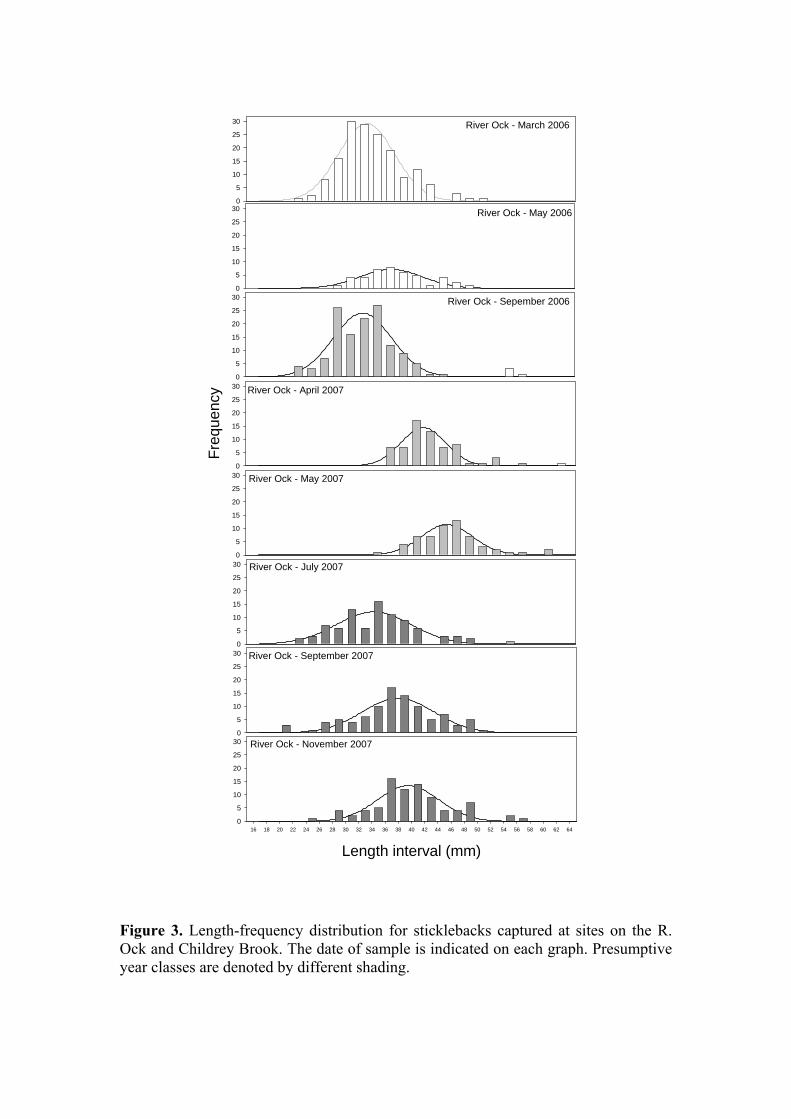
Figure 3. Length-frequency distribution for sticklebacks captured at sites on the R. Ock and Childrey Brook. The date of sample is indicated on each graph. Presumptive year classes are denoted by different shading.
River Ock - March 2006
0
5
10
15
20
25
30
River Ock - September 2007
0
5
10
15
20
25
30
River Ock - July 2007
0
5
10
15
20
25
30
River Ock - May 2007
0
5
10
15
20
25
30
River Ock - April 2007
Freq
uenc
y
0
5
10
15
20
25
30
River Ock - Sepember 2006
0
5
10
15
20
25
30
River Ock - May 2006
0
5
10
15
20
25
30
River Ock - November 2007
Length interval (mm)16 18 20 22 24 26 28 30 32 34 36 38 40 42 44 46 48 50 52 54 56 58 60 62 64
0
5
10
15
20
25
30
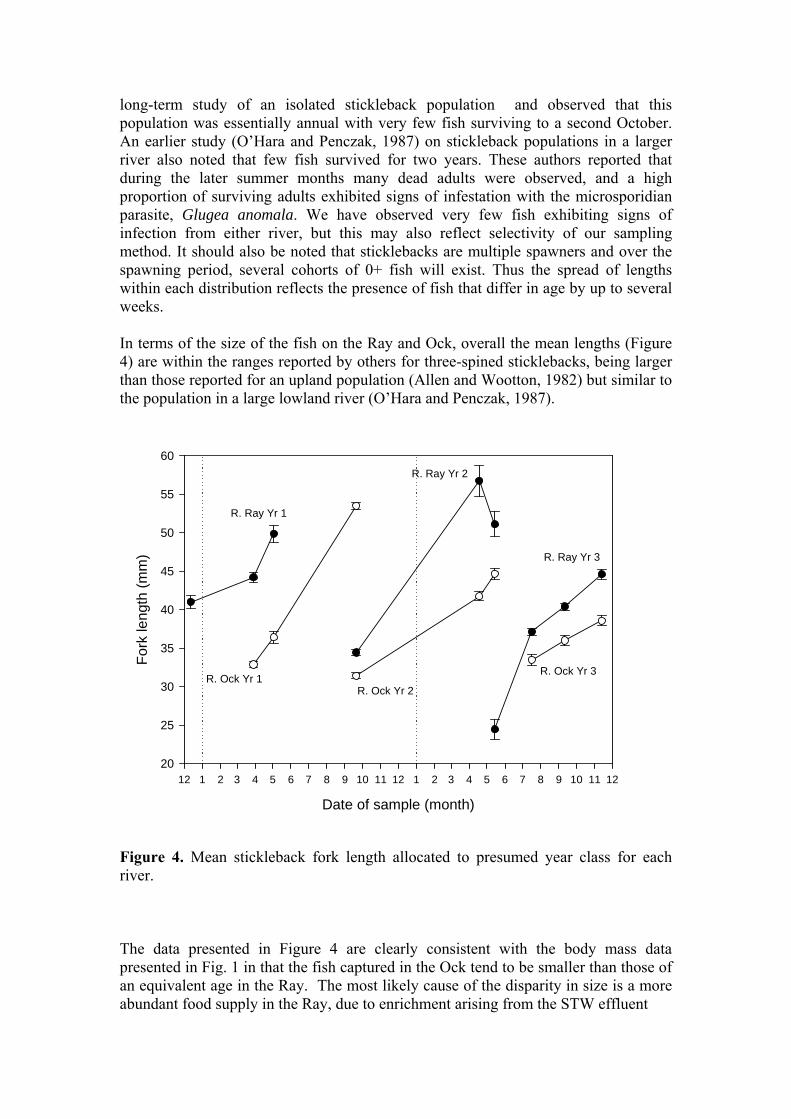
long-term study of an isolated stickleback population and observed that this population was essentially annual with very few fish surviving to a second October. An earlier study (O’Hara and Penczak, 1987) on stickleback populations in a larger river also noted that few fish survived for two years. These authors reported that during the later summer months many dead adults were observed, and a high proportion of surviving adults exhibited signs of infestation with the microsporidian parasite, Glugea anomala. We have observed very few fish exhibiting signs of infection from either river, but this may also reflect selectivity of our sampling method. It should also be noted that sticklebacks are multiple spawners and over the spawning period, several cohorts of 0+ fish will exist. Thus the spread of lengths within each distribution reflects the presence of fish that differ in age by up to several weeks. In terms of the size of the fish on the Ray and Ock, overall the mean lengths (Figure 4) are within the ranges reported by others for three-spined sticklebacks, being larger than those reported for an upland population (Allen and Wootton, 1982) but similar to the population in a large lowland river (O’Hara and Penczak, 1987).
Figure 4. Mean stickleback fork length allocated to presumed year class for each river. The data presented in Figure 4 are clearly consistent with the body mass data presented in Fig. 1 in that the fish captured in the Ock tend to be smaller than those of an equivalent age in the Ray. The most likely cause of the disparity in size is a more abundant food supply in the Ray, due to enrichment arising from the STW effluent
Date of sample (month)
12 1 2 3 4 5 6 7 8 9 10 11 12 1 2 3 4 5 6 7 8 9 10 11 12
Fork
leng
th (m
m)
20
25
30
35
40
45
50
55
60
R. Ray Yr 1
R. Ock Yr 1
R. Ray Yr 2
R. Ock Yr 2
R. Ock Yr 3
R. Ray Yr 3
Size interval (mm)
10 20 30 40 50 60 70
Cum
ulat
ive
perc
ent
0
10
20
30
40
50
60
70
80
90
100
Ray Ock
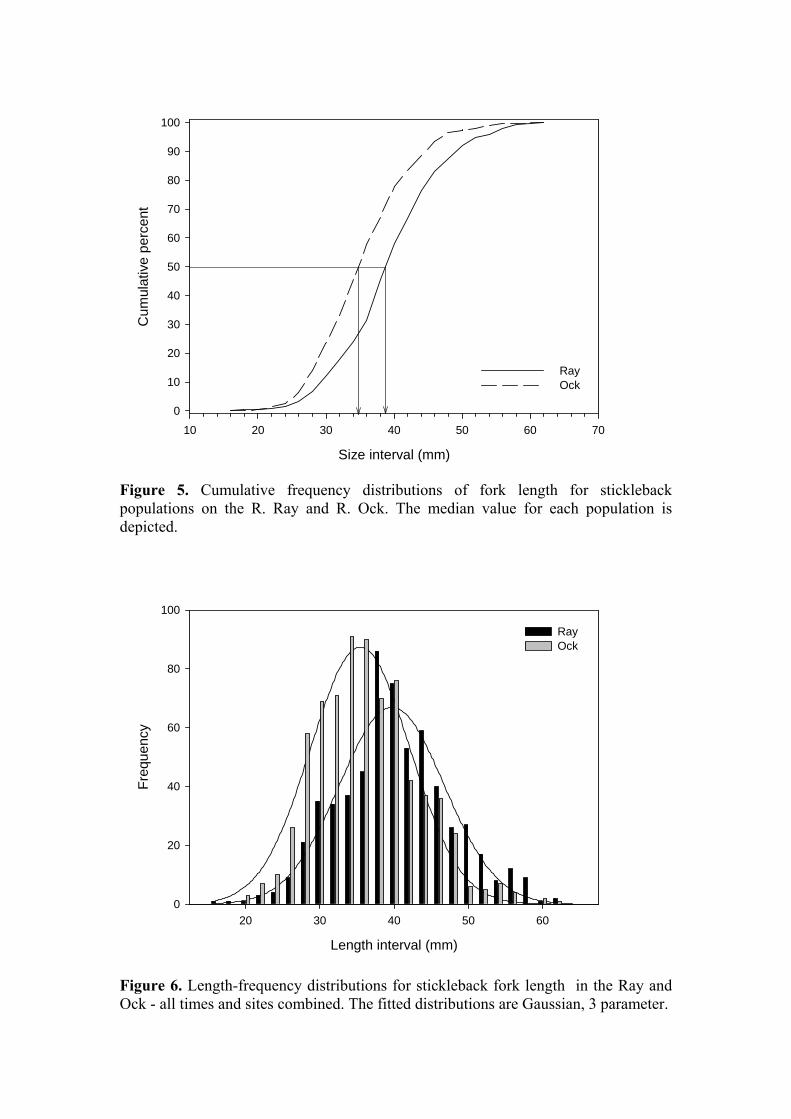
Figure 5. Cumulative frequency distributions of fork length for stickleback populations on the R. Ray and R. Ock. The median value for each population is depicted.
Figure 6. Length-frequency distributions for stickleback fork length in the Ray and Ock - all times and sites combined. The fitted distributions are Gaussian, 3 parameter.
Length interval (mm)
20 30 40 50 60
Freq
uenc
y
0
20
40
60
80
100
Ray Ock
(De Bruyn et al., 2003). This seems more probable than a genetic difference in growth trajectory, although heritable differences in growth potential have been reported for sticklebacks (Wright et al., 2004). However, this interpretation assumes that both populations spawned at the same time, which is not necessarily the case. Local conditions in the Ray may favour earlier spawning than in the Ock, sufficient to account for the disparity in length and weight of fish from the two rivers. However, the fact that the largest fish overall are found immediately downstream of the STW outfall does suggest that enrichment is a factor. Figures 5 and 6 provide further evidence that the two populations are different. Both provide some insight into the structure of the populations – although fish on the Ray are overall larger than those from the Ock, the maximum size reached by both populations appears to be similar. In Figure 5, the median values of the two populations differ, but both reach a similar maximum size. In Figure 6 the Ock distribution clearly contains higher numbers of smaller fish than is evident in the distribution derived from the Ray data, although both distributions encompass a similar range of lengths.
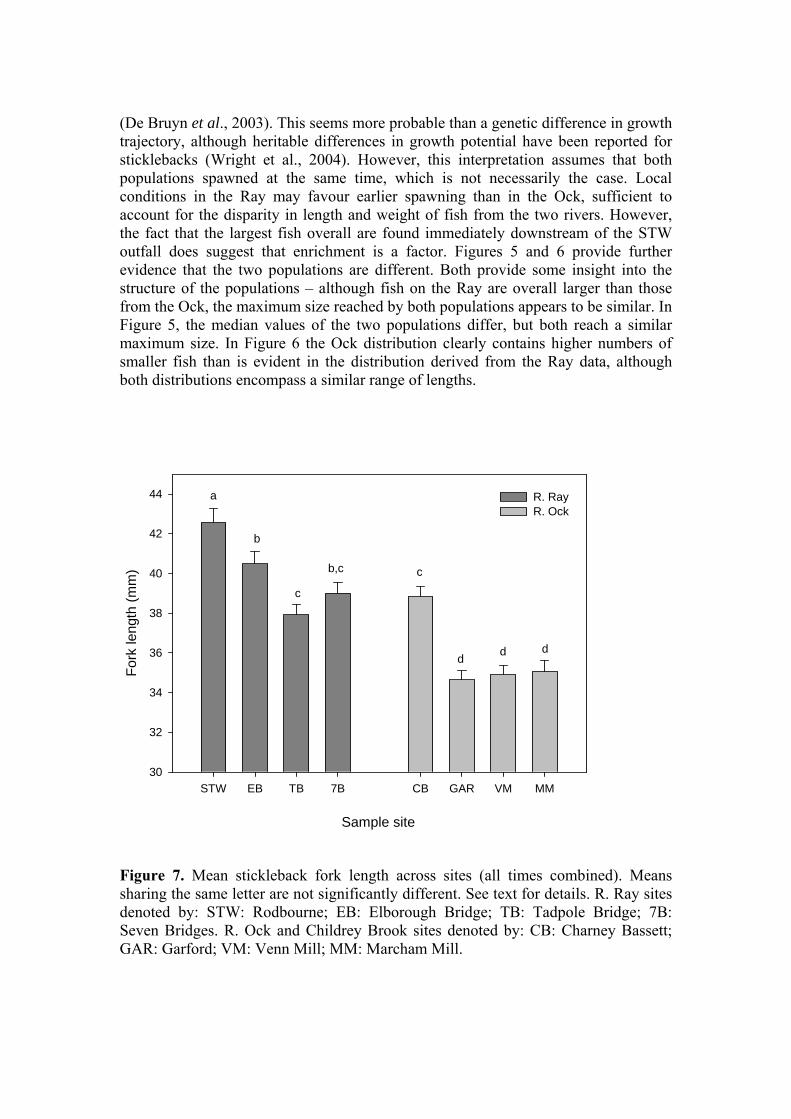
Figure 7. Mean stickleback fork length across sites (all times combined). Means sharing the same letter are not significantly different. See text for details. R. Ray sites denoted by: STW: Rodbourne; EB: Elborough Bridge; TB: Tadpole Bridge; 7B: Seven Bridges. R. Ock and Childrey Brook sites denoted by: CB: Charney Bassett; GAR: Garford; VM: Venn Mill; MM: Marcham Mill.
Sample site
STW EB TB 7B CB GAR VM MM
Fork
leng
th (m
m)
30
32
34
36
38
40
42
44 R. RayR. Ock
a
b
c
c
d d d
b,c
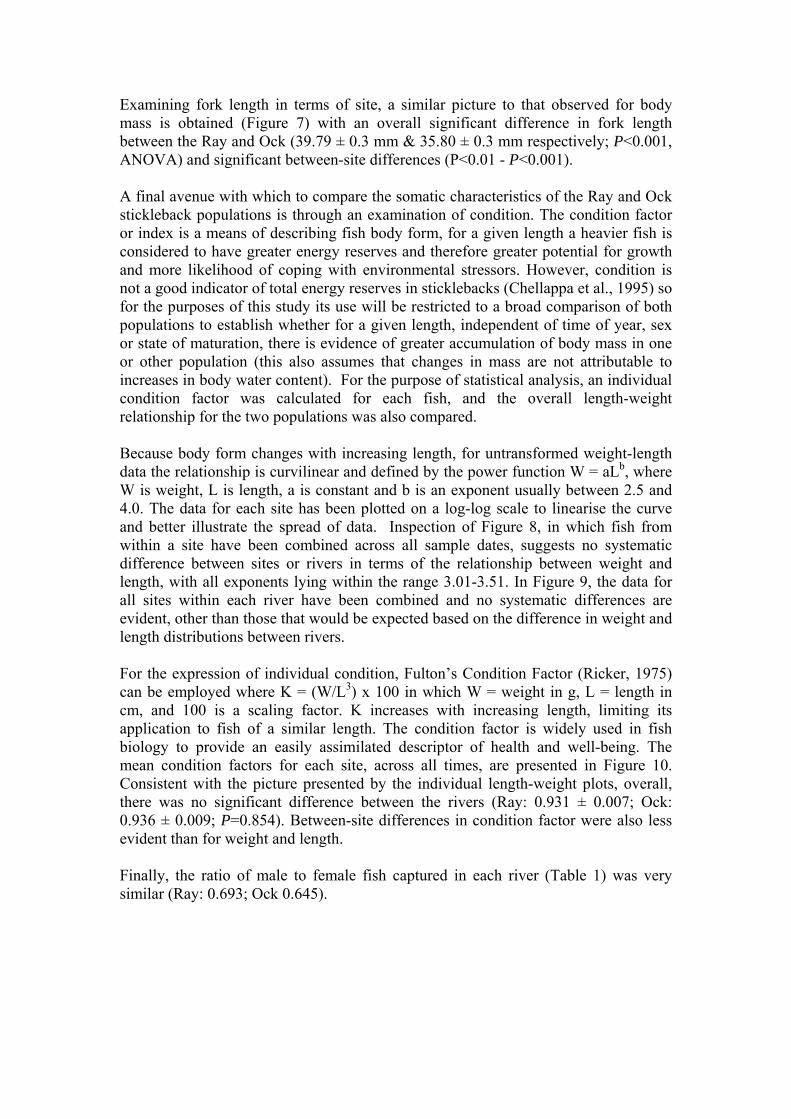
Examining fork length in terms of site, a similar picture to that observed for body mass is obtained (Figure 7) with an overall significant difference in fork length between the Ray and Ock (39.79 ± 0.3 mm & 35.80 ± 0.3 mm respectively; P<0.001, ANOVA) and significant between-site differences (P<0.01 - P<0.001). A final avenue with which to compare the somatic characteristics of the Ray and Ock stickleback populations is through an examination of condition. The condition factor or index is a means of describing fish body form, for a given length a heavier fish is considered to have greater energy reserves and therefore greater potential for growth and more likelihood of coping with environmental stressors. However, condition is not a good indicator of total energy reserves in sticklebacks (Chellappa et al., 1995) so for the purposes of this study its use will be restricted to a broad comparison of both populations to establish whether for a given length, independent of time of year, sex or state of maturation, there is evidence of greater accumulation of body mass in one or other population (this also assumes that changes in mass are not attributable to increases in body water content). For the purpose of statistical analysis, an individual condition factor was calculated for each fish, and the overall length-weight relationship for the two populations was also compared. Because body form changes with increasing length, for untransformed weight-length data the relationship is curvilinear and defined by the power function W = aLb, where W is weight, L is length, a is constant and b is an exponent usually between 2.5 and 4.0. The data for each site has been plotted on a log-log scale to linearise the curve and better illustrate the spread of data. Inspection of Figure 8, in which fish from within a site have been combined across all sample dates, suggests no systematic difference between sites or rivers in terms of the relationship between weight and length, with all exponents lying within the range 3.01-3.51. In Figure 9, the data for all sites within each river have been combined and no systematic differences are evident, other than those that would be expected based on the difference in weight and length distributions between rivers. For the expression of individual condition, Fulton’s Condition Factor (Ricker, 1975) can be employed where K = (W/L3) x 100 in which W = weight in g, L = length in cm, and 100 is a scaling factor. K increases with increasing length, limiting its application to fish of a similar length. The condition factor is widely used in fish biology to provide an easily assimilated descriptor of health and well-being. The mean condition factors for each site, across all times, are presented in Figure 10. Consistent with the picture presented by the individual length-weight plots, overall, there was no significant difference between the rivers (Ray: 0.931 ± 0.007; Ock: 0.936 ± 0.009; P=0.854). Between-site differences in condition factor were also less evident than for weight and length. Finally, the ratio of male to female fish captured in each river (Table 1) was very similar (Ray: 0.693; Ock 0.645).
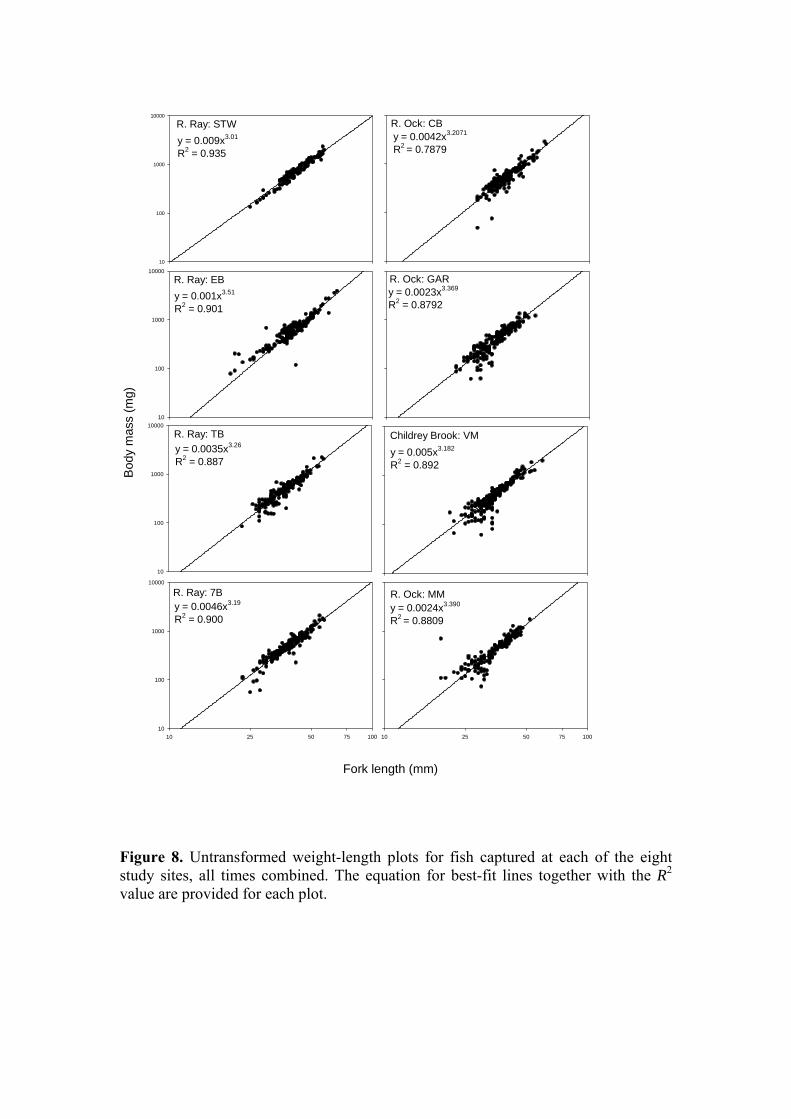
Figure 8. Untransformed weight-length plots for fish captured at each of the eight study sites, all times combined. The equation for best-fit lines together with the R2 value are provided for each plot.
R. Ray: STW
10
100
1000
10000
R. Ray: 7B
10 25 50 75 10010
100
1000
10000
R. Ray: TB
Bod
y m
ass
(mg)
10
100
1000
10000
R. Ray: EB
10
100
1000
10000R. Ock: GAR
X DataChildrey Brook: VM
R. Ock: MM
Fork length (mm)
10 25 50 75 100
R. Ock: CBy = 0.009x3.01
R2 = 0.935
y = 0.001x3.51
R2 = 0.901
y = 0.0035x3.26
R2 = 0.887
y = 0.0046x3.19
R2 = 0.900
y = 0.0042x3.2071
R2 = 0.7879
y = 0.0023x3.369
R2 = 0.8792
y = 0.005x3.182
R2 = 0.892
y = 0.0024x3.390
R2 = 0.8809
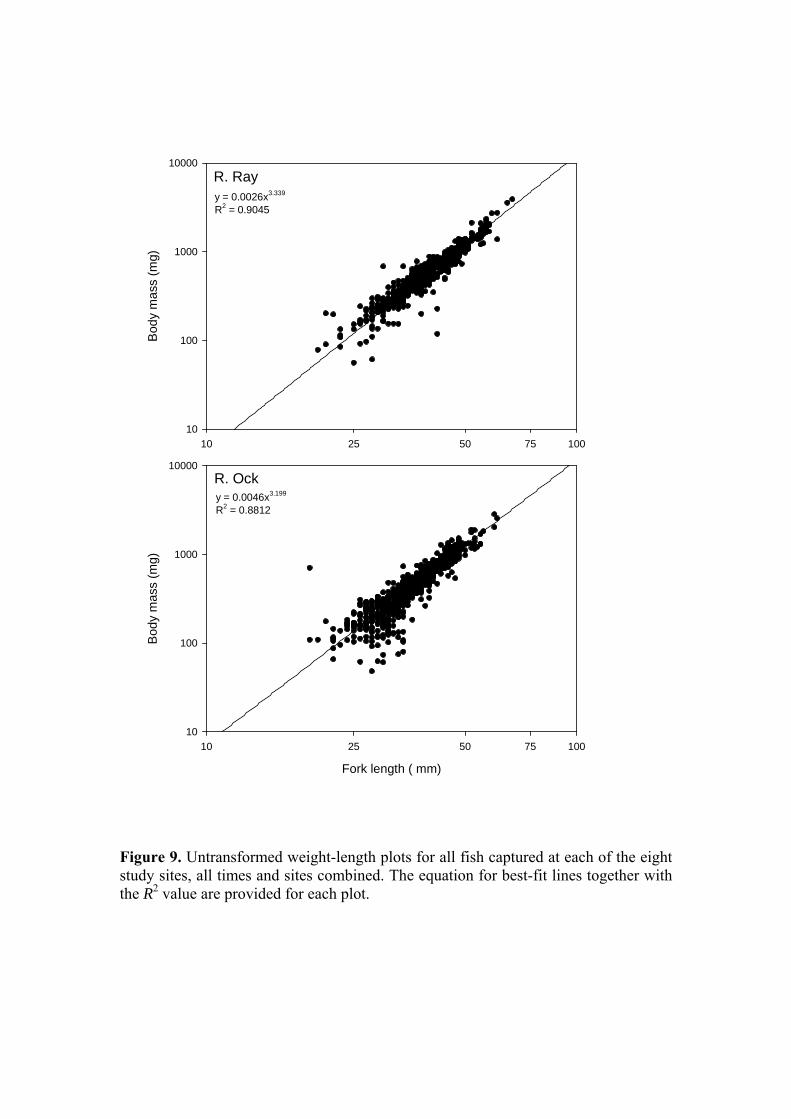
Figure 9. Untransformed weight-length plots for all fish captured at each of the eight study sites, all times and sites combined. The equation for best-fit lines together with the R2 value are provided for each plot.
R. Ray
10 25 50 75 100
Bod
y m
ass
(mg)
10
100
1000
10000
R. Ock
Fork length ( mm)
10 25 50 75 100
Bod
y m
ass
(mg)
10
100
1000
10000
y = 0.0026x3.339
R2 = 0.9045
y = 0.0046x3.199
R2 = 0.8812
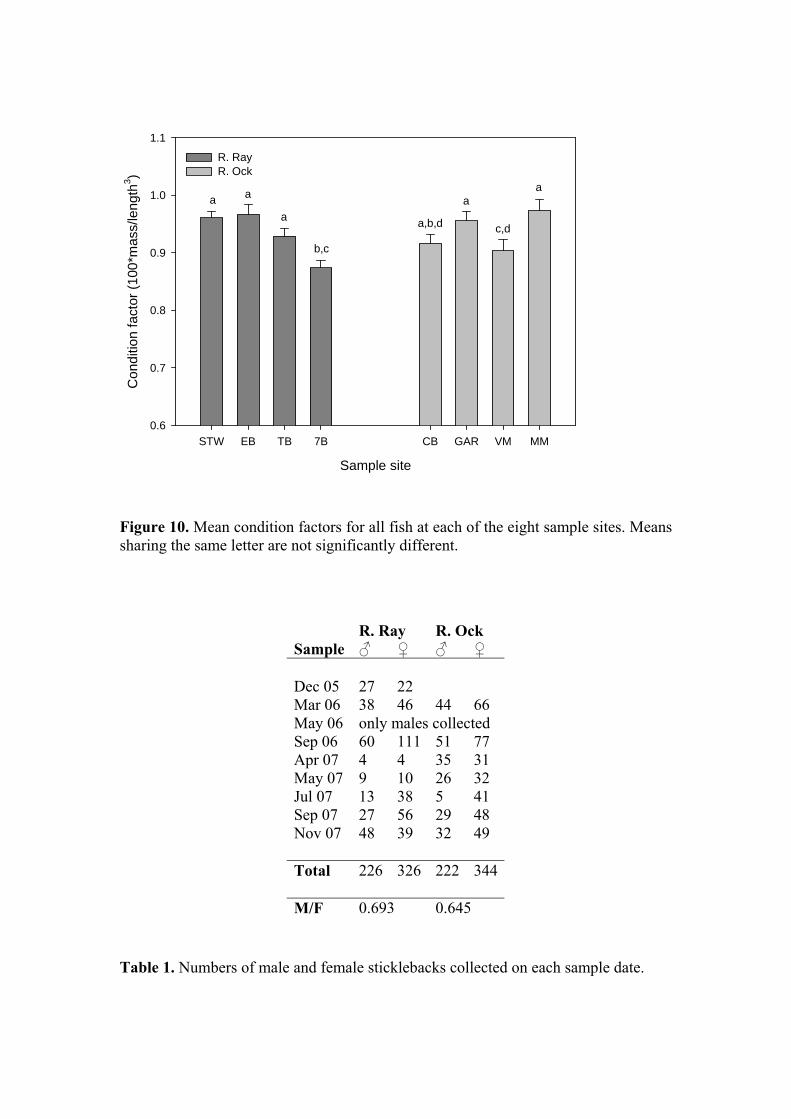
Figure 10. Mean condition factors for all fish at each of the eight sample sites. Means sharing the same letter are not significantly different. Table 1. Numbers of male and female sticklebacks collected on each sample date.
R. Ray R. Ock Sample ♂ ♀ ♂ ♀ Dec 05 27 22 Mar 06 38 46 44 66 May 06 only males collected Sep 06 60 111 51 77 Apr 07 4 4 35 31 May 07 9 10 26 32 Jul 07 13 38 5 41 Sep 07 27 56 29 48 Nov 07 48 39 32 49 Total 226 326 222 344 M/F 0.693 0.645
Sample site
STW EB TB 7B CB GAR VM MM
Con
ditio
n fa
ctor
(100
*mas
s/le
ngth
3 )
0.6
0.7
0.8
0.9
1.0
1.1
R. RayR. Ock
a a
a
b,c
a,b,d
a
c,d
a
Biomarkers of endocrine disruption Vitellogenin (VTG) concentrations have been measured in male fish from the Ray on nine occasions and from the Ock on eight occasions. The results are plotted as “raw” data in vertical point plots (Figures 11 & 12) to indicate the range of values encountered and the lack of trends, either temporal or spatial, within each river. These plots include VTG data derived from plasma, whole body homogenates, and heart tissue. Because of parity between sites at a given sample date with regard to analytical approach all VTG measurements have been consolidated. For comparisons along the x-axis functional equivalence can be assumed between VTG values derived from analysis of plasma and of heart tissue, but the data derived from the assay of whole-body homogenates should be considered separately and are therefore indicated on each Figure. Overall, there was a significant difference in VTG concentrations in males between rivers, with those from the Ray (5.688 ± 2.8 µg/ml; n = 184) significantly lower than those from the Ock (8.676 ± 2.4 µg/ml; n = 141; P<0.001; Figure 14). The high degree of variability in the numbers of fish caught at each site renders a site x time x river comparison impossible, instead, the mean VTG levels for the male fish at each site over all time points were compared and are plotted in Figure 13. There was a highly significant site-to-site variation in VTG concentrations (P<0.001) but no distinct trends were evident. To place these data in the context of results obtained from laboratory-based exposure studies: during various studies conducted at CEH, VTG has been measured in the heart tissue of sticklebacks exposed to estradiol-17β (E2) and ethinylestradiol (EE2). For male sticklebacks exposed to 26 ng/l E2 (actual) the mean measured VTG concentration was 157 µg/ml. For male sticklebacks exposed to 15 ng/l EE2 (actual) the mean measured VTG concentration was 46 µg/ml. These levels relate to baseline concentrations in control male sticklebacks of < 0.1 µg/ml (CEH & Cefas unpublished data; EDEN E2 and EE2 definitive studies). The range of VTG values observed among the male fish during the current study, when compared to laboratory data, includes many within the range that might be taken as indicative of exposure to estrogenic stimulation. However, the data do not provide any indication that estrogenic contamination within the Ray, if present, arises from the STW input. VTG levels in fish from the STW site were among the lowest at any of the eight study sites. Furthermore, as already noted, mean VTG levels on the Ock exceeded those on the Ray. We conclude that the VTG data do not support the contention that the STW effluent is a source of estrogenic contamination sufficiently high to evoke inappropriate VTG synthesis in male sticklebacks. [Analysis of VTG levels in female fish, and spiggin levels in kidneys from both sexes, has been finished but collation and statistical analysis of these data has not been completed. They will be presented at the next steering group meeting.]
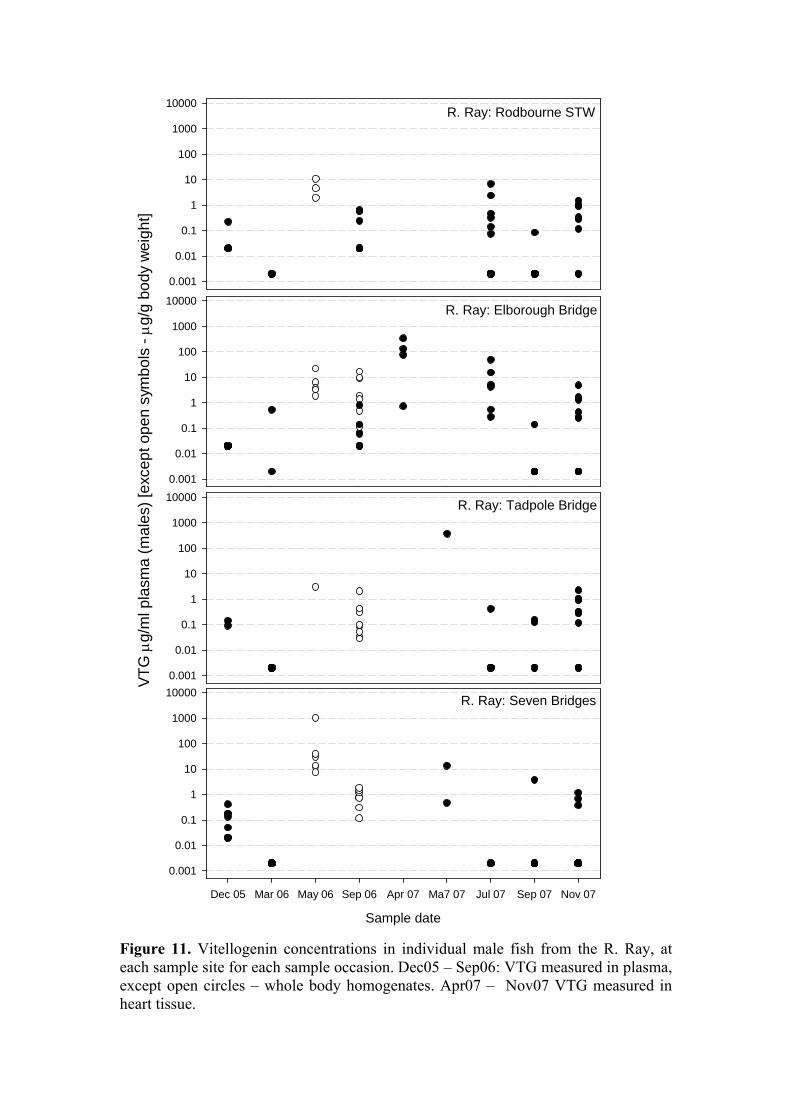
Figure 11. Vitellogenin concentrations in individual male fish from the R. Ray, at each sample site for each sample occasion. Dec05 – Sep06: VTG measured in plasma, except open circles – whole body homogenates. Apr07 – Nov07 VTG measured in heart tissue.
R. Ray: Rodbourne STW
0.001
0.01
0.1
1
10
100
1000
10000
R. Ray: Elborough Bridge
VTG
μg/
ml p
lasm
a (m
ales
) [ex
cept
ope
n sy
mbo
ls - μg
/g b
ody
wei
ght]
0.001
0.01
0.1
1
10
100
1000
10000
R. Ray: Tadpole Bridge
0.001
0.01
0.1
1
10
100
1000
10000
R. Ray: Seven Bridges
Sample date
Dec 05 Mar 06 May 06 Sep 06 Apr 07 Ma7 07 Jul 07 Sep 07 Nov 07
0.001
0.01
0.1
1
10
100
1000
10000
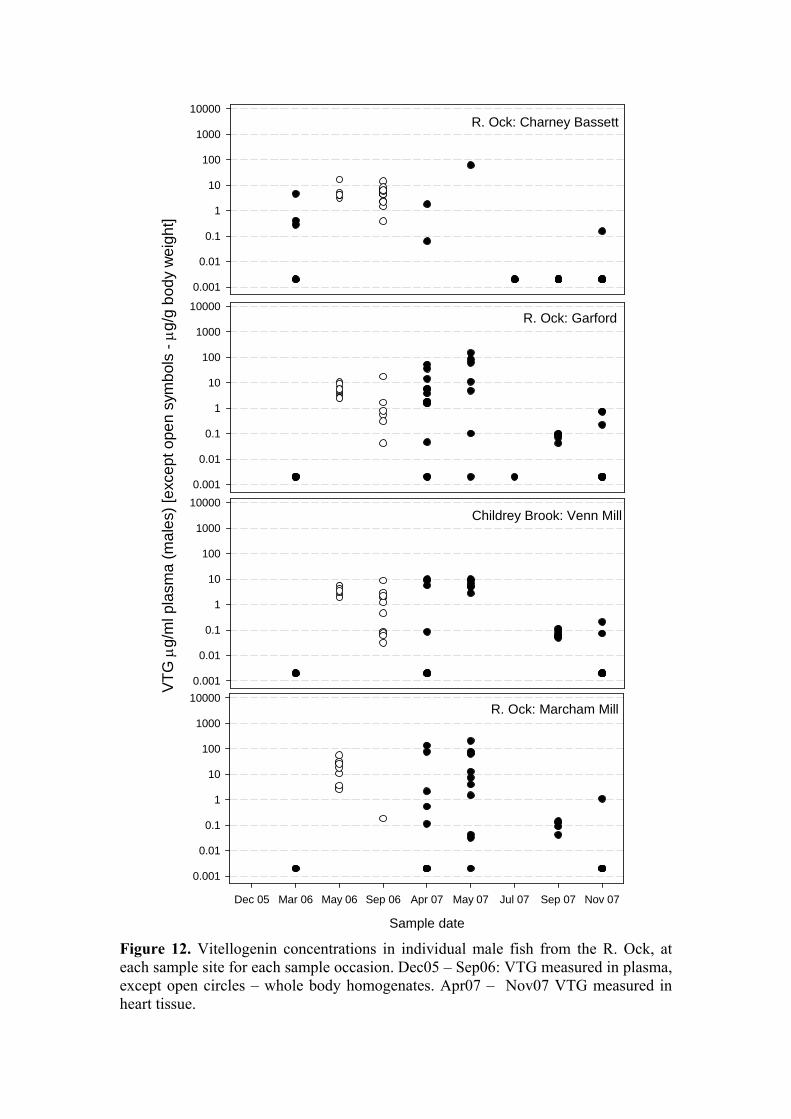
Figure 12. Vitellogenin concentrations in individual male fish from the R. Ock, at each sample site for each sample occasion. Dec05 – Sep06: VTG measured in plasma, except open circles – whole body homogenates. Apr07 – Nov07 VTG measured in heart tissue.
R. Ock: Charney Bassett
0.001
0.01
0.1
1
10
100
1000
10000
R. Ock: Garford
VTG
μg/
ml p
lasm
a (m
ales
) [ex
cept
ope
n sy
mbo
ls - μg
/g b
ody
wei
ght]
0.001
0.01
0.1
1
10
100
1000
10000
Childrey Brook: Venn Mill
0.001
0.01
0.1
1
10
100
1000
10000
R. Ock: Marcham Mill
Sample date
Dec 05 Mar 06 May 06 Sep 06 Apr 07 May 07 Jul 07 Sep 07 Nov 07
0.001
0.01
0.1
1
10
100
1000
10000
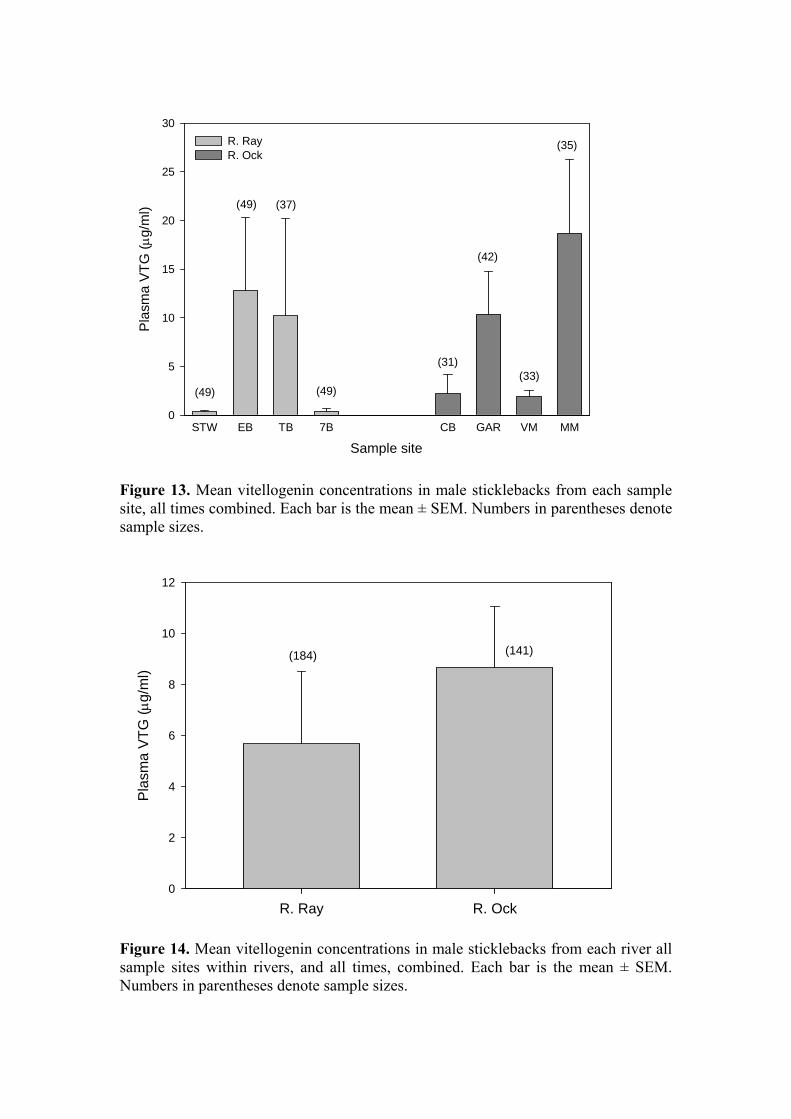
Figure 13. Mean vitellogenin concentrations in male sticklebacks from each sample site, all times combined. Each bar is the mean ± SEM. Numbers in parentheses denote sample sizes.
Figure 14. Mean vitellogenin concentrations in male sticklebacks from each river all sample sites within rivers, and all times, combined. Each bar is the mean ± SEM. Numbers in parentheses denote sample sizes.
Sample siteSTW EB TB 7B CB GAR VM MM
Pla
sma
VTG
(μg/
ml)
0
5
10
15
20
25
30R. RayR. Ock
(49)
(49) (37)
(49)
(31)
(42)
(33)
(35)
R. Ray R. Ock
Pla
sma
VTG
(μg/
ml)
0
2
4
6
8
10
12
(184) (141)
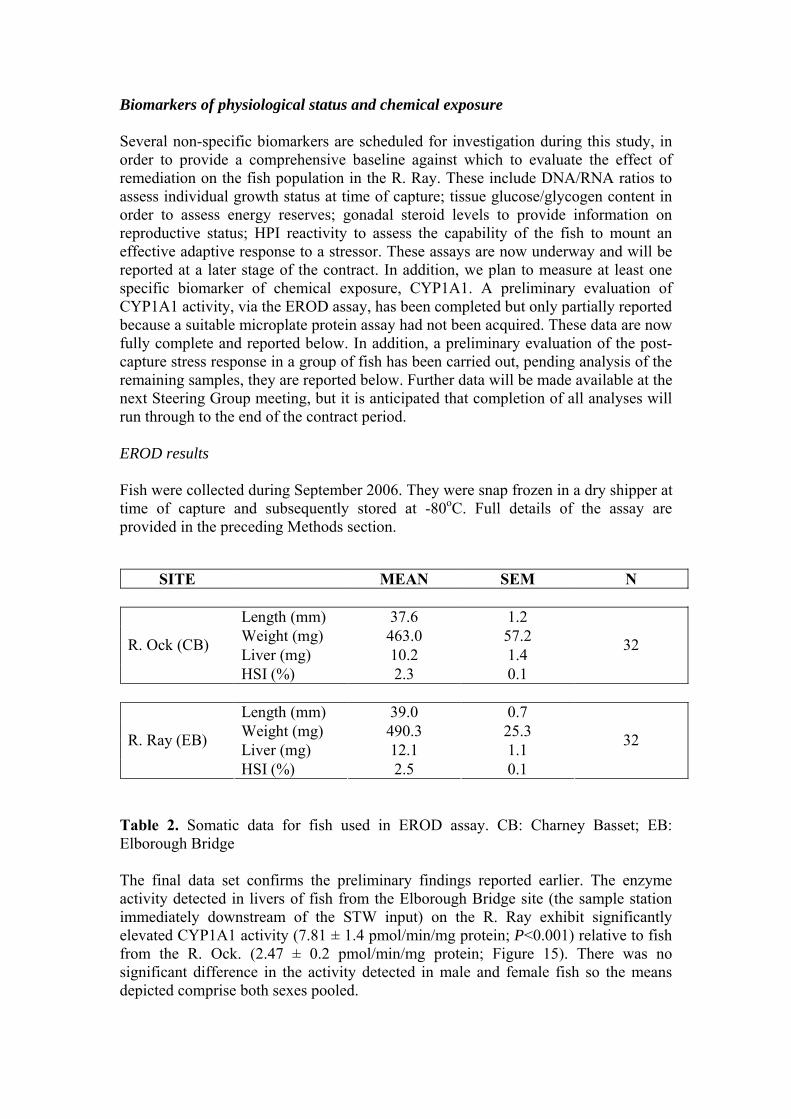
Biomarkers of physiological status and chemical exposure Several non-specific biomarkers are scheduled for investigation during this study, in order to provide a comprehensive baseline against which to evaluate the effect of remediation on the fish population in the R. Ray. These include DNA/RNA ratios to assess individual growth status at time of capture; tissue glucose/glycogen content in order to assess energy reserves; gonadal steroid levels to provide information on reproductive status; HPI reactivity to assess the capability of the fish to mount an effective adaptive response to a stressor. These assays are now underway and will be reported at a later stage of the contract. In addition, we plan to measure at least one specific biomarker of chemical exposure, CYP1A1. A preliminary evaluation of CYP1A1 activity, via the EROD assay, has been completed but only partially reported because a suitable microplate protein assay had not been acquired. These data are now fully complete and reported below. In addition, a preliminary evaluation of the post-capture stress response in a group of fish has been carried out, pending analysis of the remaining samples, they are reported below. Further data will be made available at the next Steering Group meeting, but it is anticipated that completion of all analyses will run through to the end of the contract period. EROD results Fish were collected during September 2006. They were snap frozen in a dry shipper at time of capture and subsequently stored at -80oC. Full details of the assay are provided in the preceding Methods section.
Table 2. Somatic data for fish used in EROD assay. CB: Charney Basset; EB: Elborough Bridge The final data set confirms the preliminary findings reported earlier. The enzyme activity detected in livers of fish from the Elborough Bridge site (the sample station immediately downstream of the STW input) on the R. Ray exhibit significantly elevated CYP1A1 activity (7.81 ± 1.4 pmol/min/mg protein; P<0.001) relative to fish from the R. Ock. (2.47 ± 0.2 pmol/min/mg protein; Figure 15). There was no significant difference in the activity detected in male and female fish so the means depicted comprise both sexes pooled.
SITE MEAN SEM N
Length (mm) 37.6 1.2 Weight (mg) 463.0 57.2 Liver (mg) 10.2 1.4 R. Ock (CB)
HSI (%) 2.3 0.1
32
Length (mm) 39.0 0.7 Weight (mg) 490.3 25.3 Liver (mg) 12.1 1.1 R. Ray (EB)
HSI (%) 2.5 0.1
32
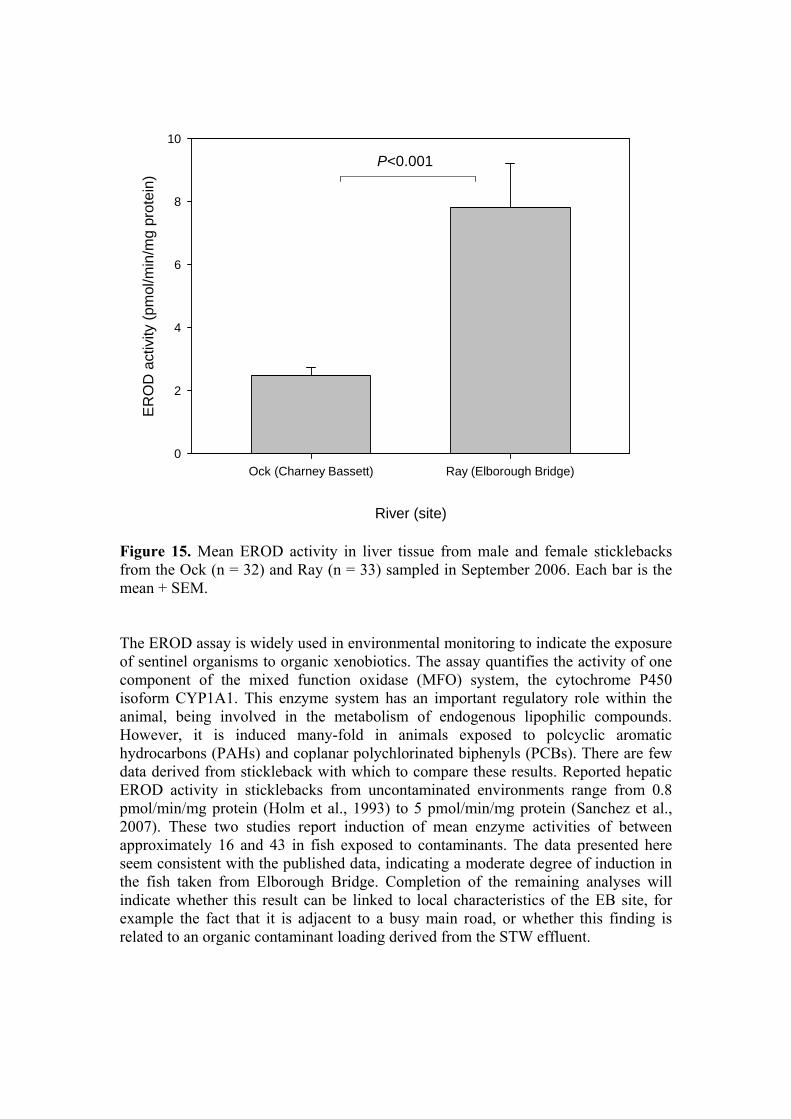
Figure 15. Mean EROD activity in liver tissue from male and female sticklebacks from the Ock (n = 32) and Ray (n = 33) sampled in September 2006. Each bar is the mean + SEM. The EROD assay is widely used in environmental monitoring to indicate the exposure of sentinel organisms to organic xenobiotics. The assay quantifies the activity of one component of the mixed function oxidase (MFO) system, the cytochrome P450 isoform CYP1A1. This enzyme system has an important regulatory role within the animal, being involved in the metabolism of endogenous lipophilic compounds. However, it is induced many-fold in animals exposed to polcyclic aromatic hydrocarbons (PAHs) and coplanar polychlorinated biphenyls (PCBs). There are few data derived from stickleback with which to compare these results. Reported hepatic EROD activity in sticklebacks from uncontaminated environments range from 0.8 pmol/min/mg protein (Holm et al., 1993) to 5 pmol/min/mg protein (Sanchez et al., 2007). These two studies report induction of mean enzyme activities of between approximately 16 and 43 in fish exposed to contaminants. The data presented here seem consistent with the published data, indicating a moderate degree of induction in the fish taken from Elborough Bridge. Completion of the remaining analyses will indicate whether this result can be linked to local characteristics of the EB site, for example the fact that it is adjacent to a busy main road, or whether this finding is related to an organic contaminant loading derived from the STW effluent.
River (site)
Ock (Charney Bassett) Ray (Elborough Bridge)
ER
OD
act
ivity
(pm
ol/m
in/m
g pr
otei
n)
0
2
4
6
8
10
P<0.001
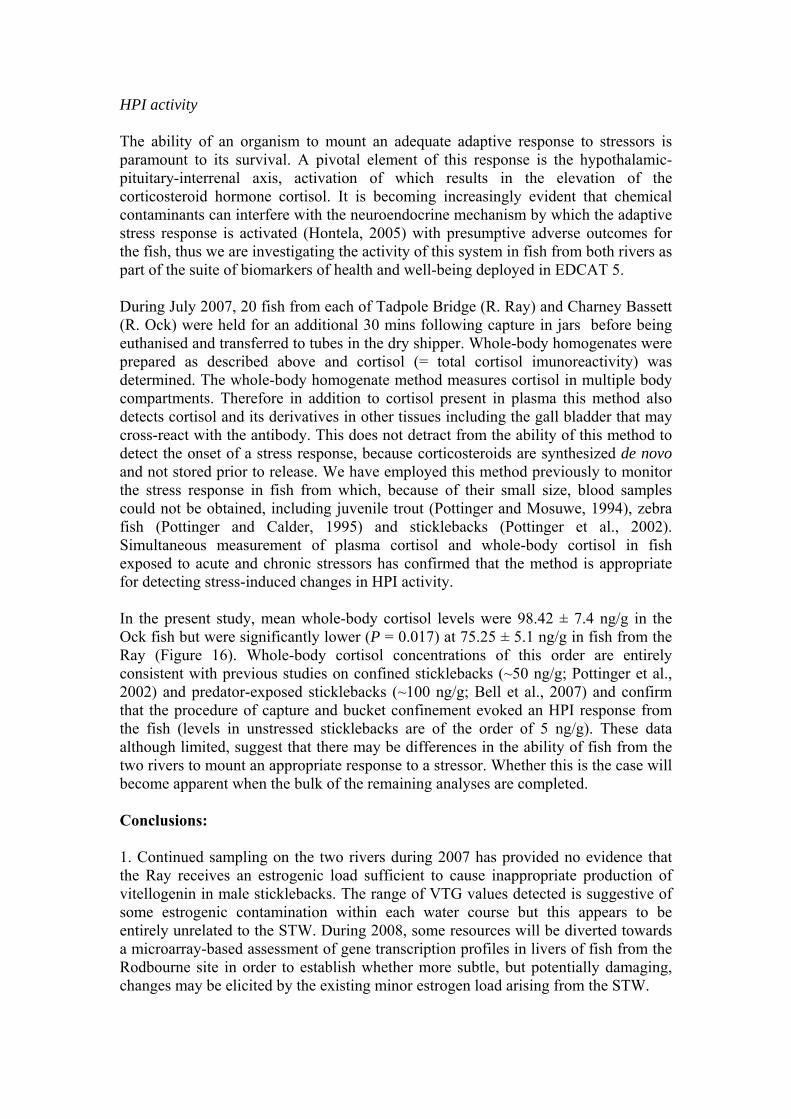
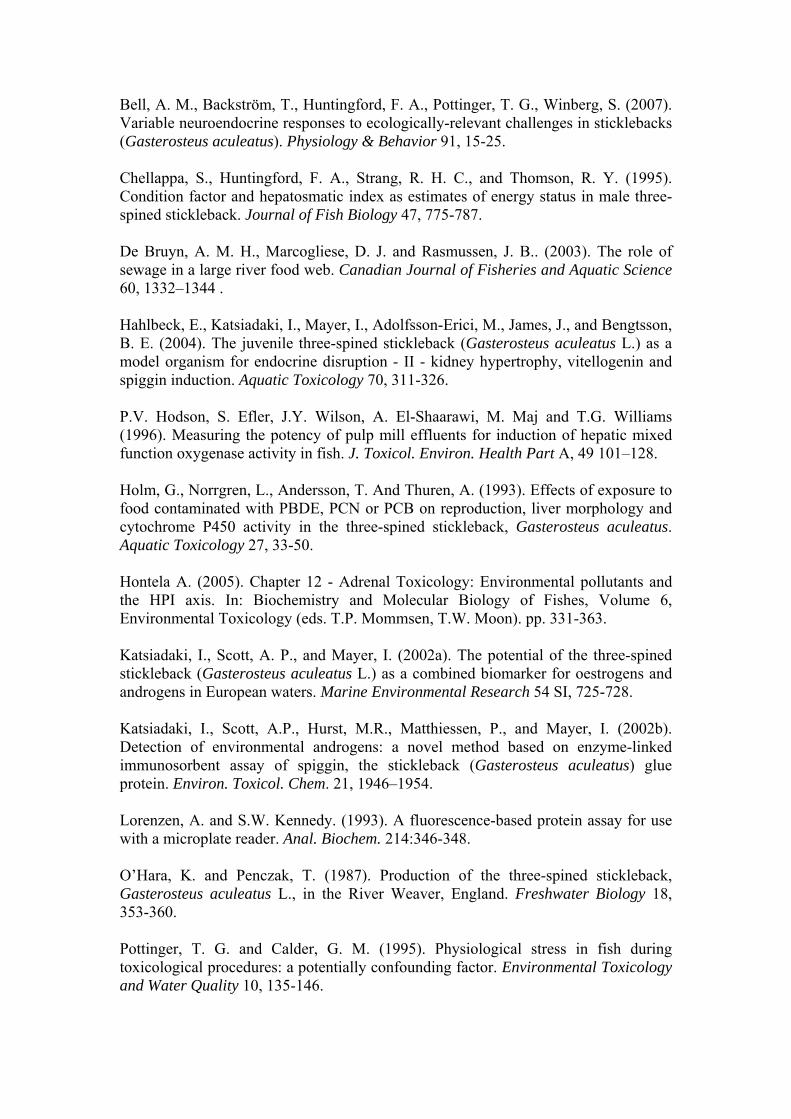
HPI activity The ability of an organism to mount an adequate adaptive response to stressors is paramount to its survival. A pivotal element of this response is the hypothalamic-pituitary-interrenal axis, activation of which results in the elevation of the corticosteroid hormone cortisol. It is becoming increasingly evident that chemical contaminants can interfere with the neuroendocrine mechanism by which the adaptive stress response is activated (Hontela, 2005) with presumptive adverse outcomes for the fish, thus we are investigating the activity of this system in fish from both rivers as part of the suite of biomarkers of health and well-being deployed in EDCAT 5. During July 2007, 20 fish from each of Tadpole Bridge (R. Ray) and Charney Bassett (R. Ock) were held for an additional 30 mins following capture in jars before being euthanised and transferred to tubes in the dry shipper. Whole-body homogenates were prepared as described above and cortisol (= total cortisol imunoreactivity) was determined. The whole-body homogenate method measures cortisol in multiple body compartments. Therefore in addition to cortisol present in plasma this method also detects cortisol and its derivatives in other tissues including the gall bladder that may cross-react with the antibody. This does not detract from the ability of this method to detect the onset of a stress response, because corticosteroids are synthesized de novo and not stored prior to release. We have employed this method previously to monitor the stress response in fish from which, because of their small size, blood samples could not be obtained, including juvenile trout (Pottinger and Mosuwe, 1994), zebra fish (Pottinger and Calder, 1995) and sticklebacks (Pottinger et al., 2002). Simultaneous measurement of plasma cortisol and whole-body cortisol in fish exposed to acute and chronic stressors has confirmed that the method is appropriate for detecting stress-induced changes in HPI activity. In the present study, mean whole-body cortisol levels were 98.42 ± 7.4 ng/g in the Ock fish but were significantly lower (P = 0.017) at 75.25 ± 5.1 ng/g in fish from the Ray (Figure 16). Whole-body cortisol concentrations of this order are entirely consistent with previous studies on confined sticklebacks (~50 ng/g; Pottinger et al., 2002) and predator-exposed sticklebacks (~100 ng/g; Bell et al., 2007) and confirm that the procedure of capture and bucket confinement evoked an HPI response from the fish (levels in unstressed sticklebacks are of the order of 5 ng/g). These data although limited, suggest that there may be differences in the ability of fish from the two rivers to mount an appropriate response to a stressor. Whether this is the case will become apparent when the bulk of the remaining analyses are completed. Conclusions: 1. Continued sampling on the two rivers during 2007 has provided no evidence that the Ray receives an estrogenic load sufficient to cause inappropriate production of vitellogenin in male sticklebacks. The range of VTG values detected is suggestive of some estrogenic contamination within each water course but this appears to be entirely unrelated to the STW. During 2008, some resources will be diverted towards a microarray-based assessment of gene transcription profiles in livers of fish from the Rodbourne site in order to establish whether more subtle, but potentially damaging, changes may be elicited by the existing minor estrogen load arising from the STW.
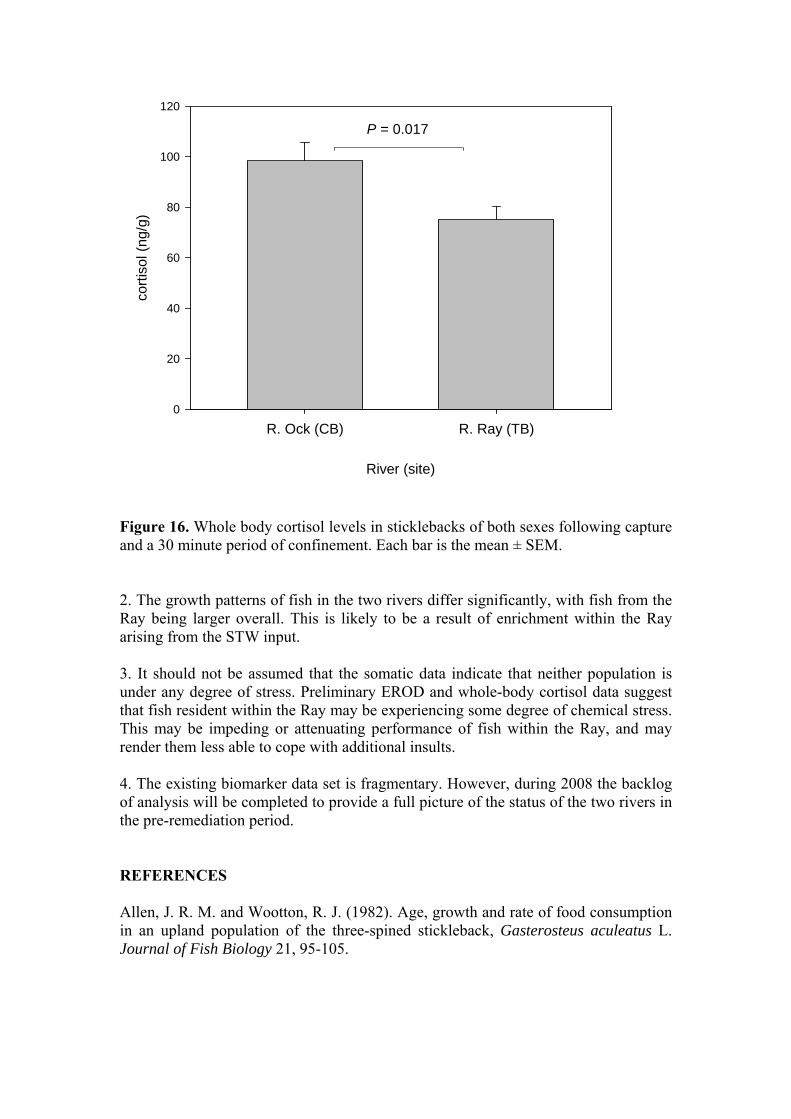
Figure 16. Whole body cortisol levels in sticklebacks of both sexes following capture and a 30 minute period of confinement. Each bar is the mean ± SEM. 2. The growth patterns of fish in the two rivers differ significantly, with fish from the Ray being larger overall. This is likely to be a result of enrichment within the Ray arising from the STW input. 3. It should not be assumed that the somatic data indicate that neither population is under any degree of stress. Preliminary EROD and whole-body cortisol data suggest that fish resident within the Ray may be experiencing some degree of chemical stress. This may be impeding or attenuating performance of fish within the Ray, and may render them less able to cope with additional insults. 4. The existing biomarker data set is fragmentary. However, during 2008 the backlog of analysis will be completed to provide a full picture of the status of the two rivers in the pre-remediation period. REFERENCES Allen, J. R. M. and Wootton, R. J. (1982). Age, growth and rate of food consumption in an upland population of the three-spined stickleback, Gasterosteus aculeatus L. Journal of Fish Biology 21, 95-105.
River (site)
R. Ock (CB) R. Ray (TB)
corti
sol (
ng/g
)
0
20
40
60
80
100
120
P = 0.017
Bell, A. M., Backström, T., Huntingford, F. A., Pottinger, T. G., Winberg, S. (2007). Variable neuroendocrine responses to ecologically-relevant challenges in sticklebacks (Gasterosteus aculeatus). Physiology & Behavior 91, 15-25. Chellappa, S., Huntingford, F. A., Strang, R. H. C., and Thomson, R. Y. (1995). Condition factor and hepatosmatic index as estimates of energy status in male three-spined stickleback. Journal of Fish Biology 47, 775-787. De Bruyn, A. M. H., Marcogliese, D. J. and Rasmussen, J. B.. (2003). The role of sewage in a large river food web. Canadian Journal of Fisheries and Aquatic Science 60, 1332–1344 . Hahlbeck, E., Katsiadaki, I., Mayer, I., Adolfsson-Erici, M., James, J., and Bengtsson, B. E. (2004). The juvenile three-spined stickleback (Gasterosteus aculeatus L.) as a model organism for endocrine disruption - II - kidney hypertrophy, vitellogenin and spiggin induction. Aquatic Toxicology 70, 311-326. P.V. Hodson, S. Efler, J.Y. Wilson, A. El-Shaarawi, M. Maj and T.G. Williams (1996). Measuring the potency of pulp mill effluents for induction of hepatic mixed function oxygenase activity in fish. J. Toxicol. Environ. Health Part A, 49 101–128. Holm, G., Norrgren, L., Andersson, T. And Thuren, A. (1993). Effects of exposure to food contaminated with PBDE, PCN or PCB on reproduction, liver morphology and cytochrome P450 activity in the three-spined stickleback, Gasterosteus aculeatus. Aquatic Toxicology 27, 33-50. Hontela A. (2005). Chapter 12 - Adrenal Toxicology: Environmental pollutants and the HPI axis. In: Biochemistry and Molecular Biology of Fishes, Volume 6, Environmental Toxicology (eds. T.P. Mommsen, T.W. Moon). pp. 331-363. Katsiadaki, I., Scott, A. P., and Mayer, I. (2002a). The potential of the three-spined stickleback (Gasterosteus aculeatus L.) as a combined biomarker for oestrogens and androgens in European waters. Marine Environmental Research 54 SI, 725-728. Katsiadaki, I., Scott, A.P., Hurst, M.R., Matthiessen, P., and Mayer, I. (2002b). Detection of environmental androgens: a novel method based on enzyme-linked immunosorbent assay of spiggin, the stickleback (Gasterosteus aculeatus) glue protein. Environ. Toxicol. Chem. 21, 1946–1954. Lorenzen, A. and S.W. Kennedy. (1993). A fluorescence-based protein assay for use with a microplate reader. Anal. Biochem. 214:346-348. O’Hara, K. and Penczak, T. (1987). Production of the three-spined stickleback, Gasterosteus aculeatus L., in the River Weaver, England. Freshwater Biology 18, 353-360. Pottinger, T. G. and Calder, G. M. (1995). Physiological stress in fish during toxicological procedures: a potentially confounding factor. Environmental Toxicology and Water Quality 10, 135-146.
Pottinger, T. G. & Carrick, T. R. (2001). Stress responsiveness affects dominant-subordinate relationships in rainbow trout. Hormones and Behavior 40, 419-427. Pottinger, T. G. and Musowe, E. M. (1994). The corticosteroidogenic response of brown and rainbow trout alevins and fry during a 'critical' period. General and Comparative Endocrinology 95, 350-362. Pottinger, T. G., Carrick, T. R. & Yeomans, W. E. (2002). The three-spined stickleback as an environmental sentinel: effects of stressors on whole-body physiological indices. Journal of Fish Biology 61, 207-229. Ricker, W. E. (1975). Computation and interpretation of biological statistics of fish populations. Bulletin of the Fisheries Research Board of Canada 191:1-382. Sanchez, W., Ait-Aissa, S., Palluel, O., Ditche, J.-M. and Porcher, J.-M. (2007). Preliminary investigation of multi-biomarker responses in three-spined stickleback (Gasterosteus aculeatus L.) sampled in contaminated streams. Ecotoxicology 16, 279-287. Wright, H. A., Wootton, R. J., and Barber, I. (2004). Interpopulation variation in early growth of threespine sticklebacks (Gasterosteus aculeatus) under laboratory conditions. Canadian Journal of Fisheries and Aquatic Science 61, 1832-1838. Wootton, R. J. (2007). Over-wintering growth and losses in a small population of the threespine stickleback, Gasterosteus aculeatus (L.), in mid-Wales. Ecology of Freshwater Fish 16, 476-481.
Related Documents