Project Maths Workshop 4 Focus on Patterns Name: School:

Welcome message from author
This document is posted to help you gain knowledge. Please leave a comment to let me know what you think about it! Share it to your friends and learn new things together.
Transcript

Project Maths Workshop 4
Focus on Patterns
Name: School:

-1 -
WS4.1 Notes

-2 -
WS4.2 Key Outcomes and Words identify patterns and describe different situations using tables, graphs, words and
formulae predict generalise in words and symbols justify relationship start amount: from a table constant rate of change: from a table a variable inputs and outputs linear graph start amount on graph: y – intercept constant rate of change on graph: called slope parallel lines ↔ same slope ↔ same rate of change constant rate of change characterises a linear function change column in table shows constant increasing rate of change formula start amount and slope/rate of change also observable from formula 𝑦 = 𝑚𝑥 or 𝑦 = 𝑚𝑥 + 𝑐 or 𝑦 = 𝑐 + 𝑚𝑥 compare and contrast steepness of slope reflects the rate of change slope: rise over run intersection common value increasing rate of change: positive slope decreasing rate of change: negative slope quadratic relationships:
story / diagram table: first change varies
second change constant graph
exponential relationships: story table: first change develops in a ratio graph
A full treatment of this topic is to be found in: “A Functions based approach to Algebra” available on http://www.projectmaths.ie.

-3 -
WS4.3 Student Activity 1B (Extract from Teaching & Learning Plan on Patterns) Represent this repeating pattern – yellow, black, green, yellow, black, green – by building it with blocks or colouring it in on a number strip or drawing a table or in any other suitable way.
1 2 3 4 5 6 7 8 9 10
1. List the numbers of the first 3 yellow blocks. Is there a pattern in these numbers?
2. List the numbers of the first 3 black blocks. Is there a pattern in these numbers?
3. List the numbers of the first 3 green blocks. Is there a pattern in these numbers?
4. What colour is the 6th block?
5. What colour is the 18th block?
6. What colour is the 25th block?
7. What colour is the 13th block?
8. What colour will the 100th block be in the sequence?
9. What colour will the 500th block be in this sequence?
10. Explain how you found your answers to questions 8 and 9.
11. What rule could you use to work out the position number of any of the (i) yellow
blocks, (ii) black blocks, (iii) green blocks?

-4 -
WS4.4 Money Box Problem Graph
-5 -
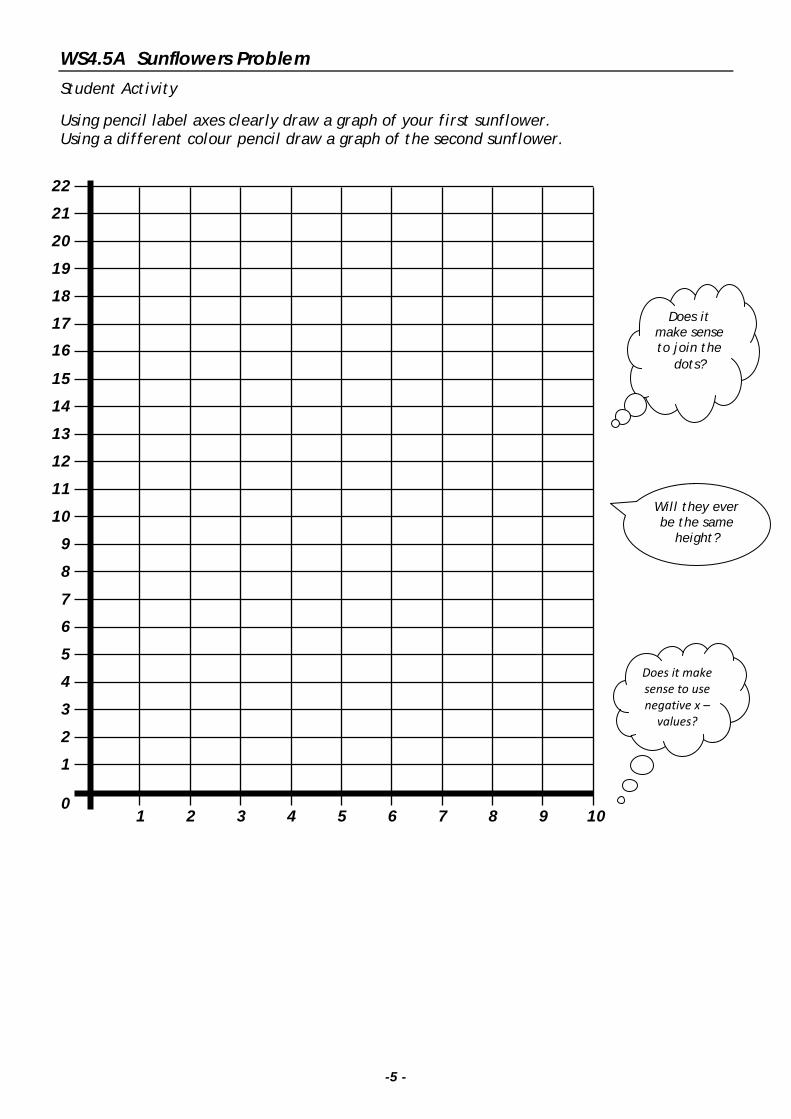
WS4.5A Sunflowers Problem Student Activity
Using pencil label axes clearly draw a graph of your first sunflower. Using a different colour pencil draw a graph of the second sunflower.
Does it make sense to join the
dots?
Does it make sense to use negative x –
values?
Will they ever be the same
height?
22
21
19
18
20
17
16
15
14
13
12
11
10
9
8
7
6
5
4
3
2
1
0 10 1 5 6 7 8 9 4 3 2

-6 -
Sunflower A Starting height 3 cm and grows 2 cm per day
each day afterwards
Sunflower B Starting height 6 cm and grows 2 cm per day
each day afterwards
Time/d Height/cm Time/d Height/cm
When you have completed the table and drawn the graph of your first sunflower answer the following questions:
1. What values are varying? Does one depend on the other? Explain.
2. Identify the starting height in the table. What time does it correspond to? Where is the starting height on the graph?
3. Identify the rate of change of growth with time in the table. Use the same reasoning to identify it in the graph.
4. What values are staying the same? After you have the table and graph of your second sunflower completed answer the following: 5. Predict the height of each sunflower on day 9, if they continue to grow at the same rate each
day. Can you think of more than one way to do this?
6. Express in words the relationship between the height of each sunflower on any day, its starting height, its rate of growth and the time in days elapsed since its starting height.
7. Express the above relationships in symbols.

-7 -
WS4.5B Sunflowers Problem Student Activity
Using pencil label axes clearly draw a graph of your first sunflower. Using a different colour pencil draw a graph of the second sunflower.
Does it make sense to join the
dots?
Will they ever be the same
height?
Does it make sense to use negative x –
values?
22
21
19
18
20
17
16
15
14
13
12
11
10
9
8
7
6
5
4
3
2
1
0 10 1 5 6 7 8 9 4 3 2

-8 -
Sunflower B Starting height 6 cm and grows 2 cm per day
each day afterwards
Sunflower C Starting height 6 cm and grows 3 cm per day
each day afterwards
Time/d Height/cm Time/d Height/cm
When you have completed the table and drawn the graph of your first sunflower answer the following questions:
1. What values are varying? Does one depend on the other? Explain.
2. Identify the starting height in the table. What time does it correspond to? Where is the starting height on the graph?
3. Identify the rate of change of growth with time in the table. Use the same reasoning to identify it in the graph.
4. What values are staying the same? After you have the table and graph of your second sunflower completed answer the following: 5. Predict the height of each sunflower on day 9, if they continue to grow at the same rate each
day. Can you think of more than one way to do this?
6. Express in words the relationship between the height of each sunflower on any day, its starting height, its rate of growth and the time in days elapsed since its starting height.
7. Express the above relationships in symbols.

-9 -
WS4.5C Sunflowers Problem Student Activity
Using pencil label axes clearly draw a graph of your first sunflower. Using a different colour pencil draw a graph of the second sunflower.
22
21
19
18
20
17
16
15
14
13
12
11
10
9
8
7
6
5
4
3
2
1
0 10 1 5 6 7 8 9 4 3 2
Does it make sense to join the
dots?
Will they ever be the same
height?
Does it make sense to use negative x –
values?

-10 -
Sunflower C Starting height 6 cm and grows 3 cm per day
each day afterwards
Sunflower D Starting height 8 cm and grows 2 cm per day
each day afterwards
Time/d Height/cm Time/d Height/cm
When you have completed the table and drawn the graph of your first sunflower answer the following questions:
1. What values are varying? Does one depend on the other? Explain.
2. Identify the starting height in the table. What time does it correspond to? Where is the starting height on the graph?
3. Identify the rate of change of growth with time in the table. Use the same reasoning to identify it in the graph.
4. What values are staying the same? After you have the table and graph of your second sunflower completed answer the following: 5. Predict the height of each sunflower on day 9, if they continue to grow at the same rate each
day. Can you think of more than one way to do this?
6. Express in words the relationship between the height of each sunflower on any day, its starting height, its rate of growth and the time in days elapsed since its starting height.
7. Express the above relationships in symbols.

-11 -
WS4.6 Growing Squares/Rectangles
-12 -
WS4.7 Doubling/Trebling (Exponential)

-13 -
WS4.8 Connections
UN
Unifix Cubes
Periodic Functions Simple Patterns
Predictions
Concepts Independent/Dependent
variables Covariatioanal reasoning
Multi-Representational Functions
Tables, Graphs, Story, Algebra
Start Value Variables
Rate of Increase
Coordinate Geometry Linear function, making a good rough drawing of a line, solving
line & circle problems
Integration Integrate under a line Making the diagram
Volume of revolution of a cone
𝒚 = 𝒎𝒙 + 𝒄
Sequences and Series
Growing (Squares)
Rectangles
Coordinate Geometry Slope formula Trigonometry
Relation between slope & tan
Calculus 𝒅𝒚𝒅𝒙
Constant, Increase, Decrease
Rates of change
Concept of Slope as a
Rate of Change
Algebra Simultaneous equations Coordinate Geometry
Find POI graphically
Problem Solving
Point of Intersection

-14 -
WS4.9 Contents of “A function based approach to algebra” Introduction and unit learning outcomes
Linear function investigations
Proportional versus non proportional
Quadratic function Investigations
Exponential function Investigations
Inverse proportion investigations
Cubic function investigations
Appendix – notes and some solutions
WS4.10 Bus Problem
WS4.11 Bath Problem
D. Gets into bath.
B. Pulls the plug.
G. Hot and cold taps turned on.
F. Turns off hot tap.
C. Cold tap turned off, gets undressed. A. Relaxes in bath.
E. Gets out of bath.

t
d
t
d
t
d
t
d
t
dd
t
1–A :M
oving at a steady
con
stant
pace.
1–B :M
oving at a fast pace changing
to a slow
er pace.
1–C :M
oving at a fast steady
pace.
1–D :Moving fast, the
n slo
wing
slightly, the
n going faster again.
1–1
1–2
1–3
1–4
1–5
1–6
1–E :M
oving at a steady
pace, th
en
stop
s for a
period of time.
1–F :M
oving at a slow
pace and then
r apidly increases.
-15-

2–A :The
graph
show
s the
cost o
f hirin
g an
electrician pe
r hou
r including
a fixed
call out fee.
2–B :The
graph
show
s the
con
nection
betw
een the length and
width of a
rectangle of a fixed area
2–C :The
graph
sho
ws s
peed
against
time for a
car travelling at a con
stant
speed.
2–D :The graph show
s the
area of a
circle as the
radius increases.
2–E :The
graph
show
s the
width of a
square as the
length of the
squ
are
increases
2–F :The
pop
ulation increased slo
wly
at first, bu
t the
n increased more
quickly.
2–1
2–2
2–3
2–4
2–5
2–6
-16-

3–1
3–2
3–3
3–4
3–5
3–6
h
t
h
t
h
t
t
h
t
h
h
t
3–A
3–B
3–C
3–D
3–E
3–F
-17-
-18 -
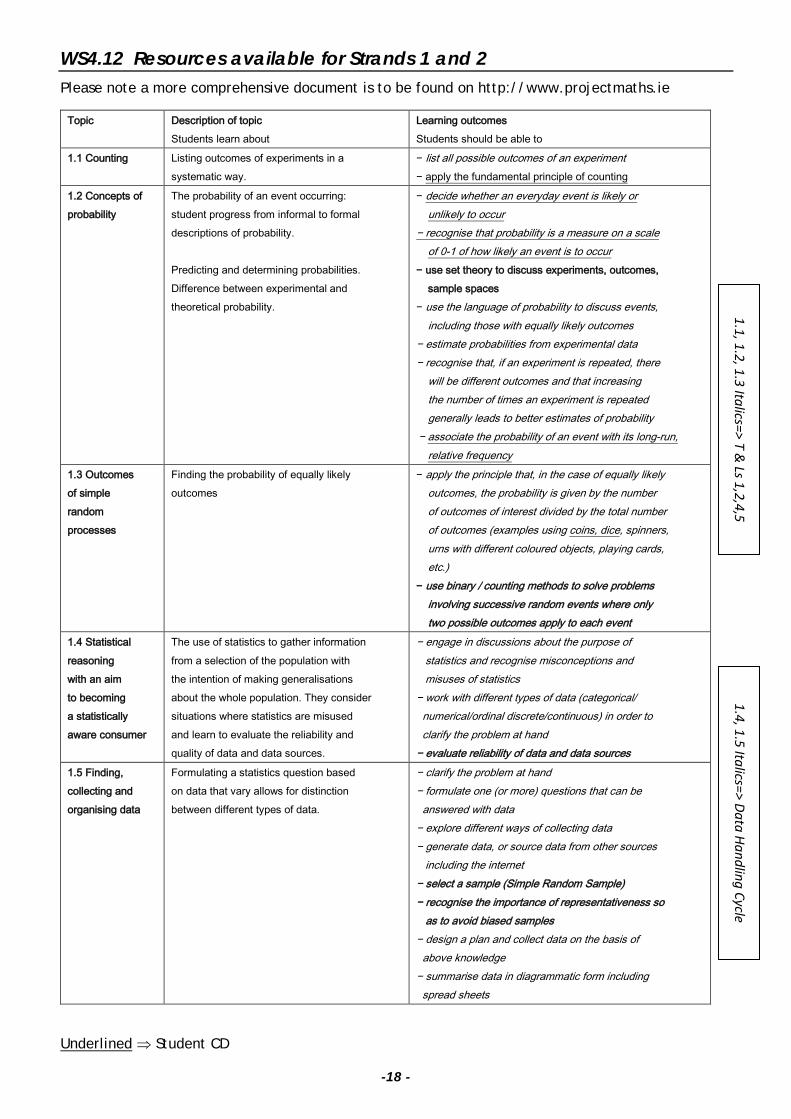
WS4.12 Resources available for Strands 1 and 2 Please note a more comprehensive document is to be found on http://www.projectmaths.ie
Topic Description of topic Students learn about
Learning outcomes Students should be able to
1.1 Counting Listing outcomes of experiments in a systematic way.
− list all possible outcomes of an experiment − apply the fundamental principle of counting
1.2 Concepts of probability
The probability of an event occurring: student progress from informal to formal descriptions of probability. Predicting and determining probabilities. Difference between experimental and theoretical probability.
− decide whether an everyday event is likely or unlikely to occur
− recognise that probability is a measure on a scale of 0-1 of how likely an event is to occur
− use set theory to discuss experiments, outcomes, sample spaces
− use the language of probability to discuss events, including those with equally likely outcomes
− estimate probabilities from experimental data − recognise that, if an experiment is repeated, there
will be different outcomes and that increasing the number of times an experiment is repeated generally leads to better estimates of probability
− associate the probability of an event with its long-run, relative frequency
1.3 Outcomes of simple random processes
Finding the probability of equally likely outcomes
− apply the principle that, in the case of equally likely outcomes, the probability is given by the number of outcomes of interest divided by the total number of outcomes (examples using coins, dice, spinners, urns with different coloured objects, playing cards, etc.)
− use binary / counting methods to solve problems involving successive random events where only two possible outcomes apply to each event
1.4 Statistical reasoning with an aim to becoming a statistically aware consumer
The use of statistics to gather information from a selection of the population with the intention of making generalisations about the whole population. They consider situations where statistics are misused and learn to evaluate the reliability and quality of data and data sources.
− engage in discussions about the purpose of statistics and recognise misconceptions and misuses of statistics − work with different types of data (categorical/ numerical/ordinal discrete/continuous) in order to clarify the problem at hand − evaluate reliability of data and data sources
1.5 Finding, collecting and organising data
Formulating a statistics question based on data that vary allows for distinction between different types of data.
− clarify the problem at hand − formulate one (or more) questions that can be answered with data − explore different ways of collecting data − generate data, or source data from other sources including the internet − select a sample (Simple Random Sample) − recognise the importance of representativeness so as to avoid biased samples − design a plan and collect data on the basis of above knowledge − summarise data in diagrammatic form including spread sheets
Underlined ⇒ Student CD
1.1, 1.2, 1.3 Italics=> T & Ls 1,2,4,5
1.4, 1.5 Italics=> Data Handling Cycle

-19 -
WS4.12 Strands 1 & 2 Have you...
…registered for Census at School and have your students inputted their data? [http://www.censusatschool.ie]
…attended the modular course for ICT for Strands 1 and 2 or accessed the resources for the same on the website? [http://www.projectmaths.ie]
…attended the modular course for content for Strand 1 or accessed the resources for the same on the website? [http://www.projectmaths.ie]
…read the Bridging Document for Mathematics produced by the NCCA and shown in Workshop 3? [http://www.ncca.ie/projectmaths]
…printed the Guide to Axioms, Theorems and Constructions for all levels? [http://www.projectmaths.ie]
…used the Student’s CD with the Student Activities in class? [http://www.projectmaths.ie]
…given your students a copy of the Student’s CD?
…accessed the Leaving Cert. 2010 Sample Papers? [http://www.examinations.ie]
…accessed the Leaving Cert. 2010 Project Maths Papers? [http://www.examinations.ie]
…accessed the Leaving Cert. 2011 Sample Papers? [http://www.examinations.ie]
…accessed the Junior Cert. 2011 Sample Papers? [http://www.examinations.ie]
…accessed the Pre-Leaving Cert. 2010 papers? [http://www.ncca.ie/projectmaths]
…used any of the Teaching and Learning plans in class? [http:www.projectmaths.ie]
…read the Report on the Trialling of the Sample Paper? [http://www.examinations.ie]
…accessed the NCCA Student Resource Materials? [http://www.ncca.ie/projectmaths]
…used any of the Teacher Handbooks? [http://www.projectmaths.ie]
…shared more resources with the rest of the teachers in your maths team in recent months?
…completed ¼, ½, ¾, or all of the Common Introductory Course? (JC syllabus pages 23 and 24)
…noticed that Paper 2 is changing for your current 1st years in 2013?
…noticed that Paper 2 is changing for your current 5th years in 2012?
…got your students to use concrete resources (e.g. unifix cubes, dice, geometry set, geostrips, clinometers etc.) more often in recent months?
…used the search engine on the Project Maths website? [http://www.projectmaths.ie]
…searched the internet for ideas on specific topics?
…copies of the syllabuses?
Related Documents