FOF-03-2016 Z-Fact0r - 723906 Page 1 of 60 PROJECT DELIVERABLE REPORT Project Title: Zero-defect manufacturing strategies towards on-line production management for European FACTORies FOF-03-2016 - Zero-defect strategies at system level for multi-stage manufacturing in production lines Deliverable number D5.1 Deliverable title Integration Discipline and Incremental Strategy Submission month of deliverable M26 Issuing partner ATLANTIS Contributing partners ALL Dissemination Level (PU/PP/RE/CO): PUBLIC Project coordinator Dr. Dionysis Bochtis Tel: +30 24210 96740 Fax: Email: [email protected] Project web site address http://www.z-fact0r.eu/ Ref. Ares(2018)6070572 - 27/11/2018

Welcome message from author
This document is posted to help you gain knowledge. Please leave a comment to let me know what you think about it! Share it to your friends and learn new things together.
Transcript

FOF-03-2016 Z-Fact0r - 723906
Page 1 of 60
PROJECT DELIVERABLE REPORT
Project Title:
Zero-defect manufacturing strategies towards on-line
production management for European FACTORies FOF-03-2016 - Zero-defect strategies at system level for multi-stage manufacturing in production lines
Deliverable number D5.1
Deliverable title Integration Discipline and Incremental Strategy
Submission month of deliverable M26
Issuing partner ATLANTIS
Contributing partners ALL
Dissemination Level (PU/PP/RE/CO): PUBLIC
Project coordinator Dr. Dionysis Bochtis
Tel: +30 24210 96740
Fax:
Email: [email protected]
Project web site address http://www.z-fact0r.eu/
Ref. Ares(2018)6070572 - 27/11/2018

FOF-03-2016 Z-Fact0r - 723906
Page 2 of 60
Document Information
Filename(s) D5.1 Integration Discipline and Incremental Strategy v1.0
Owner Z-Fact0r Consortium
Distribution/Access Z-Fact0r Consortium, **
Quality check ATLANTIS, CERTH-IBO, INOVA
Report Status Finished
Revision History
Version Date Responsible Description/Remarks/Reason for changes
0.1 05/06/2018 Konstantinos Grevenitis
1rst draft – ATLANTIS contribution, SIR contribution
0.2 29/06/2018 Konstantinos Grevenitis
BRUNEL contribution, CERTH-IBO contribution, HOLONIX contribution
0.3 06/07/2018 Konstantinos Grevenitis
DATAPIXEL contribution, CETRI contribution
0.4 19/07/2018 Konstantinos Grevenitis
EPFL contribution, CERTH-ITI contribution
0.5 28/09/2018 Konstantinos Grevenitis
ATLANTIS review
0.9 22/11/2018 Hugo Faria Inova+ peer review
1.0 30/11/2018 Konstantinos Grevenitis
Final tuning and release

FOF-03-2016 Z-Fact0r - 723906
Page 3 of 60
Contents
1 Purpose and scope of the deliverable ............................................................................................................................. 8
2 Introduction ........................................................................................................................................................................ 9
2.1 Deliverable structure................................................................................................................................................. 9
2.2 Goals and values of software integration .............................................................................................................. 9
3 Z-Fact0r architecture related to integration ................................................................................................................. 11
3.1 Overall architecture diagram ................................................................................................................................. 11
3.2 Communication protocols ..................................................................................................................................... 12
3.2.1 AMQP .................................................................................................................................................................. 12
3.2.2 STOMP ................................................................................................................................................................ 12
3.2.3 MQTT .................................................................................................................................................................. 12
3.2.4 HTTP ................................................................................................................................................................... 12
3.2.5 FTP ....................................................................................................................................................................... 12
3.2.6 GigE Vision ......................................................................................................................................................... 12
3.3 Information flow ..................................................................................................................................................... 13
3.3.1 Component DC1 - Micro profilometer .......................................................................................................... 15
3.3.2 Component DC2 – Production management ................................................................................................ 15
3.3.3 Component DC3 - Metrology - 3D scanner .................................................................................................. 15
3.3.4 Component DR1 – i-Like repositories ........................................................................................................... 15
3.3.5 Component DR2 – Semantic framework ....................................................................................................... 16
3.3.6 Component DR3 – Repos sync engine ........................................................................................................... 16
3.3.7 Component SP1 – Event manager .................................................................................................................. 16
3.3.8 Component SP2 – Green optimizer ................................................................................................................ 16
3.3.9 Component SP3 – Core manager .................................................................................................................... 16
3.3.10 Component DT1 - Metrology - High accuracy automatic geometrical analysis of defects in 3D
point clouds ....................................................................................................................................................................... 16
3.3.11 Component DT2 - Analytical tools for 3D point cloud-based defect information ............................ 16
3.3.12 Component DT3 - Multi-parametric models for defects prediction and product monitoring ......... 16
3.3.13 Component DT4 - Processing algorithms for defect detection ............................................................. 17
3.3.14 Component BS1 – KM-DSS ........................................................................................................................ 17
3.3.15 Component BS2 – ES-DSS .......................................................................................................................... 17
3.3.16 Component BS3 - RSC ................................................................................................................................. 17
3.3.17 Component BS4 - Context aware algorithms for defect prediction ...................................................... 17
3.3.18 Component RP1 - Additive Manufacturing Repair .................................................................................. 17
3.3.19 Component RP2 - Robotic deburring ........................................................................................................ 17
4 Incremental Integration Strategy (IIS) .......................................................................................................................... 18

FOF-03-2016 Z-Fact0r - 723906
Page 4 of 60
4.1 Introduction ............................................................................................................................................................. 18
4.2 Integration approaches ........................................................................................................................................... 18
4.2.1 Top bottom integration approach ................................................................................................................... 18
4.2.2 Bottom up integration approach ...................................................................................................................... 19
4.2.3 Sandwich integration approach ........................................................................................................................ 19
4.3 Integration scenario ................................................................................................................................................ 20
4.4 Regression test ......................................................................................................................................................... 20
4.5 Regression testing plan ........................................................................................................................................... 21
4.6 Possible integration problems ............................................................................................................................... 22
5 Data persistence (repositories and semantic framework) .......................................................................................... 23
5.1 HOLONIX’s repositories ...................................................................................................................................... 24
5.2 EPFL’s semantic framework ................................................................................................................................. 29
6 Production management ................................................................................................................................................. 30
7 Repositories sync engine ................................................................................................................................................. 33
7.1 Introduction ............................................................................................................................................................. 33
7.2 Engine’s architecture .............................................................................................................................................. 33
8 Z-Fact0r Incremental Integration Strategy (ZF-IIS) .................................................................................................. 34
8.1 Integration strategy ................................................................................................................................................. 34
8.2 Integration scenarios............................................................................................................................................... 37
8.2.1 Team 1 scenarios ................................................................................................................................................ 37
8.2.2 Team 2 scenarios ................................................................................................................................................ 41
8.2.3 Team 3 scenarios ................................................................................................................................................ 49
8.2.4 Team 4 scenarios ................................................................................................................................................ 52
8.3 Integration performance monitoring ................................................................................................................... 55
8.3.1 Load testing ......................................................................................................................................................... 55
8.3.2 Stress testing ........................................................................................................................................................ 55
8.3.3 Spike testing ......................................................................................................................................................... 55
8.3.4 Endurance testing ............................................................................................................................................... 55
8.3.5 Scalability testing ................................................................................................................................................. 55
8.3.6 Volume testing .................................................................................................................................................... 55
8.3.7 Possible performance issues ............................................................................................................................. 55
9 Software and hardware requirements ............................................................................................................................ 57
9.1 Software requirements ............................................................................................................................................ 57
9.1.1 ATLANTIS ENGINEERING ....................................................................................................................... 57
9.1.2 BRUNEL ............................................................................................................................................................. 57
9.1.3 CERTH/ITI ........................................................................................................................................................ 57

FOF-03-2016 Z-Fact0r - 723906
Page 5 of 60
9.1.4 HOLONIX ......................................................................................................................................................... 57
9.1.5 EPFL .................................................................................................................................................................... 58
9.2 Hardware requirements .......................................................................................................................................... 59
9.2.1 ATLANTIS ENGINEERING ....................................................................................................................... 59
9.2.2 BRUNEL ............................................................................................................................................................. 59
9.2.3 CERTH/ITI ........................................................................................................................................................ 59
9.2.4 HOLONIX ......................................................................................................................................................... 59
9.2.5 EPFL .................................................................................................................................................................... 59
References ................................................................................................................................................................................... 60
Figures
Figure 1. Z-Fact0r architecture diagram ................................................................................................................................ 11
Figure 2. i-Like relational (MySQL) database schema ......................................................................................................... 13
Figure 3. Information flow ...................................................................................................................................................... 15
Figure 4. Top bottom integration approach [7] .................................................................................................................... 18
Figure 5. Bottom up integration approach [7] ...................................................................................................................... 19
Figure 6. Sandwich integration [7] .......................................................................................................................................... 19
Figure 7. Regression diagram................................................................................................................................................... 21
Figure 8: Data every 100ms (Cassandra vs. MongoDB vs. MySQL) ................................................................................ 26
Figure 9: Data every 500ms (Cassandra vs. MongoDB vs. MySQL) ................................................................................ 26
Figure 10: Data every 1000ms (Cassandra vs. MongoDB vs. MySQL) ............................................................................ 27
Figure 11: Hourly data reading (Cassandra vs. MongoDB vs. MySQL) .......................................................................... 27
Figure 12: Daily data reading (Cassandra vs. MongoDB vs. MySQL) .............................................................................. 28
Figure 13. Production management action flow .................................................................................................................. 30
Figure 14: Sensors data flow (MICROSEMI) ....................................................................................................................... 30
Figure 15: Sensors data flow (DURIT) .................................................................................................................................. 31
Figure 16: Production data flow (DURIT) ............................................................................................................................ 31
Figure 17: Production data flow (MICROSEMI) ................................................................................................................ 32
Figure 18: I/O handling ........................................................................................................................................................... 33
Figure 19. Sync engine High-Level System Architecture .................................................................................................... 34
Figure 20. Mid-Level Sync engine system Architecture – Processing Pipeline ............................................................... 34
Figure 21. Incremental Integration Strategy (IIS) ................................................................................................................ 35
Figure 22. Bottom up integration flow .................................................................................................................................. 36
Figure 23. Information flow communication interfaces ..................................................................................................... 36

FOF-03-2016 Z-Fact0r - 723906
Page 6 of 60
Tables
Table 1. Components table ...................................................................................................................................................... 14
Table 2. Integration scenario template ................................................................................................................................... 20
Table 3. Components data requirements ............................................................................................................................... 23
Table 4. CERTH/ITI_1 integration scenario ....................................................................................................................... 38
Table 5. CERTH/ITI_2 integration scenario ....................................................................................................................... 39
Table 6. DATAPIXEL_1 integration scenario..................................................................................................................... 40
Table 7. CERTH/ITI_3 integration scenario ....................................................................................................................... 42
Table 8. CERTH/ITI_4 integration scenario ....................................................................................................................... 44
Table 9. DATAPIXEL_2 integration scenario..................................................................................................................... 45
Table 10. DATAPIXEL_3 integration scenario .................................................................................................................. 46
Table 11. DATAPIXEL_4 integration scenario .................................................................................................................. 47
Table 12.CERTH-IBO_1 integration scenario ..................................................................................................................... 48
Table 13. ATLANTIS_1 integration scenario ...................................................................................................................... 49
Table 14.ATLANTIS_2 integration scenario ....................................................................................................................... 50
Table 15. EFPL_1 integration scenario ................................................................................................................................. 51
Table 16. SIR_1 integration scenario ..................................................................................................................................... 53
Table 17. CETRI_1 integration scenario ............................................................................................................................... 54

FOF-03-2016 Z-Fact0r - 723906
Page 7 of 60
Abbreviations
Abbreviation Name
ACID Atomicity, Consistency, Isolation, Durability
AMQP Advanced Message Queuing Protocol
API Application Programming Interface
CAD Computer-Aided Design
CERTH Centre for Research & Technology, Hellas
CETRI Centre for Technology Research & Innovation
EPFL École Polytechnique Fédérale de Lausanne
GEP Gene Expression Programming
FTP File Transfer Protocol
HTTP Hypertext Transfer Protocol
IEEE Institute of Electrical and Electronics Engineers
IIS Incremental Integration Strategy
KPI Key Performance Indicator
MQ Message Queue
MQTT Message Queuing Telemetry Transport)
PLC Programmable Logic Controller
RDF Resource Description Framework
SOA Service-Oriented architecture
STOMP Simple (or Streaming) Text Orientated Messaging Protocol
TPS Transactions Per Second
TCP Transmission Control Protocol
PLC Programmable Logic Controller
UDP User Datagram Protocol

FOF-03-2016 Z-Fact0r - 723906
Page 8 of 60
1 Purpose and scope of the deliverable
Z-Fact0r Complete Solution/Architecture, incorporates the design and development of a diverse set of technologies
with different specifications, requirements and emerging methodologies. Consequently, within the Task T5.1 Z-
Fact0r Integration of software – hardware platforms and tools (due M34), as an early action, we’ll define an
integration discipline that will be followed in order to build out the integration, as well as to outline incremental
methodology, various activities to be performed, organise the hierarchy of components / interfaces integration,
incremental builds, etc. The work carried out is recoded within this deliverable (due M26), that describes in details
the methodology that is used, the Incremental Integration Strategy (IIS) as described in T5.1.
The deliverable D5.1 Integration Discipline and Incremental Strategy is considered to be the integration manual as well
and it is going to be closely followed in order to achieve the overall integration of all components into a final Z-
Fact0r platform. Furthermore, the document includes, the goals and values of software integration, all the necessary
methodologies, the utilization of them and executable integration scenarios with the defined steps to be executed.
Following this, we’ll integrate all software and hardware components and platform through incremental builds, while
performing integration tests and fix any identified integration errors, until we produce the integrated Z-Fact0r
technological solution. Each integration round will produce a new incremental build and our aim will be to ensure
that changes across builds have not introduced new faults and that updates in one component has not affected other
parts.

FOF-03-2016 Z-Fact0r - 723906
Page 9 of 60
2 Introduction
2.1 Deliverable structure
The technical details and technical knowledge of the Z-Fact0r project, its architecture’s diagram, information flow
diagram, data messages, communication protocols, repositories schemas and how are they going to by synced, API
endpoints, pub/sub topics are provided and presented within this deliverable. The work was obtained within the
Task T5.1 and it represents the manual that defines the Incremental Integration Strategy formulation that Z-Fact0r
consortium will followed as the evolves task evolves in order to achieve the integration process. The deliverable is
organized as follows:
The deliverable is organized as follows:
Chapter 2 describes the goals and values of software integration
Chapter 3 deals with the overall architecture and included components descriptions from the integration
point of view
Chapter 4 describes the methodologies we have used to build the Incremental Integration Strategy (IIS)
Chapter 5 describes the repositories performances and includes a number of benchmarks results
Chapter 6 i-Like “Production management” and how it collects sensorial and production data from the
end users.
Chapter 7 describes how the repositories sync engine works
Chapter 8 summarizes the Z-Fac0tr’s overall Incremental Integration Strategy (IIS)
Chapter 9 includes all the software and hardware requirements of the components
2.2 Goals and values of software integration
Software (system) integration is a term that defines the process(es) of assembling the components into a unique
system and ensuring that they function together as one. The components tend to be quite different in terms of
technological stacks, implementation and software/hardware requirements. Generally, integration’s goal is to
provide connectivity among heterogeneous systems, applications.
The consortium is composed by different technological provides. The integration of each partner’s component(s)
has to been carried out methodologically in order to handle successfully any kind of greater complexities.
Additionally, organizations move towards to decentralized and more flexible approaches and structures. To this
end, nowadays software solutions in their majority, are not always installed on premises but on the cloud. This leads
to capabilities to overcome time and distance constraints and enables the shift to electronically-assisted relationships
with other firms. Modern integration methodologies result into new forms of coupling among organizations.
Before strategic and well-structured systems integration, at least on the level that Z-Fact0r demands, source code
rewriting was required on source and target systems, leading to time, money and human resources wasting. Modern
systems use middleware(s) that allow current and future subsystems to freely communicate with each other through
a common layer, rather than through point-to-point integration. This leads to significant reduction in the number
of connections between systems, considering the worst-case scenario of a state of spaghetti systems with n(n-1)/2
[1] connections.

FOF-03-2016 Z-Fact0r - 723906
Page 10 of 60
The blackboard architecture Z-Fact0r utilizes, is shifted as a Service-Oriented Architecture (SOA) middleware, in
order to organize and take advantage of the distributed capabilities that may be under the control of different
ownership domains. SOA mechanism enables access to one or more capabilities, where the access is provided using
prescribed interfaces and is exercised consistent with constraints and policies as specified by the service description
[2].
Also, the issue of interoperability is directly related to the integration. IEEE defines interoperability as “the ability
of two or more systems or components to exchange information and to use the information that has been
exchanged.”. Interoperability denotes coexistence, autonomy and a federated environment, whereas integration
refers more to coordination, coherence and uniformization [12].
Due to the fact that the Z-Fact0r system, is data driven expert system, strategic integration enables highly valuable
business activities for the end users, by efficiently using the produced data of the final overall system. Business
intelligence and data warehousing will effectively assist on decisions related to aggregated, calculated, and time-series
data and data structures that wouldn’t exist without data integration. Integration also offers diverse businesses and
their processes to work together through shared data. Besides historical data, real-time information delivery is
generated by a correctly integrated system.
To assure that integration provides the best of business value, it should be aligned with end users’ business goals.
Successful, technical and business oriented, integration improves data quality. This is expected, because integration
bring to the surfaces data integration problems that need fixing, as well as opportunities for improvement of data
models, metadata, master data, and other data characteristics, so the data becomes purer, complete, and consistent.
Synchronizing data across multiple repositories is done in different ways. The business value of data synchronization
is that more users have a more complete view of it. However, data synchronization solutions tend to move and
integrate data frequently, sometimes multiple times a business day. This increases the freshness or currency of data
in applications. Data isn’t merely more complete; it’s also more current. And the currency enables nimbler, time-
sensitive business practices.

FOF-03-2016 Z-Fact0r - 723906
Page 11 of 60
3 Z-Fact0r architecture related to integration
3.1 Overall architecture diagram
Figure 1. Z-Fact0r architecture diagram
Z-Fact0r’s architecture (Figure 1) is based on the blackboard’s architectural pattern. The pattern provides a
computational framework for the design and implementation of systems that need to integrate large and diverse
specialized components. It provides the communication APIs, and also handles the data persistence and flow. i-
Like platform collects the data from all components and cooperates with EPFL semantic framework (triple storage)
for data persistence.
The consortium’s approach is to utilize a methodology that will provide the best way to manage, process and persist
signals and the produced results. The pattern provides a middleware for data sharing among components. Each
component, adds bits of knowledge (new data) until the goals are reached. They are independent to each other and
choose the most advantageous logic for their particular purposes.
The key question is the applicability of the pattern, as the unifying factor. The complicating factors of the problem
involve the various heterogeneous components utilized within the end users’ factories and the fact the consortium
is distributed. Any integrating system must depend on the sub systems and their supporting repositories if they exist.
Often there is no commonality among them. Herein lies the problem. Other attempts at integration prefer or require
that all components must be completely rewritten to enforce conformity.

FOF-03-2016 Z-Fact0r - 723906
Page 12 of 60
3.2 Communication protocols
Z-fact0r components support the following communication protocols
3.2.1 AMQP
The Advanced Message Queuing Protocol (AMQP) is a binary, wire-level, open standard, application layer protocol
for message-oriented middleware. It provides flow controlled, message-oriented communication with message-
delivery guarantees, and authentication and/or encryption based on SASL and/or TLS. It utilizes Transmission
Control Protocol (TCP). AMQP features are message orientation, queuing, routing (including point-to-point and
publish-and-subscribe), reliability and security. Its specification is defined in several layers:
(i) a type system
(ii) a symmetric, asynchronous protocol for the transfer of messages from one process to another
(iii) a standard, extensible message format
(iv) a set of standardised but extensible 'messaging capabilities.' [3]
3.2.2 STOMP
STOMP is Simple (or Streaming) Text Orientated Messaging Protocol. It provides an interoperable wire format so
that STOMP clients can communicate with any STOMP message broker to provide easy and widespread messaging
interoperability among many languages, platforms and brokers. It is a very simple and easy to implement protocol,
coming from the HTTP school of design; the server side may be hard to implement well, but it is very easy to write
a client to get yourself connected [4].
3.2.3 MQTT
MQTT stands for MQ Telemetry Transport. It is a publish/subscribe, extremely simple and lightweight messaging
protocol, designed for constrained devices and low-bandwidth, high-latency or unreliable networks. The design
principles are to minimise network bandwidth and device resource requirements whilst also attempting to ensure
reliability and some degree of assurance of delivery. These principles also turn out to make the protocol ideal of the
emerging “machine-to-machine” (M2M) or “Internet of Things” world of connected devices, and for mobile
applications where bandwidth and battery power are at a premium [5].
3.2.4 HTTP
The Hypertext Transfer Protocol (HTTP) is an application-level protocol for distributed, collaborative, hypermedia
information systems. It is a generic, stateless, protocol which can be used for many tasks beyond its use for hypertext,
such as name servers and distributed object management systems, through extension of its request methods, error
codes and headers. A feature of HTTP is the typing and negotiation of data representation, allowing systems to be
built independently of the data being transferred. HTTP has been in use by the World-Wide Web global information
initiative since 1990. This specification defines the protocol referred to as "HTTP/1.1” and is an update to RFC
2068 [6].
3.2.5 FTP
The File Transfer Protocol (FTP) is a standard network protocol used for the transfer of computer files between a
client and server on a computer network. It is built on a client-server model architecture and uses separate control
and data connections between the client and the server. Users may authenticate themselves with a clear-text sign-in
protocol, normally in the form of a username and password, but can connect anonymously if the server is configured
to allow it. For secure transmission that protects the username and password, and encrypts the content, FTP is
often secured with SSL/TLS (FTPS) or replaced with SSH File Transfer Protocol (SFTP) [10].
3.2.6 GigE Vision
GigE Vision is an interface standard for high-performance industrial cameras. It provides a framework for
transmitting high-speed video and related control data over Ethernet networks. It is based on the Internet Protocol
standard and UDP protocol [11].

FOF-03-2016 Z-Fact0r - 723906
Page 13 of 60
3.3 Information flow
HOLONIX’s repositories and EPFL’s semantic framework, with a data sync and transformation engine between
them, act as the Z-Fact0r’s middleware. A common vocabulary for sharing common knowledge, among the partners,
was defined and implemented as a database schema (Figure 2).
Figure 2. i-Like relational (MySQL) database schema

FOF-03-2016 Z-Fact0r - 723906
Page 14 of 60
The table below (Table 1) is an overview of all components, with all the essential information for each one of them.
The components are grouped based on their functional responsibilities.
Components Partners Responsibilities Component
code Tasks Strategies
1 Micro profilometer CERTH-ITI
Data collection
DC1 T3.3 Z-DETECT
2 i-Like Machines - Production management HOLONIX DC2 T2.5 Z-MANAGE
3 Metrology - 3D scanner DATAPIXEL DC3 T2.1 Z-DETECT
4 i-Like - Repositories HOLONIX
Data repository
DR1 T3.2 Z-MANAGE
5 Semantic framework EPFL DR2 T3.5 Z-MANAGE, Z-
PREDICT
6 Repositories sync engine EPFL DR3 T3.5 Z-MANAGE
7 Event manager BRUNEL
Simulation and prediction
SP1 T4.1 Z-PREVENT, Z-
PREDICT
8 Green Optimizer BRUNEL SP2 T4.3 Z-MANAGE
9 Core Model Manager BRUNEL SP3 T4.1 -
4.4 Z-MANAGE
10 Metrology - High accuracy automatic geometrical
analysis of defects in 3D point clouds DATAPIXEL
Detection
DT1 T2.1 Z-DETECT
11 Analytical tools for 3D point cloud-based defect
information CERTH-ITI DT2
T3.4 - T2.1
Z-DETECT
12 Multi-parametric models for defects prediction and
product monitoring CERTH-ITI DT3
T3.3 - T3.4
Z-DETECT, Z-PREVENT
13 Processing algorithms for defect detection CERTH-IBO DT4 T2.2 Z-DETECT
14 KMDSS EPFL
Business decision making
BS1 T2.5 Z-MANAGE, Z-
PREVENT
15 ESDSS ATLANTIS BS2 T3.3 - T3.4
Z-DETECT, Z-PREVENT
16 Reverse Supply Chain ATLANTIS BS3 T2.5 Z-MANAGE, Z-
PREVENT
17 Context aware algorithms EPFL BS4 T3.5 Z-PREDICT
18 Additive Manufacturing Repair CETRI Repair
RP1 T2.4 Z-REPAIR
19 Robotic deburring SIR RP2 T2.3 Z-REPAIR
Table 1. Components table

FOF-03-2016 Z-Fact0r - 723906
Page 15 of 60
The diagram below (Figure 3), depicts the inputs/outputs of each component. Each component is a knowledge
source and is responsible for storing current states and producing new knowledge solving specific problems. The
components run autonomously but push any common knowledge to the middleware. The middleware support both
pull and push logic. Using pull logic, the component(s) retrieve new knowledge using a time interval. On the other
hand, with the push logic as soon as new knowledge is shared by any component(s), the middleware informs any
other related component(s).
The dataflow starts from the shop floor, moves to the measuring and detection components (DATAPIXEL,
HOLONIX, CERTH-IBO, CERTH-ITI). The prediction, prevention and management (ATLANTIS, BRUNEL,
CERTH-ITI, EPFL, HOLONIX) components are followed and the flow ends to the repair related components
(CETRI, SIR)
Figure 3. Information flow
3.3.1 Component DC1 - Micro profilometer
The aim of this component is the acquisition of surface profile data for different objects under examination.
Basically, a high-resolution 3d point cloud will be produced for the inspected areas.
3.3.2 Component DC2 – Production management
Production management will correlate machine/production parameters with production code/order number to
monitor the production and enable a quick intervention in case of anomalies. Essential input comes from shop floor
sensors located on the industrial machines or PLC, from internal legacy systems (production related information)
and from other Z-Fact0r components and algorithms. The generated output is process information (correlating
process parameters with order code), machine status, alarms, warnings and KPIs.
3.3.3 Component DC3 - Metrology - 3D scanner
DATAPIXEL is using 3D high-speed sensors to scan the parts. This equipment will be used in line to ensure the
quality of the manufactured parts/products. The physical objects (inputs) are scanned (digitalized) by the 3D scanner
so that information about parts’ surface and geometrical dimensions are captured and analyzed subsequently by the
M3 software, identifying and detecting the defects. Once the parts are digitalized, their digital images as Point Clouds
are obtained (output).
3.3.4 Component DR1 – i-Like repositories
i-Like platform supports two repositories. An Apache Cassandra, which stores all the initial data from the shop
floor devices, and a MySQL repository that carries all relational data. Input for the Apache Cassandra repository
will be sensors data, while the input for MySQL repository consists of data from all the other sourses. All these
data form also the output of the component.

FOF-03-2016 Z-Fact0r - 723906
Page 16 of 60
3.3.5 Component DR2 – Semantic framework
The Semantic Framework is an integrated software stack using semantic technologies for knowledge management.
It has a layered architecture that combines existing open source software with additional open source components
developed specifically to provide a complete semantic technology framework. The premise of the entire stack is
based on the RDF (Resource Description Framework) data model. Component DR3 (Repos sync engine) syncs i-
Like MySQL to Semantic framework. So, the total input of data for the Semantic Framework comes from the i-
Like’s MySQL.
3.3.6 Component DR3 – Repos sync engine
The component is a software service that will keep in-sync HOLONIX’s relational database with EPFL’s triple
store, for further semantic data exploitation. Any time new data are inserted in the relational database, triple store
will be updated, through a real time or configurable triggered mechanism. Sync engine’s goal is to handle big loads
of data, to have high tolerance in big loads, to be scalable, and take into account time and resources constrains.
3.3.7 Component SP1 – Event manager
Event manager gets real time data from the repository and EventC learns and constructs sequential event models
based on occurred defects. If an effect is detected or predicted the data is moved to the appropriate components
for further analysis.
3.3.8 Component SP2 – Green optimizer
Green optimizer gets real data from the repository and GEP constructs and analyses correlation model. Based on
that a solution, trade-off between the energy consumption and defect rate can be generated. Pareto frontiers that
shows solutions (production schedules, machine loadings, processing speeds on different machines). With these
solutions, the decision maker (i.e. production planner) can choose the solution that fits best their overall KPIs.
3.3.9 Component SP3 – Core manager
Upon the establishment of the input data architecture and real-time feed, the 5 Key Performance Indicator (output)
models will be implemented, and the results will provide the Actual Values of the outputs measured directly from
the shop-floor. For CORE values’ measurements, the Ideal Values will be extracted from production targets and
Quality Assurance parameters. The distance between the Actual Value and the Ideal Value, determines the CORE
value or in other words the common currency of measurement. The CORE value can also be represented in the
form of traffic light system (e.g. Red, Amber and Green).
3.3.10 Component DT1 - Metrology - High accuracy automatic geometrical analysis of defects in 3D point
clouds
The component is related to geometrical dimensions and tolerance analysis so the defects related to geometrical
dimensions are detected. As an input the component needs a list with 3D points (point cloud), and the Geometrical
Dimensions and Tolerances definition (GD&T) provided by the end-user. It produces geometrical results like
dimension glue area, value glue area, height deviation, top diameter deviation, middle diameter deviation, bottom
diameter deviation, maximum diameter deviation, max wall thickness deviation, and max angle deviation, and a
report with the results.
3.3.11 Component DT2 - Analytical tools for 3D point cloud-based defect information
The component is related to the deviation map and colour mapping where surface defects are detected. As an input
the component needs a list with 3D points, a CAD model and sensorial data from the multi-sensorial network. The
component generates map deviations (max circularity, deviation, shape deviation), reports and results from crack
detection, surface statistics and registration.
3.3.12 Component DT3 - Multi-parametric models for defects prediction and product monitoring
Multi-parametric models for defects prediction and product monitoring refer to the prediction and visualization of
defected regions. Specially, it deals with the integration and fusion of data collected from the multi-sensorial
network, so as to find defects on the products and generate a better monitoring for the user. Input data will be the

FOF-03-2016 Z-Fact0r - 723906
Page 17 of 60
fused data and output from the analysis of defects from DT2. The generated output is the severity values of the
predicted defects and trend of the defects.
3.3.13 Component DT4 - Processing algorithms for defect detection
Processing algorithms for defect detection with the use of machine learning techniques will be developed based on
the acquired data. The trained machine learning model will be able to interpret the inputs into informative outputs
that will actually be quality control-related decisions. This means that the final algorithm will decide whether a testing
IC is defective, accepted or needs rework (marginally accepted/rejected glue quantity).
3.3.14 Component BS1 – KM-DSS
KM-DSS exists to assist to the decision-making process when a defect has been predicted and suggest an action
based on the input. Also, it will be responsible for managing and prioritizing decision action produced and taken
from the RSC component (BS3). Further to that the KMDSS will be responsible for conducting a defect root cause
analysis. As input KM-DSS needs a combination of defect predictions from component “Context aware algorithm”
component (BS5), defect detection data and shop floor data. The generated output are actions for each defect
probability, the cause for each defect occurrence and a list with the prioritization of the actions to be taken.
3.3.15 Component BS2 – ES-DSS
The ES-DSS component refers to Early Stage-Decision Support System, a system for the inspection, monitoring
and control that is based on a customized set of algorithms. The ES-DSS is fed by all available data from the
repositories. The output is a short-term suggestion, a detection severity score and root cause of defects.
3.3.16 Component BS3 - RSC
Reverse Supply Chain (RSC) is rules-based software that gets defection data in real time to suggest generations,
based on the rules, and sends those suggestions back to the repository. The suggestions are utilized by the DSS
components (BS1 and BS2 components).
3.3.17 Component BS4 - Context aware algorithms for defect prediction
The purpose of the component “Context aware algorithms for defect prediction” is to analyse real time data coming
from the shop floor and based on these data to provide to the users and the system a probability and a time frame
for defect occurrence in the near future. The algorithm in order to work requires input from a defect detection
component and also from live data from the production.
3.3.18 Component RP1 - Additive Manufacturing Repair
Upon detection of a defected workpiece, the item will be driven to the repairing station where all actions will take
place. After evaluation of the effectiveness of the Z-Repair protocols, if the workpiece meets the specifications, it
will be repositioned into the production line. Via a separate online software, a notification is sent to CETRI with
the resulting file of new products to be repaired. When the product is repaired the same software sends the repair
process results to the repository.
3.3.19 Component RP2 - Robotic deburring
The deburring cell, which is offline, requires a 3D model of the defect part as an input, the part itself, description
of all the possible feature to deburr/repair. It produces an .xlsx and a .txt file. A person will post those results files
via the i-Like web services to the repository.

FOF-03-2016 Z-Fact0r - 723906
Page 18 of 60
4 Incremental Integration Strategy (IIS)
4.1 Introduction
The Incremental Integration Strategy (IIS) provides a unified framework for all the EU distributed partners, to work
on common principles. By following the IIS, we try to ensure that the integration will be successfully executed in a
timely manner. It defines a number of factors to monitor and steps to execute.
The IIS manifests that the components are integrated and tested incrementally and tested to ensure smooth
interaction among them. Every component is combined incrementally, i.e., one by one till all components are
integrated logically to make the required application, instead of integrating the whole system at once and then
performing testing on the end product. Integrated components are tested as a group to ensure successful integration
and data flow between components. The process is repeated until all components are combined and tested
successfully.
4.2 Integration approaches
As a consortium we will adopt the “early and frequent” approach. The goal is to avoid the “big-bang integration”.
In the big-bang integration approach, all components are integrated at the same time. This approach will uncover
too many problems at the same time and it will make the entire integration process more complex, money, spirit
and time wasting, and lead to a hazard communication [7].
For a distributed consortium like Z-Fact0r, the big bang approach is the worst scenario, and it will not be followed.
The reason is that is difficult to trace the failures causes as the components are integrated all at once. Moreover, if
any bugs are found, it is quite difficult to detach all the components in order to find out the bugs root cause, and
there is a high probability of missing some crucial defects, errors and issues, which might pop up in the production
environment. Additionally, it is impossible to cover all the integration scenarios without missing even a single one.
4.2.1 Top bottom integration approach
In top-down integration (Figure 4), higher-level components are integrated before bringing in the lower-level
components. The advantage of this approach is that higher-level problems can be discovered early. The main
disadvantage is the usage of dummy or skeletal components (i.e. stubs) in place of lower level components, until the
real lower-level components are integrated, since the shigher level components cannot function as they depend on
lower level ones [7]. Additionaly test conditions might be impossible, or very difficult, to create. Also, the monitoring
of test output is more difficult.
Figure 4. Top bottom integration approach [7]

FOF-03-2016 Z-Fact0r - 723906
Page 19 of 60
4.2.2 Bottom up integration approach
In bottom-up integration (Figure 5), lower-level components are integrated first, and the higher-level components
later. The advantage of this approach is that problems can be discovered early and can be solved in each iteration
[7]. Test conditions are easier to create and the test results monitoring is easier. Z-Fact0r consortium will follow
this approach.
Figure 5. Bottom up integration approach [7]
4.2.3 Sandwich integration approach
This is a mix of the top-down and the bottom-up approaches (Figure 6). The idea is to do both top-down and
bottom-up so as to “meet up” in the middle [7].
Figure 6. Sandwich integration [7]
FOF-03-2016 Z-Fact0r - 723906
Page 20 of 60
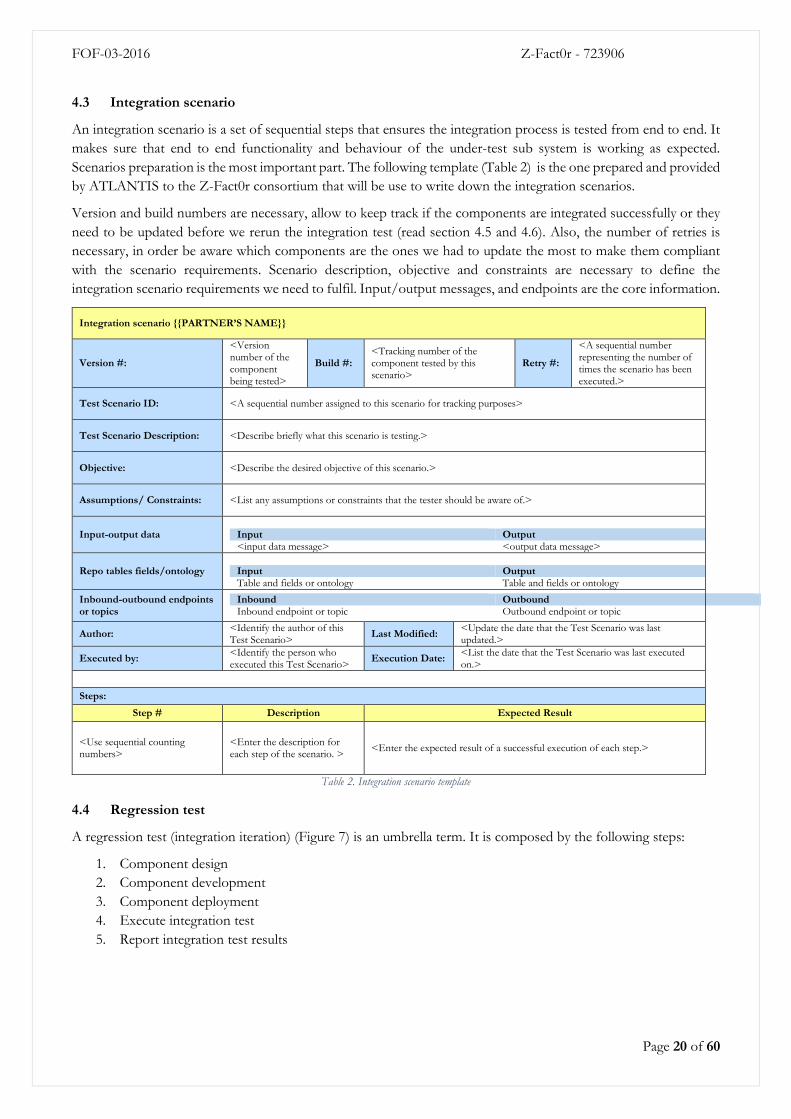
4.3 Integration scenario
An integration scenario is a set of sequential steps that ensures the integration process is tested from end to end. It
makes sure that end to end functionality and behaviour of the under-test sub system is working as expected.
Scenarios preparation is the most important part. The following template (Table 2) is the one prepared and provided
by ATLANTIS to the Z-Fact0r consortium that will be use to write down the integration scenarios.
Version and build numbers are necessary, allow to keep track if the components are integrated successfully or they
need to be updated before we rerun the integration test (read section 4.5 and 4.6). Also, the number of retries is
necessary, in order be aware which components are the ones we had to update the most to make them compliant
with the scenario requirements. Scenario description, objective and constraints are necessary to define the
integration scenario requirements we need to fulfil. Input/output messages, and endpoints are the core information.
Integration scenario {{PARTNER’S NAME}}
Version #:
<Version number of the component being tested>
Build #: <Tracking number of the component tested by this scenario>
Retry #:
<A sequential number representing the number of times the scenario has been executed.>
Test Scenario ID: <A sequential number assigned to this scenario for tracking purposes>
Test Scenario Description: <Describe briefly what this scenario is testing.>
Objective: <Describe the desired objective of this scenario.>
Assumptions/ Constraints: <List any assumptions or constraints that the tester should be aware of.>
Input-output data
Input Output <input data message> <output data message>
Repo tables fields/ontology
Input Output Table and fields or ontology Table and fields or ontology
Inbound-outbound endpoints or topics
Inbound Outbound Inbound endpoint or topic Outbound endpoint or topic
Author: <Identify the author of this Test Scenario>
Last Modified: <Update the date that the Test Scenario was last updated.>
Executed by: <Identify the person who executed this Test Scenario>
Execution Date: <List the date that the Test Scenario was last executed on.>
Steps:
Step # Description Expected Result
<Use sequential counting numbers>
<Enter the description for each step of the scenario. >
<Enter the expected result of a successful execution of each step.>
Table 2. Integration scenario template
4.4 Regression test
A regression test (integration iteration) (Figure 7) is an umbrella term. It is composed by the following steps:
1. Component design
2. Component development
3. Component deployment
4. Execute integration test
5. Report integration test results

FOF-03-2016 Z-Fact0r - 723906
Page 21 of 60
Figure 7. Regression diagram
Regression tests answer the question if the independent and heterogeneous components will work correctly when
they are integrated to each other. They verify that modifications do not cause unintended effects, and the system
still complies with its specified requirements [8]. The final purpose is to catch bugs that may have been accidentally
introduced into the new versions of the components, and to ensure that previously eradicated bugs are still
eradicated. By re-running the regression tests, we can make sure that any new changes haven’t resulted in a
regression or caused components that formerly worked to fail.
It is important for developers and testers to always keep in mind that even small, seemingly insignificant alterations
to an application’s source code can ripple outward in surprising ways, breaking functionalities that seem completely
unrelated to the new modification. Running regression tests, we are checking to make sure that any modifications
not only behave as we want them to, but also, they have not inadvertently caused problems in functionalities that
had otherwise worked correctly when previously tested.
When a regression test is completed, a report document will be filled. The monitored results (bugs, extra
improvements, software-hardware updates, etc.) for review and provide means of using these values to the next
execution of the regression test.
4.5 Regression testing plan
The regression testing plan, as part of the IIS, focuses on prioritising the execution of the regression tests where the
priority is determined by a number of factors. Collaborations among the Z-Fact0r partners and agreeing upon the
plan’s creation, with the regression tests put in place, can be leveraged down the road and used many times. Also, a
testing schedule will be defined. Regression tests for the targeted components will be completed in a specific
timeframe (i.e. within one hour, one day, two days, 5 days, etc.). The length of the timeframe of each regression test
will be defined by the complexity of the integration scenario and the number of key indicators we have to monitor.
Generally speaking, to effectively determine when to start testing, entry criteria need to be put into place related to
the project which are the minimum set of conditions that should be met before starting testing work. Similar to
entry criteria, exit criteria should be developed to set the minimum conditions that need to be met before the testing
phase is closed. These elements are agreed upon during the test-planning phase and signed off prior to product
release.
Component design
Component development
Component deployment
Execute integration test
Report integration test results

FOF-03-2016 Z-Fact0r - 723906
Page 22 of 60
4.6 Possible integration problems
Integrating a software solution to work in parallel, and not only, with a manufacturing production line, it’s not the
easiest task. Usage of existing and produced enterprise data is critical to business success. A standard data model is
required within the enterprise in order to integrate these systems, not only the business requirements needs to be
met, but needs to think beyond these and design an integration which has a standardised view of data within the
enterprise.
Ignorance of integration process and its benefits. The basic challenge is that partners often do not
understand what they are getting into. They do not do their homework before investing in integration. If
the integration plan is not clear, there are going to be some major problems. Businesses often have
unrealistic or wrong expectations regarding integration. Understanding what integration does and the
challenges that it brings to a business is very important. This lack of knowledge related to challenges itself
is a challenge.
Cost. Integrations implementations, merging processes, and then rounding up the resources it often seems
out of reach for teams with limited budgets and / or human resources.
Time. It often takes longer than expected just to deploy and set up the integration environment that is
intended to power the desired integrations. Actually, implementing the latter can quickly double the overall
timeline.
System performance. The goal is not just to integrate the various components, but also to ensure the sub
system’s (or the total system’s) performance satisfies the requirements.
Complexity. Organizations need to anticipate all potential scenarios and interactions among the connected
systems. We need to think through what happens to the data and the components behaviors when actions
are executed and date is created, edited, deleted etc. Integration paths can sometimes prove to be too
complex, if data and applications are large. If there are far too many factors to consider, and if deeper level
integrations are requested, pathways can turn out to be complex.
Coordination. Besides coordinating different components, different teams must be coordinated also.
Maintenance. Maintaining the final Z-Fac0tr solution itself can be a burden in perpetuity. Integrations
shouldn’t delay system updates and API updates shouldn’t break any automated business processes.

FOF-03-2016 Z-Fact0r - 723906
Page 23 of 60
5 Data persistence (repositories and semantic framework) i-Like, as a middleware, manages/controls the data flow of sensorial and production data. The purpose of the
semantic framework is knowledge management, and thus the semantic framework will provide historical data.
To ensure Z-Fact0r’s the overall performance, (the final Z-Fact0r solution must execute calculations and produces
results below specific thresholds in order to satisfy the end users business needs), the following decisions were made:
Components that need historical data, retrieve it from the semantic framework.
Components that need real time data, retrieve it from the i-Like Machines MySQL database.
Component that need both historical and real time data, will retrieve it from both i-Like Machines and
semantic framework
Thus, the data request overhead is distributed and provides a solid certainty to achieve the expected performance.
Components Needs real time data Needs historical data
1 Micro profilometer X -
2 i-Like Machines - Production management X X
3 Metrology - 3D scanner X -
4 i-Like - Repositories X X
5 Semantic framework - X
6 Repositories sync engine - -
5 Event manager X X
6 Green optimizer X X
9 Core Model Manager X X
10
Metrology - High accuracy automatic geometrical analysis of defects in 3D
point clouds X -
11 Analytical tools for 3D point cloud-based defect information X X
12 Multi-parametric models for defects prediction and product monitoring X X
13 Processing algorithms for defect detection X
14 KMDSS X X
15 ESDSS X -
16 Reverse Supply Chain X -
17 Context aware algorithms X X
18 Additive Manufacturing Repair - X
19 Robotic deburring - X
Table 3. Components data requirements

FOF-03-2016 Z-Fact0r - 723906
Page 24 of 60
5.1 HOLONIX’s repositories
HOLONIX iLike Machines support MySQL, Apache Cassandra and Mongo DB.
MySQL is an open-source relational database management system. The most common technique for measuring
performance is the black box approach. It measures the Transactions Per Second TPS) executed against a database.
In this scenario a transaction is a unit of execution that a client application invokes against a database. A simple read
query or a grouping of updates done in a stored procedure. In this context, the term transaction does not necessarily
refer to an ACID-compliant transaction but may involve ACID-compliant transactions depending on how the test
is structured.
Apache Cassandra is a NoSQL database platform. It offers continuous availability, high scalability and
performance, strong security, and operational simplicity. It also supports very high throughput. The write path
allows for high performance, robust writes. Read/write performance and capacity scales linearly as new hardware
are added. Adding new hardware requires no downtime or disruption to consumers. Every node in the cluster is
identical and can run on commodity hardware. There is no master server. Data is automatically replicated to multiple
nodes – which may be cross-rack (or cloud availability zone) and cross-datacentre. This can be used to ensure high
availability across geographical regions. Cassandra uses columns to store data within rows, as rows can be of
different length, i.e. have different numbers of columns per row, this leads to rows only as wide as the data in them
and users have the ability to change the schema at runtime. With tuneable consistency on a per read write operation,
replication and read write consistency guarantees can be tuned either for speed or reliability for each query. It is
ideally suited to relatively immutable data where updates and deletions are the exception rather than the rule. This
includes handling high-throughput firehoses of immutable events such as personalisation, fraud detection, time
series and IOT/sensors.
MongoDB is a NoSQL open-source cross-platform document-oriented database software. It stores data in flexible,
JSON-like documents, meaning fields can vary from document to document and data structure can be changed
over time. The document model maps to the objects in the application code, making data easy to work with and ad
hoc queries, indexing, and real time aggregation provide powerful ways to access and analyse data. MongoDB is a
distributed database at its core, so high availability, horizontal scaling, and geographic distribution are built in and
easy to use.
HOLONIX has performed benchmark tests considering on those three DB systems. The goals of this
benchmark test are to validate and to ensure the performance of the middleware. Based on the following
results, i-Like Machines platform is stable.
Benchmark test is carried out simulating:
The collection of data from industrial machines carried out for one year considering various sampling
frequencies.
The request for daily and hourly data for these machines
The test has been conducted according to the following structure:
Phase 1: Accelerated and continuous insertion of random data from 32 sources for month X (excluding the last
hour of the last day) to populate the DB. Sources mean to simulate sensors with different sampling frequencies. In
details:
2 sensors every 100ms
10 sensors every 500ms
20 sensors every 1000ms
Driving criteria for this choice was the compromise between velocity of the test and the amount of data available.
FOF-03-2016 Z-Fact0r - 723906
Page 25 of 60
Phase 2: Real-time simulation of DB usage (applied the last hour of the last day of the month X):
Sensors right data respectively every 100-5000-1000ms
15 users read every 5 minutes data corresponding to a random hour of the month X
users read every 10 minutes data for a random day of the month X
The two phases have been interchanged for 12 times to have the test during 1 year.
Medium latencies have been sampled every 5 minutes.
The model used for the test is based on a data structure containing:
Sensor ID
Data Timestamp
Value
This structure assumes different aspects according to the DB under analysis, in particular considering MongoDB,
in which there are no tables, but only “object” and “array”.
Preliminary setting where carried out:
MySQL: 10GB of RAM reserved
Apache Cassandra: 4GB RAM heap size (1/4 of the overall RAM available)
MongoDB: no pre-setting needed. The DB acquire all the available RAM and release it when it is
required by other processes
With accelerated insertion, the 3 DBs have been populated with an amount of data corresponding to an average of
1’091’750’400 rows per month (13’101’004’800 total rows).
During the real time simulation data corresponding to1’497’600 rows per hour per month have been written (total
rows: 17’971’200).
A total of random data corresponding to 13’118’976’000 rows have been inserted.
The results of writing data are in the following graphs:
every 100ms (Figure 8),
every 500ms (Figure 9)
every 1000ms (Figure 10)
And the graphs of reading data are the following:
Hourly data reading (Figure 11)
Daily data reading (Figure 12).

FOF-03-2016 Z-Fact0r - 723906
Page 26 of 60
Figure 8: Data every 100ms (Cassandra vs. MongoDB vs. MySQL)
Figure 9: Data every 500ms (Cassandra vs. MongoDB vs. MySQL)

FOF-03-2016 Z-Fact0r - 723906
Page 27 of 60
Figure 10: Data every 1000ms (Cassandra vs. MongoDB vs. MySQL)
Figure 11: Hourly data reading (Cassandra vs. MongoDB vs. MySQL)

FOF-03-2016 Z-Fact0r - 723906
Page 28 of 60
Figure 12: Daily data reading (Cassandra vs. MongoDB vs. MySQL)
MySQL is the DB that better comply with the workload required. Apache Cassandra shows similar performance, in
particular in the writing phase, thanks to the column-oriented structure and to the compression techniques used,
particularly suitable to store data similar to each other. MongoDB on the other hand shows much worst performance
and it requires more RAM to provide optimal performance. Thus, in Z-Fact0r project, it has been chosen to use
MySQL DB for production related data and Apache Cassandra for sensors (unstructured) data.

FOF-03-2016 Z-Fact0r - 723906
Page 29 of 60
5.2 EPFL’s semantic framework
Apache Jena is a free and open source Java framework for building semantic web and Linked Data applications.
The framework is composed of different APIs interacting together to process RDF data. If you are new here, you
might want to get started by following one of the tutorials. You can also browse the documentation if you are
interested in a particular topic [9].
RDF is a directed, labelled graph data format for representing information in the Web. This specification defines
the syntax and semantics of the SPARQL query language for RDF. SPARQL can be used to express queries across
diverse data sources, whether the data is stored natively as RDF or viewed as RDF via middleware [13].
SPARQL contains capabilities for querying required and optional graph patterns along with their conjunctions and
disjunctions. SPARQL also supports extensible value testing and constraining queries by source RDF graph. The
results of SPARQL queries can be results sets or RDF graphs. SPARQL allows users to write queries against what
can loosely be called "key-value" data or, more specifically, data that follow the RDF specification. Thus, the entire
database is a set of "subject-predicate-object" triples [13].
RDF data can also be considered a table with three columns – the subject column, the predicate column, and the
object column. The subject in RDF is analogous to an entity in an SQL database, where the data elements (or fields)
for a given business object are placed in multiple columns, sometimes spread across more than one table, and
identified by a unique key [13].
In RDF, those fields are instead represented as separate predicate/object rows sharing the same subject, often the
same unique key, with the predicate being analogous to the column name and the object the actual data. Unlike
relational databases, the object column is heterogeneous: the per-cell data type is usually implied (or specified in the
ontology) by the predicate value [13].
Also, unlike SQL, RDF can have multiple entries per predicate; for instance, one could have multiple "child" entries
for a single "person", and can return collections of such objects, like "children" [13].
The example below demonstrates a simple query that leverages the ontology definition. Specifically, the following query returns names and emails of every person in the dataset [13]:
PREFIX foaf: <http://xmlns.com/foaf/0.1/>
SELECT ?name
WHERE
{
?person a foaf:Person .
?person foaf:name ?name .
?person foaf:mbox ?email .
}

FOF-03-2016 Z-Fact0r - 723906
Page 30 of 60
6 Production management
The Production Management component (Figure 13) aims at:
Collecting data from different sources (sensors, machines PLC, company’s legacy systems)
Acting as middleware, managing data transfer among different components and layers
Visualising through a web-based App relevant information and KPIs, correlating production data
with machine related parameters.
In this context, the integration of the module in the global platform is given through the action flow.
Figure 13. Production management action flow
Production Managements data sources are machines (including sensors installed on the machines and nearby), legacy
systems (SAP (Durit) and Microsoft AX (MICROSEMI)) and Z-Fact0r’s components. Data consumers are also the
Z-Fact0r’s components.
Real time data from sensors installed on the machines are published into an MQTT broker where the “Raw data
handler” subscribe to acquire sensors data (see Figure 14). Then, the raw data handler writes data to the sensor data
repository, sends it to a real time data consumer and pushes it to the semantic framework through the RabbitMQ
Broker. As it was previously mentioned, components needing historical data can retrieve it from the semantic
framework. In Z-Fact0r, this approach applies only for MICROSEMI case study, since DURIT will not provide
actual real-time data.
Figure 14: Sensors data flow (MICROSEMI)

FOF-03-2016 Z-Fact0r - 723906
Page 31 of 60
All the data in DURIT case study (sensors and production related) will be provided through a bridged DB (Figure
15)
Figure 15: Sensors data flow (DURIT)
The Production Data Handler performs a scheduled data request to collect sensorial data from the Bridged database
(Figure 16). The production data from SAP are stored in the Bridged DB from which they are periodically acquired
by the Production Data Handler that posts it to the Production Data repository, and then it is pushed through the
RabbitMQ Broker to the semantic framework.
Figure 16: Production data flow (DURIT)

FOF-03-2016 Z-Fact0r - 723906
Page 32 of 60
Production data from MICROSEMI (Figure 17) from Microsoft AX is provided as a .CSV file that is uploaded daily
onto an FTP server. The Production data Handler periodically (once per day) downloads the file, parses the .CSV
file, post the data to the Production data repository and pushes it to the semantic framework through the RabbitMQ
Broker.
Figure 17: Production data flow (MICROSEMI)
The last category of data sources is represented by Z-Fact0r’s components. They can produce data organised in files
or not (Figure 18). In the first case a file from a module (e.g. PointCloud) is sent to Repository through the
Production data handler. Here a unique ID is assigned to the file and metainformation is sent to the semantic
framework. Interested components are notified that the new file is available and Unique ID is communicated. The
component can now require the file through the production data handler. After an elaboration, the Production
Management component can produce new data, not organised in files. Finally, the data is sent to the Production
Data Handler.

FOF-03-2016 Z-Fact0r - 723906
Page 33 of 60
Figure 18: I/O handling
7 Repositories sync engine
7.1 Introduction
Sync engine is a software service that will keep in-sync HOLONIX’s relational database with EPFL’s triple store,
for further semantic data exploitation. Any time new data are inserted in the relational database, triple store will be
updated, through an almost real time mechanism. Sync engine’s goal is to handle big loads of data, to have high
tolerance in big loads, to be scalable, and take into account time and resources constrains.
7.2 Engine’s architecture
The Relational Database (HOLONIX) is Z-Fact0r’s solution main repository. The RabbitMQ Server is the
mechanism for subscribing to real time data changes messages. The Synchronizer Service (Data Repository
Synchronizer Service) (Figure 19) is the service that will process incoming RabbitMQ messages and update the
triple store. The Triple Store is the database for storing the relational data as RDF triples.

FOF-03-2016 Z-Fact0r - 723906
Page 34 of 60
Figure 19. Sync engine High-Level System Architecture
When data change in the relational database, RabbitMQ will publish a relevant message containing all the
necessary information. Data Synchronizer Service is a process that runs continuously and listens for these specific
messages, by subscribing to the relevant RabbitMQ channel. The Data Synchronizer Service logic is implemented
following the data flow programming.
Data Synchronizer Flow (Figure 20) consists of 3 flow steps:
1. Receive Step: This step is responsible for connecting to RabbitMQ and receive any published messages. Messages are pushed to RDFizer step.
2. RDFizer Step: This step will tranform the received message to RDF triples and push the transformed message to the next step.
3. Persist Step: This step will save the new data to the RDF triple store. Data Synchronizer Service Processor will keep receiving and processing incoming messages keeping the triple
store updated.
Figure 20. Mid-Level Sync engine system Architecture – Processing Pipeline
8 Z-Fact0r Incremental Integration Strategy (ZF-IIS)
8.1 Integration strategy
Integration is assembled by 6 teams (Figure 21). Each team, besides Team 5 and Team 6 will start the integration
process when the previous one has executed successfully its integration scenarios, and the sub system is
built. Teams 5 and 6 will run through the whole integration process. In details:
Team 1. It is assembled by DATAPIXEL, CERTH-ITI, HOLONIX. The integration scenarios are for the
components DC1, DC2, DC3 and DR1, DR2, DR3.
Team 2. It is assembled by CERTH-IBO, CERTH-ITI, DATAPIXEL. The integration scenarios are for the
components DT1, DT2, DT3, DT4.

FOF-03-2016 Z-Fact0r - 723906
Page 35 of 60
Team 3. It is assembled by ATLANTIS, CERTH-ITI, EPFL. The integration scenarios are for components BS1,
BS2, BS3, BS4, BS5.
Team 4. It is assembled by CETRI, SIR. The integration scenarios are for components RP1 and RP2.
Team 5. It assembled by HOLONIX, EPFL. This team implements the repositories sync, during the whole
integration process.
Team 6. It is assembled by BRUNEL. This team implements the repositories sync, during the whole integration
process.
Figure 21. Incremental Integration Strategy (IIS)
As it has been described in the previous chapters, the consortium will execute the integration process by using the
bottom up approach. Integration will start from the lower-level components (data collection components) ending
to higher-level components (business components and repair components). Tests, bug fixes, updates and other
actions will be taken in the scope of each team, so monitoring the progress will be easier.
Initially (Figure 22), the middleware and the semantic framework will be deployed. Also, a RabbitMQ will be
installed, so the components to be able to subscribe to it. Then the data collection components (DC1, DC2, DC3
of Team 1) will be integrated to deliver Sub system 1. Then analysis and detection components will be integrated
with the Sub system 1, and the integration’s result will be Sub system 2. The third phase is the integration of the
business-oriented components that will deliver Sub system 3 and finally, the fully hardware components, the repair
robots will conclude the integration process by delivering the final Z-Fact0r solution.
Team 5 (HOLONIX, EPFL) will run in parallel, though out the whole integration process making sure, of the data
persistence, transformation and synchronization. Additionally, Team 6 (BRUNEL) will run in parallel, but it will
start only after Team 1 is over, because SP1, SP2, SP3 components need real-time and historical data to run the
off-line simulations and predictions.

FOF-03-2016 Z-Fact0r - 723906
Page 36 of 60
Figure 22. Bottom up integration flow
In section 3.2 the communication protocols are described. The protocols to be used are MQTT, AMPQ, HTTP,
FTP. (Figure 23).
Figure 23. Information flow communication interfaces

FOF-03-2016 Z-Fact0r - 723906
Page 37 of 60
8.2 Integration scenarios
8.2.1 Team 1 scenarios
Integration scenario CERTH-ITI
Version #: 1.0 Build #:
<Tracking number associated with the module, or set of modules, packaged together that perform the function tested by this test scenario>
Retry #: 1
Test Scenario ID:
CERTH/ITI_1
Test Scenario Description:
Managing micro profilometer sensor for the object scanning using configuration file that specify scan parameters.
Objective: To prepare the sensor for the scan by calibrating the lenses, sensor position and scan parameters.
Assumptions/ Constraints:
User is responsible to calibrate and prepare the sensor using the parameters as specified in the configuration file. The scenario requires communication with the repository to extract the configuration parameters from the file.
Input-output data
Input Output
{"MultipleScansInArea":{
"stepAccuracy":{"X":1,"Y":1},
"scanAreaLength":{"X":13,"Y":19},
"scanAreaCoords":{"X":0,"Y":0},
"roiLength":{"X":2,"Y":2 },
"offset":{"X":3,"Y":3}},
"GridScansInArea": {
"stepAccuracy":{"X":0.02,"Y":0.02},
"numScans": 0,
"PCBrows":{
"1":{
"keep":1,
"CoordsAbs":{
"X":223.9,
"Y":74.4},
"scanCircuitsNo":1,
"scanCircuitOffset":13.3,
"glueTypesNo":5,
"glueTypesData":
[
{"length":{"X":1.2,"Y":1.2},"Coords":{"X":-2.55,"Y":-
2.2},"keep":1},
{"length":{"X":0.7,"Y":1.8},"Coords":{"X":-13.955,"Y":-
9.275},"keep":0},
{"length":{"X":0.6,"Y":0.6},"Coords":{"X":-14.895,"Y":-
8.32},"keep":0},
{"length":{"X":0.7,"Y":1.8},"Coords":{"X":-13.67,"Y":-
5.45},"keep":0},
{"length":{"X":0.6,"Y":0.6},"Coords":{"X":-12.795,"Y":-
3.925},"keep":0},
{"length":{"X":0.8,"Y":0.8},"Coords":{"X":-14.35,"Y":-
2.0},"keep":0}
],
"gridRoisNo":{"X":1,"Y":1},
"gridRoisOffsetX":[4, 4, 4, 4, 4]
},
"2":
{
"keep":0,
"CoordsAbs":{
"X":202.3,
"Y":74.5},
"scanCircuitsNo":9,

FOF-03-2016 Z-Fact0r - 723906
Page 38 of 60
"scanCircuitOffset":13.3,
"glueTypesNo":5,
"glueTypesData":
[{"length":{"X":0.7,"Y":1.8},"Coords":{"X":-13.955,"Y":-
9.275},"keep":0},
{"length":{"X":0.6,"Y":0.6},"Coords":{"X":-14.895,"Y":-
8.32},"keep":0},
{"length":{"X":0.7,"Y":1.8},"Coords":{"X":-13.67,"Y":-
5.45},"keep":0},
{"length":{"X":0.6,"Y":0.6},"Coords":{"X":-12.795,"Y":-
3.925},"keep":0},
{"length":{"X":0.8,"Y":0.8},"Coords":{"X":-14.35,"Y":-
2.0},"keep":0}
],
"gridRoisNo":{"X":4,"Y":5},
"gridRoisOffsetY":[4, 4, 4, 4, 4]
}}},
"RectangleAreaSingleScan":
{
"stepAccuracy":{"X":0.05,"Y":0.05},
"scanAreaLength":{"X":75,"Y":55},
"scanAreaCoords":{"X":3,"Y":3}
},
"ScanParameters": {
"frequency": 8000,
"laserPower": 1000,
"lensIndex":1,
"totalPoints":0,
"scanningSpeedX":100,
"scanningSpeedY":100}}
Repo tables fields/ontology
Input Output
Table and fields or ontology Table and fields or ontology
Inbound-outbound endpoints or topics
Inbound Outbound
Endpoint/Topic in repository -
Author: Not available at the moment Last
Modified: Not available at the moment
Executed by: Not available at the moment Execution
Date: Not available at the moment
Test Steps:
Step # Description Expected Result
1 User must initialize the sensor The sensor is initialized.
2 Product ID and scan parameters are defined by downloading the configuration file from repository
File is read and the scan parameters are extracted.
3 The configuration file set the scan operation mode (e.g grid scanning for the Microsemi use case, rectangle scanning for Durit use case)
The scan operation mode is set for each use case.
4 The product is placed under the sensor and the sensor parameters are calibrated to scan the product’s surface.
Product’s surface to be measured must remain inside measurement range of the lenses.
Table 4. CERTH/ITI_1 integration scenario

FOF-03-2016 Z-Fact0r - 723906
Page 39 of 60
Integration scenario CERTH-ITI
Version #: 1.0 Build #:
<Tracking number associated with the module, or set of modules, packaged together that perform the function tested by this test scenario>
Retry #: 1
Test Scenario ID:
CERTH/ITI_2
Test Scenario Description:
Performing the scan of the inspected object using the parameters defined in a configuration file stored locally or in the repository (scenario CERTH/ITI_1)
Objective: The sensor scans the product’s surface and exports the surface measurements as a point cloud file/files.
Assumptions/ Constraints:
The product for inspection must be the same object as defined by the product ID from the input file from repository. The sensor must be calibrated and ready to scan the object.
Input-output data
Input Output
{ " RelatedInputID ": { " ProductID ": 42112, "ProductData": { "ProductionStage": 3, "ProductionOrderProcessID": 4123314 }}}
{"ScanData":{ "ScanAccuracyX":0.02, "ScanAccuracyY":0.05, "SensorAccuracy":0.06, "SensorLens":50 }, "PointCloudData":{ "PointCloudID":342423423, "PointCloud":[ {"X":0.4,"Y":0.5,"Z":42.9902}, {"X":0.4,"Y":0.55,"Z":44.17412}, {"X":0.4,"Y":0.6,"Z":43.12812} ]}}
Repo tables fields/ontology
Input Output
Table and fields or ontology Table and fields or ontology
Inbound-outbound endpoints or topics
Inbound Outbound
Endpoint/Topic in repository Endpoint/Topic in repository
Author: Not available at the moment Last
Modified: Not available at the moment
Executed by: Not available at the moment Execution
Date: Not available at the moment
Test Steps:
Step # Description Expected Result
1 The productID from the input file defines the id of the object for inspection and is confirmed by the user.
The product for inspection is confirmed to be the same as requested by the configuration file.
2 The product is scanned using step accuracy as defined in the configuration file.
The surface’s profile measurements are converted to point cloud file/files.
3 The measured point clouds are sent to repository Point clouds from the product scans are stored in repository.
Table 5. CERTH/ITI_2 integration scenario

FOF-03-2016 Z-Fact0r - 723906
Page 40 of 60
System and Integration Test Scenario DATAPIXEL
Version #: 38.33.4 Build
#: Retry #: 1
Test Scenario ID: DATAPIXEL_1
Test Scenario
Description:
Generate list of 3D points by scanning the physical object under study, and use these point clouds to further analysis for defect
detection and, additionally, send them to the repository
Objective: To produce reliable results without any corruptions in a timely manner.
Assumptions/
Constraints: Execute the total scenario in less than 6 minutes depending on the size of the physical part to be scanned
Input-output data
Input Output
Physical object
ID part
Production stage and timestamp
txt file (file size from 10MB-50MB up to 500MB)
Repo tables
fields/ontology
Input Output
Inbound-outbound
endpoints or topics
Inbound Outbound
N/A
1. M3 SW DB
2. webservice Holonix
Author: Not available at the
moment Last Modified: 03/07/2018
Executed by: Not available at the
moment Execution Date:
Test Steps:
Step # Description Expected Result
1 Measuring Plan
Definition Measuring Plan
2
Definition of the
digitalisation
Programme -
Settings
The programme to be used for the digitalisation of the physical part
3 Data Collection and
structuring
Scanning the physical object.
Several point clouds of different areas
4
Point cloud
Generation -
Integration of
different point
clouds based on the
qualification of
different
orientations of a
calibrated sphere
Complete point cloud with high accuracy
Table 6. DATAPIXEL_1 integration scenario

FOF-03-2016 Z-Fact0r - 723906
Page 41 of 60
8.2.2 Team 2 scenarios
Integration scenario CERTH-ITI
Version #: 1.0 Build #:
<Tracking number associated with the module, or set of modules, packaged together that perform the function tested by this test scenario>
Retry #: 1
Test Scenario ID:
CERTH/ITI_3
Test Scenario Description:
The system analyses defected regions on materials, achieves the registration between point clouds and calculates the surface statistics.
Objective: The objective of this integration scenario is the DT2 component to receive input data from the micro-profilometer and the 3D scanner and the multisensorial network, calculate the surface statistics of the selected object, detect any defected area on the object and register different scans of the same object.
Assumptions/ Constraints:
Repository must be online
Input-output data
Input Output
{ "RelatedInputID": { "ProductID": 42112, "ProductData": { "ProductionStage": 3, "ProductionOrderProcessID": 4123314 } }, "SensorsData": [ { "SensorID":4142412, "SensorMeasure":"Temperature", "SensorMeasurements":[ 22.8, 33.1] }, { "SensorID":6243126, "SensorMeasure":"Pressure", "SensorMeasurements":[ 1.45, 2.43] } ] ,"PointCloudData":{ "PointCloudID":342423423, "PointCloud":[ {"X":0.4,"Y":0.5,"Z":42.9902}, {"X":0.4,"Y":0.55,"Z":44.17412}, {"X":0.4,"Y":0.6,"Z":43.12812} ]}}
{ " RelatedInputID ": { " ProductID ": 42112, "ProductData": { "ProductionStage": 3, "ProductionOrderProcessID": 4123314 } }, "SurfaceDescriptors": { "ArithmeticalMeanDeviation": 0.1405, "DeviationOnZaxis": 0.16309, "Kurtosis": 2.0326, "MaximumHeight": 0.372, "MaximumPeakHeight": 0.37250, "MaximumPitHeight": 2.2748034e-06, "RootMeanSquareHeight": 0.1630952, "Skewness": 1.3520 }, "SensorsData": [ { "SensorID":4142412, "SensorMeasure":"Temperature", "SensorMeasurements":[ 22.8, 33.1] }, { "SensorID":6243126, "SensorMeasure":"Pressure", "SensorMeasurements":[ 1.45, 2.43] } ], "Registration": { "Hausdorff distance": 0.05409, " ProductID -Source": "42112", " ProductID -Target": "42113", "RMSE": 0.00363556039519608, "TransformationMatrix": [ [ 0.9997382, 0.01448, -0.017661, 0.0085302 ], [ -0.0135875, 0.9986685, 0.049761, 0.0008475 ], [ 0.0183582, -0.04950903, 0.998604, 5.22903e-05 ], [ 0, 0, 0, 1 ] ] } }
Repo tables fields/ontology
Input Output
Table and fields or ontology Table and fields or ontology
Inbound-outbound endpoints or topics
Inbound Outbound
Endpoint/Topic in repository Endpoint/Topic in repository
Author: Not available at the moment Last
Modified: Not available at the moment
Executed by: Not available at the moment Execution
Date: Not available at the moment

FOF-03-2016 Z-Fact0r - 723906
Page 42 of 60
Test Steps:
Step # Description Expected Result
1 Load the input data from the repository Get the right object
2 Extract the surface statistics Calculate the correct surface statistics for the input data
3 Execute defect detection algorithms on the input data
Predict the right defected area on the object
4 Execute registration algorithm between point clouds
Correct alignment of the point clouds
5 Return the results on the repository Send the generated results on the repository successfully
Table 7. CERTH/ITI_3 integration scenario

FOF-03-2016 Z-Fact0r - 723906
Page 43 of 60
Integration scenario CERTH-ITI
Version #: 1.0 Build #:
<Tracking number associated with the module, or set of modules, packaged together that perform the function tested by this test scenario>
Retry #: 1
Test Scenario ID:
CERTH/ITI_4
Test Scenario Description:
Detect and predict product’s defects using the available fused data
Objective: The objective of this integration scenario is to receive all the available fused data and detect and predict product’s defects.
Assumptions/ Constraints:
Repository must be online
Input-output data
Input Output
{ " RelatedInputID ": { " ProductID ": 42112, "ProductData": { "ProductionStage": 3, "ProductionOrderProcessID": 4123314 } }, "SurfaceDescriptors": { "ArithmeticalMeanDeviation": 0.1405, "DeviationOnZaxis": 0.16309, "Kurtosis": 2.0326, "MaximumHeight": 0.372, "MaximumPeakHeight": 0.3725, "MaximumPitHeight": 0.0000022748034, "RootMeanSquareHeight": 0.1630952, "Skewness": 1.352 }, "SensorsData": [ { "SensorID": 4142412, "SensorMeasure": "Temperature", "SensorMeasurements": [ 22.8, 33.1 ] }, { "SensorID": 6243126, "SensorMeasure": "Pressure", "SensorMeasurements": [ 1.45, 2.43 ] } ], "Registration": { "Hausdorff distance": 0.05409, " ProductID -Source": "42112", " ProductID -Target": "42113", "RMSE": 0.00363556039519608, "TransformationMatrix": [ [ 0.9997382,0.01448,-0.017661,0.0085302 ], [ -0.0135875, 0.9986685, 0.049761, 0.0008475 ], [ 0.0183582,0.04950903, 0.998604,0.0000522903 ], [ 0,0,0,1 ] ] }, "DetectedDeviations": [
{ "Event":"Detection", "DefectData": { "DefectCauseID": 342342342, "DefectDescription": "Glue Normal", "DefectFlag": 0, "DefectOriginID": 2131234, "DefectTrend": 0, "DefectTypeID": 34234324, "Severity": { "score_LOF": 1 } }, "GlueData": { "CircuitID": 2, "DeviationScore": 0, "GlueID": "a", "row": 2, "thresholdDn": 0.038, "thresholdUp": 0.055, "volume": 0.044942 }, "ID": 11, "ProductData": { "PartID": "34235234324", "PartType": "PCB circuit" }, "ProductionStage": 3, "SensorsData": [ { "SensorID": 41232131, "SensorMeasure": "Temperature", "SensorMeasurements": [ 34.65, 33.45, 32.15 ] }, { "SensorID": 72113454, "SensorMeasure": "Pressure", "SensorMeasurements": [ 1.45, 4.65, 8.54 ] } ], "Timestamp": "2018-07-03T16:15:46.242" }

FOF-03-2016 Z-Fact0r - 723906
Page 44 of 60
{ "GlueID": "a", "CircuitID": 3, "row": 1, "volume": 0.04531, "DeviationScore": 0.3434, "DefectFlag": 1, "DetectionTimeStamp": 1523343287068 }, { "GlueID": "b", "CircuitID": 2, "row": 1, "volume": 0.04531, "DeviationScore": 0.3434, "DefectFlag": 1, "DetectionTimeStamp": 1523343287068 } ] }
Repo tables fields/ontology
Input Output
Table and fields or ontology Table and fields or ontology
Inbound-outbound endpoints or topics
Inbound Outbound
Endpoint/Topic in repository Endpoint/Topic in repository
Author: Not available at the moment Last
Modified: Not available at the moment
Executed by: Not available at the moment Execution
Date: Not available at the moment
Test Steps:
Step # Description Expected Result
1 Load data from CERTH/ITI_3 scenario output All available fused data are loaded.
2 Implement a set of algorithms and analytical tools to detect and predict product’s defects and defects trend.
A set of algorithms process the input data and produce the output values.
3 Define the severity score and the defect trend based on the output of the algorithms.
Severity score and defect trend score are calculated.
Table 8. CERTH/ITI_4 integration scenario

FOF-03-2016 Z-Fact0r - 723906
Page 45 of 60
System and Integration Test Scenario DATAPIXEL
Version #: 38.33.4 Build #:
Retry #: 1
Test Scenario ID:
DATAPIXEL_2
Test Scenario Description:
Generate the measurement results, based on the point cloud and geometrical dimensions and tolerances, to identify the results out of tolerance (defects)
Objective: To produce reliable results without any corruptions in a timely manner.
Assumptions/ Constraints:
Execute the total scenario in less than 2 minutes Results should be mapped (read) by other components to detect where the defect appears
Input-output data
Input Output
Pointcloud Geometrical dimension and tolerances of the end-user
XML file (max 100kb)
Repo tables fields/ontology
Input Output
Inbound-outbound endpoints or topics
Inbound Outbound
M3 software DB End-user
1. M3 SW DB 2. webservice Holonix
Author: Not available at the moment
Last Modified: Not available at the moment
Executed by: Not available at the moment
Execution Date: Not available at the moment
Test Steps:
Step # Description Expected Result
1 Receive inputs Get the point cloud generated and the geometrical dimensions and tolerances set by the end-user
2 Geometrical alignment Calculation of the best transformation of point cloud coordinate systems
3 Automatic extraction of the geometry (2D and 3D)
Dimensions of the geometry. Based on the part to be studied, geometries are extracted and measured.
4 Comparison with nominal GD&T
Comparison of the measured dimensions and the ones set by the design of the part.
5 Calculation of deviations Obtain the deviation between the measured dimensions and the nominal ones.
6 Comparison with tolerances
Comparison of the deviations with the tolerance set by the end-user. Identification of defects. If the deviation>tolerance = defect.
Table 9. DATAPIXEL_2 integration scenario

FOF-03-2016 Z-Fact0r - 723906
Page 46 of 60
System and Integration Test Scenario DATAPIXEL
Version #: 38.33.4 Build #: Retry #: 1
Test Scenario ID: DATAPIXEL_3
Test Scenario Description:
Generate a deviation map, based on the point cloud and CAD model, to identify the surface defects of the parts.
Objective: To produce reliable results without any corruptions in a timely manner.
Assumptions/ Constraints:
Execute the total scenario in less than 4 minutes Results should be mapped (read) by other components to detect where the defect appears Only in Durit use case
Input-output data
Input Output
Pointcloud
CAD model
STL file (≈ 1MB) cmr file (≈ 300-500 kB)
Repo tables fields/ontology
Input Output
Inbound-outbound endpoints or topics
Inbound Outbound
M3 software DB End-user
1. M3 SW DB 2. webservice Holonix
Author: Not available at the moment Last Modified:
Not available at the moment
Executed by: Not available at the moment Execution Date:
Not available at the moment
Test Steps:
Step # Description Expected Result
1 Receive inputs Get the point cloud generated and the CAD model in STEP format
2 Geometrical alignment Calculation of the best transformation of point cloud coordinate systems
3 Generation of the polygonal mesh based on the CAD model
A polygonal mesh
4 Calculation of the distances from the point cloud to the model in each region
Set of distances in each region
5 Annotation of the distances in each triangle of the polygonal mesh
Deviation Map. Polygonal mesh with distances annotated
6 Generation of the colormap Colormap. Deviation map presented with different colors based on deviations and tolerances. Red color indicates a defect
Table 10. DATAPIXEL_3 integration scenario

FOF-03-2016 Z-Fact0r - 723906
Page 47 of 60
System and Integration Test Scenario DATAPIXEL
Version #: 38.33.4 Build #: Retry #: 1
Test Scenario ID: DATAPIXEL_4
Test Scenario Description:
Generate a report based on the GD&T results and deviation map
Objective: To produce reliable results without any corruptions in a timely manner.
Assumptions/ Constraints:
Execute the total scenario in less than 2 minutes Results should be read by the components
Input-output data
Input Output
GD&T results Deviation Map
PDF file (≈ 300-500 KB)
Repo tables fields/ontology
Input Output
Inbound-outbound endpoints or topics
Inbound Outbound
M3 software DB
1. M3 SW DB 2. webservice Holonix
Author: Not available at the moment Last Modified:
Not available at the moment
Executed by: Not available at the moment Execution Date:
Not available at the moment
Test Steps:
Step # Description Expected Result
1 Receive inputs Get the GD&T results and the deviation map
2 Integrate the results in one document Document with all the results coming from the scanning process where defects are detected
Table 11. DATAPIXEL_4 integration scenario

FOF-03-2016 Z-Fact0r - 723906
Page 48 of 60
Integration scenario CERTH-IBO
Version #:
<Version number of the component being tested>
Build #: <Tracking number of the component tested by this scenario>
Retry #:
<A sequential number representing the number of times the scenario has been executed.>
Test Scenario ID: CERTH_IBO_1
Test Scenario Description:
Processing algorithms for defect detection will be developed based on the acquired data and will be based on the use of machine learning techniques that will be trained using the input data. At the end, the trained machine learning model will be able to 'transform/translate ‘interpret the inputs into informative outputs that will actually be quality control-related decisions. This means that the trained model will decide whether a testing IC is defective, accepted or needs rework (marginally accepted/rejected glue quantity)
Objective: The goal is for the processing algorithm to decide whether a part/material is defective, accepted or needs rework (marginally accepted/rejected glue quantity).
Assumptions/ Constraints: Data sets big enough for training and testing, generated data
Input-output data
Input Output Point clouds (.ply) .stl, .stp .cmr .txt .csv
Classes: Healthy Defected Needs rework
Repo tables fields/ontology
Input Output Table and fields or ontology Table and fields or ontology
Inbound-outbound endpoints or topics
Inbound Outbound Inbound endpoint or topic Outbound endpoint or topic
Author: Not available at the moment Last Modified: Not available at the moment
Executed by: Not available at the moment Execution Date: Not available at the moment
Steps:
Step # Description Expected Result
1 Receive data (historical, current)
<Enter the expected result of a successful execution of each step.>
2 Generate data if necessary Increase the number of data
3 Train model Fit a machine learning model to the data
4 Receive new data Classify inputs to the respective categories
Table 12.CERTH-IBO_1 integration scenario

FOF-03-2016 Z-Fact0r - 723906
Page 49 of 60
8.2.3 Team 3 scenarios Integration scenario ATLANTIS
Version #: 208.03.01 Build #: 03 Retry #: 1
Test Scenario ID: ATL_1
Test Scenario Description:
The Reverse Supply Chain (RSC) component will receive as input, a JSON message with the defect data (type, origin, cause), the defection severity and the production stage. RSC will generate a suggestion, based on rules set by users, and this suggestion will be saved into the local RSC repository, and it will be send as JSON message to the i-Like MySQL repository. Additionally, a notification will be send to the appropriate user(s). The component will use the push logic (pub/sub), by using HOLONIX’s RabbitMQ
Objective: The objective is to produce reliable results based on reliable rules, in a timely manner.
Assumptions/ Constraints: The data feed from HOLONIX’s repo to be uninterrupted (as long as new data exists), and the suggestions to generated in less than 5 seconds
Input-output data
Input Output { "ID": "48154687-643e-41b1-ab3b-96fee1d3b706", "Timestamp": "2017-11-10T00:00:00", "Tier": { "ID": "655fe42a-0789-4266-bd23-4a99019cd8d7", "Name": "Tier 1", "ParentTierID": "00000000-0000-0000-0000-000000000000", "ParentTierName": "" }, "ProductionStage": 3, "ProductData": { "Type": "5515a066-4304-4baa-b62d-81d622efceb0" }, "DefectData": { "Type": "f9396992-3cc0-4041-bdc5-8620d126ac59", "Origin": "DefectOrigin1", "Cause": "DefectCause1", "Value": "0.5" } }
{ "id": "0c19e41a-5d38-4bb4-944e-86ae21a186ff", "partType": "PCB deposit type A", "action": "Repair/rework", "ruleName": "Insufficient glue rule - PCB deposit type A", "isRecoverable": true, "defectValue": "0.017761000000000002", "thresholdValue": "0.04669805", "defectInputAsString": "{\"ID\":\"48154687-643e-41b1-ab3b-96fee1d3b706\",\"Timestamp\":\"2018-03-27T14:17:10\",\"Tier\":{\"ID\":\"c880ec03-0ad8-46e3-9198-35a4b238b6c7\",\"Name\":\"Glue Placement\",\"ParentTierID\":\"00000000-0000-0000-0000-000000000000\",\"ParentTierName\":\"\"},\"ProductionStage\":1,\"ProductData\":{\"Type\":\"b46943e2-de65-4d9a-b2aa-0a1c2f921961\"},\"DefectData\":{\"Type\":\"5126b5d2-146c-4810-8e13-51c6f5e1c519\",\"Origin\":\"Origin\",\"Cause\":\"Insufficient glue\",\"Value\":\"0.017761000000000002\"}}", "creationDateTime": "2018-03-27T14:17:17.72233", "productionStageToGo": 1, "delta": "1.77609999953302E+16", "thresholdName": "Glue volume" }
Repo tables fields/ontology
Input Output z_process.id z_defect.id z_defect.z_material_id z_defect. z_defect_type_id z_defect. z_defect_origin z_defect.z_defect_cause z_defect_values_holder.value z_defect.z_defect_generated_time
TBA
Inbound-outbound endpoints or topics
Inbound Outbound TBA TBA
Author: Konstantinos Grevenitis Last Modified: Not available at the moment
Executed by: Konstantinos Grevenitis Execution Date: Not available at the moment
Steps:
Step # Description Expected Result
1
JSON message will be received by the RSC component through the RabbitMQ
Receive successfully the message
2 Extract the appropriate values from the message
Extracting the values without any casting exceptions will occur
3 Select rules based on the extracted values
The selection must be executed fast in case we have to many rules
4 Generate suggestion, save it to the local repo
Generate suggestion without any exceptions occurred and save it, without any exceptions again, to the local postgresql database
5 Send suggestion back to HOLONIX’s repo
Sending successfully the generated suggestion to HOLONIX’s repo
6 Send notification with the suggestion
The notification must be successfully sent
Table 13. ATLANTIS_1 integration scenario

FOF-03-2016 Z-Fact0r - 723906
Page 50 of 60
Integration scenario ATLANTIS
Version #:
<Version number of the component being tested>
Build #: <Tracking number of the component tested by this scenario>
Retry #: 1
Test Scenario ID: ATL_2
Test Scenario Description: DSS will accept defect and prediction data and will produce short term suggestions
Objective: The objective is to successfully parse the input data and execute the appropriate rule(s) and generate the appropriate suggestions and notifications. Finally the suggestions will return back to the HOLONIX iLike Machines platform
Assumptions/ Constraints: Internet connection available, data in jSON format
Input-output data
Input Output <input data message> <output data message>
Repo tables fields/ontology
Input Output Table and fields or ontology Table and fields or ontology
Inbound-outbound endpoints or topics
Inbound Outbound Inbound endpoint or topic Outbound endpoint or topic
Author: Konstantinos Grevenitis Last Modified: Not available at the moment
Executed by: Konstantinos Grevenitis Execution Date: Not available at the moment
Steps:
Step # Description Expected Result
1 Get input data to build the Event
An Event object filled with the appropriate data
2 Execute the FSM and find the appropriate rule
Execute the appropriate rule
3 Generate short term suggestions
Send the suggestions to the appropriate destinations without any issues
4 Save the suggestions Save the suggestions without any issues
Table 14.ATLANTIS_2 integration scenario

FOF-03-2016 Z-Fact0r - 723906
Page 51 of 60
Integration scenario EPFL
Version #:
<Version number of the component being tested>
Build #: <Tracking number of the component tested by this scenario>
Retry #: 1
Test Scenario ID: EPFL_1
Test Scenario Description:
KMDSS will have inputs from the shop floor and also from the defect prediction component, and according to the input the KMDSS must create and evaluate alternative feasible actions and suggest the most suitable actions for each case. Further to that, having as input sensor data it will perform a root cause analysis for identifying the exact causes of each defect. Finally, the KMDSS will be responsible for prioritizing actions.
Objective: The goal to execute a root cause analysis, generate and prioritize actions in a timely manner, due to the fact that KMDSS has multiple inputs (real time and historical data)
Assumptions/ Constraints: Internet connection available
Input-output data
Input Output { "DefectData": { "DefectCauseID": 342342342, "DefectDescription": "Glue Normal", "DefectOriginID": 2131234, "DefectTypeID": 34234324, "Severity": 1 }, "ID": 28, "ProductData": { "PartID": "34235234324", "PartType": "PCB circuit" }, "ProductionStage": 3, "Timestamp": "2018-06-22T13:16:03.671" }
<output data message>
Repo tables fields/ontology
Input Output z_process.id z_defect.id z_defect.z_material_id z_defect. z_defect_type_id z_defect. z_defect_origin z_defect.z_defect_cause z_defect_values_holder.value z_defect.z_defect_generated_time
Table and fields or ontology
Inbound-outbound endpoints or topics
Inbound Outbound Inbound endpoint or topic Outbound endpoint or topic
Author: Not available at the moment Last Modified:
Not available at the moment
Executed by: Not available at the moment Execution Date:
Not available at the moment
Steps:
Step # Description Expected Result
1 Generate a number of actions for each defect probability
Actions for each defect probability
2 Execute RCA and find the cause of each defect occurrence
The cause for each defect occurrence
3 Collect and prioritize all the possible actions
A list with the prioritization of the actions to be taken
Table 15. EFPL_1 integration scenario

FOF-03-2016 Z-Fact0r - 723906
Page 52 of 60
8.2.4 Team 4 scenarios
Integration scenario SIR
Version #: - Build #: - Retry #: 1
Test Scenario ID: SIR_1
Test Scenario Description: Deburring cell, that works offline, generates a .txt file. SIR will send the .txt file to the i-Like platform by using POSTMAN.
Objective: Send .txt file successfully in a timely manner, as soon it is generated.
Assumptions/ Constraints: POSTMAN installed and internet connection available
Input-output data
Input Output <input data message> DATE
TIME PART_ID CAD_ID PROGRAM_ID PART_STATUS_IN PART_STATUS_OUT TOTAL_PROCESS_TIME CYCLE_PARAMETERS QC_00 TIME ACTIVE_PROFILE PROFILE_001 PROFILE_003 PROFILE_XXX INACTIVE_PROFILE PROFILE_002 PROFILE_004 PROFILE_YYY CYCLE_01 TIME PROFILE_001 TIME TOOL_NUMBER TOOL_ANGULAR_POSITION TOOL_SPEED TOOL_COMPENSATION TOOL_CORRECTION FEED_RATE PROFILE_003 TIME TOOL_NUMBER TOOL_ANGULAR_POSITION TOOL_SPEED TOOL_COMPENSATION TOOL_CORRECTION FEED_RATE PROFILE_XXX TIME TOOL_NUMBER TOOL_ANGULAR_POSITION TOOL_SPEED TOOL_COMPENSATION TOOL_CORRECTION FEED_RATE QC_01 TIME ACTIVE_PROFILE PROFILE_XXX INACTIVE_PROFILE PROFILE_001 PROFILE_002 PROFILE_003 PROFILE_004 PROFILE_YYY CYCLE_02 TIME PROFILE_XXX

FOF-03-2016 Z-Fact0r - 723906
Page 53 of 60
TIME TOOL_NUMBER TOOL_ANGULAR_POSITION TOOL_SPEED TOOL_COMPENSATION TOOL_CORRECTION FEED_RATE QC_02 TIME ACTIVE_PROFILE INACTIVE_PROFILE PROFILE_001 PROFILE_002 PROFILE_003 PROFILE_004 PROFILE_XXX PROFILE_YYY
Repo tables fields/ontology
Input Output Table and fields or ontology Table and fields or ontology
Inbound-outbound endpoints or topics
Inbound Outbound Inbound endpoint or topic Outbound endpoint or topic
Author: Not available at the moment Last Modified:
Not available at the moment
Executed by: Not available at the moment Execution Date:
Not available at the moment
Steps:
Step # Description Expected Result
1 Send .txt file to i-Like platform Send .txt successfully
Table 16. SIR_1 integration scenario

FOF-03-2016 Z-Fact0r - 723906
Page 54 of 60
System and Integration Test Scenario CETRI
Version #: n/a Build #: 1 Retry #: 1
Test Scenario ID:
CET-1
Test Scenario Description:
The system will allow HOLONIX to send a csv file of parts to be repaired to CETRI and CETRI will respond with a csv description file of the repairs.
Objective:
A resulting file of new products to be repaired is sent to CETRI. The appropriate sql query is executed against the Holonix
database and the expected results are sent back to CETRI. The appropriate sql query with the updated parameters of the
repaired components is executed against the SQL database and the appropriate records are updated.
Assumptions/ Constraints:
DB to be installed and online and URL to be functional.
Input-output data
Input Output
csv file from Holonix csv file to Holonix
Repo tables fields/ontology
Input Output
Not available at the moment Not available at the moment
Inbound-outbound endpoints or topics
Inbound Outbound
n/a n/a
Author: Not available at the moment Last Modified:
Not available at the moment
Executed by: Not available at the moment Execution Date:
Not available at the moment
Test Steps:
Step # Description Expected Result
1 Holonix sends a CSV file with components to be repaired
.csv file received by CETRI in the correct format.
2 CETRI repairs the components in the csv file Create a response csv to be sent to Holonix as a response.
3 CETRI sends response csv to Holonix .csv file received by Holonix in the correct format.
Table 17. CETRI_1 integration scenario

FOF-03-2016 Z-Fact0r - 723906
Page 55 of 60
8.3 Integration performance monitoring
Monitoring the integration performance will assist the consortium to determine whether a given sub system has the
capacity to perform in terms of scalability and responsiveness under a specified workload. Responsiveness refers to
the ability of a given application to meet pre-determined objectives for throughput, while scalability is the number
of activities processed within a given time. Performing this type of testing is a key factor when ascertaining the
quality of a given application.
8.3.1 Load testing
Load testing measures the system’s performance as the workload increases, the behaviour of the application is tested
under specified workloads. That workload could mean concurrent users or transactions. The system is monitored
to measure response time and system staying power as workload increases. That workload falls within the parameters
of normal working conditions.
Load testing can be conducted in two ways. Longevity testing, also called endurance testing, evaluates a system's
ability to handle a constant, moderate work load for a long time. Volume testing, on the other hand, subjects a
system to a heavy work load for a limited time.
8.3.2 Stress testing
Unlike load testing, stress testing (or fatigue testing) is meant to measure the system’s performance outside the
normal working conditions. The software is given more users or transactions that can be handled for example. The
goal of stress testing is to measure the software stability. At what point does software fail, and how does the software
recover from failure?
When conducting a stress test, an adverse environment is deliberately created and maintained. The adverse condition
is progressively and methodically worsened, until the performance level falls below a certain minimum or the system
fails altogether. In order to obtain the most meaningful results, individual stressors are varied one by one, leaving
the others constant. This makes it possible to pinpoint specific weaknesses and vulnerabilities. For example, a
computer may have adequate memory but inadequate security. Such a system, while able to run numerous
applications simultaneously without trouble, may crash easily when attacked by a hacker intent on shutting it down.
8.3.3 Spike testing
Spike testing is a type of stress testing that evaluates software performance when workloads are substantially
increased quickly and repeatedly. The workload is beyond normal expectations for short amounts of time.
8.3.4 Endurance testing
Endurance testing (or soak testing) is an evaluation of how software performs with a normal workload over an
extended amount of time. The goal of endurance testing is to check for system problems such as memory leaks. A
memory leak occurs when a system fails to release discarded memory. The memory leak can impair system
performance or cause it to fail.
8.3.5 Scalability testing
Scalability testing is used to determine if software is effectively handling increasing workloads. This can be
determined by gradually adding to the user load or data volume while monitoring system performance.
8.3.6 Volume testing
Volume testing determines how efficiently software performs with a large, projected amount of data. It is also
known as flood testing because the test floods the system with data.
8.3.7 Possible performance issues
Speed issues. Slow responses and long load times
Bottlenecking. It occurs when data flow is interrupted or halted because there is not enough capacity to
handle the workload.

FOF-03-2016 Z-Fact0r - 723906
Page 56 of 60
Poor scalability. If the system cannot handle the expected number of concurrent tasks, results could be
delayed, errors could increase, or other unexpected behaviour could happen
Software configuration issues. Often settings are not set at a sufficient level to handle the workload.
Insufficient hardware resources. Performance testing may reveal physical constraints
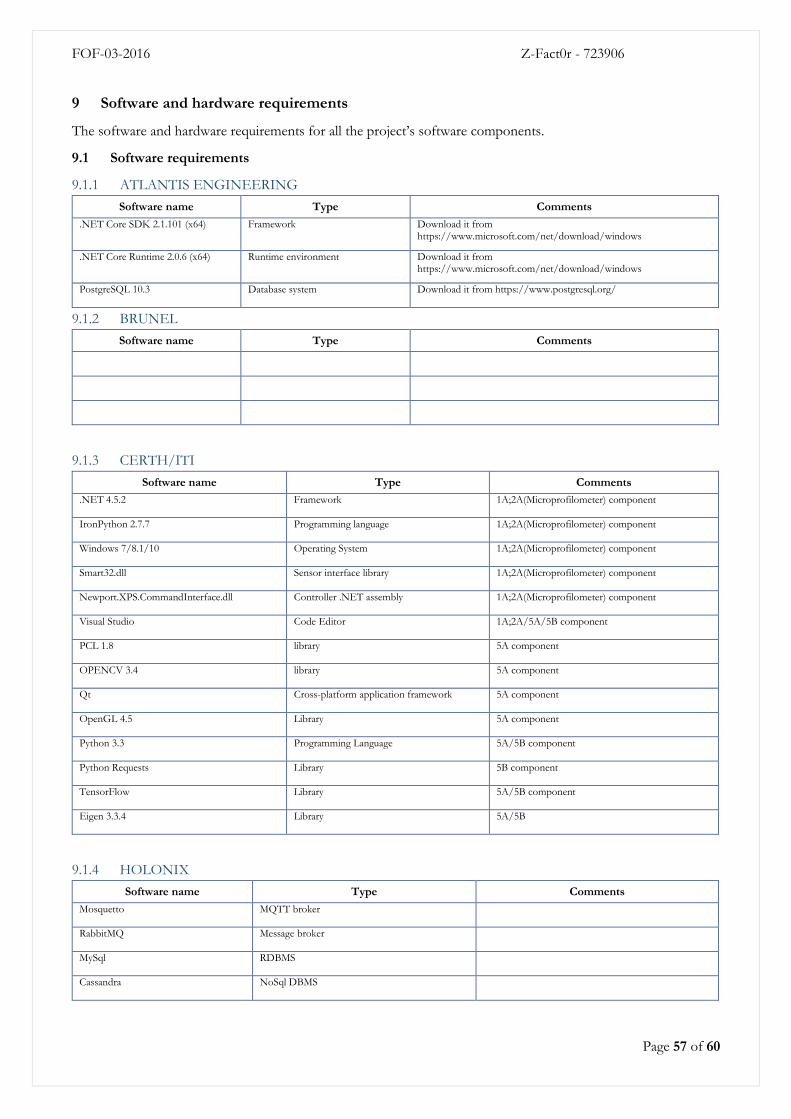
FOF-03-2016 Z-Fact0r - 723906
Page 57 of 60
9 Software and hardware requirements
The software and hardware requirements for all the project’s software components.
9.1 Software requirements
9.1.1 ATLANTIS ENGINEERING
Software name Type Comments
.NET Core SDK 2.1.101 (x64) Framework Download it from https://www.microsoft.com/net/download/windows
.NET Core Runtime 2.0.6 (x64) Runtime environment Download it from https://www.microsoft.com/net/download/windows
PostgreSQL 10.3 Database system Download it from https://www.postgresql.org/
9.1.2 BRUNEL
Software name Type Comments
9.1.3 CERTH/ITI
Software name Type Comments
.NET 4.5.2 Framework 1A;2A(Microprofilometer) component
IronPython 2.7.7 Programming language 1A;2A(Microprofilometer) component
Windows 7/8.1/10 Operating System 1A;2A(Microprofilometer) component
Smart32.dll Sensor interface library 1A;2A(Microprofilometer) component
Newport.XPS.CommandInterface.dll Controller .NET assembly 1A;2A(Microprofilometer) component
Visual Studio Code Editor 1A;2A/5A/5B component
PCL 1.8 library 5A component
OPENCV 3.4 library 5A component
Qt Cross-platform application framework 5A component
OpenGL 4.5 Library 5A component
Python 3.3 Programming Language 5A/5B component
Python Requests Library 5B component
TensorFlow Library 5A/5B component
Eigen 3.3.4 Library 5A/5B
9.1.4 HOLONIX
Software name Type Comments
Mosquetto MQTT broker
RabbitMQ Message broker
MySql RDBMS
Cassandra NoSql DBMS

FOF-03-2016 Z-Fact0r - 723906
Page 58 of 60
Software name Type Comments
Java Programming language
JavaScript Programming language
Spring MVC Java Framework
Node.js Javascript platform
9.1.5 EPFL
Software name Type Comments

FOF-03-2016 Z-Fact0r - 723906
Page 59 of 60
9.2 Hardware requirements
9.2.1 ATLANTIS ENGINEERING
Hardware type Value Comments
HDD SSD Samsung SSDs are suggested
CPU I3 at least
OS Windows 10 Not tested on other OS at the moment.
RAM 8 GB at least
9.2.2 BRUNEL
Hardware type Type Comments
9.2.3 CERTH/ITI
Hardware type Value Comments
Connection cable Ethernet 10/100/100
CPU (at least) i3 (indicative)
Memory (at least) 4GB (indicative)
GPU Nvidia GTX 1060 (indicative)
9.2.4 HOLONIX
Hardware type Value Comments
CPU CPU 6 core 12 threads
Memory 64 GB RAM
HDD 2 TB HDD
9.2.5 EPFL
Hardware type Type Comments

FOF-03-2016 Z-Fact0r - 723906
Page 60 of 60
References
[1]. B. Manouvrier and L. Ménard, Application Integration: EAI, B2B, BPM and SOA. Wiley-IEEE Press, 2008, p.
256.
[2]. C. MacKenzie, K. Laskey, F. McCabe, P. Brown, and R. Metz, “Reference model for service oriented
architecture 1.0,” Architecture, no. October. OASIS open, 2006
[3]. Toward a Commodity Enterprise Middleware. John O'Hara, JPMorgan. Published in: Queue magazine - API
Design Volume 5 Issue 4, May-June 2007 Pages 48-55
[4]. Mesnil, J. (2012). STOMP. [online] Stomp.github.io. Available at: https://stomp.github.io/
[5]. Mqtt.org. (2018). FAQ - Frequently Asked Questions | MQTT. [online] Available at: http://mqtt.org/faq
[6]. Tools.ietf.org. (2018). RFC 2616 - Hypertext Transfer Protocol -- HTTP/1.1. [online] Available at:
https://tools.ietf.org/html/rfc2616
[7]. NUS Computing - Comp.nus.edu.sg. -
http://www.comp.nus.edu.sg/~cs2103/AY1617S2/files/handouts/%5BL7P3%5D%20How%20to%20Avoid%
20a%20Big%20Bang%20-%20Integrating%20Software%20Components.pdf
[8]. Thayer, R. (2003). Glossary software engineering. IEEE Software, 20(4), pp.97-93.
[9]. Jena.apache.org. (2018). Apache Jena -. [online] Available at: https://jena.apache.org/
[10]. En.wikipedia.org. (2018). File Transfer Protocol. [online] Available at:
https://en.wikipedia.org/wiki/File_Transfer_Protocol
[11]. Vision Online. (2018). Vision Online. [online] Available at: https://www.visiononline.org/vision-standards-
details.cfm?type=5
[12]. Cruz-Cunha, M. (2013). Handbook of research on ICTs for human-centered healthcare and social care
services. Hershey: Igi Publishing.
[13]. En.wikipedia.org. (2018). Resource Description Framework. [online] Available at:
https://en.wikipedia.org/wiki/Resource_Description_Framework
Related Documents