PACE Applications to Case II Waters: Backscatter Response to Particle Composition and Morphology Steven Ackleson & Wesley Moses Naval Research Laboratory, DC. Korea (N = 56) Chesapeake Bay (N = 7) (N = 277) Block Island Sound San Francisco Bay (N = 68) N = 408

Welcome message from author
This document is posted to help you gain knowledge. Please leave a comment to let me know what you think about it! Share it to your friends and learn new things together.
Transcript

PACE Applications to Case II Waters:Backscatter Response to Particle Composition and Morphology
Steven Ackleson & Wesley MosesNaval Research Laboratory, DC.
Korea(N = 56)
ChesapeakeBay
(N = 7)
(N = 277)Block Island
Sound
San FranciscoBay
(N = 68)
N = 408
Definitions
Particle Morphology (LISST 100X)Sauter Diameter:
Apparent Density:
Particle Backscatter Properties (ac and bb sensors)Backscatter Ratio:
Mass-Specific Backscatter:
Spectral Slope:
Particle Composition (water samples)Suspended Particulate Mass:
Particulate Organic Carbon:
SPM g m-3
POC g m-3
Ds = 6 * Vp Ap-1 µ
ra = SPM Vp-1 kg m-3
h = ln[bbp(l)/bbp(lo)]/(lo/l)
b*bp = bbp SPM-1 m2 g-1
b~bp = bbp bp
-1
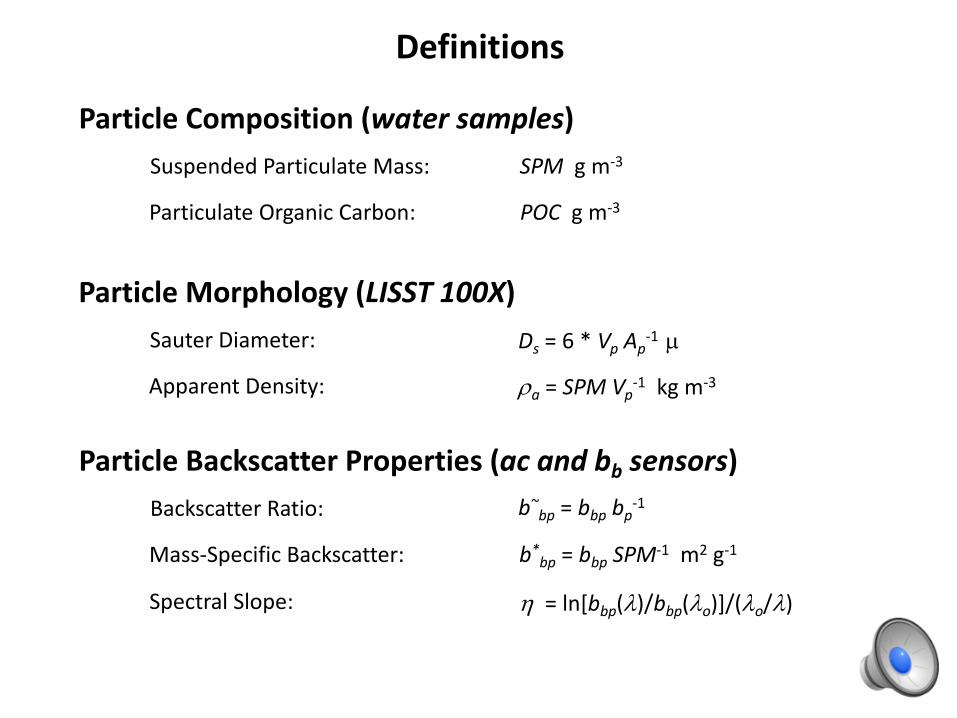
Particle Size and Apparent DensitySFB/D Chs. Bay BIS_0613 BIS_0813 BIS_1113 BIS_0114 Korea
ra kg m-3
D sµ
Particle size and apparent density (and excess density) are inversely correlated.
Fettweis, 2008
North Sea
Europe and French Guyana
Neukermans et al., 2012
Case ICase II

Particle Apparent Density and Carbon Content
Reynolds et al., 2016
Arctic Ocean
Particle apparent density decreases with increasing POC content.
ra kg m-3
POC:
SPM
BIS_0613 BIS_0813 BIS_1113 Korea

SPM Versus Composition
Particulate organic carbon concentration is positively correlated with the concentration of suspended particulate mass.
BIS_0613 BIS_0813 BIS_1113 Korea
Ni et al., 2008
Pearl River Delta
Reynolds et al., 2016
Arctic Ocean
0.01 0.1 1 10 100
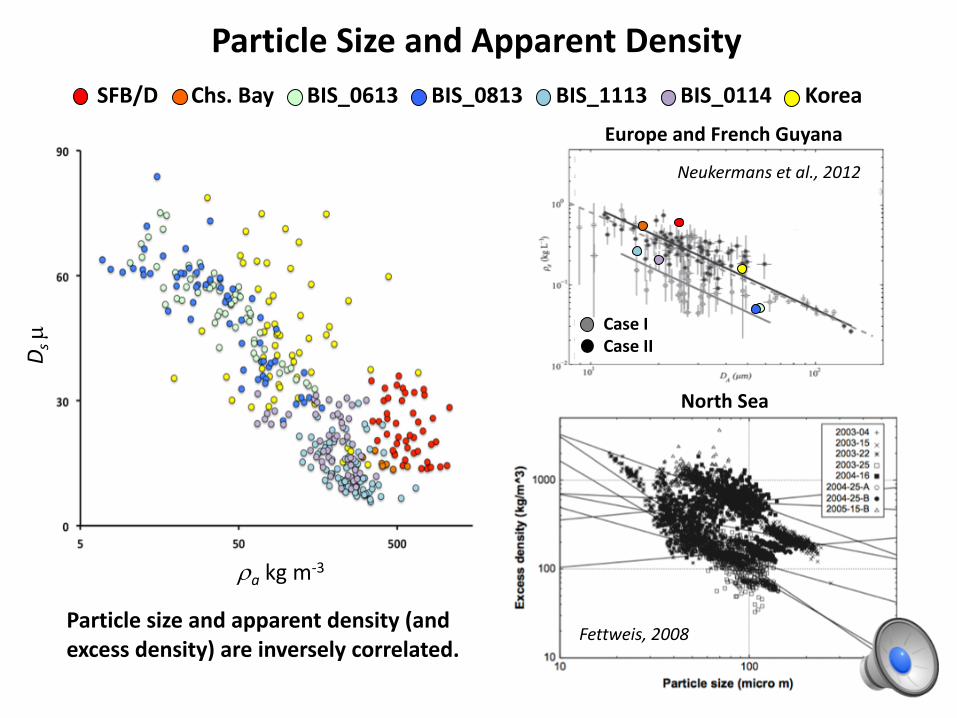
Fractional Backscatter, b~bp
POC:SPM
b~bp
(532
nm
)
10-3
10-2
10-1
10-2 10-1 10-010-4
Backscatter ratio is negatively correlated with the fraction of organic carbon.
BIS_0613 BIS_0813 BIS_1113 Korea
10-4
10-3
10-2
10-1 Europe and French Guyana
Neukermans et al., 2012
Case ICase II

Fractional Backscatter, b~bp
SFB/D Chs. Bay BIS_0613 BIS_0813 BIS_1113 BIS_0114 Korea
b~bp
(532
nm
)
10-3
10-2
10-1
10-0 101 102 103
Backscatter ratio is positively correlated with particle apparent density.
Neukermans et al., 2012
Europe and French Guyana
Case ICase II

POC:SPM
b*
bp
(55
5 n
m)
m2
g-1
Wozniak et al. (Accepted, 2018)
Baltic and North Sea
POC:SPM
b*bp
(53
2 n
m)
b*
bp
(53
2 n
m)
m2
g-1
Mass-Specific Backscatter
BIS_0613 BIS_0813 BIS_1113 Korea
The spectral slope of backscatter appears to increase with the
fraction of organic matter, contrary to previous reports.
Baltic Low OrganicBaltic High OrganicNorth Sea Stations

Mass-Specific BackscatterSFB/D Chs. Bay BIS_0613 BIS_0813 BIS_1113 BIS_0114 Korea
Mass-specific backscatter and apparent particle density appear poorly correlated.
Reynolds et al., 2016
Arctic Ocean
0 1000 2000
ra kg m-3
OrganicMixedMineral

BIS_0613 BIS_0813 BIS_1113 Korea
Spectral Slope of Backscatter, h
0 0.2 0.4 0.6 0.8
Reynolds et al., 2016
Arctic Ocean
POC:SPM
The spectral slope of backscatter appears to be highly variable at low fractions of particulate carbon, but converge to a stable, intermediate
value as the fraction of POC increases.
-h
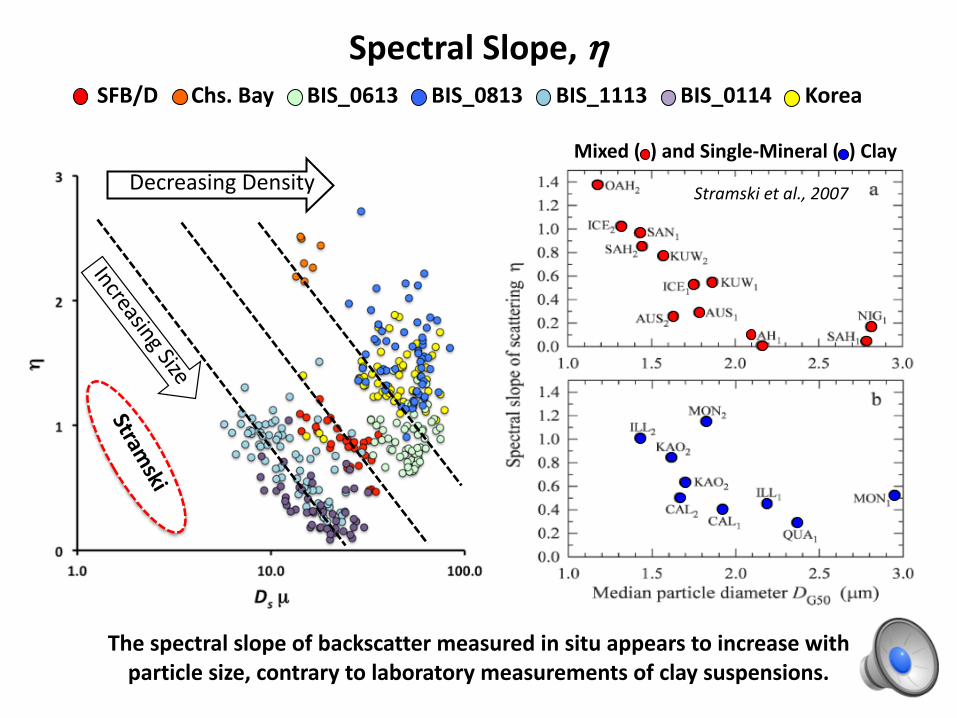
Spectral Slope, hSFB/D Chs. Bay BIS_0613 BIS_0813 BIS_1113 BIS_0114 Korea
Stramski
Decreasing Density
Increasing Size
The spectral slope of backscatter measured in situ appears to increase with particle size, contrary to laboratory measurements of clay suspensions.
Stramski et al., 2007
Mixed ( ) and Single-Mineral ( ) Clay
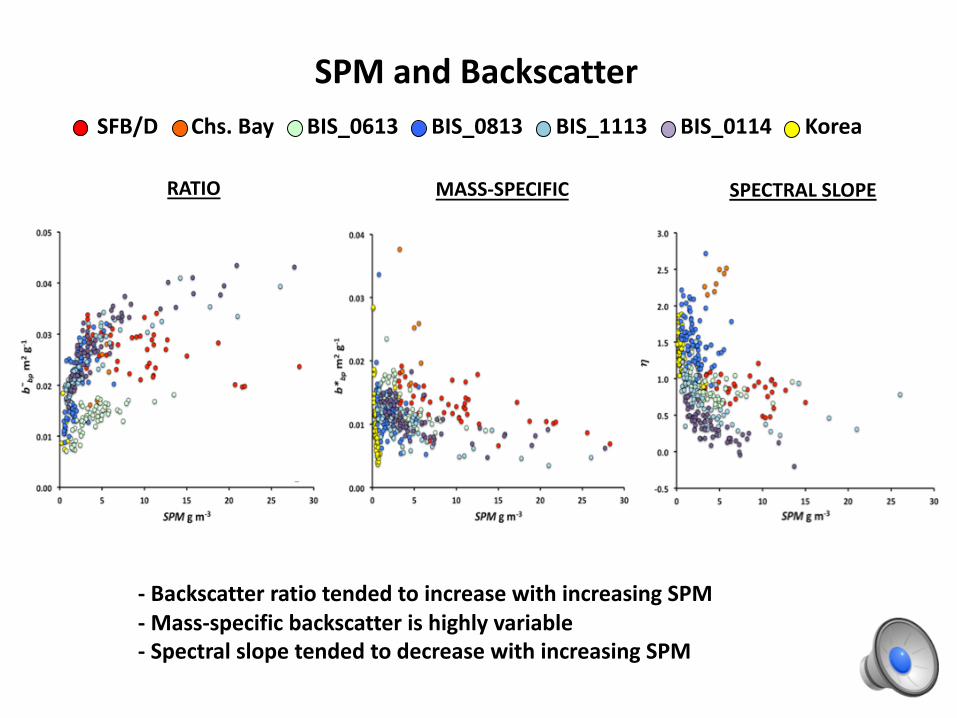
SPM and BackscatterSFB/D Chs. Bay BIS_0613 BIS_0813 BIS_1113 BIS_0114 Korea
RATIO MASS-SPECIFIC SPECTRAL SLOPE
- Backscatter ratio tended to increase with increasing SPM- Mass-specific backscatter is highly variable- Spectral slope tended to decrease with increasing SPM

Summary
Results support current ideas about the relationships between marine particle composition, morphology, and backscatter.
In response to increasing SPM:- Backscatter ratio tends to increase (POC:SPM decreases)- Mass-specific backscatter is highly variable- Spectral slope tends to decrease (decreasing aggregate size?)
There remains a great deal of uncertainty in these and previously published results, but teasing apart sources from fiend measurements is difficult;
- Sampling methods- Sensor bias/error
Related Documents