Progressive Fetal Distress Estimation by Characterization of Fetal Heart Rate Decelerations Response Based on Signal Variability in Cardiotocographic Recordings Patricio Fuentealba, Alfredo Illanes, Frank Ortmeier Otto-von-Guericke University, Magdeburg, Germany Abstract In the current clinical practice, Cardiotocograph (CTG) is a standard and widely used tool for fetal surveillance. However, CTG interpretation is difficult since it involves human diagnosis of different patterns in highly complex signals. Fetal heart rate (FHR) decelerations and vari- ability are known to be the most significant and difficult patterns to assess by the clinical staff. The main goal of this work is to analyze the fetal distress by tracking the evolution of the dynamical changes occurring in the CTG recording. The idea is to consider the direct input/output relationship between uterine contraction (UC) and FHR signals by the characterization of FHR decelerations in terms of their signal variability as a sign of the fetal re- sponse corresponding to a UC event. Results show that the progression of the decelerations response over time can help the observer to track fetal distress. 1. Introduction During labor, fetal monitoring is essential to help clin- icians for timely intervention in order to prevent potential adverse outcomes resulting from decreased oxygen supply [1]. Fetal monitoring is usually based on the joint record- ing of FHR and UC signals acquired by CTG, which is the most widely used tool for fetal welfare assessment during the perinatal period. In clinical practice, the CTG interpre- tation relies mainly on four FHR signal patterns: baseline, accelerations, decelerations and variability. However, the analysis of these patterns is difficult because it involves a human interpretation of highly complex signals leading to a wide intra- and inter-observer disagreement [1]. In order to increase the objectivity and improve the CTG interpretation, several medical guidelines [2] and expert systems (ES) [3] have been proposed. Nevertheless, guide- lines still lack consensus in many key aspects due mainly to their complexity and ES have not shown evidence that they improve fetal welfare assessment compared with the classic CTG analysis [3]. According to the literature [4], the observer disagreement is related mainly with the inter- pretation of FHR decelerations and variability. For that, many works have been proposed to extract hidden features in the FHR signal using signal processing techniques such as FFT, Short Time Fourier Transform, AR modeling and Continuous and Discrete Wavelets Transform [5]. Most of them do not take into account the input/output relation- ship between UC and FHR signals. In this context, some works have been proposed in order to consider CTG as an input/output system [6, 7], however, they do not consider the progression of decelerations along the FHR signal. In this work, we propose a new methodology of CTG analysis based on the evolution of the fetal response by the characterization of FHR decelerations over time. The main idea is to analyze the direct input/output relationship between UC and FHR signals in order to track the progres- sion of the fetal condition based on the variability during deceleration episodes as a response to a UC event. For this purpose, deceleration episodes are first identified ac- cording to their location, length and depth making use of a progressive baseline. Then, in each identified episode the variability is estimated as a sign of the fetal response corresponding to a UC event that trigger such episode. Results show that both the progressive baseline and de- celerations can describe different time-variant dynamics and their evolution over time can help the observer to track fetal distress behavior during labor. 2. Method The analysis is performed using CTG recordings ex- tracted from the CTU-UHB Intrapartum Cardiotocography Database freely available on the PhysioNet Website [8] and the principles of the approach is explained making use of the FHR and UC signals shown in Figure 1. 2.1. Fetal heart rate signal pre-processing The acquisition of CTG signals involves different types of artifacts such as loss of data and outliers. For that, fol- lowing [9], values less than 50 bpm and more than 200 Computing in Cardiology 2017; VOL 44 Page 1 ISSN: 2325-887X DOI:10.22489/CinC.2017.276-152

Welcome message from author
This document is posted to help you gain knowledge. Please leave a comment to let me know what you think about it! Share it to your friends and learn new things together.
Transcript

Progressive Fetal Distress Estimation by Characterization of Fetal Heart RateDecelerations Response Based on Signal Variability in Cardiotocographic
Recordings
Patricio Fuentealba, Alfredo Illanes, Frank Ortmeier
Otto-von-Guericke University, Magdeburg, Germany
Abstract
In the current clinical practice, Cardiotocograph (CTG)is a standard and widely used tool for fetal surveillance.However, CTG interpretation is difficult since it involveshuman diagnosis of different patterns in highly complexsignals. Fetal heart rate (FHR) decelerations and vari-ability are known to be the most significant and difficultpatterns to assess by the clinical staff. The main goal ofthis work is to analyze the fetal distress by tracking theevolution of the dynamical changes occurring in the CTGrecording. The idea is to consider the direct input/outputrelationship between uterine contraction (UC) and FHRsignals by the characterization of FHR decelerations interms of their signal variability as a sign of the fetal re-sponse corresponding to a UC event. Results show thatthe progression of the decelerations response over time canhelp the observer to track fetal distress.
1. Introduction
During labor, fetal monitoring is essential to help clin-icians for timely intervention in order to prevent potentialadverse outcomes resulting from decreased oxygen supply[1]. Fetal monitoring is usually based on the joint record-ing of FHR and UC signals acquired by CTG, which is themost widely used tool for fetal welfare assessment duringthe perinatal period. In clinical practice, the CTG interpre-tation relies mainly on four FHR signal patterns: baseline,accelerations, decelerations and variability. However, theanalysis of these patterns is difficult because it involves ahuman interpretation of highly complex signals leading toa wide intra- and inter-observer disagreement [1].
In order to increase the objectivity and improve the CTGinterpretation, several medical guidelines [2] and expertsystems (ES) [3] have been proposed. Nevertheless, guide-lines still lack consensus in many key aspects due mainlyto their complexity and ES have not shown evidence thatthey improve fetal welfare assessment compared with theclassic CTG analysis [3]. According to the literature [4],
the observer disagreement is related mainly with the inter-pretation of FHR decelerations and variability. For that,many works have been proposed to extract hidden featuresin the FHR signal using signal processing techniques suchas FFT, Short Time Fourier Transform, AR modeling andContinuous and Discrete Wavelets Transform [5]. Mostof them do not take into account the input/output relation-ship between UC and FHR signals. In this context, someworks have been proposed in order to consider CTG as aninput/output system [6, 7], however, they do not considerthe progression of decelerations along the FHR signal.
In this work, we propose a new methodology of CTGanalysis based on the evolution of the fetal response bythe characterization of FHR decelerations over time. Themain idea is to analyze the direct input/output relationshipbetween UC and FHR signals in order to track the progres-sion of the fetal condition based on the variability duringdeceleration episodes as a response to a UC event. Forthis purpose, deceleration episodes are first identified ac-cording to their location, length and depth making use ofa progressive baseline. Then, in each identified episodethe variability is estimated as a sign of the fetal responsecorresponding to a UC event that trigger such episode.
Results show that both the progressive baseline and de-celerations can describe different time-variant dynamicsand their evolution over time can help the observer to trackfetal distress behavior during labor.
2. Method
The analysis is performed using CTG recordings ex-tracted from the CTU-UHB Intrapartum CardiotocographyDatabase freely available on the PhysioNet Website [8] andthe principles of the approach is explained making use ofthe FHR and UC signals shown in Figure 1.
2.1. Fetal heart rate signal pre-processing
The acquisition of CTG signals involves different typesof artifacts such as loss of data and outliers. For that, fol-lowing [9], values less than 50 bpm and more than 200
Computing in Cardiology 2017; VOL 44 Page 1 ISSN: 2325-887X DOI:10.22489/CinC.2017.276-152
(a)
(b)
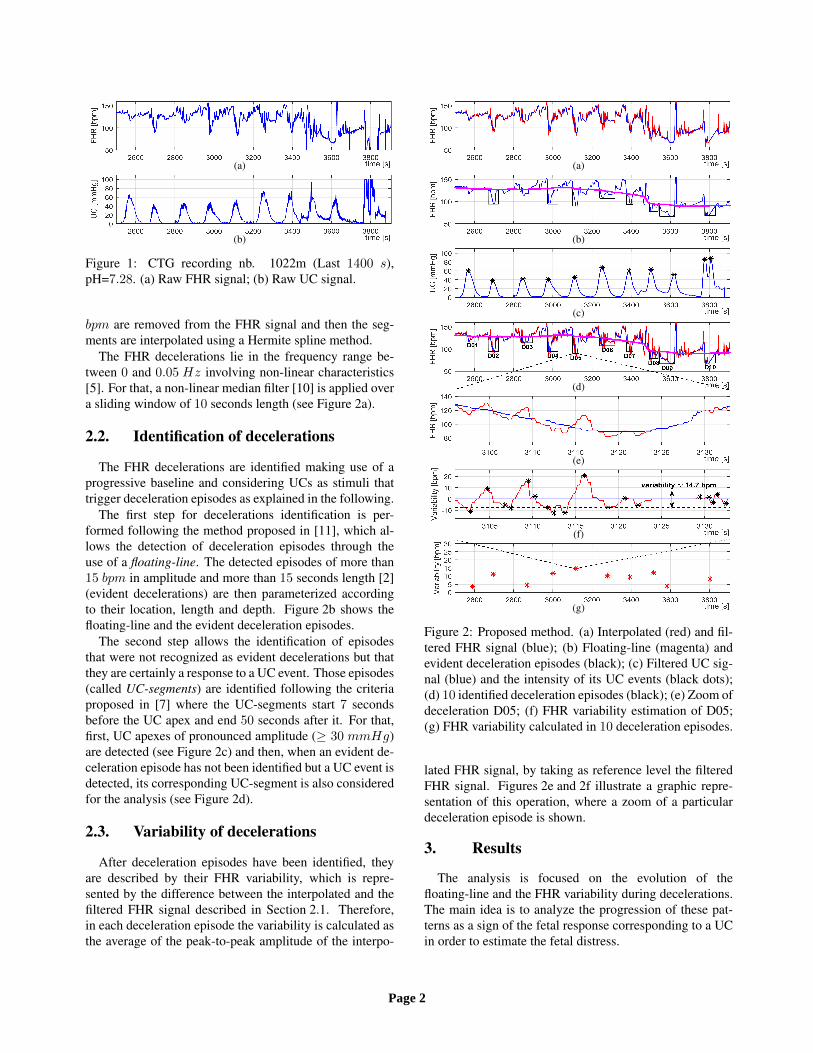
Figure 1: CTG recording nb. 1022m (Last 1400 s),pH=7.28. (a) Raw FHR signal; (b) Raw UC signal.
bpm are removed from the FHR signal and then the seg-ments are interpolated using a Hermite spline method.
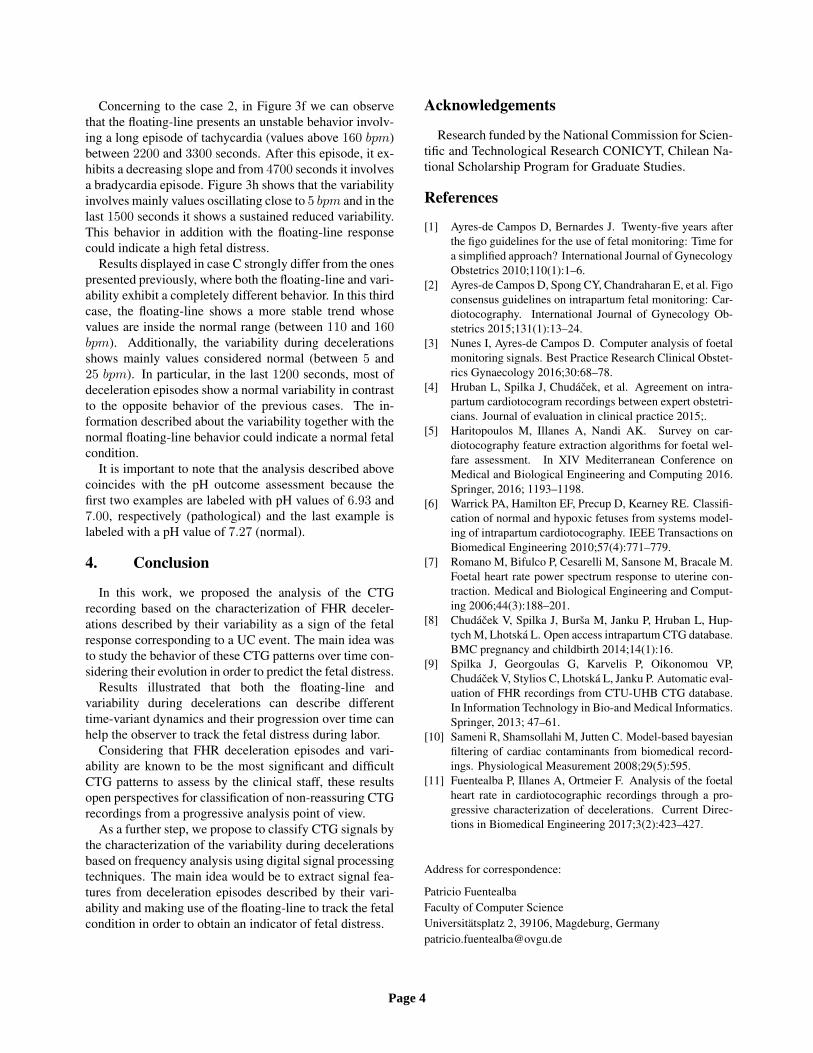
The FHR decelerations lie in the frequency range be-tween 0 and 0.05 Hz involving non-linear characteristics[5]. For that, a non-linear median filter [10] is applied overa sliding window of 10 seconds length (see Figure 2a).
2.2. Identification of decelerations
The FHR decelerations are identified making use of aprogressive baseline and considering UCs as stimuli thattrigger deceleration episodes as explained in the following.
The first step for decelerations identification is per-formed following the method proposed in [11], which al-lows the detection of deceleration episodes through theuse of a floating-line. The detected episodes of more than15 bpm in amplitude and more than 15 seconds length [2](evident decelerations) are then parameterized accordingto their location, length and depth. Figure 2b shows thefloating-line and the evident deceleration episodes.
The second step allows the identification of episodesthat were not recognized as evident decelerations but thatthey are certainly a response to a UC event. Those episodes(called UC-segments) are identified following the criteriaproposed in [7] where the UC-segments start 7 secondsbefore the UC apex and end 50 seconds after it. For that,first, UC apexes of pronounced amplitude (≥ 30 mmHg)are detected (see Figure 2c) and then, when an evident de-celeration episode has not been identified but a UC event isdetected, its corresponding UC-segment is also consideredfor the analysis (see Figure 2d).
2.3. Variability of decelerations
After deceleration episodes have been identified, theyare described by their FHR variability, which is repre-sented by the difference between the interpolated and thefiltered FHR signal described in Section 2.1. Therefore,in each deceleration episode the variability is calculated asthe average of the peak-to-peak amplitude of the interpo-
(a)
(b)
(c)
(d)
(e)
(f)
(g)
Figure 2: Proposed method. (a) Interpolated (red) and fil-tered FHR signal (blue); (b) Floating-line (magenta) andevident deceleration episodes (black); (c) Filtered UC sig-nal (blue) and the intensity of its UC events (black dots);(d) 10 identified deceleration episodes (black); (e) Zoom ofdeceleration D05; (f) FHR variability estimation of D05;(g) FHR variability calculated in 10 deceleration episodes.
lated FHR signal, by taking as reference level the filteredFHR signal. Figures 2e and 2f illustrate a graphic repre-sentation of this operation, where a zoom of a particulardeceleration episode is shown.
3. Results
The analysis is focused on the evolution of thefloating-line and the FHR variability during decelerations.The main idea is to analyze the progression of these pat-terns as a sign of the fetal response corresponding to a UCin order to estimate the fetal distress.
Page 2

Case A
(a) (b)
(c) (d)
Case B
(e) (f)
(g) (h)
Case C
(i) (j)
(k) (l)
Figure 3: Three representative cases of CTG. Case A: CTG recording nb. 1490m, pH=6.93, pathological. Case B: CTGrecording nb. 1017m, pH=7.00, pathological. Case C: CTG recording nb. 1332m, pH=7.27, normal. (a)(e)(i) Raw FHRsignal; (b)(f)(j) Filtered FHR signal (blue), floating-line (magenta) and reference levels of bradycardia and tachycardia(dotted lines); (c)(g)(k) Filtered UC signal (blue) and the intensity of its UC events (black dots); (d)(h)(l) FHR variabilityat each deceleration and reference levels of reduced and increased variability (dotted lines) [2].
Figure 3 shows three representative cases selected ac-cording to their pH value, which is considered as a stan-dard measurement for fetal acidemia. Values of pH lessor equal than 7.05 indicate a pathological fetus and valuesgreater or equal than 7.25 indicate a normal fetal condition[8]. Cases A and B correspond to pathological fetuses andcase C represents a normal fetal condition.
Results show that both the floating-line and variabilityduring decelerations exhibit different time-variant dynam-ics for the three cases. Case A shows an interesting exam-
ple, where a repetitive set of UCs triggers consecutive de-celeration episodes. Figure 3b shows that the floating-linepresents an unstable behavior along the signal involvinga bradycardia episode (below 110 bpm) around 4000 sec-onds. In Figure 3d, we can observe that decelerations showdifferent responses over time described by values of re-duced (values below than 5 bpm) and normal variability.Particularly, during the last 1000 seconds decelerations ex-hibit a sustained reduced variability, which together withthe bradycardia episode could indicate a high fetal distress.
Page 3
Concerning to the case 2, in Figure 3f we can observethat the floating-line presents an unstable behavior involv-ing a long episode of tachycardia (values above 160 bpm)between 2200 and 3300 seconds. After this episode, it ex-hibits a decreasing slope and from 4700 seconds it involvesa bradycardia episode. Figure 3h shows that the variabilityinvolves mainly values oscillating close to 5 bpm and in thelast 1500 seconds it shows a sustained reduced variability.This behavior in addition with the floating-line responsecould indicate a high fetal distress.
Results displayed in case C strongly differ from the onespresented previously, where both the floating-line and vari-ability exhibit a completely different behavior. In this thirdcase, the floating-line shows a more stable trend whosevalues are inside the normal range (between 110 and 160bpm). Additionally, the variability during decelerationsshows mainly values considered normal (between 5 and25 bpm). In particular, in the last 1200 seconds, most ofdeceleration episodes show a normal variability in contrastto the opposite behavior of the previous cases. The in-formation described about the variability together with thenormal floating-line behavior could indicate a normal fetalcondition.
It is important to note that the analysis described abovecoincides with the pH outcome assessment because thefirst two examples are labeled with pH values of 6.93 and7.00, respectively (pathological) and the last example islabeled with a pH value of 7.27 (normal).
4. Conclusion
In this work, we proposed the analysis of the CTGrecording based on the characterization of FHR deceler-ations described by their variability as a sign of the fetalresponse corresponding to a UC event. The main idea wasto study the behavior of these CTG patterns over time con-sidering their evolution in order to predict the fetal distress.
Results illustrated that both the floating-line andvariability during decelerations can describe differenttime-variant dynamics and their progression over time canhelp the observer to track the fetal distress during labor.
Considering that FHR deceleration episodes and vari-ability are known to be the most significant and difficultCTG patterns to assess by the clinical staff, these resultsopen perspectives for classification of non-reassuring CTGrecordings from a progressive analysis point of view.
As a further step, we propose to classify CTG signals bythe characterization of the variability during decelerationsbased on frequency analysis using digital signal processingtechniques. The main idea would be to extract signal fea-tures from deceleration episodes described by their vari-ability and making use of the floating-line to track the fetalcondition in order to obtain an indicator of fetal distress.
Acknowledgements
Research funded by the National Commission for Scien-tific and Technological Research CONICYT, Chilean Na-tional Scholarship Program for Graduate Studies.
References
[1] Ayres-de Campos D, Bernardes J. Twenty-five years afterthe figo guidelines for the use of fetal monitoring: Time fora simplified approach? International Journal of GynecologyObstetrics 2010;110(1):1–6.
[2] Ayres-de Campos D, Spong CY, Chandraharan E, et al. Figoconsensus guidelines on intrapartum fetal monitoring: Car-diotocography. International Journal of Gynecology Ob-stetrics 2015;131(1):13–24.
[3] Nunes I, Ayres-de Campos D. Computer analysis of foetalmonitoring signals. Best Practice Research Clinical Obstet-rics Gynaecology 2016;30:68–78.
[4] Hruban L, Spilka J, Chudacek, et al. Agreement on intra-partum cardiotocogram recordings between expert obstetri-cians. Journal of evaluation in clinical practice 2015;.
[5] Haritopoulos M, Illanes A, Nandi AK. Survey on car-diotocography feature extraction algorithms for foetal wel-fare assessment. In XIV Mediterranean Conference onMedical and Biological Engineering and Computing 2016.Springer, 2016; 1193–1198.
[6] Warrick PA, Hamilton EF, Precup D, Kearney RE. Classifi-cation of normal and hypoxic fetuses from systems model-ing of intrapartum cardiotocography. IEEE Transactions onBiomedical Engineering 2010;57(4):771–779.
[7] Romano M, Bifulco P, Cesarelli M, Sansone M, Bracale M.Foetal heart rate power spectrum response to uterine con-traction. Medical and Biological Engineering and Comput-ing 2006;44(3):188–201.
[8] Chudacek V, Spilka J, Bursa M, Janku P, Hruban L, Hup-tych M, Lhotska L. Open access intrapartum CTG database.BMC pregnancy and childbirth 2014;14(1):16.
[9] Spilka J, Georgoulas G, Karvelis P, Oikonomou VP,Chudacek V, Stylios C, Lhotska L, Janku P. Automatic eval-uation of FHR recordings from CTU-UHB CTG database.In Information Technology in Bio-and Medical Informatics.Springer, 2013; 47–61.
[10] Sameni R, Shamsollahi M, Jutten C. Model-based bayesianfiltering of cardiac contaminants from biomedical record-ings. Physiological Measurement 2008;29(5):595.
[11] Fuentealba P, Illanes A, Ortmeier F. Analysis of the foetalheart rate in cardiotocographic recordings through a pro-gressive characterization of decelerations. Current Direc-tions in Biomedical Engineering 2017;3(2):423–427.
Address for correspondence:
Patricio FuentealbaFaculty of Computer ScienceUniversitatsplatz 2, 39106, Magdeburg, [email protected]
Page 4
Related Documents