PROGRESSIVE COLLAPSE RESISTANCE OF REINFORCED AND POST-TENSIONED CONCRETE FLAT PLATE STRUCTURES A Dissertation Presented By LEILA KEYVANI To The Department of Civil and Environmental Engineering In partial fulfillment of the requirements For the degree of Doctor of Philosophy In the field of Structural Engineering Northeastern University Boston, Massachusetts January, 2015

Welcome message from author
This document is posted to help you gain knowledge. Please leave a comment to let me know what you think about it! Share it to your friends and learn new things together.
Transcript

PROGRESSIVE COLLAPSE RESISTANCE OF
REINFORCED AND POST-TENSIONED
CONCRETE FLAT PLATE STRUCTURES
A Dissertation Presented
By
LEILA KEYVANI
To
The Department of Civil and Environmental Engineering
In partial fulfillment of the requirements
For the degree of
Doctor of Philosophy
In the field of
Structural Engineering
Northeastern University
Boston, Massachusetts
January, 2015

ii
ABSTRACT
Flat plates are found to be susceptible to progressive collapse which has rarely been
investigated at the system-level. One of the methods to evaluate the response of structures
to progressive collapse is to impose initial damage to the actual buildings. Column removal
scenarios have been investigated in actual buildings using wired data acquisition systems.
In the first part of this dissertation a wireless data acquisition system capable of peer-to-
peer and multi-hop communication is developed that would replace and overcome the
constraints and drawbacks of wired systems.
Using field data, the progressive collapse resistance of an actual post-tensioned flat
plate parking garage is analytically evaluated after an interior column is dynamically
removed. The tendons and the interaction of the tendons and floor are modeled explicitly.
The slab had no bottom bars yet successfully redistributed the gravity load to the adjacent
columns without failure. Compressive membrane forces developed as a result of growth
tendency contributed to an increase of the gravity load carrying capacity of slab. Use of
total moments developed in post-tensioned slab sections were found to be misleading in
identifying the contribution of different portions of the post-tensioned slab to collapse
resistance.
The punching and post-punching failure of an isolated and simply supported slab-
column specimen is analytically evaluated. The model was verified against available
experimental result. The model was improved to account for the effect of compressive
membrane forces in the slab. Using the method developed, the system-level response after
a column loss of a reinforced concrete flat plate floor designed according to ACI 318-11
and ACI 352.1R with and without the effects of membrane forces is presented. The results

iii
show that the compressive membrane forces increase the punching strength of the slab and
help mitigate progression of punching failures to the adjacent columns.
Previous studies showed that the bottom integrity bars in flat plates play a
significant role in the load transfer after punching failure. ACI 318-11, however, has no
minimum requirement for the integrity steel size passing over the column. A simple FE
model is introduced to evaluate the post-punching response of flat plates. The simple model
was first verified against the results of an analysis carried out in this dissertation. Then, the
post-punching response of a flat plate designed based on ACI 318-11 is investigated using
the model mentioned. It was found that following the punching failure of an overloaded
column, there is a risk of bar fracture at a deflection of about one third of the slab depth for
the flat plate detailed according to ACI 318-11. Increasing the bar diameter and steel
rupture strain increases the maximum post-punching strength and deformation capacity of
the connection before bar fracture.

iv
ACKNOWLEDGEMENT
I would like to thank my advisor Prof. Mehrdad Sasani for his endless help, and
supports. Without his help this dissertation could not be completed. I would also like to
thank my committee members, Prof. Jerome Hajjar, Prof. Dionisio Bernal and Prof.
Guevara Noubir for their technical comments on this dissertation.
I would like to specially thank Prof. Noubir and Jin Tao from CS department for
all their guidance in completing wireless DAQ system project; Prof. Hajjar and Michele
McNeil from CE for their help during my PhD study in US.
I would like to thank Dr. Serkan Sagiroglu, Dr. Ali Kazemi, and Justin Murray for
their willingness to discuss technical aspects of my projects, and all my friends in 10 SN
and 427 RI for the help and all the pleasant memories we shared together.
Last but not the least, my deepest gratitude goes to my dear parents, siblings and
husband for their love, support, trust, courage, and all the good things they gave me. For
helping me achieve my goals in life during all these years of being hundreds of miles away
from home. This dissertation is dedicated to them.

v
TABLE OF CONTENT
ABSTRACT ........................................................................................................... ii
ACKNOWLEDGEMENT ................................................................................... iv
Chapter 1 Introduction to Progressive Collapse ............................................. 1
1.1 Introduction ............................................................................................... 1
1.2 Progressive collapse examples .................................................................. 1
1.3 Previous experiments on buildings ........................................................... 2
1.4 Flat plate/slab floors .................................................................................. 3
1.5 Post-tensioned flat plate/slab floors .......................................................... 3
1.6 Evaluation of progressive collapse potential ............................................. 4
Indirect design method ........................................................................ 5
Direct design method .......................................................................... 5
Progressive collapse analysis .............................................................. 5
1.7 Objectives .................................................................................................. 6
1.8 Figures ....................................................................................................... 7
Chapter 2 Developing wireless data acquisition system for progressive
collapse experiments ....................................................................................... 12
2.1 Introduction ............................................................................................. 12
2.2 Phase 1 (peer-to-peer communication) ................................................... 13
IEEE 802.15.4 ................................................................................... 13
Communication layers....................................................................... 14
Network topologies ........................................................................... 14

vi
Hardware ........................................................................................... 15
Code Development ............................................................................ 16
Tests .................................................................................................. 22
2.3 Phase 2: Wireless sensor network (Multi-hop communication) ............. 28
ZigBee ............................................................................................... 28
ZigBee pro ......................................................................................... 28
Protocol architecture ......................................................................... 28
ZigBee device types .......................................................................... 30
Network addressing ........................................................................... 31
Network initiation ............................................................................. 31
Routing .............................................................................................. 32
Code development ............................................................................. 32
Tests and results ................................................................................ 34
2.4 Tables ...................................................................................................... 39
2.5 Figures ..................................................................................................... 46
Chapter 3 Progressive collapse evaluation of a post-tensioned floor .......... 63
3.1 Introduction ............................................................................................. 63
3.2 Parking Garage Characteristics ............................................................... 63
3.3 Explicit Modeling of Unbonded PT Parking Garage .............................. 64
Material properties ............................................................................ 66
Initial upward force ........................................................................... 67
After column removal ....................................................................... 68

vii
Column removal without initial upward force .................................. 72
3.4 Explicit Bonded PT Modeling................................................................. 72
3.5 Parametric study of Explicit Unbonded PT slab ..................................... 73
Mesh size ........................................................................................... 73
Effect of modulus of rupture of concrete .......................................... 73
Torsional stiffness of grillage ............................................................ 74
Effect of live load .............................................................................. 74
Effect of compressive strength of concrete ....................................... 74
3.6 PT models in SAP2000 ........................................................................... 75
3.7 Tables ...................................................................................................... 77
3.8 Figures ..................................................................................................... 78
Chapter 4 Progressive collapse resistance of RC flat plate floors ............... 87
4.1 Introduction ............................................................................................. 87
4.2 Punching failure in flat plates .................................................................. 88
4.3 Experimental and analytical response of isolated and simply-supported
(ISS) slab ....................................................................................................... 90
Material Properties ............................................................................ 91
Modeling of Punching Failure ........................................................... 92
Axis-Symmetric Punching Strength .................................................. 93
Modeling of Post-Punching Response .............................................. 94
Analytical Results and Discussion .................................................... 97
4.4 Analytical evaluation of isolated and laterally restrained slabs .............. 98

viii
Analytical Results for laterally restrained Slab ............................... 100
4.5 Progressive collapse in flat plate floor systems .................................... 101
Analytical Models ........................................................................... 101
Asymmetric Punching Strength ...................................................... 103
Results and Discussions .................................................................. 104
4.6 Figures ................................................................................................... 108
Chapter 5 Post-punching response of a flat plate designed based on ACI
318-11 ..................................................................................................... 118
5.1 Introduction ........................................................................................... 118
5.2 Integrity requirements of other guidelines ............................................ 119
5.3 Previous studies on integrity of flat plates ............................................ 120
5.4 Explicit modeling method (Chapter 4) .................................................. 123
5.5 Simple method for modeling punching failure ..................................... 124
Estimation of punching strength: EC2 (2004)................................. 124
Estimation of post-punching strength: Mirzaei (2010) ................... 125
Dowel action ................................................................................... 130
5.6 Implementation and verification of Mirzaei’s numerical method ......... 131
Flat plate tests at EPFL (Mirzaei and Muttoni, 2008) ..................... 131
Flat plate tests (Melo and Regan, 1998) .......................................... 132
Flat plate tests at McGill University (Habibi et al. 2012) ............... 132
Validation of simple method of modeling by results of Chapter 4 . 133
Results and discussion ..................................................................... 137

ix
5.7 Punching failure of an overloaded column in a flat plate floor (system-
level response) ............................................................................................ 140
Characteristics of the flat plate floor ............................................... 140
Simple modeling method and analysis ............................................ 141
Results and discussions ................................................................... 142
5.8 Tables .................................................................................................... 146
5.9 Figures ................................................................................................... 150
Chapter 6 Conclusions ................................................................................... 172
6.1 Developing Wireless DAQ system ....................................................... 172
6.2 Progressive collapse resistance of a PT flat plate parking garage ......... 173
6.3 Progressive collapse resistance of RC flat plate floors ......................... 175
6.4 Evaluating post-punching response of a flat plate designed based on
ACI 318-11 ................................................................................................. 177
REFERENCES .................................................................................................. 180
Appendix 1: Wireless communication codes .................................................. 191
Peer to peer communication............................................................................ 191
Sender code: ................................................................................................ 191
Receiver codes ............................................................................................ 199
Serial reader ................................................................................................ 205
Multi-hop communication .............................................................................. 215
Configuration parameters ............................................................................ 215
Sensor code ................................................................................................. 219

x
Collector code ............................................................................................. 234
Appendix 2: Design work sheet ....................................................................... 253

xi
LIST OF FIGURES
Figure 1-1 Ronan point building collapse in 1968 (http://www.construction53.com/wp-
content)
Figure 1-2 Alfred P Murrah after explosion in 1995 (http://assets.nydailynews.com)
Figure 1-3 Parking garage collapse in Miami (https://www.osha.gov/doc/engineering/)
Figure 1-4 Front facade of Tropicana Casino Parking Garage after collapse
(http://failures.wikispaces.com/Tropacana+Casino+Parking+Garage)
Figure 1-5 Punching failure of Pipers Row Car Park
(http://www.corrosionengineering.co.uk/knowledge-library/corrosion-of-steel-in-
concrete/)
Figure 1-6 Alternative Load Path (ALP) in a damaged structure
Figure 2-1 CC2530 development kit (CC2530 user’s guide, 2010)
Figure 2-2 FT232RL Serial to USB board from Sparkfun (Sparkfun website)
Figure 2-3 IAR Embedded workbench for programming and debugging EMs (IAR User
Guide, 2009)
Figure 2-4 Location of measurement points at the WVH (Adopted from CS students)
Figure 2-5 Comparison of location test at VWH with different communication and
application characteristics
Figure 2-6 Measurement point at the basement of Snell Engineering Building
Figure 2-7 Typical directional antenna
Figure 2-8 Test with signal generator
Figure 2-9 Results after revising code
Figure 2-10 A schematic representation of test sample and location of strain gauges
Figure 2-11 Comparison of wired and wireless DAQ systems
Figure 2-12 Voltage of 7 pots overtime
Figure 2-13 Time synchronization test between sender and receiver

xii
Figure 2-14 ZigBee protocol stack
Figure 2-15 Sensor demo application shown in ZigBee Sensor Monitor 1.2.0; Left: dummy
router, right: active router
Figure 2-16 Two router scenario
Figure 2-17 Self-healing capability of ZigBee network after a router disabled
Figure 2-18 Single channel test on Zigbee using ED, Router and a gateway at a close
distance
Figure 2-19 Test layout at NU campus for Phase 2
Figure 3-1 Plan view of post-tensioned parking garage
Figure 3-2 Column D5 with shear cap (before removal)
Figure 3-3 A 2D view of PT slab showing tendons connectted to slab axis by link elements
Figure 3-4 a) Exploded column b) Analytical model
Figure 3-5 Analytical and experimental vertical displacement of unbonded PT at top of
removed column (zoomed-in view of initial upward motion is shown)
Figure 3-6 Relative displacement between columns B5 and D5 (slab elongation) along line
5 after column removal
Figure 3-7 Change in membrane force of slab after column removal at peak displacement
normal to section 1-1
Figure 3-8 Moment about global axis X, along line 5 per unit width of slab at a) peak and
b) permanent displacements for unbonded PT (dashed lines represent faces of columns E5
and C5 and shear cap of column D5 )
Figure 3-9 Comparison of vertical displacement history of analytical bonded and unbonded
PT model
Figure 3-10 Change in bonded tendon axial force per unit width of slab along line 5 after
column removal at peak displacement

xiii
Figure 3-11 Vertical displacement history at location of removed column for explicit
unbonded PT model with different parameters compared to experiment ( ′ = 32 MPa =4.6
ksi)
Figure 3-12 Vertical displacement history at the location of removed column for explicit
unbonded PT model compared to experiment ( ′ = 24 MPa = 3.5 ksi)
Figure 4-1Truncated punching cone, tensile and integrity reinforcing bars and failure zones
of slab, cone and connectors
Figure 4-2 A quarter of ISS slab a) FE mesh; b) four types of connectors: TRCC_Breakout,
TRCC_Spalling, IRCCs, SCCs and explicit reinforcing bars in one direction; and c) test
specimen of Mirzaei and Muttoni (2008)
Figure 4-3 Constitutive law for the vertical force component of SCCs
Figure 4-4 Comparison of experimental column force by Mirzaei and Muttoni (2008) and
analytical results of ISS slab
Figure 4-5 Contribution of integrity and tensile reinforcing bars to vertical shear force
transfer from column to slab versus slab center displacement
Figure 4-6 IRCCs’ shear force versus column displacement starting from closest ones to
column
Figure 4-7 Simplified relationship of Bresler and Pister’s (1958) criteria between axial and
shear components of SCCs
Figure 4-8 Analytical column axial forces of Isolated and Laterally restrained (ILR) slab
compared to analytical column axial force of ISS slab
Figure 4-9 Comparison between column axial force, concrete contribution with and
without effect of friction
Figure 4-10 Friction shear force of SCCs versus slab center displacement
Figure 4-11 Plan and explicit tensile and integrity reinforcing bars at location of interior
columns

xiv
Figure 4-12 a) Interior column axial forces vs time; and b) time history of vertical
displacement
Figure 4-13 a) History of contribution of integrity and tensile reinforcing bars to vertical
shear forces transferred from column to slab; and b) transverse profile of vertical
displacement of slab at peak displacement
Figure 4-14 Vertical displacement of slab a) under gravity; b) at t= 0.3; and c) final
deformed shape
Figure 4-15 Cone, slab and integrity bars after punching modeled explicitly
Figure 4-16 History of interior columns’ a) axial forces; and b) vertical displacement with
effect of compressive membrane forces
Figure 4-17 Membrane forces in transverse direction at maximum vertical displacement
Figure 4-18 Relative horizontal displacement of columns adjacent to removed column on
axis B (Negative means moving away from removed column)
Figure 5-1 Post-punching behavior of flat slab with and without bottom reinforcement
(adopted from Hawkins and Mitchell, 1979)
Figure 5-2 Horizontal projection of conical surface for single and double integrity bars
(adopted from Melo and Regan, 1998)
Figure 5-3 a) geometry of slab, cone and rebars after punching (shear transfer), b) elastic
deformed shape, c) plastic deformed shape(formation of plastic hinges) (adopted from
Mirzaei, 2010)
Figure 5-4 Circumferential concrete cover failure ring (adopted from Mirzaei, 2010)
Figure 5-5 Distance xi from column face (adopted from Mirzaei, 2010)
Figure 5-6 Numerical post-punching strength estimated based on Mirzaei (2010) compared
with experimental results of specimen PM-9 from Mirzaei and Muttoni (2008)
Figure 5-7 Comparison of numerical post-punching strength based on Mirzaei (2010) with
experimental results of specimen PM-10 from Mirzaei and Muttoni (2008)

xv
Figure 5-8 Comparison of numerical post-punching strength based on Mirzaei (2010) with
experimental results of specimen PM-11 from Mirzaei and Muttoni (2008)
Figure 5-9 Comparison of numerical post-punching strength based on Mirzaei (2010) with
experimental results of specimen PM-12 from Mirzaei and Muttoni (2008)
Figure 5-10 Comparison of numerical post-punching strength based on Mirzaei (2010) with
experimental results of specimen PM-21 from Mirzaei and Muttoni (2008)
Figure 5-11 Comparison of numerical post-punching strength based on Mirzaei (2010) with
experimental results of specimen PM-22 from Mirzaei and Muttoni (2008)
Figure 5-12 Comparison of numerical post-punching strength based on Mirzaei (2010) with
experimental results of specimen S1 tested by Habibi et al. (2012)
Figure 5-13 Comparison of numerical post-punching strength based on Mirzaei (2010) with
experimental results of specimen S2 tested by Habibi et al. (2012)
Figure 5-14 Comparison of numerical post-punching strength based on Mirzaei (2010) with
experimental results of specimen SS tested by Habibi et al. (2012)
Figure 5-15 Plan of flat plate floor studied in Chapter 4 modeled using simple method
Figure 5-16 Estimated integrity bar shear force versus vertical deformation of slab for
interior slab-column connection based on Mirzaei (2010)
Figure 5-17 Slab-column connection using connector for column B2
Figure 5-18 Force-deformation of axial component of connector (effect of tensile bars
ignored)
Figure 5-19 Comparison of the punched column force after column removal for simple and
explicit models
Figure 5-20 Variation of vertical force provided by integrity bar on the south side of
punched column for explicit and simple model versus relative displacement of slab with
respect to column

xvi
Figure 5-21 Variation of vertical force provided by integrity bar on south side of punched
column for explicit and simple model versus horizontal progress of damage from column
face after punching
Figure 5-22 Variation of vertical force provided by the integrity bar on north side of
punched column for explicit and simple model versus relative displacement of slab with
respect to column
Figure 5-23 Variation of vertical force provided by integrity bar on north side of punched
column for explicit and simple model versus horizontal progress of damage from column
face after punching
Figure 5-24 Variation of vertical force provided by integrity bar on east and west side of
the punched column for explicit and simple model versus relative displacement of slab with
respect to column
Figure 5-25Variation of vertical force provided by integrity bar on east and west side of
the punched column for explicit and simple model versus horizontal progress of damage
from column face after punching
Figure 5-26 Profile of slab along axis 2 at location of column B2 at permanent displacement
for simple and explicit models
Figure 5-27 Reinforcement detailing of a quarter of 6 m span flat plate floor (only top bars
are shown). Bottom bars are Φ12@300 mm in both directions
Figure 5-28 Estimated connector axial force-deformation relationship after punching
for2Φ12 integrity bars in each direction
Figure 5-29 Estimated post-punching strength of slab-column connection for integrity bar
diameters 12-22 mm for rupture strain of 0.1
Figure 5-30 Effect of concrete compressive strength on estimated post-punching strength
of slab-column connection of flat plate floor for integrity bar Φ12 mm
Figure 5-31 Effect of steel ultimate strength on estimated post-punching strength of slab-
column connection of flat plate floor for integrity bar Φ12 mm

xvii
Figure 5-32 Estimated post-punching strength as a function of horizontal propagation of
concrete breakout
Figure 5-33 Effect of steel ultimate strain on estimated post-punching strength of slab-
column connection of flat plate floor for integrity bar ∅ 12 mm
Figure 5-34 Estimated post-punching strength of slab-column connection for integrity bar
diameters 12-22 mm for rupture strain of 0.15
Figure 5-35. Estimated post-punching strength of slab-column connection for integrity bar
diameters 12-22 mm for rupture strain of 0.2

xviii
LIST OF TABLES
Table 2-1 IEEE802.15.4 RF bands (Adopted from IEEE 802.15.4 User Guide, 2014)
Table 2-2 Comparison of ZigBee with available wireless standards
Table 2-3 Location description
Table 2-4 Location description and packet loss, indoor test
Table 2-5 Outdoor test description and packet loss
Table 2-6 Part of results for UART test
Table 2-7 Channel tests
Table 2-8 Evaluating data received by 3 boards on 3 different channels simultaneously:
distance 1 ft – one PC
Table 2-9 Results of Test at NU campus using a router
Table 2-10 Multi-channel test phase 2 in a short distance
Table 3-1 Percentage of axial force of removed column transferred to adjacent columns
after column removal at peak vertical displacement
Table 5-1 Average characteristics of specimens tested by Mirzaei and Muttoni (2008)
Table 5-2 Numerical estimation of post-punching strength based on Mirzaei (2010) and
experimental results of test set 2 by Melo and Regan (1998)
Table 5-3 Numerical estimation of post-punching strength of test set 3 by Melo and Regan
(1998)
Table 5-4 Maximum estimated post-punching strength of interior slab-column connection
based on Mirzaei (2010) compared with Melo and Regan (1998) estimation
Table 5-5 Maximum estimated post-punching deformation for 6m span flat plate floor
based on Mirzaei (2010)
Table 5-6 Minimum bar diameter for overloaded 6m span flat plate structure to avoid bar
fracture
Table 5-7 Minimum bar diameter to achieve specific post-punching strength as a ratio of
punching strength without bar fracture

xix
Table 5-8 Minimum bar diameter to achieve specific post-punching deformation as a
function of span without bar fracture

Chapter 1 Introduction to Progressive Collapse
1.1 Introduction
Progressive collapse is an important threat for safety and stability of structures.
Progressive collapse is defined as the spread of an initial local failure from element to
element eventually resulting in collapse of an entire structure or a disproportionately large
part of it (ASCE-7, 2010). The chain reaction of failures will continue until the structure
comes to equilibrium by finding a stable alternative load path (Choi and Krauthammer,
2003). The initial cause of the local failure can be man-made such as explosions or natural
such as earthquakes. That is, if any load exceeds the load-carrying capacity of a member,
it can cause additional failures. Recent building collapses demonstrated that most casualties
are due to building collapse rather than the initial explosion or impact loads. Thus
prevention or prediction of collapse by studying the resisting mechanisms and increasing
the integrity of the structures can increase the safety of both the occupants and rescue
personnel.
1.2 Progressive collapse examples
Ronan point building in London in 1968 was the first incident of progressive
collapse. A cooking gas explosion occurred in the 18th floor. The debris of 18th floor fall
down on the 17 th floor and exceeded its capacity. Thus, the entire corner of the building
fall down progressively as shown in Figure 1-1. The British team of investigation reported
that inability of the structure to find alternative path was the main cause of the progressive
collapse.
Alfred P.Murrah building in Oklahoma City was the target of a truck of explosives
in 1995. Due to the explosion occurred in front of the building, considerable damage was

Chapter1: Introduction to progressive collapse 2
introduced to the building. The structural system was an ordinary concrete moment frame.
Note that there was a beam girder that helped some of the columns from the third floor be
discontinued to the ground and the load was transferred through the girder. This was the
distance between the columns was increased in the first and second floor. As a result of
explosion, three main columns that were holding the girder was exploded and the majority
of the building fall down progressively (Figure 1-2)
On October 10, 2012 a construction catastrophe occurred in the Miami-Dade
College West Campus at 3800 NW 115th Avenue, Doral, Florida. A six-story parking
garage was under construction when the northeast portion of the garage suddenly collapsed
(see Figure 1-3). The base of column B3 was not grouted. Therefore, load transfer to the
footing were through the four 1 1/4" anchor bolts (A370), and 10x10" shim plates.
On October 30, 2003, part of the Tropicana Casino Parking Garage in Atlantic City,
New Jersey crashed to the ground (see Figure 1-4). The structure was incomplete at the
time of the crash. Five floors of a ten story building collapsed as a result of the lack of
adequate temporary supports for the floors’ fresh concrete. Also, the steel reinforcements
in the concrete were not properly anchored to its supporting columns.
1.3 Previous experiments on buildings
One of the methods to evaluate the response of buildings to progressive collapse is
to evaluate the behavior of actual buildings during collapse in the field. Previous tests on
progressive collapse evaluation of the actual buildings (Sasani et al., 2007; Sasani and
Sagiroglu, 2008, Sasani et al. 2011) have been performed using wired data acquisition
system for years. Experimental data that will be used in Chapter 3 is collected from an
actual building after a column removal.

Chapter1: Introduction to progressive collapse 3
1.4 Flat plate/slab floors
Previous incidents and studies have shown flat plates to be susceptible to
progressive collapse following a column removal and/or punching failure (Hawkins and
Mitchell, 1979; Sagaseta et al., 2011; Habibi et al., 2012) (see Figure 1-5). Structural
collapses have been reported over the past decades due to punching failure (Schousboe
1976; Carino et al. 1983; Kaminetzky 1991; King and Delatte 2004). Punching failure over
a column can overload the system and initiate punching shear failure in the neighboring
columns and lead to a partial or total collapse of the structure.
Hawkins and Mitchell (1979) evaluated factors that can initiate and trigger
progressive collapse in flat plate structures. Salim and Sebastian (2003), Jahangir Alam et
al. (2009), Mirzaei and Muttoni (2008); Mirzaei, (2010) and Habibi et al. (2012)
experimentally evaluated the punching strength of flat plate panels due to monotonic
loading. Qian and Li (2013c) experimentally investigated progressive collapse resistance
of sub assemblage flat plate floor due to a corner column removal. Polak (1998), Megally
and Ghali (2000) and Wang and Teng (2008), developed and used layered shell elements
to capture localized punching in flat plate structures. Mirzaei and Sasani (2011) and
Keyvani et al. (2014) analytically evaluated the progressive collapse resistance of flat plate
floors after a sudden column removal in a system-level.
1.5 Post-tensioned flat plate/slab floors
Post-tensioned (PT) flat plate/slab floors have been widely used as a floor system
in the United States. About 1 billion m2 (10 billion ft2) of PT slabs are in service (Bondy,
2012). Parking garages have increased the use of PT floor systems due to its efficiency in
providing long spans with a rather shallow slab thickness. Despite the popularity of PT
slabs, there is a lack of experimental and analytical research on nonlinear and dynamic

Chapter1: Introduction to progressive collapse 4
response of PT structures to extreme events such as loss of a primary element due to an
impact or a terrorist attack, and their progressive collapse resistance. A review of previous
studies on PT slabs shows that there are limited experimental studies on the topic. There
are some experiments on small scale flat plate systems (one-way or two-way) for
evaluating elastic and ultimate responses under fire conditions, gravity, and cyclic loading
(Scordelis et al., 1959; Burns and Hemakom, 1977; Kosut et al., 1985; Kang and Wallace,
2006; Ellobody and Bailey, 2009; Zhang et al., 2011; Kim et al., 2012). Experiments are
also conducted on small scale PT slab-column connection specimens for evaluating
flexural and shear failure under gravity and pseudo-static loading (Foutch et al., 1990; Han
et al. 2006 a and b). Ratay (2007) conducted an experiment on an actual two story unbonded
PT flat plate by evaluating the response to loss of post-tensioning force. They removed the
effect of post-tensioning by gradual saw-cutting of the tendons.
Similar to the experimental studies, analytical models on PT flat plate floors
have not been developed adequately to date. There are limited studies on modeling of post-
tensioning. Han et al. (2012) analytically evaluated seismic performance of three PT flat
plate frames. The post-tensioning was modeled implicitly at the level of slab-column
connections only. Huang et al. (2010) studied two explicit modeling approaches for
post-tensioned beams and slab-column connections: detailed modeling of the physical
condition of the tendons in the concrete, and using springs to model the connection between
the tendon and slab. The latter was validated with experimental results of Foutch et al.
(1990) and was found to be more efficient (Huang et al., 2010).
1.6 Evaluation of progressive collapse potential
The potential for progressive collapse for the existing structures can be investigated
by two common methods suggested by GSA (2013) and DoD (2010):
- Indirect design method

Chapter1: Introduction to progressive collapse 5
- Direct design method
Indirect design method
This method was used for the first time in UK in 1970s and later on published by
DoD in 2005. In this method, implicit consideration of resistance to progressive collapse
through the provision of minimum levels of strength, continuity, and ductility are
incorporated.
Direct design method
Explicit considerations of resistance to progressive collapse are incorporated in this
method. This can be achieved by either Alternative load path method (ALP) or specific
local resistance method.
In APL, The ability of the structure to withstand sudden failure and bridge of the
failed key elements is evaluated. Some of the key elements such as columns are removed
dynamically and the redistribution of the load to the supports are evaluated (Figure 1-6).
This method threat independently evaluates the structures response to an initial damage.
Specific local resistance method requires the designer to provide additional local
resistance to some of the relevant elements by considering a specific initial damage to the
structure.
Progressive collapse analysis
The recommended method to analyze a structure against progressive collapse is
ALP by the guidelines. The initial damage commonly starts with the removal of one of the
ground floor columns dynamically while the structure is under service loads. Since
progressive collapse includes nonlinearity of the material and geometry by nature, the
analysis needs to be accounted for both nonlinearities.

Chapter1: Introduction to progressive collapse 6
In the absence of any experimental data for loading pattern of existing structures to
be analyzed for progressive collapse potential, GSA (2013) suggests combination of Dead
+ 0.25 Live. The structure is statically analyzed under the above loading, and then the
reaction of the column to be removed was found and removed dynamically.
1.7 Objectives
In the current study we are to identify the collapse resisting mechanisms of flat
plate/slab floors for normal weight and normal strength concrete subjected to punching
failure and/or column removal scenario and more reliably evaluate structural response
following initial damage.
The objective of the current research is to
Develop a wireless data acquisition system for evaluating progressive
collapse of structures
Identify and characterize the progressive collapse resistance of reinforced
concrete slabs accounting for post-punching response
Identify and characterize the progressive collapse resistance of prestressed
slabs following loss of a load bearing element
evaluate the integrity requirements of the general building codes for
reinforced concrete slabs

Chapter1: Introduction to progressive collapse 7
1.8 Figures
Figure 1-1 Ronan point building collapse in 1968 (http://www.construction53.com/wp-content)
Figure 1-2 Alfred P Murrah after explosion in 1995 (http://assets.nydailynews.com)

Chapter1: Introduction to progressive collapse 8
Figure 1-3 Parking garage collapse in Miami (https://www.osha.gov/doc/engineering/)

Chapter1: Introduction to progressive collapse 9
Figure 1-4 Front facade of Tropicana Casino Parking Garage after collapse (http://failures.wikispaces.com/Tropacana+Casino+Parking+Garage)

Chapter1: Introduction to progressive collapse 10
Figure 1-5 Punching failure of Pipers Row Car Park (http://www.corrosionengineering.co.uk/knowledge-library/corrosion-of-steel-in-
concrete/)
Figure 1-6 Alternative Load Path (ALP) in a damaged structure
Initial damage

Chapter 2 Developing wireless data acquisition system for progressive collapse experiments
2.1 Introduction
Wireless data acquisition systems combine the sensor technology with wireless
communication technology which has become very popular and growing in 21st century in
agricultural, mine safety, building safety, military and smart house applications (Jin et al.
2006; Yu, 2006; Yang and Yang, 2005). Wireless DAQs is competing wired system due to
low installation and maintenance costs (Serodio et al. 2001).
Following disadvantages of the old/wired method was our motivation to evaluate
the possibility of using wireless data acquisition systems in actual structures. A significant
amount of time and effort is required to run the wires, not to mention the associated cost,
which can become cost prohibitive if the number of sensors were to increase significantly;
Due to the explosions during tests on structures, wired systems are vulnerable to falling
objects.
In the first part of this chapter (Phase 1) an attempt was made to develop a wireless
data acquisition system capable of peer-to-peer wireless communication that would replace
and overcome the constraint of the previous wired system. The type of network chosen for
this investigation is based on IEEE 802.15.4 protocol that is meant to develop low cost,
low power and easy to install personal wireless network.
For the column removal scenarios that have been studied in the past (Sasani et al.,
2007; Sasani and Sagiroglu, 2008, Sasani et al. 2011) wired data acquisition systems have
were used inside the buildings. To study the effect of more severe damage to the buildings,
a wireless system is required to be able to transfer the data to a station outside of the

Chapter 2: Developing wireless DAQ 13
building in case the entire structure collapses (we call it phase 2). Peer-to-peer
communication has a limited transmission range of about 100 m. A wireless network of
sensors capable of relaying the data is developed in the remaining of the chapter.
More importantly and beyond the experiments conducted in the past and the
applications developed here for phase 1 and 2, a wireless data acquisition system is more
effective than a wired system for instrumenting structures for developing an alert system
for collapse of structures to be used by primary responders. However, in the current
chapter, we focus on the application of the wireless data acquisition system for progressive
collapse experiments in actual structures. The idea can be extended to develop an alert
system for collapse prediction which requires a robust and resilient network of wireless
sensors.
Some of the codes and hardware used in this chapter was from a collaboration with
the computer science department’s faculty and students. Special thanks to Prof. Guevara
Noubir and Jin Tao for their endless help during the development of the applications.
2.2 Phase 1 (peer-to-peer communication)
IEEE 802.15.4
IEEE 802.15.4 wireless network protocol is a low-rate wireless personal area
networks communication protocol. IEEE 802.15 working group maintains the standard,
defined in 2003. It is low power, low data rate and less complicated with short transmission
range. It has unlicensed radio bands, easy to install and low cost (IEEE 802.15.4 User
Guide, 2014). The low power capability make the devices using IEEE802.15.4 protocol to
run on a battery without the need for cable installation which is an advantage for the
progressive collapse experiments since there are no main power in the building during the
test. There are many applications that use this protocol such as home automation, security,

Chapter 2: Developing wireless DAQ 14
health care and vehicle monitoring, etc. IEEE 802.15.4 is designed such that it runs on the
radio frequency bands shown in Table 2-1. However 2.4 GHz band is more popular since
it is available worldwide for unlicensed use. 2.4 GHz band has the highest data-rate among
others (250 kbps per channel), and popular in market in developing hardware. One of the
constraints in this protocol is the short communication range.
Communication layers
The Physical layer and MAC are the communication layers of IEEE 802.15.4 which
are based on Open Systems Interconnection (OSI) model. OSI is a conceptual model that
divides and standardizes the internal functions of a communication system to abstract
layers.
The Physical layer supports 868 MHz (1 channel), 915 MHz (10 channels) and 2.4
GHz (16 channels) bands. It is the initial layer that is responsible for data transmission,
channel selection, energy and signal management.
MAC is the second layer that controls access to the physical channel, frame
validation, packet formation and delivery, network interface, network synchronization,
device association and secure services. One of its main tasks is to listen for when the
channel is clear before transmitting in a shared channel. This is known as Carrier Sense
Multiple Access-Collision Avoidance (CSMA-CA) communication.
Network topologies
IEEE 802.15.4 standard supports star communication and peer-to-peer
communication. A tree and mesh network are also available network topologies from
802.15.4-based networks such as ZigBee that facilitate message propagation in the network
not available in IEEE 802.15.4.

Chapter 2: Developing wireless DAQ 15
Hardware
2.2.4.1 CC2530 from Texas Instrument
Based on the recommendation from Prof. Noubir’s team in the Computer Science
department of NU, CC2530 a system on-chip that is 2.4-GHz IEEE 802.15.4, ZigBee and
RF4CE Compliant RF transceiver was chosen (CC253x user’s guide, 2010). It is a low
power system on chip with a High-Performance and Low-Power 8051 Microcontroller
core. Followings are the peripherals:
- Powerful Five-Channel DMA,
- IEEE 802.15.4 MAC Timer,
- General-Purpose Timers (One 16-Bit, Two 8-Bit),
- IR Generation Circuitry
- CSMA/CA Hardware Support.
- 12-Bit ADC With Eight Channels and Configurable Resolution
- Two Powerful USARTs
- 21 General-Purpose I/O Pins
- Watchdog Timer
The CC2530 development kit includes, CC2530 ZigBee development kit, Packet
sniffer, and IAR embedded workbench software. CC2530 development kit contains,
SmartRF05 evaluation board (large boards), Battery boards (medium boards), CC2530
evaluation module (small boards), and antenna (Figure 2-1). Evaluation boards (EB) are
the platform for the Evaluation modules (EM) and can be connected to PC via USB to

Chapter 2: Developing wireless DAQ 16
control/program EMs. The EB come in smaller sizes operated on BB to be able to mount
EMs on top. EMs have RC transmitter. The antenna which mounts on EM is a 2.4 GHz
antenna Titans from Antenova.
2.2.4.2 FT232RL USB to serial board from Spark Fun
The data on the receiver EM needs to be transferred to PC for further evaluation
and recording. FT232RL USB to serial board (Figure 2-2) translates data in serial form
from BB/EBs to USB form which is connected to PC. Socket pins are soldered to the empty
spaces on the board and connected to IO pins on EB/BBs though UART (universal
asynchronous receiver/transmitter) links for serial data transfer between FT232RL and
BB/EBs. Another mini USB transfers the data that is translated by FT232RL through a
regular USB connected the PC.
Note that the data format and transmission speed on both sides of the UART link
are configurable and needs to follow the same format.
Code Development
To develop and debug an application on CC2530 EM, TI recommends using IAR
Embedded workbench (Figure 2-3). The IAR workbench is equipped with all the files for
CC2530 such as register definition header files, linker command files, driver and device
description files needed for debugging and programming (CC2530 User’s Guide, 2010).
EM is mounted on EB for debugging and loading application using IAR workbench. For
peer-to-peer communication following codes are customized and modified from an original
program developed by computer science department (by Jin Tao).

Chapter 2: Developing wireless DAQ 17
2.2.5.1 Sender code
C programming language is used for writing all the codes. The final codes are
available in Appendix 1. Some of the features of the code will be explained here.
TI provides the header files that enable programming the CC2530 EM. These files
include basic configuration functions, packet building functions, timer setup,
microcontroller programing, IO pins access and RF operation on the chip.
Similar to any application, the program starts with headings, main function
followed by some local functions. The original file from CS department had only the basic
peer-to-to peer communication functions and coding all of the board peripherals such as
ADC, DMA etc. that will be discussed later, was added.
Mainfunction:
Initializes board peripherals, RF, timer, Direct Memory Access (DMA) and sets
transmission power to 4dBm. Personal Area Network ID (PAN ID), RF Channel number
(channel 26), and local address (0xDead) of the sender are constant values defined at the
beginning. Once the initialization is done and if the device is ready, Analog to digital
converter (ADC) works on sequential conversion and Timer triggers ADC to read analog
data from all seven IO pins at once (seven potentiometers) every 1.5 ms (reading rate is
666Hz) as a single-ended input and convert them to digital data. Every time a sample is
ready from one of the pins, ADC triggers DMA to move the data from ADC registers to
RF memory. The memory allocated for data storage is of size 3728 bytes (can hold up to
maximum of 38 packets of sensed data) to be transmitted via RF. A packet that is ready to
be sent by RF is 102 bytes (98 bytes for data + 2 bytes for sequence number (number of
packets being sent) + 2 bytes as the packet header). When the DMA is done with the
transmission it disarms. The frames (packets) are then transmitted in an infinite loop along

Chapter 2: Developing wireless DAQ 18
with ACK and after CCA enabled. For every successfully transmitted packet one led on
the board is set to toggle.
Each data point is 2 bytes, the packet header (0xFFFF) is defined for every packet
and a sequence number is automatically incremented every 10.5 msec (1.5 msec * 7
readings to fill a packet) and is added to the begging of each packet. At each reading of
ADC 14 bytes of data ((7 pins * 2 bytes of data) is moved by DMA to memory. Total of 7
sequential readings from 7 IO pins are needed for one packet to be ready for transmission.
Acknowledgement (ACK) and Clear Channel Assessment (CCA) is enabled on the
sender side.
ADCConfiguration
Analog to Digital convertor (ADC) of CC2530 has eight single-ended or
differential configurable channels with up to 12 bits of resolution (effective number of
bits). That is, the analog voltage will be converted in the range of -2048 to +2047 (212).
Conversion results will be written to the memory as discussed by DMA.
The input pins AIN0–AIN7 are set to connect to the ADC by configuring APCFG
register. ADC inputs used in the current code are single-ended with sequential conversion
ending at pin 6 by setting register ADCCON2.SCH bits. ADCCON2.SDIV register bits define
the 12 bit resolution. ADCCON2.SREF register bit defines the last pin (7) as the single
ended reference voltage. The reference voltage is the highest possible voltage and other
inputs will be converted according to the reference voltage.
ADC has two registers ADCH and ADCL that stores the converted values. ADCH
has the highest bits and ADCL has the lowest bits. Since the resolution of ADC is 12, 4
lowest bits of ADCL are considered as noise and ignored. The ADC generates a DMA
trigger every time a conversion from the sequence has completed.

Chapter 2: Developing wireless DAQ 19
DMAconfiguration
The Direct Memory Access (DMA) Controller is used to relieve the 8051 CPU
core, of handling data movement operations. The DMA controller can move data from a
peripheral unit such as ADC periodically to memory, RF transceiver, or to feed a USART
with minimum CPU intervention thus achieving high overall performance with good power
efficiency (CC253x user’s guide) without having to wake up to move data to or from a
peripheral unit.
There are five DMA channels available in the DMA controller, numbered channel
0 through channel 4. Each DMA channel can move data from one place within the DMA
memory space to another (CC253x user’s guide, 2010).
After a DMA channel is configured, it is armed before any transfers are allowed to
be initiated. The DMA channel 0 is used and armed by setting register DMAARM’s bit.
Function dmaInitial() is the initial configuration for DMA data structure. Calling
this function configures the DMA and ARMs channel 0. Register dma_config is configured
to move data from source to destination after being triggered by ADC. The address of
source data is the address of ADC registers (ADCL and ADCH) and the destination is the
large memory allocated for the data collection. After transfer of data, all the flags are
cleared and DMA is armed again to wait for the next trigger from ADC.
2.2.5.2 Receiver code
Listens on specified RF channel, and processes all the frames received from node
"Dead" (ID of sender). In each received frame, the first two bytes are always 0xFF which
represents the start of a packet, as mentioned before, and second two bytes are 16 bit packet
sequence number followed by 98 bytes of data assembled by sender.

Chapter 2: Developing wireless DAQ 20
Receiver will send 105 byte message on UART link for each received frame. 0xFF
| 0xFF | seq_MSB | seq_LSB | and 98 DATA| packet end delimiter. The receiver code uses
IO pins as UART receive/transmit pins. Code available in Appendix 1.
Mainfunction:
Initializes board peripherals, initializes RF, sets maximum transmission power for
RF(4db), system will be in sleep mode and wakes up when a packet is received. An ISR
will check if a packet is being received. A Led on the board will turn solid green when the
device is ready to receive data.
basicRfProcessPacket() function processes received packet and copies data to
buffer. Toggles LED every time a packet is received. The data will be copied by DMA to
a memory. After copying, the address of destination memory will shifted to where next
packet will be copied. The memory is used by USART for data transfer from receiver to
PC.
ConfiguringUART
UART mode is available for asynchronous serial interface communication on EM.
We are using two-wire interface consisting of the pins RXD and TXD. The transmission
starts by writing to U0DBUF. The byte is then transmitted through output pin of TXD.
(CC253x user’s guide, 2010).
In our receiver code available in Appendix 1, uart_init() function configures and
initializes UART. Sets the BAUD Rate for communication through UART and handles the
interrupt flag for UART. Sets the peripheral I/O pins for UART communication. UART is
configured with:- no flow control, word size (8-bit), no parity check, 1 stop bit, low stop
bit, high start bit, Baud rate of 230400bps, and low significant bit first (LSB). uart_send()
sets a variable named "uart_send_active" to check if the UART is active or not. Reads

Chapter 2: Developing wireless DAQ 21
unsent data from buffer and transmits through UART. Also increments the pointer to the
next unread byte.
FramePacking() takes 102 bytes from buffer (the packet that was received) and
forms a frame of size 105 bytes to be sent over UART. Two bytes are added to the ends of
the packet as the ETX (the end text) and a (delimiter) DLE each equal to 0x00. At the end,
sum of the bytes (checksum) is added for control and validating the frame after
transmission through UART on PC by another code (Serial reader code). The reason for
this coding is explained in the UART test section.
2.2.5.3 Serial Reader code
The original serial reader code by Jin Tao (CS student) was developed in Linux and
we have expanded on the same code under Linux which is available in Appendix 1. Serial
reader logs everything read from USB to a log file. It asks for a file name and device name
and creates a file to log the data to.
Mainfunction
Configures the serial interface to match the setting of UART: no flow control, word
size: 8-bit, no parity check, one stop bit, low stop bit, high start bit, Baud rate is 230400bps,
and low significant bit first (LSB). Each received packet will be time stamped using the
local time on the computer. In a while loop, the code validates the packets sent from
receiver node by decoding and looking for start and end delimiters. If the packet was valid
then it will be time stamped, and finally prints all the data after conversion to the file
created.

Chapter 2: Developing wireless DAQ 22
ValidatingpacketsonPC
check_header(),check_End(), check_Sum(), and valid_Packet() are functions to
check whether the first two bytes of the packets are the same as the packet header that was
defined (0xFFFF), whether the last two bytes of the packets are the same as the packet End
that was defined (0x0000), whether the last byte of the packet is equal to bitwise OR of all
data (checksum) and lastly whether a packet passes all the initial check points
(check_header(),check_End(), check_Sum()). Then the packet will be ready to be
interpreted.
Interpretingsensordata
The result of ADC conversion, as mentioned before are stored in twos complement
form. The significant bits are the eight bits in ADCH and the most significant four bits in
the ADCL register with the remaining four bits being noise and ignored.
result() function on serial reader code combines the 4 bits of LSB and 8 bits of MSB
by bitwise shifting and returns the proportional results of voltage to the reference voltage.
The sign of the voltage is also converted.
Tests
2.2.6.1 Locations/range/obstacles test
IEEE 802.15.4 sensing units with peer-peer topology are capable of transmitting
through obstacles like walls, glasses in short range communications. Maximum line of
sight transmission was 180 ft which can be increased up to 500 ft by using directional
antennas. In three different locations, following parameters are evaluated for a peer-to-peer
communication topology: Obstacles, range of transmission, sampling rate, booster
antennas (increasing transmission power).

Chapter 2: Developing wireless DAQ 23
WestvillageH:
Tests are performed in the West village H located on NU campus. Indoor test results
on 15 different locations (see Figure 2-4) are compared with those done by Computer
Science students. The common characteristics of the communications were 4dBm
Transmission Power on channel 26. The results highly depended on the type of application,
and data rate as those performed by CS students was found to be on low rate transmission
performed with virtual data. Some locations are found to be dead zones (No successful
transmission). No solid conclusion could be made on the relationship between the effect of
data rate and successful transmission.
The following items are the differences between the tests done by our group and
CS students:
CS test : digital data, broad casting mode, No ACK, No CCA, data rate: 40 kbps,
No ADC, NO DMA, NO TIMER,
Our Test_1 first try (High data rate): analog data, Unicast mode, ACK on, CCA on,
data rate: 78 kbps, ADC, DMA, TIMER, 2 packet capacity
Our Test_2 (low data rate): analog data, Unicast mode, ACK on, CCA on, data rate:
2 kbps, ADC, DMA, TIMER, 2 packet capacity
The results are compared with those of the CS students in Figure 2-5. Table 2-3
shows the description of the obstacles.
SnellEngineering:
Effect of different obstacles, type of material and the range are evaluated in Snell
Engineering building. Signal penetration through two walls, glass doors, and metal doors
are tested. Maximum LOS test was performed as well.

Chapter 2: Developing wireless DAQ 24
Single hop test with the rate of 666Hz is performed at the Snell Engineering
basement. No sensors were used, random data are transmitted. First set of tests are indoor
tests at the basement. Second tests are done in the stairways through the opening to evaluate
the possibility of transferring data wirelessly through multiple floors. Figure 2-6 shows the
location of the transmitters in the basement of SN. Table 2-4 shows the packet loss for each
test in addition to the description provided for the type of obstacles in between.
Some outdoor tests are performed to evaluate the effect of moving obstacles such
as people, cars and measured the maximum LOS successful transmission range. Results
are shown in Table 2-5.
Outdoorlongrangetest(NUcampus):
In order to increase the transmission range, which will help transfer from phase 1
to phase 2, directional antennas can be useful. Directional antennas need not to be used on
both sides, since they will need to be aimed precisely at each other or else they will lose
signal. So it is used at the receiver side only. This antenna (see Figure 2-7) did not require
main power, runs on board’s battery. Tests are done on NU campus.
The initial LOS transmission was 200 ft with less than 0.5% loss for 2 min. Despite
previous tests in which the communication was lost if there was a moving obstacles, in this
test a car passed by and the data was not lost. Maximum successful LOS that achieved was
500 ft. Same test was repeated in different locations of the campus and average of 10% loss
was achieved.
2.2.6.2 Accuracy of measurements
Following tests are performed to evaluate the accuracy and reliability of data
transmitted and recorded: Test with signal generator, UART accuracy test with fixed data,
Comparison of wired data acquisition versus wireless, Test with 7 pots using prototype IB

Chapter 2: Developing wireless DAQ 25
Testwithsignalgenerator
Using signal generator, a customized pattern of analog signal is fed to pin 0 of the
evaluation or battery board to evaluate the accuracy of sensed, converted, and transmitted
wireless data to the PC. Considering the fact that analog data sampling rate is 5msec, period
of a sine wave input signal was chosen to be 15msec to avoid Nyquist error. Some of the
results are shown in Figure 2-8. The expected data was to be in the range of 0-1 volts
however, some of the recorded data as shown, was not only wrong but also out of range.
The problem was narrowed down to the UART link which sends data bit by bit from board
to the FT232 serial to USB converter. This problem happened before applying end
delimiters and checksum to the packet sent from receiver node to PC. That is, UART was
not properly sending the data bit by bit.
UARTaccuracytestwithvirtualdata
Virtual data packet was generated on the receiver board and sent to PC using UART
and FT232 links. Also, there is no wireless communication involved to be able to check
the validity of the link between receiver and PC. The expected values are 0.5 on all pins as
shown on the first row of Table 2-6. However some of the results were not as expected.
Data evaluation showed that wrong results in red, can only happen if one of the bits are
missing. So each data set is combined with one bit from next set of data.
This can only happen if the UART was not successful in transmitting the data
properly which is inevitable in high data rate transmissions. In order to check and verify
validity of a data packet before UART and after that on the computer, there need to be
either a software/hardware ACK or each packet needs to be verified before being printed
out in a text file. The latter is possible by defining a packet start and end delimiter, and a
checksum for the data points in the packet before UART link and after at the base PC.

Chapter 2: Developing wireless DAQ 26
As mentioned in the Code Development section, the packet size from receiver to
computer is increased such that delimiters and checksums can be fitted. 2 bytes for end,
and one byte as check sum which is a “bitwise or” operation performed on all of the data
points are saved in 1 byte space. So invalid packets received by PC through UART link
will NOT be printed and saved.
The test with signal generator is repeated to evaluate the validity of the results after
revising serial reader code shown in Figure 2-9. The results were satisfactory.
WiredsystemversuswirelessDAQtest
The accuracy of analog data measured by wireless DAQ is verified by wired DAQ
from NI (National instruments). Wire DAQ have been used in previous field tests by Sasani
et al. (2007); Sasani and Sagiroglu (2010); Sasani et al. (2011). Capability of data reception
and interpretation simultaneously from USB ports highly depends on the performance of
computer. Data rate for both systems are the same 666 Hz.
A concrete cylinder is prepared with two strain gauges attached side by side. One
connected to the wireless DAQ and the other one connected to the wired system and then
swapped. A drawing of the specimen is shown in Figure 2-10. Figure 2-11 shows the results
collected. Figure 2-11a shows some noise in the data collected from wireless DAQ due to
loose connection. Nonetheless, the pattern is properly followed. Figure 2-11b is collected
after fixing the loose connection.
Testwith7potsusingprototypeIB:
An interface board (IB) was designed by one of the group members to connect 7
potentiometers at the same time to the wireless DAQ board. Pots are used one at a time in
order from pin0 to pin6. All pots should show 3.5 cycles which is intentionally moved by
the user one at a time. Figure 2-12 shows the voltage of the pots overtime from pin 0 to pin

Chapter 2: Developing wireless DAQ 27
6. Expected variation of voltage for all pins is 0-1 however pin 6 starts from a value greater
than 0 at the beginning which needs to be investigated
2.2.6.3 Time-stamping test receiver vs sender
Time stamps generated by the sender is compared with that generated by PC for
synchronization purpose. Time stamp at the sender is measuring a relative time, however
at the PC side, a computer assigns an absolute time to each packet. Results show almost
150msec time differences between sender and PC time stamp after 2 hours (Figure 2-13).
2.2.6.4 Multi-USB with virtual data test
Capability of computer in handling data from 7 USB ports are evaluated by virtual
data. Virtual data was generated in one of the receiver boards and transmitted over. No
wireless communication is involved to focus only on the lost packets due to the wired
communication. From available department laptops, one could not handle (Dell) while
other (Lenovo) was able to transfer data on all seven ports with less than 5% loss.
2.2.6.5 Channel test
Quality of 16 channels of IEEE802.15, 2.4 GHz is investigated. Also possibility of
peer-to-peer communication on 3 different channels simultaneously is tested.
Communication was tested in 1 ft and then 15 ft distances, with 666 Hz sampling rate (10.5
packet generation rates) and the duration was 1 minute (5000 packets). Table 2-7 shows
the results of 16 channel tests one at a time and Table 2-8 is the results of 3 simultaneous
channels.
The quality of all channels for data transfer are good for short range tests (15ft).
Less than 5% packet loss is observed for multiple channels test.

Chapter 2: Developing wireless DAQ 28
2.3 Phase 2: Wireless sensor network (Multi-hop communication)
ZigBee
The ZigBee Alliance (ZigBee Alliance, 2005) is an association of companies that
develop standards for secure, low-power, low-cost wireless networking. The ZigBee
standard defines the higher layers of the IEEE 802.15.4 protocol stack. The network layer
(NWK), application layer (APL) are the main layers built above physical and MAC layers.
The APL layer includes application framework and ZigBee Device Objects (ZDO) and the
Application Sub Layer (APS).
ZigBee pro
ZigBee has two stack profiles. Stack profile 1 (simply called ZigBee), for home and
light commercial use. In October 2007 the ZigBee Alliance announced an expanded set of
features. Stack profile 2 (called ZigBee Pro) which is an enhanced version of original
ZigBee protocol and offers more features, such as multi-casting, many-to-one routing
(ideal for sensor networking that has one node as gateway).
Protocol architecture
ZigBee Pro divides up the communication tasks into layers and stack them on IEEE
802.15.4 standard’s layers. Each layer performs specific services for the other layers.
Figure 2-14 shows the stack of ZigBee layers in addition to IEEE 802.15.4 layers.
Network layer is responsible for multi-hop routing, route discovery and
maintenance, security, join and or leave a network, assigning consequent short (16-bit)
address to newly joined devices (Baronti et al. 2005). Apply security to frames, discovery
of one-hop neighbors and storing the pertinent neighbor information.

Chapter 2: Developing wireless DAQ 29
Application layer is the highest-level of layer in the stack and provides a framework
to develop applications that run on ZigBee. It consists of the Application Framework,
ZigBee Device Object (ZDO), and Application Support (APS) Sub layer.
Application frame work defines the frame format for application objects to send
and receive data. An application object is the software at an end point which achieves what
the device is designed to do. A ZigBee product is developed by creating application end
points on top of the ZigBee stack.
The responsibilities of the ZDO include:
• Defining the role of the device within the network (ZigBee coordinator, Router or
End device)
• Discovering devices on the network and determining which application services
they provide
• Initiating and/or responding to binding requests
• Establishing a secure relationship between network devices
The responsibilities of APS are:
• Forming and storing Binding tables
• Message forwarding between bound devices
• Group address definition and management
• Address mapping from 64-bit extended addresses to 16-bit NWK addresses
• Fragmentation and reassembly of packets

Chapter 2: Developing wireless DAQ 30
• Reliable data transport
There are many applications for ZigBee devices, wireless light switches, electrical
meters, traffic management systems, heating control, home security, Medical sensing and
monitoring, (zigbee.org/about/FAQ.aspx) and any other application that requires low data
rate and transmission distance which leads to a longer battery life.
ZigBee device types
CC2530 kit mentioned and utilized in phase 1 are compatible with ZigBee and will
be used here as well.
Coordinator (C): There is only one coordinator in each network. It assigns PAN ID,
finds or uses a suitable radio frequency, handles requests from other devices to join the
network. Typically coordinator needs to be on all the time and cannot sleep thus it cannot
be battery operated and needs a main-power resource. Also, in ZigBee Pro it can be
configured as the gateway/sink in the network to which all the data are transmitted.
ZigBee Router (R): A ZigBee Pro network requires at least one router. Router
handles request from other devices to join network and relays messages. In order to
increase the transmission distance. The router similar to coordinator cannot sleep and needs
to be available for routing.
ZigBee End Device (ED): This device can only talk to a router or coordinator. It is
directly connected to sensing devices and can have a longer battery life if it remains asleep
most of the time. Once association is complete the sensor node enters a regular loop of
reading its sensors, puts out a frame containing the sensor data, performs a clear channel
assessment (CCA) and then transmits a data packet containing a payload of 105 bytes.

Chapter 2: Developing wireless DAQ 31
Network addressing
All the nodes in ZigBee network have two addresses:
IEEE (MAC) address: a 64-bit address, allocated by IEEE. Each device has a
unique MAC address in the world.
Network address: 16-bit address of a noted within a network. It is local, two nodes
in two different networks can have the same address. The coordinator is always 0x0000.
In ZigBee pro, the network address of each node is assigned by its parent as a 16-
bit random number. Since it is a random number, it is referred as stochastic addressing.
Network initiation
Coordinator is responsible to start a network. Followings are the main tasks
performed by coordinator to start a network and serve as the gateway:
Sets network address of coordinator as 0x0000
Selects radio channel in case it is not already assigned
Sets the pan ID randomly to avoid conflict with other networks
Receives join requests from other devices
After the network is created, routers and ED search for the network. Each node
select a parent which is in the smallest depth to it and then sends a joining request. Then it
waits for a response. Then if the parent accepts the join request it will allocated a 16-bit
network address to the child which is randomly generated. A router or coordinator can be
configured such that no more join request will be accepted.

Chapter 2: Developing wireless DAQ 32
Routing
In this phase since ED and gateway/coordinator are not in the hearing distance from
each other, routers are added to the network to increase the transmission distance. Up to 30
hops are allowed in ZigBee pro. In this case each message would carry the destination
address and the address of next hop.
Code development
One of the projects of CC2530ZD available in TI.com is Sensor demo application
that contains source codes for setting up the devices (ED, Router and coordinator) and
starting a basic communication between them by binding the devices together. The codes
require Z-stack 2.5 and IAR EW8051 8.1. The Sensor demo is organized into 2 difference
configuration for programming ED or Coordinator/Router. They are Sensor code and
Collector codes. Sensor code is used for ED since it does not have routing or network
formation capability. While Collector code, is used for programming Coordinator/router.
The devices however, does not restrict the type of application that can run on them.
Sensor Demo project from IT is used as a template to build our project upon. The
features and configurations used in the previous section (Phase 1) such as configuration of
ADC, DMA, timer and packet formation and UART configuration is added.
2.3.8.1 Sensor Code
Sensor Demo project from Texas instrument sends temperature data, sensed by a
sensor on the board, to a router or coordinator. It was modified to make use of ADC, DMA,
and timer and customize the packet formation. Each project has several header files and
source codes that handle variables and functions defined. For instance the default and
constant network related values are configured in f8wconfig.cfg file (see Appendix 1).
Parameters such as the channel no., type of ZigBee profile (ZigBee or ZigBee pro), PAN

Chapter 2: Developing wireless DAQ 33
ID, maximum number of retries to deliver a packet, Maximum frame size are all defined
in the configuration file. In order to modify the code, it was necessary to understand and
make use of header files and functions and variables that are defined by the project to keep
the integrity of the codes. For instance, functions and variables that configure ADC in this
project was explained in hal_adc.c file. That is, the configure ADC to do what explained
in phase 1, it was necessary to understand and use functions in hal_adc.c file. Similar
header files are available for configuration of other board peripherals. A copy of the code
and the definition of the variables or function are in the Appendix 1.
The main functions that handle sensing data prepare a packet are listed as:
readVoltage, sendReport in the Appendix 1. The program will bind the ED to a router or
coordinator and will send periodically sensed data.
The code also handles LEDs, LCD and a Joystick on the board if any. LCD is used
to print information about the device type (ED or Coordinator), LED to show the status of
device (ready, reporting, etc.) and the Joystick to manually control some of the functions
such as when to start reporting (sensing data from ADC). Joystick is a button with 5
different position. Each position can be set to handle a specific task on the board manually.
The function that handels the Joystick is zb_HandleKeys.
This code is only responsible for sensing and sending data and cannot be used as
the receiver. Since in this project, receiver is always a coordinator/gateway.
2.3.8.2 Collector code
The collector code is also based on the Sensor demo application from Texas
Instrument with modifications. The collector node is a receiver of data from the sensor
nodes, depending on the device responsibility, router or coordinator/gateway, it can either
relay the data to the next node or send the reports via the UART links to a PC. Similar to

Chapter 2: Developing wireless DAQ 34
Sensor code, collector code is a project that can be edited and compiled using IAR
Embedded Workbench. It has header files that facilitates programming. The main code is
available in Appendix 1.
The code also makes use of Joystick on the board. The Joystick is set such that the
device can be started as a coordinator which initiates the network and then serves as a
gateway (collects and sends data through a UART link to PC). Also, Joystick is
programmed to limit the number of devices that can be bound to the gateway. For instance,
if the router and coordinator are both in the hearing distance from ED, to make ED
connector to router, by pressing Joystick in the right direction on the coordinator board,
coordinator will not accept any join request. Thus ED sends the join request to the router.
The code handles the received data, if a coordinator/gateway, it forms a packet similar to
that described in Phase 1 with end delimiters and sends it through UART. All the functions
are described in the code.
The devices that will serve as a router will be loaded with the same collector code
except that they will only relay data.
2.3.8.3 Serial reader
The serial reader code on PC will be the same as before It validates the packets,
interprets the data received, time stamps and logs in a text file.
Tests and results
2.3.9.1 Sensor demo application from TI short range
CC2530ZDK Sensor demo application on channel 11 is tested here. It is a demo to
show how the devices will connect to each other by TI. It uses a temperature sensor on the
boards to report the temperature. ZigBee Sensor Monitor 1.2.0 is a tool to visualize the

Chapter 2: Developing wireless DAQ 35
connection between the nodes and temperature. This software is available in TI.com.
Program can be downloaded to the CC2530 chips using flash programmer.
Onerouterscenario:
Coordinator (Red circle) starts the network, one ED (Yellow circle) binds to the
coordinator directly. Then ED starts sending data by pressing joystick down. Another
router which is a dummy router (not connected to any ED shown in light gray) has been
binded. Pressing joystick left on the gateway device. This will disallow further nodes to
associate directly with the gateway. Next we add another ED (Yellow circles) which has
to connect to the router. Adding second ED to the system, router will serve as relaying
node for the data coming from the ED (active router, blue circle). This is shown in Figure
2-15.
Two router scenario
Two routers (collector) are powered up after gateway, they will try to join an
existing network. Pressing joystick down periodic report is sent from router to the gateway
which is used to visualize the nodes on the tool mentioned. Pressing joystick to the left on
the gateway (coordinator) does not let any device join it directly. When the last sensor
nodes is powered up that will instead associate to the one of the collector nodes (router)
(see Figure 2-16).
Self‐healingcapability
In order to evaluate self-healing capability of the network, one of the routers that
ED is associated with is intentionally disabled. The result is as below. ED finds another
parent for its data to associate with. i.e. when an ED does not receive ACK and the number
failed sent data hits the limit specified in the file, ED tries to find another gateway or router
to bind to (see Figure 2-17).

Chapter 2: Developing wireless DAQ 36
2.3.9.2 Single channel test
Shortdistance
Wireless communication based on ZigBee stack with sampling rate of
333Hz/channel (21 msec packet generation rate) is carried out while ED, router and
gateway are located in close distance (~30 ft).7 potentiometer were connected to the
sender board.
Test procedure:
1‐ Pressing joystick in the middle, turn on the gateway.
2‐ Then release joystick
3‐ Push up the joystick (make device to start a network)
4‐ Push right to make it function as a gateway
5‐ Holding joystick at the middle, turn on the router
6‐ Release joystick, let it join the network
7‐ Push joystick left on the gateway board (this way gateway will not accept any
further direct child, this way as soon as we turn on ED it HAS to connect to router)
8‐ Simply turn on the ED.
9‐ Let the device run for 30 sec (none of the potentiometers are moved at this
time)
10‐ Every 30 sec, one of the potentiometers, starting from pin 0, moved (10
cycles).

Chapter 2: Developing wireless DAQ 37
11‐ Ran for about 4 minutes
The results are plotted and shown in Figure 2-18. The test was successful, except
that pin 6 could not properly detect the amplitude of cycles.
Longdistance
Similar test was repeated in long distance. Wireless communication based on
ZigBee stack with sampling rate of 333Hz/channel (21 msec packet generation rate) is
carried out. Characteristics of the communication: 3 MAC retransmission, 2 Network level,
No Application level retransmission.
The test is performed on Northeastern University campus. The gateway
(GW)/coordinator is located outside of the building, router and ED inside the building.
Three different locations were used for the GW to evaluate the maximum distance the data
can be transferred (Forsyth, Grassy, and Ryder, see Figure 2-19). The data are sensed at
ED then sent to RT which is in a hearing distance of ED. Coordinator however is not within
the hearing distance of ED, thus the router relay the data to the coordinator. A directional
antenna is used in GW side to increase the LOS transmission range from route to GW.
Results of test is summarized in Table 2-9. The maximum transmission range that could
achieve was about 150 m (500 ft).
2.3.9.3 Multi-channel test
Section 2.3.9.2 was repeated for three channels simultaneously to evaluate the
functionality of DAQ while 3 separate channels (11, 19, and 26) are in the hearing distance
of each other. Each DAQ had one ED, Router and gateway. ED is within 10 ft distance of
router. Gateway is within 25 ft distance of Router. That is ED is within 35 ft distance of
GW. The packets are generated every 18 msec but the sampling rate is still 333 Hz/channel.
Communication characteristics were 3 MAC retransmission, 1 Network level (3 MAC

Chapter 2: Developing wireless DAQ 38
retransmission), No Application level retransmission (No 2nd level Ack.). Performance of
each channel is summarized in Table 2-10. Comparing previous test on single channel and
current test which is short distance communication, it can be seen that presence of other
channels increases the noise level and packet loss increases.

Chapter 2: Developing wireless DAQ 39
2.4 Tables
Table 2-1 IEEE802.15.4 RF bands (Adopted from IEEE 802.15.4 User Guide, 2014)
Table 2-2 Comparison of ZigBee with available wireless standards

Chapter 2: D
eveloping wireless D
AQ
40
Table 2-3 Location description
location
Index
Total
distancePossible obstacles location description
1 100 ft walls, glass door 2 possible paths: either through 2 office walls or thorugh glass door, reflecting to top of stairs
2 100 ft walls, glass door 2 possible paths: either through at least 2 office walls or thorugh glass door, reflecting to end of hallway
3100 ft H
12 ft Vglass door same as location 2 ‐ one floor below
4 15ft glass door Just outside of the office
5 30ft wall, glass doors through one wall next door, or reflecting through glass in hallway
6 150‐200ft glass door through glass door reflecting down hallway
7 150ft underneath stairs one floor below, possibly through overhanging slab
830 ft H
12 ft Vglass door just outside of the office, one floor below
9 12 ft floor slab directly above sender, must penetrate through slab
10 120 ft several walls two normal hallways, sender at one of the hallways in the room
11100ft H
12ft Vfloor slab, glass doors one floor below, down hallway
12 100ft walls, glass door by the elevator in the hallway normal to the sender's hallway
13 50ft floor slab one floor above
14 120ft windows simplest path must go outside the building, downstairs, ans back in through glass. Nothing to bounce off
15100 ft H
12 ft Vfloor slab through slab

Chapter 2: D
eveloping wireless D
AQ
41
Table 2-4 Location description and packet loss, indoor test
Snell building location test
Floorlocation Index
location descriptionpacket loss (%)
Commentdistance(ft)
obstacles
Basement
1 5one 6" wall in between‐ walls are continous in all directions
type of ceiling: drop ceiling0.01
2 18two 6" walls in between‐walls are continous in all directions
type of ceiling: drop ceiling0.03
3_1 25one closed glass door in between
type of ceiling: drop ceiling0.1
3_2 25one open glass door in between (line of sight)
type of ceiling: drop ceiling0.1
4 10 one metal door in between 2.1
5_1
30
one closed metal and one closed glass door in between 1.2 data received for a short time
5_2 same location doors are open (line of sight) 2
5_3one closed metal and one closed glass door in between
Alternate hall way door closed ( avoiding any possible path)0.94
6 70two thin partitions‐ one closed glass door‐ one closed metal
door100 couple of packets received
7‐115
(one floor)tested in the stair ways. Not line of sight 0.18
7‐230
(two floors)opening of stair ways are used for test 0.44 only received through opening
7‐345
(3 floors)opening of stair ways are used for test 3.8 only received through opening
7‐460
(4 floors)opening of stair ways are used for test 0.17 only received through opening
8 15two 6" walls in between‐walls are continous in all directions
type of ceiling: drop ceiling
LOS180 Tested in the tunnel 2.1
200 Tested in the tunnel 2 data received for a short time

Chapter 2: D
eveloping wireless D
AQ
42
Table 2-5 Outdoor test description and packet loss
Table 2-6 Part of results for UART test
seq num
received packets
data (pin0)
data (pin1)
data (pin2)
data (pin3)
data (pin4)
data (pin5)
data (pin6)
13394 13327 0.5 0.5 0.5 0.5 0.5 0.5 0.5 13394 13327 -0.124 -0.124 -0.124 -0.124 -0.124 -0.124 -0.124 13394 13327 -0.124 -0.124 -0.124 -0.124 -0.124 -0.124 -0.124
Out door location test
location Index
location description
packet loss (%)
CommentHorizontal distance
(ft)
Vertical distance
(ft)obstacles
1 504 floor (~60)
one glass window. Receiver in the 400 SN, sender in front of the Egan (total length = 78 ft)
0.2the anthenna of sender was towards the recever
2_1 1304 floor (~60)
one glass window. Couple of trees. Receiver in the 400 SN, sender on the steps of snell library (total length = 143 ft)
35.6 crashed after 30 sec.
2_2 1104 floor (~60)
one glass window. Couple of trees. Receiver in the 400 SN, sender in front of Snell library (total length = 125 ft)
100 crashed couple of times
LOS 185 People 1crashed while a bunch of people passing by
LOS 200 Nothing 0.7

Chapter 2: Developing wireless DAQ 43
Table 2-7 Channel tests
*2nd trial, first trial was 91%
1 ft distance
Channel Received
(%)
26 100
25 100
24 100
23 99
22 99.66*
21 99.8
20 99.9
19 99.8
18 96
17 100
16 99.2
15 99.9
14 99.9
13 99.5
12 98.5
11 100
15 ft distance
Channel Received
(%)
26 98.88
25 96.94
24 98.02
23 99.32
22 98.92
21 99.14
20 98.28
19 99.49
18 96.76
17 96.34
16 94.24
15 98.42
14 97.16
13 98.28
12 96.8
11 99.24

Chapter 2: Developing wireless DAQ 44
Table 2-8 Evaluating data received by 3 boards on 3 different channels simultaneously: distance 1 ft – one PC
set Board-
channels
Total
received (%)
Individual
received (%)
1 11 98.8 99.9
13 96.72
15 99.8
2 11 97.7 99.5
14 99.8
17 93.9
4 11 99.82 99.96
15 99.6
19 99.9
Table 2-9 Results of Test at NU campus using a router
Device locations LOS
distance (m) Packet loss
(%)
Test duration
(min) ED ROUTER GATEWAY
4th floor Snell
By the elevator
400 Snell By the
window Forsyth 115 12 4.5
4th floor Snell
By the elevator
400 Snell By the
window Grassy 147 22 4.5
4th floor Snell
By the elevator
400 Snell By the
window Ryder 200
No data received
-

Chapter 2: Developing wireless DAQ 45
Table 2-10 Multi-channel test phase 2 in a short distance
Board-channels Individual
Loss (%) Total loss (%)
11 19.5
29.2 19 26.2
26 1.7

Chapter 2: Developing wireless DAQ 46
2.5 Figures
Figure 2-1 CC2530 development kit (CC2530 user’s guide, 2010)
Figure 2-2 FT232RL Serial to USB board from Sparkfun (Sparkfun website)

Chapter 2: Developing wireless DAQ 47
Figure 2-3 IAR Embedded workbench for programming and debugging EMs (IAR User Guide, 2009)

Chapter 2: Developing wireless DAQ 48
Figure 2-4 Location of measurement points at the WVH (Adopted from CS students)

Chapter 2: D
eveloping wireless D
AQ
49
Figure 2-5 Comparison of location test at VWH with different communication and application characteristics
0
20
40
60
80
100
1 2 3 4 5 6 7 8 9 10 11 12 13 14 15
Packet loss %
Location index
My test_1 First try
CS Test
My Test_2
My Test_1 second try

Chapter 2: D
eveloping wireless D
AQ
50
Figure 2-6 Measurement point at the basement of Snell Engineering Building

Chapter 2: Developing wireless DAQ 51
Figure 2-7 Typical directional antenna

Chapter 2: D
eveloping wireless D
AQ
52
Figure 2-8 Test with signal generator

Chapter 2: D
eveloping wireless D
AQ
53
Figure 2-9 Results after revising code

Chapter 2: Developing wireless DAQ 54
Figure 2-10 A schematic representation of test sample and location of strain gauges
Wireless DAQ
Wired DAQ

Chapter 2: Developing wireless DAQ 55
a)
Str
ain
(Mic
ro)
Time (sec)
Wireless
Wired

Chapter 2: Developing wireless DAQ 56
b)
Figure 2-11 Comparison of wired and wireless DAQ systems
Str
ain
(Mic
ro)
Time (sec)
Wireless
Wired

Chapter 2: Developing wireless DAQ 57
Figure 2-12 Voltage of 7 pots overtime

Chapter 2: Developing wireless DAQ 58
Figure 2-13 Time synchronization test between sender and receiver
Figure 2-14 ZigBee protocol stack
R² = 1
0
20
40
60
80
100
120
140
0 15 30 45 60 75 90 105 120 135
Receiver time (m
sec)
Sender time (min)

Chapter 2: Developing wireless DAQ 59
Figure 2-15 Sensor demo application shown in ZigBee Sensor Monitor 1.2.0;
Left: dummy router, right: active router
Figure 2-16 Two router scenario

Chapter 2: Developing wireless DAQ 60
Figure 2-17 Self-healing capability of ZigBee network after a router disabled

Chapter 2: Developing wireless DAQ 61
Figure 2-18 Single channel test on Zigbee using ED, Router and a gateway at a close distance

Chapter 2: D
eveloping wireless D
AQ
62
Figure 2-19 Test layout at NU campus for Phase 2
Forsyth
GW
Grassy
GW
Ryder
GW

Chapter 3 Progressive collapse evaluation of a post-tensioned floor
This chapter is a reprint of the following manuscript with slight modifications
Keyvani, L., and Sasani, M., (2014). "Analytical and experimental evaluation of progressive collapse resistance of a flat slab post-tensioned parking garage." J. Struc.
Eng. ASCE. (Under review)
3.1 Introduction
In the current study, an actual PT parking garage surrounding the Crowne Plaza
Hotel in Houston, TX was evaluated against progressive collapse. An interior column was
removed by explosion and the response was recorded using sensors. Explicit FE analytical
models are developed here to evaluate the results. The interaction between the tendon and
the slab is modeled explicitly using link elements (Huang et al., 2010). A nonlinear
dynamic FE analysis is performed which accounts for both material and geometric
nonlinearities using SAP2000 (2009). The analytical results are in good agreement with
the experimental results. In addition, the effect of different parameters on the global
response of the structure is evaluated.
3.2 Parking Garage Characteristics
The parking garage of the Crowne Plaza Hotel was located in Houston, TX and
constructed in 1973. The hotel and the garage were demolished by implosion after the
experiment was concluded. Figure 3-1 shows the plan of a portion of the parking garage
located on the north side of the hotel. The 216 mm (8.5 in) thick garage floor was made of
post-tensioned concrete. Button-headed wire tendons were used in the garage floor, which
was common in the industry in the 1960s and early 1970s (Krauser, 2006). The button-

Chapter 3: Progressive collapse evaluation of post-tensioned floor 64
headed system involved the use of parallel, 6 mm (0.25 in) diameter wires. The wires were
bundled together in groups of seven to form tendons. The average effective post-tensioning
force in both directions was 36 kN/m (27 kips/ft). The material properties are discussed
later in this paper. The initial damage was imposed by exploding column D5 (see Figure
3-1 and Figure 3-2). The slab vertical displacement at the top of removed column D5 is
obtained using the average recording of two diagonal potentiometers as described in Sasani
et al. (2007).
3.3 Explicit Modeling of Unbonded PT Parking Garage
The building was symmetric about line 5 (Figure 3-1) and extended beyond line G.
The symmetric floor plan is utilized in the model. The floor beyond line G is not modeled
since the extended portion of the building beyond that line was not considerably affecting
the response after column removal. In order to reduce the analysis time, the floor is divided
into regions with linear and nonlinear material behavior. The linear regions are modeled
by 4-node shell elements while the nonlinear regions are modeled by beam elements. This
is due to the fact that the nonlinearity is modeled using localized fiber plastic hinges (FPH)
which can only be assigned to beam-column elements in the computer program SAP2000
(2009). The surroundings of the removed column as well as the neighboring columns are
the main nonlinear regions. Through an iterative process, the regions that remain linear
elastic are identified and modeled as such. Figure 3-1 shows a zoomed in view of the mesh
layout around the removed column. The geometric nonlinearity is also accounted for in the
analysis.
The beams are modeled using Bernoulli beam elements with localized nonlinear
FPHs at the center of the elements. The hinges account for the interaction between the
moment and axial forces and the corresponding deformations in the section. Given the
refined model and the short lengths of the beams with respect to the floor spans, the plastic

Chapter 3: Progressive collapse evaluation of post-tensioned floor 65
hinge length is set equal to the element length. In this computer program (SAP2000, 2009)
the force-deformation relationship of a FPH is not rigid-plastic but rather elastic-plastic.
This leads to an error of double counting the flexibility of the beam element. Therefore,
the portion of the beam elements represented by FPH is considered axially and flexurally
rigid (Sasani et al., 2011). Ten integration points are used over the depth of the section.
The shear area of the beam elements is set equal to the slab cross-section but the torsional
stiffness is half of the slab cross-section because of the change in shear flow in the
continuous slab as compared with that of beams (Hambly, 1991). The torsional stiffness of
the beam elements are calculated based on Roark's formulation (Young and Budynas,
2002).
The post-tensioning tendons are modeled explicitly. The model can be used for both
unbonded and bonded slabs. Unbonded tendons are modeled such that they are free to slide
horizontally with respect to the slab. That is, the relative vertical displacement of the tendon
with respect to the slab is neglected. The tendons are modeled as truss elements which are
connected to the slab (beam and shell) elements (see Figure 3-3). The connection between
the truss and slab elements is through link elements (Wilson and Habibullah, 2000). A Link
element constrains the displacement of a node on the truss to the corresponding node of
the slab element (beam or shell). For unbonded tendons, all degrees of freedoms except the
horizontal component of the link elements, which is parallel to the tendon line, are rigid.
The post-tensioning force for the truss elements are then calculated and applied by reducing
the temperature of the truss elements.
The top portion of the exploded column was not damaged after column removal
(see Figure 3-4a). In addition, the reinforcing bars of the lower half of the column survived
the explosion with some residual lateral deformation. To account for the resistance from
the remaining column rebars after explosion, they are explicitly modeled. Figure 4b shows
the analytical model for the rebars and the top portion of the column. Two perpendicular

Chapter 3: Progressive collapse evaluation of post-tensioned floor 66
rigid elements constrain the displacement of the top of the rebars to the bottom of the
remained column (Figure 3-4b) (Sasani and Sagiroglu, 2010). Due to the symmetry of the
plan in X direction (see Figure 3-1) only half of the model shown in Fig. 4b is used. The
longitudinal reinforcement of the column was 8 Φ25 mm (#8) bars. These bars are modeled
as 4 lumped nonlinear beam elements.
In order to remove the column dynamically, first, its reactions under gravity loads
and post-tensioning effects are found. Then the column is removed from the model and
replaced with its reactions. The results of analysis under the gravity loads and post-
tensioning effects are identical for the two models with and without the column. Then,
forces opposite to the reactions are applied in 2 milliseconds (Sasani and Sagiroglu, 2008)
and a nonlinear dynamic analysis is performed.
The average damping ratio in the first mode of vibration based on the recorded
vertical motion of the floor is found (Chopra, 2000), which is about 0.03. A Mass-
proportional damping is used in the model. In addition, numerical damping is used to
dissipate the effects of higher modes of vibration and improve numerical convergence.
Material properties
Due to some issues with concrete sampling from the parking garage floor, the
compressive strength of concrete is not known experimentally. A concrete sample obtained
from the first floor of the main structure surrounded by the garage suggested a concrete
compressive strength of 32 MPa (4.6 ksi), which is used in this study. This uncertainty is
discussed later in the paper. A linear post-peak compressive softening is considered up to
a strain of 0.006, with no residual strength beyond this point. The modulus of rupture
calculated based on the ACI 318-11 recommendation of 0.62 ′ MPa (7.5 ′ ksi) is
found to be 3.5 MPa (0.5 ksi). A linear tensile post-peak softening is considered up to
maximum tensile strain of 3 (Sinha et al., 1964; Bahn and Hsu, 1998) with no residual

Chapter 3: Progressive collapse evaluation of post-tensioned floor 67
tensile strength beyond it. This is used for 152 mm (6 in) long beam elements, representing
fracture energy of 104 N/m (7.1 lb/ft), which is in the range of values reported by
Yankelevsky and Reinhardt (1987). The Takeda model is adopted for the hysteretic
behavior of the concrete material. The tendons and the reinforcing bars had yield strengths
of 1700 MPa (250 ksi) and 480 MPa (70 ksi), respectively and modulus of elasticity of
about 200 GPa (29000 ksi).
Initial upward force
The removed column was supporting only one floor. The column explosion caused
an upward motion, with a peak value of 3.7 mm (0.14 in) at 0.019 sec after the column
removal (see Figure 3-5). In order to account for the upward motion soon after column
removal, a dynamic upward force is applied to the structure. Due to the unknown
magnitude and variation over time of the upward dynamic force over time, as a result of
explosion, this force was found by an iterative approach such that the floor displacement
would be consistent with the recorded field data. Consistent with the experimental data, in
the analytical model and during the upward motion, it was assumed that the bars were
deformed outwards, due to the blast effects inside the column. The results show that the
building response is not, however, sensitive to the maximum value of the outward
deformation, which is consistent with the results obtain by Sasani and Sagiroglu (2010).
At the peak upward motion, explicitly modeled column rebars apply about 1245
kN (280 kips) of downward force to the slab at the location of the removed column. This
was expected to help match the sharper slope of the recorded downward motion from about
0.02 sec to 0.04 sec. However, as can be seen in the close-up plot in Figure 3-5, the
analytical results deviate from the field data. Following this initial discrepancy, the
downward displacements obtained from the analysis and the experiment show rather
parallel curves, with the analytical results shifted by about 0.015 sec.

Chapter 3: Progressive collapse evaluation of post-tensioned floor 68
After column removal
The results obtained from the field test and the analytical study show that the
building resisted progressive collapse with the maximum vertical displacements of 92 mm
(3.6 in) and 84 mm (3.3 in), respectively. The permanent vertical displacements of about
61 mm (2.4 in) and 49 mm (1.9 in) were found experimentally and analytically,
respectively. The period of vibration of the analytical model is about 9% larger than that
of the field data, which can be primarily attributed to the discrepancy in estimating the
stiffness of the structure.
3.3.3.1 Slab tendency to grow
Based on the analytical results after column removal, with the increase of the
vertical downward displacement, the tensile stress at the bottom of the slab at the vicinity
of the removed column reaches the concrete modulus of rupture in the weakest sections
under positive moments. Note that before column removal and under the gravity loads, this
region was under negative moment. Since the slab around the removed column had tendons
and reinforcing bars located at the top of the slab sections, after column removal, a larger
portion of the sections including the centerline of the slab (mid-height) experiences
(smeared) tensile strains. Due to this tensile strain at the mid-height of the slab, the slab
tends to elongate or grow horizontally (Fenwick and Megget, 1993; Kim et al., 2004;
Sasani et al., 2011; Keyvani et al., 2014). One indication of the slab in-plane growth is the
relative horizontal movement of columns adjacent to the removed column. The growth
pushes the surrounding columns away from each other. Based on the analytical results and
as shown in Figure 3-6, the total maximum horizontal elongation of the slab along line 5
after column removal is about 0.64 mm (0.025 in). The effects of the slab growth tendency
are described below.

Chapter 3: Progressive collapse evaluation of post-tensioned floor 69
3.3.3.2 Slab membrane forces
The tendency of slab around the removed column to grow is primarily constrained
by the membrane action of the surrounding slab (including tendons) and the lateral stiffness
of the columns. As a result of these constraints, compressive membrane forces develop in
this region, which amplify the post-tensioning compressive forces. The elongation of the
slab increases the surrounding column shear forces. On average, 76% of the additional
compressive membrane forces developed as a result of the slab growth tendency being
constrained in the region with higher flexural demand are in equilibrium primarily with the
tensile membrane forces in the remaining portion of the slab. A 24% increase in column
shear forces also help satisfying the slab in-plane equilibrium (see Figure 3-7).
Figure 3-7 shows the formation of the additional compressive membrane force
normal to section 1-1, shown on Figure 3-1, at the peak vertical displacement. The axial
compressive force in the slab around the removed column increases due to the slab
tendency to grow and the imposed constraint by the structure (primarily the slab in the
surrounding region). In order for the structure to be in equilibrium horizontally, tensile
membrane forces develop in the rest of the slab to resist the additional compressive force
(Dat and Hai, 2013). The enhancement in compressive membrane forces is in general
higher at the locations with higher flexural demands such as the location of the removed
column where the growth tendency is higher compared to the rest of the slab.
Analytical results show a 10% increase in the tendon tensile force on column lines
5 and D at the peak displacement. This is due to the combined effects of geometric
nonlinearity and the slab tendency to grow. Kim et al. (2012) tested three simply supported
two-way slabs with two-way post-tensioning loaded to develop extensive cracks. With the
increase of the vertical displacement and formation of cracks, they also observed an
increase in tendon axial forces. Since the tendons are unbonded, the tendon force depends

Chapter 3: Progressive collapse evaluation of post-tensioned floor 70
on its total elongation. That is, the increase in the tendon force in unbonded tendons is not
localized. Thus, a local failure of an unbonded tendon is less likely in the case of large
deformations (Kim et al., 2012).
3.3.3.3 Gravity load redistribution
After column removal, the slab moment reverses from negative to positive (tension
at the bottom) around the removed column, while the negative moments around the
adjacent columns increase. At the peak displacement, more than half of the gravity load
previously supported by the removed column is transferred in the direction of the shorter
adjacent span to column E5. The percentages of axial force of the removed column that is
transferred to the adjacent columns at the peak vertical displacement after column removal
is given in Table 3-1 Note that due in part to the dynamic nature of the response, at the
peak displacement, the total increase in the axial force of the neighboring column is larger
than the removed column axial force.
Figure 3-8 show the moment diagrams about the global axis X along line 5 (see
Figure 3-2) at the peak and permanent vertical displacements directly obtained from the
computer program SAP 2000 (2009), called the “total” moments, respectively. The total
moment in a PT slab is composed of three parts: the primary moment which is generated
due to tendon eccentricity, the secondary moment which is generated because of the
tendons in indeterminate structures and most importantly, the moment due to gravity
(external) loads (Khan and Williams, 1995).
In the vicinity of all columns, as expected, both the tendons and the reinforcing bars
are located close to the top of the slab sections. As can be seen in Figure 3-8, the slab in
the vicinity of the neighboring columns of the removed column is under a negative moment
(consistent with the locations of the tendons and reinforcement) of about 84.5 kN-m/m
(19.0 kip-ft/ft) at permanent displacement. The slab around the removed column, however,

Chapter 3: Progressive collapse evaluation of post-tensioned floor 71
is under a positive moment of about 44.5 kN-m/m (10.0 kip-ft/ft) at the left face of the
shear cap, causing compressive stress at the top of the slab, where the tendons and
reinforcing bars are placed. That is, the gravity loads and the tendons develop moments in
the same direction (both positive) in the vicinity of the removed column and in opposite
directions (negative and positive, respectively) in the vicinity of the adjacent columns.
Despite the significant difference between the contribution of the reinforcement and
tendons in developing the moments of these two sections, the negative moment at the far
end is only about twice the positive moment. This ratio is even smaller if the positive
moment at the right side of the shear cap is considered. Therefore, the total moment does
not seem to correctly represent the contribution of different sections of the slab in
developing moments and in turn, shear forces to resist the gravity loads.
In order to better understand the gravity load redistribution in the slab after column
removal, the moment due to the gravity loads at the permanent displacement is of interest.
Due to the nonlinearity of the system, a method for estimating the secondary moments is
not readily available. One can, however, calculate the primary moment for each section,
subtract it from the total moment, and find the sum of the secondary moment and the
moment due to gravity loads. This is shown in Figure 3-8 as “Gravity+Secondary”.
The Gravity+Secondary moment at the permanent displacement is about 16 kN-
m/m (3.6 kip-ft/ft) in the slab section at the left face of the shear cap of the removed column.
While the negative Gravity+Secondary moments at the faces of columns E5 and C5 are
about 122 and 127 kN-m/m (27.5 and 28.6 kip-ft/ft), respectively (Figure 3-8). In order to
compare the relative contribution of the positive and negative moments in resisting the
gravity loads, the response of the slab can be analogous to that of a fixed end beam under
gravity loads. Having this analogy in mind, the contribution of the negative moment in
resisting the gravity loads is in fact about 8 times larger than that of the positive moment.
It is important to recognize that the positive Gravity+Secondary moment resistance in the

Chapter 3: Progressive collapse evaluation of post-tensioned floor 72
vicinity of the shear cap (where there is no bottom rebars or tendons) is due to the axial
compressive force developed by the compressive membrane forces caused by the slab
tendency to grow, which was discussed previously.
Column removal without initial upward force
As was explained in the introduction, one of the scenarios suggested in the ALP
method by guidelines such as DoD (2010) and GSA (2013) to evaluated progressive
collapse response of the structures is the instantaneous removal of an entire column.
Therefore, another analysis is carried out in which no upward force (pressure due to the
column explosion) is applied during column removal. The vertical displacement is shown
in Figure 3-5. The results show that the initial upward force due to the explosion did not
have a significant effect on the maximum response of the structure.
3.4 Explicit Bonded PT Modeling
In order to compare the effects of unbonded versus bonded tendons in PT slabs, in
this section the response of the building to a column removal under the assumption of
bonded tendons is analytically evaluated. To model the floor with bonded tendon, link
elements described before, are fully rigid in all DOFs at all nodes. Figure 9 shows the
vertical displacement history at the location of the removed column. The results show
insignificant differences between the two bonded and unbonded analytical models. Unlike
the unbonded model in which the change in tendon axial force is uniform along the slab
and depends on the total elongation of the slab between the anchored ends only, for the
bonded model, the variation of the tendon axial force along the slab is not uniform and
show localized increase in the tendon forces. At the locations where yielding of tendons is
likely, to account for the material nonlinearity in these regions, localized axial plastic
hinges are defined with bilinear force-deformation relationship according to the material
properties. Unlike FPHs, the elastic deformation occurs over the member length and the

Chapter 3: Progressive collapse evaluation of post-tensioned floor 73
plastic behavior occurs in the hinge. Figure 10 shows the change in tendon axial force after
column removal at the peak displacement. The analytical results show that the tendon
yields axially at the locations with larger flexural demands.
Compared to the unbonded model, in the bonded model due to the localization of
the deformation and forces, the tendons are subjected to higher strain at the critical section.
This could potentially lead to tendon fracture and eventually to partial progressive collapse
of the structure. Unlike the local responses, the global responses of the two models are not
significantly different.
3.5 Parametric study of Explicit Unbonded PT slab
In this section the sensitivity of the unbonded PT model to different modeling
parameters such as the torsional stiffness of the grillage, mesh size, presence of live load
and material properties is evaluated.
Mesh size
The analysis was started with a maximum mesh size of about 915 mm (36 in) and
achieved peak vertical displacement of about 76 mm (3 in). The mesh size was reduced to
the smallest reasonable size and the final mesh layout is shown in Fig. 2 which has been
used throughout this paper. The mesh layout is finer around the columns with layout of 152
mm (6 in) and coarser farther away with maximum shell element size of 432 mm (17 in).
The peak vertical displacement increased to 82 mm (3.2 in).
Effect of modulus of rupture of concrete
The modulus of rupture used in the previous sections was based on ACI318-11
(2011) recommendation of 0.62 ′ MPa (7.5 ′ ksi), however other studies show that
modulus of rupture for the normal weight concrete can vary between 0.66 ′ - ′ MPa

Chapter 3: Progressive collapse evaluation of post-tensioned floor 74
(8 - 12 ′ ksi (Nilson et al., 2010). The maximum value of 1 ′ MPa (12 ′ ksi is
used here to examine its effects. Figure 3-11 shows the effect of tensile properties of
concrete on the global response of the structure after column removal compared with the
unbonded model and experimental results. In this model, an increase of about 66% in
modulus of rupture results in 7% reduction in the maximum vertical displacement of the
structure (see Figure 3-11).
Torsional stiffness of grillage
As mentioned before, the torsional stiffness that is used for the grid of beam
elements is set equal to one half of the normal cross section of the slab (Hambly, 1991).
Using full torsional stiffness for the beam elements, shown in Figure 3-11, results in about
15% decrease in vertical displacements at the location of the removed column.
Effect of live load
The load combination DoD (2010) and GSA (2013) is used in this section to study
the structural response in the presence of live load and additional dead load for the explicit
unbonded PT model. This load combination is 1.2(Dead load) + 0.5(Live load). The live
load of parking garages is 1.9 kN/m2 (40 psf) according to ASCE/SEI-7 (2010). The results
show about 90% increase in vertical displacement as a result of 40% increase in the gravity
loads (see Figure 3-11) which is due to the nonlinearity of the system. However, the time
to peak displacement is increased only by 14%.
Effect of compressive strength of concrete
The results reported so far were based on using the concrete compressive strength
of a sample obtained from the first floor of main structure surrounded by the garage. A
second concrete sample obtained from the main structure suggested a concrete compressive
strength of 24 MPa (3.5 ksi). In order to evaluate the floor response with ′ = 24 MPa (3.5

Chapter 3: Progressive collapse evaluation of post-tensioned floor 75
ksi) and its corresponding modulus of elasticity, the explicit unbonded model of the parking
garage is analyzed with the smaller concrete compressive strength. The analytical model
was further modified by increasing the modulus of rupture to 1 ′ MPa (12 ′ ksi ,
which is the upper range according to Nilson et al. (2010). The results of these two analyses
are shown in Figure 3-12. The results suggest that lower concrete compressive strength and
modulus of elasticity with or without a high tensile strength could also capture the vertical
displacement response of the slab reasonably well.
3.6 PT models in SAP2000
The post-tensioning in SAP2000 (2009) can be modeled using template models
with linear behavior as well, which can be used either as equivalent constant force acting
on the structure along the tendon profile or as structural elements. The tendon profile for
both cases is modeled using linear segments, to be consistent with the explicit model
discussed before.
For the equivalent constant force method, the post-tensioning effects of the tendon
are replaced with the horizontal and vertical components of the tendon axial force as
constant forces acting at the boundaries of the beam or shell elements. This method is
mainly meant for models having linear response (Wilson and Habibullah, 2000). The peak
vertical displacement at the location of the removed column modeled using this method is
114 mm (4.5 in) compared to 92 mm (3.6 in) of experimental results. In the explicit model,
the tendons are modeled as elements and therefore increase the degree of indeterminacy of
the structure, which is ignored in the case of model with constant force. Furthermore, since
the force exerted from tendon to the structure is constant in the equivalent constant force
method, the increase in tendon force, which was discussed before, is not accounted for.

Chapter 3: Progressive collapse evaluation of post-tensioned floor 76
The second method, in which tendons are considered as structural elements, gives
questionable results when used in the nonlinear PT slab model. This is in part due to
automatic discretization of the tendons by the program into smaller segments, which cannot
be disabled. An interpolation constraint, then connects the end nodes of each discretized
segment to the nodes of beam and shell elements behaving as bonded tendons. Therefore
tendons cannot be properly modeled as unbonded.

Chapter 3: Progressive collapse evaluation of post-tensioned floor 77
3.7 Tables
Table 3-1 Percentage of axial force of removed column transferred to adjacent columns after column removal at peak vertical displacement
Lines 4 5
C 3% 27%
D 17% NA
E -4% 52%

Chapter 3: Progressive collapse evaluation of post-tensioned floor 78
3.8 Figures
Figure 3-1 Plan view of post-tensioned parking garage

Chapter 3: Progressive collapse evaluation of post-tensioned floor 79
Figure 3-2 Column D5 with shear cap (before removal)
Figure 3-3 A 2D view of PT slab showing tendons connectted to slab axis by link elements

Chapter 3: Progressive collapse evaluation of post-tensioned floor 80
a)
b)
Figure 3-4 a) Exploded column b) Analytical model
Column
Rebars
Undamaged top portion of column

Chapter 3: Progressive collapse evaluation of post-tensioned floor 81
0 0.2 0.4 0.6 0.8 1
Time (sec)
-4
-3
-2
-1
0
1
Ver
tica
l Dis
plac
emen
t (in
)
-100
-75
-50
-25
0
25
(mm
)
ExperimentAnalyticalAnal. w/o upward force
0 0.02 0.04 0.06Time (sec)
-1.2-0.8-0.4
00.4
(in)
-30-20-10010
(mm
)
Figure 3-5 Analytical and experimental vertical displacement of unbonded PT at top of removed column (zoomed-in view of initial upward motion is shown)

Chapter 3: Progressive collapse evaluation of post-tensioned floor 82
0 0.05 0.1 0.15 0.2 0.25
Time (sec)
0
0.01
0.02
0.03
Rel
ativ
e H
oriz
onta
l Dis
plac
emen
t (in
)
0
0.25
0.5
0.75
(mm
)
Figure 3-6 Relative displacement between columns B5 and D5 (slab elongation) along line 5 after column removal

Chapter 3: Progressive collapse evaluation of post-tensioned floor 83
-15
-10
-5
0
5
10
15C
hang
e in
Mem
bran
e F
orce
s (k
ip/f
t)
-210
-140
-70
0
70
140
210
(kN
/m)
G F E D C B A
Tension
Compression
9.75m32'
3.6612'
9.3530'-8"
6.120'
3.2610'-9"
3.2610'-9"
Figure 3-7 Change in membrane force of slab after column removal at peak displacement normal to section 1-1

Chapter 3: Progressive collapse evaluation of post-tensioned floor 84
-40
-20
0
20
Mom
ent a
long
axi
s 5
(kip
-ft/
ft)
E5 D5 C5Rmv'd Col
-180
-90
0
90
(kN
-m/m
)
E5 D5 C5
TotalGravity+Secondary
Rmv'd Cola) b)
Figure 3-8 Moment about global axis X, along line 5 per unit width of slab at a) peak and b) permanent displacements for unbonded PT (dashed lines represent faces of columns
E5 and C5 and shear cap of column D5 )

Chapter 3: Progressive collapse evaluation of post-tensioned floor 85
0 0.2 0.4 0.6 0.8 1
Time (sec)
-4
-3
-2
-1
0
1
Ver
tica
l Dis
plac
emen
t (in
)
-100
-75
-50
-25
0
25
(mm
)
UnbondedBonded
Figure 3-9 Comparison of vertical displacement history of analytical bonded and unbonded PT model
0
4
8
12
16
20
Cha
nge
in T
endo
n fo
rce/
wid
th (
kip/
ft)
0
60
120
180
240
300
(kN
/m)
E5 D5 C5
Figure 3-10 Change in bonded tendon axial force per unit width of slab along line 5 after column removal at peak displacement

Chapter 3: Progressive collapse evaluation of post-tensioned floor 86
0 0.1 0.2 0.3 0.4
Time (sec)
-7
-6
-5
-4
-3
-2
-1
0
1
Ver
tica
l Dis
plac
emen
t (in
)
-175
-150
-125
-100
-75
-50
-25
0
25
(mm
)
Experiment
Analytical (full tor. stif f .)Analytical (f r =1f 'c MPa)
Analytical (1.2D+0.5L)
Figure 3-11 Vertical displacement history at location of removed column for explicit unbonded PT model with different parameters compared to experiment ( ′ = 32 MPa
=4.6 ksi)
0 0.1 0.2 0.3 0.4
Time (sec)
-5
-4
-3
-2
-1
0
1
Ver
tica
l Dis
plac
emen
t (in
)
-125
-100
-75
-50
-25
0
25
(mm
)
ExperimentAnalytical (f 'c=24MPa)Analytical (f 'c=24 & f r=1f 'c MPa)
Figure 3-12 Vertical displacement history at the location of removed column for explicit unbonded PT model compared to experiment ( ′ = 24 MPa = 3.5 ksi)

Chapter 4 Progressive collapse resistance of RC flat plate floors
This chapter is a reprint of the following article with slight modifications
Keyvani, L., Sasani, M., and Mirzaei, Y., (2014). "Compressive membrane action in progressive collapse resistance of RC flat plates," Eng. Struct., 59, 554-564.
4.1 Introduction
Since 1921, researchers have reported an increase in the ultimate load carrying
capacity of laterally restrained slabs on a single column or flat plate structures than that of
Isolated and Simply Supported (ISS) slabs (Westgaard and Slater, 1921; Ockleston, 1955;
Ockleston, 1958; Park, 1964; Criswell, 1974; Hewit and Batchelor, 1975; Vecchio and
Tang, 1990; Salim and Sebastian, 2003; Jahangir Alam et al., 2009). The compressive
membrane action in the slab is known to contribute to the enhancement of punching
strength and load carrying capacity, which in turn can help prevent or limit progressive
collapse in flat plates (Ockleston, 1958;Vecchio and Tang, 1990; Salim and Sebastian,
2003; Pinho Ramos et al., 2011; Dat and Hai, 2011; Dat and Hai, 2013).
Over the past 50 years, researchers and guidelines have proposed various
analytical/empirical methods to predict the punching strength of flat plate floors (Kinnunen
and Nylander, 1960; Moe, 1961; Hewit and Batchelor, 1975; SIA 262, 2003; EC2, 2004;
Muttoni, 2008; ACI318-11, 2011). The majority of these methods were based on the
experimental results of ISS slabs that did not properly represent the boundary conditions

Chapter 4: Progressive collapse resistance of RC slabs 88
of slabs such as those conducted by Mirzaei and Muttoni (2008) (Moe, 1961; Hewit and
Batchelor, 1975; Vecchio and Tang, 1990; Salim and Sebastian, 2003; Jahangir Alam et
al., 2009). Thus, predicting the punching shear strength of flat plates based on the behavior
of ISS slabs underestimates the ultimate load carrying capacity of floor systems and/or
laterally restrained isolated slabs (Criswell, 1974).
Despite the studies on the finite element modeling of punching failure in flat plate
and slab structures (Loo and Guan, 1997; Vidosa et al., 1988; Polak, 1998; Megally and
Ghali, 2000; Wang and Teng, 2008), the progressive collapse potential of RC flat plates
following punching is rarely investigated using Finite Element Methods (FEMs). This is
due to the complexity of modeling punching failure, including the effects of the
compressive membrane forces and dowel action on the punching shear strength. In the first
section of the present study, a new technique is developed to explicitly simulate the
punching failure of an isolated slab-column specimen. The effects of dowel action, critical
shear crack formation, critical shear crack widening during punching, and post-punching
response are investigated. The results are compared with the available experimental results.
The effects of the boundary conditions on the punching strength of the isolated slab-column
specimen are then numerically investigated by improving the proposed technique. In the
second section, the system-level response after a column loss of an RC flat plate floor
system with and without the effects of membrane forces is presented.
4.2 Punching failure in flat plates
Under monotonically increasing load, tangential flexural cracks form around
columns (ASCE-ACI committee 426, 1974; Muttoni, 2008). The propagation of the
flexural cracks in the slab in combination with shear cracks forms a diagonal critical shear
crack. After the formation of the shear crack, and prior to punching shear failure, aggregate
interlocking and dowel action are the main shear transfer mechanisms from the slab to the

Chapter 4: Progressive collapse resistance of RC slabs 89
column (Muttoni 2008). Once the shear crack crosses the bottom reinforcement,
reinforcing bars contribute to the shear transfer by dowel action. A truncated punching
cone around the column forms as the column punches through the slab (see Figure 4-1).
The punching shear failure occurs with very little warning. After punching shear failure,
the only connection between the slab and the truncated cone is the flexural and integrity
reinforcement, in the absence of shear reinforcement. Note that the slab bottom
reinforcement passing directly over the column is called the integrity reinforcement, which
may be under compressive stress before punching failure. Slabs with only top
reinforcement at the location of the column have little post-punching strength and
deformation capacity to redistribute the load from the damaged column to the adjacent
columns (Mitchell and Cook, 1984; Habibi et al., 2012). The top flexural reinforcement
tends to break the concrete cover and tear out as the slab moves downwards with respect
to the column. According to ACI 318-11, Section 13.3.8.5, at least two integrity (bottom)
reinforcing bars, which are continuous through the column and well anchored at the
supports, are required to increase the redundancy, ductility, and integrity of two-way slabs.
The integrity reinforcement will act in a hammock-like fashion to prevent the slab from
falling down and triggering a progressive collapse (Knoll and Vogel, 2009). After
punching, the integrity reinforcing bars can almost recover the pre-punching strength of
the slab if sufficient integrity reinforcing bars are used (Mirzaei and Muttoni, 2008).
Three failure zones can be defined during punching failure of the slabs with
integrity reinforcing bars (Figure 4-1). As the column punches through the slab, the tensile
reinforcement tears out of the concrete slab in zone 1 causing concrete spalling, and the
integrity and tensile reinforcing bars break concrete in zones 2 and 3 . When the thickness
of the concrete is enough to prevent the breakouts of zones 2 and 3, concrete failure stops
(Mirzaei, 2010).

Chapter 4: Progressive collapse resistance of RC slabs 90
4.3 Experimental and analytical response of isolated and simply-
supported (ISS) slab
A large number of experiments have been conducted to study the punching shear
strength over the past decades. The dimensions of most of the specimens were bounded by
the lines of contraflexure at a radial distance of about 0.22L from the supports, where L is
the center-to-center span of the slab. ISS slabs are individual panels with the dimensions
discussed above and no restraints against lateral (in-plane) movement around the edges.
One of the specimens tested by Mirzaei and Muttoni (2008) was chosen for the numerical
simulation in this section. The test was carried out on a half-scale, ISS RC slab specimen
(PM-11) under monotonically increasing displacement at the center of the specimen.
Figure 2c, shows a quarter of the test specimen after punching. The specimen, with
uniformly distributed tensile reinforcement ( 8@60 top), two integrity reinforcing
bars ( 12 in each normal direction, and dimensions of 1.5x1.5x0.125 meters, represented
a slab with 7 m center-to-center spans. The tensile and integrity reinforcing bars were well
anchored at the ends representing the continuity of the top and bottom bars over the entire
span.
Due to the symmetry and to simplify the analysis, a quarter FE model was
developed using Abaqus v.6.9-2 (see Figure 4-2a and Figure 4-2b). Figure 4-2a shows the
final mesh layout of the ISS slab. The finite element mesh used in this study is primarily
determined by considering the following factors: 1) Given that the integrity and tensile
reinforcing bars crossing the punching cone are modeled explicitly and need to attach to
the slab, these reinforcing bars are aligned with the boundary of finite elements and the
slab nodes; 2) A proper number of Slab-Cone Connectors (SCCs) connecting the nodes on
the mid-height of the slab to the corresponding nodes on the mid-height of the cone, is
required to model the slab punching strength; and 3) The state of stress and strain in the

Chapter 4: Progressive collapse resistance of RC slabs 91
slab need to be reliably represented. The results of a sensitivity study demonstrated that
increasing the number of Slab-Cone Connectors by a factor of two and the number of
elements by a factor of four leads to less than 1% change in the punching strength of the
slab and the vertical displacement at which punching occurs. Furthermore, the post-
punching response of the slab changes insignificantly as a result of increasing the number
of elements. Therefore, the finite element mesh presented in Figure 4-2a is considered
reliable. S4R general-purpose shell elements with quadrilateral finite-membrane-strain
were used for the slab. An explicit time integration method was used to perform a nonlinear
displacement-controlled quasi-static analysis which was compared with the experimental
results.
Material Properties
The tensile and cylindrical compressive strengths of the concrete were 2.5 MPa and
30 MPa, respectively. The yield and ultimate strengths of reinforcing bars were 548 MPa
and 625 MPa, respectively. The concrete and steel moduli of elasticity were 26 GPa and
200 GPa, respectively.
To account for the material nonlinearity, a quadrilinear stress-strain relationship is
defined for the steel reinforcement with ultimate strain of 0.1. Beyond this strain, the
reinforcing bars fracture. Among available concrete inelastic models in Abaqus, the
Concrete Damaged Plasticity Model (CDPM) was chosen. This model is based on the
scalar plastic damage models proposed by Lubliner et al. (1989) and Lee and Fenves
(1998). Upon crack closure, the compressive stiffness of this concrete model is fully
recovered (Abaqus, 2010). The ratio of initial equi-biaxial compressive yield stress to
initial uniaxial compressive yield stress was considered 1.2 to account for the biaxial state
of stress in the slab elements according to Kupfer and Hilsdorf (1969). The program’s
default values were assigned to the remaining parameters.

Chapter 4: Progressive collapse resistance of RC slabs 92
Modeling of Punching Failure
The punching cone and the integrity and tensile reinforcing bars crossing the critical
shear crack were modeled explicitly to account for the actual separation of the cone and
the contribution of the reinforcing bars to pre and post-punching responses. Figure 2b
shows the explicit reinforcing bars in only one direction, which are fully-anchored at the
ends, consistent with the experimental specimen. The same reinforcing bars are used in the
other normal direction. The flexural reinforcement of shell sections are modeled using
rebar layers. Four types of connectors are shown in Figure 2b which will be introduced in
the following sections.
The punching cone dimensions were estimated using an angle of inclination ( of
30° (see Figure 4-1). The continuity/separation of the slab shell elements for pre- and post-
punching response is modeled by three dimensional Cartesian-Cardan connector elements
with six components of relative motion which connect two arbitrary nodes. The relative
displacements and rotations of the nodes are referred to as components of relative motion.
Constitutive laws can be defined for each component which may include linear, nonlinear
or rigid force-displacement relationships. To connect slab mid-height (centerline) to the
cone mid-height (centerline), a total of eight Cartesian-Cardan connectors with six
uncoupled components of relative motion are used. These connectors are referred to as
Slab-Cone Connectors (SCCs) throughout this manuscript shown in Figure 4-2b. For
simplicity, the flexural contribution of the hatched area on the cone and the slab of the FE
model are neglected.
Hewit and Batchelor (1975) reported a 20% increase in the punching load due to
dowel action. The contribution of the reinforcement was found to be 10-30% in other
literature (Fib bulletin 12, 2001; Long, 1975). In the finite element model used in this paper,
the contribution of dowel action will be accounted for through the explicit modeling of the
reinforcing bars. To start the analysis, however, there is a need to divide the punching

Chapter 4: Progressive collapse resistance of RC slabs 93
strength between the concrete and dowel action. Given the test results reported here, a value
of 15% is assumed, which will be verified after the analysis is conducted. By allocating
15% of the punching strength (Vp) to be provided by the dowel action, 85% of the punching
strength is distributed among the vertical components of the SCCs according to their
tributary areas. Punching shear strength of the ISS slab (specimen PM-11) tested by
Mirzaei and Muttoni (2008) was calculated based on Muttoni’s (2008) method and was
estimated to be 238kN. Based on experiments performed on various specimen sizes,
including half-scale, full scale and even double scale, at about 70% of the punching load,
the critical shear crack opens about 1-1.5 mm (Theodorakopoulosa and Swamy, 2002;
Guandalini 2005; Guandalini, et al., 2009). Therefore, the vertical component of SCCs is
modeled rigid up to 70% of the punching strength, followed by yielding up to 1.25 mm of
vertical deformation and then failure (see Figure 4-3). Note that the crack opening size may
not be valid for all slabs and requires further studies. The plastic deformation of SCCs
represents the critical shear crack opening. As soon as the SCCs fail in shear, all of the
remaining rigid components of SCCs are set free representing the punching shear failure.
Axis-Symmetric Punching Strength
The concrete compressive strength, reinforcement ratio and grade, and slab depth
are the important parameters used in design guidelines and methods to calculate punching
shear strength of slabs (Kinnunen and Nylander, 1960; EC2, 2004; Muttoni, 2008; ACI318-
11, 2011). The first model for estimating punching shear strength was proposed by
Kinnunen and Nylander (1960). Despite providing a complex model, the effect of dowel
action was not included (Hewit and Bachelor, 1975). Recently, Muttoni (2008) proposed a
mechanical model based on critical shear crack theory (Muttoni and Ruiz, 2008; Muttoni,
2008).

Chapter 4: Progressive collapse resistance of RC slabs 94
Muttoni (2008) concluded that the punching shear strength of slabs with low
reinforcement ratio (yielding occurs prior to the punching) is controlled by the flexural
capacity of the slab. Dragosvic and Beukel (1974), however, showed that the effect of
flexural reinforcement ratio on the punching strength of slabs with low reinforcement ratio
was negligible (Sacramento et al., 2012). Formation of yield lines limits the amount of
shear demand on slabs with low reinforcement ratios. So the flexural capacity of the slab
controls the amount of shear demand applied to the slab. Therefore, increasing the
reinforcement ratio increases the transferred shear to the column. Thus, for slabs with low
flexural reinforcement ratio, the punching strength of the slab neither decreases nor
increases by alteration of the reinforcement ratio. Rather, the demand is affected by the
reinforcement ratio. Eventually, with the opening of the critical shear crack, the reinforcing
bars contribute to the punching strength by dowel action and finally the punching occurs.
Dragosvic and Beukel (1974) also showed that for slabs with high reinforcement ratio
(punching occurs prior to flexural yielding) the punching strength remains almost
unchanged with increases of reinforcement ratio. ACI-ASCE Committee 426 (1978)
reported similar results for the relationship between the shear force and reinforcement ratio
of beam elements without shear reinforcement.
Modeling of Post-Punching Response
After punching and in the absence of shear reinforcement, the only connection
between the cone and slab is the slab reinforcement. The explicitly modeled reinforcement
consists of two-node Bernoulli beam elements. Similar to the previous section, reinforcing
bars are connected to the slab or cone by the Cartesian-Cardan connectors which are
referred to as Rebar-Concrete connectors in this manuscript modeling the spalling and
breakout strength of concrete in zones 1-3.

Chapter 4: Progressive collapse resistance of RC slabs 95
Note that, Mirzaei (2010) developed a numerical procedure utilizing Equations (4-
1)-(4-3) to calculate the post-punching strength of more than 30 specimens tested by
Mirzaei and Muttoni (2008). The results of Mirzaei’s (2010) procedure using Equations
(4-1)-(4-3) for calculating the post-punching response of a large number of slabs show
good agreement with the experimental data (Mirzaei, 2010). Because the post-punching
response of a slab depends mainly on Equations (4-1)-(4-3), which have already been
verified by Mirzaei (2010), only one of Mirzaei and Muttoni’s (2008) tests is used in this
study to verify the proposed modeling technique. The concrete breakout and spalling
strength at a specific location can be calculated based on Mirzaei’s (2010) method, using
Equations (4-1)-(4-3). Equations (4-1) and (4-2) estimate spalling and breakout strengths
due to the interaction of tensile reinforcing bar and concrete, while Equation (4-3) estimates
the breakout strength due to the integrity reinforcement.
V _ x 2πc x η f (4-1)
V _ x 2πx tanα x η f (4-2)
V _ x 4 x tan α θ π 2θ sin 2θ η f (4-3)
V _ x is the sum of the vertical components of concrete spalling strength
associated with the tensile bars crossing an imaginary circle with radius x from the
column center at zone 1. x is the radial distance to the punching cone (see Figure 4-2b).
D is the diameter of the original punching cone (see Figure 4-2b) equal to a 2dcotα, a is
the column width, d is the effective depth of the slab andαis the angle of the critical shear
crack with the horizon (see Figure 1). c is the concrete cover, which is equal to the depth
of the spalled concrete.η is a reduction factor equal to 0.4, which is defined in the next
paragraph. f is the tensile strength of concrete. In Equation 4-1, although the concrete
cover is constant, as the diameter of the imaginary circle increases, the overall spalling

Chapter 4: Progressive collapse resistance of RC slabs 96
strength increases. However, because the number of tensile bars crossing the circle also
increases proportionally, the spalling strength of each connector remains constant.
V _ x is the sum of the vertical components of concrete breakout
strength associated with the tensile bars crossing an imaginary circle with radius x
from the column center. x tanα is the depth of the breakout zone. The breakout strength
of zone 2 increases as the breakout zone approaches the column face, at which its
progression stops. In Equations (4-1) and (4-2), the terms multiplied by η f are the
effective areas of spalling and breakout in Zones 1 and 2, respectively
V _ x is the sum of the vertical components of concrete breakout strength
associated with the integrity reinforcing bars passing through the column at distance x
from the face of the column.θ cos , s is the integrity bar spacing, n is the
number of integrity bars passing through the column in one direction, and η 0.6. In
Equation 4-3, the term multiplied by η f is the effective area of breakout in Zone 3,
which is the horizontal projection of the conical failure surface. Although Equation 3 is
based on ACI 349 (2001), unlike ACI 349 (2001)’s equation in which only a maximum
breakout strength is calculated, this equation provides the progressive destruction of the
concrete over reinforcing bars based on the distance to the column face. η and η are the
reduction factors of tensile bars and integrity bars equal to 0.4 and 0.6, respectively adopted
to consider the variation of the tensile stress from a maximum at the edge of reinforcing
bars to a minimum at the surface of the slab. The values of η and η are determined
empirically by Mirzaei (2010); and neither of the equations above depends on material
properties of the reinforcement. Rather, they are a function of the concrete properties over
the reinforcement.

Chapter 4: Progressive collapse resistance of RC slabs 97
Figure 4-2b shows the location of the Integrity Rebar-Concrete Connectors (IRCC)
on the ISS model, connecting a node on the integrity reinforcing bar to a corresponding
node on the slab. The vertical component of all Rebar-Concrete Connectors was rigid up
to the failure. The failure force for each IRCC was calculated by dividing _ by
the number of integrity bars on all sides of the column (8 bars). Tensile-Rebar Concrete
Connectors (TRCCs) connect a node on the tensile reinforcing bar to a corresponding node
on the cone or slab. TRCCs’ breakout and spalling strength were calculated by
dividing _ and by the number of the bars passing the imaginary circle
discussed before.
As the column punches through the slab, a portion of the concrete breaks out in
zones 2, and 3. This size is reported to be approximately eight times the corresponding bar
diameter and have found to be in good agreement with the experimental results (Mirzaei,
2010). The location of the first rebar-concrete connectors, modeling concrete breakout, is
estimated accordingly. The first IRCCs were located eight times the bar diameter away
from the column face (90 mm ≈ 8×12) and the first TRCCs eight times the bar diameter (
60mm ≈ 8×8) from the critical shear crack on each side.
Analytical Results and Discussion
Figure 4-4 compares the column axial force from the analytical and experimental
results of the ISS slab versus slab displacement at the center of the column (slab center
displacement). The analytical results reasonably follow the experimental data. The
maximum analytical punching shear strength was 251 kN at a vertical displacement of 8.4
mm, which was 4.1% larger than the experimental punching strength reported by Mirzaei
and Muttoni (2008). At this displacement, all the SCCs failed in shear and the concrete and
reinforcing bars contributed about 79% and 21% of the punching strength, respectively.

Chapter 4: Progressive collapse resistance of RC slabs 98
After the punching failure occurred, the three additional sudden large drops in the
analytical column axial force (Figure 4-4) are due to the concurrent failure of some IRCCs
and TRCCs. If the model was more refined the analytical curve would be smoother. Figure
4-5 shows the total shear force transferred by the tensile and integrity reinforcing bars from
the slab to the cone. Once the punching failure occurs, there is a sudden increase of about
10 kN in the shear force of integrity reinforcing bars. This is due to the sudden downward
movement of the slab with respect to the column. However, spalling of the concrete cover
right after punching reduced the shear force of the tensile reinforcing bars by about 8 kN.
At the peak post-punching column axial force the integrity and tensile reinforcement’s
contribution in transferring the force from slab to column were 84% and 16%, respectively.
The tensile reinforcing bars were fully anchored in the experiment. However, in slabs
designed in accordance with the detailing requirements of ACI 318-11 Section 13.3.8,
tensile reinforcement would not be continuous over the entire span and would be likely to
tear out of the concrete completely.
The considerable contribution of the integrity reinforcing bars to the post-punching
response of the slab increases the post-punching strength and deformation capacity, which
in turn help redistribute the gravity loads to the adjacent supports after punching. The
failure progression of the IRCCs with the increase of the vertical displacement is shown in
Figure 4-6. The IRCCs closer to the column were weaker compared to those farther away
due to the shallow depth of the breakout concrete (see Figure 4-2b), however, where the
integrity reinforcing bars were supported by the full depth of the slab, the IRCCs had
constant strength independent of their distance to the column.
4.4 Analytical evaluation of isolated and laterally restrained slabs
Under a monotonically increasing load, the formation and propagation of flexural
cracks in the slab sections along with yielding of the longitudinal reinforcing bars reduces

Chapter 4: Progressive collapse resistance of RC slabs 99
the depth of the compressive zone. As a result, the section neutral axis moves away from
the section centerline. Thus, tensile strain, forms at the mid-height of the slab. If the slab
is simply supported, any infinitesimal length of the slab, , will experience an
infinitesimal increase in length . . The total horizontal elongation of the slab,
∆ , due to the formation of flexural cracks is considered as the slab/beam tendency
to grow (Fenwick and Megget, 1993; Kim et al., 2004; Sasani et al., 2011). In actual flat
plate structures under small deflections, this growth tendency is constrained primarily by
the membrane action of the slab in the surrounding area leading to the development of axial
compressive forces in RC floor elements which contributes to the higher punching strength
capacity. In order to investigate the effects of compressive membrane forces on the
punching strength of isolated slabs, the ISS slab studied in the previous section is modified
to have lateral restraints similar to the pinned edge condition and will be referred to as
laterally restrained slab in this paper.
The effect of membrane forces developed in the slab on the SCCs’ shear strength
is accounted for by using a simplified relationship based on a model proposed by Bresler
and Pister (1958). Among the properties available for connectors in Abaqus, frictional
behavior was considered as a proper interaction between the membrane forces and the shear
strength.
Figure 4-7 shows Bresler and Pister’s parabolic failure criteria based on the
response of concrete specimens under combined shear and compression. A linear
relationship between the compressive strength and the shear strength is used to
approximate the parabolic failure criteria. Equation (4-4), which is similar to the Mohr-
Coloumb’s failure theory, relates the friction force of an SCC to the compressive
membrane force of the slab.
, tan , (4-4)

Chapter 4: Progressive collapse resistance of RC slabs 100
, is the total shear strength of the SCCs and tan is the slope of the
simplified linear criteria shown in Figure 4-7, which is equal to the Coulomb’s friction
coefficient. This coefficient is estimated from the experimental data of Bresler and Pister
(1958) and found to be 0.25. N is the axial compressive force in the slab, , is the
concrete shear strength of the SCCs without the effect of membrane forces. tan is
the friction shear as a result of the membrane forces in the slab.
Once the vertical deformation of the SCCs reached 1.25mm (see Figure 4-3), all
six DoFs of the SCCs were set free. It was assumed that the contribution of the
reinforcement to the punching shear by dowel action remains the same, independent of the
effect of lateral restraint (Hewit and Batchelor, 1975).
Analytical Results for laterally restrained Slab
Due to the lack of reliable experimental data, the results of the restrained analytical
model are compared with the results of the ISS analytical model to demonstrate the effect
of compressive membrane forces on punching strength. As was shown in Figure 4-4, the
results of the analytical ISS slab were in good agreement with experimental data. Figure
4-8 shows the column force versus column vertical displacement for the analytical ISS and
laterally restrained slabs. The increase in punching shear strength of the laterally restrained
slab is about 34% compared to that of the ISS slab. As a result of the increased punching
force a larger impact was applied to the system upon punching, causing more damage to
the connectors. So the shear strength of the laterally restrained slab immediately after
punching was about 20kN less than the post-punching strength of the analytical ISS slab.
The additional punching strength is due to the effect of friction shear caused by the
formation of the compressive membrane forces in the slab. In Figure 4-9, the three main
contributors to the punching strength of the slab (concrete, friction shear, and the dowel
action) are compared with the column force. At punching, 20% of the punching strength

Chapter 4: Progressive collapse resistance of RC slabs 101
was provided by the dowel action. The contribution of the reinforcements through dowel
action started at a vertical displacement of 3.8mm, which was after the initiation of plastic
deformation of the SCCs in shear (representing the formation of the shear crack). The
contribution of the friction shear started at the initial stage of loading with the formation of
the membrane forces.
Figure 4-10 shows the friction shear versus slab vertical displacement. With the
increase of vertical displacement and widening of cracks, the compressive membrane
forces in the slab increase until the critical elements around the column experience concrete
crushing. As the crushing propagates in the slab, the flexural and axial strengths of the
critical elements drop which lead to a decrease of the compressive membrane forces, and
in turn the friction shear in the slab. Due to the decrease of friction shear after 3.4mm of
vertical displacement, the total shear force from concrete and friction shear remains almost
constant (see Figure 4-9). Although there are no experimental results for the post-punching
behavior of laterally restrained slabs, the post-punching response is anticipated to be
similar to ISS slabs.
4.5 Progressive collapse in flat plate floor systems
Analytical Models
In a flat plate structure, the degree of lateral restraint of the slab in the vicinity of
the column, where punching shear can occur, is unknown (Hewit and Batchelor, 1975).
Thus, the results of analytical models similar to the laterally restrained slab which have
ideal boundary conditions are not valid for system-level response. The response of two
sixteen-column flat plate structures to a column removal with and without the effects of
compressive membrane forces are evaluated in this section. Figure 4-11 shows the plan
view of the slab and the location of the removed column as well as the explicit reinforcing
bars. As mentioned before, the explicit reinforcing bars will contribute to the post-punching

Chapter 4: Progressive collapse resistance of RC slabs 102
response at the location of the interior columns. The modeling technique presented in the
previous section for punching failure is used to model the interior slab-column connections
only, as they are more susceptible to punching. The final mesh layout was similar to that
of Figure 4-2a. In order for the results to be applicable to a wide range of flat plate
buildings, the slab’s geometry is considered as the average value of the typical flat plate
buildings’ dimensions reported by Mullers (2007). The slab is designed according to ACI
318-11 (2011).
A slab thickness of 0.28m satisfied the two-way shear punching design criteria
under an ultimate load of 15.2 kN/m2, including the slab self-weight. The average live load
is 3.2 kN/m2 and the additional dead load is 1.4 kN/m2. The design shear strength of the
slab including the strength reduction factor of 0.75 is estimated at 748 kN. A live load
reduction factor of 0.59 was used for the design of interior columns and the ultimate
uniform load was 13.1 kN/m2. The interior columns’ ultimate reaction was 722 kN
considering the live load reduction factor, which satisfied the design shear strength.
The slab flexural reinforcement is designed according to the direct design method
(ACI 318-11). The maximum top tensile flexural reinforcement ratio of the column strip is
0.3% and 0.51% in the transverse and longitudinal directions, respectively. For other
locations, the minimum reinforcement ratio satisfied the design requirements. According
to ACI 318-11 Section 13.3.8, top tensile reinforcement is cut at 0.3ln from the face of
support, where ln is the clear span length. The use of two integrity reinforcing bars with a
diameter of 22 mm in both normal directions was calculated according to Equation (4-5)
satisfying provisions of ACI 352.1R-11.
.
∅ (4-5)

Chapter 4: Progressive collapse resistance of RC slabs 103
Asm is the minimum area of the integrity reinforcement in normal directions passing
through the column, wu is the factored uniformly distributed load, fy is the yield strength
of steel, ∅ = 0.9, and ℓ1 and ℓ2 are the center-to-center spans in normal directions.
A dynamic analysis with an explicit time integration method was conducted
considering both material and geometric nonlinearities. The structure was analyzed under
the load combinations suggested by GSA (2013). The reaction of the removed interior
column under the distributed progressive collapse load combination of D + 0.25 L = 9.2
kN/m2 was 510 kN. The column was replaced with its reactions and the structure was
reanalyzed to ensure the likeness of the results under gravity before and after replacing the
column with its reaction. Then, the column reactions were removed in 2 milliseconds,
simulating the removal of a column under explosion (Sasani et al., 2007; Sasani, 2008). In
order to account for the effects of strain rates on material strength, Cowper-Symonds power
law was used. Mass-proportional damping with a damping ratio of 5% in the first mode
was used to dissipate the system’s dynamic energy.
Upon column removal, interior slab-column connections were considered more
vulnerable to punching failure than exterior slab-column connections, due to higher shear
stresses in the slab that generates higher axial forces in the columns. So the three remaining
interior slab-column connections were modeled by the explicit punching simulation
technique presented in this paper. Similarly, SCCs and Rebar-Concrete Connectors
simulated the continuity/separation. Eighty five percent (85%) of the strength was assigned
to the SCCs and the remaining to the dowel action of the explicit bars (see Figure 4-3).
Asymmetric Punching Strength
The flat plate building studied here is not symmetric in plan. A reliable evaluation
of the punching shear strength of asymmetric slabs with unequal span lengths and
reinforcement ratios in two orthogonal directions ( , requires experimental tests

Chapter 4: Progressive collapse resistance of RC slabs 104
conducted on rectangular specimens bounded by the corresponding line of contraflexure in
each direction. For such specimens under monotonically increasing vertical loads, the
longitudinal reinforcement in the two normal directions is likely to yield simultaneously in
tension. Due to the lack of relevant experimental data and methods for such cases, the
punching shear strength of the slab is calculated according to EC2, Equation (4-6). EC2
(2004) defines the shear strength of members without shear reinforcement or material
safety factors as follows:
0.18 1 100 0.1 (4-6)
In which d is the average effective depth of the slab; is the concrete compressive
strength; is the control perimeter at distance 2d from the column face; and are the
reinforcement ratios in the two normal directions; and is the axial stress in the section
as a result of pre-stressing. The Equation provided by EC2 requires a known value of axial
stress/force ( to be used in the Equation such as those developed as a result of
prestressing; however the amount of membrane forces developed in the slab is not a priori.
Therefore, this parameter is set to zero in this paper.
The geometric average of the reinforcement ratios in two orthogonal directions was
0.39% and the punching shear strength of the slab was 790 kN based on Equation (4-6).
Results and Discussions
Slab model without the effect of compressive membrane forces
Figure 4-12a shows the axial forces of the three remaining interior columns after
column removal. All three interior columns punched sequentially. At the beginning, the
majority of the additional shear force, as a result of the column removal, was dynamically
distributed in the transverse (shorter) direction to column B2. Following the punching of

Chapter 4: Progressive collapse resistance of RC slabs 105
column B2, the other two interior columns punched, starting with the closest to the location
of the initial damage. As mentioned before, punching was not modeled for slab connections
of exterior columns. Figure 4-12b shows the vertical displacement of the slab at the location
of the removed and punched interior columns versus time. The maximum slab deformation
was about 350 mm at the location of the removed column. The post-punching load on the
interior punched columns recovered 92% of the original column force under gravity. The
maximum reinforcing bar tensile strain at the bottom of the slab was less than 5% at the
location of the removed column. However, the maximum strain of the explicit integrity
reinforcing bars at the location of column B2 was about 10%, which is near fracture.
The post-punching response of column B2 showed that tensile reinforcing bars
which are not continuous over the span have negligible contribution to the post-punching
strength and tear out of the concrete. Figure 4-13a shows the contribution of the tensile and
integrity reinforcing bars to the post-punching strength of column B2. As shown in Figure
13a, the entire post-punching strength was provided by the integrity reinforcing bars.
Similar results were reported by the experimental results of Habibi et al. (2012). Figure
4-13b shows the vertical displacement profile of the slab, and the explicit integrity
reinforcement after punching. The explicit tensile reinforcing bars were torn out of the
concrete and are not shown in the figure.
Figure 4-14 shows the vertical displacement contours of the slab over time. Due to
the extreme deformations and potential fracture of the integrity reinforcing bars, the slab
response was evaluated considering the effect of compressive membrane forces in the next
section. Similar to the laterally restrained slab model, the effect of membrane forces on the
shear strength was modeled by defining Coulomb-like frictional behavior for the SCCs.
The deformed shape of an interior column, cone, and integrity bars modeled
explicitly is shown in Figure 4-15 after punching.

Chapter 4: Progressive collapse resistance of RC slabs 106
Slab model with effect of compressive membrane forces
Figure 4-16a shows the history of column forces and Figure 4-16b shows the
vertical displacements of the slab at the location of all four interior columns after column
removal. Including the effect of compressive membrane forces in the form of friction shear
increased the punching strength of the slab by 17% compared to the previous model and
none of the columns punched. Criswell (1974) reported 10-12% increase in the shear
strength of a quarter scale nine-panel slab. Criswell estimated the compressive membrane
forces developed in the section and implemented in an equation developed for prestressed
slabs to evaluate the punching strength enhancement of the slab.
The permanent force of column C2 did not change while 88% of the additional
force imposed on the system as a result of the column removal was transferred to columns
B2 and C3. The remaining force was transferred to the external columns. The slab at the
location of the removed column had a permanent vertical displacement of about 60mm.
The membrane forces in the transverse direction per unit length are shown in Figure
16 for axis 2 (see Figure 4-11) at the peak vertical displacement. The increase of vertical
displacement after column removal increased the curvature and the crack widths in the
slab. Consequently, the compressive forces in the slab, especially at the location of column
B2, developed as shown in Figure 4-17. As mentioned before, the slab tendency to grow is
limited by the neighboring portions of the slab resulting in compression in regions under
maximum moments and tension in the other areas. In other words, the compressive
membrane action is primarily in equilibrium with other portions of the slab in tension. The
total compressive membrane force formed in the slab was 1699 kN, of which 97% is in
equilibrium primarily with the tensile membrane forces of the middle strips of the slab and
the remaining 3% by the column shear forces.

Chapter 4: Progressive collapse resistance of RC slabs 107
Figure 4-18 shows the relative horizontal displacement of the slab at the top of
columns B2 and B4 in the transverse direction. The total growth allowed by the system is
about 1.6mm. This indicates that the slab in flat plate structures is not completely restrained
and is allowed to grow. Since the restraining membrane action was provided almost
entirely by the slab itself, none of the columns yielded in shear at the maximum horizontal
displacement.
Calibration factors used in this Chapter, and , are from a half-scale tests which
has been used throughout this manuscript.

Chapter 4: Progressive collapse resistance of RC slabs 108
4.6 Figures
2)
Figure 4-1Truncated punching cone, tensile and integrity reinforcing bars and failure zones of slab, cone and connectors

Chapter 4: Progressive collapse resistance of R
C slabs
109
Figure 4-2 A quarter of ISS slab a) FE mesh; b) four types of connectors: TRCC_Breakout, TRCC_Spalling, IRCCs, SCCs and explicit reinforcing bars in one direction; and c) test specimen of Mirzaei and Muttoni (2008)
288750
65
125
Ø 8 @ 60 mm
288750
Integrity rebar
Tensile rebars
TOPØ 8 @ 60 mm
Critical shear crack
Punching cone
TRCC_Breakout
TRCC_SpallingIRCCSCC
Integrity rebar
-XT
XI
Support
Support
a) b) c)
D/2+XT
Connector Types

Chapter 4: Progressive collapse resistance of RC slabs 110
Figure 4-3 Constitutive law for the vertical force component of SCCs
0 25 50 75 100 125
Slab Center Displacement (mm)
0
100
200
300
Col
umn
Axi
al F
orce
(kN
)
93 k
N
Post-punching
ExperimentalAnalytical
65 k
N
Figure 4-4 Comparison of experimental column force by Mirzaei and Muttoni (2008) and analytical results of ISS slab
0.7 Vp
0.85 Vp
1.25mm Vertical Deformation
Vertical Force

Chapter 4: Progressive collapse resistance of RC slabs 111
0 25 50 75 100 125
Slab Vertical Displacement (mm)
0
100
200
300
Ver
tica
l Com
pone
nt (
kN)
Punching
Integrity barsTensile bars
Figure 4-5 Contribution of integrity and tensile reinforcing bars to vertical shear force transfer from column to slab versus slab center displacement
0 25 50 75 100 125
Slab Center Displacement (mm)
0
4
8
12
16
IRC
C F
orce
(kN
)
Punching
Figure 4-6 IRCCs’ shear force versus column displacement starting from closest ones to column

Chapter 4: Progressive collapse resistance of RC slabs 112
0 0.25 0.5 0.75 1
Axial Stress/f 'c
0
0.05
0.1
0.15
0.2
0.25
She
ar S
tres
s/f'
c
Bresler & PisterSimplif ied
Figure 4-7 Simplified relationship of Bresler and Pister’s (1958) criteria between axial and shear components of SCCs
0 25 50 75 100 125
Slab Center Displacement (mm)
0
100
200
300
Col
umn
Axi
al F
orce
(kN
)
ISSILR
Figure 4-8 Analytical column axial forces of Isolated and Laterally restrained (ILR) slab compared to analytical column axial force of ISS slab

Chapter 4: Progressive collapse resistance of RC slabs 113
0 5 10 15
Slab Cener Displacement (mm)
0
100
200
300
For
ce (
kN)
Dowel Action
Friction Shear
Concrete+FrictionColumn
Concrete
Figure 4-9 Comparison between column axial force, concrete contribution with and without effect of friction
0 5 10 15
Slab Center Displacement (mm)
0
-40
-80
-120
Fri
ctio
n S
hear
For
ce (
kN)
Figure 4-10 Friction shear force of SCCs versus slab center displacement

Chapter 4: Progressive collapse resistance of RC slabs 114
Figure 4-11 Plan and explicit tensile and integrity reinforcing bars at location of interior columns
a)
0 0.2 0.4 0.6 0.8Time (sec)
0
-200
-400
-600
-800
Col
umn
forc
e (k
N)
Column B2
Column C3Column C2
b)
0 0.2 0.4 0.6 0.8Time (sec)
-400
-300
-200
-100
0
Ver
tica
l Dis
plac
emen
t (m
m) Exploded (B3)
Figure 4-12 a) Interior column axial forces vs time; and b) time history of vertical displacement
A B C D
1
2
3
4
8000 8000 8000 1000
1000
6000
600
060
00
IntegrityØ22
280
TensileØ12@150
TensileØ16@150
Cone
Ø16@150Ø12@150
Ø12@200
Shear crack
300

Chapter 4: Progressive collapse resistance of RC slabs 115
a)
0 0.2 0.4 0.6 0.
Time (sec)
0
200
400
600
800
Ver
tica
l She
ar F
orce
(kN
)
Tensile RebarIntegrity Rebar
b)
Figure 4-13 a) History of contribution of integrity and tensile reinforcing bars to vertical shear forces transferred from column to slab; and b) transverse profile of vertical
displacement of slab at peak displacement
Figure 4-14 Vertical displacement of slab a) under gravity; b) at t= 0.3; and c) final deformed shape
a)
b)
c)
0 4 8 12 16 20
Axis B (m)
Cone
Col. B2 Exploded (B3)
Integrity Rebar
350 mm
Δ= 20 mm -20 -80 -150 -250 -350

Chapter 4: Progressive collapse resistance of RC slabs 116
Figure 4-15 Cone, slab and integrity bars after punching modeled explicitly
a)
0 0.2 0.4 0.6 0.8
Time (sec)
0
-200
-400
-600
-800
-1000
Col
umn
forc
e (k
N)
Column B2
Column C3Column C2
b)
0 0.2 0.4 0.6 0.8
Time (sec)
-80
-60
-40
-20
0
Ver
tica
l Dis
plac
emen
t (m
m)
Column B2
Column C3Column C2
Exploded (B3)
Figure 4-16 History of interior columns’ a) axial forces; and b) vertical displacement with effect of compressive membrane forces
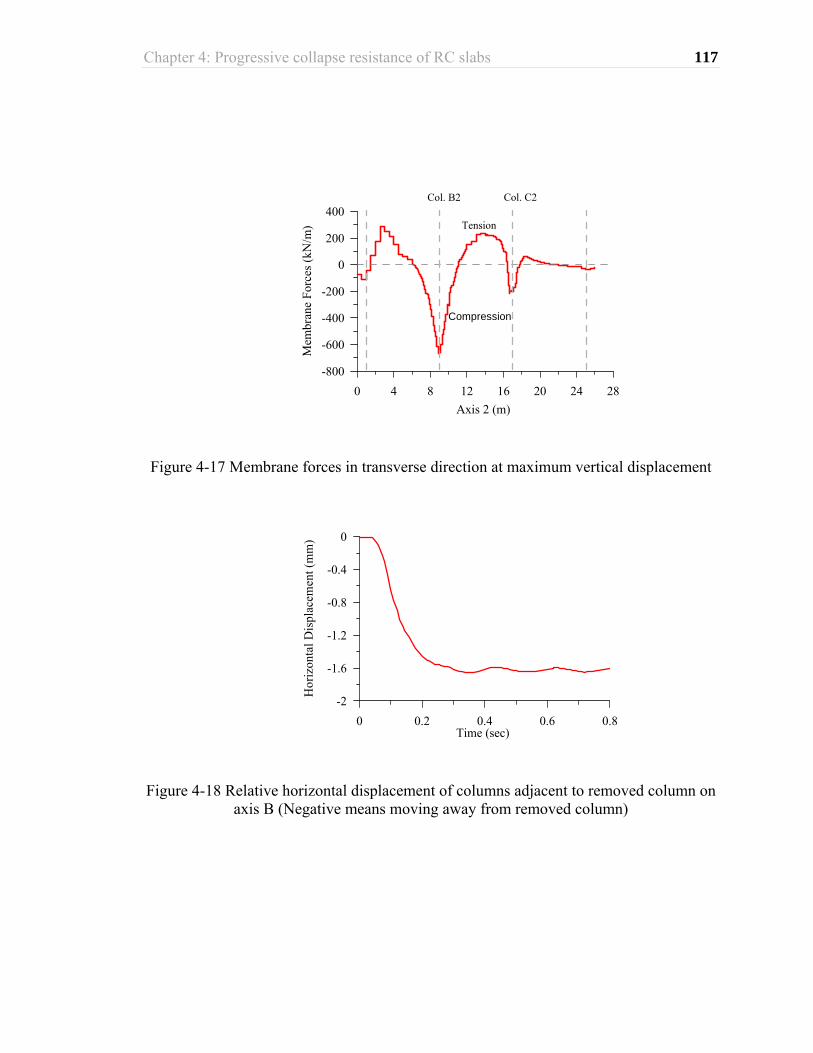
Chapter 4: Progressive collapse resistance of RC slabs 117
Figure 4-17 Membrane forces in transverse direction at maximum vertical displacement
0 0.2 0.4 0.6 0.8Time (sec)
-2
-1.6
-1.2
-0.8
-0.4
0
Hor
izon
tal D
ispl
acem
ent (
mm
)
Figure 4-18 Relative horizontal displacement of columns adjacent to removed column on axis B (Negative means moving away from removed column)
0 4 8 12 16 20 24 28
Axis 2 (m)
-800
-600
-400
-200
0
200
400
Mem
bran
e F
orce
s (k
N/m
)
Col. B2 Col. C2
Tension
Compression

Chapter 5 Post-punching response of a flat plate designed based on ACI 318-11
5.1 Introduction
ACI 318-11 “Standard Building Code Requirements for Structural Concrete and
Commentary” has integrity steel requirements with the objective of increasing the overall
continuity and redundancy of structures. These requirements do not involve any specific
loading or analysis. Rather they require minor changes in the reinforcement detailing of
structures to improve their integrity. Section 13.3.8.5 for two-way slabs, requires two
bottom bars pass through column core and anchored at the exterior supports in order to
maintain integrity of the structure after a punching failure by citing the study done by
Mitchell and Cook (1984) in the commentary without any requirements for bar diameter.
Experimental results of Mitchell and Cook (1984), Melo and Regan (1998), Mirzaei
and Muttoni (2008), Habibi et al. (2012) and our analyses from Chapter 4, showed that the
continuous bottom bars play a significant role after punching failure compared to the top
non-continuous bars. Mitchel and Cook (1984), Melo and Regan (1998), and Mitchell
(1990) suggest a minimum bar area for bottom/integrity bars based on the experimental
results to increase the integrity of the system by providing some residual strength in case
of a punching shear failure. Guidelines other than ACI 318-11 adopted their
recommendation as the minimum requirement for the integrity of flat plate structures.
Our main focus in this chapter is on the post-punching response of a flat plate floor
designed and detailed based on ACI 318-11. A brief summary of the explicit modeling
technique developed in Chapter 4 to evaluate punching and post-punching response of a

Chapter 5: Post-punching response of a flat plate 119
flat plate floor is introduced. The modeling technique mentioned earlier is not efficient both
time and effort wise for the purpose of this chapter. Thus, an alternative simple FE model
is introduced with reasonable accuracy compared to that of Chapter 4. Then, the flat plate
floor designed based on ACI318-11 is analytically evaluated at the system-level following
punching failure of an over loaded interior column.
5.2 Integrity requirements of other guidelines
ACI 352.1R-11 “Guide for Design of Slab-Column Connections in Monolithic
Concrete Structures” specifies minimum area for integrity bars passing through column to
increase the resistance of the structural system to progressive collapse. It requires that “at
interior connections, bottom reinforcement in each direction passing through column cage
have a minimum area of”:
. (5-1)
In which, Asm is the minimum area of the integrity reinforcement in normal
directions passing through the column, is the factored uniformly distributed load, fy is
the yield strength of steel, = 0.9, and ℓ1 and ℓ2 are the center-to-center spans in normal
directions.
Canadian standard for “Design of concrete structures for buildings” (CSA A23.3)
section 13.10.6.1 requires that “The summation of the area of bottom reinforcement
connecting the slab, drop panel, or slab band to the column or column capital on all faces
of the periphery of the column or column capital shall be:”
∑ 2 / (5-2)
The number of bar should be at least two extended through the column core in each
span direction. In which, is the shear force transmitted by rebars from slab to column,

Chapter 5: Post-punching response of a flat plate 120
is the yield strength of the rebars. This requirement was added to the code following
study of Mitchell and Cook (1984).
5.3 Previous studies on integrity of flat plates
Hawkins and Mitchell (1979) evaluated failures that can lead to progressive
collapse in flat plate structures. Punching failure of an overloaded column without bottom
bars (Figure 5-1) was found to be one that leads to brittle failures.
Mitchell and Cook (1984) reported the importance of continuous integrity bars in
preventing progressive collapse following punching failure. A number of a-quarter scaled
four-panel flat plate structures were designed and detailed according to ACI 318-77 at
McGill University. Since ACI 318-77 had no minimum bar area requirements, the size of
the bottom bars, however, were increased to help improve the post-punching strength. A
corner panel was overloaded with a 9-point load until bottom bars fracture at the corner
column. They proposed a simple equation (Eq 5-1), which was later adopted by ACI
352.1R, to help slab hang off the column and resist progressive collapse of overloaded slab
panels. The equation is valid up to a vertical deflection of 0.15ln. Since the majority of
failures for flat plates have happened during construction, used for the estimation of the
minimum area of integrity bar was considered not be less than twice the slab dead load.
They concluded for instance, the area of bottom bars required for a center column to have
the minimum post-punching strength ( 2 at about 60 mm deflection
after punching is 2 Φ 15 bars for a 4 m span flat plate structure.
Mitchell (1993) recommended a simplified form of the equation suggested by
Mitchell and Cook (1984) by replacing in (5-1) with Vs :
2 / (5-3)

Chapter 5: Post-punching response of a flat plate 121
Where, is the total area of the continuous bottom steel passing through column
cage at all sides of the column, is the likely shear due to the service load on the slab
column joint, is the strength reduction factor of 0.9 for tension, and is the specified
yield strength of the bars.
Melo and Regan (1998) ran three sets of post-punching tests. The first set was
conducted up to about 50 mm (about half of the slab thickness) vertical displacement in
which no bar fracture was observed. Steel bars had a large rupture strain of about 0.2. The
majority of the bottom bars passing through column were 6 or 8 mm in diameter. The
failure mode was dominated by concrete breakout strength for these tests. They found a
good agreement between the resistance estimated by ACI 349 (2001) “Code for nuclear
safety related structures” for concrete acting against integrity bar and the experimental data
of first set that was limited to the destruction of concrete above the bars (Eq 5-4 through 5-
6).
(5-4)
Where is the horizontal projection of the conical surface (Figure 5-2), and
is the average tensile stress in the concrete equal to 0.33 (MPa). For an isolated bar
they found
. (5-5)
A modification is applied for more than one bar to account for overlap of bars at a
spacing (s) < 2d (see Figure 5-2 for double bars).
. (5-6)

Chapter 5: Post-punching response of a flat plate 122
Where, , cos ; s is the spacing of integrity
bars, d is the effective depth, is the concrete compressive strength.
For the second set, each test was conducted until the ultimate post-punching
strength was reached by fracture of integrity bars. They observed bar fracture for integrity
bar diameters less than equal 12 mm provided that the bars have enough anchorage. For
steels with rupture strain of about 0.2, the maximum strength governed by fracture was
estimated as:
Vpp-f = 0.44∑ (5-7)
In which, is the ultimate strength of steel, is the cross section of one integrity
bar and 0.44 is the sinus of angle of bar at failure which was found by experiment (26o).
For unknown values of ultimate tensile strength they proposed =1.15fy and the equation
becomes:
V pp-f = 0.5∑ (5-8)
The third series was conducted by using large diameter bottom bars and the tests
were continued until the bars fractured, in order to evaluate the potential of crushing of
column concrete where the bars were connected. For larger bar diameters 16 and 20 (mm),
no concrete crushing was observed at the time of bar fracture (Melo and Regan, 1998).
Mirzaei and Muttoni (2008) summarized the results of an experimental campaign
carried out at Ecole Polytechnique Federale de Lausanne on post-punching behavior of 24,
half-scaled RC flap plate panels with single column of 130x130 mm. The thickness of all
the slabs were 125 mm. The specimens were mixture of panels with cold-rolled or hot-
rolled steel, straight or bent-up integrity reinforcement, different concrete strength and steel

Chapter 5: Post-punching response of a flat plate 123
diameters to study the effect of different parameters on the post-punching response. They
observed some bar fractures as it is summarized by Fernandez Ruiz et al. (2013).
Mirzaei (2010) developed a numerical procedure based on ACI 349 (2001)
equation (5-4 to 5-6) to calculate the post-punching strength of more than 30 specimens
including those tested by Mirzaei and Muttoni (2008). He expanded the equation such that
the progressive destruction of the concrete over the bars can also be estimated with respect
to the vertical displacement. He then, estimated the post-punching strength of slab-column
connections and verified based on the experiment
Habibi et al. (2012) tested seven interior slab-column specimens against punching
failure detailed according to the integrity requirements of CSA A23.3 to investigate the
efficiency of the integrity requirements. No bar fracture was observed after punching while
the test was continued after punching up to about 200 mm vertical displacement. They
concluded that the integrity requirements of CSA A23.3 standard gives the slab enough
post-punching resistance and deformation capability.
5.4 Explicit modeling method (Chapter 3Chapter 4)
In Chapter 4Chapter 3, post-punching response of a flat plate floor following a
column removal is investigated by explicitly modeling the failure progression of concrete
at discrete locations. The interaction of reinforcement and concrete during post-punching
phase is modeled using connector elements at discrete location. By means of the
connectors, the separation of reinforcement from slab and failure of concrete
(breakout/spall) is modeled after punching. The strength of concrete at those locations were
estimated by Mirzaei’s (2010) equations. However, due to high number of connector
elements and details used in the model, the analysis and modeling was costly in terms of
time and effort spent. Therefore, in the following sections an alternative and simple
modeling method is introduced such that the analysis and modeling process would be

Chapter 5: Post-punching response of a flat plate 124
expedited with reasonable accuracy and simple model to capture punching and post-
punching response of flat plates.
5.5 Simple method for modeling punching failure
In this method, the slab is modeled using nonlinear shell elements. A connector
connects the top of the column to its corresponding node on the slab. The punching strength
of the slab-column connections are estimated using EC2 (2004) and the post-punching
response is estimated using the numerical procedure developed by Mirzaei (2010). Based
on the estimated punching and post-punching strength, the force-deformation relationship
of the connector is defined in the FE model and the system-level response following a
punching failure is investigated. To validate the results, the flat plate floor of Chapter 4 is
remodeled using this method and the column removal scenario is repeated. Detailed
explanation of the procedure is presented in the following sections.
Estimation of punching strength: EC2 (2004)
Similar to section 4.5.2, EC2’s equation (Eq. 5-9) is used to estimate the punching
strength of the slab-column connection. The increase in punching strength due to
membrane actions, wherever needed, will be added as a percentage based on the finding of
Chapter 4.
0.18 1 100 ′ 0.1 (5-9)
In which d is the average effective depth of the slab; ′ is the concrete compressive
strength; is the control perimeter at distance 2d from the column face; and are the

Chapter 5: Post-punching response of a flat plate 125
reinforcement ratios in the two normal directions; and is the axial stress in the section
as a result of pre-stressing.
Estimation of post-punching strength: Mirzaei (2010)
After punching, the only connections between the slab and the column are the
reinforcing bars (Figure 5-3). As a result of the slab deformation with respect to the column,
concrete failures occur on the slab and cone sides and propagate along the reinforcing bars.
The maximum shear transferred by the reinforcing bars is equal to the spalling and breakout
strength of slab concrete.
In this section, first the shear force transferred from slab to column through
reinforcement is calculated. Then the spalling and breakout strength of concrete
(reinforcement-concrete interaction) mentioned in Chapter 4 is summarized.
5.5.2.1 Shear transfer through reinforcing bars
The post-punching strength of a slab is the sum of the contributions of the tensile
and integrity bars to the vertical load carrying capacity of the slab as shown in Figure 5-3a.
This is given in the following equation
Vp-p = VT + VI (5-10)
In which, Vp-p is the post-punching strength of the slab-column connection, VI is
the shear transfer through all the integrity bars passing through column core that is in
equilibrium with the breakout strength and VT is the shear transfer through all the tensile
bars crossing the punching cone and active in shear transfer that is in equilibrium with the
spalling strength of concrete.

Chapter 5: Post-punching response of a flat plate 126
Elasticdeformation
As shown in Figure 5-3b, after punching and having (vertical displacement with
respect to column) and (the free length of the bars measured from the face of the column),
the elastic deformation of bars is assumed to be a cubic function of
(Mirzaei, 2010). Mirzaei (2010) derived the following equations for the contribution
of one integrity or tensile bar to shear transfer.
/ (5-11)
In which, 1 1, , / and
127 /Φ / (Soroushian et al., 1986). Ab is the reinforcement cross-section area for
one bar, Es, modulus of Elasticity, Ib second moment of inertia,Φ reinforcement diameter
and the slope of bar.
L, the free length of the tensile and integrity bars are shown in Figure 5-3a. For
integrity bars L . and for tensile bars is defined later.
Plastichingeformation
Mirzaei (2010) reported the formation of plastic hinges in the reinforcing bars at
the face of the crack due to combination of flexural, shear and axial deformations during
experiment shown in Figure 5-3c. During this phase, the above mentioned equations are
no longer valid and the shear contribution of the bars can be found using the following
equations (Millard and Johnson, 1984; Mirzaei, 2010).
/ 1 (5-12)

Chapter 5: Post-punching response of a flat plate 127
Where, , 1, .
After calculating the vertical component of the force transferred by one integrity or
tensile bar, VT is the sum of V(I/T)i for the tensile bars that are crossing the punching cone.
The number of tensile bars (i) crossing the cone can be found as:
i(tensile)= ∗ 4 (5-13)
As concrete breakouts occur on the cone side, the number of tensile bars that
contribute to the shear transfer decreases. The tensile bars that remain and contribute at the
end are those passing through the column core.
VT is the sum of V(I/T)i on all sides for all the integrity bars that pass through the
column.
i(integrity)= number of bar passing through the column *2 (5-14)
CalculationofL:freelengthoftensilebars
To find the vertical component of the force in the tensile bars, Mirzaei (2010)
describes the free length of the reinforcing bars as: L= p + q
In which, p is the extent of damage in the cone and q is the extent of damage in the
slab (Figure 5-4) measured from the shear crack. For tensile bar p and q are related as
described in the following equation:
2 2 . cot
2 2 . cot (5-15)

Chapter 5: Post-punching response of a flat plate 128
All the parameters are discussed before. The progressive failure of the cone
concrete at the bottom of tensile bars on the cone side will stop at the face of the column.
That is, p is limited to dcot(α).
5.5.2.2 Reinforcement-concrete interaction (concrete spalling and breakout)
After punching, three types of damage/failures are expected while the slab is
deforming downwards with respect to the column. Two of them, as discussed in Chapter
4, are concrete failures due to the interaction of the concrete and reinforcement (top and
bottom bars) and the third one is the failure of reinforcing bars.
As shown in Figure 4-1, the thin layer of concrete cover gradually spalls off after
punching (failure type 1, zone 1) and tensile bars tear out of concrete on the slab side. At
the locations where a thick layer of concrete is acting against the reinforcing bar (concrete
on top of integrity bars and concrete below the tensile bars on the cone side) concrete
breakouts occurs (failure type 2, zones 2 and 3) (Mirzaei, 2010).
Concretebreakoutstrength(Integritybar‐concreteinteraction)
The vertical component of tensile strength of slab concrete above the integrity bars
limits the maximum amount of force applied from the bar to the concrete (Mirzaei, 2010).
As mentioned before Mirzaei (2010) expanded ACI 349 (2001) equation to estimate the
failure propagation and concrete breakout strength. A conical failure surface develops
above integrity reinforcement (concrete breakout) during post-punching phase. Thus
strength of concrete in interaction with integrity bars is multiplication of projected area of
conical failure surface and the effective tensile strength as mentioned in Chapter 4 and
repeated here (Eq.5-4).
V 4 tanα θ π 2θ sin 2θ η f (5-15)

Chapter 5: Post-punching response of a flat plate 129
V is the sum of the vertical components of concrete breakout strength
associated with the integrity reinforcing bars passing through the column at distance
x from the face of the column (Figure 5-5).θ cos , s is the integrity bar
spacing, n is the number of integrity bars passing through the column in one direction, and
η 0.6. f is the tensile strength of the concrete.
Concretespallingstrength(Tensilebar‐slabinteraction)
Spalling strength is the sum of the concrete tensile stresses acting on a
circumferential ring of concrete cover outside of the cone that act against the mesh of
tensile reinforcement located close to the top of the slab (Figure 5-4). The following
equations determine the spalling strength of concrete cover (Mirzaei, 2010). A simplified
version was used in Chapter 4.
2 . cot
2 . cot (5-16)
V is the sum of the vertical components of concrete spalling strength
associated with the tensile bars crossing an imaginary circle with radius from the
column center at zone 1. Where q is the distance from the shear crack away from column,
c is the concrete cover, D= a 2dcotα; a is the column width, d is the effective depth of the
slab andαis the angle of the critical shear crack with the horizon. is a reduction factor
equal to 0.4 and fct is concrete tensile strength (Mirzaei, 2010).
The shear force in a tensile bar transferred from slab to the column needs to come
to equilibrium with either the strength of concrete in zone 1 (spalling strength) or zone 2
(breakout strength) Thus, only spalling strength of the concrete will be used to find the
contribution of the tensile bars to post-punching strength.

Chapter 5: Post-punching response of a flat plate 130
Barfractureduetocurvaturelocalization
The tensile strain at the outer fiber of the bars, which are the location of maximum
strain in the section due to curvature localization, will be checked against rupture strain of
the steel. The maximum tensile strain in the bar section can be calculated by the following
equation (Mirzaei, 2010).
(5-17)
In which, is the tensile strain at the center of the bar calculated before, is the
slope of the bar.
Dowel action
For the sake of completeness, the partial contribution of the top and bottom bars to
shear force transfer from slab to column before punching is separately presented here. As
mentioned before in Chapter 4, majority of the punching strength (85%) is assumed to be
provided by concrete based on the experimental data and remaining by the dowel action.
After formation of the shear crack, as the crack widens, due to the relative deformation
between the slab and the column, reinforcement contribute in a dowel action to the shear
transfer. There are three mechanisms of shear transfer by dowel action for a rebar crossing
a cracked reinforced concrete. Direct shear, kinking and flexure of the bars (Millard and
Johnson, 1984; Mirzaei, 2010). Since the concrete surrounding the rebar can be considered
flexible and not rigid thus flexural mechanism is the dominant action (Millard and Johnson,
1984). Millard and Johnson (1984) proposed the following equation by considering the
dowel bar as a beam on an elastic foundation.
1 (5-18)

Chapter 5: Post-punching response of a flat plate 131
1.3Φ ′ (5-19)
In which 0.166 . Φ . . , is the relative vertical displacement of
the two ends of the bar, is the foundation modulus of concrete equal to 127 ′ , Φ is
the bar diameter, (MPa) is the elastic modulus of elasticity of steel, ′ is concrete
compressive strength (MPa), is the yield strength of the bar.
5.6 Implementation and verification of Mirzaei’s numerical method
The equations mentioned above by Mirzaei (2010) are implemented in Matlab.
Starting at a vertical displacement of 1 mm (w=1) and through an iterative process the
vertical component of the top and bottom bars ( that is in equilibrium with spalling
and breakout strength of concrete is estimated, respectively. This process is repeated for
each w. Then, the total post-punching strength force is calculated based on Eq. (5-10). The
results of post-punching strength estimation using Mirzaei’s method, implemented here is
compared with the following experiments. The initial contribution of the bars through
dowel action is also plotted for the sake of completeness.
Flat plate tests at EPFL (Mirzaei and Muttoni, 2008)
The specimens were square slab panels with column at the center. The slab was
loaded at the location of the column and was mounted on 8 steel roller supports at a distance
of 0.2L (location of inflection points) from the column. A monotonically increasing loading
was applied at the location of the column. Out of 24 specimens, six of them were chosen
(PM-9, PM-10, PM-11, PM-12, PM-21, PM-22) with the average characteristics shown in
Table 5-1. Specimens that experienced fracture is also marked using information from
Fernandez Ruiz et al. (2013). All the top and bottom reinforcement (tensile and integrity)
were anchored at the ends.

Chapter 5: Post-punching response of a flat plate 132
Figure 5-6 through Figure 5-11 compare the total contribution of all tensile and
integrity bars to shear transfer from slab to column with the experimental data of Mirzaei
and Muttoni (2008) for specimen listed in Table 5-1. The numerically estimated response
includes the dowel action (pre-punching) and post-punching based on Millard and Johnson
(1984) and Mirzaei (2010), respectively. The sudden increase in reinforcement forces at
about 10 mm of relative vertical displacement is attributed to the punching and sudden
opening of the shear crack. The drops in the total and individual bar forces of all the
specimens except PM-12, are due to the fracture of the integrity bars which is reasonably
captured using Mirzaei (2010) numerical method. Note that the average properties of
reinforcement and concrete are used for numerical prediction purposes.
Since the main focus in this part of the chapter is to develop a numerical procedure
that would estimate the post-punching strength, the punching strength is not shown.
Flat plate tests (Melo and Regan, 1998)
The maximum post-punching strength numerically estimation based on Mirzaei
(2010) is compared with those of the experimental data of sets two and three of Melo and
Regan (1998). Among the experiments performed by Melo and Regan (1998) those with
enough development length or anchored bars was chosen here. The results are summarized
in Table 5-2. Except for specimen Melo-6LG, the maximum post-punching strength and
bar fracture of remaining three specimens are predicted reasonably well. The result of max
post-punching strength from numerical estimation compared with that of set 3 is shown in
Table 5-3, which are in good agreement.
Flat plate tests at McGill University (Habibi et al. 2012)
Excluding those with drop panel and rectangular columns, which is out of the scope
of this section, the remaining three panels’ post-punching response of Habibi et al. (2012)
is estimated using the numerical method of Mirzaei (2010). Note that, specimens S1 and

Chapter 5: Post-punching response of a flat plate 133
S2 had discontinuous tensile bars that became inactive in early stages after punching, thus
only the contribution from integrity bars are presented in Figure 5-12 and Figure 5-13. The
decrease in post-punching strength of the experiment is attributed to integrity bars not being
anchored at the ends. Due to the bar pull out, the strength decreases, this is not captured in
the numerical estimation since the initial assumption is that the integrity bars are properly
anchored at the ends. No bar fracture was observed neither in the test nor numerical
estimation.
Figure 5-14 also compares the result of numerical estimation with another specimen
of Habibi et al. (2012). This specimen had tensile bars that were extended all the way to
the support but not anchored. So the post-punching response is estimated using the
contribution from both integrity and tensile bars.
Validation of simple method of modeling by results of Chapter 4
In this section, the flat plate floor of section 4.5 that was evaluated for progressive
collapse potential is again modeled using simple method discussed before. Unlike the
previous explicit modeling technique, the slab is continuous and reinforcing bars are
embedded. The punching and post-punching strengths of slab-column connections are
estimated based on EC2 (2004) and the numerical procedure of Mirzaei (2010) mentioned
and implemented in this chapter, respectively. The response to a column removal similar
to that of section 4.5 (explicit model) is compared for both models. In order to simplify
the comparison, punching is modeled only for column B2 (see plan in Figure 5-15). The

Chapter 5: Post-punching response of a flat plate 134
model is described in the following section and the results are then compared with those
of the explicit model.
5.6.4.1 FE model description
The slab was designed according to ACI 318-11 and ACI 352.1R-11 (2011) to
satisfy the integrity requirements for punching failure. A 0.28 m thick slab was designed
to carry an ultimate load of 15.2 kN/m2, including the slab self-weight, an average live load
of 3.2 kN/m2 and an additional dead load of 1.4 kN/m2. A live load reduction factor of 0.59
was used for the design of interior columns and the ultimate uniform load was 13.1 kN/m2.
The interior columns’ ultimate compressive force was 722 kN considering the live load
reduction factor and the design punching shear strength of the slab including the strength
reduction factor of 0.75 was estimated at 748 kN.
The slab flexural reinforcement is designed according to the direct design method
(ACI 318-11). The maximum top tensile flexural reinforcement ratio of the column strip is
0.003 and 0.0051 in the transverse and longitudinal directions, respectively. For other
sections, the minimum reinforcement ratio satisfied the design requirements.
A dynamic analysis with an explicit time integration method was conducted
considering both material and geometric nonlinearities. The structure was analyzed under
the load combinations of D + 0.25 L = 9.2 kN/m2 (GSA, 2013). The axial reaction of the
removed interior column under this load combination was 510 kN. The column was
replaced with its reactions and the structure was reanalyzed to ensure the likeness of the
results under gravity before and after replacing the column with its reaction. Then, the
column reactions were removed in 2 milliseconds (Sasani et al., 2007; Sasani, 2008). Mass-
proportional damping with a damping ratio of 0.05 in the first mode was used.

Chapter 5: Post-punching response of a flat plate 135
The cylindrical compressive strengths of the concrete were 30 MPa. The yield and
ultimate strengths of reinforcing bars were 500 MPa and 600 MPa, respectively. The
concrete and steel moduli of elasticity were 26 GPa and 200 GPa, respectively.
A quadrilinear stress-strain relationship is defined for the steel reinforcement. The
Concrete Damaged Plasticity Model (CDPM) was chosen for modeling nonlinear behavior
in concrete (Abaqus, 2010). The ratio of initial equi-biaxial compressive yield stress to
initial uniaxial compressive yield stress was considered 1.2 to account for the biaxial state
of stress in the slab elements according to Kupfer and Hilsdorf (1969). The program’s
default values were assigned to the remaining parameters. The slab is modeled using S4R
general-purpose shell elements with quadrilateral finite-membrane-strain.
5.6.4.2 Punching strength
As mentioned before in section 4.5.2 the punching strength is estimated using EC2
(2004). The geometric average of the reinforcement ratios in two orthogonal directions was
0.0039 and the punching shear strength of the slab was 790 kN
5.6.4.3 Post-punching strength
Based on the experimental results of Mirzaei and Muttoni (2008) and Habibi et al.
(2012), discontinuous top bars become inactive at the early stages after punching. Since
top bars of slab studied here were also discontinuous and found to have a relatively small
contribution to the post-punching strength based on the results of Chapter 4, their effect to
post-punching strength are conservatively ignored. Using the numerical method mentioned
before, the shear transfer from slab to column through the integrity bars versus vertical
deformation of slab is estimated in Figure 5-16 including the effect of dowel action before
punching. The sudden increase in bar force following the initial plateau (dowel action), as

Chapter 5: Post-punching response of a flat plate 136
shown in the Figure, is right after punching failure which leads to sudden increase in bar
force.
5.6.4.4 Slab-column connection
As mentioned before, the punching and post-punching response of the interior slab-
column connection is modeled using a three-dimensional Cartesian-Cardan connector
element in Abaqus. As discussed in Chapter 4, Cartesian-Cardan connector element in
Abaqus has six degrees of freedom and each degree of freedom can have user-defined
force-deformation relationship. The connector connects the top of the column to its
associated node on the slab (see Figure 5-17 and a closed up view of column B2).
Before punching, all the components of connector are defined rigid to transfer
flexural and axial forces from slab to the column. Since the connector is rigid, there will
be no relative deformation between the two ends of the connector. Thus, axial component
of the connector, which is along the axial component of the column, will have zero axial
deformation up to punching failure. The vertical displacement of slab at the location of the
column however, before punching is equal to the elastic axial deformation of the column.
In order to model punching, a failure initiation force equal to the punching strength
(790 kN), calculated before, is assigned to the axial component of connector. As soon as
the force of the axial component of the connector reaches the failure initiation force, all the
components except axial will be deactivated simulating separation of the slab from the
column. To define the post-punching response for the axial component of the connector,
the force-deformation relationship shown in Figure 5-16 needs to be converted to axial
force-deformation of the connector. This is done by defining the connector axial
deformation at punching to be zero followed by the post-punching response of Figure 5-16.
From this point on, connector only has axial component that follows the force-deformation
relationship shown in Figure 5-18. Figure 5-18 is the defined axial force-deformation

Chapter 5: Post-punching response of a flat plate 137
relationship for the connector based on the estimated punching and post-punching
responses.
Results and discussion
In this section the post-punching response of flat plate floor of section 4.5 without
the effect of membrane forces is compared with the results of simple modeling method.
Figure 5-19 compares the punched column force in both models versus time. The
maximum post-punching force from the simple model is 604 kN which is about 26% larger
than that of the explicit model. Permeant post-punching column forces are 360 kN and 520
kN for the explicit and simple models, respectively. The maximum column forces in the
remaining two interior columns of explicit model after punching of column B2 are about
9% larger than the simple model on average.
The discrepancy between the responses is found to be primarily associated with the
level of failure refinement in the two models. The estimation of the post-punching
responses of both simple and explicit models are based on the method provided by Mirzaei
(2010) except that in the explicit model the concrete breakout strength is modeled at
discrete locations, where connectors connect the integrity bars to slab, while in the simple
model the failures are assumed to be gradual and propagating smoothly. In order to evaluate
the effect of refinement on contribution of the integrity bars to post-punching respone, the
vertical component of the force in integrity bars of the two models are compared (Figure
5-20 and Figure 5-21). In Figure 5-20, the horizontal axis is the relative vertical
displacement of the end of the integrity bar where it is connected to slab with respect to the
column (w) defined before in Figure 5-3b adopted from Mirzaei (2010). Sudden drops in
the results of explicit model show connector failures. Right after each failure the length of
the integrity bar suddenly increases, thus the vertical component of the force drops. Then
the integrity bar force increases until reaches the concrete breakout strength. At this

Chapter 5: Post-punching response of a flat plate 138
location, the results of simple model and explicit model match. As can be seen, due to the
level of refinement of the explicit model, the contribution of the integrity bars to post-
punching is underestimated.
The lengths of horizontal propagation of concrete breakout associated with integrity
bar at the maximum post-punching strength measured from column face are about 355 mm
and 428 mm for the simple and explicit models, respectively. Since the connectors in the
explicit model are located at 300 and 428 mm away from the column face, the failure could
not stop at the value estimated by simple model (see Figure 5-21). That is, the connector at
300 mm breaks and the failure stops at the next available connector (428 mm). This makes
the maximum post-punching strength of the explicit model to be 11% smaller than that of
the simple model for the integrity bars. To summarize, the explicit model underestimates
the post-punching contribution of the integrity bars and over estimates the horizontal
progress of damage due to the level of refinement which leads to smaller post-punching
strength compared to that of the simple model.
As mentioned before, the difference between the maximum forces provided by each
integrity bar of the explicit and simple models is 11%, however the analyses showed about
25% discrepancy between the maximum total forces of the two models (see Figure 5-19).
This is attributed to non-sequential and asymmetric failure of the connectors of the explicit
model. Figure 5-22 and Figure 5-23 show the vertical component of the integrity bar
located on the north side of the punched column of the explicit model versus vertical
displacement and horizontal propagation of the damage compared to that of the simple
model.
Unlike the response shown in Figure 5-20 and Figure 5-21 for the bars located on
the south side of the punched column, in which the connectors failed sequentially allowing
the integrity bar force to develop gradually to the maximum possible, two of the connectors

Chapter 5: Post-punching response of a flat plate 139
failed simultaneously as a result of impact caused by punching. Similar plots are shown for
the remaining integrity bars on the east and west side of the column in Figure 5-24 and
Figure 5-25.
The asymmetric deformation of the slab after column removal along axis 2 is shown
in Figure 5-26 for column B2. This asymmetric deformation leads to unequal vertical
displacements on the two sides of the column (north and south) while the horizontal
progress of damage (L) on both sides of the slab due to the level of refinement is equal.
That is, since the bar on the north side has smaller vertical displacement compared to the
displacement of the slab at the location of column, it was expected to have smaller
horizontal propagation of damage compared to that of the simple model, which was 355
mm. But due to the level of refinement, the damage propagation is found to be equal on
the two sides of the column. This leads to 44% difference between the results of explicit
and simple models yet, the simple model will not be affected by the asymmetric
deformation in case of column removal and punching since it is based on the relative
displacement of slab with respect to column at the location of the column, which is the
average of the north and south unequal deformations.
Despite differences between the two models, which was associated with the level
of refinement of failure propagation in the slab, non-sequential failure of connectors and
asymmetric response, the post-punching response estimated by the explicit model was
found to be underestimating the post-punching strength. The simple model is found to be
a more refined and reasonable method for estimation of the post-punching response. In the
following sections a flat plate floor with dimensions that is common in the industry will be
designed according to ACI 318-11 only and its integrity steel requirements will be
evaluated following a punching failure.

Chapter 5: Post-punching response of a flat plate 140
5.7 Punching failure of an overloaded column in a flat plate floor (system-level response)
A three span flat plate floor was designed according to ACI 318-11 (2011). The
simple modeling method, discussed before, is used to evaluate the post-punching response
of the floor designed according to the integrity steel requirements of ACI 318-11 following
a punching failure of an overloaded interior column.
Characteristics of the flat plate floor
The floor is designed to withstand the ultimate gravity load of 11.52 kN/m2 and it
was assumed that the lateral load will be taken by a lateral load resisting system such as a
shear wall. Based on our enquiries, the span of flat plate floors according to the current
practice in NY city is 5.48 m (18 ft) and 6.7 m (22 ft). An average span length of 6m (20
ft) was chosen for this study.
The slab thickness was 0.2 m under an ultimate load of 11.52 kN/m2 (6.4 kN/m2
Dead and 2.4 kN/m2 Live). The dead load included slab self-weight and an additional 1.4
kN/m2. The design detail is in Appendix 2. The slab flexural reinforcement is designed
according to the direct design method (ACI 318-11). The maximum top tensile flexural
reinforcement ratio of the column strip is 0.0038 in both transverse and longitudinal
directions. The top reinforcement layout is shown in Figure 5-27 for a quarter of the floor
plan due to the symmetry. The bottom reinforcement is found based on the minimum
practical reinforcement requirements, which is Φ12 @ 300 mm. To satisfy the integrity
requirements of ACI 318-11, two Φ12 bars in each direction passes through the column.
The cylindrical compressive strengths of the concrete were chosen as 30 MPa. The
yield and ultimate strengths of reinforcing bars were 500 MPa and 600 MPa, respectively.
The rupture strain of the steel was chosen as 0.1. The concrete and steel moduli of elasticity
were 26 GPa and 200 GPa, respectively.

Chapter 5: Post-punching response of a flat plate 141
Simple modeling method and analysis
The simple modeling method, mentioned before, was adopted to model the floor,
punching and post-punching behavior of one of the interior columns. A pseudo-dynamic
analysis was performed under the load combinations of D + 0.25 L = 7kN/m2 (GSA, 2003).
The load was increased gradually in about 2 sec and kept constant for about 0.2 sec. The
interior column force under this load is 286 kN. The interior columns B2 is then overloaded
gradually by about 24 kN/m2 in a 3x3 m2 area around the column (10 time live load). The
overloading was applied such that it would be marginally equal to the punching strength
of the slab. Then the post-punching response based on the integrity requirements of ACI
318-11 is evaluated in the system-level.
5.7.2.1 Punching strength
According to EC2 (2004) the punching strength of the slab-column connection for
a round control perimeter at a distance 2d from column face is estimated as:
0.18 1 100 30 0.00384 3103 172 451 kN
5.7.2.2 Post-punching strength
As mentioned before, the contribution of non-continuous tensile bars at the top of
the column to post-punching strength is found to be relatively small and conservatively
ignored based on the experimental results of Mirzaei and Muttoni (2008) and Habibi et al.
(2012).
Using the numerical method explained in 5.5.2, Figure 5-28 shows the estimated
force-deformation relationship of the axial component of the connector at the location of
the interior column after punching (when connector force reaches yield force equal to

Chapter 5: Post-punching response of a flat plate 142
punching strength of 451 kN). The maximum estimated post-punching strength and relative
vertical deformation with respect to column are 150 kN and 52 mm.
Results and discussions
Following punching failure of the overloaded column B2, the bottom bars cannot
provide the post-punching strength and deformation needed to redistribute the load to the
adjacent columns and fractured at a vertical displacement of about 60 mm. That is, if
punching failure occurs at the location of column B2 due to overloading, a floor designed
based on the integrity steel requirement of ACI 318-11 without any minimum bar size
requirement, 2 Φ 12 integrity bars chosen for each direction, would lead to bar fracture.
The results show that after bar fracture, the remaining interior columns adjacent to the
punched column (C2 and B3) would punch as well (including the effect of membrane
forces on the punching strength of the adjacent columns). Further analyses is carried out in
the following sections to find the minimum bar diameter and steel properties that would
help structure come to equilibrium after punching of column B2.
Experimental results of Melo and Regan (1998) and Mirzaei and Muttoni (2008)
showed that increase in bar diameter affects the post-punching strength. In addition, in the
following sections the effect of material properties such as concrete compressive strength,
steel ultimate strength and steel rupture strain on post-punching strength of slab-column
connection and integrity of floor in system-level is evaluated.
5.7.3.1 Effect of bar diameter on integrity of flat plate floor after punching
In order to find the appropriate integrity bar diameter that would help the structure
studied, come to equilibrium without bar fracture the post-punching strength of the interior
slab-column connection of this structure is estimated numerically based on Mirzaei (2010)
using different bar diameters (Figure 5-29). As expected, the post-punching strength and

Chapter 5: Post-punching response of a flat plate 143
deformation increases with the increase of diameter. The FE analysis was repeated for
larger bar diameters based on the estimated post-punching strength shown in Figure 5-29.
The results showed that, only 2Φ22 mm bottom bar in each direction can survive the
fracture following the punching failure and help structure come to equilibrium. By
increasing the bar diameter with respect to slab effective depth (d/Φ ), the fracture happens
at a larger bar vertical force and displacement, providing slab with more residual post-
punching strength. The depth to diameter ratio is fairly small for Φ22 compared toΦ12
(d/Φ 7.8).
5.7.3.2 Effect of concrete compressive strength on integrity of flat plate floor after
punching
Figure 5-30 shows the effect of concrete compressive strength on post-punching
strength of slab-column connection of the flat plate floor using bar diameter 12 mm. Three
common compressive strength used in the previous experiments are chosen for
comparison. 30 MPa, 35 MPa, and 40 MPa. The results show that, the post-punching
strength is not significantly affected by the compressive strength. Thus increasing the
concrete strength would not help avoid bar fracture of smaller bar diameters.
5.7.3.3 Effect of steel ultimate strength on integrity of flat plate floor after
punching
To evaluated the effect of steel ultimate strength on the post-punching response, the
ultimate strength was found by assuming fu=1.2fy for the following yield strengths: 400,
500, 600 MPa, shown in Figure 5-31. The ultimate post-punching strength proportionally
increased by 20% from fy = 500 to fy = 600. With the increase of vertical displacement, the
bar with larger ultimate strength can break larger piece of concrete above it. Thus it is

Chapter 5: Post-punching response of a flat plate 144
expected that the bar with larger ultimate strength have larger horizontal propagation of
damage (concrete breakout) or longer free length of bar (L), shown in Figure 5-32.
5.7.3.4 Effect of steel rupture strain on integrity of flat plate floor after punching
Figure 5-33 shows the effect of rupture strain of 2Φ12 in each direction on post-
punching response estimated based on Mirzaei (2010) for the interior slab-column
connection of the flat plate floor. Among variables studied, bar rupture strain has the most
significant effect on post-punching strength and deformation. Using ultimate strain of 0.15
and 0.2, the post-punching strength of different diameters are plotted in Figure 5-34 and
Figure 5-35. The results of maximum post-punching strength estimated for diameters 12-
22mm for different ultimate strains is summarized in Table 5-4. The results are compared
with the maximum post-punching strength proposed by Melo and Regan (1998) and the
ratio of effective slab depth to bar diameter is also calculated. For bars with large rupture
strain and diameters above 20 mm failure is limited to concrete breakout strength which is
constant beyond shear crack. Melo and Regan (1998)’s proposed maximum post-punching
strength reasonably matches the maximum strength estimated using Mirzaei (2010) method
for large ultimate strain (0.2). However, it overestimates the post-punching strength limited
by concrete breakout for larger bar diameters. The maximum ultimate deformation
achieved after punching is also shown in Table 5-5. For ductile bars 15% with d/Φ
less than about 8, bar undergoes large deformations before fracture.
By comparing the maximum post-punching strength of Table 5-4 with the result of
FE analysis, Table 5-6 summarizes the minimum bar diameter that would help structure
come to equilibrium without fracture after an overloaded column punches. Guidelines other
than ACI 318-11 suggest minimum bar diameter of Φ18 which is suitable for ductile steel
( 0.2) and not safe for non-ductile steel (Table 5-6).

Chapter 5: Post-punching response of a flat plate 145
To avoid bar fracture at early stages after punching at small post-punching strength
compared to punching strength, other variables such as the slab depth/bar diameter ratio
(which is a measure to evaluate the thickness of slab relative to bar diameter) and steel
rupture strain needs to be also accounted for in estimation of the minimum bar diameter.
The recommended minimum bar diameters to achieve specific post-punching strength as a
ratio of punching strength before bar fracture is summarized in Table 5-7. The estimations
are based on the characteristics of the flat plate floor studied here and Mirzaei (2010)’s
method. As shown in Table 5-7, to achieve a post-punching strength of 1.2 times the
punching strength using steel with 0.1, the slab thickness needs to be increased. This
is attributed to the fact that, the maximum post-punching strength is capped with concrete
breakout strength which is a function of slab thickness. Thus, to increase the post-punching
strength of the slab when concrete breakout is the dominant type of failure, the slab
thickness needs to be increased. Table 5-8 summarized minimum bar diameter to achieve
a specific post-punching deformation as a function of span before bar fracture.

Chapter 5: Post-punching response of a flat plate
146
5.8 Tables
Table 5-1 Average characteristics of specimens tested by Mirzaei and Muttoni (2008)
* Integrity bars fractures at the end of the test
Table 5-2 Numerical estimation of post-punching strength based on Mirzaei (2010) and experimental results of test set 2 by Melo and Regan (1998)
Specimen no. Vmax-num.
Vmax-exp Fracture?
Numerical.Fracture?
Experiment Vmax-num./Vmax-exp
Melo-6LG* 30 41 Yes Yes 0.73 Melo-8LG* 55.8 57 Yes Yes 0.97 Melo-10LG* 87.9 90 Yes Yes 0.97 Melo-12LG* 126 123 Yes Yes 1.02
* Integrity bars fractures at the end of the test
Tensile reinforcement Integrity reinforcement
Test d
Aten. bars fsy fsu Es
Ainteg. bars fsy fsu Es fc
mm MPa MPa % GPa MPa MPa % GPa MPa
PM-9* 102 Φ8@60 601 664 7.39 201 4 Φ 8 616 680 7.4 202 31
PM-10* 102 Φ 8@60 601 664 7.39 201 4 Φ 10 560 599 7.9 195 31.1
PM-11* 102 Φ 8@60 601 664 7.39 201 4 Φ 12 548 625 10.5 201 32.3
PM-12 102 Φ 8@60 601 664 7.39 201 4 Φ 14 527 629 13.5 199 32.4
PM-21* 103 Φ 8@60 625 641 6.1 200 4 Φ 8 625 641 8.9 200 40.2
PM-22* 99 Φ 8@60 625 641 6.1 200 4 Φ 10 605 658 10.3 194 40.3

Chapter 5: Post-punching response of a flat plate
147
Table 5-3 Numerical estimation of post-punching strength of test set 3 by Melo and Regan (1998)
specimen no. Vmax-
numerical
Vmax-experime
nt
Fracture? Numerical.
Fracture? Experiment
Vmax-num./Vmax-exp
Melo-16LG* 456 433 yes yes 1.05 Melo-20LG* 600 649 yes yes 0.92

Chapter 5: Post-punching response of a flat plate 148
Table 5-4 Maximum estimated post-punching strength of interior slab-column connection based on Mirzaei (2010) compared with Melo and Regan (1998) estimation
Φ Vmax
(Melo) d/Φ
0.10 0.15 0.20
12 (#4) 148 199 237 239 14.3 14.00 204 271 322 325 12.3
16 (#5) 267 353 421 424 10.7 18.00 338 447 531 537 9.5
20 (#6) 416 552 559 663 8.6 22 (#7) 505 559 559 803 7.8
Limited by fracture
Limited by concrete breakout strength
Table 5-5 Maximum estimated post-punching deformation for 6m span flat plate floor based on Mirzaei (2010)
Φ
0.10 0.15 0.20 d/Φ
12 (#4) 60 89 117 14.33 14.00 68 101 134 12.29
16 (#5) 78 114 153 10.75 18.00 87 128 172 9.56
20 (#6) 96 143 >300 8.60 22 (#7) 106 >300 >300 7.82

Chapter 5: Post-punching response of a flat plate 149
Table 5-6 Minimum bar diameter for overloaded 6m span flat plate structure to avoid bar fracture
Melo CSA
(2004) ACI352.1R-11
0.10 0.15 0.20
Punching failure Φ 22 Φ 20 Φ 18 Φ 18 Φ 18 Φ 18 d/Φ 7.82 8.60 9.56 9.56 9.56 9.56
Table 5-7 Minimum bar diameter to achieve specific post-punching strength as a ratio of punching strength without bar fracture
Vpp/Vp (EC2, 2004)
Melo
0.10 0.15 0.20
0.80 Φ 20 Φ 18 Φ 16 Φ 16 0.90 Φ 20 Φ 18 Φ 16 Φ 16 1.00 Φ 22 Φ 20 Φ 18 Φ 18 1.10 Φ 22 Φ 20 Φ 18 Φ 18 1.20 increase d Φ 20 Φ 20 Φ 20
Table 5-8 Minimum bar diameter to achieve specific post-punching deformation as a function of span without bar fracture
Vertical displ./span
0.10 0.15 0.20
1% 14.00 Φ 10 Φ 8 1.50% Φ 20 Φ 14 Φ 10
2% > Φ 22 Φ 18 Φ 14 2.50% > Φ 22 Φ22 Φ 16
3% > Φ 22 Φ 22 Φ 20

Chapter 5: Post-punching response of a flat plate 150
5.9 Figures
Figure 5-1 Post-punching behavior of flat slab with and without bottom reinforcement (adopted from Hawkins and Mitchell, 1979)

Chapter 5: Post-punching response of a flat plate 151
Figure 5-2 Horizontal projection of conical surface for single and double integrity bars (adopted from Melo and Regan, 1998)

Chapter 5: Post-punching response of a flat plate 152
Figure 5-3 a) geometry of slab, cone and rebars after punching (shear transfer), b) elastic deformed shape, c) plastic deformed shape(formation of plastic hinges) (adopted from Mirzaei, 2010)

Chapter 5: Post-punching response of a flat plate 153
Figure 5-4 Circumferential concrete cover failure ring (adopted from Mirzaei, 2010)
Figure 5-5 Distance xi from column face (adopted from Mirzaei, 2010)
xi

Chapter 5: Post-punching response of a flat plate 154
Figure 5-6 Numerical post-punching strength estimated based on Mirzaei (2010) compared with experimental results of specimen PM-9 from Mirzaei and Muttoni (2008)
Figure 5-7 Comparison of numerical post-punching strength based on Mirzaei (2010) with experimental results of specimen PM-10 from Mirzaei and Muttoni (2008)
0 20 40 60 80 100 1200
50
100
150
200
250
300
vertical displacement (mm)
Col
umn
forc
e (k
N)
Tensile bar (Num.)
Integiry bar (Num.)Total (Num.)
PM-9 (Exp.)
0 20 40 60 80 100 1200
50
100
150
200
250
300
vertical displacement (mm)
Col
umn
forc
e (k
N)
Tensile bar (Num.)
Integiry bar (Num.)Total (Num.)
PM-10 (Exp.)

Chapter 5: Post-punching response of a flat plate 155
Figure 5-8 Comparison of numerical post-punching strength based on Mirzaei (2010) with experimental results of specimen PM-11 from Mirzaei and Muttoni (2008)
Figure 5-9 Comparison of numerical post-punching strength based on Mirzaei (2010) with experimental results of specimen PM-12 from Mirzaei and Muttoni (2008)
0 20 40 60 80 100 1200
50
100
150
200
250
300
vertical displacement (mm)
Col
umn
forc
e (k
N)
Tensile bar (Num.)
Integiry bar (Num.)Total (Num.)
PM-11 (Exp.)
0 20 40 60 80 100 1200
50
100
150
200
250
300
350
vertical displacement (mm)
Col
umn
forc
e (k
N)
Tensile bar (Num.)
Integiry bar (Num.)
Total (Num.)
PM-12 (Exp.)

Chapter 5: Post-punching response of a flat plate 156
Figure 5-10 Comparison of numerical post-punching strength based on Mirzaei (2010) with experimental results of specimen PM-21 from Mirzaei and Muttoni (2008)
Figure 5-11 Comparison of numerical post-punching strength based on Mirzaei
(2010) with experimental results of specimen PM-22 from Mirzaei and Muttoni (2008)
0 20 40 60 80 100 1200
50
100
150
200
250
300
vertical displacement (mm)
Col
umn
forc
e (k
N)
Tensile bar (Num.)
Integiry bar (Num.)
Total (Num.)
PM-21 (Exp.)
0 20 40 60 80 100 1200
50
100
150
200
250
300
vertical displacement (mm)
Col
umn
forc
e (k
N)
Tensile bar (Num.)
Integiry bar (Num.)Total (Num.)
PM-22 (Exp.)

Chapter 5: Post-punching response of a flat plate 157
Figure 5-12 Comparison of numerical post-punching strength based on Mirzaei (2010) with experimental results of specimen S1 tested by Habibi et al. (2012)
Figure 5-13 Comparison of numerical post-punching strength based on Mirzaei (2010) with experimental results of specimen S2 tested by Habibi et al. (2012)
0 50 100 150 200 250 3000
50
100
150
200
250
300
350
Vertical displacement (mm)
Col
umn
forc
e (k
N)
Integiry bar (Num.)
S1(Exp.)
0 50 100 150 200 250 3000
50
100
150
200
250
300
350
Vertical displacement (mm)
Col
umn
forc
e (k
N)
Integiry bar (Num.)
S2(Exp.)
Slip
Slip

Chapter 5: Post-punching response of a flat plate 158
Figure 5-14 Comparison of numerical post-punching strength based on Mirzaei (2010) with experimental results of specimen SS tested by Habibi et al. (2012)
0 50 100 150 200 250 3000
100
200
300
400
500
600
Vertical displacement (mm)
Col
umn
forc
e (k
N)
Tensile bar (Num.)
Integiry bar (Num.)Total (Num.)
SS (Exp.)

Chapter 5: Post-punching response of a flat plate 159
Figure 5-15 Plan of flat plate floor studied in Chapter 4 modeled using simple
method
Figure 5-16 Estimated integrity bar shear force versus vertical deformation of slab for interior slab-column connection based on Mirzaei (2010)
0
100
200
300
400
500
600
700
800
900
0 50 100 150 200 250
Integrity bar shear force (kN)
Vertical displacement (mm)
Punching

Chapter 5: Post-punching response of a flat plate 160
Figure 5-17 Slab-column connection using connector for column B2
Figure 5-18 Force-deformation of axial component of connector (effect of tensile bars ignored)
0
100
200
300
400
500
600
700
800
900
0 50 100 150 200 250
Axial componet of connector (kN)
axial deformation of connector (mm)

Chapter 5: Post-punching response of a flat plate 161
Figure 5-19 Comparison of the punched column force after column removal for simple and explicit models
‐1,000
‐800
‐600
‐400
‐200
0
0 0.5 1 1.5 2
Column force
time
Simple
Explicit (Chapter 4)

Chapter 5: Post-punching response of a flat plate 162
Figure 5-20 Variation of vertical force provided by integrity bar on the south side of punched column for explicit and simple model versus relative displacement of slab with respect to column
Figure 5-21 Variation of vertical force provided by integrity bar on south side of punched column for explicit and simple model versus horizontal progress of damage from column face after punching
0
10
20
30
40
50
60
70
80
0 30 60 90 120 150
Vertical force of integ bar (kN
)
w (mm)
Numerical
Explicit_S2
0
10
20
30
40
50
60
70
80
0 100 200 300 400 500
Vertical force of integ bar (kN
)
L (mm)
Numerical
Explicit_S2

Chapter 5: Post-punching response of a flat plate 163
Figure 5-22 Variation of vertical force provided by the integrity bar on north side of punched column for explicit and simple model versus relative displacement of slab with respect to column
Figure 5-23 Variation of vertical force provided by integrity bar on north side of punched column for explicit and simple model versus horizontal progress of damage from column face after punching
0
10
20
30
40
50
60
70
80
0 30 60 90 120 150
Vertical force of integ bar (kN
)
w (mm)
Numerical
Explicit_N2
0
10
20
30
40
50
60
70
80
0 100 200 300 400 500
Vertical force of integ bar (kN
)
L (mm)
Numerical
Explicit_N2

Chapter 5: Post-punching response of a flat plate 164
Figure 5-24 Variation of vertical force provided by integrity bar on east and west side of the punched column for explicit and simple model versus relative displacement of slab with respect to column
Figure 5-25Variation of vertical force provided by integrity bar on east and west side of the punched column for explicit and simple model versus horizontal progress of damage from column face after punching
‐10
0
10
20
30
40
50
60
70
80
0 30 60 90 120 150
Vertical force of integ bar (kN
)
w (mm)
Numerical
Explicit_W2
Explicit_E2
‐10
0
10
20
30
40
50
60
70
80
0 100 200 300 400 500
Vertical force of integ bar (kN
)
L (mm)
Numericall
Explicit_W2
Explicit_E2

Chapter 5: Post-punching response of a flat plate 165
Figure 5-26 Profile of slab along axis 2 at location of column B2 at permanent displacement for simple and explicit models
‐250.00
‐200.00
‐150.00
‐100.00
‐50.00
0.00
Vertical displacemen
t (m
m)
Explicit model
Intebrity bar
simple model
B23 m 3 m

Chapter 5: Post-punching response of a flat plate 166
Figure 5-27 Reinforcement detailing of a quarter of 6 m span flat plate floor (only top bars are shown). Bottom bars are Φ12@300 mm in both directions

Chapter 5: Post-punching response of a flat plate 167
Figure 5-28 Estimated connector axial force-deformation relationship after punching for2Φ12 integrity bars in each direction
Figure 5-29 Estimated post-punching strength of slab-column connection for integrity bar diameters 12-22 mm for rupture strain of 0.1
0
100
200
300
400
500
0 20 40 60 80 100
Connector vertical force (kN)
Connector vertical deformation (mm)
0
100
200
300
400
500
600
0 50 100 150 200
Force (kN)
Vertical displacement (mm)
Integrity: 2 Φ 12
Integrity: 2 Φ 14
Integrity: 2 Φ 16
Integrity: 2 Φ 18
Integrity: 2 Φ 20
Integrity: 2 Φ 22

Chapter 5: Post-punching response of a flat plate 168
Figure 5-30 Effect of concrete compressive strength on estimated post-punching strength of slab-column connection of flat plate floor for integrity bar Φ12 mm
Figure 5-31 Effect of steel ultimate strength on estimated post-punching strength of slab-column connection of flat plate floor for integrity bar Φ12 mm
0
40
80
120
160
200
0 10 20 30 40 50 60 70 80 90 100
Post‐punching strength (kN
)
Vertical displacement (mm)
f'c=30
f'c=35
f'c=40
0
50
100
150
200
250
300
0 10 20 30 40 50 60 70 80 90 100
Post‐punching strength (kN
)
Vertical displacement (mm)
fy=400
fy=500
fy=600

Chapter 5: Post-punching response of a flat plate 169
Figure 5-32 Estimated post-punching strength as a function of horizontal propagation of concrete breakout
Figure 5-33 Effect of steel ultimate strain on estimated post-punching strength of slab-column connection of flat plate floor for integrity bar ∅ 12 mm
0
100
200
300
400
500
600
10 20 30 40 50 60 70 80 90 100
Horizontal propagation of concrete
breakout /Free length of integrity bar
(L) in m
m
Vertical displacement (mm)
fy=400
fy=500
fy=600
0
50
100
150
200
250
300
0 20 40 60 80 100 120 140
Post‐punching strength (kN
)
Vertical displacement (mm)
er=0.1
er=0.15
er=0.2

Chapter 5: Post-punching response of a flat plate 170
Figure 5-34 Estimated post-punching strength of slab-column connection for integrity bar diameters 12-22 mm for rupture strain of 0.15
0
100
200
300
400
500
600
0 20 40 60 80 100 120 140 160 180 200
Force (kN)
Vertical displacement (mm)
Integrity: 2 Φ 12
Integrity: 2 Φ 14
Integrity: 2 Φ 16
Integrity: 2 Φ 18
Integrity: 2 Φ 20
Integrity: 2 Φ 22

Chapter 5: Post-punching response of a flat plate 171
Figure 5-35. Estimated post-punching strength of slab-column connection for integrity bar diameters 12-22 mm for rupture strain of 0.2
0
100
200
300
400
500
600
0 50 100 150 200
Force (kN)
Vertical displacement (mm)
Integrity: 2 Φ 12
Integrity: 2 Φ 14
Integrity: 2 Φ 16
Integrity: 2 Φ 18
Integrity: 2 Φ 20
Integrity: 2 Φ 22

Chapter 6 Conclusions
6.1 Developing Wireless DAQ system
An attempt was made to develop a wireless DAQ system which combines the
sensor technology with the wireless communication technology and overcome the
constraints of the old wired DAQ system for progressive collapse field experiments. To
start, an application was developed capable of peer-to-peer communication based on IEEE
802.15.4 protocol for a short range. The hardware was CC2530, a system on-chip that is
2.4-GHz IEEE 802.15.4 compliant RF transceiver from Texas Instrument. The analog data
was sensed at specific intervals, digitalized and put together in a packet form and sent
wirelessly to a receiver. The receiver then transferred the received data to a PC through
UART links. The wireless DAQ was tested at different locations, with different obstacles.
The accuracy of the data received by wireless DAQ are then compared with that of the
wired DAQ. Followings are the concluding remarks from the peer-to-peer application:
For indoor tests, the efficient transmission range was about 7 m through walls and
doors (glass or metal).
The data was successfully transferred through staircases up to 4 floors (~ 15 m).
The maximum efficient LOS transmission range (outdoor/indoor) was about 50 m.
The accuracy of the wireless DAQ verified against the wired DAQ.
The highest sampling rate achieved considering the IEEE 802.15.4 limited data
rate and the hardware was 666 Hz/Channel.
The peer-to-peer application is possible only within a short range, the equipment
and the PC need to be located close to the sensing location (inside the building), and in

Chapter 6: Conclusions 173
order to not lose the DAQ, PC can only be used in an experiment that does not lead to
significant damage to the structure. In order to study the response to other scenarios such
as the collapse of the entire building, however the application mentioned above was
modified to develop a network of wireless DAQ cards such that the data could be
transferred to a station outside during the field test by relaying the data. ZigBee wireless
protocol was chosen for this purpose since it allows for the formation of a network of
wirelessly communicating devices.
Sensed data was successfully transferred from inside of the building to an outside
station by relaying the data over about 150 m distance. Directional antenna was
used on the received side to increase the transmission range. Only three devices
(End device, a router, and a coordinator) were involved in this experiment.
The highest data rate that was achieved for the above-mentioned communication
was 333 Hz/Channel which can be an alternative to wired DAQ system for field
studies or progressive collapse experiments such as those done by Sasani et al.
(2007), Sasani and Sagiroglu (2008), and Sasani et al. (2011).
The test was repeated for multiple channels at the hearing distance from each other
at the same time, which was not successful and led to high percentage of data loss.
6.2 Progressive collapse resistance of a PT flat plate parking garage
The progressive collapse resistance of an actual PT parking garage was
analytically evaluated to an interior column removal using SAP2000. The results are then
verified against the experimental data collected by Prof. Sasani’s research team in the
past from this structure after the column was removed by explosion and the response was
recorded using sensors. The post-tensioned slab of the parking garage had no bottom
reinforcement and around the removed column the tendons (located close to the top of

Chapter 6: Conclusions 174
the slab) were adding to the demand and pushing the floor down, yet the structural system
was able to redistribute the gravity loads with a permanent vertical displacement of about
61 mm based on the experiment.
The analyses showed that the readily available models in SAP2000 for post-
tensioning did not properly capture the nonlinear response of the structure to a
column removal.
Post-tensioning was modeled using truss elements representing tendons and
springs representing interaction the slab and tendons. The model can be used for both
unbonded and bonded slabs. Localized plasticity is used to model the material
nonlinearity.
This method was able to more closely simulate the recorded vertical displacement
of the floor.
Due to the slab tendency to grow and the constraint applied by the surrounding
slab, compressive membrane forces formed around the removed column where the
flexural demand is high.
76% of the additional compressive membrane forces developed as a result of the
slab growth tendency being constrained in the region with higher flexural demand
are in equilibrium primarily with the tensile membrane forces in the remaining
portion of the slab. A 24% increase in column shear forces also help satisfying the
slab in-plane equilibrium.
The slab successfully redistributed the gravity load to the adjacent columns
following the column removal.

Chapter 6: Conclusions 175
The increase in the gravity load carrying capacity of slab is in part attributed to an
increase in the flexural capacity of slab sections due to the formation of
compressive membrane forces in the slab.
It is demonstrated that the use of total moments developed in slab sections is
misleading in identifying the contribution of different portions of the slab in
collapse resistance following column removal.
Around the removed column, the primary moment is in the same direction as the
moment due to the gravity loads, therefore the total moment overestimates the
contribution of this region in redistributing gravity loads.
It is also concluded that compared to unbonded PT systems, bonded PT floors are
more susceptible to failure after column removal, due to the localization of tendon
strains.
6.3 Progressive collapse resistance of RC flat plate floors
The punching and post-punching failure of an isolated and simply supported slab-
column specimen is analytically evaluated. The effects of dowel action, critical shear crack
formation, critical shear crack widening during punching, and post-punching response are
accounted for in the model. The punching cone, the integrity and tensile reinforcing bars
crossing the critical shear crack were modeled explicitly to account for the actual separation
of the cone and the contribution of the reinforcing bars to pre and post-punching responses.
The post-punching damage propagation is estimated using an already verified numerical
method available in the literature.

Chapter 6: Conclusions 176
The effects of the boundary conditions on the punching strength of the isolated slab-
column specimen is then analytically accounted for and investigated. For material
nonlinearity, the Concrete Damage Plasticity Model (CDPM) available in Abaqus is used.
The punching and post-punching FE model using Abaqus reasonably simulated
the pre-punching shear transfer mechanisms, punching, and post-punching
response of the isolated slab specimen.
The lateral restraints led to the formation of compressive membrane force in the
isolated slab, which increased the punching strength through friction shear force
by 34%.
The system-level response after a sudden column loss of an RC flat plate floor
designed according to ACI 318-11 and ACI 352.1R with and without the effects of
membrane forces is presented. The following conclusions are made:
Unlike the fully restrained condition, the punching strength enhancement in the
actual flat plate floor system studied was found to be about 17%, which is less than
34% found for the isolated and laterally restrained slab.
The following finding was attributed to the fact that the slab is allowed to grow
partially in the flat plate structure, thus the compressive membrane forces which
developed in the slab and contributed to the enhancement of the punching shear
strength were less than that of the fully restrained slab.
Evaluation of the punching strength based on the fully restrained slab condition
would overestimate the contribution of the compressive membrane forces to the
punching shear strength.

Chapter 6: Conclusions 177
Compressive membrane forces improved the slab resistance against progressive
punching failures in flat plate buildings. Ignoring the formation of compressive
membrane forces underestimated the punching strength of the floor system.
97% of the compressive membrane forces developed in the slabs as a result of
growth tendency being constrained were mainly in equilibrium with the tensile
membrane forces of the middle strips of the slab and the remaining 3% by the
column shear forces.
It was also found that well-anchored integrity reinforcing bars which directly pass
over the column contributed significantly to the post-punching strength.
Discontinuous tensile reinforcement, however, did not considerably contribute to
the post-punching strength of slabs. Therefore, the use of well-anchored tensile
bars, which are often used in experiments, may in some cases overestimate the
post-punching strength of the slab.
6.4 Evaluating post-punching response of a flat plate designed based
on ACI 318-11
Previous experimental results and our analyses from Chapter 4 showed that the
continuous bottom bars play a significant role after a punching failure. However, the
integrity steel requirements of ACI 318-11 for two-way slabs only requires two bars pass
through column core and anchored at the exterior supports without specifying a minimum
bar diameter. To evaluate the post-punching response of a flat plate designed based on ACI
318-11, the modeling method mentioned earlier in Chapter 4 is replaced with a simple
model in which the post-punching response of the slab-column connection is estimated
using numerical methods used in Chapter 4 and the interaction of slab and column after
punching is replaced with a spring.

Chapter 6: Conclusions 178
The numerical method available in the literature is re-validated against
experimental data.
The results of simple model developed, was compared against response of the slab
studied in Chapter 4.
It was found that the model presented in Chapter 4 underestimates the post-
punching strength due to modeling the damage propagation along the slab at
discrete locations, while simple model provides better level of refinement for the
damage propagation and post-punching strength estimation.
The interior slab-column connection of the designed flat plate floor is modeled
using the simple method developed here. An interior column was overloaded and the post-
punching response is then evaluated. It is shown that for a flat plate floor of 6 meter long
span with 200 mm thickness 2Φ12 bottom bars in each direction will satisfy the integrity
steel requirements of ACI 318-11. If an interior column is overloaded and punched:
The system-level response showed that the above mentioned details for the integrity
bars would lead to bar fracture after punching of the overloaded column.
Increasing the bar diameter and steel rupture strain, increases the maximum post-
punching strength and deformation capacity of the connection before bar fracture.
The minimum bar diameter that did not lead to bar fracture was found to be at least
2Φ22 in each direction for 0.1, and 2 Φ 18 for larger rupture strain ( 0.2).
The minimum bar area recommended by other guidelines and researchers such as
Melo and Regan (1998), CSA A23.2 and ACI 352.1R, was found to be suitable for
bars with larger rupture strain ( 0.2).

Chapter 6: Conclusions 179
The following conclusion is made by numerical evaluation of the post-punching
response of the slab-column connection of the flat plate floor designed with FE analyses:
To achieve larger vertical displacement after punching (>300 mm) and before bar
fracture, the failure mode is better to be dominated by the concrete breakout
strength, which depends of the thickness of the slab relative to the bar diameter
(d/ and .

REFERENCES
Abaqus INC. (2010). Standard User’s Manual, 6.9 Edition.
ACI 318. (2011). Building code requirements for structural concrete (ACI 318-11) and
commentary. American Concrete Institute.
ACI Committee 349. (2001). Code Requirements for Nuclear Safety Related Concrete
Structures. American Concrete Institute.
ACI-ASCE Committee 352.1R-11. (2012). Guide for design of slab-column connections
in monolithic concrete structures. American Concrete Institute.
ACI-ASCE Committee 426. (1974). “Shear strength of reinforced concrete members-
slabs.” Proc., American Society of Civil Engineers, 100(ST8), 543-1591.
ACI-ASCE Committee 426. (1978). Suggested revisions to shear provisions for building
codes. American Concrete Institute, Detroit, 88pp.
ASCE/SEI-7, (2010). Minimum design loads for buildings and other structures. American
Society of Civil Engineers.
Bahn, B. Y., and Hsu, C. T., (1998). "Stress-strain behavior of concrete under cyclic
loading," ACI Mater. J., 95(2), 178-193.
Baronti, P., Pillai, P., Chook, V.W.C, Chessa, S., Gotta, A., and Fun Hu, Y. (2007).
“Wireless sensor networks: A survey on the state of the art and the 802.15.4 and ZigBee
standards.” Computer Communications, 30, 1655-1695.
Bondy, K. B., (2012). "Two-way post-tensioned slab with bonded tendons," PTI J., 8(2),
43-48.

References 181
Bresler, B., and Pister, K. S. (1958). “Strength of concrete under combined stresses.” ACI
J. Proc., American Concrete Institute, 321-345.
Burns, N. H., and Hemakom, R., (1977). "Test of scale model post-tensioned flat plate," J.
Struct. Div., 103(6), 1237-1255.
Carino, N., Woodward, K., Leyendecker, E., and Fattal, S. (1983). “A review of the Skyline
Plaza collapse.” Concr.Int., 5(7), 35-42.
CC2530 User's Guide. (2010). CC2530 Development Kit User’s Guide. Terxas
Instruments.
CC253x user's guide. (2010). CC253x system-on-chip solution for 2.4-GHz IEEE 802.15.4
and Zigbee Applications. Texas Instrument.
Choi, H. J., and Krauthammer, T. (2003). “Investigation of progressive collapse
phenomena in a multi-story building.” Eleventh international symposium on the interaction
of the effects of munitions with structures, Mannheim, Germany.
Chopra, A. K. (2000). Dynamics of structures, 2nd Edition, Prentice Hall.
Criswell, M. E. (1974). “Static and dynamic response of reinforced concrete slab-column
connections.” ACI Special Publication, SP 42-31, 721-746
CSA A23.3. (2004). Design of concrete structures. CSA standard A23.3-04, Canadian
Standards Association (CSA), Mississauga, Ontario.
Dat P. X., and Hai T. K. (2011). “Membrane actions of RC slabs in mitigating progressive
collapse of building structures.” Eng. Struct., doi:10.1016/j.engstruct.2011.08.039.

References 182
Dat P. X., and Hai T. K. (2013). “Experimental study of beam–slab substructures subjected
to a penultimate-internal column loss.” Eng. Struct., http ://dx.doi. org/10.1016/ j.engstruct.
2013.03. 026.
Dat, P. X., and Hai, T. K., (2013). "Membrane actions of RC slabs in mitigating progressive
collapse of building structures," Eng. Struct., 55, 107-115.
DoD, (2010). Unified facilities criteria, design of buildings to resist progressive collapse.
Washington, DC, US Department of Defense.
Dragosvic, M., and Beukel, A. van den. (1974). “Punching shear.” Heron, 20(2), 48.
EC2. (2004). 1-2: 2004 Eurocode 2: Design of concrete structures-Part 1-1: General rules
and rules for buildings. European Standards, London.
Ellobody, E., and Bailey, C. G., (2009). "Modelling of unbonded post-tensioned concrete
slabs under fire conditions," Fire Saf. J., 44(2), 159-167.
Fenwick, R., and Megget, L., (1993). "Elongation and load deflection characteristics of
reinforced concrete members containing plastic hinges," Bulletin of the New Zealand
National Society for Earthquake Engineering, 26(1), 28-41.
Fernández Ruiz M., Mirzaei Y., and Muttoni A. (2013). “Post-Punching Behavior of Flat
Slabs.” ACI Struct. J., 110, pp. 801-812.
Fib. (2001). “Punching of structural concrete slabs.” fib bulletin 12, (fédération
internationale du béton), Switzerland.
Foutch, D. A., Gamble, W. L., and Sunidja, H., (1990). "Tests of post-tensioned concrete
slab-edge column connections," ACI Struct. J., 87(2), 167-179.

References 183
GSA, (2013). Progressive collapse analysis and design guidelines for new federal office
buildings and major modernization projects, General Services Administration.
Guandalini, S. (2005). Poinçonnement Symétrique Des Dalles En Béton Armé, Thèse de
doctorat, N. 3380, Lausanne, Switzerland. (French)
Guandalini, S., Burdet, O.L., and Muttoni, A. (2009). “Punching tests of slabs with low
reinforcement ratios.” ACI Struct. J. 106(1), 87-95.
Habibi, F., Redl, E., Egberts, M., Cook, W. D., and Mitchell, D. (2012). “Assessment of
CSA A23. 3 structural integrity requirements for two-way slabs.” Can. J. Civil Eng., 39(4),
351-361.
Hambly, E. C., (1991). Bridge deck behaviour. CRC Press.
Han S. W., Kee S-H., and Kang T. H-K., (2006a). "Cyclic behaviour of interior post-
tensioned flat plate connections," Mag. Concrete Res., 58(10), 699–711.
Han S. W., Kee S-H., Park Y-M,, Lee L-H and Kang T. H-K., (2006b). "Hysteretic
behavior of exterior post-tensioned flat plate connections," Eng. Struct., 28(14), 1983–
1996.
Han, S. W.; Moon, K. H., and Park, Y., (2012). "Effect of slab bottom reinforcement on
seismic performance of post-tensioned flat plate frames," Mag. Concrete Res., 64(4), 317-
334.
Hawkins, N. M., and Mitchell, D. (1979). “Progressive collapse of flat plate structures.”
ACI J. Proc., 76(7), 775-808.
Hewitt, B. E., and Batchelor, B. (1975). “Punching shear strength of restrained slabs.” J.
Struct. Div., 101, 1837-53.

References 184
Huang, Y., Kang, T. H., Ramseyer, C., and Rha, C., (2010). "Background to multi-scale
modelling of unbonded Post-Tensioned concrete structures," Int. J. Theor. and Applied
Multiscale Mech., 1(3), 219-235.
IAR User Guide. (2009). IAR Embedded Workbench IDE user guide. IAR Systems AB.
IEEE 802.15.4 User Guide. (2014). IEEE 802.15.4 Stack User guide. NXP Laboratories,
Jahangir Alam, A. K. M., Amanat, K. M., and Seraj, S. M. (2009). “Experimental
investigation of edge restraint on punching shear behavior of RC slabs.” The IES J. Part A:
Civil & Struct. Eng., 2(1), 35-46.
Jin, C.; Qi, Y.S., and Luo, Z. Q. (2006) “The application of ZigBee on mine safety,” Safety
in Coal Mines, 9(2), 39-41.
Kaminetzky, D. (1991). Design and construction failures: Lessons from forensic
investigations. McGraw-Hill, New York, NY.
Kang T, H. ., and Wallace, J. W., (2006). "Punching of reinforced and post-tensioned
concrete slab-column connections," ACI Struct. J., 103(4), 531-540.
Keyvani, L., Sasani, M., and Mirzaei, Y., (2014). "Compressive membrane action in
progressive collapse resistance of RC flat plates," Eng. Struct., 59, 554-564.
Khan, S., and Williams, M., (1995). Post-tensioned concrete floors. Butterworth-
Heinemann Oxford.
Kim, J., Stanton, J. F., and MacRae, G. A. (2004). “Effect of beam growth on reinforced
concrete frames.” J. Struct. Eng., Ameerical Society of Civil Engineers, 130(9), 1333–42.
Kim, U., Kang, T. H. K., and Chakrabarti, P. R., (2012). "Rehabilitation of unbonded post-
tensioned slabs with different boundary conditions," PTI J., 8(2), 5-19.

References 185
King, S., and Delatte, N. J. (2004). “Collapse of 2000 Commonwealth Avenue: punching
shear case study.” J. Perform. Constr. Facil., 18(1), 54-61.
Kinnunen, S., and Nylander, H. (1960). “Punching of concrete slabs without shear
reinforcement.” Trans. Royal Instit. Tech., 3(158), 1-112. Stockholm, Sweden.
Knoll F., and Vogel T. (2009). Design for Robustness. Struct. Eng.
Kosut, G. M., Burns, N. H., and Winter, C. V., (1985). "Test of four-panel post-tensioned
flat plate," J. Struct. Eng., 111(9), 1916-1929.
Krauser, L. (2006). "Repairs, modifications, and strengthening with post-tensioning." PTI
J, 4(1), 24-40.
Kupfer, H., Hilsdorf, H. K., and Rusch, H. (1969). “Behavior of concrete under biaxial
stresses.” ACI J. Proc., American Concrete Institute, 656-666.
Lee, J., and Fenves, G. L. (1998). “Plastic-damage model for cyclic loading of concrete
structures.” J. Eng. Mech., 124(8), 892-900.
Long, A. E. (1975). “A two-phase approach to the prediction of the punching strength of
slabs.” ACI J. Proc., American Concrete Institute, 37-45.
Loo, Y. C., and Guan, H. (1997). “Cracking and punching shear failure analysis of RC flat
plates.” J. Struct. Eng., 123(10), 1321-1330.
Lubliner, L., Oller, S., Oliver, J., and Onate, E. (1989) ‘‘A plastic damage model for
nonlinear analysis of concrete.’’ Int. J. Solids Struct., 25(3), 299–326.
Megally, S., and Ghali, A. (2000). “Punching of concrete slabs due to column moment
transfer.” J. Struct. Eng., 126(2), 180-189.

References 186
Melo, G.S.S.A., and Regan, P.E. (1998). “Post-punching resistance of connections between
flat slabs and interior columns.” Mag. Conc. Res., 50(4), 319-327.
Millard S.G., and Johnson R. P. (1984). “Shear transfer across cracks in reinforced concrete
due to aggregate interlock and to dowel action.” Mag. Conc. Res., 36(126), 9 –21.
Mirzaei, Y. (2010). Post-punching behavior of Reinforced concrete slab. PhD thesis,
École Polytechnique Fédérale de Lausanne, 230 p., Switzerland.
http://infoscience.epfl.ch/record/148592/files/EPFL_TH4613.pdf
Mirzaei, Y., and Muttoni, A. (2008). “Tests of the post punching behavior of the reinforced
concrete flat slabs.” IBETON, Switzerland.
Mitchell, D., and Cook, W. D. (1984) “Preventing progressive collapse of slab structures.”
J. Struct. Eng., 110(7), pp. 1513-1532.
Mitchell, D. (1993). “Controversial issues in the seismic design of connections in
reinforced concrete frames. Proceedings of the Thomas Paulay Symposium—Recent
Developments in Lateral Force Transfer in Buildings.” UCSD, La Jolla, Calif. pp. 73–93.
Moe, J. (1961). Shearing strength of reinforced concrete slabs and footings under
concentrated loads. Development department bulletin No. D47, Portland Cement
Association, Skokie I11.
Müllers, I. (2007). Zur Robustheit im Hochbau: Stützenausfall als Gefährdungsbild für
Stahlbetontrag-werke, Ph.D. Thesis, ETH, Zurich, Switzerland.
Muttoni, A. (2008). “Punching shear strength of reinforced concrete slabs without
transverse reinforcement.” ACI Struct. J., 105(4), 440.

References 187
Muttoni, A., and Ruiz, M. F. (2008). “Shear strength of members without transverse
reinforcement as function of critical shear crack width.” ACI Struct. J., 105(2), 163.
Nilson, A., Darwin; D. and Dolan, C., (2010). Design of concrete structures. 14th edition.
McGraw-Hill.
Ockleston, A. (1955). “Load tests on a three storey reinforced concrete building in
Johannesburg.” Struct, Eng., 33(10), 304-322.
Ockleston, A. (1958). “Arching action in reinforced concrete slabs.” The Structural
Engineer, 36(6), 197-201.
Park, R. (1964). “The ultimate strength and long-term behavior of uniformly loaded, two-
way concrete slabs with partial lateral restraint at all edges.” Mag. Concrete Res., 16(48),
139-152.
Pinho Ramos, A., Lúcio, V. J., and Regan, P. E. (2011). “Punching of flat slabs with in-
plane forces.” Eng. Struct., 33(3), 894-902.
Polak, M. A. (1998). “Modeling punching shear of reinforced concrete slabs using layered
finite elements.” ACI Struct. J., 95(1), 71-80.
Ratay, C.R. (2007). "Progessive weakening to failure of an unbonded post-tensioned flat
plate," PTI J., 5(1), 23-35.
Sacramento, P. V. P., Ferreira, M. P., Oliveira, D. R. C., and Melo, G.S.S.A. (2012).
“Punching strength of reinforced concrete flat slabs without shear reinforcement”. Revista
IBRACON de Estruturas e Materiais, 5(5), 659-691.

References 188
Sagaseta, J., Muttoni, A., Ruiz, M. F., and Tassinari, L. (2011). “Non-axis-symmetrical
punching shear around internal columns of RC slabs without transverse reinforcement.”
Mag. Concrete Res., 63(6), 441-457.
Salim, W., and Sebastian, W. (2003). “Punching shear failure in reinforced concrete slabs
with compressive membrane action.” ACI Struct. J., 100(4), 471-479.
SAP2000, (2009). Linear and nonlinear static and dynamic analysis and design of three-
dimensional structures, Ver. 14, Computers and Structures Inc, Berkeley, CA.
Sasani, M and Sagiroglu, S. (2010). “Gravity load redistribution and progressive collapse
resistance of a 20-story RC structure following loss of an interior column.” Struct. J.,
American Concrete Institute, 107(6), 636-644.
Sasani, M. (2008). “Response of a reinforced concrete infilled-frame structure to removal
of two adjacent columns.” Eng. Struct., 30 (9), 2478-2491.
Sasani, M., and Sagiroglu, S., (2008). "Progressive collapse resistance of hotel San Diego,"
J.Struct.Eng., 134(3), 478-488.
Sasani, M., Bazan, M., and Sagiroglu, S., (2007). "Experimental and analytical progressive
collapse evaluation of actual reinforced concrete structure," ACI Struct. J., 104(6), 731-
739.
Sasani, M., Kazemi, A., Sagiroglu, S., and Forest, S. (2011). “Progressive collapse
resistance of an actual 11-story structure subjected to severe initial damage.” J. Struct.
Eng., 137(9), 893-902.
Schousboe, I. (1976). “Bailey’s Crossroads collapse reviewed.” J. Constr. Div., 102(2),
365-378.

References 189
Scordelis, A., Lin, T., and Itaya, R., (1959). Behavior of a Continuous Slab Prestressed in
Two Directions. Sacramento, California dept. of public works, division of architecture.
Serôdio, C.; J.B.C.; Raul Morais; Couto, C. and Monteiro, J. (2001) “A networked platform
for agricultural management systems," COMPUT ELECTRON AGR, 31(1), 75-90.
SIA 262. (2003). Concrete structures. Schweizerischer Ingenieur- und Architektenverein
(SIA), Zurich, Switzerland.
Sinha, B., Gerstle, K. H., and Tulin, L. G., (1964). "Stress-strain relations for concrete
under cyclic loading," ACI J. Proc., 61(2), 195-212.
Theodorakopoulos, D., and Swamy, R. (2002). “Ultimate punching shear strength analysis
of slab–column connections.” Cement Concrete Comp., 24(6), 509-521.
Vecchio, F., and Tang, K. (1990). “Membrane action in reinforced concrete slabs.” Can.
J. Civil Eng., 17(5), 686-697.
Vidosa, F. G.; Kotsovos, M. D., and Pavlovic, M. N. (1988). “Symmetrical punching of
reinforced concrete slabs: an analytical investigation based on nonlinear finite element
modeling.” ACI Struct. J., 85(3), 241-250.
Wang, W., and Teng, S. (2008). “Finite-element analysis of reinforced concrete flat plate
structures by layered shell element.” J. Struct. Eng., 134(12), 1862-1872.
Westergaard, H. M., and Slater, W. A. (1921). “Moments and stresses in slabs.” ACI J.
Proc., American Concrete Institute, 17(2), 415-538.
Wilson, E., and Habibullah, A., (2000). Structural Analysis Program SAP2000. Berkeley,
CA.

References 190
Yang, R. and Yang, T. (2005) “Wireless Sensor Network Based on ZigBee with
Applications for Smart Building,” Agricultural mechanization of China, 5, 76-79.
Yankelevsky, D. Z., and Reinhardt, H. W., (1987). "Response of plain concrete to cyclic
tension," ACI Mater. J., 84(5), 365-373.
Young, W. C., and Budynas, R. G., (2002). Roark's formulas for stress and strain, 7th
Edition, McGraw-Hill.
Yu, C.Y. (2006) "Application of Zigbee to Family’s Long- Distance Remote Control
Managing System," Journal of Dalian Nationalities University, 8(3), 60-61.
Zhang, N., Fu, C.C., and Che, H. (2011). "Experiment and numerical modeling of
prestressed concrete curved slab with spatial unbonded tendons," Eng. Struct., 33(3), 747-
756.
ZigBee Alliance. (2005) ZigBee Specifications, version 1.0.

Appendix 1: Wireless communication codes
Peer to peer communication
Sender code:
/*********************************************************************************** Initial Code for configuring the ADC without timer, DMA, ISR,sequential conversions and for one sensor was written by: Max Wolfe 7/21/2010 The code for RF communication was written by: Jin Tao Configuration of timer, DMA, ISR and seq. conversion for ADC and remainings written By: Leila Keyvani: [email protected], Archita Shah: [email protected], Justin Murray: [email protected] 6/20/2011 /*********************************************************************************** * INCLUDING HEADER FILES ************************************************************************************/ #include <hal_mboard/hal_led.h> #include <types/hal_assert.h> #include <hal_mboard/hal_board.h> #include <hal_module/hal_rf.h> #include <hal_module/basic_rf.h> #include <hal_module/hal_mcu.h> #include <hal_module/hal_int.h> #include <dev/cc2530/hal_timer_32k.h> #include <ioCC2530.h> /*********************************************************************************** * CONSTANTS

Appendix 1 192
************************************************************************************/ // Application parameters #define RF_CHANNEL 26 // 2.4 GHz RF channel // BasicRF address definitions #define APP_PAYLOAD_LENGTH 102 #define BUFFER_LENGTH 3728 //saves 38 packets with 98 bytes of data + 4 packet header #define PAN_ID 0x2010 #define LOCAL_ADDR 0xdead #define DEST_ADDR 0xbeef #define RF_BUFFER_LENGTH 3724 /*********************************************************************************** * LOCAL VARIABLES ***********************************************************************************/ // Defined two pointers for DMA and RF respectively both of which are pointing to the start of the packet initially. // DMA pointer(DmaCursor) points to the beginning of the memory space where the packet has to be written and the // RF pointer(RFCursor) points to the beginning of the packet that is to be sent. // Once the DMA is done writing to the initially pointed memory space, the DMA pointer will be transferred // and pointed to the second block of the memory. By this time, RF pointer is still pointing to the initial memory // space because that packet is to be still sent and then both the pointers would swap. static uint8 pTxData[BUFFER_LENGTH];// buffer length for filling the data static basicRfCfg_t basicRfConfig; static uint8 dma_conf [8]; //DMA configuration data structure static uint8* DMAcursor = (pTxData + 4); // pointer used by RF static uint8 counter = 0; // counts the number of ADC sequential conversions that is done static uint16 seq_no = 0; static uint8 RFflag = 0;

Appendix 1 193
/*********************************************************************************** * GLOBAL VARIABLES ***********************************************************************************/ void dmaInitial (uint8* destAddrss); void timer1Initial(); void packetStart(uint16 ,uint8* ); /*********************************************************************************** * LOCAL FUNCTIONS ***********************************************************************************/ //@brief: Handles the channel 0 interrupt and overflow. Increases the sequence number automatically every 7 ms. #pragma vector = T1_VECTOR __interrupt void timer1_ISR(void) { //channel 0 interrupt if(T1STAT & BIT0) //Clear timer1 channel 0 interrupt flag { T1STAT = (T1STAT &(0xF0)); //Clear Timer1 CPU interrupt flag IRCON &= (~0x02); counter ++; if (counter == 8)//Automatically increments sequence number every 10.5ms { seq_no ++; RFflag = 1; counter = 1; } }

Appendix 1 194
//overflow interrupt if (T1STAT & BIT5) //Clear timer1 overflow T1STAT = (T1STAT &(0x0F)); } //@brief: Handles the channel 0 interrupts. Dma interrupt service routine rearms when it is disarmed. #pragma vector = DMA_VECTOR __interrupt void dma_ISR(void) { //Clear DMA CPU interrupt flag IRCON &= (~0x01); //Clear DMA channel 0 DMAIRQ &= (~0x01); //Arm DMA channel 0 DMAARM |= 0x01; } /*********************************************************************************** @fn_name: main() @return: void ************************************************************************************/ void main(void) { uint16 RFindex = 0; // initalize board peripherals halBoardInit(); // initialize the RF basicRfConfig.panId = PAN_ID; basicRfConfig.channel = RF_CHANNEL; basicRfConfig.myAddr = LOCAL_ADDR; basicRfConfig.ackRequest = TRUE; if(basicRfInit(&basicRfConfig)==FAILED)

Appendix 1 195
{ HAL_ASSERT(FALSE); } basicRfReceiveOn(); // set maximum TX power, 4dBm halRfSetTxPower(0xF5); dmaInitial(DMAcursor);// start with original packet // Indicate that device is ready halLedSet(1); // set pins pin 0.0, pin 0.1 , pin0.2, pin 0.3, pin 0.4, pin 0.5, pin 0.6 and P0.7 to ADC operation mode APCFG |= BIT0 | BIT1 | BIT2 | BIT3 | BIT4 | BIT5 | BIT6 |BIT7 ; ADCCON1 = 0x2F;//0x2F is selected based on Page 137 User's guide CC253x TO START USING TIMER1 CHANNEL0 ADCCON2 = 0x76;// Controls how the sequence of conversions is performed //sets ADCCON2.SCH to end at channel 6 (AIN6 single-ended input), ADCCON2.SDIV to use 12 bit resolution, and //ADCCON2.SREF to use AIN7 single-ended reference voltage timer1Initial(); // transmit frames in an infinite loop while(1) { while (RFflag != 1); if(seq_no == 0xFFFF) seq_no = 1; packetStart(seq_no,pTxData+RFindex); RFflag = 0; for (uint8 i = 1; i<3; i++) {

Appendix 1 196
if (basicRfSendPacket(0xbeef, pTxData+RFindex, APP_PAYLOAD_LENGTH) == SUCCESS) { halLedToggle(1); break; } } RFindex = (RFindex + 98) % RF_BUFFER_LENGTH; //creates a circular buffer for RFCursor } } void basicRfProcessPacket(void) {} /*********************************************************************************** @fn_name: dmaInitial() @brief: Initial configuration for DMA data structure. Calling this function configures the DMA and ARMs channel 0 We use DMA channel 0 and sends the address of data structure to the channel 0 @return: void ************************************************************************************/ void dmaInitial (uint8* destAddrss) { DMA0CFGH = (uint8)(((uint16)dma_conf & 0xFF00) >> 8); DMA0CFGL = (uint8)((uint16)dma_conf & 0xFF); //Source address is LSB of ADC result register dma_conf[0] = (uint8)((uint16)(&X_ADCL)>> 8); dma_conf[1] = (uint8)((uint16)(&X_ADCL)); //Destination Address packet index #4 dma_conf[2] = (uint8)((uint16)(destAddrss) >> 8); // Destination address high dma_conf[3] = (uint8)((uint16)(destAddrss)); // Destination Address low // VLEN disabled, LEN is set to the maximum transfer of 1862

Appendix 1 197
dma_conf[4] = 0x07; // LEN is set to the maximum transfer of 1862 dma_conf[5] = 0x46; //16-bit word size - TMODE: Single - trigger source # 20 dma_conf[6] = 0; dma_conf[6] |= BIT7 |0x14; // SRC address No increment - DST Address +1 word increment - DMA channel interupt enabled - High priority dma_conf[7] = 0x1A; //Clear DMA CPU interrupt flag IRCON &= (~0x01); //clear interrupt flag if any DMAIRQ = 0; //Enable DMA interrupt DMAIE = 1; //Clear general DMA interrupt flag- ARM DMA DMAARM = 1; } /*********************************************************************************** @fn_name: timer1Initial() @brief: Clock Source is 32MHz XOSC - we use Timer tick speed of 1MHz in order to get 0.001ms Timer Speed. Timer1 Channel 0 is used in compare and modulo mode with counter which counts from 0 to 999 inclusive to get 1ms ADC Sensing Time (1000*0.001) @return: void ************************************************************************************/ void timer1Initial() { CLKCONCMD = 0; // changes the clock source from 16MHz to 32MHz while(CLKCONSTA != 0);// waits for 32MHz XOSC to be stable CLKCONCMD |= BIT5 | BIT3; // changes the timer tick speed to 1MHz

Appendix 1 198
while(CLKCONSTA != 0x28);// wait to be stable // clear interrupts T1STAT = (T1STAT &(0xF0)); T1STAT = (T1STAT &(0x0F)); //set up interrupts T1CCTL0 |= BIT6; //Enable interrupt on channel 0 TIMIF |= BIT6; // Enable overflow interrup T1CCTL1 &= (~BIT6); //Disable interrupt for channel 1 T1CCTL2 &= (~BIT6); //Disable interrupt for channel 2 //Enable timer 1 interrupts by setting (IEN1.T1IE = 1) T1IE = 1; // Enable global interrupt by setting (IEN0.EA =1) EA = 1; //set up timer setting T1CCTL0 |= BIT2 | BIT4; //Toggle on output, compare mode T1CC0H =0x05;//compare value timer 1.5 ms (counts from 0 to 1499 inclusively) T1CC0L =0xDB;//compare value T1CTL |= BIT1; // modulo mode No prescaler } /*********************************************************************************** @fn_name: packetStart() @brief: Writes the header (0xFF) and sequence number at the beginning of each packet that is to be transmitted. @return: void ************************************************************************************/ void packetStart(uint16 seq,uint8* packet) { packet[0] = 0xFF; packet[1] = 0xFF; packet[2] = (seq & 0xFF00) >> 8; packet[3] = (seq & 0x00FF); }

Appendix 1 199
Receiver codes
/*********************************************************************************** The original code was written by: Jin Tao Modified by: Leila Keyvani: [email protected], Archita Shah: [email protected], Justin Murray: [email protected] ***********************************************************************************/ /*********************************************************************************** INCLUDING HEADER FILES ***********************************************************************************/ #include <hal_mboard/hal_led.h> #include <types/hal_assert.h> #include <hal_mboard/hal_board.h> #include <hal_module/hal_rf.h> #include <hal_module/basic_rf.h> #include <hal_module/hal_mcu.h> #include <hal_module/hal_int.h> #include <dev/cc2530/hal_timer_32k.h> /*********************************************************************************** CONSTANTS ***********************************************************************************/ // Application parameters #define RF_CHANNEL 26 // 2.4 GHz RF channel // BasicRF address definitions #define APP_PAYLOAD_LENGTH 102 #define PAN_ID 0x2010 #define LOCAL_ADDR 0xbeef #define BUFFER_SIZE 3675 // 35 packets

Appendix 1 200
#define FRAME_SIZE 105 // UART Data Rate 230400bps #define BAUD_E 12 #define BAUD_M 216 /*********************************************************************************** * LOCAL VARIABLES ***********************************************************************************/ static uint8 frame[FRAME_SIZE]; static uint8 pRxData[APP_PAYLOAD_LENGTH]; static basicRfCfg_t basicRfConfig; static uint8 buffer[BUFFER_SIZE]; static uint16 buf_len; static uint16 buf_head; static uint8 uart_send_active; /*********************************************************************************** * LOCAL FUNCTIONS ***********************************************************************************/ void FramePacking(void); /*********************************************************************************** @fn_name: uart_init() @brief: @return: void ************************************************************************************/ void uart_init() { // select USART0 alt-1 pin layout. select USART1 alt-2 pin layout just to avoid conflicts. PERCFG = (PERCFG & ~BIT0) | BIT1; U0CSR = BIT7 | BIT6; // set UART mode for USART0 interface, and enable receiver

Appendix 1 201
P0SEL |= BIT2 | BIT3 | BIT4 | BIT5; // select p0 2,3,4 and 5 pins as peripheral I/O pins U0UCR = BIT1; // no flow control, 8-bit, no parity check, 1 stop bit, low stop bit, high start bit // set baud rate, and LSB first U0GCR = BAUD_E; U0BAUD = BAUD_M; UTX0IF = 0; // clear the interrupt flag } /*********************************************************************************** //@fn_name: uart_send() //@return: void ************************************************************************************/ void uart_send() { uart_send_active = 1; while(buf_len > 0) { U0DBUF = buffer[buf_head]; buf_head = (buf_head + 1) % BUFFER_SIZE; while(!UTX0IF); // check UART0 TX IF UTX0IF = 0; buf_len--; } uart_send_active = 0; } /*********************************************************************************** @fn_name: main() @return: void ************************************************************************************/ void main(void) {

Appendix 1 202
buf_len = 0; buf_head = 0; uart_send_active = 0; // Initalize board peripherals halBoardInit(); // Initialize the RF basicRfConfig.panId = PAN_ID; basicRfConfig.channel = RF_CHANNEL; basicRfConfig.myAddr = LOCAL_ADDR; basicRfConfig.ackRequest = FALSE; if(basicRfInit(&basicRfConfig)==FAILED) { HAL_ASSERT(FALSE); } basicRfReceiveOn(); halRfSetTxPower(0xF5); // sets maximum power 4db for RF uart_init(); halIntOn(); // enable global interrupt halLedSet(1); // Indicate that device is ready while(1) { // enter LPM0 sleep mode PCON |= 0x01; if(buf_len > 0 && !uart_send_active) uart_send(); } } /*********************************************************************************** @fn_name: basicRfProcessPacket() @return: void ************************************************************************************/

Appendix 1 203
void basicRfProcessPacket(void) { uint16 cursor = buf_head; if(basicRfPacketIsReady() == TRUE) { // read message from RX buffer if(basicRfReceive(pRxData, APP_PAYLOAD_LENGTH, NULL)>0) { // discard message if buffer is full if(BUFFER_SIZE - buf_len >= FRAME_SIZE) { FramePacking(); for(uint8 i=0; i < FRAME_SIZE; i++) { buffer[cursor] = frame[i]; cursor = (cursor+1 == BUFFER_SIZE) ? 0 : (cursor + 1); } buf_len += FRAME_SIZE; halLedToggle(1); } } } } //Leila Keyvani 7-18-2011 /***************************************************************** * @fn_name: FramePacking() * * * @return: void *****************************************************************/ void FramePacking( ) { uint8 CS = 0xFF; int i ; frame[0] = 0xFF; for(i = 1; i <FRAME_SIZE-3 ; i++){ //Insert data byte-by-byte frame[i] = pRxData[i]; CS = frame[i]^CS; }
Appendix 1 204
frame[FRAME_SIZE-3] = 0x00; //Adding DLE,ETX to the end frame[FRAME_SIZE-2] = 0x00; CS = CS ^ frame[FRAME_SIZE-3]; CS = CS ^ frame[FRAME_SIZE-2]; frame[FRAME_SIZE-1] = CS; //Adding the checksum }

Appendix 1 205
Serial reader
/* * serial_reader.c * * Created on: Nov 17, 2009 * Author: taojin <[email protected]> * Modified by Leila Keyvani <[email protected]>, Archita Shah <[email protected]>, Justin Murray <[email protected]> * logs results are received from 7 potentiometers */ /************************************************************************************** INCLUDING HEADER FILES **************************************************************************************/ #include <stdio.h> #include <stdlib.h> #include <termios.h> #include <fcntl.h> #include <unistd.h> #include <string.h> #include <stdint.h> #include <time.h> #include <sys/time.h> #include <sys/ioctl.h> /*********************************************************************************** CONSTANTS ***********************************************************************************/ // Application parameters #define FRAME_SIZE 105 /************************************************************************************** GLOBAL VARIABLES **************************************************************************************/ static uint8_t buffer[FRAME_SIZE];

Appendix 1 206
int fd; static uint8_t CS; /************************************************************************************* LOCAL FUNCTIONS *************************************************************************************/ /************************************************************************************* @fn_name: usage() @brief: Prints an error message if the device name and the file name are not mentioned @return: void *************************************************************************************/ void usage() { printf("usage: serial_io [devicename] [log file name]\n"); } int check_header(void); int buffer_ready(); float result(int i); int valid_Packet(void); int check_End(void); int check_Sum(void); /************************************************************************************* @fn_name: main() @brief: Reads data from serial port and saves that data in a log file @return: integer *************************************************************************************/ int main(int argc, char *argv[])
Appendix 1 207
{ struct termios cfg; FILE *log; uint8_t timestamp = 1; uint16_t prevSeq = 0; uint16_t s_seq; struct timeval start, end; struct tm *tmtime; int rcvd = 0; int rcvdSens = 0; int tmp = 0; int i = 0; //long difftime; char *devname; char *logname; char loctime[30]; float Data [7]; int ActualL; uint32_t NewSeq = 0; uint32_t count = 0; if(argc != 3) { usage(); exit(1); } devname = argv[1]; logname = argv[2]; printf("opening device %s\n", devname); // open serial device fd = open(devname, O_RDWR | O_NOCTTY); if(fd == -1) { printf("failed to open devices %s\n", devname); exit(1); } if(!isatty(fd)) {

Appendix 1 208
printf("%s is NOT a serial device\n", devname); exit(1); } // open log file log = fopen(logname, "a"); if(log == NULL) { printf("error opening logfile\n"); exit(1); } // configure serial interface memset((void*)&cfg, 0, sizeof(struct termios)); cfg.c_cflag = B230400 | CS8 | CLOCAL | CREAD; // baud rate 230400bps, 8bit character size, cfg.c_iflag = IGNBRK; // ignore break condition cfg.c_oflag = 0; cfg.c_lflag = 0; // set non-canonical mode cfg.c_iflag &= ~(IXON|IXOFF|IXANY); // disable software flow control cfg.c_cflag &= ~CSTOPB; // set 1 stop bit if(tcsetattr(fd, TCSANOW, &cfg) == -1) { printf("error configuring %s\n", devname); close(fd); exit(1); } fprintf(log, "No.Sent\tNo.Received\tP0.0\tP0.1\tP0.2\tP0.3\tP0.4\tP0.5\tP0.6\n"); printf("No.Sent\tNo.Received\tP0.0\tP0.1\tP0.2\tP0.3\tP0.4\tP0.5\tP0.6\n"); fflush(stdout); // tcflush cannot properly flush the serial buffer. // have to wait for a while usleep(400000); // clear everything in INPUT buffer.

Appendix 1 209
tcflush(fd, TCIFLUSH); //time stamp received packet gettimeofday(&end, NULL); tmtime = localtime(&end.tv_sec); strftime(loctime,30,"%a %x %X",tmtime); printf("Program started at: %s:%.1f\n",loctime,end.tv_usec/(float)1000); fprintf(log, "Program started at: %s:%.1f\n",loctime,end.tv_usec/(float)1000); // keep reading byte stream from serial interface while(1) { while(valid_Packet()!= 1); if (timestamp == 1) { //time stamp received packet gettimeofday(&end, NULL); tmtime = localtime(&end.tv_sec); strftime(loctime,30,"%a %x %X",tmtime); printf("Data received at: %s:%.1f\n",loctime,end.tv_usec/(float)1000); fprintf(log, "Data received at: %s:%.1f\n",loctime,end.tv_usec/(float)1000); timestamp = 0; } s_seq = ((uint16_t)buffer[2] << 8) + buffer[3];// call the sequence number of the new pkt if (s_seq == prevSeq) { continue; }

Appendix 1 210
//converts input 16 bit sequence number to 32 bit if (prevSeq > s_seq ) { count++;} prevSeq = s_seq; NewSeq = count * 0xFFFE + s_seq ; // seq_no does not have 0xFFFF and 0x0000 // infer how many pkts sender has sent so far rcvd++; for (i=4; i<89; i+=14) { Data[0] = result(i); Data[1] = result(i+2); Data[2] = result(i+4); Data[3] = result(i+6); Data[4] = result(i+8); Data[5] = result(i+10); Data[6] = result(i+12); printf("%-8d\t%-5d\t%-6.3f\t%-6.3f\t%-6.3f\t%-6.3f\t%-6.3f\t%-6.3f\t%-6.3f\n", NewSeq, rcvd, Data[0], Data[1],Data[2],Data[3],Data[4],Data[5],Data[6]); fprintf(log,"%-8d\t%-5d\t%-6.3f\t%-6.3f\t%-6.3f\t%-6.3f\t%-6.3f\t%-6.3f\t%-6.3f\n", NewSeq, rcvd, Data[0],Data[1],Data[2],Data[3],Data[4],Data[5],Data[6]); // avoid expensive I/O operation if(tmp == 10) { fflush(log); tmp = 0; } } } close(fd); exit(0); }

Appendix 1 211
/************************************************************************************* @fn_name: check_header() @return: integer *************************************************************************************/ int check_header(void) { int j=0; for(j=0;j<=1;j++) { while(read(fd,buffer+j,1) != 1); if (buffer[j] != 0xFF) {printf("\nincorrect header: [0] = %X, [1] = %X\n", buffer[0], buffer[1]); return 0; } else continue; } return 1; } /************************************************************************************* @fn_name: buffer_ready() @brief: Expecting to read remaining (FRAME_SIZE-2) bytes. However, not all the (FRAME_SIZE-2) bytes might be ready It reads as many bytes as available return the number of bytes read. @return: integer *************************************************************************************/ int buffer_ready(void) { int i; int ActualL; int ExpL = FRAME_SIZE-2; ActualL = read(fd, buffer+FRAME_SIZE-ExpL, ExpL); //Read the buffer while((ExpL -= ActualL)!= 0)

Appendix 1 212
{ ActualL = read(fd, buffer+FRAME_SIZE-ExpL, ExpL); //Read the buffer } return 1; //indicates that the buffer is ready } /************************************************************************************* @fn_name: check_End() @return: integer *************************************************************************************/ int check_End(void) { if ((buffer[FRAME_SIZE-3]== 0x00)&& (buffer[FRAME_SIZE-2] == 0x00)) { return 1; } else return 0; } /************************************************************************************* @fn_name: check_Sum() @return: integer *************************************************************************************/ int check_Sum(void) { int i; CS = 0; for(i = 2; i <FRAME_SIZE-1; i++){ //add up data byte-by-byte CS = CS ^ buffer[i]; } if ( CS == buffer[FRAME_SIZE-1]) return 1;

Appendix 1 213
else return 0; } /************************************************************************************* @fn_name: valid_Packet() @return: integer *************************************************************************************/ int valid_Packet(void) { while (check_header()!= 1); while (buffer_ready()!= 1); if (check_End()==1) if (check_Sum() == 1) { return 1;} else {printf("invalid packet buffer[104]= %X, CS = %X\n",buffer[104], CS ); return 0;} else {printf("invalid buffer End"); return 0;} } /************************************************************************************* @fn_name: result() @return: float *************************************************************************************/ float result(int i) { if((buffer[i+1] >> 7)==1) return (float)(((255-buffer[i+1])<<4)|((255-buffer[i])>>4)+1)/-2048; else

Appendix 1 214
return (float)(((uint16_t)buffer[i+1]<< 4) | ((uint16_t)buffer[i] >> 4))/2047; }

Appendix 1 215
Multi-hop communication
Configuration parameters
/*
* Modified by Leila Keyvani ([email protected]) * Compiler command-line options used to define a TI Z-Stack ZigBee device. * To move an option from here to the project file, comment out or delete the * option from this file and enter it into the "Define Symbols" box under the * Preprocessor tab of the C/C++ Compiler Project Options. New user defined * options may be added to this file, as necessary. * * Each macro is prefixed with '-D'. The entries are to be constructed as if * they are to be on the compiler command line invocation (which they are). * * NOTE: The RHS (Right-Hand-Side) must be quoted if there are embedded blanks. * See the DEFAULT_KEY definition for an example. */ /* Enable ZigBee-Pro */ -DZIGBEEPRO /* Set to 0 for no security, otherwise non-0 */ -DSECURE=0 -DZG_SECURE_DYNAMIC=0 /* Enable the Reflector */ -DREFLECTOR /* Default channel is Channel 26 - 0x1A */ // Channels are defined in the following: // 0 : 868 MHz 0x00000001 // 1 - 10 : 915 MHz 0x000007FE // 11 - 26 : 2.4 GHz 0x07FFF800 // //-DMAX_CHANNELS_868MHZ 0x00000001 //-DMAX_CHANNELS_915MHZ 0x000007FE //-DMAX_CHANNELS_24GHZ 0x07FFF800 -DDEFAULT_CHANLIST=0x04000000 // 26 - 0x1A //-DDEFAULT_CHANLIST=0x02000000 // 25 - 0x19 //-DDEFAULT_CHANLIST=0x01000000 // 24 - 0x18 //-DDEFAULT_CHANLIST=0x00800000 // 23 - 0x17 //-DDEFAULT_CHANLIST=0x00400000 // 22 - 0x16

Appendix 1 216
//-DDEFAULT_CHANLIST=0x00200000 // 21 - 0x15 //-DDEFAULT_CHANLIST=0x00100000 // 20 - 0x14 //-DDEFAULT_CHANLIST=0x00080000 // 19 - 0x13 //-DDEFAULT_CHANLIST=0x00040000 // 18 - 0x12 //-DDEFAULT_CHANLIST=0x00020000 // 17 - 0x11 //-DDEFAULT_CHANLIST=0x00010000 // 16 - 0x10 //-DDEFAULT_CHANLIST=0x00008000 // 15 - 0x0F //-DDEFAULT_CHANLIST=0x00004000 // 14 - 0x0E //-DDEFAULT_CHANLIST=0x00002000 // 13 - 0x0D //-DDEFAULT_CHANLIST=0x00001000 // 12 - 0x0C //-DDEFAULT_CHANLIST=0x00000800 // 11 - 0x0B /* Define the default PAN ID. * * Setting this to a value other than 0xFFFF causes * ZDO_COORD to use this value as its PAN ID and * Routers and end devices to join PAN with this ID */ -DZDAPP_CONFIG_PAN_ID=0x0001 /* Minimum number of milliseconds to hold off the start of the device * in the network and the minimum delay between joining cycles. */ -DNWK_START_DELAY=100 /* Mask for the random joining delay. This value is masked with * the return from osal_rand() to get a random delay time for * each joining cycle. This random value is added to NWK_START_DELAY. * For example, a value of 0x007F will be a joining delay of 0 to 127 * milliseconds. */ -DEXTENDED_JOINING_RANDOM_MASK=0x007F /* Minimum number of milliseconds to delay between each beacon request * in a joining cycle. */ -DBEACON_REQUEST_DELAY=100 /* Mask for the random beacon request delay. This value is masked with the * return from osal_rand() to get a random delay time for each joining cycle. * This random value is added to DBEACON_REQUEST_DELAY. For example, a value * of 0x00FF will be a beacon request delay of 0 to 255 milliseconds. */ -DBEACON_REQ_DELAY_MASK=0x00FF /* Jitter mask for the link status report timer. This value is masked with the * return from osal_rand() to add a random delay to _NIB.nwkLinkStatusPeriod. * For example, a value of 0x007F allows a jitter between 0-127 milliseconds. */

Appendix 1 217
-DLINK_STATUS_JITTER_MASK=0x007F /* in seconds; set to 0 to turn off route expiry */ -DROUTE_EXPIRY_TIME=30 /* This number is used by polled devices, since the spec'd formula * doesn't work for sleeping end devices. For non-polled devices, * a formula is used. Value is in 2 milliseconds periods */ -DAPSC_ACK_WAIT_DURATION_POLLED=3000 /* Default indirect message holding timeout value: * 1-65535 (0 -> 65536) X CNT_RTG_TIMER X RTG_TIMER_INTERVAL */ -DNWK_INDIRECT_MSG_TIMEOUT=7 /* The number of simultaneous route discoveries in network */ -DMAX_RREQ_ENTRIES=8 /* The maximum number of retries allowed after a transmission failure */ -DAPSC_MAX_FRAME_RETRIES=3 /* Max number of times retry looking for the next hop address of a message */ -DNWK_MAX_DATA_RETRIES=2 /* Number of times retry to poll parent before indicating loss of synchronization * with parent. Note that larger value will cause longer delay for the child to * rejoin the network. */ -DMAX_POLL_FAILURE_RETRIES=2 /* The number of items in the broadcast table */ -DMAX_BCAST=9 /* The maximum number of groups in the groups table */ -DAPS_MAX_GROUPS=16 /* Number of entries in the regular routing table plus additional * entries for route repair */ -DMAX_RTG_ENTRIES=40 /* Maximum number of entries in the Binding table. */ -DNWK_MAX_BINDING_ENTRIES=4 /* Maximum number of cluster IDs for each binding table entry. * Note that any value other than the default value may cause a * compilation warning but Device Binding will function correctly. */ -DMAX_BINDING_CLUSTER_IDS=4 /* Default security key. */ -DDEFAULT_KEY="{0x01, 0x03, 0x05, 0x07, 0x09, 0x0B, 0x0D, 0x0F, 0x00, 0x02, 0x04, 0x06, 0x08, 0x0A, 0x0C, 0x0D}" /* Reset when ASSERT occurs, otherwise flash LEDs */ //-DASSERT_RESET /* Set the MAC MAX Frame Size (802.15.4 default is 102) */

Appendix 1 218
-DMAC_MAX_FRAME_SIZE=130 /* Minimum transmissions attempted for Channel Interference detection, * Frequency Agility can be disabled by setting this parameter to zero. */ -DZDNWKMGR_MIN_TRANSMISSIONS=20 /* Compiler keywords */ -DCONST="const __code" -DGENERIC=__generic /**************************************** * The following are for End Devices only ***************************************/ -DRFD_RCVC_ALWAYS_ON=FALSE /* The number of milliseconds to wait between data request polls to the coordinator. */ -DPOLL_RATE=1000 /* This is used after receiving a data indication to poll immediately * for queued messages...in milliseconds. */ -DQUEUED_POLL_RATE=100 /* This is used after receiving a data confirmation to poll immediately * for response messages...in milliseconds */ -DRESPONSE_POLL_RATE=100 /* This is used as an alternate response poll rate only for rejoin request. * This rate is determined by the response time of the parent that the device * is trying to join. */
-DREJOIN_POLL_RATE=440

Appendix 1 219
Sensor code
/************************************************************************************************** Filename: DemoSensor.c Description: Sensor application for the Mysensor network utilizing the Simple API. The sensor application binds to a gateway and will periodically read temperature and supply voltage from the ADC and send report towards the gateway node. Modified by Leila Keyvani ([email protected]) Copyright 2009 Texas Instruments Incorporated. All rights reserved. IMPORTANT: Your use of this Software is limited to those specific rights granted under the terms of a software license agreement between the user who downloaded the software, his/her employer (which must be your employer) and Texas Instruments Incorporated (the "License"). You may not use this Software unless you agree to abide by the terms of the License. The icense limits your use, and you acknowledge, that the Software may not be modified, copied or distributed unless embedded on a Texas Instruments microcontroller or used solely and exclusively in conjunction with a Texas Instruments radio frequency transceiver, which is integrated into your product. Other than for the foregoing purpose, you may not use, reproduce, copy, prepare derivative works of, modify, distribute, perform, display or sell this Software and/or its documentation for any purpose. YOU FURTHER ACKNOWLEDGE AND AGREE THAT THE SOFTWARE AND DOCUMENTATION ARE PROVIDED “AS IS” WITHOUT WARRANTY OF ANY KIND, EITHER EXPRESS OR IMPLIED, INCLUDING WITHOUT LIMITATION, ANY WARRANTY OF MERCHANTABILITY, TITLE, NON-INFRINGEMENT AND FITNESS FOR A PARTICULAR PURPOSE. IN NO EVENT SHALL TEXAS INSTRUMENTS OR ITS LICENSORS BE LIABLE OR OBLIGATED UNDER CONTRACT, NEGLIGENCE, STRICT LIABILITY, CONTRIBUTION, BREACH OF WARRANTY, OR OTHER

Appendix 1 220
LEGAL EQUITABLE THEORY ANY DIRECT OR INDIRECT DAMAGES OR EXPENSES INCLUDING BUT NOT LIMITED TO ANY INCIDENTAL, SPECIAL, INDIRECT, PUNITIVE OR CONSEQUENTIAL DAMAGES, LOST PROFITS OR LOST DATA, COST OF PROCUREMENT OF SUBSTITUTE GOODS, TECHNOLOGY, SERVICES, OR ANY CLAIMS BY THIRD PARTIES (INCLUDING BUT NOT LIMITED TO ANY DEFENSE THEREOF), OR OTHER SIMILAR COSTS. Should you have any questions regarding your right to use this Software, contact Texas Instruments Incorporated at www.TI.com. **************************************************************************************************/ /****************************************************************************** * INCLUDES */ #include "ZComDef.h" #include "OSAL.h" #include "sapi.h" #include "hal_key.h" #include "hal_lcd.h" #include "hal_led.h" #include "hal_adc.h" #include "hal_mcu.h" #include "hal_uart.h" #include "DemoApp.h" /****************************************************************************** * CONSTANTS */ #define REPORT_FAILURE_LIMIT 4 #define ACK_REQ_INTERVAL 5 // each 5th packet is sent with ACK request // Application States #define APP_INIT 0 // Initial state

Appendix 1 221
#define APP_START 1 // Sensor has joined network #define APP_BIND 2 // Sensor is in process of binding #define APP_REPORT 4 // Sensor is in reporting state // Application osal event identifiers // Bit mask of events ( from 0x0000 to 0x00FF ) #define MY_START_EVT 0x0001 #define MY_REPORT_EVT 0x0002 #define MY_FIND_COLLECTOR_EVT 0x0004 // ADC definitions for CC2430/CC2530 from the hal_adc.c file #if defined (HAL_MCU_CC2530) #define HAL_ADC_REF_125V 0x00 /* Internal 1.25V Reference */ #define HAL_ADC_DEC_064 0x00 /* Decimate by 64 : 8-bit resolution */ #define HAL_ADC_DEC_128 0x10 /* Decimate by 128 : 10-bit resolution */ #define HAL_ADC_DEC_512 0x30 /* Decimate by 512 : 14-bit resolution */ #define HAL_ADC_CHN_VDD3 0x0f /* Input channel: VDD/3 */ #define HAL_ADC_CHN_TEMP 0x0e /* Temperature sensor */ #endif // HAL_MCU_CC2530 /****************************************************************************** * TYPEDEFS */ /****************************************************************************** * LOCAL VARIABLES */ static uint8 appState = APP_INIT; static uint8 reportState = FALSE; static uint8 reportFailureNr = 0; static uint16 myReportPeriod = 200; // milliseconds static uint16 myBindRetryDelay = 2000; // milliseconds

Appendix 1 222
static uint16 parentShortAddr; /****************************************************************************** * GLOBAL VARIABLES */ // Inputs and Outputs for Sensor device #define NUM_OUT_CMD_SENSOR 1 #define NUM_IN_CMD_SENSOR 0 // List of output and input commands for Sensor device const cId_t zb_OutCmdList[NUM_OUT_CMD_SENSOR] = { SENSOR_REPORT_CMD_ID }; // Define SimpleDescriptor for Sensor device const SimpleDescriptionFormat_t zb_SimpleDesc = { MY_ENDPOINT_ID, // Endpoint MY_PROFILE_ID, // Profile ID DEV_ID_SENSOR, // Device ID DEVICE_VERSION_SENSOR, // Device Version 0, // Reserved NUM_IN_CMD_SENSOR, // Number of Input Commands (cId_t *) NULL, // Input Command List NUM_OUT_CMD_SENSOR, // Number of Output Commands (cId_t *) zb_OutCmdList // Output Command List }; /****************************************************************************** * LOCAL FUNCTIONS */ void uartRxCB( uint8 port, uint8 event ); static void sendReport(void); static int8 readTemp(void); static uint8 readVoltage(void);

Appendix 1 223
/***************************************************************************** * @fn zb_HandleOsalEvent * * @brief The zb_HandleOsalEvent function is called by the operating * system when a task event is set * * @param event - Bitmask containing the events that have been set * * @return none */ void zb_HandleOsalEvent( uint16 event ) { if(event & SYS_EVENT_MSG) { } if( event & ZB_ENTRY_EVENT ) { // blind LED 1 to indicate joining a network HalLedBlink ( HAL_LED_1, 0, 50, 500 ); // Start the device zb_StartRequest(); } if ( event & MY_REPORT_EVT ) { if ( appState == APP_REPORT ) { sendReport(); osal_start_timerEx( sapi_TaskID, MY_REPORT_EVT, myReportPeriod ); } } if ( event & MY_FIND_COLLECTOR_EVT ) { // Delete previous binding if ( appState==APP_REPORT ) {

Appendix 1 224
zb_BindDevice( FALSE, SENSOR_REPORT_CMD_ID, (uint8 *)NULL ); } appState = APP_BIND; // blind LED 2 to indicate discovery and binding HalLedBlink ( HAL_LED_2, 0, 50, 500 ); // Find and bind to a collector device zb_BindDevice( TRUE, SENSOR_REPORT_CMD_ID, (uint8 *)NULL ); } } /****************************************************************************** * @fn zb_HandleKeys * * @brief Handles all key events for this device. * * @param shift - true if in shift/alt. * @param keys - bit field for key events. Valid entries: * EVAL_SW4 * EVAL_SW3 * EVAL_SW2 * EVAL_SW1 * * @return none */ void zb_HandleKeys( uint8 shift, uint8 keys ) { // Shift is used to make each button/switch dual purpose. if ( shift ) { if ( keys & HAL_KEY_SW_1 ) { } if ( keys & HAL_KEY_SW_2 ) { } if ( keys & HAL_KEY_SW_3 ) { } if ( keys & HAL_KEY_SW_4 ) {

Appendix 1 225
} } else { if ( keys & HAL_KEY_SW_1 ) { } if ( keys & HAL_KEY_SW_2 ) { } if ( keys & HAL_KEY_SW_3 ) { // Start reporting osal_set_event( sapi_TaskID, MY_REPORT_EVT ); reportState = TRUE; } if ( keys & HAL_KEY_SW_4 ) { } } } /****************************************************************************** * @fn zb_StartConfirm * * @brief The zb_StartConfirm callback is called by the ZigBee stack * after a start request operation completes * * @param status - The status of the start operation. Status of * ZB_SUCCESS indicates the start operation completed * successfully. Else the status is an error code. * * @return none */ void zb_StartConfirm( uint8 status ) { // If the device sucessfully started, change state to running if ( status == ZB_SUCCESS ) {

Appendix 1 226
// Change application state appState = APP_START; // Set LED 1 to indicate that node is operational on the network HalLedSet( HAL_LED_1, HAL_LED_MODE_ON ); // Update the display #if defined ( LCD_SUPPORTED ) HalLcdWriteString( "Mysensor Network", HAL_LCD_LINE_1 ); HalLcdWriteString( "Sensor", HAL_LCD_LINE_2 ); #endif // Store parent short address zb_GetDeviceInfo(ZB_INFO_PARENT_SHORT_ADDR, &parentShortAddr); // Set event to bind to a collector osal_set_event( sapi_TaskID, MY_FIND_COLLECTOR_EVT ); } } /****************************************************************************** * @fn zb_SendDataConfirm * * @brief The zb_SendDataConfirm callback function is called by the * ZigBee after a send data operation completes * * @param handle - The handle identifying the data transmission. * status - The status of the operation. * * @return none */ void zb_SendDataConfirm( uint8 handle, uint8 status ) { if(status != ZB_SUCCESS) { if ( ++reportFailureNr >= REPORT_FAILURE_LIMIT ) { // Stop reporting osal_stop_timerEx( sapi_TaskID, MY_REPORT_EVT );

Appendix 1 227
// After failure reporting start automatically when the device // is binded to a new gateway reportState=TRUE; // Try binding to a new gateway osal_set_event( sapi_TaskID, MY_FIND_COLLECTOR_EVT ); reportFailureNr=0; } } // status == SUCCESS else { // Reset failure counter reportFailureNr=0; } } /****************************************************************************** * @fn zb_BindConfirm * * @brief The zb_BindConfirm callback is called by the ZigBee stack * after a bind operation completes. * * @param commandId - The command ID of the binding being confirmed. * status - The status of the bind operation. * * @return none */ void zb_BindConfirm( uint16 commandId, uint8 status ) { if( status == ZB_SUCCESS ) { appState = APP_REPORT; HalLedSet( HAL_LED_2, HAL_LED_MODE_ON ); // After failure reporting start automatically when the device // is binded to a new gateway if ( reportState )

Appendix 1 228
{ // Start reporting osal_set_event( sapi_TaskID, MY_REPORT_EVT ); } } else { osal_start_timerEx( sapi_TaskID, MY_FIND_COLLECTOR_EVT, myBindRetryDelay ); } } /****************************************************************************** * @fn zb_AllowBindConfirm * * @brief Indicates when another device attempted to bind to this device * * @param * * @return none */ void zb_AllowBindConfirm( uint16 source ) { } /****************************************************************************** * @fn zb_FindDeviceConfirm * * @brief The zb_FindDeviceConfirm callback function is called by the * ZigBee stack when a find device operation completes. * * @param searchType - The type of search that was performed. * searchKey - Value that the search was executed on. * result - The result of the search. * * @return none */

Appendix 1 229
void zb_FindDeviceConfirm( uint8 searchType, uint8 *searchKey, uint8 *result ) { } /****************************************************************************** * @fn zb_ReceiveDataIndication * * @brief The zb_ReceiveDataIndication callback function is called * asynchronously by the ZigBee stack to notify the application * when data is received from a peer device. * * @param source - The short address of the peer device that sent the data * command - The commandId associated with the data * len - The number of bytes in the pData parameter * pData - The data sent by the peer device * * @return none */ void zb_ReceiveDataIndication( uint16 source, uint16 command, uint16 len, uint8 *pData ) { } /****************************************************************************** * @fn uartRxCB * * @brief Callback function for UART * * @param port - UART port * event - UART event that caused callback * * @return none */ void uartRxCB( uint8 port, uint8 event ) { }

Appendix 1 230
/****************************************************************************** * @fn sendReport * * @brief Send sensor report * * @param none * * @return none */ static void sendReport(void) { uint8 pData[SENSOR_REPORT_LENGTH]; static uint8 reportNr=0; uint8 txOptions; // Read and report temperature value pData[SENSOR_TEMP_OFFSET] = readTemp(); // Read and report voltage value pData[SENSOR_VOLTAGE_OFFSET] = readVoltage(); pData[SENSOR_PARENT_OFFSET] = HI_UINT16(parentShortAddr); pData[SENSOR_PARENT_OFFSET + 1] = LO_UINT16(parentShortAddr); // Set ACK request on each ACK_INTERVAL report // If a report failed, set ACK request on next report if ( ++reportNr<ACK_REQ_INTERVAL && reportFailureNr==0 ) { txOptions = AF_TX_OPTIONS_NONE; } else { txOptions = AF_MSG_ACK_REQUEST; reportNr = 0; } // Destination address 0xFFFE: Destination address is sent to previously // established binding for the commandId. zb_SendDataRequest( 0xFFFE, SENSOR_REPORT_CMD_ID, SENSOR_REPORT_LENGTH, pData, 0, txOptions, 0 ); }

Appendix 1 231
/****************************************************************************** * @fn readTemp * * @brief read temperature from ADC * * @param none * * @return temperature */ static int8 readTemp(void) { static uint16 voltageAtTemp22; static uint8 bCalibrate=TRUE; // Calibrate the first time the temp sensor is read uint16 value; int8 temp; #if defined (HAL_MCU_CC2530) ATEST = 0x01; TR0 |= 0x01; /* Clear ADC interrupt flag */ ADCIF = 0; ADCCON3 = (HAL_ADC_REF_125V | HAL_ADC_DEC_512 | HAL_ADC_CHN_TEMP); /* Wait for the conversion to finish */ while ( !ADCIF ); /* Get the result */ value = ADCL; value |= ((uint16) ADCH) << 8; // Use the 12 MSB of adcValue value >>= 4; /* * These parameters are typical values and need to be calibrated * See the datasheet for the appropriate chip for more details * also, the math below may not be very accurate */

Appendix 1 232
/* Assume ADC = 1480 at 25C and ADC = 4/C */ #define VOLTAGE_AT_TEMP_25 1480 #define TEMP_COEFFICIENT 4 // Calibrate for 22C the first time the temp sensor is read. // This will assume that the demo is started up in temperature of 22C if(bCalibrate) { voltageAtTemp22=value; bCalibrate=FALSE; } temp = 22 + ( (value - voltageAtTemp22) / TEMP_COEFFICIENT ); // Set 0C as minimum temperature, and 100C as max if( temp >= 100) { return 100; } else if (temp <= 0) { return 0; } else { return temp; } // Only CC2530 is supported #else return 0; #endif } /****************************************************************************** * @fn readVoltage * * @brief read voltage from ADC * * @param none * * @return voltage */ static uint8 readVoltage(void) { #if defined (HAL_MCU_CC2530)

Appendix 1 233
uint16 value; // Clear ADC interrupt flag ADCIF = 0; ADCCON3 = (HAL_ADC_REF_125V | HAL_ADC_DEC_128 | HAL_ADC_CHN_VDD3); // Wait for the conversion to finish while ( !ADCIF ); // Get the result value = ADCL; value |= ((uint16) ADCH) << 8; // value now contains measurement of Vdd/3 // 0 indicates 0V and 32767 indicates 1.25V // voltage = (value*3*1.25)/32767 volts // we will multiply by this by 10 to allow units of 0.1 volts value = value >> 6; // divide first by 2^6 value = (uint16)(value * 37.5); value = value >> 9; // ...and later by 2^9...to prevent overflow during multiplication return value; #else return 0; #endif // CC2530 }

Appendix 1 234
Collector code
/************************************************************************************************** Filename: DemoCollector.c Description: Collector application for the MySensor network utilizing Simple API. Modified by Leila Keyvani([email protected]) The collector node can be set in a state where it accepts incoming reports from the sensor nodes, and can send the reports via the UART to a PC tool. The collector node in this state functions as a gateway. The collector nodes that are not in the gateway node function as routers in the network. Copyright 2009 Texas Instruments Incorporated. All rights reserved. IMPORTANT: Your use of this Software is limited to those specific rights granted under the terms of a software license agreement between the user who downloaded the software, his/her employer (which must be your employer) and Texas Instruments Incorporated (the "License"). You may not use this Software unless you agree to abide by the terms of the License. The License limits your use, and you acknowledge, that the Software may not be modified, copied or distributed unless embedded on a Texas Instruments microcontroller or used solely and exclusively in conjunction with a Texas Instruments radio frequency transceiver, which is integrated into your product. Other than for the foregoing purpose, you may not use, reproduce, copy, prepare derivative works of, modify, distribute, perform, display or sell this Software and/or its documentation for any purpose. YOU FURTHER ACKNOWLEDGE AND AGREE THAT THE SOFTWARE AND DOCUMENTATION ARE PROVIDED “AS IS” WITHOUT WARRANTY OF ANY KIND, EITHER EXPRESS OR IMPLIED, INCLUDING WITHOUT LIMITATION, ANY WARRANTY OF MERCHANTABILITY, TITLE, NON-INFRINGEMENT AND FITNESS FOR A PARTICULAR PURPOSE. IN NO EVENT SHALL

Appendix 1 235
TEXAS INSTRUMENTS OR ITS LICENSORS BE LIABLE OR OBLIGATED UNDER CONTRACT, NEGLIGENCE, STRICT LIABILITY, CONTRIBUTION, BREACH OF WARRANTY, OR OTHER LEGAL EQUITABLE THEORY ANY DIRECT OR INDIRECT DAMAGES OR EXPENSES INCLUDING BUT NOT LIMITED TO ANY INCIDENTAL, SPECIAL, INDIRECT, PUNITIVE OR CONSEQUENTIAL DAMAGES, LOST PROFITS OR LOST DATA, COST OF PROCUREMENT OF SUBSTITUTE GOODS, TECHNOLOGY, SERVICES, OR ANY CLAIMS BY THIRD PARTIES (INCLUDING BUT NOT LIMITED TO ANY DEFENSE THEREOF), OR OTHER SIMILAR COSTS. Should you have any questions regarding your right to use this Software, contact Texas Instruments Incorporated at www.TI.com. **************************************************************************************************/ /****************************************************************************** * INCLUDES */ #include "ZComDef.h" #include "OSAL.h" #include "OSAL_Nv.h" #include "sapi.h" #include "hal_key.h" #include "hal_led.h" #include "hal_lcd.h" #include "hal_uart.h" #include "DemoApp.h" /****************************************************************************** * CONSTANTS */ #define REPORT_FAILURE_LIMIT 4 #define ACK_REQ_INTERVAL 5 // each 5th packet is sent with ACK request

Appendix 1 236
// General UART frame offsets #define FRAME_SOF_OFFSET 0 #define FRAME_LENGTH_OFFSET 1 #define FRAME_CMD0_OFFSET 2 #define FRAME_CMD1_OFFSET 3 #define FRAME_DATA_OFFSET 4 #define FRAME_DATA_START 2 #define FRAME_EOF_OFFSET 102 // ZB_RECEIVE_DATA_INDICATION offsets #define ZB_RECV_SRC_OFFSET 0 #define ZB_RECV_CMD_OFFSET 2 #define ZB_RECV_LEN_OFFSET 4 #define ZB_RECV_DATA_OFFSET 6 #define ZB_RECV_FCS_OFFSET 8 // ZB_RECEIVE_DATA_INDICATION frame length #define ZB_RECV_LENGTH 105 // PING response frame length and offset #define SYS_PING_RSP_LENGTH 7 #define SYS_PING_CMD_OFFSET 1 // Stack Profile #define ZIGBEE_2007 0x0040 #define ZIGBEE_PRO_2007 0x0041 #ifdef ZIGBEEPRO #define STACK_PROFILE ZIGBEE_PRO_2007 #else #define STACK_PROFILE ZIGBEE_2007 #endif #define CPT_SOP 0xFF #define EOF_DEL 0x00 #define SYS_PING_REQUEST 0x0021 #define SYS_PING_RESPONSE 0x0161 #define ZB_RECEIVE_DATA_INDICATION 0x8746 // Application States #define APP_INIT 0 #define APP_START 2 #define APP_BINDED 3

Appendix 1 237
// Application osal event identifiers #define MY_START_EVT 0x0001 #define MY_REPORT_EVT 0x0002 #define MY_FIND_COLLECTOR_EVT 0x0004 /****************************************************************************** * TYPEDEFS */ typedef struct { uint16 source; uint16 parent; uint8 temp; uint8 voltage; } gtwData_t; /****************************************************************************** * LOCAL VARIABLES */ static uint8 appState = APP_INIT; static uint8 reportState = FALSE; static uint8 myStartRetryDelay = 10; // milliseconds static uint8 isGateWay = FALSE; static uint16 myBindRetryDelay = 2000; // milliseconds static uint16 myReportPeriod = 2000; // milliseconds static uint8 reportFailureNr = 0; static uint16 parentShortAddr; static gtwData_t gtwData; /****************************************************************************** * LOCAL FUNCTIONS */ static uint8 calcFCS(uint8 *pBuf, uint8 len); static void sysPingReqRcvd(void); static void sysPingRsp(void); static void sendGtwReport(gtwData_t *gtwData);

Appendix 1 238
static void sendDummyReport(void); /****************************************************************************** * GLOBAL VARIABLES */ // Inputs and Outputs for Collector device #define NUM_OUT_CMD_COLLECTOR 2 #define NUM_IN_CMD_COLLECTOR 2 // List of output and input commands for Collector device const cId_t zb_InCmdList[NUM_IN_CMD_COLLECTOR] = { SENSOR_REPORT_CMD_ID, DUMMY_REPORT_CMD_ID }; const cId_t zb_OutCmdList[NUM_IN_CMD_COLLECTOR] = { SENSOR_REPORT_CMD_ID, DUMMY_REPORT_CMD_ID }; // Define SimpleDescriptor for Collector device const SimpleDescriptionFormat_t zb_SimpleDesc = { MY_ENDPOINT_ID, // Endpoint MY_PROFILE_ID, // Profile ID DEV_ID_COLLECTOR, // Device ID DEVICE_VERSION_COLLECTOR, // Device Version 0, // Reserved NUM_IN_CMD_COLLECTOR, // Number of Input Commands (cId_t *) zb_InCmdList, // Input Command List NUM_OUT_CMD_COLLECTOR, // Number of Output Commands (cId_t *) zb_OutCmdList // Output Command List }; /****************************************************************************** * FUNCTIONS */

Appendix 1 239
/****************************************************************************** * @fn zb_HandleOsalEvent * * @brief The zb_HandleOsalEvent function is called by the operating * system when a task event is set * * @param event - Bitmask containing the events that have been set * * @return none */ void zb_HandleOsalEvent( uint16 event ) { uint8 logicalType; if(event & SYS_EVENT_MSG) { } if( event & ZB_ENTRY_EVENT ) { // Initialise UART initUart(uartRxCB); // blind LED 1 to indicate starting/joining a network HalLedBlink ( HAL_LED_1, 0, 50, 500 ); HalLedSet( HAL_LED_2, HAL_LED_MODE_OFF ); // Read logical device type from NV zb_ReadConfiguration(ZCD_NV_LOGICAL_TYPE, sizeof(uint8), &logicalType); // Start the device zb_StartRequest(); } if ( event & MY_START_EVT ) { zb_StartRequest(); }

Appendix 1 240
if ( event & MY_REPORT_EVT ) { if (isGateWay) { osal_start_timerEx( sapi_TaskID, MY_REPORT_EVT, myReportPeriod ); } else if (appState == APP_BINDED) { // sendDummyReport(); //osal_start_timerEx( sapi_TaskID, MY_REPORT_EVT, myReportPeriod ); } } if ( event & MY_FIND_COLLECTOR_EVT ) { // Find and bind to a gateway device (if this node is not gateway) if (!isGateWay) { zb_BindDevice( TRUE, DUMMY_REPORT_CMD_ID, (uint8 *)NULL ); } } } /****************************************************************************** * @fn zb_HandleKeys * * @brief Handles all key events for this device. * * @param shift - true if in shift/alt. * @param keys - bit field for key events. Valid entries: * EVAL_SW4 * EVAL_SW3 * EVAL_SW2 * EVAL_SW1 * * @return none */ void zb_HandleKeys( uint8 shift, uint8 keys ) { static uint8 allowBind=FALSE;

Appendix 1 241
static uint8 allowJoin=TRUE; uint8 logicalType; // Shift is used to make each button/switch dual purpose. if ( shift ) { if ( keys & HAL_KEY_SW_1 ) { } if ( keys & HAL_KEY_SW_2 ) { } if ( keys & HAL_KEY_SW_3 ) { } if ( keys & HAL_KEY_SW_4 ) { } } else { if ( keys & HAL_KEY_SW_1 ) { if ( appState == APP_INIT ) { // Key 1 starts device as a coordinator logicalType = ZG_DEVICETYPE_COORDINATOR; zb_WriteConfiguration(ZCD_NV_LOGICAL_TYPE, sizeof(uint8), &logicalType); // Reset the device with new configuration zb_SystemReset(); } } if ( keys & HAL_KEY_SW_2 ) { allowBind ^= 1; if (allowBind) { // Turn ON Allow Bind mode infinitly zb_AllowBind( 0xFF ); HalLedSet( HAL_LED_2, HAL_LED_MODE_ON ); //This node is the gateway node

Appendix 1 242
isGateWay = TRUE; // Update the display #if defined ( LCD_SUPPORTED ) HalLcdWriteString( "Gateway Mode", HAL_LCD_LINE_2 ); #endif } else { // Turn OFF Allow Bind mode infinitly zb_AllowBind( 0x00 ); HalLedSet( HAL_LED_2, HAL_LED_MODE_OFF ); isGateWay = FALSE; // Update the display #if defined ( LCD_SUPPORTED ) HalLcdWriteString( "Collector", HAL_LCD_LINE_2 ); #endif } } if ( keys & HAL_KEY_SW_3 ) { // Start reporting osal_set_event( sapi_TaskID, MY_REPORT_EVT ); } if ( keys & HAL_KEY_SW_4 ) { // Key 4 is used to control which routers // that can accept join requests allowJoin ^= 1; if(allowJoin) { NLME_PermitJoiningRequest(0xFF); } else { NLME_PermitJoiningRequest(0); } } } } /****************************************************************************** * @fn zb_StartConfirm

Appendix 1 243
* * @brief The zb_StartConfirm callback is called by the ZigBee stack * after a start request operation completes * * @param status - The status of the start operation. Status of * ZB_SUCCESS indicates the start operation completed * successfully. Else the status is an error code. * * @return none */ void zb_StartConfirm( uint8 status ) { // If the device sucessfully started, change state to running if ( status == ZB_SUCCESS ) { // Set LED 1 to indicate that node is operational on the network HalLedSet( HAL_LED_1, HAL_LED_MODE_ON ); // Update the display #if defined ( LCD_SUPPORTED ) HalLcdWriteString( "Mysensor network", HAL_LCD_LINE_1 ); HalLcdWriteString( "Collector", HAL_LCD_LINE_2 ); #endif // Change application state appState = APP_START; // Set event to bind to a collector osal_set_event( sapi_TaskID, MY_FIND_COLLECTOR_EVT ); // Store parent short address zb_GetDeviceInfo(ZB_INFO_PARENT_SHORT_ADDR, &parentShortAddr); } else { // Try again later with a delay osal_start_timerEx( sapi_TaskID, MY_START_EVT, myStartRetryDelay );

Appendix 1 244
} } /****************************************************************************** * @fn zb_SendDataConfirm * * @brief The zb_SendDataConfirm callback function is called by the * ZigBee stack after a send data operation completes * * @param handle - The handle identifying the data transmission. * status - The status of the operation. * * @return none */ void zb_SendDataConfirm( uint8 handle, uint8 status ) { if ( status != ZB_SUCCESS && !isGateWay ) { if ( ++reportFailureNr>=REPORT_FAILURE_LIMIT ) { // Stop reporting osal_stop_timerEx( sapi_TaskID, MY_REPORT_EVT ); // After failure reporting start automatically when the device // is binded to a new gateway reportState=TRUE; // Delete previous binding zb_BindDevice( FALSE, DUMMY_REPORT_CMD_ID, (uint8 *)NULL ); // Try binding to a new gateway osal_set_event( sapi_TaskID, MY_FIND_COLLECTOR_EVT ); reportFailureNr=0; } } else if ( !isGateWay ) { reportFailureNr=0;

Appendix 1 245
} } /****************************************************************************** * @fn zb_BindConfirm * * @brief The zb_BindConfirm callback is called by the ZigBee stack * after a bind operation completes. * * @param commandId - The command ID of the binding being confirmed. * status - The status of the bind operation. * * @return none */ void zb_BindConfirm( uint16 commandId, uint8 status ) { if( status == ZB_SUCCESS ) { appState = APP_BINDED; // Set LED2 to indicate binding successful HalLedSet ( HAL_LED_2, HAL_LED_MODE_ON ); // After failure reporting start automatically when the device // is binded to a new gateway if ( reportState ) { // Start reporting osal_set_event( sapi_TaskID, MY_REPORT_EVT ); } } else { osal_start_timerEx( sapi_TaskID, MY_FIND_COLLECTOR_EVT, myBindRetryDelay ); } } /****************************************************************************** * @fn zb_AllowBindConfirm

Appendix 1 246
* * @brief Indicates when another device attempted to bind to this device * * @param * * @return none */ void zb_AllowBindConfirm( uint16 source ) { } /****************************************************************************** * @fn zb_FindDeviceConfirm * * @brief The zb_FindDeviceConfirm callback function is called by the * ZigBee stack when a find device operation completes. * * @param searchType - The type of search that was performed. * searchKey - Value that the search was executed on. * result - The result of the search. * * @return none */ void zb_FindDeviceConfirm( uint8 searchType, uint8 *searchKey, uint8 *result ) { } /****************************************************************************** * @fn zb_ReceiveDataIndication * * @brief The zb_ReceiveDataIndication callback function is called * asynchronously by the ZigBee stack to notify the application * when data is received from a peer device.

Appendix 1 247
* * @param source - The short address of the peer device that sent the data * command - The commandId associated with the data * len - The number of bytes in the pData parameter * pData - The data sent by the peer device * * @return none */ void zb_ReceiveDataIndication( uint16 source, uint16 command, uint16 len, uint8 *pData ) { gtwData.parent = BUILD_UINT16(pData[SENSOR_PARENT_OFFSET+ 1], pData[SENSOR_PARENT_OFFSET]); gtwData.source=source; gtwData.temp=*pData; gtwData.voltage=*(pData+1); // Flash LED 2 once to indicate data reception HalLedSet ( HAL_LED_2, HAL_LED_MODE_FLASH ); // Update the display #if defined ( LCD_SUPPORTED ) HalLcdWriteScreen( "Report", "rcvd" ); #endif // Send gateway report sendGtwReport(>wData); } /****************************************************************************** * @fn uartRxCB * * @brief Callback function for UART * * @param port - UART port * event - UART event that caused callback * * @return none */ void uartRxCB( uint8 port, uint8 event ) { uint8 pBuf[RX_BUF_LEN];

Appendix 1 248
uint16 cmd; uint16 len; if ( event != HAL_UART_TX_EMPTY ) { // Read from UART len = HalUARTRead( HAL_UART_PORT_0, pBuf, RX_BUF_LEN ); if ( len>0 ) { cmd = BUILD_UINT16(pBuf[SYS_PING_CMD_OFFSET+ 1], pBuf[SYS_PING_CMD_OFFSET]); if( (pBuf[FRAME_SOF_OFFSET] == CPT_SOP) && (cmd == SYS_PING_REQUEST) ) { sysPingReqRcvd(); } } } } /****************************************************************************** * @fn sysPingReqRcvd * * @brief Ping request received * * @param none * * @return none */ static void sysPingReqRcvd(void) { sysPingRsp(); } /****************************************************************************** * @fn sysPingRsp * * @brief Build and send Ping response *

Appendix 1 249
* @param none * * @return none */ static void sysPingRsp(void) { uint8 pBuf[SYS_PING_RSP_LENGTH]; // Start of Frame Delimiter pBuf[FRAME_SOF_OFFSET] = CPT_SOP; // Length pBuf[FRAME_LENGTH_OFFSET] = 2; // Command type pBuf[FRAME_CMD0_OFFSET] = LO_UINT16(SYS_PING_RESPONSE); pBuf[FRAME_CMD1_OFFSET] = HI_UINT16(SYS_PING_RESPONSE); // Stack profile pBuf[FRAME_DATA_OFFSET] = LO_UINT16(STACK_PROFILE); pBuf[FRAME_DATA_OFFSET+ 1] = HI_UINT16(STACK_PROFILE); // Frame Check Sequence pBuf[SYS_PING_RSP_LENGTH - 1] = calcFCS(&pBuf[FRAME_LENGTH_OFFSET], (SYS_PING_RSP_LENGTH - 2)); // Write frame to UART HalUARTWrite(HAL_UART_PORT_0,pBuf, SYS_PING_RSP_LENGTH); } /****************************************************************************** * @fn sendGtwReport * * @brief Build and send gateway report * * @param none * * @return none */ static void sendGtwReport(gtwData_t *gtwData) { uint8 pFrame[ZB_RECV_LENGTH]; //int i;

Appendix 1 250
// Start of Frame Delimiter pFrame[FRAME_SOF_OFFSET] = CPT_SOP; // Start of Frame Delimiter pFrame[FRAME_SOF_OFFSET+1] = CPT_SOP; // Length //pFrame[FRAME_LENGTH_OFFSET] = 10; No need for length // Command type //pFrame[FRAME_CMD0_OFFSET] = LO_UINT16(ZB_RECEIVE_DATA_INDICATION); //pFrame[FRAME_CMD1_OFFSET] = HI_UINT16(ZB_RECEIVE_DATA_INDICATION); // Source address //pFrame[FRAME_DATA_OFFSET+ ZB_RECV_SRC_OFFSET] = LO_UINT16(gtwData->source); //pFrame[FRAME_DATA_OFFSET+ ZB_RECV_SRC_OFFSET+ 1] = HI_UINT16(gtwData->source); // Command ID //pFrame[FRAME_DATA_OFFSET+ ZB_RECV_CMD_OFFSET] = LO_UINT16(SENSOR_REPORT_CMD_ID); //pFrame[FRAME_DATA_OFFSET+ ZB_RECV_CMD_OFFSET+ 1] = HI_UINT16(SENSOR_REPORT_CMD_ID); // Length //pFrame[FRAME_DATA_OFFSET+ ZB_RECV_LEN_OFFSET] = LO_UINT16(4); //pFrame[FRAME_DATA_OFFSET+ ZB_RECV_LEN_OFFSET+ 1] = HI_UINT16(4); // Data //for (i=0;i<102;i+=2) //{ pFrame[FRAME_DATA_START+ 0] = gtwData->temp; pFrame[FRAME_DATA_START+ 1] = gtwData->voltage; //pFrame[FRAME_DATA_OFFSET+ ZB_RECV_DATA_OFFSET+ 2] = LO_UINT16(gtwData->parent); //pFrame[FRAME_DATA_OFFSET+ ZB_RECV_DATA_OFFSET+ 3] = HI_UINT16(gtwData->parent); // End of Frame Delimiter pFrame[FRAME_EOF_OFFSET] = EOF_DEL; //End of Frame Delimiter pFrame[FRAME_EOF_OFFSET+1] = EOF_DEL;

Appendix 1 251
// Frame Check Sequence pFrame[ZB_RECV_LENGTH - 1] = calcFCS(&pFrame[FRAME_LENGTH_OFFSET+1], (ZB_RECV_LENGTH - 2) ); // Write report to UART HalUARTWrite(HAL_UART_PORT_0,pFrame, ZB_RECV_LENGTH); } /****************************************************************************** * @fn sendDummyReport * * @brief Send dummy report (used to visualize collector nodes on PC GUI) * * @param none * * @return none */ static void sendDummyReport(void) { uint8 pData[SENSOR_REPORT_LENGTH]; static uint8 reportNr=0; uint8 txOptions; // dummy report data pData[SENSOR_TEMP_OFFSET] = 0xFF; pData[SENSOR_VOLTAGE_OFFSET] = 0xFF; pData[SENSOR_PARENT_OFFSET] = HI_UINT16(parentShortAddr); pData[SENSOR_PARENT_OFFSET+ 1] = LO_UINT16(parentShortAddr); // Set ACK request on each ACK_INTERVAL report // If a report failed, set ACK request on next report if ( ++reportNr<ACK_REQ_INTERVAL && reportFailureNr==0 ) { txOptions = AF_TX_OPTIONS_NONE; } else { txOptions = AF_MSG_ACK_REQUEST; reportNr = 0; }

Appendix 1 252
// Destination address 0xFFFE: Destination address is sent to previously // established binding for the commandId. zb_SendDataRequest( 0xFFFE, DUMMY_REPORT_CMD_ID, SENSOR_REPORT_LENGTH, pData, 0, txOptions, 0 ); } /****************************************************************************** * @fn calcFCS * * @brief This function calculates the FCS checksum for the serial message * * @param pBuf - Pointer to the end of a buffer to calculate the FCS. * len - Length of the pBuf. * * @return The calculated FCS. ****************************************************************************** */ static uint8 calcFCS(uint8 *pBuf, uint8 len) { uint8 rtrn = 0; while (len--) { rtrn ^= *(pBuf++); } return rtrn; }
Bold items are the major changes in the code by Leila Keyvani

Appendix 2: Design work sheet
h (mm) 200 slab concrete cover (mm) 28
longer span length (m) 6 additional dead load (kN/m2) 1.4
shorter span length (m) 6 concrete unit weight (kN/m3) 25
column size (m) 0.3 Live load (kN/m2) 2.4
clear span(m) 5.7 Total factored load (kN/m2) 11.52
Preliminary design a) control of deflection:
hmin (mm) 190
b) shear strength of slab:
Pick h>hmin (mm) 200
d (mm) 172
Factored dead load (kN/m2) 7.68
Factored live load (kN/m2) 3.84
Total factored load (kN/m2) 11.52
b‐1) beam‐type shear strength of slab
Vu @ d (kN) 30.8
Vc (kN) =0.17 . .
160
beam‐type shear? OK
b‐2) punching shear strenth of slab
b0 (mm) 1888
Vu (kN) 412
Vc (kN) 587
Punching shear? OK

Appendix 2 254
Flexural design of longitudinal dir.
wu (kN/m^2) 11.52
Mo (kN.m) 280.71
Moment distribution:
Location total M (kN.m) Column strip Middle strip
(Total ‐ column strip)
End span: Perc.
Ext. Negative (0.26Mo) 73 100% 73 0
Positive (0.52Mo) 146 60% 87.6 58.4
Int. Negative (0.7 Mo) 196.5 75% 147.37 49.12
Int. Span
positive (0.35 Mo) 98.3 60% 58.98 39.32
negative (0.65 Mo) 182.5 75% 136.87 45.65
Design for maximum moment (Int. Negative)
Design Reinforcement
M max (kN.m) 147.375 Calculated diam (mm)
@ (mm)
width of the strip (m) 3 9.2 100
Rn (kN/m2) 1845028 11.2 150
reinf. Ratio (Ro) 0.00384 13 200
Asmin (mm2) 1080 14.5 250
As req'd (mm2) 1981 Pick (diam size @ spacing)
As used (mm2) 2010 16 300
Verify tension controlled
a (mm) 13.14 Tension
controlled? Yes!
c (depth of N.A.) (mm) 15.46
(tensile strain) 0.030
Related Documents