EPA EPSCoR Progress Report Harrell E. Hurst, Ph.D. - 1 – Progress Report Part 1: Web Summary Report NCER Assistance Agreement Annual Report Summary Period Covered by the Report: September 1, 2003 – August 31, 2004 Date of Report: August 31, 2004 EPA Grant Number: R829419 Title: Biomarkers for Air Pollutants: Development of Hemoglobin Adduct Methodology for Assessment of Exposure to Butadienes and Polycyclic Aromatic Hydrocarbons, SEER project of SIP: Experimental Program To Stimulate Competitive Research (EPSCoR) From The Commonwealth Of Kentucky Investigators: Harrell E. Hurst and Steven R. Myers Institution: University of Louisville Research Category: EPSCoR Project Period: October 1, 2001 - September 30, 2005 Aims of the Project: We proposed to develop methodology that will measure systemic exposures to chloroprene (2- chloro-1,3-butadiene CAS-126-99-8) and selected polycyclic aromatic hydrocarbons (PAH: fluoranthene, CAS# 205-44-0; benzo(a)pyrene, CAS# 50-32-8). The methods involve detection and measurement of covalent adducts to the abundant blood protein hemoglobin (Hb) as biomarkers of exposure. The postulated adducts are formed by electrophilic epoxide metabolites of these compounds. Analysis involves synthesis of derivatives of chloroprene epoxide adducts through Edman cleavage of globin N-terminal valine adducts, or hydrolysis of PAH adducts bound at other more labile sites. Quantification of adducts derived from chloroprene is accomplished by selected ion monitoring gas chromatography/mass spectrometry (SIM-GC/MS) using stable isotope internal standards. Adducts from PAH exposure are analyzed after acid hydrolysis of labile PAH-Hb carboxylate adducts. SEER Component 1: Development of Methods to detect Hemoglobin (Hb) Adducts of Chloroprene Harrell E. Hurst, Ph.D., Professor Dept. Pharmacology and Toxicology University of Louisville Louisville, KY 40292 Progress Summary: During the third year of this, grant research focused on refinement of working assays for measurement of Hb adducts. Selected ion monitoring GC/MS methods have been developed for assay of Hb adducts formed from (1-chloroethenyl)oxirane, also known as chloroprene epoxide or CEO. The adduct detection methods rely on sequential Edman cleavage and trimethylsilylation reactions. Limits of detection and quantification of analytical methods of CEO-valine adducts are of the order of 1 and 10 picomoles of adduct per mg globin. These limits are anticipated to be inadequate to use this assay for chloroprene human exposure assessment at parts-per-billion levels in ambient air. However, exposure levels in the parts-per-million range should be detectable. Insight has been gained into mechanism of detoxification of

Welcome message from author
This document is posted to help you gain knowledge. Please leave a comment to let me know what you think about it! Share it to your friends and learn new things together.
Transcript
EPA EPSCoR Progress Report Harrell E. Hurst, Ph.D.
- 1 –
Progress Report Part 1: Web Summary Report NCER Assistance Agreement Annual Report Summary Period Covered by the Report: September 1, 2003 – August 31, 2004 Date of Report: August 31, 2004 EPA Grant Number: R829419 Title: Biomarkers for Air Pollutants: Development of Hemoglobin Adduct Methodology for Assessment of Exposure to Butadienes and Polycyclic Aromatic Hydrocarbons, SEER project of SIP: Experimental Program To Stimulate Competitive Research (EPSCoR) From The Commonwealth Of Kentucky Investigators: Harrell E. Hurst and Steven R. Myers Institution: University of Louisville Research Category: EPSCoR Project Period: October 1, 2001 - September 30, 2005 Aims of the Project: We proposed to develop methodology that will measure systemic exposures to chloroprene (2-chloro-1,3-butadiene CAS-126-99-8) and selected polycyclic aromatic hydrocarbons (PAH: fluoranthene, CAS# 205-44-0; benzo(a)pyrene, CAS# 50-32-8). The methods involve detection and measurement of covalent adducts to the abundant blood protein hemoglobin (Hb) as biomarkers of exposure. The postulated adducts are formed by electrophilic epoxide metabolites of these compounds. Analysis involves synthesis of derivatives of chloroprene epoxide adducts through Edman cleavage of globin N-terminal valine adducts, or hydrolysis of PAH adducts bound at other more labile sites. Quantification of adducts derived from chloroprene is accomplished by selected ion monitoring gas chromatography/mass spectrometry (SIM-GC/MS) using stable isotope internal standards. Adducts from PAH exposure are analyzed after acid hydrolysis of labile PAH-Hb carboxylate adducts. SEER Component 1: Development of Methods to detect Hemoglobin (Hb) Adducts of Chloroprene Harrell E. Hurst, Ph.D., Professor Dept. Pharmacology and Toxicology University of Louisville Louisville, KY 40292 Progress Summary: During the third year of this, grant research focused on refinement of working assays for measurement of Hb adducts. Selected ion monitoring GC/MS methods have been developed for assay of Hb adducts formed from (1-chloroethenyl)oxirane, also known as chloroprene epoxide or CEO. The adduct detection methods rely on sequential Edman cleavage and trimethylsilylation reactions. Limits of detection and quantification of analytical methods of CEO-valine adducts are of the order of 1 and 10 picomoles of adduct per mg globin. These limits are anticipated to be inadequate to use this assay for chloroprene human exposure assessment at parts-per-billion levels in ambient air. However, exposure levels in the parts-per-million range should be detectable. Insight has been gained into mechanism of detoxification of
EPA EPSCoR Progress Report Harrell E. Hurst, Ph.D.
- 2 –
toxicologically-significant metabolite of chloroprene. Reactions of CEO with N-terminal valines in mouse red cell hemoglobin have been characterized kinetically. Additionally a method was developed to resolve chromatographically the R- and S-enantiomers of (1-chloroethenyl)oxirane. The methods were used to explore a glutathione dependent mechanism of degradation of (1-chloroethenyl)oxirane, an active metabolite of chloroprene. From the latter work, enantiomeric selectivity in the destruction of chloroprene epoxide was discovered using a red blood cell incubation system in vitro. This discovery led to formulation of the hypothesis that the enantiomeric selectivity results from glutathione S-transferase mediated degradation of the S-enantiomer of chloroprene epoxide. Publications from Project during 2003- 2004: Results of this work have been presented at the following sites:
Ali, M.Y. and Hurst, H.E. Development of a GC/MS method to determine hemoglobin N-valine adducts from (1-chloroethenyl)oxirane, a chloroprene metabolite. Research! Louisville2003 Postgraduate Research Day, November 4, 2003. Myers, S.R., Cunningham, C, Wright, T. and Hurst, H.E. Kinetics of reaction of epoxide metabolites of polycyclic aromatic hydrocarbons with human and mouse hemoglobin. 43rd Annual Meeting, Society of Toxicology, Baltimore, MD, March 22, 2004. Hurst, H.E. and Ali, M.Y. Analysis of hemoglobin N-valine adducts from (1-chloroethenyl)oxirane, a metabolite of chloroprene. 43rd Annual Meeting, Society of Toxicology, Baltimore, MD, March 23, 2004.
Hurst, H.E.: Analysis of hemoglobin n-valine adducts from (1-chloroethenyl)oxirane, a metabolite of chloroprene, 10th Annual Kentucky EPSCoR Conference Lexington, KY, May 13, 2004.
Planned Future Activities: Efforts will continue toward refinement of GC/MS and other MS techniques for quantification of CEO adducts in mouse globin following exposure to CEO. An objective will be to maximize detection of trace amounts of the globin adducts that result from exposure to CEO. As refinement of the assay for these adducts is accomplished, mice will be treated with chloroprene to examine suitability of the mass spectrometric assay(s) as a biomarker of chloroprene exposure. Additional work will focus on the specificity of glutathione S-transferase for detoxification of enantiomers of CEO. Relevant Web Site: www.louisville.edu/~hehurs01/
EPA EPSCoR Progress Report Harrell E. Hurst, Ph.D.
- 3 –
Part 2: Progress Report NCER Assistance Agreement Annual Report Period Covered by the Report: September 1, 2003 – August 31, 2004 Date of Report: August 31, 2004 EPA Grant Number: R829419 Title: Biomarkers for Air Pollutants: Development of Hemoglobin Adduct Methodology for Assessment of Exposure to Butadienes and Polycyclic Aromatic Hydrocarbons, SEER project of SIP: Experimental Program To Stimulate Competitive Research (EPSCoR) From The Commonwealth Of Kentucky Investigators: Harrell E. Hurst and Steven R. Myers Institution: University of Louisville Research Category: EPSCoR Project Period: October 1, 2001 - September 30, 2005 Aims of the Project: We proposed to develop methodology that will measure systemic exposures to chloroprene (2-chloro-1,3-butadiene CAS-126-99-8) and selected polycyclic aromatic hydrocarbons (PAH: fluoranthene, CAS# 205-44-0; benzo(a)pyrene, CAS# 50-32-8). The methods involve detection and measurement of covalent adducts to the abundant blood protein hemoglobin (Hb) as biomarkers of exposure. The postulated adducts are formed by electrophilic epoxide metabolites of these compounds. Analysis involves synthesis of derivatives of chloroprene epoxide adducts through Edman cleavage of globin N-terminal valine adducts, or hydrolysis of PAH adducts bound at other more labile sites. Quantification of adducts derived from chloroprene is accomplished by selected ion monitoring gas chromatography/mass spectrometry (SIM-GC/MS) using stable isotope internal standards. Adducts from PAH exposure are analyzed after acid hydrolysis of labile PAH-Hb carboxylate adducts. SEER Component 1: Development of Methods to detect Hemoglobin (Hb) Adducts of Chloroprene Harrell E. Hurst, Ph.D., Professor Dept. Pharmacology and Toxicology University of Louisville Louisville, KY 40292 Progress Summary: During the third year of this, grant research focused on refinement of working assays for measurement of Hb adducts. Two selected ion monitoring GC/MS methods have been developed for assay of Hb adducts formed from (1-chloroethenyl)oxirane, also known as chloroprene epoxide or CEO. The adduct detection methods rely on sequential Edman cleavage and trimethylsilylation reactions. Limits of detection and quantification of analytical methods of CEO-valine adducts are of the order of 1 and 10 picomoles of adduct per mg globin. These limits are anticipated to be inadequate to use this assay for chloroprene human exposure assessment at parts-per-billion levels in ambient air. However, exposure levels in the parts-per-million range should be detectable. Insight has been gained into mechanism of detoxification of toxicologically-significant metabolite of chloroprene. Reactions of CEO with N-terminal valines
EPA EPSCoR Progress Report Harrell E. Hurst, Ph.D.
- 4 –
in mouse red cell hemoglobin have been characterized kinetically. Additionally, a method was developed to resolve chromatographically the R- and S-enantiomers of (1-chloroethenyl)oxirane, a significant toxic metabolite of chloroprene. The methods were used to explore a glutathione dependent mechanism of degradation of (1-chloroethenyl)oxirane. From the latter work, enantiomeric selectivity in the destruction of chloroprene epoxide was discovered using a red blood cell incubation system in vitro. This discovery led to formulation of the hypothesis that the enantiomeric selectivity results from glutathione S-transferase mediated degradation of the S-enantiomer of chloroprene epoxide, and may have impact on the carcinogenicity of chloroprene. Key Personnel: Md. Yeakub Ali, Ph.D., who joined the project in September, 2002, has been supported by this work and has contributed to this research since that time. Part time student workers contributed efforts during the summer, 2004. Discussion of Expenditures to Date: Expenditures involving personnel, supplies, and travel are similar to those projected in the original schedule. Expenditures for animals have lagged behind schedule due to the need to resolve analytical issues prior to performance of in vivo experiments. Funds remain to finish the work during the next year. Quality Assurance Statement: Details included in this report provide methods for measurement of hemoglobin adducts as biomarkers of exposure. We have demonstrated in vitro that Hb adducts are formed by reactions of epoxide metabolites of chloroprene and selected polycyclic aromatic hydrocarbons. To be acceptable biomarkers of exposure, the proposed analytical determinations must have adequate specificity, sensitivity, accuracy, and precision to link unequivocal adduct detection with conditions of exposure. The assays rely on the unparalleled specificity of mass spectrometry, which provides the primary methodology for adduct detection. Chromatographic separations and specific chemical reactions, including modified Edman cleavage of amino acids and formation of trimethylsilyl ether derivatives of hydroxyl functions, provide additional specificity. The sensitivity of each analysis has been determined empirically. However, ultimate suitability of the assays to measure biomarkers of exposure is determined by complex sequential processes derived from the chemical processes of adduct formation and analytical determination. Some of these include the extent and duration of exposure to these toxic air pollutants, the degree of metabolic activation to electrophiles, competition among nucleophilic binding sites for covalent binding to electrophiles, the nature and stabilities of the adducts, chemistries of sample preparation, and instrumental conditions. Of major importance for success of this project has been discovery of stable Hb adducts which are converted to analytical chemical derivatives, which are reproducibly and uniquely detectable. Precision has been examined by repeated measures and accuracy has been determined by cross checks using multiple preparations derived from standards prepared gravimetrically. The proposed structures for analyses detailed above will provide unequivocal detection of adducts formed in sufficient quantities for detection. Limits of adduct detection and quantification are of the order of 1 and 10 pmole adduct/mg globin, respectively. Work remains yet to determine if this limit of sensitivity is sufficient for measurement of adducts formed in vivo, as only very limited animal studies been accomplished to determine the extent of adduct formation in vivo.
EPA EPSCoR Progress Report Harrell E. Hurst, Ph.D.
- 5 –
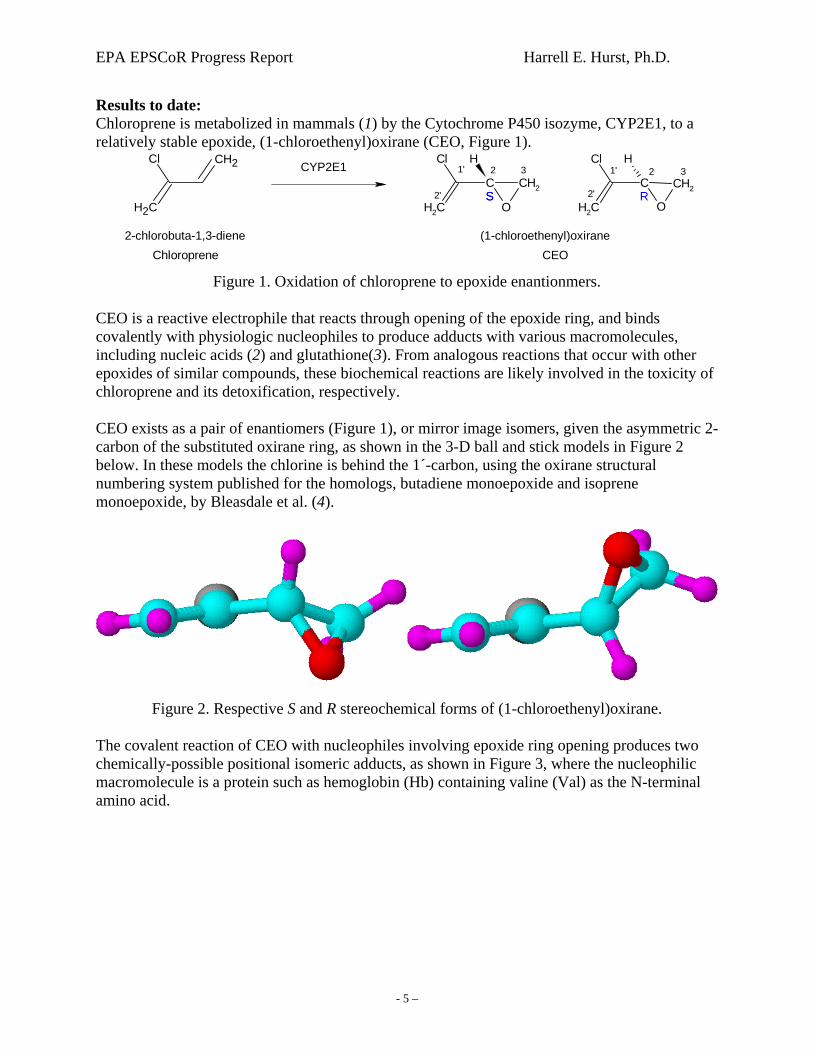
Results to date: Chloroprene is metabolized in mammals (1) by the Cytochrome P450 isozyme, CYP2E1, to a relatively stable epoxide, (1-chloroethenyl)oxirane (CEO, Figure 1).
CH2
CH2Cl
Chloroprene2-chlorobuta-1,3-diene (1-chloroethenyl)oxirane
CYP2E1
CEO
CH2
C CH2
Cl
O
H
CH2
C CH2
Cl
O
H2 32 3
SS R
1' 1'
2' 2'
Figure 1. Oxidation of chloroprene to epoxide enantionmers.
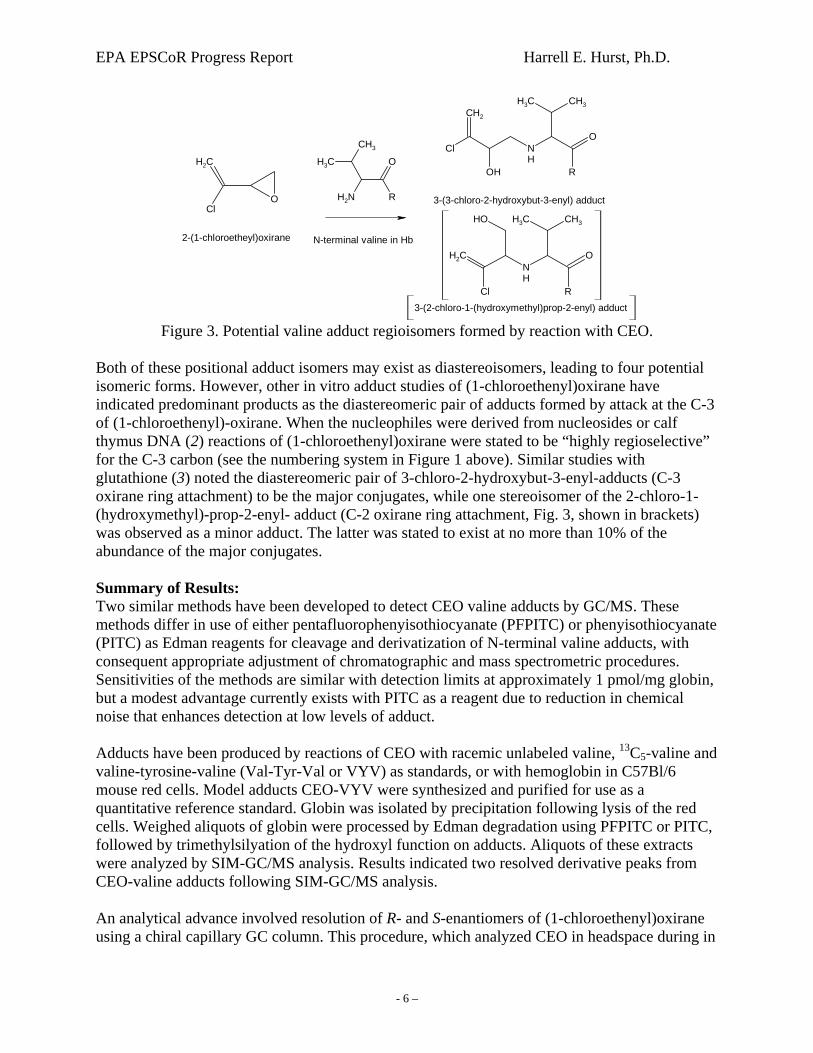
CEO is a reactive electrophile that reacts through opening of the epoxide ring, and binds covalently with physiologic nucleophiles to produce adducts with various macromolecules, including nucleic acids (2) and glutathione(3). From analogous reactions that occur with other epoxides of similar compounds, these biochemical reactions are likely involved in the toxicity of chloroprene and its detoxification, respectively. CEO exists as a pair of enantiomers (Figure 1), or mirror image isomers, given the asymmetric 2-carbon of the substituted oxirane ring, as shown in the 3-D ball and stick models in Figure 2 below. In these models the chlorine is behind the 1´-carbon, using the oxirane structural numbering system published for the homologs, butadiene monoepoxide and isoprene monoepoxide, by Bleasdale et al. (4).
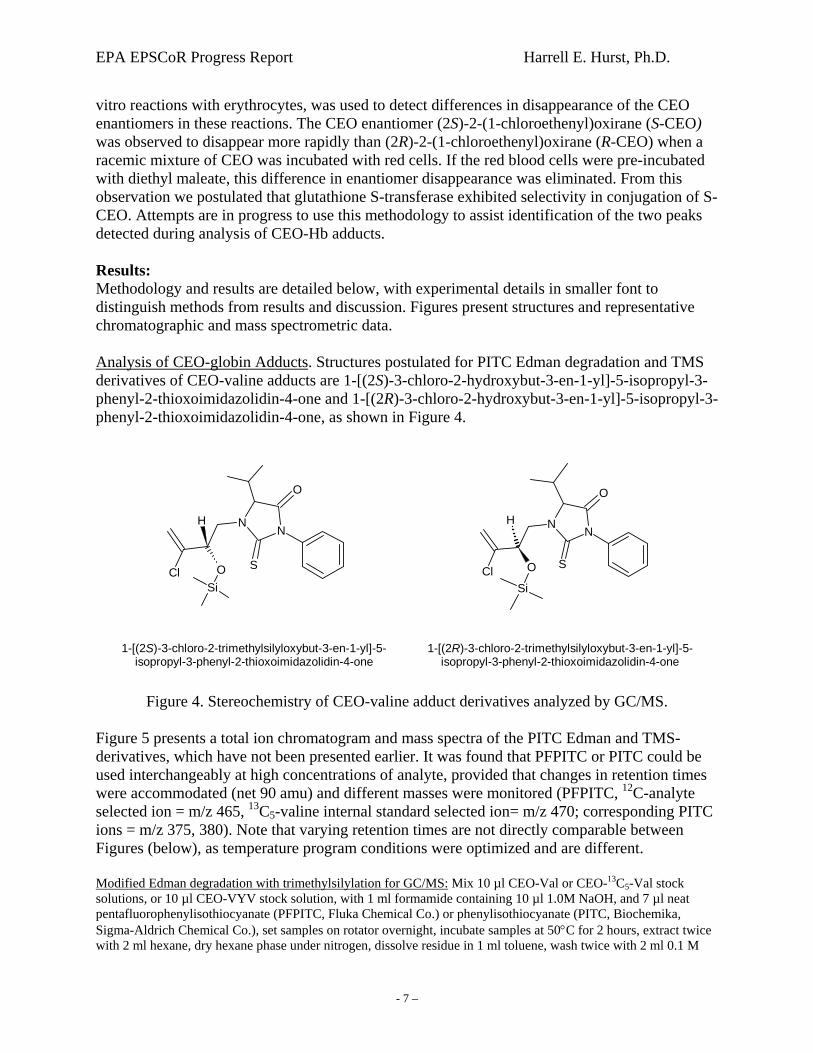
Figure 2. Respective S and R stereochemical forms of (1-chloroethenyl)oxirane. The covalent reaction of CEO with nucleophiles involving epoxide ring opening produces two chemically-possible positional isomeric adducts, as shown in Figure 3, where the nucleophilic macromolecule is a protein such as hemoglobin (Hb) containing valine (Val) as the N-terminal amino acid.
EPA EPSCoR Progress Report Harrell E. Hurst, Ph.D.
- 6 –
CH2
ClO
2-(1-chloroetheyl)oxirane
CH2
Cl
OH
ONH
CH3CH3
RO
NH2
CH3
CH3
R 3-(3-chloro-2-hydroxybut-3-enyl) adduct
N-terminal valine in HbO
NH
CH3CH3
R
CH2
OH
Cl
3-(2-chloro-1-(hydroxymethyl)prop-2-enyl) adduct Figure 3. Potential valine adduct regioisomers formed by reaction with CEO.
Both of these positional adduct isomers may exist as diastereoisomers, leading to four potential isomeric forms. However, other in vitro adduct studies of (1-chloroethenyl)oxirane have indicated predominant products as the diastereomeric pair of adducts formed by attack at the C-3 of (1-chloroethenyl)-oxirane. When the nucleophiles were derived from nucleosides or calf thymus DNA (2) reactions of (1-chloroethenyl)oxirane were stated to be “highly regioselective” for the C-3 carbon (see the numbering system in Figure 1 above). Similar studies with glutathione (3) noted the diastereomeric pair of 3-chloro-2-hydroxybut-3-enyl-adducts (C-3 oxirane ring attachment) to be the major conjugates, while one stereoisomer of the 2-chloro-1-(hydroxymethyl)-prop-2-enyl- adduct (C-2 oxirane ring attachment, Fig. 3, shown in brackets) was observed as a minor adduct. The latter was stated to exist at no more than 10% of the abundance of the major conjugates. Summary of Results: Two similar methods have been developed to detect CEO valine adducts by GC/MS. These methods differ in use of either pentafluorophenyisothiocyanate (PFPITC) or phenyisothiocyanate (PITC) as Edman reagents for cleavage and derivatization of N-terminal valine adducts, with consequent appropriate adjustment of chromatographic and mass spectrometric procedures. Sensitivities of the methods are similar with detection limits at approximately 1 pmol/mg globin, but a modest advantage currently exists with PITC as a reagent due to reduction in chemical noise that enhances detection at low levels of adduct. Adducts have been produced by reactions of CEO with racemic unlabeled valine, 13C5-valine and valine-tyrosine-valine (Val-Tyr-Val or VYV) as standards, or with hemoglobin in C57Bl/6 mouse red cells. Model adducts CEO-VYV were synthesized and purified for use as a quantitative reference standard. Globin was isolated by precipitation following lysis of the red cells. Weighed aliquots of globin were processed by Edman degradation using PFPITC or PITC, followed by trimethylsilyation of the hydroxyl function on adducts. Aliquots of these extracts were analyzed by SIM-GC/MS analysis. Results indicated two resolved derivative peaks from CEO-valine adducts following SIM-GC/MS analysis. An analytical advance involved resolution of R- and S-enantiomers of (1-chloroethenyl)oxirane using a chiral capillary GC column. This procedure, which analyzed CEO in headspace during in
EPA EPSCoR Progress Report Harrell E. Hurst, Ph.D.
- 7 –
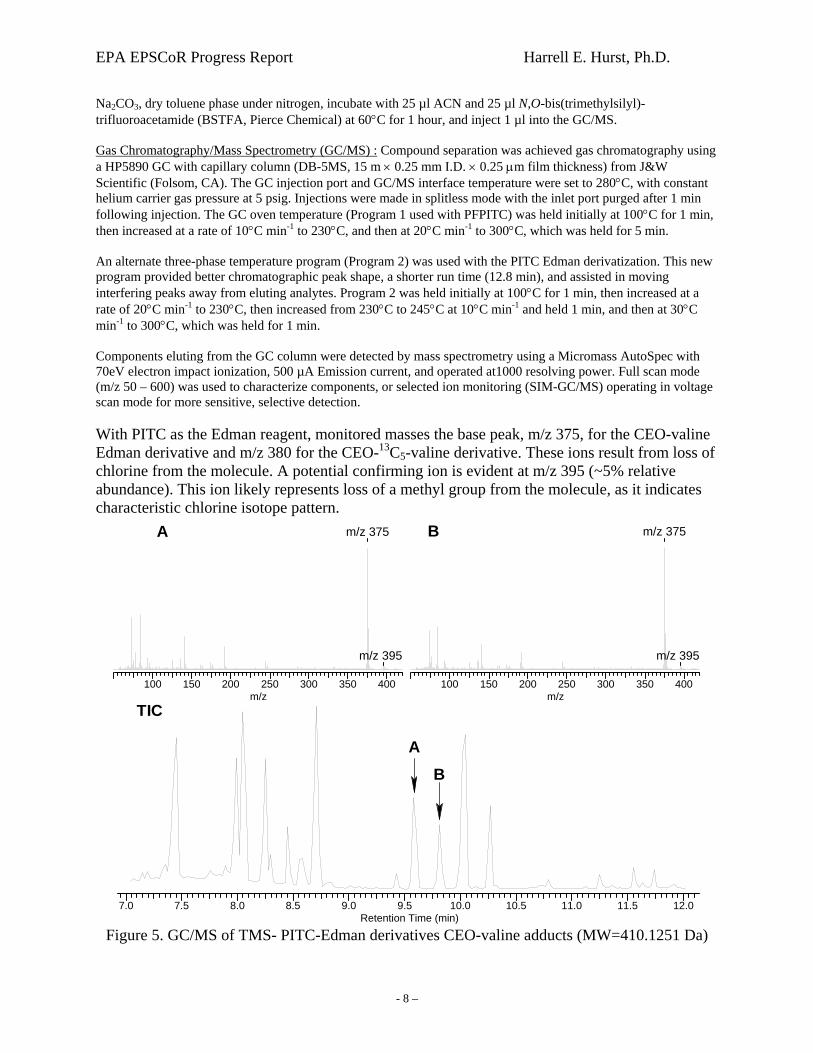
vitro reactions with erythrocytes, was used to detect differences in disappearance of the CEO enantiomers in these reactions. The CEO enantiomer (2S)-2-(1-chloroethenyl)oxirane (S-CEO) was observed to disappear more rapidly than (2R)-2-(1-chloroethenyl)oxirane (R-CEO) when a racemic mixture of CEO was incubated with red cells. If the red blood cells were pre-incubated with diethyl maleate, this difference in enantiomer disappearance was eliminated. From this observation we postulated that glutathione S-transferase exhibited selectivity in conjugation of S-CEO. Attempts are in progress to use this methodology to assist identification of the two peaks detected during analysis of CEO-Hb adducts. Results: Methodology and results are detailed below, with experimental details in smaller font to distinguish methods from results and discussion. Figures present structures and representative chromatographic and mass spectrometric data. Analysis of CEO-globin Adducts. Structures postulated for PITC Edman degradation and TMS derivatives of CEO-valine adducts are 1-[(2S)-3-chloro-2-hydroxybut-3-en-1-yl]-5-isopropyl-3-phenyl-2-thioxoimidazolidin-4-one and 1-[(2R)-3-chloro-2-hydroxybut-3-en-1-yl]-5-isopropyl-3-phenyl-2-thioxoimidazolidin-4-one, as shown in Figure 4.
O
N
Cl
N
SO
H
Si
O
N
Cl
N
SO
Si
H
1-[(2R)-3-chloro-2-trimethylsilyloxybut-3-en-1-yl]-5-isopropyl-3-phenyl-2-thioxoimidazolidin-4-one
1-[(2S)-3-chloro-2-trimethylsilyloxybut-3-en-1-yl]-5-isopropyl-3-phenyl-2-thioxoimidazolidin-4-one
Figure 4. Stereochemistry of CEO-valine adduct derivatives analyzed by GC/MS.
Figure 5 presents a total ion chromatogram and mass spectra of the PITC Edman and TMS-derivatives, which have not been presented earlier. It was found that PFPITC or PITC could be used interchangeably at high concentrations of analyte, provided that changes in retention times were accommodated (net 90 amu) and different masses were monitored (PFPITC, 12C-analyte selected ion = m/z 465, 13C5-valine internal standard selected ion= m/z 470; corresponding PITC ions = m/z 375, 380). Note that varying retention times are not directly comparable between Figures (below), as temperature program conditions were optimized and are different. Modified Edman degradation with trimethylsilylation for GC/MS: Mix 10 µl CEO-Val or CEO-13C5-Val stock solutions, or 10 µl CEO-VYV stock solution, with 1 ml formamide containing 10 µl 1.0M NaOH, and 7 µl neat pentafluorophenylisothiocyanate (PFPITC, Fluka Chemical Co.) or phenylisothiocyanate (PITC, Biochemika, Sigma-Aldrich Chemical Co.), set samples on rotator overnight, incubate samples at 50°C for 2 hours, extract twice with 2 ml hexane, dry hexane phase under nitrogen, dissolve residue in 1 ml toluene, wash twice with 2 ml 0.1 M
EPA EPSCoR Progress Report Harrell E. Hurst, Ph.D.
- 8 –
Na2CO3, dry toluene phase under nitrogen, incubate with 25 µl ACN and 25 µl N,O-bis(trimethylsilyl)-trifluoroacetamide (BSTFA, Pierce Chemical) at 60°C for 1 hour, and inject 1 µl into the GC/MS. Gas Chromatography/Mass Spectrometry (GC/MS) : Compound separation was achieved gas chromatography using a HP5890 GC with capillary column (DB-5MS, 15 m × 0.25 mm I.D. × 0.25 µm film thickness) from J&W Scientific (Folsom, CA). The GC injection port and GC/MS interface temperature were set to 280°C, with constant helium carrier gas pressure at 5 psig. Injections were made in splitless mode with the inlet port purged after 1 min following injection. The GC oven temperature (Program 1 used with PFPITC) was held initially at 100°C for 1 min, then increased at a rate of 10°C min-1 to 230°C, and then at 20°C min-1 to 300°C, which was held for 5 min. An alternate three-phase temperature program (Program 2) was used with the PITC Edman derivatization. This new program provided better chromatographic peak shape, a shorter run time (12.8 min), and assisted in moving interfering peaks away from eluting analytes. Program 2 was held initially at 100°C for 1 min, then increased at a rate of 20°C min-1 to 230°C, then increased from 230°C to 245°C at 10°C min-1 and held 1 min, and then at 30°C min-1 to 300°C, which was held for 1 min. Components eluting from the GC column were detected by mass spectrometry using a Micromass AutoSpec with 70eV electron impact ionization, 500 µA Emission current, and operated at1000 resolving power. Full scan mode (m/z 50 – 600) was used to characterize components, or selected ion monitoring (SIM-GC/MS) operating in voltage scan mode for more sensitive, selective detection. With PITC as the Edman reagent, monitored masses the base peak, m/z 375, for the CEO-valine Edman derivative and m/z 380 for the CEO-13C5-valine derivative. These ions result from loss of chlorine from the molecule. A potential confirming ion is evident at m/z 395 (~5% relative abundance). This ion likely represents loss of a methyl group from the molecule, as it indicates characteristic chlorine isotope pattern.
400350300250200150100m/z
m/z 375
m/z 395
400350300250200150100m/z
m/z 395
m/z 375
12.011.511.010.510.09.59.08.58.07.57.0Retention Time (min)
AB
BA
TIC
Figure 5. GC/MS of TMS- PITC-Edman derivatives CEO-valine adducts (MW=410.1251 Da)

EPA EPSCoR Progress Report Harrell E. Hurst, Ph.D.
- 9 –
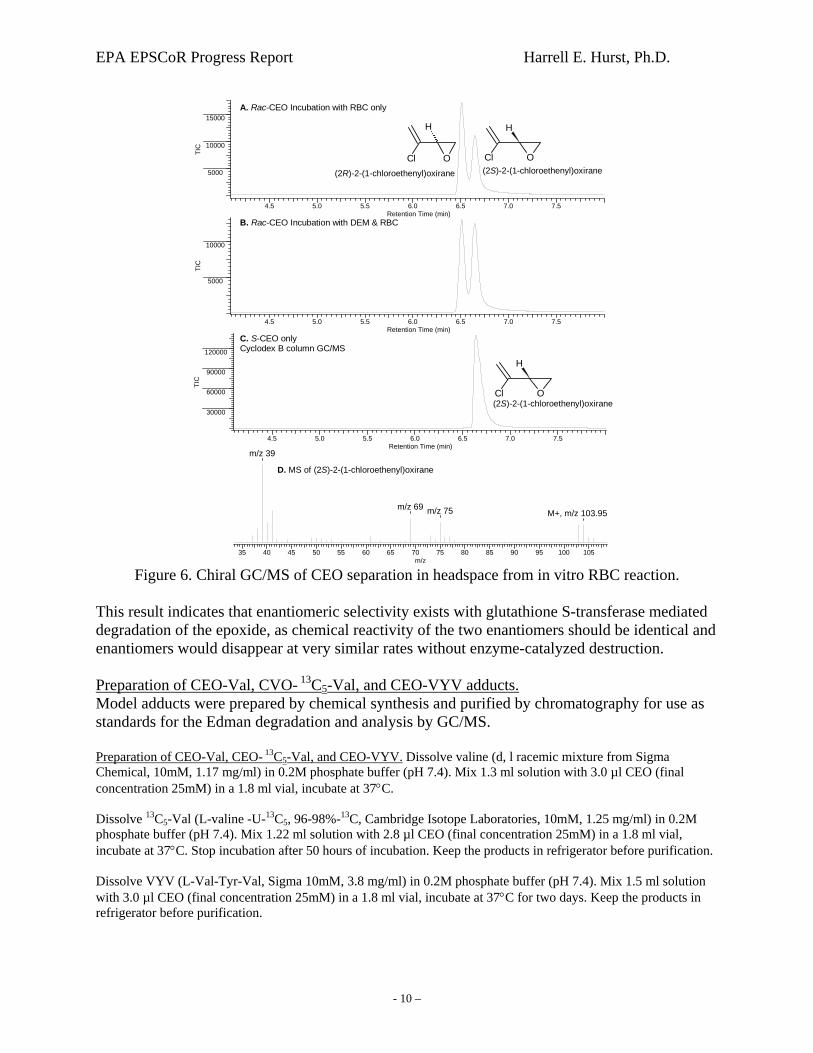
The sensitivity of analyses with either (PFPITC or PITC) reagent was limited by contaminants of unknown origin that co-eluted with analyte peaks. These contaminant peaks appeared in the chromatogram baseline and interfered with quantification at analyte levels of 1 – 10 pmol/mg globin, and therefore limited sensitivity of quantification. At present the PITC derivative appears to offer advantages of increased sensitivity due to lower chromatographic baseline noise and higher reaction efficiency. The latter, evident in calibration curve slope differences (see Figure 11 below) was checked by comparison of CEO-VYV standard areas versus areas from CEO-13C5-valine after normalization of concentrations. We have proposed that the two adduct peaks in the GC/MS Edman degradation analysis represent diastereoisomers due to the detailed similarity of the mass spectra. Differences is peak areas of adduct derivatives suggest that the diastereomers, if the peaks are such, elute from the GC column in the following order: first the S-diastereoisomer (Figure 5; Peak 1, A), and then the R-diastereoisomer (Peak 2, B). This was postulated from variations in peak heights of (2S)-2-(1-chloroethenyl)oxirane (S-CEO) observed in vitro by headspace chiral GC/MS analysis (see below). However, this tentative hypothesis must be rigorously tested using individual CEO enantiomers. Resolution of racemic-CEO into R- and S-enantiomers. A new analytical method provided resolution of R- and S-enantiomers of (1-chloroethenyl)-oxirane using a chiral capillary GC column. This enabled headspace detection of individual enantiomers in vitro reactions of CEO with erythrocytes, and analysis of differences in disappearance of these enantiomers, as shown in Figure 6. This establishes the identities of separated enantiomers of CEO. Panels C and D present the retention time and mass spectrum of S-CEO, respectively. Note that the S-enantiomer elutes after the R-enantiomer. Gas Chromatography of CEO R- and S-enantiomers. Headspace injections were made in splitless mode on a HP 6890 GC with 5973 MS. The capillary column (J&W Scientific) dimensions were 30 m x 0.25 mm id with a 0.25 µm thick film of Cyclodex-B as stationary phase. He served as carrier gas. Injection conditions were optimized to increase resolution of the enantiomers. The injection port liner was 2.0 mm id, and injection volumes were limited to 100 µL due to the reduced volume of the port liner. Injections were made at 150ºC with a pulsed He pressure of 15 psi, which was reduced to 10 psi after 0.1 min. Splitless purge time was 0.1 min. The column oven was held initially at 40ºC for 1 min, then programmed at 5ºC/min to 50ºC. Average He linear velocity was 41 cm/sec. CEO was detected in the mass spectrometer using selected ions at m/z 103 and 104. Panel A in Figure 6 indicates levels of racemic-CEO enantiomers in headspace from C57Bl/6 mouse red blood cells incubated in saline only. Panel B represents an identical experiment with red cells that had been pre-incubated with 1 millimolar diethyl maleate, a chemical known to deplete tissue stores of glutathione. As the initial atmosphere included racemic mixture of CEO in both A and B, it is evident that mouse red blood cells preferentially remove the S-enantiomer, presumably by conjugation with glutathione (Panel A). When diethyl maleate was used to deplete glutathione prior to CEO exposure (Panel B), the ratio of CEO enantiomers equaled those present in racemic-CEO in control experiments involving saline alone (not shown).
EPA EPSCoR Progress Report Harrell E. Hurst, Ph.D.
- 10 –
7.57.06.56.05.55.04.5Retention Time (min)
30000
60000
90000
120000
TIC
7.57.06.56.05.55.04.5Retention Time (min)
5000
10000
TIC
7.57.06.56.05.55.04.5Retention Time (min)
5000
10000
15000
TIC
Cl O
H
(2S)-2-(1-chloroethenyl)oxiraneCl O
H
(2R)-2-(1-chloroethenyl)oxirane
Cl O
H
(2S)-2-(1-chloroethenyl)oxirane
A. Rac-CEO Incubation with RBC only
B. Rac-CEO Incubation with DEM & RBC
C. S-CEO onlyCyclodex B column GC/MS
10510095908580757065605550454035m/z
m/z 39
m/z 69 m/z 75 M+, m/z 103.95
D. MS of (2S)-2-(1-chloroethenyl)oxirane
Figure 6. Chiral GC/MS of CEO separation in headspace from in vitro RBC reaction.
This result indicates that enantiomeric selectivity exists with glutathione S-transferase mediated degradation of the epoxide, as chemical reactivity of the two enantiomers should be identical and enantiomers would disappear at very similar rates without enzyme-catalyzed destruction. Preparation of CEO-Val, CVO- 13C5-Val, and CEO-VYV adducts. Model adducts were prepared by chemical synthesis and purified by chromatography for use as standards for the Edman degradation and analysis by GC/MS. Preparation of CEO-Val, CEO- 13C5-Val, and CEO-VYV. Dissolve valine (d, l racemic mixture from Sigma Chemical, 10mM, 1.17 mg/ml) in 0.2M phosphate buffer (pH 7.4). Mix 1.3 ml solution with 3.0 µl CEO (final concentration 25mM) in a 1.8 ml vial, incubate at 37°C. Dissolve 13C5-Val (L-valine -U-13C5, 96-98%-13C, Cambridge Isotope Laboratories, 10mM, 1.25 mg/ml) in 0.2M phosphate buffer (pH 7.4). Mix 1.22 ml solution with 2.8 µl CEO (final concentration 25mM) in a 1.8 ml vial, incubate at 37°C. Stop incubation after 50 hours of incubation. Keep the products in refrigerator before purification. Dissolve VYV (L-Val-Tyr-Val, Sigma 10mM, 3.8 mg/ml) in 0.2M phosphate buffer (pH 7.4). Mix 1.5 ml solution with 3.0 µl CEO (final concentration 25mM) in a 1.8 ml vial, incubate at 37°C for two days. Keep the products in refrigerator before purification.
EPA EPSCoR Progress Report Harrell E. Hurst, Ph.D.
- 11 –
Purification of CEO-Val and CEO-13C5-Val. Wash column (Strata X column (30mg/1ml) from Phenomenex) with 1 ml 50% MeOH and 1 ml water, load 0.4 ml Val/CVO or d8-Val/CVO incubation product, wash with 0.5 ml water, elute with 1.2 ml water. Repeat the process till the entire incubation product was processed. SPE fractions were analyzed by electrospray ionization ion trap mass spectrometry Finnigan LCQ Duo) after 1/10 dilution with 50% acetonitrile (ACN) containing 0.5% formic acid. CEO-Val and CEO-13C5-Val were found in 1.2 ml fractions. Small impurity peaks (m/z 118 and 176 in CEO-Val and m/z 123 and 181 in CEO-13C5-Val) were also detected in 1.2 ml fractions. CEO-Val and CEO-13C5-Val are not well retained on Strata X column. Concentrate 1.2 ml fractions with CEO-Val and CEO-13C5-Val by Speedvac. Combine CEO-Val or CEO-13C5-Val fractions together and dry the samples after combination. This yielded white residue in the vials. Purification of CEO-VYV. Inject aliqots 500µL into semi-preparative Waters HPLC system using 10mm x 25 cm column containing 5µm diameter Ultrasphere-ODS solid phase. Elution is accomplished by using a solvent gradient from 50% water-50% acetonitrile at injection to 100% acetonitrile over 30 minutes. Unreacted VYV eluted between 15 – 17 minutes, while CEO-VYV eluted between 17 – 20 minutes. The latter fraction was collected from each of several separations, and fractions were combined and analyzed by HPLC MS/MS using a ThermoFinnigan LCQ-Duo ion trap mass spectrometer. CEO-Val, CEO-13C5-Val, and CEO-VYV stock solutions. Dissolve residues from CEO-Val, CEO-13C5-Val, or CEO-VYV fractions in 0.2 ml water. Analysis of CEO-Val and CEO-13C5-Val by GC/MS using PFPITC. Modified Edman degradation and trimethylsilylation were used to derivatize the adducted N-terminal amino acid (valine). Samples were analyzed by capillary gas chromatography/mass spectrometry using the HP5890/Micromass AutoSpec GC/MS system. Modified Edman degradation with trimethylsilylation for GC/MS. Mix 10 µl CEO-Val or CEO-13C5-Val stock solutions, or 10 µl CEO-VYV stock solution, with 1 ml formamide containing 10 µl 1.0M NaOH, and 7 µl neat pentafluorophenylisothiocyanate (PFPITC, Fluka Chemical Co.) or phenylisothiocyanate (PITC, Biochemika Chemical Co.), set samples on rotator overnight, incubate samples at 50°C for 2 hours, extract twice with 2 ml hexane, dry hexane phase under nitrogen, dissolve residue in 1 ml toluene, wash twice with 2 ml 0.1 M Na2CO3, dry toluene phase under nitrogen, incubate with 25 µl ACN and 25 µl N,O-bis(trimethylsilyl)-trifluoroacetamide (BSTFA, Pierce Chemical) at 60°C for 1 hour, and inject 1 µl into the GC/MS. Gas Chromatography/Mass Spectrometry (GC/MS). Compound separation was achieved gas chromatography using a HP5890 GC with capillary column (DB-5MS, 15 m × 0.25 mm I.D. × 0.25 µm film thickness) from J&W Scientific (Folsom, CA). The GC injection port and GC/MS interface temperature were set to 280°C, with constant helium carrier gas pressure at 5 psig. Injections were made in splitless mode with the inlet port purged after 1 min following injection. The GC oven temperature (Program 1) was held initially at 100°C for 1 min, then increased at a rate of 10°C min-1 to 230°C, and then at 20°C min-1 to 300°C, which was held for 5 min. An alternate program (Program 2) provided a shorter run time (12.8 min) and assisted in moving interfering peaks away from eluting analytes with the PITC Edman derivitization. Program 2 was held initially at 100°C for 1 min, then increased at a rate of 20°C min-1 to 230°C, then increased from 230°C to 245°C at 10°C min-1 and held 1 min, and then at 30°C min-1 to 300°C, which was held for 1 min. Program 2. Components eluting from GC were detected by mass spectrometry using a Micromass AutoSpec with 70eV electron impact ionization, 500 µA Emission current, and operated at1000 resolving power. Full scan mode (m/z 50 – 600) was used to characterize components, or selected ion monitoring (SIM-GC/MS) operating in voltage scan mode for more sensitive, selective detection. When PFPITC was used for Edman degradation, monitored masses included the spectral base peak of m/z 465 for the CEO-valine Edman derivative and m/z 470 for the CEO-13C5-valine derivative. With PITC as the Edman reagent, monitored masses the base peak, m/z 375, for the CEO-valine Edman derivative and m/z 380 for the CEO-13C5-valine derivative. These ions result from loss of chlorine from the molecule. A potential confirming ion is
EPA EPSCoR Progress Report Harrell E. Hurst, Ph.D.
- 12 –
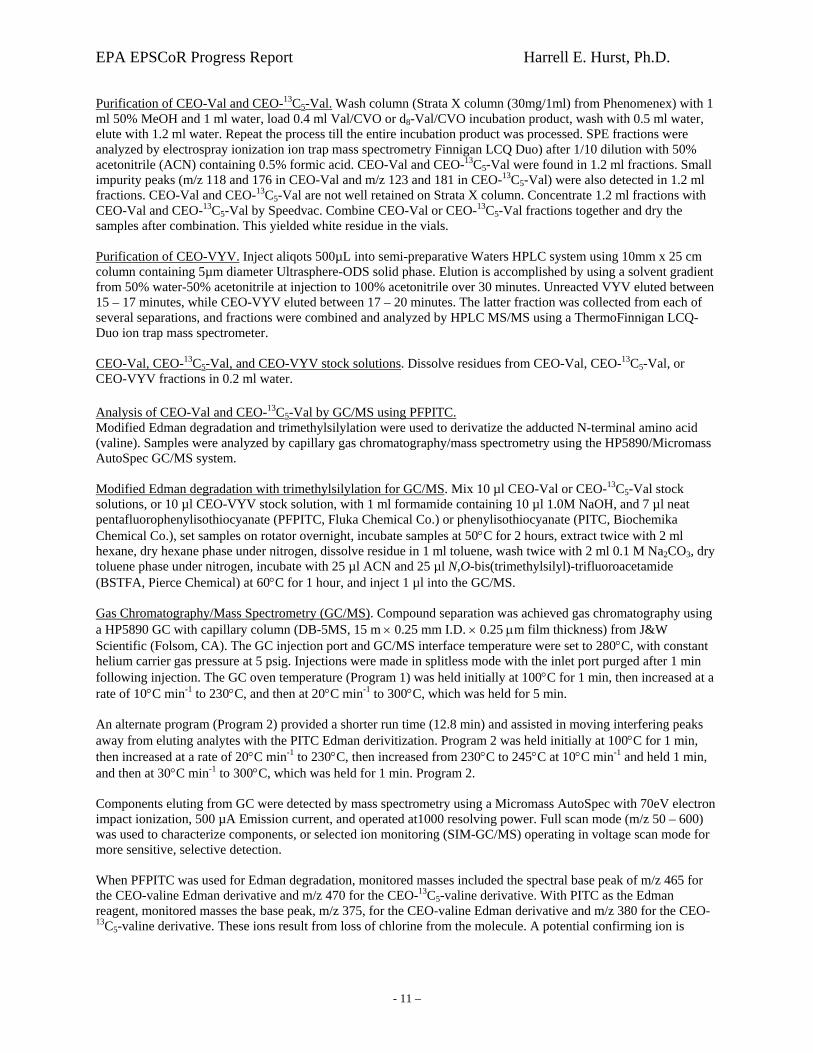
evident at m/z 395 (~5% relative abundance). This ion likely represents loss of a methyl group from the molecule, as it indicates characteristic chlorine isotope pattern. CEO-Val Edman derivatives formed using PFPITC, 1-(3-chloro-2-trimethylsilyloxy-but-3-enyl)-5-isopropyl-3-(pentafluorophenyl)-2-thioxoimidazolidin-4-one, were detected following Edman degradation and trimethylsilylation. The unlabeled fluorinated Edman derivatives have a nominal molecular weight of 500, while the molecular weight of the 13C5-derivative is 505. A two minute section of a total ion current chromatogram is shown below in Figure 7, while a representative mass spectrum of the unlabeled derivatives is illustrated in Figure 8.
14.914.814.714.614.514.414.314.214.114.013.913.813.713.613.513.413.313.213.1Retention Time (min)
0.1
0.2
0.3
0.4
0.5
0.6
Rel
ativ
e In
tens
ity
O
NCH2
Cl
N
SO
SiF
F
F
F
F
1-(3-chloro-2-trimethylsilyloxybut-3-en-1-yl)-5-isopropyl-3-(pentafluorophenyl)-2-thioxoimidazolidin-4-one
Figure 7. Section of chromatogram showing Edman TMS derivatives of CEO-valine adduct.
450400350300250200150100m/z
465
14173
FF F
FF
N
S
O
N+
O
Si
[Molecular Ion - 35Cl]+
m/z = 465 (470 for 13C5-valine IS)
Figure 8. Electron impact mass spectrum of PFPITC Edman TMS derivative of CEO-valine.
The chromatogram clearly illustrates formation of two compounds, which are postulated to be diastereomers (see below) of the structure included in the chromatogram. The mass spectrum is dominated by the [M-35]+ ion at m/z 465 which results from facile elimination of chloride anion (Cl-) from the molecule. A lesser abundant ion exists at m/z 485, which is attributable to loss of a methyl group from the molecule. Other abundant ions are m/z 73, attributable to (CH3)3Si+, and m/z 141, likely (CH3)3Si-O-C4H4
+.
EPA EPSCoR Progress Report Harrell E. Hurst, Ph.D.
- 13 –
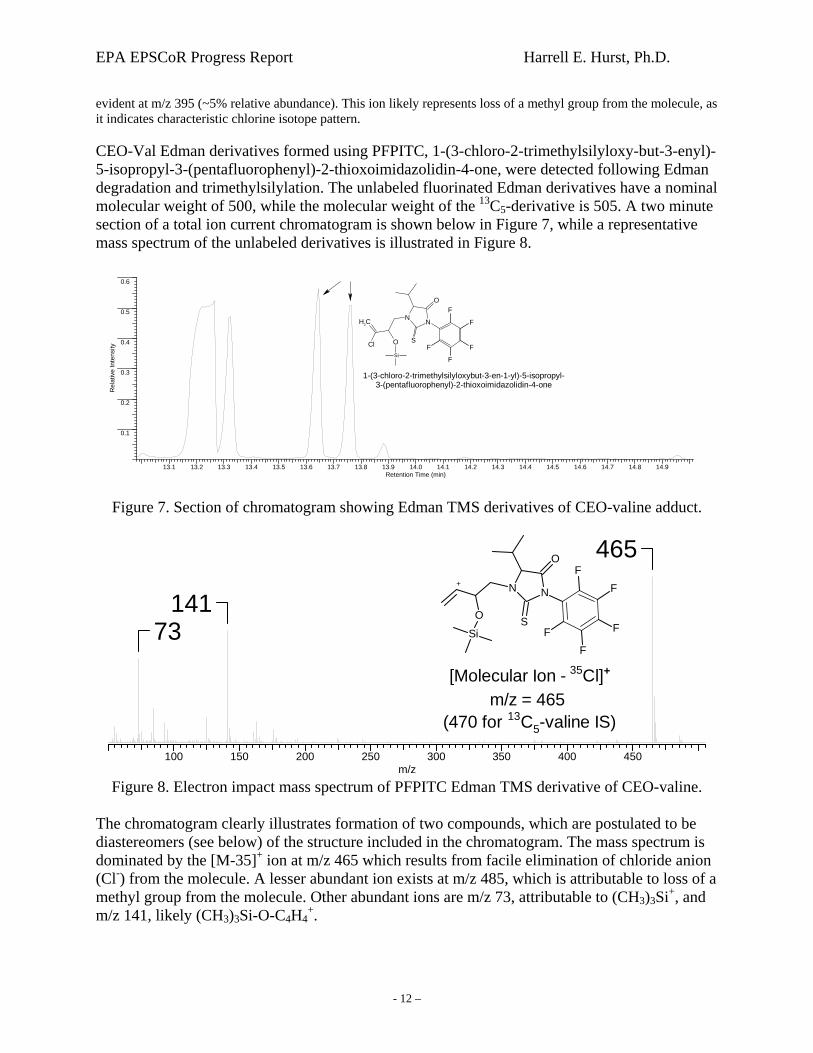
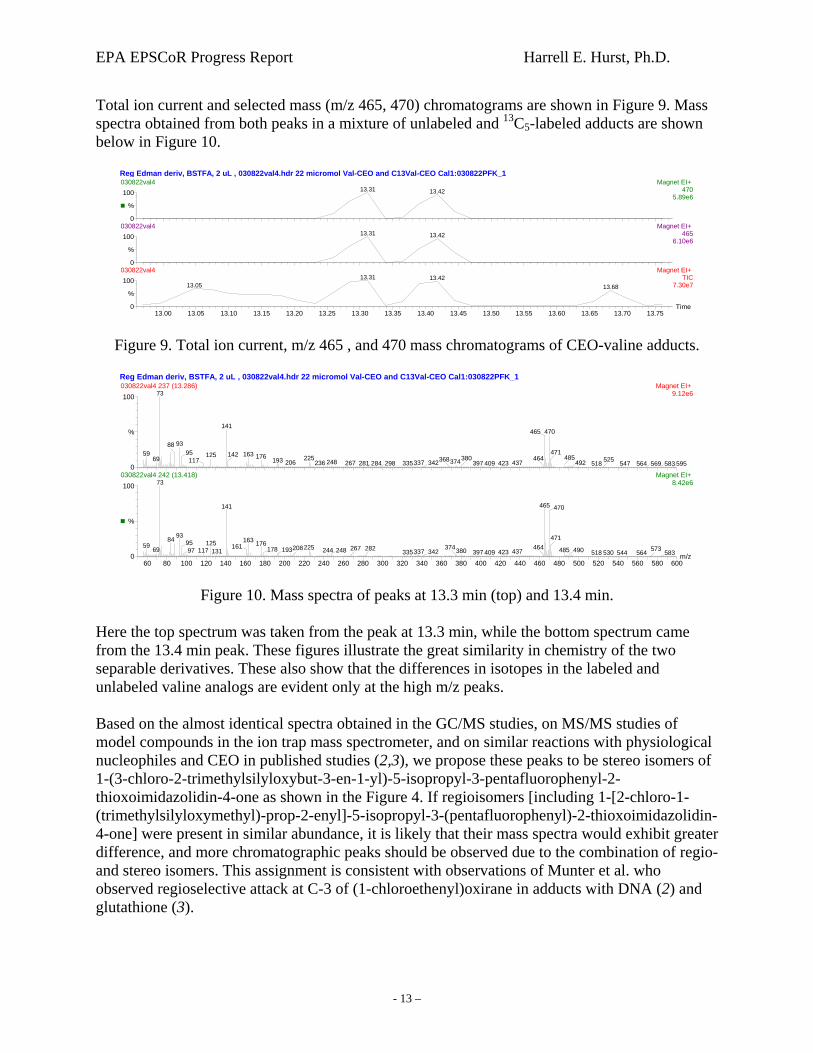
Total ion current and selected mass (m/z 465, 470) chromatograms are shown in Figure 9. Mass spectra obtained from both peaks in a mixture of unlabeled and 13C5-labeled adducts are shown below in Figure 10.
Reg Edman deriv, BSTFA, 2 uL , 030822val4.hdr 22 micromol Val-CEO and C13Val-CEO Cal1:030822PFK_1
13.00 13.05 13.10 13.15 13.20 13.25 13.30 13.35 13.40 13.45 13.50 13.55 13.60 13.65 13.70 13.75Time0
100
%
0
100
%
0
100
%
030822val4 Magnet EI+ 470
5.89e613.31 13.42
030822val4 Magnet EI+ 465
6.10e613.31 13.42
030822val4 Magnet EI+ TIC
7.30e713.31
13.0513.42
13.68
Figure 9. Total ion current, m/z 465 , and 470 mass chromatograms of CEO-valine adducts.
Reg Edman deriv, BSTFA, 2 uL , 030822val4.hdr 22 micromol Val-CEO and C13Val-CEO Cal1:030822PFK_1
60 80 100 120 140 160 180 200 220 240 260 280 300 320 340 360 380 400 420 440 460 480 500 520 540 560 580 600m/z0
100
%
0
100
%
030822val4 237 (13.286) Magnet EI+ 9.12e673
5969
141
938895 125117
470465
163142 176 225193 206 374248236 337267 281 335284 298 342368 380 464437423397 409
471485
492 547518 525 564 569 583 595
030822val4 242 (13.418) Magnet EI+ 8.42e673
59 69
465141
9384 95 12511797 131
163161 176 225178 193208 244 248 380374
337267 335282 342464437423397 409
470
471
485 490 518 530 564544 573 583
Figure 10. Mass spectra of peaks at 13.3 min (top) and 13.4 min.
Here the top spectrum was taken from the peak at 13.3 min, while the bottom spectrum came from the 13.4 min peak. These figures illustrate the great similarity in chemistry of the two separable derivatives. These also show that the differences in isotopes in the labeled and unlabeled valine analogs are evident only at the high m/z peaks. Based on the almost identical spectra obtained in the GC/MS studies, on MS/MS studies of model compounds in the ion trap mass spectrometer, and on similar reactions with physiological nucleophiles and CEO in published studies (2,3), we propose these peaks to be stereo isomers of 1-(3-chloro-2-trimethylsilyloxybut-3-en-1-yl)-5-isopropyl-3-pentafluorophenyl-2-thioxoimidazolidin-4-one as shown in the Figure 4. If regioisomers [including 1-[2-chloro-1-(trimethylsilyloxymethyl)-prop-2-enyl]-5-isopropyl-3-(pentafluorophenyl)-2-thioxoimidazolidin-4-one] were present in similar abundance, it is likely that their mass spectra would exhibit greater difference, and more chromatographic peaks should be observed due to the combination of regio- and stereo isomers. This assignment is consistent with observations of Munter et al. who observed regioselective attack at C-3 of (1-chloroethenyl)oxirane in adducts with DNA (2) and glutathione (3).
EPA EPSCoR Progress Report Harrell E. Hurst, Ph.D.
- 14 –
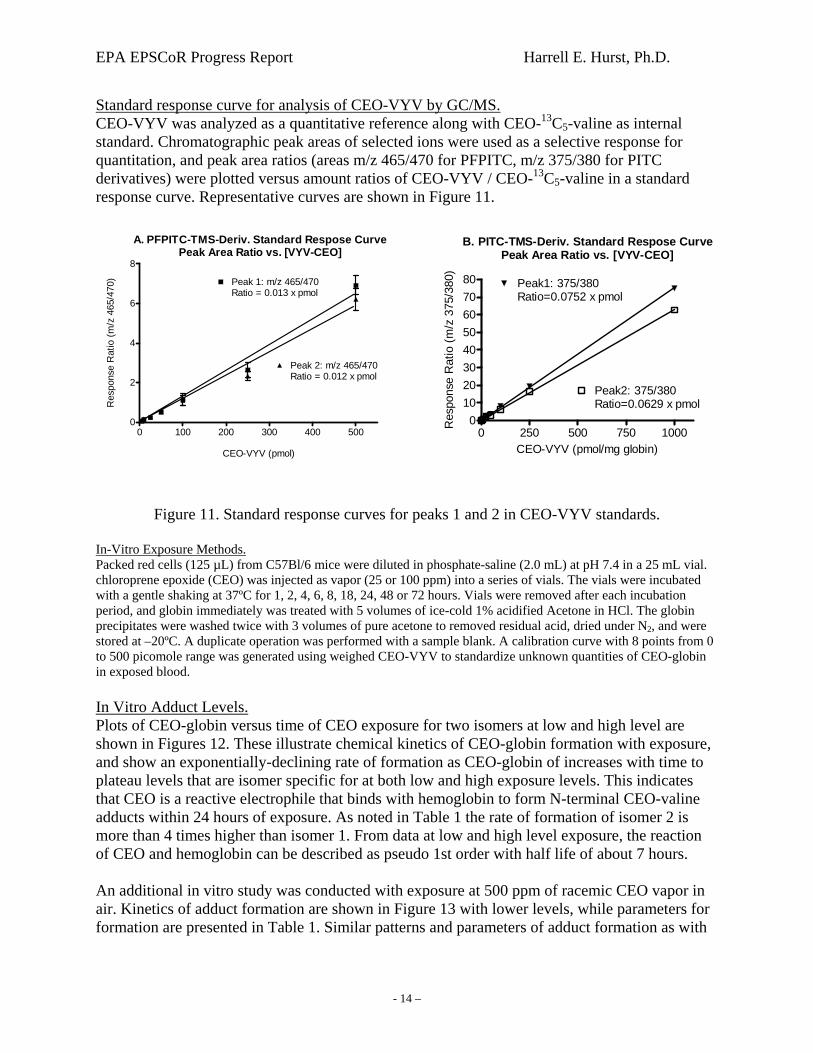
Standard response curve for analysis of CEO-VYV by GC/MS. CEO-VYV was analyzed as a quantitative reference along with CEO-13C5-valine as internal standard. Chromatographic peak areas of selected ions were used as a selective response for quantitation, and peak area ratios (areas m/z 465/470 for PFPITC, m/z 375/380 for PITC derivatives) were plotted versus amount ratios of CEO-VYV / CEO-13C5-valine in a standard response curve. Representative curves are shown in Figure 11.
0 100 200 300 400 5000
2
4
6
8
Peak 1: m/z 465/470Ratio = 0.013 x pmol
Peak 2: m/z 465/470Ratio = 0.012 x pmol
A. PFPITC-TMS-Deriv. Standard Respose CurvePeak Area Ratio vs. [VYV-CEO]
CEO-VYV (pmol)
Res
pons
e R
atio
(m/z
465
/470
)
B. PITC-TMS-Deriv. Standard Respose CurvePeak Area Ratio vs. [VYV-CEO]
0 250 500 750 10000
1020304050607080 Peak1: 375/380
Ratio=0.0752 x pmol
Peak2: 375/380Ratio=0.0629 x pmol
CEO-VYV (pmol/mg globin)R
espo
nse
Rat
io (m
/z 3
75/3
80)
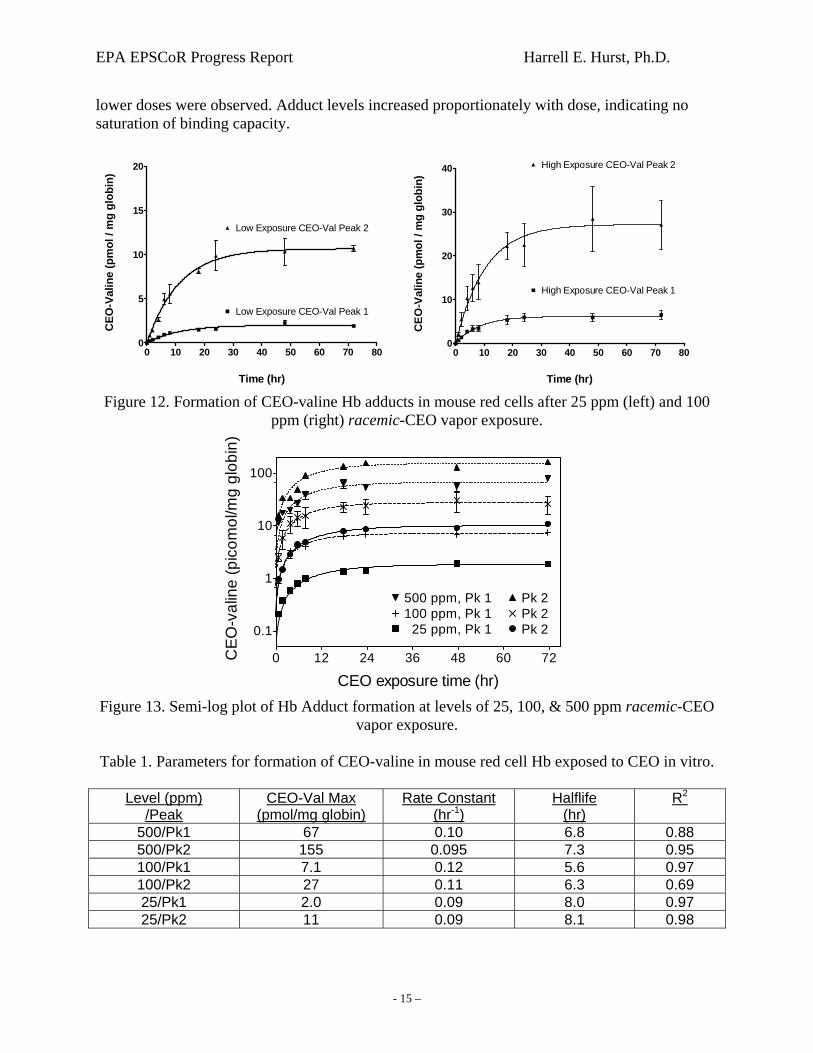
Figure 11. Standard response curves for peaks 1 and 2 in CEO-VYV standards. In-Vitro Exposure Methods. Packed red cells (125 µL) from C57Bl/6 mice were diluted in phosphate-saline (2.0 mL) at pH 7.4 in a 25 mL vial. chloroprene epoxide (CEO) was injected as vapor (25 or 100 ppm) into a series of vials. The vials were incubated with a gentle shaking at 37ºC for 1, 2, 4, 6, 8, 18, 24, 48 or 72 hours. Vials were removed after each incubation period, and globin immediately was treated with 5 volumes of ice-cold 1% acidified Acetone in HCl. The globin precipitates were washed twice with 3 volumes of pure acetone to removed residual acid, dried under N2, and were stored at –20ºC. A duplicate operation was performed with a sample blank. A calibration curve with 8 points from 0 to 500 picomole range was generated using weighed CEO-VYV to standardize unknown quantities of CEO-globin in exposed blood. In Vitro Adduct Levels. Plots of CEO-globin versus time of CEO exposure for two isomers at low and high level are shown in Figures 12. These illustrate chemical kinetics of CEO-globin formation with exposure, and show an exponentially-declining rate of formation as CEO-globin of increases with time to plateau levels that are isomer specific for at both low and high exposure levels. This indicates that CEO is a reactive electrophile that binds with hemoglobin to form N-terminal CEO-valine adducts within 24 hours of exposure. As noted in Table 1 the rate of formation of isomer 2 is more than 4 times higher than isomer 1. From data at low and high level exposure, the reaction of CEO and hemoglobin can be described as pseudo 1st order with half life of about 7 hours. An additional in vitro study was conducted with exposure at 500 ppm of racemic CEO vapor in air. Kinetics of adduct formation are shown in Figure 13 with lower levels, while parameters for formation are presented in Table 1. Similar patterns and parameters of adduct formation as with
EPA EPSCoR Progress Report Harrell E. Hurst, Ph.D.
- 15 –
lower doses were observed. Adduct levels increased proportionately with dose, indicating no saturation of binding capacity.
0 10 20 30 40 50 60 70 800
5
10
15
20
Low Exposure CEO-Val Peak 1
Low Exposure CEO-Val Peak 2
Time (hr)
CEO
-Val
ine
(pm
ol /
mg
glob
in)
0 10 20 30 40 50 60 70 800
10
20
30
40
High Exposure CEO-Val Peak 1
High Exposure CEO-Val Peak 2
Time (hr)
CEO
-Val
ine
(pm
ol /
mg
glob
in)
Figure 12. Formation of CEO-valine Hb adducts in mouse red cells after 25 ppm (left) and 100
ppm (right) racemic-CEO vapor exposure.
0 12 24 36 48 60 72
0.1
1
10
100
Pk 2500 ppm, Pk 1Pk 2100 ppm, Pk 1Pk 2 25 ppm, Pk 1
CEO exposure time (hr)
CEO
-val
ine
(pic
omol
/mg
glob
in)
Figure 13. Semi-log plot of Hb Adduct formation at levels of 25, 100, & 500 ppm racemic-CEO
vapor exposure. Table 1. Parameters for formation of CEO-valine in mouse red cell Hb exposed to CEO in vitro.
Level (ppm) /Peak
CEO-Val Max (pmol/mg globin)
Rate Constant (hr-1)
Halflife (hr)
R2
500/Pk1 67 0.10 6.8 0.88 500/Pk2 155 0.095 7.3 0.95 100/Pk1 7.1 0.12 5.6 0.97 100/Pk2 27 0.11 6.3 0.69 25/Pk1 2.0 0.09 8.0 0.97 25/Pk2 11 0.09 8.1 0.98
EPA EPSCoR Progress Report Harrell E. Hurst, Ph.D.
- 16 –
Conclusions: 1. Chloroprene epoxide (CEO) reacts with Hb protein in red cells to form globin N-terminal valine-(3-chloro-2-hydroxy-3-buten-1-yl) adducts. 2. The two evident valine adducts appear to be stereoisomers with attachment at the terminal (C-3) carbon, as opposed to regio (positional) isomers at C-2 or C-3 of (1-chloroethenyl)oxirane. It has not yet been possible to determine the specific stereoisomeric configuration of the isomers obtained from the racemic CEO reagent. 3. When hemoglobin in red cells reacts in vitro with racemic R,S-CEO, the second eluting stereoisomer is favored in a ratio of about 5:1. 4. CEO reaction in vitro with excess Hb in red cells appears to be 1st order with half life of about 7 hours. Reactions in vitro are essentially (~90%) complete within 24 hours. 5. When racemic CEO reacts in vitro with Hb in red cells, the S-enantiomer of CEO is consumed more rapidly, leading to lesser amounts of Peak 1. When racemic CEO reacts in vitro with Hb in red cells that have been pre-incubated with diethyl maleate, the mixture retains the 1:1 racemic ratio and more equal amounts of adducts are formed. We attribute these differences to more rapid conjugation of S-CEO with glutathione, thereby reducing the amount of this enantiomer available for reaction with Hb. 6. The identities and different reactivities established for enantiomers of CEO have led to a hypothesis that the two globin adduct peaks are diastereomers formed from the enantiomers. This hypothesis will be further tested in studies using single enantiomers of CEO. Planned Future Activities: Efforts will continue toward refinement of GC/MS and other MS techniques for quantification of CEO adducts in mouse globin following exposure to CEO. An objective will be to maximize efficiencies of derivative formation detection of trace amounts of the globin adducts that result from exposure to CEO. As refinement of the assay for these adducts is accomplished, mice will be treated with chloroprene to examine suitability of the mass spectrometric assay(s) as a biomarker of chloroprene exposure. Additional work will focus on the specificity of glutathione S-transferase for detoxification of enantiomers of CEO. The identities of the observed Edman and TMS-derivatized valine adduct products will be further tested in studies using single enantiomers of CEO. SEER Component 2: Development of Hemoglobin Adduct Methodology for Assessment of Exposure Polycyclic Aromatic Hydrocarbons Steven R. Myers, Ph.D., Associate Professor Dept. Pharmacology and Toxicology University of Louisville Louisville, KY 40292
EPA EPSCoR Progress Report Harrell E. Hurst, Ph.D.
- 17 –
Introduction: Polycyclic aromatic hydrocarbons (PAHs) are a group of over 100 different chemicals that are formed during the incomplete burning of coal, oil and gas, garbage, or other organic substances like tobacco or charbroiled meat. PAHs are usually found as a mixture containing two or more of these compounds, such as soot. Some PAHs are manufactured. These pure PAHs usually exist as colorless, white, or pale yellow-green solids. PAHs are found in coal tar, crude oil, creosote, and roofing tar, but a few are used in medicines or to make dyes, plastics, and pesticides. Many of the PAHs found in the environment are potentially carcinogenic to experimental animals and humans. Sir Percival Pott (1714-1788) was one of earliest investigators to understand the concept of environmental carcinogenesis that may be attributable to various exposures. He described a squamous cell carcinoma of the scrotum which occurred in chimney sweeps – men whose job it was to clean the soot and other residue from the chimneys and fireplaces in the houses in London. In those days the fires burned coal and considerable soot was continually building up inside of chimneys that needed to be regularly cleaned. Pott noticed that a considerable number of those chimney sweeps that had been working in that environment had a high incidence of scrotal cancers when compared to a control (non-chimney sweep) population. Pott recognized that the potential source of this cancer was most probably from the soot to which the sweeps were exposed. In addition, Pott also described a similar cancer on the hands of gardeners who spread the residue from the sweeps into London gardens. Pott said this was an occupational disease and postulated that the cancer was caused by an ingredient in the residue from the burning coal. This hypothesis of Pott was confirmed nearly 200 years later by Katsusaburo Yamagiwa. He produced Squamous Cell Carcinoma in the ears of rabbits by painting coal tar on their ears daily for 660 days. These results confirmed the original hypothesis of Pott that the origins of the cancers of the chimney sweeps as well as the gardeners was in some way related to the exposure of these individuals to the soot from chimneys. How are we exposed to PAHs today: Today, we are exposure to both carcinogenic as well as noncarcinogenic PAHs by multiple routes. Exposure to polycyclic aromatic hydrocarbons usually occurs by breathing air contaminated by wild fires or coal tar, or by eating foods that have been grilled. PAHs have been found in at least 600 of the 1,430 National Priorities List sites identified by the Environmental Protection Agency (EPA). Breathing air which contains PAHs in the workplace of coking, coal-tar, and asphalt production plants; smokehouses; and municipal trash incineration facilities is a prime source of exposure to PAHs. Other sources of PAHs are from cigarette smoke, wood smoke, vehicle exhausts, asphalt roads, or agricultural burn smoke. Coming in contact with air, water, or soil near hazardous waste sites is a potential source of PAH exposure as is eating grilled or charred meats; contaminated cereals, flour, bread, vegetables, fruits, meats; and processed or pickled foods. In addition to the above mentioned exposure paths, drinking contaminated water or cow's milk that has been exposed to PAH results in elevated PAH concentrations of body fluids. Nursing infants of mothers living near hazardous waste sites may be exposed to PAHs through their mother's milk, which ultimately exposed the neonate to potentially harmful levels of PAHs.

EPA EPSCoR Progress Report Harrell E. Hurst, Ph.D.
- 18 –
What harmful effects can benzo(a)pyrene as well as other PAHs have on us? Since laboratory studies have identified that several environmental PAHs can cause cancer in laboratory animals, it follows that these compounds will likely cause cancer in humans. However, since the latency period is rather long for this endpoint (cancer), other shorter endpoints become more desirable. One of the other features of most PAHs is that they will also cause skin rashes in animals and it is also predicted that this will be evident in humans exposed to acutely high levels of PAHs. Long term exposure to PAH can cause serious developmental and reproductive effects, leading to teratogenesis and spontaneous abortions. Animal studies have indicated that benzo(a)pyrene, via oral exposure, induces reproductive toxicity, and teratogenesis. Developmental effects, such as a reduced viability of litters and reduced mean pup weight, have also been noted from oral exposure to benzo(a)pyrene in animals Epidemiologic studies have reported an increase in lung cancer in humans exposed to coke oven emission, roofing tar emissions, and cigarette smoke. Each of these mixtures contains a number of PAHs. Animal studies have reported respiratory tract tumors from inhalation exposure to benzo(a)pyrene and forestomach tumors, leukemia, and lung tumors from oral exposure to benzo(a)pyrene. As a result of these numerous studies, the EPA has classified benzo(a)pyrene as a Group B2, probable human carcinogen.. Rationale for Experiments: In the following experiments we investigated the binding of selected PAH epoxides to hemoglobin in order to determine the overall extent of binding of the PAH to the protein and to also investigate the kinetics of binding of the PAH epoxide to hemoglobin. The following experiments were carried out using mouse (C57BL/6 male mice) hemoglobin in vitro. Through a series of binding studies as well as known carcinogenicity of the parent PAHs, we will correlate extent of reaction of various epoxides with known carcinogenicity of the parent PAH. In these studies, we will develop and confirm methods of hemoglobin adduct formation and detection that may be applicable to human exposure assessments. PAH epoxides were used in the studies. These compounds are predicted to be the ultimate carcinogenic forms of these parent PAHs. The epoxides arise via metabolism of the parent PAH to epoxides, followed by the addition of water across the epoxide bond to generate a diol. These reactions are catalyzd by microsomal enzymes as well as epoxide hydrolase. A second and final epoxidation reaction is carried out at an adjacent double bond to yield a reactive diol-epoxide metabolite of the parent PAH. The compounds used in the study are shown in Table 1.
EPA EPSCoR Progress Report Harrell E. Hurst, Ph.D.
- 19 –
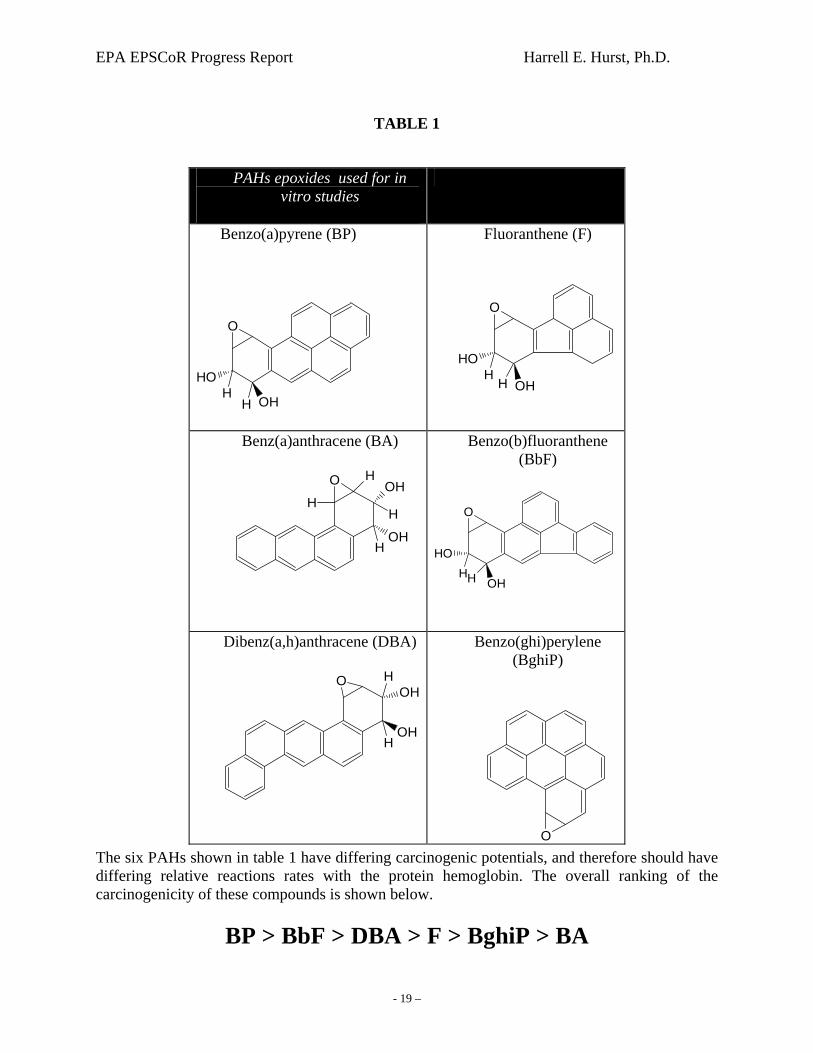
TABLE 1
The six PAHs shown in table 1 have differing carcinogenic potentials, and therefore should have differing relative reactions rates with the protein hemoglobin. The overall ranking of the carcinogenicity of these compounds is shown below.
BP > BbF > DBA > F > BghiP > BA
PAHs epoxides used for in vitro studies
Benzo(a)pyrene (BP)
OH
OHH
H
O
Fluoranthene (F)
OH
OHH
H
O
Benz(a)anthracene (BA)
OH
OH
H
H
O H
H
Benzo(b)fluoranthene (BbF)
OH
OHHH
O
Dibenz(a,h)anthracene (DBA)
OH
OH
H
H
O
Benzo(ghi)perylene (BghiP)
O

EPA EPSCoR Progress Report Harrell E. Hurst, Ph.D.
- 20 –
highly carcinogenic Low carcinogenicity Methods: Packed red cells (mouse) were resuspended in isotonic saline (2 mls). 100 µl aliquots of RBC suspension were used in reactions (volume brought to 500 µl with saline). PAH epoxide stock solutions were dissolved in tetrahydrofuran (1 mg/ml). 10 µl epoxide PAH stock (for each PAH) was added to reactions. Reactions were carried out at 37° for 0,1,2,4,8,10,15,20,45,and 60 minutes. Reactions were stopped by addition of 500 µl ice cold water to hydrolyze unreacted PAH epoxide After the reaction was completed, the red cell membranes were precipitated by centrifugation at 3,000 rpm for 10 minutes. The packed red cells were lyzed using 1 volume cold water and the globin precipitated from hemoglobin solution by addition of hemoglobin dropwise to acidified (0.1% HCl) acetone chilled to -20°. Globin pellets were collected, rinsed with acetone (100%), dried under nitrogen and stored at -20° until analysis. Control reactions were performed by preincubation of the PAH epoxides in saline for 15 minutes prior to addition of the red cell suspension to allow for conversion of the PAH epoxide to unreactive PAH tetrols. Additional control reactions were carried out by immediately adding 500 µl water to the reaction after adding the epoxide to the red cell suspension. This also results in conversion of the epoxide to unreactive tetrols. Those PAH epoxides were released from the globin by incubation (1 ml) with 250 µl pronase stock for 24 hours at 37°. After reaction, released PAH tetrols extracted from solution with ethyl acetate. The ethyl acetate extracts were dried under nitrogen and redissolved in 100 µl methanol for analysis by HPLC and GC/MS. HPLC analysis of PAH tetrols: A Waters LC system, coupled with Waters autosampler, scanning fluorescence detector, PDA detector, M600E pumps, Millennium software were used to characterize the PAH tetrols obtained in the reaction. A 4.6 X 25 cm C18 µbondapak PAH column was eluted with methanol water gradients at a flow rate of 1.0 ml/min. Full spectrum PDA detection was accomplished by scanning from 200 nm – 500 nm and extraction of the spectra for 254 nm. Fluorescence detection was accomplished by setting the detector for the appropriate excitation and emission wavelengths of the corresponding tetrols.
EPA EPSCoR Progress Report Harrell E. Hurst, Ph.D.
- 21 –
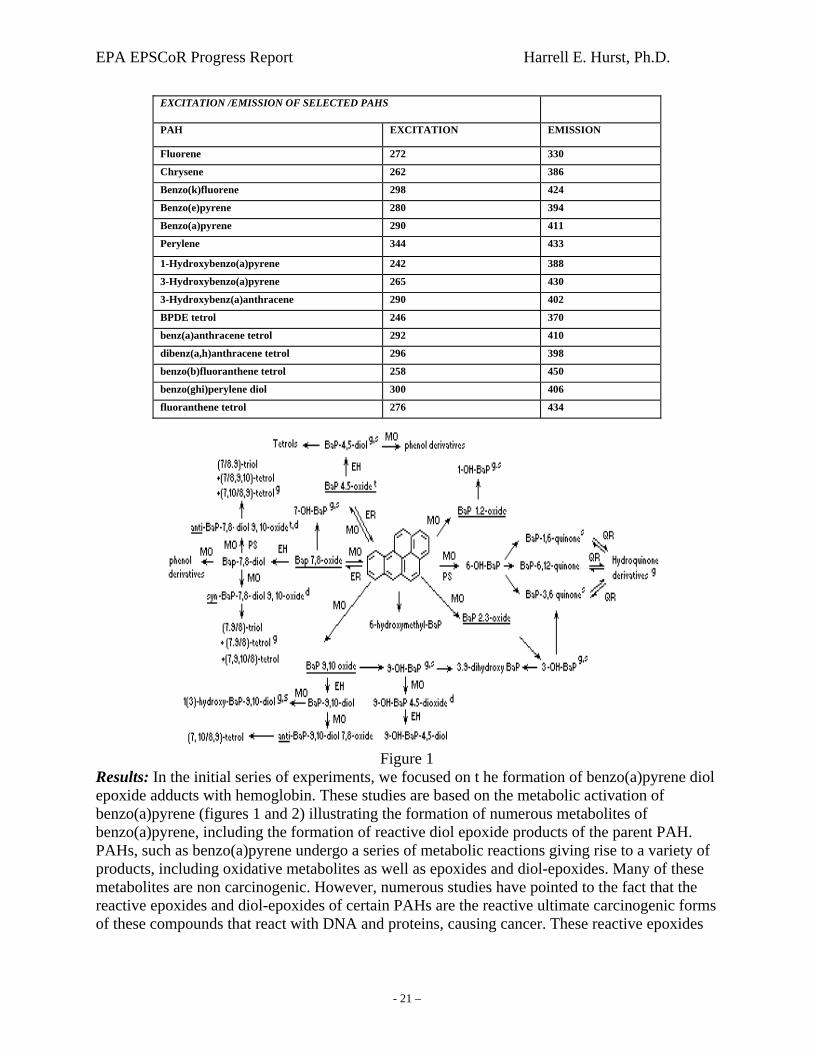
EXCITATION /EMISSION OF SELECTED PAHS
PAH EXCITATION EMISSION
Fluorene 272 330
Chrysene 262 386
Benzo(k)fluorene 298 424
Benzo(e)pyrene 280 394
Benzo(a)pyrene 290 411
Perylene 344 433
1-Hydroxybenzo(a)pyrene 242 388
3-Hydroxybenzo(a)pyrene 265 430
3-Hydroxybenz(a)anthracene 290 402
BPDE tetrol 246 370
benz(a)anthracene tetrol 292 410
dibenz(a,h)anthracene tetrol 296 398
benzo(b)fluoranthene tetrol 258 450
benzo(ghi)perylene diol 300 406
fluoranthene tetrol 276 434
Figure 1 Results: In the initial series of experiments, we focused on t he formation of benzo(a)pyrene diol epoxide adducts with hemoglobin. These studies are based on the metabolic activation of benzo(a)pyrene (figures 1 and 2) illustrating the formation of numerous metabolites of benzo(a)pyrene, including the formation of reactive diol epoxide products of the parent PAH. PAHs, such as benzo(a)pyrene undergo a series of metabolic reactions giving rise to a variety of products, including oxidative metabolites as well as epoxides and diol-epoxides. Many of these metabolites are non carcinogenic. However, numerous studies have pointed to the fact that the reactive epoxides and diol-epoxides of certain PAHs are the reactive ultimate carcinogenic forms of these compounds that react with DNA and proteins, causing cancer. These reactive epoxides
EPA EPSCoR Progress Report Harrell E. Hurst, Ph.D.
- 22 –
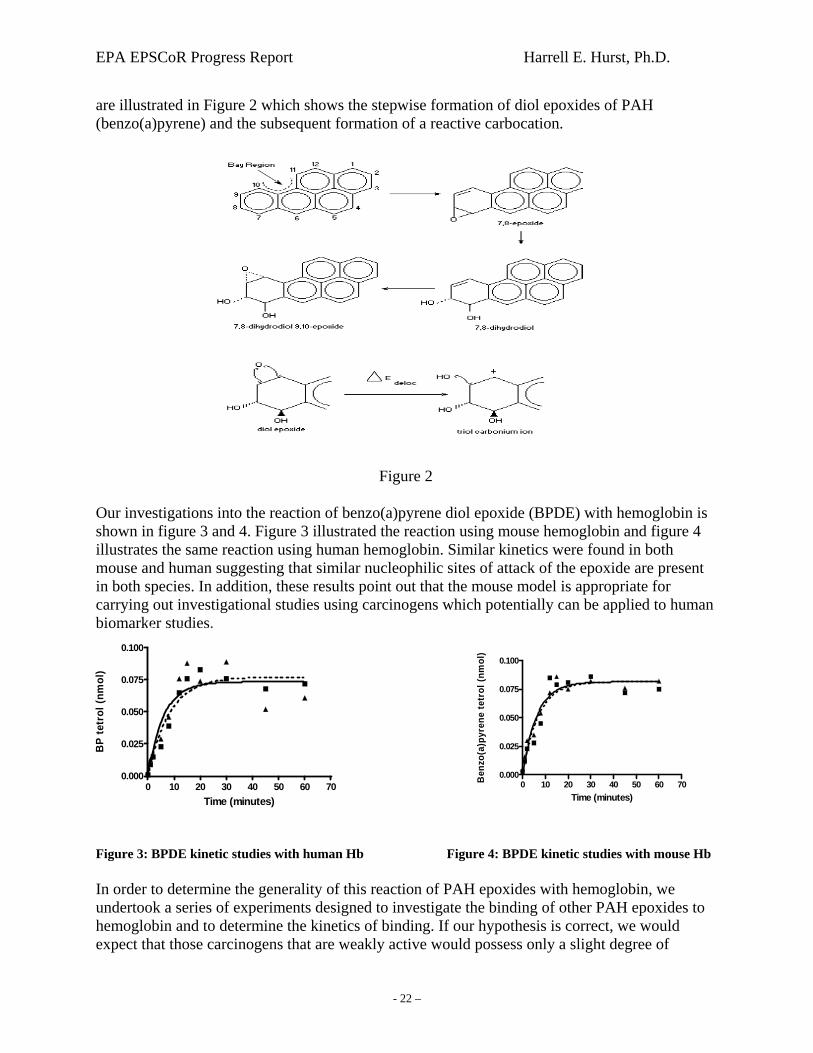
are illustrated in Figure 2 which shows the stepwise formation of diol epoxides of PAH (benzo(a)pyrene) and the subsequent formation of a reactive carbocation.
Figure 2 Our investigations into the reaction of benzo(a)pyrene diol epoxide (BPDE) with hemoglobin is shown in figure 3 and 4. Figure 3 illustrated the reaction using mouse hemoglobin and figure 4 illustrates the same reaction using human hemoglobin. Similar kinetics were found in both mouse and human suggesting that similar nucleophilic sites of attack of the epoxide are present in both species. In addition, these results point out that the mouse model is appropriate for carrying out investigational studies using carcinogens which potentially can be applied to human biomarker studies. Figure 3: BPDE kinetic studies with human Hb Figure 4: BPDE kinetic studies with mouse Hb In order to determine the generality of this reaction of PAH epoxides with hemoglobin, we undertook a series of experiments designed to investigate the binding of other PAH epoxides to hemoglobin and to determine the kinetics of binding. If our hypothesis is correct, we would expect that those carcinogens that are weakly active would possess only a slight degree of
Benzo(a)pyrene tetrol Mouse Hemoglobin
0 10 20 30 40 50 60 700.000
0.025
0.050
0.075
0.100
Time (minutes)
BP
tetr
ol (n
mol
)
BPDE kinetics Human Hemoglobin
0 10 20 30 40 50 60 700.000
0.025
0.050
0.075
0.100
Time (minutes)
Ben
zo(a
)pyr
ene
tetr
ol (n
mol
)
EPA EPSCoR Progress Report Harrell E. Hurst, Ph.D.
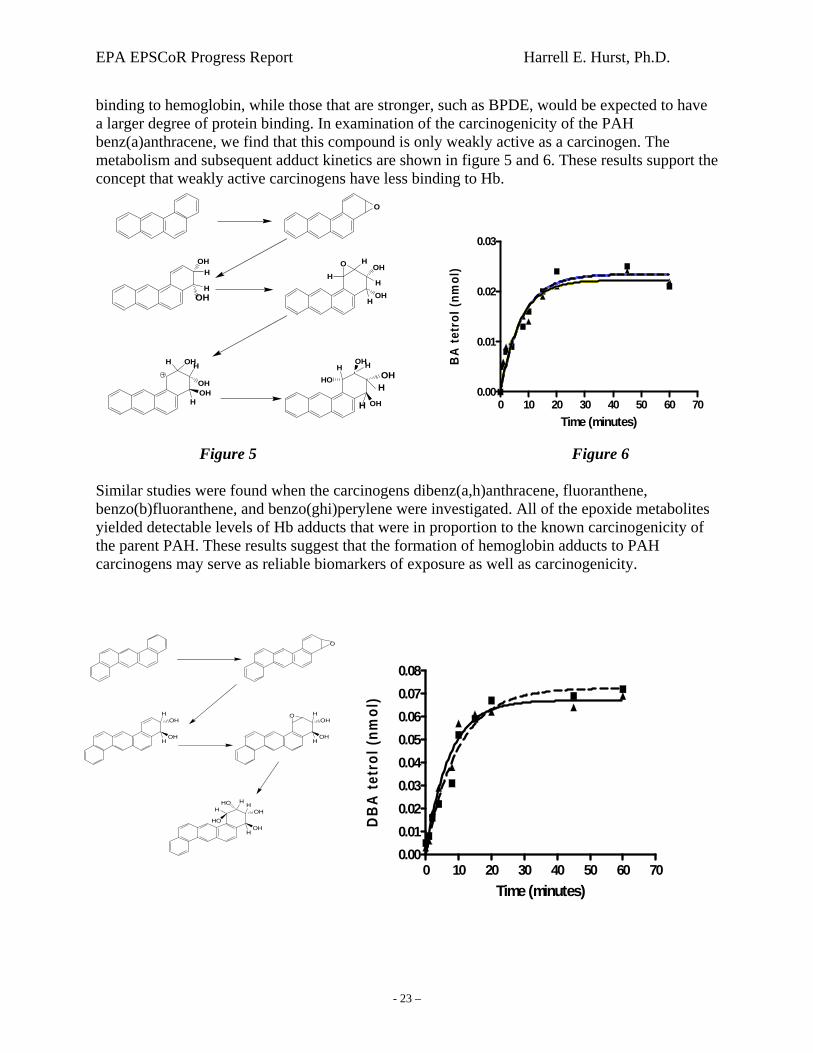
- 23 –
binding to hemoglobin, while those that are stronger, such as BPDE, would be expected to have a larger degree of protein binding. In examination of the carcinogenicity of the PAH benz(a)anthracene, we find that this compound is only weakly active as a carcinogen. The metabolism and subsequent adduct kinetics are shown in figure 5 and 6. These results support the concept that weakly active carcinogens have less binding to Hb. Figure 5 Figure 6 Similar studies were found when the carcinogens dibenz(a,h)anthracene, fluoranthene, benzo(b)fluoranthene, and benzo(ghi)perylene were investigated. All of the epoxide metabolites yielded detectable levels of Hb adducts that were in proportion to the known carcinogenicity of the parent PAH. These results suggest that the formation of hemoglobin adducts to PAH carcinogens may serve as reliable biomarkers of exposure as well as carcinogenicity.
OHH
HOH
OH
OHH
H
O H
H
H H
OH
H
HO
OH
OH
H HOH
H
H
O
OH
OH
Benz(a)anthracene epoxide kinetics Mouse Hemoglobin
0 10 20 30 40 50 60 700.00
0.01
0.02
0.03
Time (minutes)
BA
tetr
ol (n
mol
)
OH
OH
H
H
OH
OH
H
H
O
OH
OH
H
H
HO
HO
HH
O z(a,h)anthracene Epoxide Kinetics with Mouse
0 10 20 30 40 50 60 700.000.010.020.030.040.050.060.070.08
Time (minutes)
DB
A te
trol
(nm
ol)
EPA EPSCoR Progress Report Harrell E. Hurst, Ph.D.
- 24 –
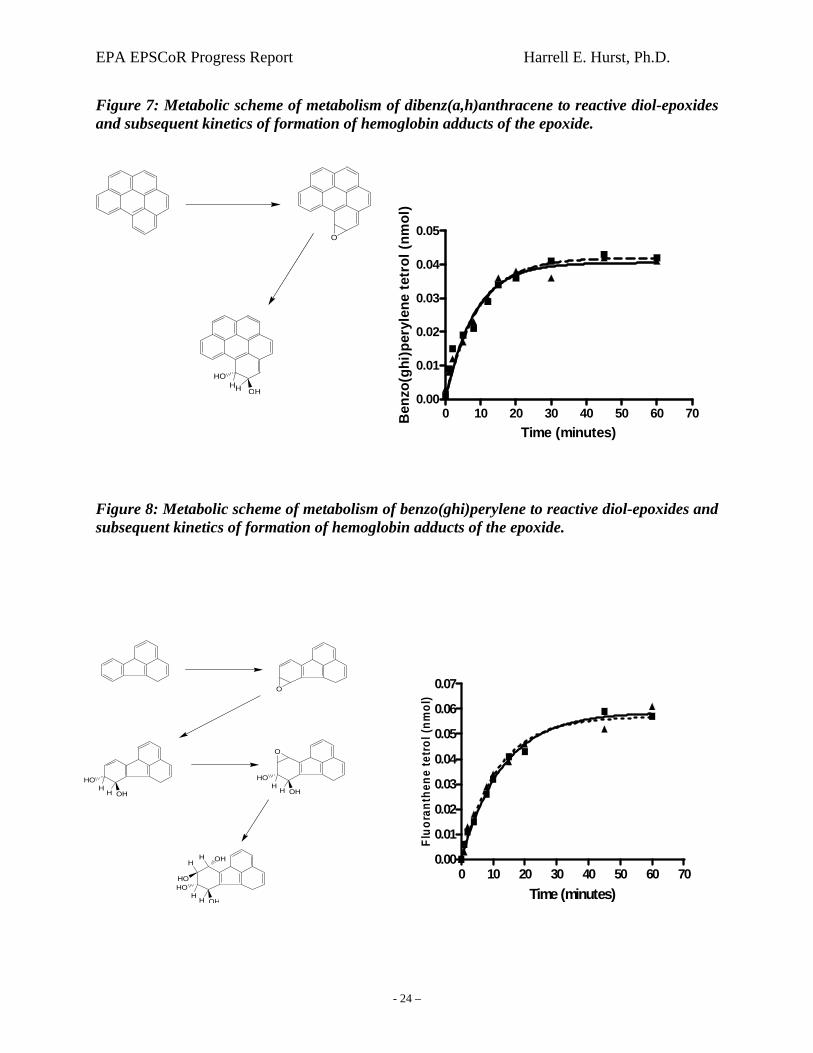
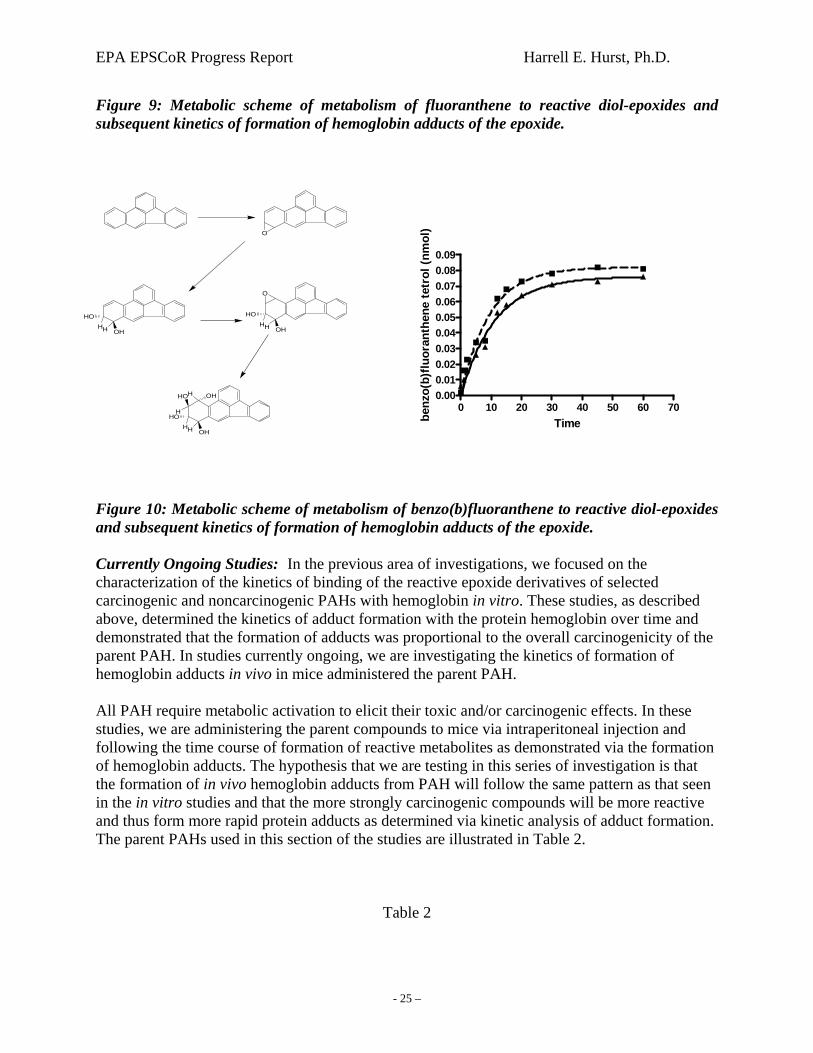
Figure 7: Metabolic scheme of metabolism of dibenz(a,h)anthracene to reactive diol-epoxides and subsequent kinetics of formation of hemoglobin adducts of the epoxide. Figure 8: Metabolic scheme of metabolism of benzo(ghi)perylene to reactive diol-epoxides and subsequent kinetics of formation of hemoglobin adducts of the epoxide.
O
HO
OHHH
Benzo(ghi)perylene tetrol kinetics
0 10 20 30 40 50 60 700.00
0.01
0.02
0.03
0.04
0.05
Time (minutes)
Ben
zo(g
hi)p
eryl
ene
tetr
ol (n
mol
)
O
HO
OHH
H
HO
OHH
H
HO
OHH
H
O
OH
HO
HH
Fluoranthene tetrol kinetics
0 10 20 30 40 50 60 700.00
0.01
0.02
0.03
0.04
0.05
0.06
0.07
Time (minutes)
Fluo
rant
hene
tetro
l (nm
ol)
EPA EPSCoR Progress Report Harrell E. Hurst, Ph.D.
- 25 –
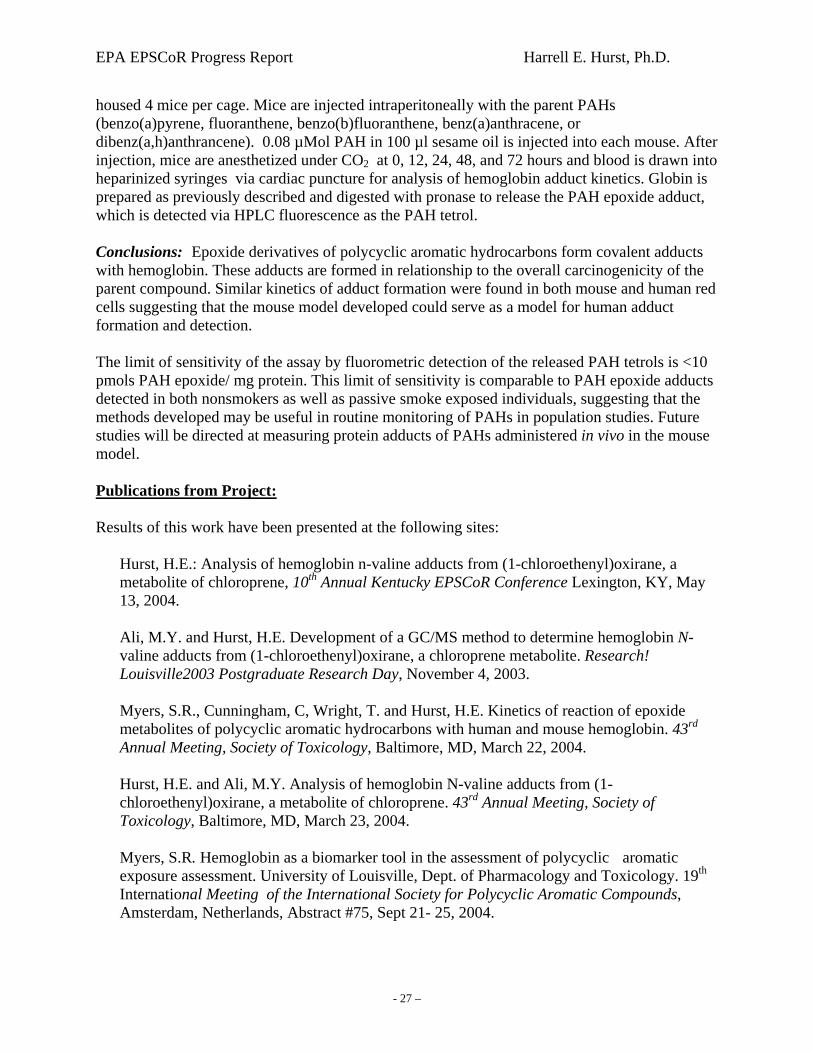
Figure 9: Metabolic scheme of metabolism of fluoranthene to reactive diol-epoxides and subsequent kinetics of formation of hemoglobin adducts of the epoxide. Figure 10: Metabolic scheme of metabolism of benzo(b)fluoranthene to reactive diol-epoxides and subsequent kinetics of formation of hemoglobin adducts of the epoxide. Currently Ongoing Studies: In the previous area of investigations, we focused on the characterization of the kinetics of binding of the reactive epoxide derivatives of selected carcinogenic and noncarcinogenic PAHs with hemoglobin in vitro. These studies, as described above, determined the kinetics of adduct formation with the protein hemoglobin over time and demonstrated that the formation of adducts was proportional to the overall carcinogenicity of the parent PAH. In studies currently ongoing, we are investigating the kinetics of formation of hemoglobin adducts in vivo in mice administered the parent PAH. All PAH require metabolic activation to elicit their toxic and/or carcinogenic effects. In these studies, we are administering the parent compounds to mice via intraperitoneal injection and following the time course of formation of reactive metabolites as demonstrated via the formation of hemoglobin adducts. The hypothesis that we are testing in this series of investigation is that the formation of in vivo hemoglobin adducts from PAH will follow the same pattern as that seen in the in vitro studies and that the more strongly carcinogenic compounds will be more reactive and thus form more rapid protein adducts as determined via kinetic analysis of adduct formation. The parent PAHs used in this section of the studies are illustrated in Table 2.
Table 2
O
HO
OHHH
HO
OHHH
HO
OHHH
O
OHHOH
H
Benzo(b)fluoranthene tetrol kinetics
0 10 20 30 40 50 60 700.000.010.020.030.040.050.060.070.080.09
Timebenz
o(b)
fluor
anth
ene
tetr
ol (n
mol
)

EPA EPSCoR Progress Report Harrell E. Hurst, Ph.D.
- 26 –
In order to accomplish these experiments, we have selected to use the male C57BL/6 mice. This strain of mouse was selected for use in the in vivo studies due to its well characterized metabolism profile of PAHs as well as the fact that this strain of mouse has similar hemoglobin sequences compared to humans. Male mice were selected for the study since hormonal and estrous cycle regulation in the female mouse could potentially add various confounders to adduct formation to the study. Mice (20 g) are purchased from Charles River Laboratories, Inc. and
Parent PAHs used in the in vitro formation of hemoglobin adducts
Benzo(a)pyrene (BP)
Fluoranthene (F)
Benz(a)anthracene (BA)
Benzo(b)fluoranthene (BbF)
Dibenz(a,h)anthracene (DBA)
Benzo(ghi)perylene (BghiP)
EPA EPSCoR Progress Report Harrell E. Hurst, Ph.D.
- 27 –
housed 4 mice per cage. Mice are injected intraperitoneally with the parent PAHs (benzo(a)pyrene, fluoranthene, benzo(b)fluoranthene, benz(a)anthracene, or dibenz(a,h)anthrancene). 0.08 µMol PAH in 100 µl sesame oil is injected into each mouse. After injection, mice are anesthetized under CO2 at 0, 12, 24, 48, and 72 hours and blood is drawn into heparinized syringes via cardiac puncture for analysis of hemoglobin adduct kinetics. Globin is prepared as previously described and digested with pronase to release the PAH epoxide adduct, which is detected via HPLC fluorescence as the PAH tetrol. Conclusions: Epoxide derivatives of polycyclic aromatic hydrocarbons form covalent adducts with hemoglobin. These adducts are formed in relationship to the overall carcinogenicity of the parent compound. Similar kinetics of adduct formation were found in both mouse and human red cells suggesting that the mouse model developed could serve as a model for human adduct formation and detection. The limit of sensitivity of the assay by fluorometric detection of the released PAH tetrols is <10 pmols PAH epoxide/ mg protein. This limit of sensitivity is comparable to PAH epoxide adducts detected in both nonsmokers as well as passive smoke exposed individuals, suggesting that the methods developed may be useful in routine monitoring of PAHs in population studies. Future studies will be directed at measuring protein adducts of PAHs administered in vivo in the mouse model.
Publications from Project: Results of this work have been presented at the following sites:
Hurst, H.E.: Analysis of hemoglobin n-valine adducts from (1-chloroethenyl)oxirane, a metabolite of chloroprene, 10th Annual Kentucky EPSCoR Conference Lexington, KY, May 13, 2004. Ali, M.Y. and Hurst, H.E. Development of a GC/MS method to determine hemoglobin N-valine adducts from (1-chloroethenyl)oxirane, a chloroprene metabolite. Research! Louisville2003 Postgraduate Research Day, November 4, 2003. Myers, S.R., Cunningham, C, Wright, T. and Hurst, H.E. Kinetics of reaction of epoxide metabolites of polycyclic aromatic hydrocarbons with human and mouse hemoglobin. 43rd Annual Meeting, Society of Toxicology, Baltimore, MD, March 22, 2004. Hurst, H.E. and Ali, M.Y. Analysis of hemoglobin N-valine adducts from (1-chloroethenyl)oxirane, a metabolite of chloroprene. 43rd Annual Meeting, Society of Toxicology, Baltimore, MD, March 23, 2004.
Myers, S.R. Hemoglobin as a biomarker tool in the assessment of polycyclic aromatic exposure assessment. University of Louisville, Dept. of Pharmacology and Toxicology. 19th International Meeting of the International Society for Polycyclic Aromatic Compounds, Amsterdam, Netherlands, Abstract #75, Sept 21- 25, 2004.
EPA EPSCoR Progress Report Harrell E. Hurst, Ph.D.
- 28 –
S. Myers, C. Cunningham, T Wright, H. Hurst., Polycyclic Aromatic Hydrocarbon Adducts with Hemoglobin. American Association for Cancer Research, March, Orlando, FL, 2004.
References
(1) Himmelstein, M. W., Carpenter, S. C., Hinderliter, P. M., Snow, T. A., and Valentine, R. (2001) The metabolism of beta-chloroprene: preliminary in-vitro studies using liver microsomes. Chem. Biol. Interact. 135-136, 267 - 284.
(2) Munter, T., Cottrell, L., Hill, S., Kronberg, L., Watson, W. P., and Golding, B. T. (2002) Identification of adducts derived from reactions of (1-chloroethenyl)oxirane with nucleosides and calf thymus DNA. Chem. Res. Toxicol. 15, 1549 - 1560.
(3) Munter, T., Cottrell, L., Golding, B. T., and Watson, W. P. (2003) Detoxication pathways involving glutathione and epoxide hydrolase in the in vitro metabolism of chloroprene. Chem. Res. Toxicol. 16, 1287 - 1297.
(4) Bleasdale, C., Small, R. D., Watson, W. P., Wilson, J., and Golding, B. T. (1996) Studies on the molecular toxicology of buta-1,3-diene and isoprene epoxides. Toxicology 113, 290 - 293.
Related Documents


