Progress Report Optimization and Scale-up of Process Parameters for High Fructose Syrup Production Using A. niger OP-3 and Penicillium sp. NFCCI 2768 Inulinase (PA-23/656 dt. 22.11.2012) Sponsored by MADHYA PRADESH BIOTECHNOLOGY COUNCIL 26, Kisan Bhawan, Arera Hills, Jail Road, BHOPAL-462011 (M.P.) Submitted By Prof. Naveen Kango Head, Department of Microbiology Dr. Harisingh Gour Vishwavidyalaya Sagar (M.P.) 470003

Welcome message from author
This document is posted to help you gain knowledge. Please leave a comment to let me know what you think about it! Share it to your friends and learn new things together.
Transcript

1
Progress Report
Optimization and Scale-up of Process Parameters for High
Fructose Syrup Production Using A. niger OP-3 and
Penicillium sp. NFCCI 2768 Inulinase (PA-23/656 dt. 22.11.2012)
Sponsored by
MADHYA PRADESH BIOTECHNOLOGY COUNCIL
26, Kisan Bhawan, Arera Hills, Jail Road,
BHOPAL-462011 (M.P.)
Submitted By
Prof. Naveen Kango Head, Department of Microbiology
Dr. Harisingh Gour Vishwavidyalaya
Sagar (M.P.) 470003
2
Section A: Project Details
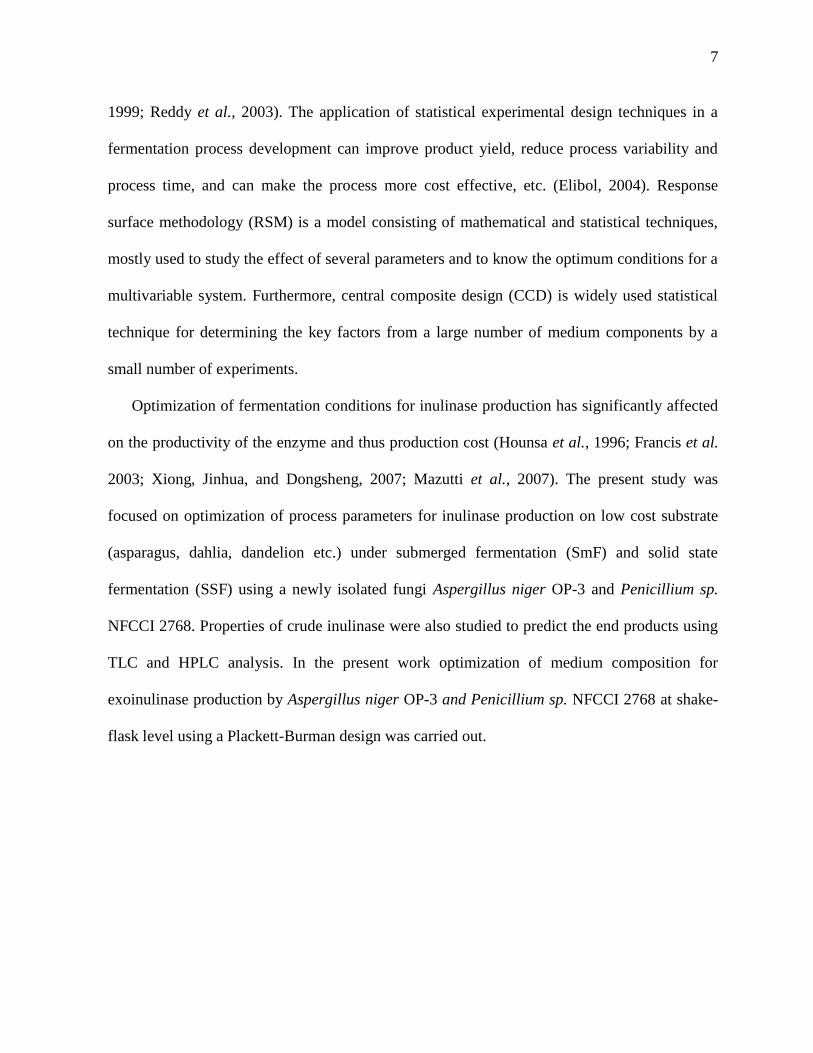
A1. Project Title: Optimization and scale up of process parameters
for high fructose syrup production using A. niger
OP-3 and Penicillium sp. NFCCI 2768 inulinase
A2. Name of Principal Investigator
Prof. Naveen Kango
A3. University
Dr. Harisingh Gour Vishwavidyalaya
(A Central University)
A4. Address with Contact No. Department of Microbiology
Dr. Harisingh Gour Vishwavidyalaya
(A Central University), Sagar (M.P.) 470003
Phone: 07582-224450, Mobile +91 9425635736
email: [email protected]
A5. MPBTC Sanction letter no. and date: PA-23/656 Dated 22.11.2012
A6. Total cost (Non recurring + Recurring ) Rs. 6, 58, 000/-
A7. Duration of the project 3 Years
A8. Approved objectives of the project
Year Objectives
I Year Optimization of inulinase production by select fungal strains using response surface
methodology (RSM).
Scale-up of inulinase production under optimized conditions in 5-litre laboratory
fermenter.
II Year Partial purification of inulinase using precipitation and ion exchange chromatography.
Extraction of inulin from locally available plants.
Application of crude and partially purified inulinase for hydrolysis of
commonly available inulin (Asparagus, Chicory, Dandelion and Dahlia) and
crude inulin extracts.
III Year Immobilization of inulinase using alginate beads, glutaraldehyde and
chitosan etc.
Optimization of process parameters (pH, temperature, dosage, substrate
concentration) for inulin hydrolysis using free and immobilized inulinase.
Evaluation of efficacy of inulinase preparation in terms of product yield.
A9.
Specific recommendations made by the PAC (if any)
NA

3
Section- B: Scientific and Technical progress
B1. Brief introduction
Inulin is a linear β-(2→1)-linked fructose polymer that occurs as a reserve carbohydrate in
many members of liliaceae and compositae including garlic, asparagus root, dandelion,
Jerusalem artichoke, dahlia tubers and chicory root. Inulinases are fructofuranosyl hydrolases
produced by a wide array of organisms including plants, bacteria, molds and yeasts. The
general reaction mainly involves action of two enzymes: (i) Exoinulinase (EC 3.8.1.80) which
splits of the terminal fructose units from inulin and (ii) Endoinulinase (EC 3.2.1.7) that breaks
down inulin into inulooligosaccharides (IOS). The yield in such process can be up to 75–85%
fructose solution. The high-fructose syrup obtained from enzymatic hydrolysis of inulin can be
used for production of ethanol. Inulinase obtained from microbial sources have a promising
application in obtaining high-fructose syrup from plant-inulin. Dandelion (Taraxacum
officinale) is a perennial herb of the family Asteraceae and native to temperate areas with large
amount of inulin (12-15%) and oligofructans in its tap roots and leaves that have various ethno-
pharmacological relevancies and regarded as anti-tumor, anti-diabetic, anti-rheumatic, anti-
inflammatory and anti-cardiogenic disorder. Dandelion, a common flowering weed and a rich
source of fructan can be exploited for generation of fructose using microbial inulinase (Kango,
2008; Chi et al., 2011; Qian et al., 2014; Weber and Wigg, 2014; Liu et al.,2014; Rawat et
al.,2015a; Martinez et al., 2015).
Nowadays, fructose is becoming an important food ingredient in pharmaceutical, soft drink
and energy industries for the production of fruit beverages, ice creams, dairy products, baby
food, carbonated soft drinks and bio-ethanol.The use of fructose in place of sucrose is helpful

4
in avoiding problems associated with corpulence, cariogenicity, atherosclerosis and diabetes
(Chi et al., 2011; Kango and Jain, 2011).
Enzyme immobilization has received greater attention because it renders the enzyme
reusable, provides greater stability and catalytic control, prevents product contamination,
allows continuous product formation and thus has great potential for industrial applications.
Reusability of the immobilized enzymes also increases cost-effectiveness and helps in actual
realization of enzyme application at industrial level. Enzyme entrapment using calcium
alginate is one such technique that is widely used for generation of industrial important
products (Gupta et al., 1992; Catana et al., 2005; Richetti et al., 2011; Silva et al., 2013;
Ganaie et al., 2014a).
Response surface methodology (RSM) provides information about optimum levels of each
variables, interaction between them and their effects to generate product with higher-rate
(Dilipkumar et al., 2013; Mutanda et al., 2008; Rao and Satyanarayana, 2003). A packed-bed
reactor (PBR) can continuously generate products of enzyme action under controlled
environment (Nakamura et al., 1995; Jung et al., 2011; Ganaie et al., 2014a; Detofol et al.,
2015). The present study describes production and characterization of exoinulinase from A.
niger NFCCI 3879 and use of inulin rich extract obtained from dandelion root as an alternative
material for continuous generation of fructose syrup using PBR.
B2. Review of literature
Microbial inulinases are an important class of industrial enzymes that hydrolyze β-fructosyl
linkages. Inulinases are fructofuranosyl hydrolases produced by a wide array of organisms
including plants, bacteria, molds, and yeasts. exoinulinase splits the terminal fructose units
from inulin and endoinulinase that breaks down inulin into inulooligosaccharides (IOS). The
former can be used for production of high fructose syrup from natural inulins

5
(saccharification), and the latter can be used for producing inulooligosaccharides of varying
lengths. A number of yeast, filamentous fungi and bacteria are reported to produce inulinases
(Kango and Jain 2011). Inulinases are receiving attention as they can be used for the
production of high-fructose syrup from abundant and renewable inulin. Conventional fructose
production from starch needs at least three enzymatic steps involving α-amylase, glucoamylase
and glucose isomerase and yields only 45% fructose. In contrast, enzymatic hydrolysis of
inulin is a single step process yielding 90-95% (w/w) fructose (Vandamme and Derycke 1983).
Apart from being a low calorie sweetener, fructose has other important applications such as in
the production of ethanol, acetone and butanol, gluconic acid, sorbitol and fructo-
oligosaccharides (Singh and Gill 2006). Inulooligosaccharides (IOS) produced by action of
endoinulinase are reported to have similar physiological functions to fructooligosaccharides
(FOS). These are regarded as prebiotics which positively influence the composition of the gut
microflora (Roberfroid 1993; Kaur and Gupta 2002).
Production of inulinase is affected by medium components and type of the organism used
for fermentation. To compensate the high cost of inulin, various inulin rich plant materials like
Jerusalem artichoke, dahlia, chicory; kuth roots, dandelion extract etc. have also been used for
the production of inulinases (Vandamme and Derycke 1983; Kango and Jain 2011; Jain 2011).
Dahlia tubers, asparagus roots, garlic bulbs and onion bulbs are rich source of inulin containing
15-20%, 10-15%, 9-16% and 2-6% of inulin (% fresh weight) (Singh and Singh 2010; van Loo
et al. 1995). Kluyveromyces marxianus and Aspergillus niger are the most commonly used
microorganisms for inulinase production (Kango 2008). Inulinase production by Penicillium
has been a subject of extensive survey and several such strains have been reported. These
include Penicillium sp. strain1 (Nakamura and Nakatsu 1977), Penicillium purpurogenum
(Onodera and Shiomi 1988), Penicillium trzebinskii (Onodera and Shiomi 1992), Penicillium

6
palitans, Penicillium cyclopium (Balayan et al. 1996) and Penicillium strain TN-88 (Nakamura
et al. 1997). Other strains of this genus reported for inulinase production include Penicillium
janczewskii (Pessoni et al. 2007) and Penicillium subrubescens (Mansouri et al. 2013). In the
present study production and properties of inulinase by newly isolated Penicillium sp. NFCC
2768 on media containing inulin rich plant extracts is studied.
Statistical experimental design techniques are very useful tools for the selection of nutrient,
as they can provide statistical models which help in understanding the interactions among the
process parameters at varying levels and in calculating the optimal level of each parameter for
a given target maximal enzyme production (Reddy et al., 2003). The application of statistical
experimental design techniques in fermentation process development can result in improved
product yields, reduced process cost, confirmation of the output response and reduced
development time (Elibol 2004). RSM is used to enhance enzyme production by optimizing the
culture media has been reported. On the other hand, studies regarding to optimization of
culture medium in SSF for the production of inulinase are still required scientific
consideration. Optimization of bioprocess by statistical experimental designs is very useful as
it helps in understanding the interactions among the process parameters at varying levels and in
calculating an optimal level of each parameter for the maximal product yield (Reddy et al.,
2003; Trivedi et al., 2012).
The optimization of a process or formulation of a medium by classical methods involving
the change of one-variable-at-a-time is extremely time consuming and expensive, when a large
number of variables are considered. This method does not. Statistical experimental design
techniques are very useful tools for the selection of nutrients. They can provide statistical
models which help in understanding the interactions among the nutrients at various levels and
in calculating the optimal level of each nutrient for a given target (Selvakurmar and Pandey,
7
1999; Reddy et al., 2003). The application of statistical experimental design techniques in a
fermentation process development can improve product yield, reduce process variability and
process time, and can make the process more cost effective, etc. (Elibol, 2004). Response
surface methodology (RSM) is a model consisting of mathematical and statistical techniques,
mostly used to study the effect of several parameters and to know the optimum conditions for a
multivariable system. Furthermore, central composite design (CCD) is widely used statistical
technique for determining the key factors from a large number of medium components by a
small number of experiments.
Optimization of fermentation conditions for inulinase production has significantly affected
on the productivity of the enzyme and thus production cost (Hounsa et al., 1996; Francis et al.
2003; Xiong, Jinhua, and Dongsheng, 2007; Mazutti et al., 2007). The present study was
focused on optimization of process parameters for inulinase production on low cost substrate
(asparagus, dahlia, dandelion etc.) under submerged fermentation (SmF) and solid state
fermentation (SSF) using a newly isolated fungi Aspergillus niger OP-3 and Penicillium sp.
NFCCI 2768. Properties of crude inulinase were also studied to predict the end products using
TLC and HPLC analysis. In the present work optimization of medium composition for
exoinulinase production by Aspergillus niger OP-3 and Penicillium sp. NFCCI 2768 at shake-
flask level using a Plackett-Burman design was carried out.
8
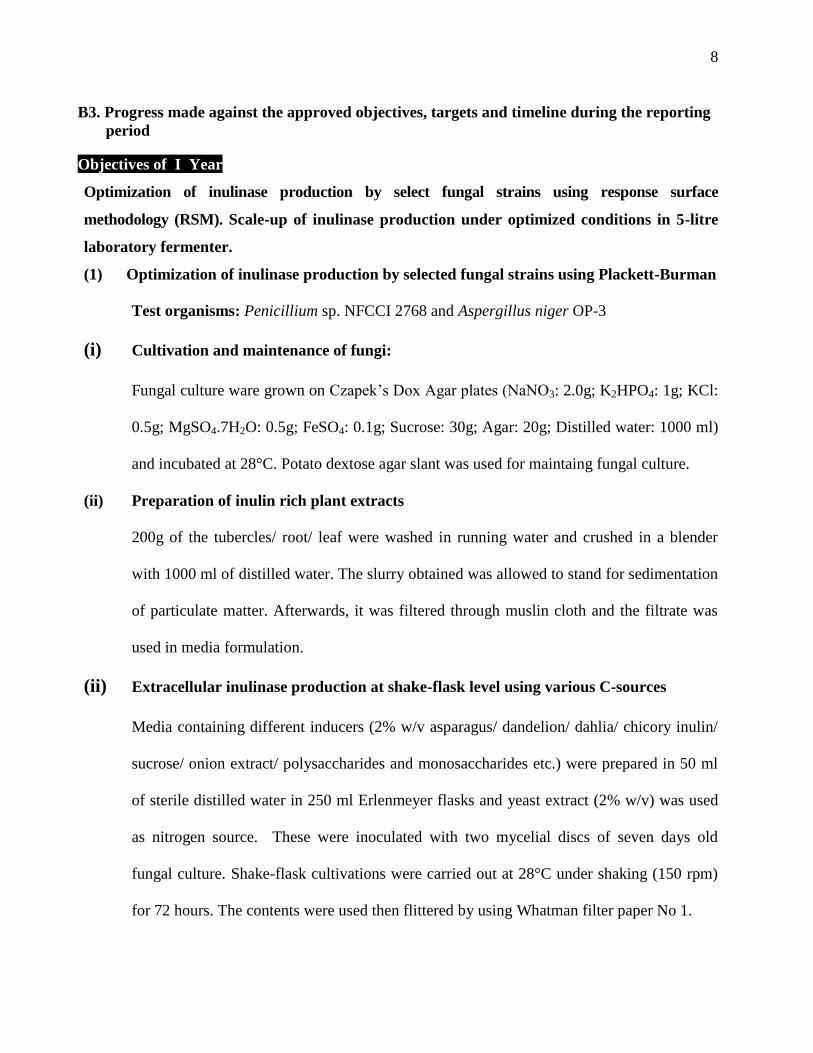
B3. Progress made against the approved objectives, targets and timeline during the reporting
period
Objectives of I Year
Optimization of inulinase production by select fungal strains using response surface
methodology (RSM). Scale-up of inulinase production under optimized conditions in 5-litre
laboratory fermenter.
(1) Optimization of inulinase production by selected fungal strains using Plackett-Burman
Test organisms: Penicillium sp. NFCCI 2768 and Aspergillus niger OP-3
(i) Cultivation and maintenance of fungi:
Fungal culture ware grown on Czapek’s Dox Agar plates (NaNO3: 2.0g; K2HPO4: 1g; KCl:
0.5g; MgSO4.7H2O: 0.5g; FeSO4: 0.1g; Sucrose: 30g; Agar: 20g; Distilled water: 1000 ml)
and incubated at 28°C. Potato dextose agar slant was used for maintaing fungal culture.
(ii) Preparation of inulin rich plant extracts
200g of the tubercles/ root/ leaf were washed in running water and crushed in a blender
with 1000 ml of distilled water. The slurry obtained was allowed to stand for sedimentation
of particulate matter. Afterwards, it was filtered through muslin cloth and the filtrate was
used in media formulation.
(ii) Extracellular inulinase production at shake-flask level using various C-sources
Media containing different inducers (2% w/v asparagus/ dandelion/ dahlia/ chicory inulin/
sucrose/ onion extract/ polysaccharides and monosaccharides etc.) were prepared in 50 ml
of sterile distilled water in 250 ml Erlenmeyer flasks and yeast extract (2% w/v) was used
as nitrogen source. These were inoculated with two mycelial discs of seven days old
fungal culture. Shake-flask cultivations were carried out at 28°C under shaking (150 rpm)
for 72 hours. The contents were used then flittered by using Whatman filter paper No 1.

9
(iv) Enzyme Assay
Inulinase/ Invertase activity:
For evaluation of inulinase activity, 0.2 ml of appropriately diluted enzyme (culture filtrate)
was added to 1.8 ml of inulin (1% w/v dissolved in 200 mM sodium acetate buffer, pH 5.0)
and incubated at 50°C for 15 min. After incubation, total reducing sugars liberated from
inulin were measured by adding 3 ml DNS reagent and boiling for 5 min (Kango, 2008).
Samples were allowed to cool and their absorbance was read at 540 nm. Invertase activity
was measured using sucrose solution (1% w/v) in place of inulin. One nanokatals (nkat) of
inulinase/invertase activity was defined as the amount of enzyme which produced 1nano
mole of fructose/glucose per second under the assay conditions as described above.
(V) Optimization of culture conditions for Inulinase production
Best carbon source supporting maximum titres of inulinase by Penicillium sp. 2768 and A.
niger OP-3 were then selected for optimization studies. Accordingly effect of varying best
carbon source and yeast extract, temperature, rpm, pH (total five parameters) were studied
using Placket-Burman design (Table 1).
(VI) Chromatographic analysis of inulin hydrolysate
End products of inulinase action were visualized using thin layer chromatography (TLC)
and high performance liquid chromatography (HPLC). 200 μl of undiluted enzyme (culture
filtrate) was added to 200 μl of inulin (5% w/v in 200 mM sodium acetate buffer, pH 5.0)
and incubated at 50°C in a water bath. Aliquots of 3 μl were withdrawn at different time
intervals and spotted on TLC plate (Merck, UV254). Plates were developed with the solvent
system containing isopropyl alcohol: ethyl acetate: water (2:2:1 by volume). Sugar spots
were developed with reagent containing 0.5% α-naphthol and 5% sulfuric acid in absolute
10
ethanol and by heating the plate at 100°C for 10 min (Kango, 2008). Fructose (F), kestose
(GF2) and nystose (GF3) were used as sugar standards. Inulin hydrolysis was also studied
by high performance liquid chromatography (HPLC), (Waters) using the Sugar Pak I
column and the Waters 410 RI detector. Distilled water was used as the mobile phase.
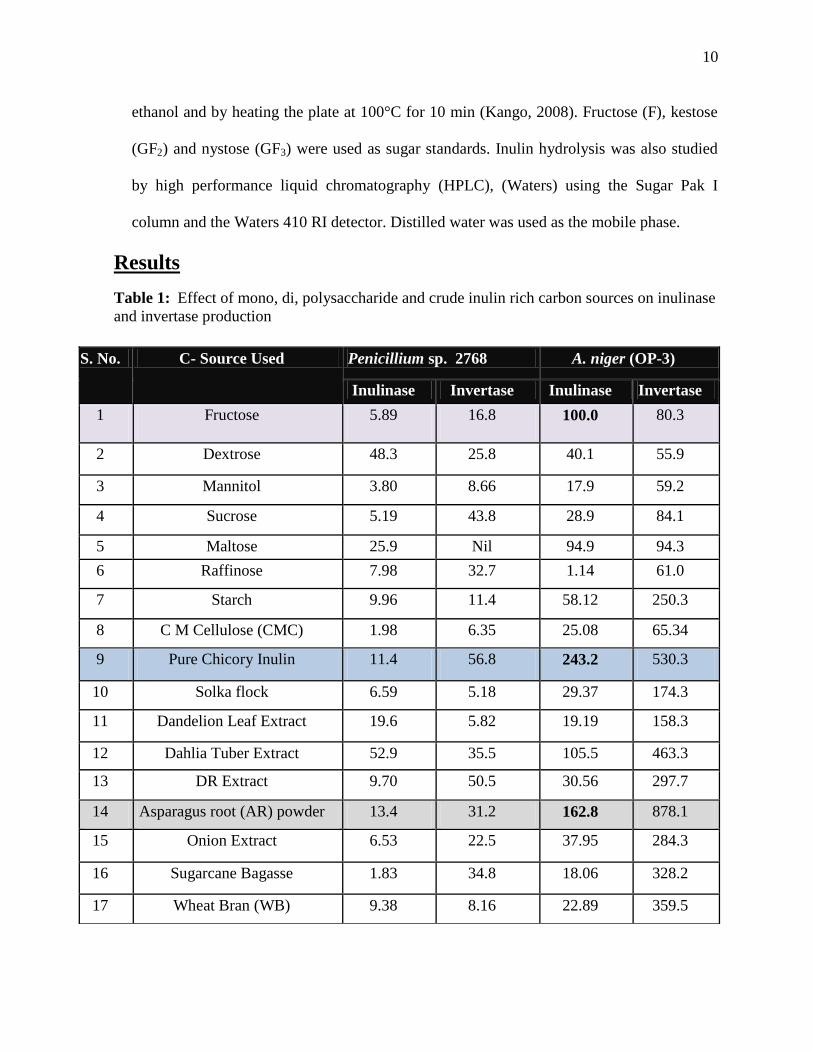
Results
Table 1: Effect of mono, di, polysaccharide and crude inulin rich carbon sources on inulinase
and invertase production
S. No. C- Source Used Penicillium sp. 2768 A. niger (OP-3)
Inulinase Invertase Inulinase Invertase
1 Fructose 5.89 16.8 100.0 80.3
2 Dextrose 48.3 25.8 40.1 55.9
3 Mannitol 3.80 8.66 17.9 59.2
4 Sucrose 5.19 43.8 28.9 84.1
5 Maltose 25.9 Nil 94.9 94.3
6 Raffinose 7.98 32.7 1.14 61.0
7 Starch 9.96 11.4 58.12 250.3
8 C M Cellulose (CMC) 1.98 6.35 25.08 65.34
9 Pure Chicory Inulin 11.4 56.8 243.2 530.3
10 Solka flock 6.59 5.18 29.37 174.3
11 Dandelion Leaf Extract 19.6 5.82 19.19 158.3
12 Dahlia Tuber Extract 52.9 35.5 105.5 463.3
13 DR Extract 9.70 50.5 30.56 297.7
14 Asparagus root (AR) powder 13.4 31.2 162.8 878.1
15 Onion Extract 6.53 22.5 37.95 284.3
16 Sugarcane Bagasse 1.83 34.8 18.06 328.2
17 Wheat Bran (WB) 9.38 8.16 22.89 359.5
11
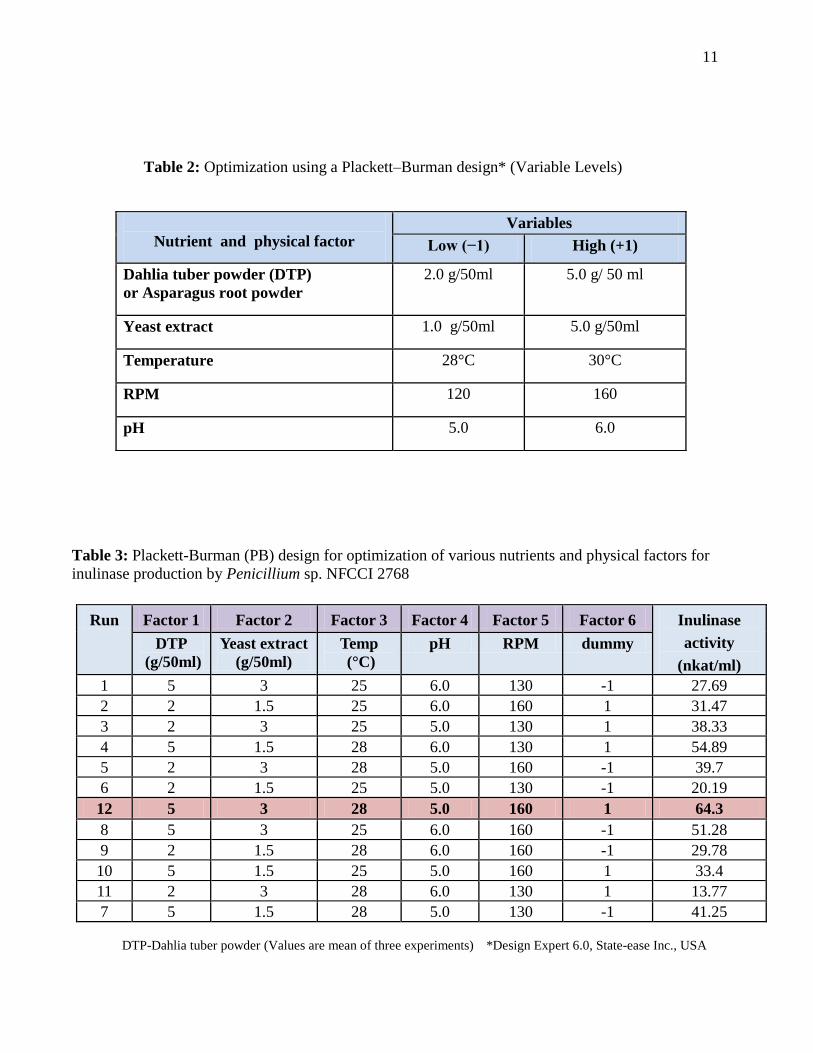
Table 2: Optimization using a Plackett–Burman design* (Variable Levels)
Table 3: Plackett-Burman (PB) design for optimization of various nutrients and physical factors for
inulinase production by Penicillium sp. NFCCI 2768
Run Factor 1 Factor 2 Factor 3 Factor 4 Factor 5 Factor 6 Inulinase
activity
(nkat/ml)
DTP
(g/50ml)
Yeast extract
(g/50ml)
Temp
(°C)
pH RPM dummy
1 5 3 25 6.0 130 -1 27.69
2 2 1.5 25 6.0 160 1 31.47
3 2 3 25 5.0 130 1 38.33
4 5 1.5 28 6.0 130 1 54.89
5 2 3 28 5.0 160 -1 39.7
6 2 1.5 25 5.0 130 -1 20.19
12 5 3 28 5.0 160 1 64.3
8 5 3 25 6.0 160 -1 51.28
9 2 1.5 28 6.0 160 -1 29.78
10 5 1.5 25 5.0 160 1 33.4
11 2 3 28 6.0 130 1 13.77
7 5 1.5 28 5.0 130 -1 41.25
DTP-Dahlia tuber powder (Values are mean of three experiments) *Design Expert 6.0, State-ease Inc., USA
Nutrient and physical factor
Variables
Low (−1) High (+1)
Dahlia tuber powder (DTP)
or Asparagus root powder
2.0 g/50ml 5.0 g/ 50 ml
Yeast extract 1.0 g/50ml 5.0 g/50ml
Temperature 28°C 30°C
RPM 120 160
pH 5.0 6.0

12
Table 4: Plackett-Burman (PB) design for optimization of various nutrients and physical factors for
inulinase production by Aspergillus niger (OP-3)
Run Factor 1 Factor 2 Factor 3 Factor 4 Factor 5 Factor 6 Inulinase
activity
(nkat/ml) ARP
(g/50ml)
Yeast
extract
(g/50ml)
Temp
(°C)
pH RPM dummy
1 5.00 1.00 30.00 6.00 120.0 1 180
2 2.00 1.00 27.00 5.00 120.0 -1 127
3 5.00 1.00 30.00 5.00 120.0 -1 98
4 2.00 1.00 30.00 6.00 150.0 -1 147
5 5.00 3.00 27.00 6.00 120.0 -1 91
6 5.00 3.00 27.00 6.00 150.0 -1 59
7 2.00 3.00 30.00 5.00 150.0 -1 47
8 2.00 3.00 27.00 5.00 120.0 1 98
9 5.00 1.00 27.00 5.00 150.0 1 104
10 2.00 1.00 27.00 6.00 150.0 1 111
11 2.00 3.00 30.00 6.00 120.0 1 84
12 5.00 3.00 30.00 5.00 150.0 1 116
ARP-Asparagus root powder (Values are mean of three experiments)

13
Table 5: Inulinase activity in the selected isolates after optimization
S. N. Fungus Unoptimized After Optimization
1. Penicillium sp. NFCCI 2768 52.9 64.3
2. Aspergillus niger OP-3 162.8 180
Inulinase activity (nkat/ml)
Figure 1: S-Standards (F-fructose, GF1-sucrose and GF2-raffinose); F-fructose;
I- chicory inulin L1, L2 Penicillium sp. NFCCI 2768 and L3, L4 A. niger OP-3
Culture filtrate was incubated with pure chicory inulin (2% w/v, pH 5.0) at 50°C for 1 hr.
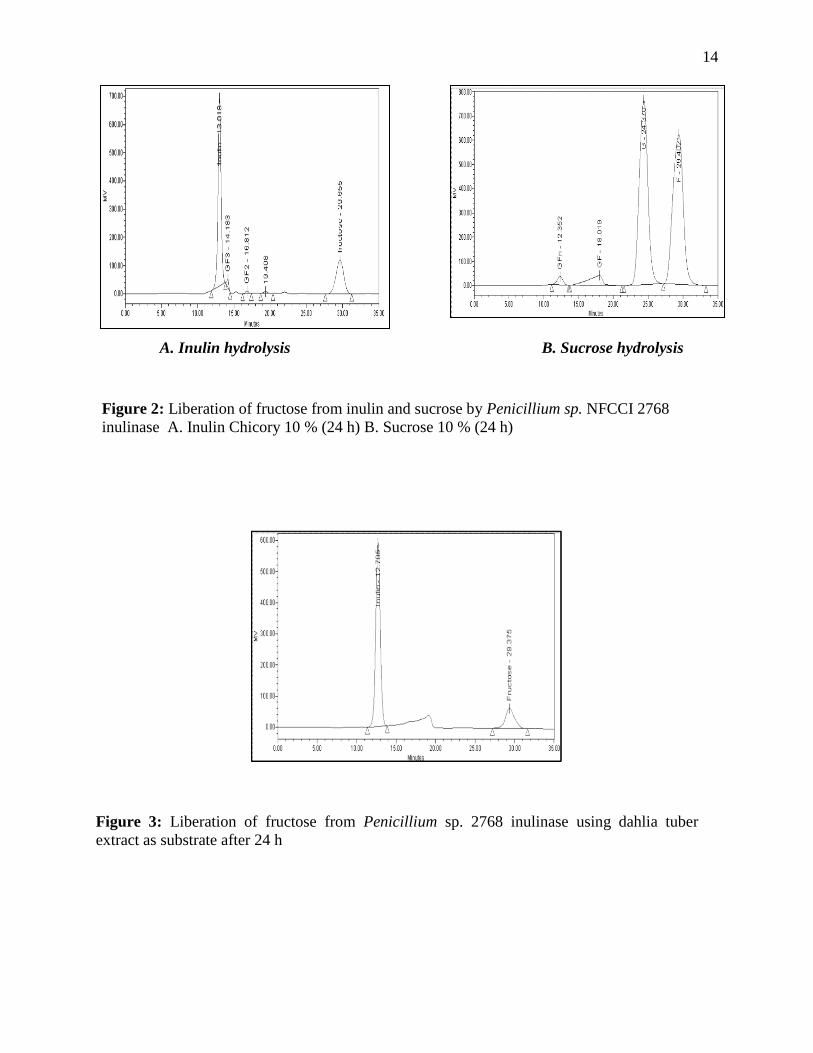
14
A. Inulin hydrolysis B. Sucrose hydrolysis
Figure 2: Liberation of fructose from inulin and sucrose by Penicillium sp. NFCCI 2768
inulinase A. Inulin Chicory 10 % (24 h) B. Sucrose 10 % (24 h)
Figure 3: Liberation of fructose from Penicillium sp. 2768 inulinase using dahlia tuber
extract as substrate after 24 h
A
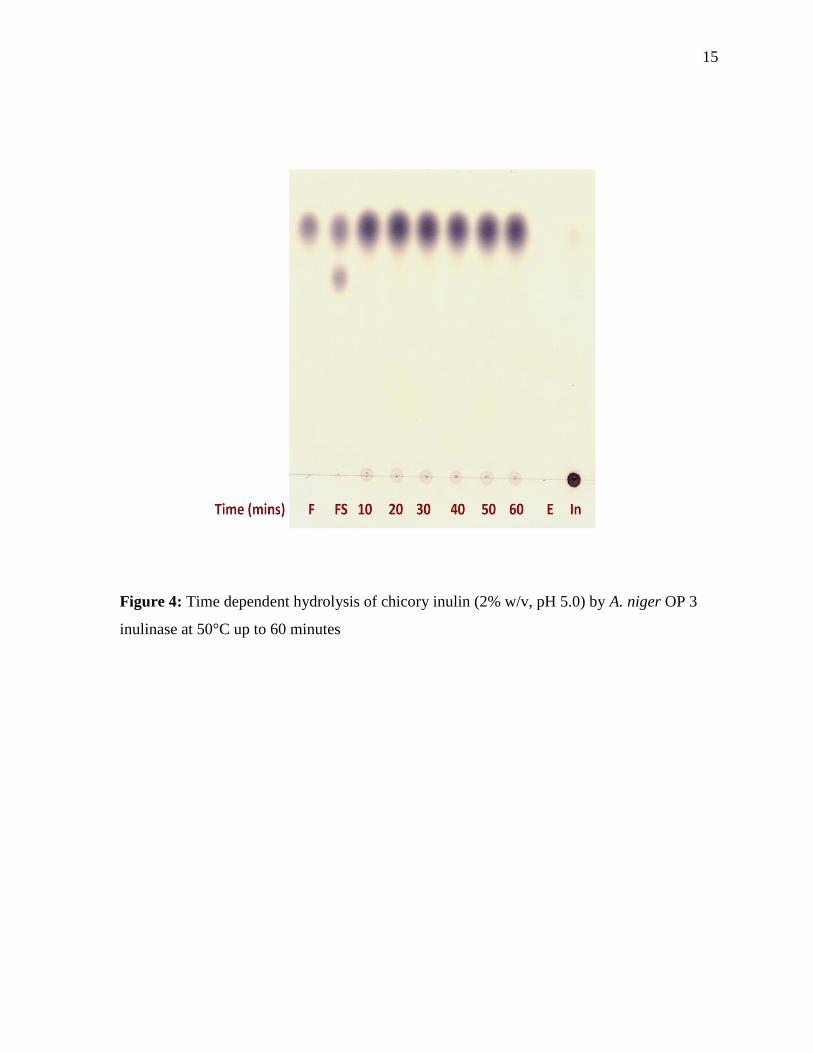
15
Figure 4: Time dependent hydrolysis of chicory inulin (2% w/v, pH 5.0) by A. niger OP 3
inulinase at 50°C up to 60 minutes

16
A. Inulin hydrolysis B. Sucrose hydrolysis
Figure 5: Liberation of fructose and other sugars from inulin by A. niger OP-3
A. Sucrose 25 % (24 h) B. Inulin Chicory 10 % (24 hours)
Figure 6: Liberation of fructose and other sugars by A. niger OP-3 inulinase from dandelion
root extract (24 hours)
C
B A

17
Scale-up of inulinase production under optimized conditions in 5-litre
laboratory fermentor
Enzyme production was carried out in 5-L laboratory scale fermentor (Bio-Spin, Bioage). Fixed
volume batch experiment was performed by adding asparagus root powder yeast extract solution
as substrate as described below.
Table 6: Medium used for fermentor study
S. No. Fermentation condition per litre
1 Asparagus root Powder (10% w/v) 100g
2 Yeast extract 20g
3 Temperature 30°C
4 Time 96h
5 RPM 120
A
18
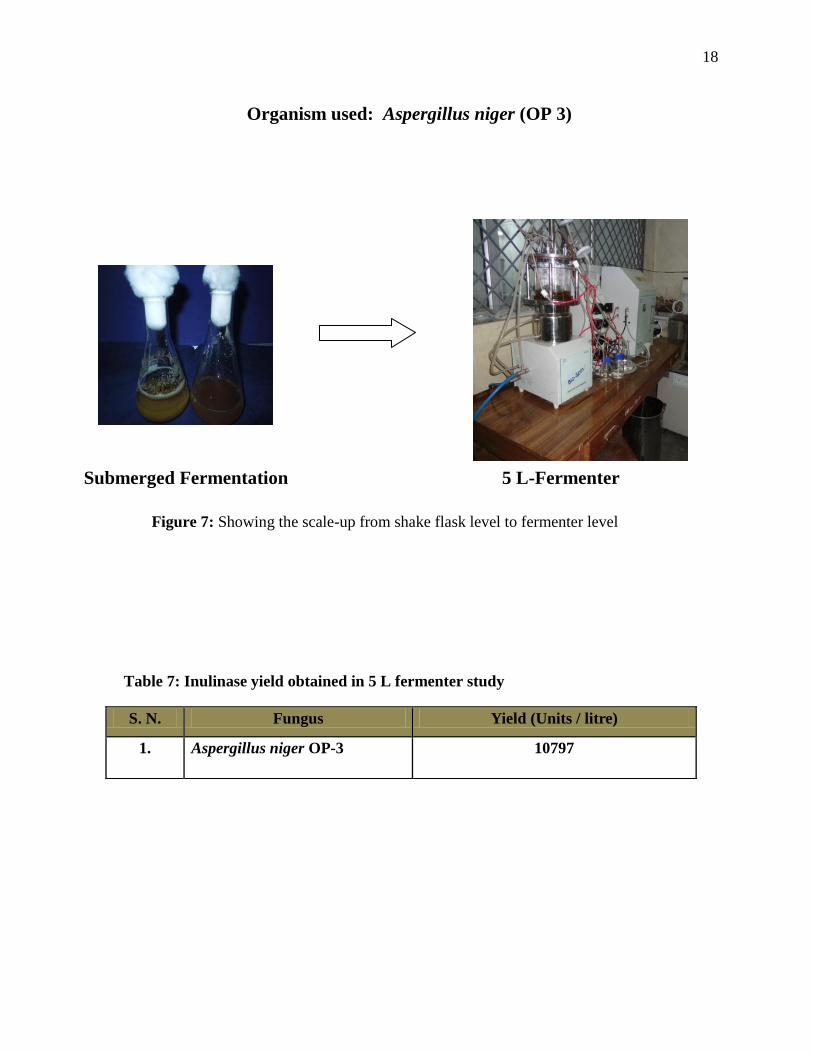
Organism used: Aspergillus niger (OP 3)
Submerged Fermentation 5 L-Fermenter
Figure 7: Showing the scale-up from shake flask level to fermenter level
Table 7: Inulinase yield obtained in 5 L fermenter study
S. N. Fungus Yield (Units / litre)
1. Aspergillus niger OP-3 10797

19
Solid State Fermentation (SSF)
Inulinase production by the two select strains was studied in SSF. Four different inulin rich
plant materials alongwith wheat bran were examined for this purpose. Czapek’s Dox Mineral
Salt Solution without sucrose was used as moistening agent.
Table 8: Production of inulinase in SSF by Penicillium sp. NFCCI 2768
S No Substrate used Inulinase Activity
(nkat/gds)
Invertase Activity
(nkat/gds)
1 Wheat Bran 34 147
2 Dandelion Root powder 205 367
3 Asparagus root powder 50 300
4 Dandelion leaf powder 35 665
5 Dandelion Root powder 38 140
Czapek mineral salt solution without sucrose used as moistening agent
Table 9: Production of inulinase in SSF by Aspergillus niger OP- 3
Czapek’s mineral salt solution without sucrose used as moistening agent
S N Substrate used Inulinase Activity
(nkat/gds)
Invertase Activity
(nkat/gds)
1 Wheat Bran 48 511
2 Dandelion Root Powder 245 2067
3 Asparagus Root Powder 620 3150
4 Dandelion Root Powder 193 853
5 Dandelion Leaf Powder 319 1053

20
Figure 8: Photographs of Microscopic Image Projection System (MIPS)
21
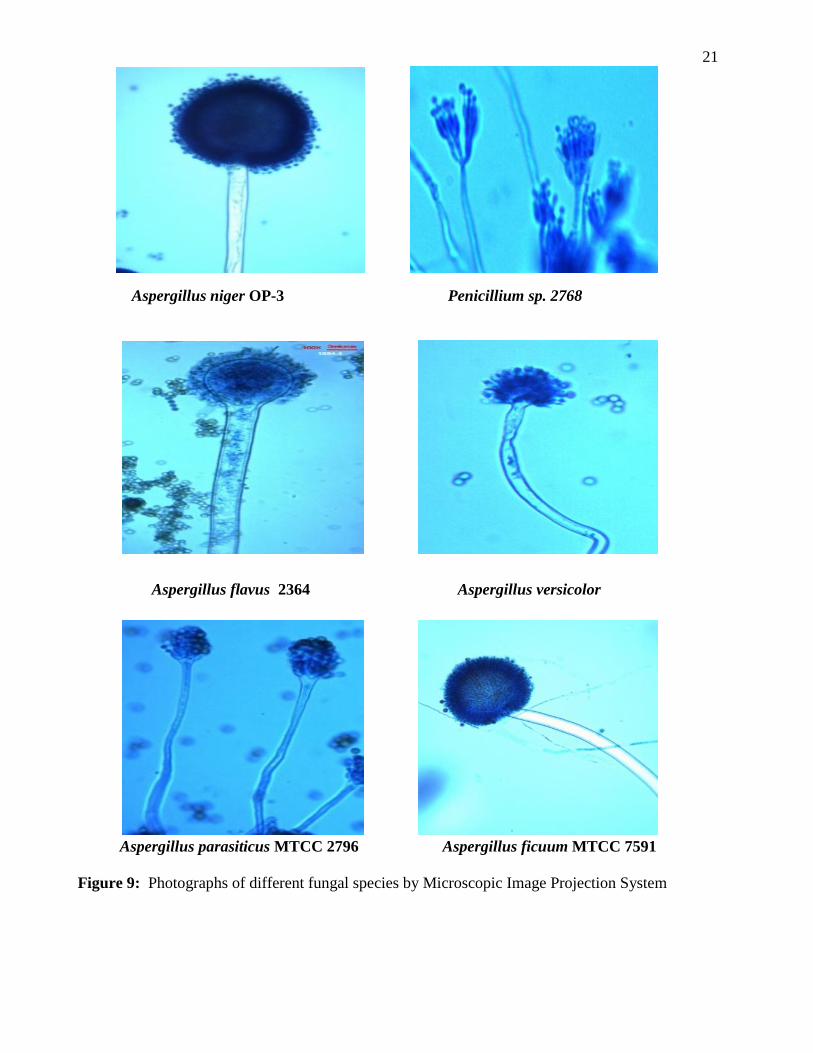
Aspergillus niger OP-3 Penicillium sp. 2768
Aspergillus flavus 2364 Aspergillus versicolor
Aspergillus parasiticus MTCC 2796 Aspergillus ficuum MTCC 7591
Figure 9: Photographs of different fungal species by Microscopic Image Projection System

22
Conclusions
The inulinulolytic systems studied in Penicillium sp. NFCCI 2768 and Aspergillus niger
OP-3 were found to produce varied enzyme titres on different carbon sources (Table 1).
Plackett-Burman design experiments showed wide variations in inulinase activity with
changes in variables. These variations reflected the importance of optimization for
obtaining higer production yield (Table 2,3,4).
Optimization studies resulted in 11% and 21% increase in inulinase yield in case of
Penicillium sp. NFCCI 2768 and Aspergillus niger (OP-3), respectively. Further studies on
optimization using Central composite design are underway.
Analysis of end products by TLC and HPLC confirmed that fructose is generated
exclusively using Aspergillus niger OP-3 and Penicillium sp. NFCCI 2768 inulinase. The
inulinase can be used for generating fructose from crude inulin extracts (Figure 1-6).
The optimum values for different variables were used inulinase production in 5 L-
laboratory fermenter by A. niger OP-3. The fungus produced 10797 nkat/l of inulinase
(Table 6,7 and Figure 7).
These strains also produced inulinase in solid state cultivation on various crude vegetal
substrates (Table 8,9).

23
Objectives of II Year
Partial purification of inulinase using precipitation and ion exchange chromatography.
Extraction of inulin from locally available plants.
Application of crude and partially purified inulinase for hydrolysis of commonly available inulin
(Asparagus, Chicory, Dandelion and Dahlia) and crude inulin extracts.
Methods
Materials
Inulin rich substrates used in this study were collected from local sources. Dahlia tubers, garlic
bulbs, onion bulbs and asparagus root powder (locally known as safed musli or shatavari) were
obtained from local market. Inulin (Chicory; MW-(162.14)n, hygroscopic in nature, white powder,
Cat. No. I2255-25G Sigma), fructose, 3,5-dinitrosalicycilc acid (DNS), kestose, nystose and corn
steep liquor (CSL) were obtained from Sigma Chemical Co., U.S.A., Silica gel plates UV254 were
obtained from Merck, Germany.
Taxonomic studies
The fungal strain was isolated from dahlia rhizosphere and was grown on
Czapek’s agar at 28°C. It was identified on the basis of its morphological features using taxonomic
description (Pitt 1973; Raper & Thom 1949). The identity of the culture was confirmed at National
fungal culture collection (NFCC), Agharkar research institute, Pune, India as Penicillium sp.
NFCC 2768.
Enzyme production
Penicillium sp. NFCC 2768 was cultivated on media containing inulin rich extracts in shake
cultures and the culture filtrates were assayed for inulinase activity. Asparagus root medium
contained 2% (w/v) dried root powder while production medium with pure inulin contained 2%
(w/v) chicory inulin. Media containing dahlia, garlic and onion were prepared by crushing 200g of

24
tubers or bulbs in 1000 ml of distilled water (20% fresh w/v). The slurry was filtered through a
muslin cloth and used in media preparation. Yeast extract 2% (w/v) was used as nitrogen source in
all the media formulations. Erlenmeyer flasks (150 ml) containing 50 ml aliquots of medium were
autoclaved (20 min, 121°C) and inoculated with two mycelial discs (7mm) cut from 7 days old
culture of Penicillium sp. NFCC 2768. Flasks were incubated at 30°C on a rotary shaker (150 rpm)
and were withdrawn at regular intervals of 24 h. The content of the flasks was filtered through
Whatman filter paper No.1 and clear filtrate was used for enzyme assays. The biomass (dry weight
in grams/50 ml) and final pH were also recorded. All the experiments were carried out in triplicate
and mean values ± standard deviation (SD) are reported.
Enzyme assays
For evaluation of inulinase activity, 0.2 ml of appropriately diluted enzyme (culture filtrate) was
added to 1.8 ml of inulin (1% w/v dissolved in 200 mM sodium acetate buffer, pH 5.0) and
incubated at 50°C for 15 min. After incubation, total reducing sugars liberated from inulin were
measured by adding 3 ml DNS reagent and boiling for 5 min (Kango 2008). Samples were allowed
to cool and their absorbance was read at 540 nm. Invertase activity was measured using sucrose
solution (1% w/v) in place of inulin. One nanokatals (nkat) of inulinase/invertase activity was
defined as the amount of enzyme which produced 1nano mole of fructose/glucose per second
under the assay conditions as described above.
Enzyme purification
Precipitation of total proteins was done by adding two volumes (2:1 v/v) of chilled ethanol to the
culture filtrate obtained from garlic bulb medium under constant stirring for 30 min at 4°C. The
precipitate was obtained by centrifuging the mix at 8000 g for 10 minutes at 4°C. Protein
25
precipitate thus obtained was suspended in sodium acetate buffer (200 mM, pH 5.0) and was used
finding pH optima, temperature optima and other characteristics of the inulinase. Inulinase was
apparently purified by total precipitation using ethanol followed by fractionation using DEAE-
Cellulose-52 (Hi-media, Mumbai) ion exchange chromatographic column of size 2.5×50 cm
(internal diameter×height). Five gram DEAE-cellulose-52 with the charge density of 0.80-1.10
meq/g dry weight was added to 300 mL of 0.2M NaOH with slow stirred for overnight. Discard
the NaOH solution and washed the slurry with double distilled water until pH achieved 5.5 to 6.5.
Then the 0.2M HCL was used to reach the pH 2.0 and mild stirred for 12 hour. After that slurry
was washed with double distilled water and poured the slurry in column. Purification of inulinase
from 100 ml crude enzyme was carried out at 4°C. The culture filtrate was precipitated using
ethanol precipitation. 1 mL of concentrated enzyme sample was loaded on to pre-equilibrated
column with the sodium acetate buffer (pH 5.0; 0.2 M). The proteins were eluted with a linear
gradient of 1 M NaCl at a flow rate of 0.2 mL/min. Optical densities of eluted column fractions
were measured at 280 nm and these were examined for protein concentration (Lowry 1951) and
inulinase activity (Kango 2008). Fractions showing activity were pooled and excess amount of
water was removed by lyophilization.
Gel electrophoresis:
SDS-PAGE was performed at a concentration of 10 % (w/v) polyacrylamide according to the
method of Laemmli (1970). Bands were visualized using Coomassie brilliant blue R-250
(0.25% w/v). Standard protein markers used were phosphorylase b (98 kDa), bovine serum
albumin (68 kDa), ovalbumin (44 kDa), glutathione S-trasferase (29 kDa) and lysozyme
(16 kDa).

26
Effect of pH and temperature on inulinase activity
The effect of pH on inulinase activity was determined by incubating 0.2 ml of suitably diluted
enzyme and 1.8 ml of inulin (1% w/v in different buffers; 200 mM sodium acetate buffer: pH 4.0
and 5.0; 100 mM phosphate buffer: pH 6.0, 7.0 and 8.0; 100 mM Tris-HCl buffer: pH 9.0; 200
mM Glycine-NaOH buffer: pH 10.0) for 15 min at 50°C. The effect of temperature was
determined by incubating 0.2 ml of suitably diluted enzyme and 1.8 ml of inulin (1% w/v in 200
mM sodium acetate buffer: pH 5.0) for 15 min at different temperatures.
Effect of metal ions and other reagents on inulinase activity
Effect of metal ions and enzyme inhibitors such as phenylmethanesulfonyl fluoride (PMSF),
p-chloromercuribenzoic acid (pCMB), ethylene diamine tetra acetic acid (EDTA) on inulinase
activity was examined by treating the enzyme sample (protein precipitate) with their solutions for
1 hour at 30°C. 1 mM solutions of MgSO4, ZnSO4, HgCl2, BaCl2, MnSO4, CaCl2, CuSO4, FeCl3
and aforesaid enzyme inhibitors in 50 mM sodium acetate buffer (pH 5.0) were used. The residual
activity of inulinase was then determined and compared to the control i.e. untreated enzyme
sample.
Chromatographic analysis of inulin hydrolysate
End products of inulinase action were visualized using thin layer chromatography (TLC) as
described earlier (Kango 2008). 200 μl of undiluted enzyme (culture filtrate) was added to 200 μl of
inulin (5% w/v in 200 mM sodium acetate buffer, pH 5.0) and incubated at 50°C in a water bath.
Aliquots of 3 μl were withdrawn at different time intervals and spotted on TLC plate (Merck,
UV254). Plates were eluted with the solvent system containing isopropyl alcohol: ethyl acetate:
water (2:2:1 by volume). Sugar spots were developed with reagent containing 0.5% α-naphthol and

27
5% sulfuric acid in absolute ethanol and by heating the plate at 100°C for 10 min. Fructose (F),
kestose (GF2) and nystose (GF3) were used as sugar standards. End products formed after inulin
hydrolysis were also analyzed by HPLC (Waters) using the Sugar Pak I column (6.5 × 300 mm) and
the Waters refractive index (RI) differential detector (RI 2414). Distilled water was used as the
mobile phase. The samples were filtered by using 0.45µm Millipore syringe filters before injecting
in 20µl valve. Column temperature was maintained 70°C by oven column (Dyna, Mumbai).
Calculation and analysis were performed using Empower-2 software Build 2154, Waters (Ganaie et
al. 2014).
Results and discussion
Effect of carbon-sources on inulinase production
Use of low-cost complex substrates as carbon source has been reported to ameliorate enzyme
production (Kango et al. 2003). In the present study Penicillium sp. NFCC 2768 was found to
utilize different carbon sources for its growth. Growth on dahlia tuber extract was profuse and a
decrease in the turbidity of the medium was also noticed. Inulinase and invertase activities noticed
on different carbon sources were noticed. Maximum inulinase activity was seen in dahlia extract
medium (64.54 nkat/ml) followed by 45.2 nkat/ml and 41.3 nkat/ml in asparagus root powder and
garlic extract medium, respectively (Table 1). Dahlia tuber extract can be an interesting
alternative, since it is a relatively cheap and easily available substrate that can serve as a feedstock
for large-scale fermentation. Recently, Jain et al. (2012) have used tubers of dahlia for production
of inulinase by Kluyveromyces marxianus and have observed higher inulinase activity
(25.3nkat/ml) as compared to pure inulin (17.8nkat/ml). Nakamura et al. (1997) reported 9.9 U/ml
of inulinase production by Penicillium sp. TN-88 using inulin as carbon source.
Trivedi et al. (2012) have indicated use of low-cost substrates such as wheat bran and corn steep
28
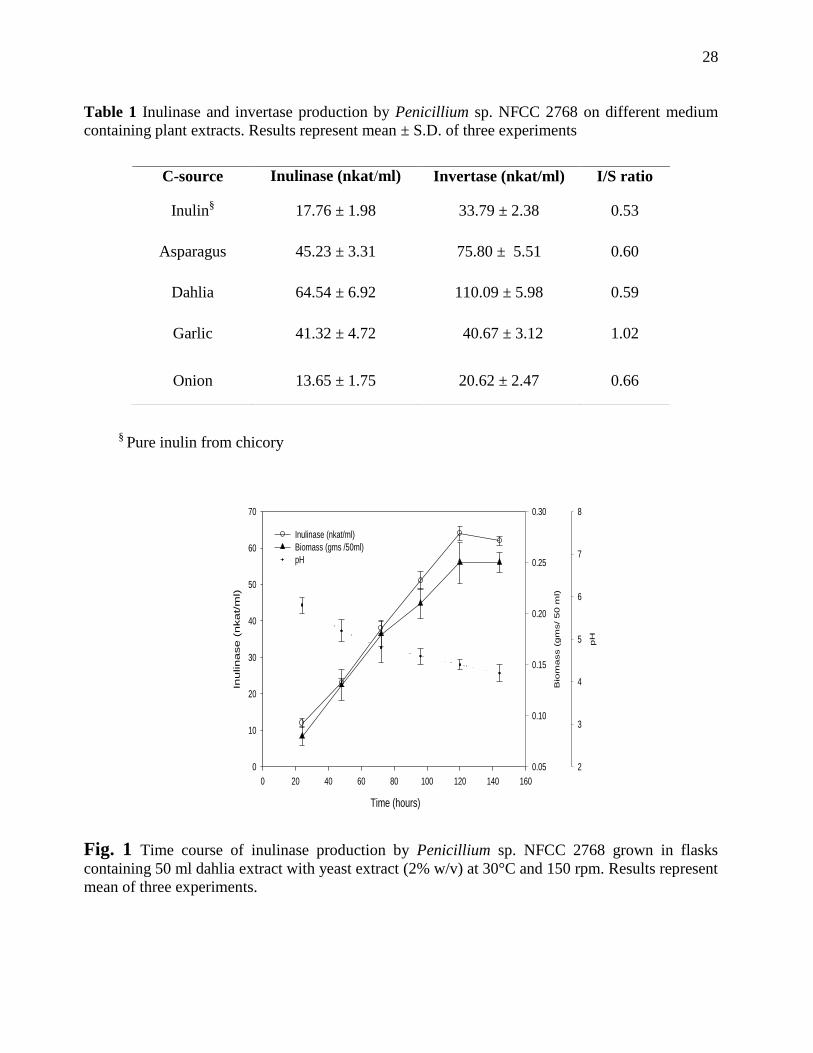
Table 1 Inulinase and invertase production by Penicillium sp. NFCC 2768 on different medium
containing plant extracts. Results represent mean ± S.D. of three experiments
§ Pure inulin from chicory
Fig. 1 Time course of inulinase production by Penicillium sp. NFCC 2768 grown in flasks
containing 50 ml dahlia extract with yeast extract (2% w/v) at 30°C and 150 rpm. Results represent
mean of three experiments.
C-source Inulinase (nkat/ml) Invertase (nkat/ml) I/S ratio
Inulin§ 17.76 ± 1.98 33.79 ± 2.38 0.53
Asparagus 45.23 ± 3.31 75.80 ± 5.51 0.60
Dahlia 64.54 ± 6.92 110.09 ± 5.98 0.59
Garlic 41.32 ± 4.72 40.67 ± 3.12 1.02
Onion 13.65 ± 1.75 20.62 ± 2.47 0.66
Time (hours)
0 20 40 60 80 100 120 140 160
Inu
lin
ase
(n
ka
t/m
l)
0
10
20
30
40
50
60
70
Bio
mass (
gm
s/
50 m
l)
0.05
0.10
0.15
0.20
0.25
0.30
pH
2
3
4
5
6
7
8
Inulinase (nkat/ml)
Biomass (gms /50ml)
pH

29
liquor in the production of inulinase by newly isolated Aspergillus tubingensis CR16. Catalytic
activity of inulinase is described in terms of I/S ratio which represents ratio of the activity of
enzyme preparation on inulin and sucrose (Vandamme & Derycke 1983). Invertase activity was
also found to vary in fashion similar to inulinase (Table 1). I/S ratio were found in the range of
0.53-0.66 except in case of garlic extract medium where it was 1.02. A range of I/S ratios between
0.02 and 7.9 for various microbial inulinases has been reported by workers previously (Moriyama
et al. 2002). Contrastingly, much more higher I/S ratios, ranging from 4.7 to 9.5, with respect to
nitrogen source, have been observed with Penicillium sp. TN-88 (Nakamura et al. 1997).
Effect of incubation period
Time course of inulinase production by Penicillium sp. NFCC 2768 on
dahlia tuber extract medium is shown in Table 1. Inulinase activity was found to increase with the
incubation period reaching 64.54 nkat/ml on fifth day with a pH shift from 6.2 to 5.4.
A corresponding increase was noticed in the biomass of the fungus. Kango (2008) have found
inulinase production by A. niger to reach maximum on the fourth day of growth on dandelion tap
root extract medium. Nakamura et al. (1997) have found inulinase production by Penicillium sp.
TN-88 to reach maximum (9.9 U/ml) after 4 days. Inulinase activity in Penicillium janczewskii is
reported to reach maximum (3.2 U/ml) in relatively longer period of 12 days on medium
containing inulin or sucrose (Pessoni et al. 2007). Initial pH (6.0) of the medium decreased to 4.5
after six days of incubation (Fig. 1). Similar decrease in pH has also been noticed in case of A.
niger grown on crude dandelion extract (Kango 2008).
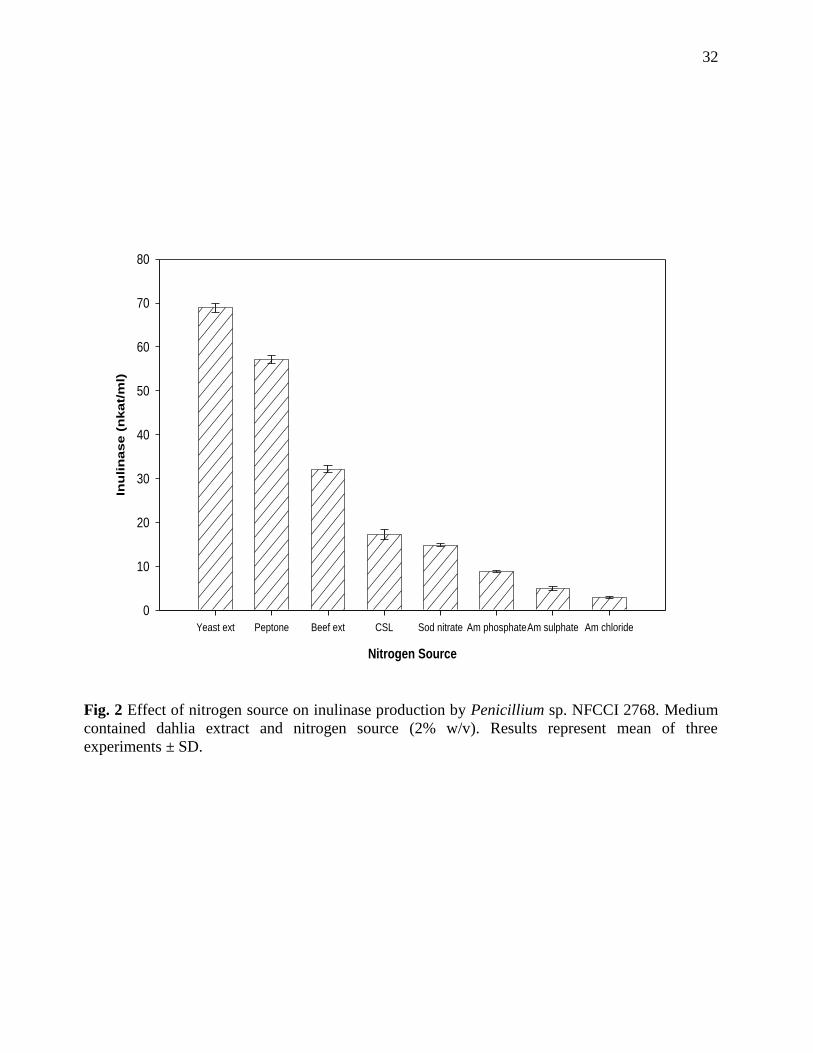
Effect of nitrogen source
Yeast extract was found to be the best nitrogen source for inulinase production (64.54 nkat/ml)
followed by peptone (57.11 nkat/ml). Kango (2008) and Nakamura et al. (1997) have also found
30
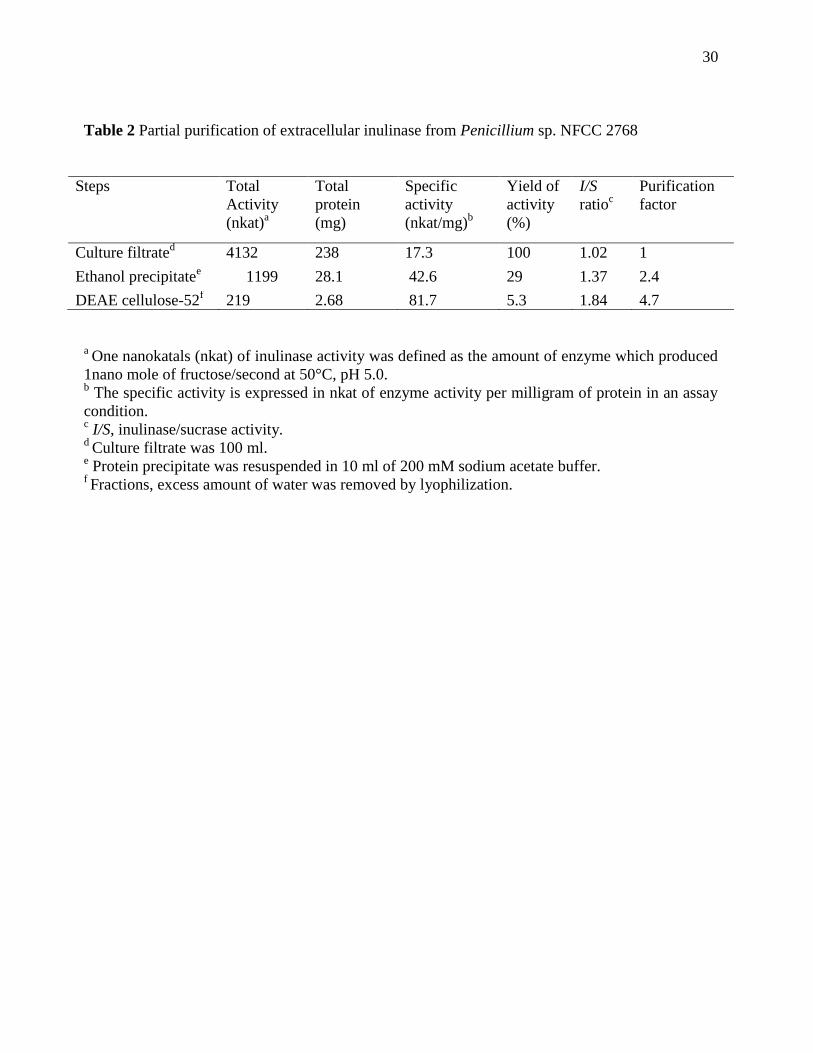
Table 2 Partial purification of extracellular inulinase from Penicillium sp. NFCC 2768
Steps Total
Activity
(nkat)a
Total
protein
(mg)
Specific
activity
(nkat/mg)b
Yield of
activity
(%)
I/S
ratioc
Purification
factor
Culture filtrated
4132 238 17.3 100 1.02 1
Ethanol precipitatee 1199 28.1 42.6 29 1.37 2.4
DEAE cellulose-52f 219 2.68 81.7 5.3 1.84 4.7
a One nanokatals (nkat) of inulinase activity was defined as the amount of enzyme which produced
1nano mole of fructose/second at 50°C, pH 5.0. b The specific activity is expressed in nkat of enzyme activity per milligram of protein in an assay
condition. c I/S, inulinase/sucrase activity.
d Culture filtrate was 100 ml.
e Protein precipitate was resuspended in 10 ml of 200 mM sodium acetate buffer.
f Fractions, excess amount of water was removed by lyophilization.

31
yeast extract to be the best nitrogen source for inulinase production. Among inorganic nitrogen
sources, NaNO3 was found to support 14.8 nkat/ml inulinase activities. Nakamura et al. (1997)
have observed NH4Cl as the best inorganic nitrogen source (5.91 IU/ml) for Penicillium sp. TN-88.
The fungus produced higher levels of inulinase on organic nitrogen sources while much lower
activity was noticed with inorganic nitrogen sources (Fig. 2).
Inulinase Purification
Inulinase was purified from cell free culture filtrate of Penicillium sp. grown on garlic bulb extract
medium. The culture filtrate had 41.32 nkat/ml inulinase with I/S ratio 1.02.
29% of inulinase activity was recovered in ethanol precipitate showing 2.4 fold purification and an
enhanced I/S ratio of 1.37. Finally, inulinase was purified to apparent homogeneity with 4.7 fold
purification and I/S ratio increased 1.84. Enhancement in I/S ratio indicated reduction in
contaminating invertase activity with increase in degree of purification (Table 2).
Nakamura et al. (1997) have reported I/S ratio in the range of 11.2-2210 using purified Penicillium
sp. TN-88 inulinase. Following results summarize two step purification of inulinase. Total protein
precipitated from the culture filtrate was dissolved it in 0.2 M sodium acetate buffer (pH 5.0) and
was fractionated using DEAE-cellulose-52 column (El-souod et al. 2014). The elution profile
indicated binding and separation of inulinase. SDS-PAGE analysis of the pooled active fractions
showed a single band with apparent molecular weight of 68 kDa (Fig 3). Similar to our findings,
Fawzi (2011) reported the comparative account of two purified inulinase from Thielavia terrestris
and Aspergillus foetidus using DEAE-cellulose-52 chromatography and obtained MW of protein
was 72 & 78 kDa respectively. DEAE-cellulose-52 and Sepharose CL-6b columns were used for
purification and characterization of Aspergillus ficuum JNSP5-06 exo and endo-inulinases. The
obtained MW of purified inulinase was range between 31kDa to 70 kDa with optimum activity at
45°C and pH optima between 4 to 8 (Chen et al, 2009). Chen et al. (2012) have reported molecular
32
Fig. 2 Effect of nitrogen source on inulinase production by Penicillium sp. NFCCI 2768. Medium
contained dahlia extract and nitrogen source (2% w/v). Results represent mean of three
experiments ± SD.
Nitrogen Source
Yeast ext Peptone Beef ext CSL Sod nitrate Am phosphateAm sulphate Am chloride
Inu
lin
ase (
nkat/
ml)
0
10
20
30
40
50
60
70
80

33
Table 3 Effect of metal ions and other enzyme inhibitors on activity of inulinase of
Penicillium sp. NFCC 2768.
Compound Relative activity (%)
Control (Untreated) 100.00 ± 3.78
Mg2+
79.29 ± 2.89
Zn2+
91.25 ± 3.19
Ba2+
74.58 ± 2.48
Mn2+
106.58 ± 3.58
Ca2+
102.25 ± 3.39
Cu2+
94.25 ± 2.91
Fe3+
71.58 ± 2.61
Hg2+
21.59 ± 1.03
PMSF 21.25 ± 1.34
pCMB 37.15 ± 1.78
EDTA 61.25 ± 1.81

34
Fig. 3 3a. SDS-PAGE analysis of purified inulinase of Penicillium sp NFCC 2768. Lane 1:
Standard marker; lane 2: crude enzyme; lane 3: ethanol precipitate; lane 4: purified inulinase.
3b. Elution profile of the protein in DEAE-Cellulose using binding buffer of pH 5.0.
1 2 3 4
98
68
44
16
29
Fig. 3b
Fig. 3a

35
mass of endoinulinase obtained from Aspergillus ficuum JNSP5-06 as 60.0 kDa and optimum pH
and temperature of this enzyme were 5.0 and 60°C, respectively. Exoinulinase obtained from
Penicillium janthinellum strain B01 purified and the molecular weight of purified inulinase was
100 kDa. The optimal pH and temperature of the purified exoinulinase were 4.5 and 50°C,
respectively (Wang et al., 2011). Goosen et al, (2008) purified exoinulinase sourced from
Aspergillus niger N402 having molecular weight 57 kDa and the enzyme hydrolyzed inulin into
fructose, sucrose and oligosaccharides.
Effect of metal ions and other reagents
Effect of various metal ions and reagents on inulinase obtained from Penicillium sp. NFCC 2768 is
presented in Table 2. Activity of inulinase was increased slightly in presence of Mn2+
and Ca2+
ions, whereas Zn2+
and Cu2+
ions were marginally inhibitory. Mg2+
, Ba2+
and Fe3+
showed
significant reduction in the activity. Hg2+
, which is known to affect -SH- groups, strongly inhibited
inulinase activity. Singh et al. (2007) have also reported Mn2+
and Ca2+
to increase the enzyme
activity by 2.4 and 1.2 folds, respectively, while Hg2+
and Ag+
completely inhibited the activity of
Kluyveromyces marxianus YS-1 inulinase. In the present study EDTA partially inhibited the
inulinase activity while PMSF and pCMB strongly inhibited the enzyme (Table 3). These results
are in accordance with those noticed for inulinases of Penicillium sp. TN-88, Chaetomium sp., A.
fumigatus, Cryptococcus aureus G7a, Bifidobacterium infantis and Kluyveromyces sp. Y-85 (Chi
et al. 2009).
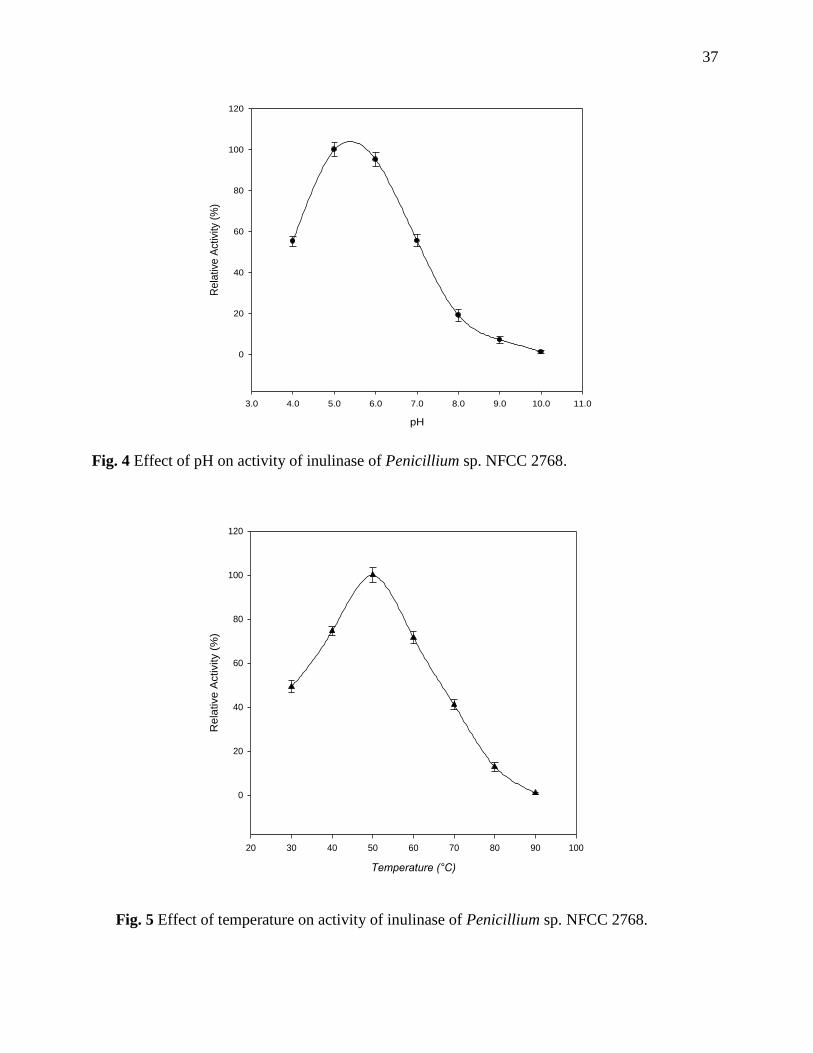
Effect of pH and temperature on enzyme activity
The activity of enzyme was measured at different pH ranging from 4.0-10.0. The optimum pH for
inulinase activity was found to be 5.0 (Fig. 4). Penicillium janczewskii inulinase had optimum pH
between 5.0-5.5 (Pessoni et al. 2007). The optimum pH for inulinase of Penicillium sp. strain TN-

36
88 was noticed as 5.2 (Nakamura et al. 1997). Penicillium sp. NFCC 2768 inulinase showed
optimal activity at 50°C (Fig. 5). Temperature optimum at 50°C has also been reported for
Penicillium sp. TN-88 (Nakamura et al. 1997) and many other fungal inulinase (Kango & Jain
2011).
Chromatographic analysis of the hydrolysate end products
Nature of inulinase from Penicillium sp. NFCC 2768 was ascertained by analyzing the end
products of enzyme action using TLC. Liberation of fructose and inulo-fructosaccharides from
chicory inulin was noticed. Amount of these sugars enhanced with incubation time as witnessed by
the increasing intensity of the spots. Formation of 4 to 5 oligosaccharides with apparent degree of
polymerization (DP) between 2 to 5 along with fructose indicated presence of inulinase activity.
Endoinulinase from Penicillium purpurogenum produced F3, F4 and F5 oligosaccharides (Onodera
& Shiomi 1988) while endoinulinase of Penicillium sp. TN-88 liberated only F3 (Nakamura et al.
1997). In the present study Penicillium sp. NFCC 2768 produced a mixture of exo- and
endoinulinase leading to production of both fructose and oligosaccharides from chicory inulin. The
enzyme preparation obtained from Penicillium sp. NFCC 2768 had resemblance with that of A.
niger NK-126 (Kango 2008) in being a mixture of exo- and endo-inulinase, however, number of
oligosaccharides was more in case of former. End product profile as visualized by TLC (Fig. 6)
was also confirmed by HPLC analysis. Result showed glucose, fructose, sucrose, kystose (GF2),
nystose (GF3) as the prominent end products of inulinase action on chicory inulin (Fig. 7).
Conclusions
In the present study production of inulin hydrolyzing enzyme using low value inulin rich vegetal
infusions has been demonstrated by a newly isolated Penicillium sp. NFCC 2768. The inulinase
37
Fig. 4 Effect of pH on activity of inulinase of Penicillium sp. NFCC 2768.
Fig. 5 Effect of temperature on activity of inulinase of Penicillium sp. NFCC 2768.
Temperature (°C)
20 30 40 50 60 70 80 90 100
Re
lative
Activity (
%)
0
20
40
60
80
100
120
pH
3.0 4.0 5.0 6.0 7.0 8.0 9.0 10.0 11.0
Re
lativ
e A
ctiv
ity (
%)
0
20
40
60
80
100
120

38
Fig. 6 End product analysis of inulinase preparation of Penicillium sp. NFCC 2768 by TLC.
S- Standards (F-Fructose, K-Kestose and N-Nystose); F-Fructose; I- Chicory inulin (5% w/v); E-
Enzyme sample of Penicillium sp. NFCCI 2768, Lanes 1 to 4 end products of inulin hydrolysis
after 5, 15, 30 and 60 minutes, respectively.
Fig. 7 HPLC analysis of end products of Penicillium sp. NFCC 2768 inulinase action on Chicory
inulin (S- Standard inulin, GF3-Nystose, GF2-Kestose, GF- Sucrose, G-Glucose, F- Fructose)
N
K
F
S F I E 1 2
3 4

39
preparation liberated fructose and inulooligosaccharides from inulin. The maximum yield of
inulinase achieved was 64.54 nkat/ml. The apparent molecular weight of purified inulinase as
determined by SDS-PAGE was 68 kDa. The optimum pH and temperature of this enzyme were 5.0
and 50°C, respectively. The report signifies use of low value inulin rich infusions in production of
inulinase and describes its properties.
40
Progress of III Year
Immobilization of inulinase using alginate beads, glutaraldehyde and chitosan etc.
Optimization of process parameters (pH, temperature, dosage, substrate
concentration) for inulin hydrolysis using free and immobilized inulinase.
Evaluation of efficacy of inulinase preparation in terms of product yield.
Materials and methods
Materials
Inulin rich substrates dandelion tap root, dahlia tubers and asparagus root powder used in
this study were collected from local sources. Pure inulin (chicory), fructose, 3, 5-dinitrosalicylic
acid (DNS), glutaraldehyde and sugar standards were obtained from Sigma Chemical Co., U.S.A.
Sodium alginate (molecular mass 10,000-600,000) and calcium chloride (anhydrous) were
obtained from Finar, India. Glass column reactor (60cm × 10cm) was used in the present study
(ASGI, India). Other chemicals were purchased from Hi-Media and Merck, India.
Microorganism
The fungal strain was isolated from dandelion rhizospheric soil of local garden and was grown
on Czapek’s dox agar at 28°C. It was identified on the basis of its morphological features using
taxonomic description (Onions et al., 1981). The identity of the culture was confirmed as Aspergillus
niger and it was deposited in National Fungal Culture Collection of India (NFCCI) at Agarkar
Research Institute (ARI), Pune, India with an accession number NFCCI 3879 and Gour Nodal
Culture Collection (GNCC), departmental culture collection centre, Sagar, (M.P.).
Substrates and carbohydrate analysis
Fresh dandelions (complete plant with tap roots) were collected from local fields of Sagar
(MP, India) district. Roots and leaves were separated and tap root was used for the extraction of
inulin.200 gram of fresh solids (20% w/v) root was mixed in 1000 ml of distilled water using
grinder. Inulin was extracted from this slurry by hydrothermal treatment (10-20 psi) of the formed
slurry. The slurry was filtered through a muslin cloth to obtain clear solution (containing soluble
inulin) and used in media preparation (Kango, 2008). Total carbohydrate and inulin content were
estimated by HPLC analysis.
Enzyme production
Aspergillus niger NFCCI 3879 was cultivated on media containing inulin rich extracts in
shake cultures and the culture filtrates were assayed for inulinase and invertase activity. Media

41
containing extracts of dandelion root, dahlia tubers, asparagus roots, onion and garlic bulb were
used as crude substrate and pure chicory inulin (2% w/v each) (Sigma) for inulinase production
(Table 6.1). Yeast extract 2% (w/v) was used as nitrogen source in all the media formulations.
Fungus was also cultivated on solid substrates for enzyme production. Solid state fermentation
(SSF) was performed using various crude substrate (5g each; moisture ratio 2:1) employed in SSF
study. Erlenmeyer flasks (250 ml) containing 50 ml/ 5g aliquots of medium were autoclaved (20
min, 121°C) and inoculated with two mycelial discs (7 mm) cut from 7 days old culture of
Aspergillus niger. Flasks were then incubated at 28°C and samples were withdrawn at regular
intervals of 24 h upto 5 days. The content of the flask was filtered through Whatman filter paper
No.1 and clear filtrate was used for enzyme assays. All the experiments were carried out in
triplicate and mean values ± standard deviation (SD) are reported.
Experimental design for the determination of optimum values of yeast extract and dandelion
extract
Both yeast extract (A) and dandelion tap root extract (B) were selected to find their
optimum values for inulinase production by A. niger NFCCI 3879 using RCCD. The ranges and
levels of the variables taken for RSM are listed in Table 2. According to RCCD, the total number
of experimental combinations is 2k + 2k + no, where k is the number of independent variables and
no is the number of repetitions of the experiments at the centre point. A total of 13 set of
experiments including five center points were conducted along with different combination of
physical parameters. Each numeric factor was varied over 5 levels, that is, plus and minus alpha
(axial point), plus and minus one (factorial points), and zero (center point).
Statistical analysis and validation of experimental modeling
The data obtained from RSM was subjected to analysis of variance (ANOVA) for analysis
of regression coefficient, prediction equations, and case statistics. Analysis of data was performed
using Design-Expert software (Version 7.0). The experimental results of RSM were fitted using
the second order polynomial equation:
Y= β0 + Σ βiXi + Σ βiiXi2 + Σ βijXiXj (Eq. 1)
i ii ij
In this polynomial equation, Y is the predicted response, Xi Xj are independent variables, β0 is the
intercept term, βi is the linear coefficient, βii is the quadratic coefficient, and βij is the interaction
coefficient. The statistical model was validated with respect to all variables within the design

42
space. A random set of 2 experimental optimized combinations were used to study the inulinase
production under submerged fermentation.
Enzyme assays
For evaluation of inulinase activity, 0.2 ml of appropriately diluted enzyme sample was
added to 1.8 ml of chicory inulin (0.5% w/v dissolved in 200 mM sodium acetate buffer, pH 5.0)
and incubated at 50°C for 15 min. For estimation of immobilized inulinase activity, 1 g of Ca-
alginate beads was added to 3 ml of inulin/ sucrose (0.5 and 1% w/v, respectively) solution. After
incubation, reducing sugar liberated from inulin/ sucrose was measured by adding 3 ml DNS
reagent and boiling for 5 min. Samples were allowed to cool and their absorbance was read at 540
nm. One unit of inulinase/invertase activity was defined as the amount of enzyme which produced
1 micromole of fructose/glucose per minutes under the assay conditions as described above (Rawat
et al., 2015a).
Partial purification of enzyme
Precipitation of total proteins was done by adding two volumes (2:1 v/v) of chilled ethanol
to the culture filtrate (100 ml) obtained after growth on dandelion root extract medium under
constant stirring for 30 min at 4°C. The precipitate was obtained by centrifuging the mix at 9000g
for 10 minutes at 4°C. Protein precipitate thus obtained was suspended in appropriate volume of
sodium acetate buffer (200 mM, pH 5.0).Inulinase was partially purified by precipitating total
protein using ethanol followed by fractionation using DEAE-Cellulose-52 (Hi-media, Mumbai) ion
exchange chromatographic column of size 2.5×50 cm (internal diameter × height) (Rawat et al.,
2015b). Optical densities of eluted column fractions were measured at 280 nm and these were
examined for protein concentration (Lowry, 1951) and inulinase activity. Fractions showing
activity were pooled and excess amount of water was removed by lyophilization. Partially purified
enzyme was used in finding pH and temperature optimum, thermo-stability, metal ions, inhibitors
and other characteristics of the inulinase.
Enzyme immobilization
Sodium alginate slurry was prepared by mixing 3 g (w/v) of sodium alginate in 99 ml of warm
distilled water (50°C) to which 1 ml of glutaraldehyde (25%) was added. Approximately 2337nkat/ml
of inulinase obtained in free form was added to the appropriate volume of alginate slurry. For
entrapment of exoinulinase, enzyme was mixed in the slurry and extruded drop-wise through needle
(1D, 1.0 mm) into 0.2 M chilled CaCl2solution by peristaltic pump. To maintain the spherical

43
conformation Ca-alginate beads were cured for 2h in CaCl2 and stored in sodium acetate buffer (pH
5.0) for further study (Ganaie et al., 2014a).
Effect of pH, temperature and thermostability profile
The effect of pH on free and immobilized inulinase was determined by incubating suitable
enzyme with 1.8 ml of inulin (0.5% w/v) in different buffers
(200 mM sodium phosphate citrate: pH 2.0 and 3.0, 200 mM sodium acetate buffer: pH 4.0, 5.0 and
pH 6.0; 200 mM phosphate buffer: 7.0 and 8.0; 200 mM Tris-HCl buffer: pH 9.0; 200 mM, Glycine-
NaOH buffer: pH 10.0) for 15 min at 50°C. The effect of temperature was determined by incubating
suitably diluted enzyme with 1.8 ml of inulin (0.5% w/v) (200 mM sodium acetate buffer: pH 5.0) for
15 min at different temperatures (30 - 80°C). Thermo stability profile of enzyme sample was
estimated by measuring the relative activity of free and Ca-alginate entrapped inulinase after different
incubation period at different temperatures (15 - 80°C).
Effect of metal ions and inhibitors on enzyme activity
Effect of various metal ions on enzyme activity was assessed by
pre-incubating the inulinase (free and immobilized) with2 mM solutions of MgSO4, ZnSO4, BaCl2,
MnCl2, CaCl2, CuCl2, FeCl3, and HgCl2. The effect of inhibitors (2 mM) such as
phenylmethanesulfonyl fluoride (PMSF), ethylene diaminetetraaceticacid (EDTA), and pCMB on
inulinase activity was examined by treating the enzyme sample with their solutions for 1 hour at
30°C. The effect of metal ion was compared to untreated control and is presented as relative
activity of inulinase.
Kinetic parameters
Kinetic characteristics (Km, Vmax and Kcat) of free and immobilized inulinase were studied
and compared. For confirming the rate of reaction, different substrate concentrations ranging from
0.1 to 2.0% mg/ml was used for inulinase activity. The rate of reaction versus substrate
concentration was plotted to understand whether the enzyme followed Michalis-Menten kinetics
and Km and Vmax parameters were analyzed by Lineweaver-Burk plot.
Packed-bed reactor (PBR) studies
Ca-alginate immobilized beads were used in packed-bed reactor (PBR) for continuous
hydrolysis studies of dandelion root extract and pure inulin (chicory and dahlia). 50 ml of
dandelion root extract (20% fresh w/v), chicory and dahlia inulin (Sigma, 2% w/v) prepared in 0.2
M sodium acetate buffer (pH 5.0) were poured in designed reactor contained packed-bed of
immobilized beads under constant temperature 50°C maintained using thermostat. In order to test

44
the practicability of this PBR system samples flowing through it were collected after regular
incubation intervals i.e. beginning from 30 minutes up to 30 days.
Chromatographic analysis of inulin hydrolysate
End products formed after action of immobilized inulinase on dandelion root, pure chicory
and dahlia inulin was analyzed by TLC and HPLC. Samples were withdrawn at different time
intervals and 3 µl was spotted on pre-coated TLC glass plate (Merck). These were developed with
the solvent system containing isopropyl alcohol: ethyl acetate: water (2:2:1 by volume). Sugar
spots were developed with reagent containing 0.5% alpha-naphthol and 5% sulfuric acid in
absolute ethanol and by heating the plates at 100°C for 10 min. Fructose (F), Sucrose (GF),
Kestose (GF2) and nystose (GF3) were used as sugars standards. HPLC (Waters) was performed
by using the Sugar Pak I column (6.5 × 300 mm) and the refractive index differential detector (RI
2414). Distilled water was used as the mobile phase. Samples were filtered using 0.45µm
Millipore syringe filters before injecting in 20µl valve. Column temperature was maintained at
70°C by oven column (Dyna, Mumbai). Calculations and analysis were performed using
Empower-2 software Build 2154, Waters (Rawat et al., 2015a).
Results and discussion
Enzyme production
Aspergillus niger NFCCI 3879 grew well on various inulin-rich plant extracts and
elaborated varied levels inulinase. Dandelion tap root extract supported maximum inulinase
production (984 nkat/ml) followed by asparagus, garlic and dahlia extracts (Table 1). Complex
inulin rich plant extracts supported high inulinase activity while much lower activity was seen on
pure chicory inulin. Use of inulin rich infusions in media formulation makes the process
economical thus making enzyme application cost-effective. Jing et al. (2003) have found
maximum inulinase (25 U/ml) activity of A. ficuum after 5 days of incubation. Previous study
reported the use of various crude inulin rich plant materials viz. dandelion, dahlia, asparagus,
sunflower, lettuce root and Jerusalem artichoke (Mansouri et al., 2013; Housseiny, 2014; Singh
and Singh, 2014; Rawat et al., 2015b). Kango (2008) reported A. niger NK-126, an isolate from
onion peels, to produce 55 U/ml of inulinase in four days using dandelion tap root extract. Many
microbial preparations of inulinase possess remarkable invertase activity accompanying the
inulinase activity. The I/S ratio was differed considerably ranging from 0.12 to 0.83.In the present
study dandelion tap root extract supported higher inulinase activity in SmF (984 nkat/ml) while
dahlia tuber powder supported maximum yield (972 nkat/gds) in SSF. Inulin containing plant
45
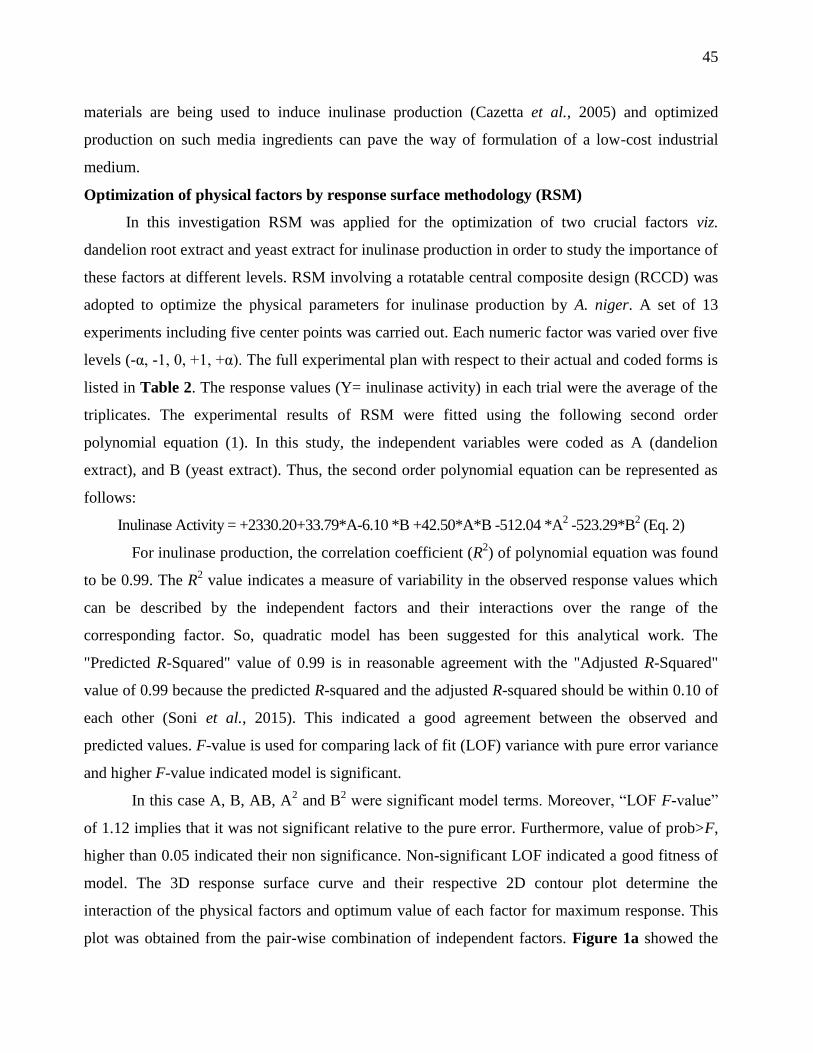
materials are being used to induce inulinase production (Cazetta et al., 2005) and optimized
production on such media ingredients can pave the way of formulation of a low-cost industrial
medium.
Optimization of physical factors by response surface methodology (RSM)
In this investigation RSM was applied for the optimization of two crucial factors viz.
dandelion root extract and yeast extract for inulinase production in order to study the importance of
these factors at different levels. RSM involving a rotatable central composite design (RCCD) was
adopted to optimize the physical parameters for inulinase production by A. niger. A set of 13
experiments including five center points was carried out. Each numeric factor was varied over five
levels (-α, -1, 0, +1, +α). The full experimental plan with respect to their actual and coded forms is
listed in Table 2. The response values (Y= inulinase activity) in each trial were the average of the
triplicates. The experimental results of RSM were fitted using the following second order
polynomial equation (1). In this study, the independent variables were coded as A (dandelion
extract), and B (yeast extract). Thus, the second order polynomial equation can be represented as
follows:
Inulinase Activity = +2330.20+33.79*A-6.10 *B +42.50*A*B -512.04 *A2 -523.29*B
2 (Eq. 2)
For inulinase production, the correlation coefficient (R2) of polynomial equation was found
to be 0.99. The R2 value indicates a measure of variability in the observed response values which
can be described by the independent factors and their interactions over the range of the
corresponding factor. So, quadratic model has been suggested for this analytical work. The
"Predicted R-Squared" value of 0.99 is in reasonable agreement with the "Adjusted R-Squared"
value of 0.99 because the predicted R-squared and the adjusted R-squared should be within 0.10 of
each other (Soni et al., 2015). This indicated a good agreement between the observed and
predicted values. F-value is used for comparing lack of fit (LOF) variance with pure error variance
and higher F-value indicated model is significant.
In this case A, B, AB, A2 and B
2 were significant model terms. Moreover, “LOF F-value”
of 1.12 implies that it was not significant relative to the pure error. Furthermore, value of prob>F,
higher than 0.05 indicated their non significance. Non-significant LOF indicated a good fitness of
model. The 3D response surface curve and their respective 2D contour plot determine the
interaction of the physical factors and optimum value of each factor for maximum response. This
plot was obtained from the pair-wise combination of independent factors. Figure 1a showed the

46
effect of yeast extract and dandelion extract on inulinase production. Increasing the value of both
from significantly increased the inulinase

47
Table 1 Inulinase and invertase production by Aspergillus niger NFCCI 3879 on different
substrates in submerged and solid state fermentation study
Submerged fermentation (SmF)a Solid state fermentation (SSF)
b
Substrate* Inulinase Invertase I/S ratioc Inulinase Invertase I/S ratio
Dandelion
tap root
extract
984.1 ± 14.3 1258.1 ± 25.4 0.78 867.6 ± 18.6 1038 ± 19.3 0.83
Asparagus
root powder 570.0 ± 17.2 1956.2 ± 39.9 0.83 888.7 ± 19.7 1647 ± 29.4 0.53
Dahlia
extract 182.4 ± 11.9 217.4 ± 19.7 0.22 972.9 ± 24.2 1467 ± 17.2 0.66
Garlic bulbs
extract 220.3 ± 17.8 990.1 ± 31.8 0.16 892.4 ± 13.9 1179 ± 11.3 0.75
Onion bulb
extract 108.2 ± 12.7 670.2 ± 25.8 0.12 347.2 ± 9.02 421 ± 8.61 0.82
Inulin§ 31.7 ± 5.92 245.8 ± 13.6 0.30 - - -
Cultures were grown in 250 ml Erlenmeyer flasks containing 2% w/v (SmF) vegetal extract or 3-
5g dry substrate (SSF) with yeast extract (2% w/v) as N - source. (SmF - 150 rpm; Temp - 28°C;
SSF - Temp. 28°C; moisture - 1:2). aEnzyme activity in nkat/ml of culture filtrate;
bEnzyme
activity in nkat/gds; cI/S (inulinase/invertase) ratio
.; *fresh weight of extract (% w/v);
§Chicory
inulin (Sigma, USA); values represents mean values of three replicates ± SD.
Table 2 Experimental levels of the independent variables used for inulinase production using
Aspergillus niger NFCCI 3879
Variables Experimental range and levels
-α -1 0 1 +α
Dandelion root extract (% fresh w/v) 34.14 10 20 30 5.8
Yeast extract (% w/v) 3.4 1 2 3 0.59

48
activity up to 2337 nkat/ml, but thereafter no significant increase in inulinase activity was
observed. It was also observed that when the values were increased beyond level “0”, the inulinase
activity decreased (Std Run. 3, 4 and 8 in Table 3). Predicted vs actual plot (Figure 1b) represents
a high degree of similarity that was observed between the predicted and experimental values.
Analysis of variance (ANOVA) was used for analysis of regression coefficient, prediction
equations and case statistics (Table 4).There are some previous studies in the literature in which
inulinase were produced by different carbon sources using different microorganism to support
present study (Treichel et al., 2009; Trivedi et al., 2012; Abd El Aty et al., 2014; Dilipkumar et al.,
2014b).
Validation of the optimum condition defined by the model
The quadratic model was validated by conducting experiments under the optimum conditions
predicted by the model. The optimum value for both factors was found to be dandelion extract (20%)
and yeast extract (2%) for maximum inulinase production. The maximum predictable response was
calculated using regression equation employing substituted level of factors and was experimentally
verified. The average activities obtained from 3 replicates was 2337 ± 13.9 nkat/ml, which is in
agreement with the predicted value of 2330 nkat/ml.
Partial purification of inulinase and immobilization studies
Inulinase was partially purified to homogeneity by ethanol precipitation followed by anion
exchange chromatography. A summary of the purification steps for exoinulinase is presented in
Table 5. Inulinase specific activity increased in comparison to crude enzyme leading to
purification. The precipitated enzyme was partially purified by DEAE cellulose ion exchange
chromatography. In this purification step, exoinulinase was partially purified 8.26 total fold with
the yield of 34.9%. The purity of inulinase was realized as a single band on SDS-PAGE with
molecular weight of 80 kDa approximately (Figure 2).

49
Fig 1 a) 3D-Response surface plot showing effect of concentration of dandelion tap root extract (%
fresh w/v) and yeast extract (% w/v) on inulinase production (nkat/ml) in submerged fermentation
by Aspergillus niger NFCCI 3879. b) Predicted vs. actual response plot of the quadratic model
used for inulinase production yield (nkat/ml).
Inu
lin
ase
act
ivit
y (n
ka
t/m
l)
Yeast extract (%)
Dandelion root extract (%)
1a
Pred
icta
ble i
nulin
ase a
ctiv
ity (nk
at/m
l)
Actual inulinase activity (nkat/ml)
Pred
icta
ble i
nulin
ase a
ctiv
ity (nk
at/m
l)
Actual inulinase activity (nkat/ml)
1b

50
Table 3 Process variables used in the RCCD approach of RSM, showing the levels of variables and prediction and actual of inulinase production. Data points indicate the mean of triplicate values ± SD
Std. Run
Level A: Dandelion root extract
(% fresh w/v)
B: Yeast extract (%)
Inulinase Activity (nkat/ml)
-α 34.14 3.4
Predicted Actual
-1 10 1 0 20 2
+1 30 3 +α 5.8 0.59
1 10 1 1309 1308 ± 8.2 2 30 1 1292 1291 ± 12.1 3 10 3 1212 1217 ± 9.3 4 30 3 1365 1370 ± 13.2 5 5.8 2 1258 1257 ± 11.2 6 34 2 1353 1352 ± 7.3 7 20 0.58 1292 1295 ± 5.2 8 20 3.4 1275 1269 ± 11.3 9 20 2 2330 2331 ± 22.6 10 20 2 2330 2327 ± 27.4 11 20 2 2330 2323 ± 19.4 12 20 2 2330 2333 ± 15.4 13 20 2 2330 2337 ± 10.6

51
Table 4 Analysis of variance (ANOVA) for the experimental results of the CCD used for inulinase production
Source Sum of Squares
DF Mean Square
F Value
p-value Prob > F
Model 3315312 5 663062.4 21592.44 < 0.0001 significant
A-pH 9136.16 1 9136.16 297.5165 < 0.0001
B-Moisture 297.3087 1 297.3087 9.681774 0.017
A2 1823878 1 1823878 59394.07 < 0.0001
B2 1904903 1 1904903 62032.64 < 0.0001
AB 7225 1 7225 235.2801 < 0.0001
Residual 214.9565 7 30.70808
Lack of Fit 98.15654 3 32.71885 1.120508 0.4399 not significant
Pure Error 116.8 4 29.2
Cor Total 3315527 12
52
Earlier reports suggest considerable variation in molecular weight from various Aspergilli
and their exoinulinase in the range of 70-85 kDa viz. Aspergillus niger AF10 (83 kDa), A. niger
(68.1 kDa), A. ficuum JNSP5-06 (70 kDa), A. niger AUMC 9375 (75 kDa) (Zhang et al., 2004;
Mutanda et al., 2008; Chen et al., 2009; Housseiny, 2014). An 83 kDa exoinulinase was purified
from preparation of Aspergillus niger AF 10 using anion exchange (Hi-Trap-SP, Pharmacia)
chromatography (Zhang et al., 2004). Previously we have described purification of a 68 kDa
inulinase from Penicillium sp. NFCCI 2768 using similar method
(Rawat et al., 2015b).
Inulinase preparation obtained after DEAE Cellulose-52 fraction containing 1166 nkat/mg
was immobilized in Ca-alginate support by gel entrapment and cross-linking with glutaraldehyde.
The immobilization yield was more than 80% and the amount of entrapped protein was higher as
compared to other matrices such as chitosan and casein test for immobilization. Gill et al. (2006a)
immobilized the purified inulinase from A. fumigatus on casein, alginate, chitin, DEAE-sephacel,
QAE-sephadex, dowex and amberlite; however, no significant entrapment was achieved with
calcium alginate. Inulinase sourced from A. niger AUMC 9375was immobilized in calcium
alginate and was used upto 10 cycles for generation of high fructose syrup (Housseiny, 2014). In
the present study, efficient entrapment of inulinase in Ca-alginate was achieved. Liquid containing
fructose was separated from alginate beads and the end products were confirmed by TLC and
HPLC.
Characterization of free and immobilized inulinase
Optimum pH, temperature and thermo-stability profile
Free and immobilized exoinulinase of Aspergillus niger NFCCI 3879 was selected to at
different pH and temperatures revealed that the free and immobilized inulinase were optimally
active at pH 5.0 and 50°C temperature (Figure 3).

53
Table 5 Partial purification of exoinulinase from Aspergillus niger NFCCI 3879
Fraction Protein
(mg/ml)
Total
protein
(mg)
Inulinasea
ctivitya
(nkat/ml)
Total
inulinase
activity
Specific
activityb
(nkat/mg)
Yield %
per step
Culture filtrate c 4.10 410 984.1 98410.0 240.0 100
Protein Precipitated 1.44 14.4 1235.2 12352.3 857.7 21.3
DEAE-Cellulose-52e 0.74 3.70 862.7 4313.5 1166 34.9
aOne nkat of inulinase activity was defined as the amount of enzyme which produced 1micro mole of fructose
per minute at 50°C and pH 5.0. bThe specific activity is expressed in nkat/mg of enzyme activity per milligram of protein in an assay condition.
cCulture filtrate of dandelion tap root medium (100 ml).
dProtein precipitate was resuspended in 10 ml of 200 mM sodium acetate buffer pH 5.0.
e Fractions, excess amount of water was removed by lyophilization.

54
Fig. 2 SDS-PAGE analysis of purified inulinase of Aspergillus niger NFCCI
3879. Lane 1: Standard marker; Lane 2: precipitate enzyme;
Lane 3: DEAE cellulose-52 column fraction of purified inulinase.

55
The purified exoinulinase was found to be suitable for long term stability purpose and had half life
of 15 days at 50°C. Exoinulinase from A. niger AF10 (Zhang et al., 2004) is reported to be
optimally active at 55°C, which is higher to our findings. Again, the immobilized enzyme was
relatively more reusable than free enzyme. Thermo-stability profile of temperature (Figure 4a) and
pH confirmed that enzyme is highly stable at optimum temperature for long time (Figure 4b). The
pH optimum of free inulinase was 5.0 which remained unchanged in case of immobilized inulinase
also.
Similar results have been reported by Paula et al. (2008) and the effect of pH on free and
immobilized inulinase was the same. These results are also comparable with other exoinulinases
reported so far: A. ficuum JNSP5-06 (pH 4.5) (Chen et al., 2009); A. fumigatus (pH 6.0) (Gill et
al., 2006b), and A. niger NK-126 (pH 5.0, 50°C) (Kango 2008). Present study described higher
operational time and stability of immobilized biocatalyst makes this preparation more suitable for
industrial application.
Effect of metal ions and inhibitors
The effect of various metal ions and inhibitors on Aspergillus niger inulinase is presented
in Table 6. Activity of free and immobilized enzyme was strongly stimulated in presence of
Mn2+
,Mg2+
and Cu2+
while Hg2+
which is known to affect -SH- groups, strongly inhibited inulinase
activity. Chen et al. (2013) and Singh et al. (2007) have reported Mn2+
to enhance the enzyme
activity, while Hg2+
and Al3+
completely inhibited the activity of inulinase. In the present study,
EDTA, PMSF and pCMB strongly inhibited the inulinase activity of free and immobilized
inulinase. These results are in accordance with those noticed for exoinulinases of Aspergillus
ficuum, Aspergillus fumigatus and Sphingomonas sp. JB13 (Chen et al., 2009; Gill et al., 2006a;
Zhou et al., 2015).

56
Fig. 3 Effect of pH and temperature on immobilized inulinase activity.

57
Fig. 4 Thermal stability of Aspergillus niger NFCCI 3879 immobilized
inulinase at different (a) temperatures and (b) pH.
58
Continuous fructose production using packed-bed reactor (PBR)
Hydrothermally extracted inulin-rich extract of dandelion tap roots
(20% fresh w/v), pure chicory and dahlia inulin (2% w/v) was continuously poured into the PBR
(Figure 5) and the initial inulinase activity was maintained for over 15 days without changing the
immobilized biocatalysts. Total fructose syrup was about <90% (w/w) and 85% (w/w) in case of
dandelion root extract and chicory inulin hydrolysis, respectively. PBR employing alginate
immobilized inulinase showed long term stability and efficient fructose generation. Inulinase
preparation obtained after DEAE-cellulose fraction containing 0.74 mg/ml protein was
immobilized in Ca-alginate support by covalent gel entrapment.
The immobilization yield was more than 85% and the amount of entrapped protein was
also higher as compared to other matrices such as chitosan and casein tested for immobilization.
Paula et al. (2008) immobilized cell free inulinase in gelatin for continuous hydrolysis of sucrose
using fixed-bed column reactor. Immobilization yield of their study was 82% coming of glucose
and fructose. Singh et al. (2007) have immobilized exoinulinae on duolite A568 after partial
purification to generate high fructose syrup from crude asparagus inulin and yielded 39.2 g/L
fructose in four hour. Inulinase sourced from A. niger AUMC 9375 was immobilized in calcium
alginate and was used upto 10 cycles for generation of high fructose syrup (Housseiny, 2014).
Trytek et al. (2015) immobilized inulinase and also reported efficient operational stability of
inulinase in packed-bed reactor for continuous hydrolysis of inulin (0.5% w/v) to generate fructose
(98%) period of 28 days.
In the present study the PBR resulted in 90% conversion producing fructose exclusively.
Fructose containing fractions were collected at regular intervals from PBR and the hydrolysates
were analyzed by TLC (Figure 6a and 6 b) and HPLC (Figure 7). Inulin rich extract obtained
from dandelion tap roots was successfully hydrolyzed to fructose by the PBR.

59
Table 6 Effect of different metal ions and inhibitors on free and immobilized inulinase activity of Aspergillus niger NFCCI 3879
SN Metal ion* Concentration
Relative Activity
Free inulinase Immobilized
inulinase
1. Control - 100.0 ± 2.9 100.0 ± 1.8
2. Mg2+ 2mM 102.8 ± 3.4 115.0 ± 2.6
3. Zn2+ 2mM 94.3 ± 3.7 98.6 ± 3.9
4. Ba2+ 2mM 81.1 ± 2.7 93.5 ± 2.1
5. Mn2+ 2mM 112.1 ± 2.9 127.2 ± 3.2
6. Ca2+ 2mM 91.9 ± 2.5 98.2 ± 2.5
7. Cu2+ 2mM 96.5 ± 1.9 106.3 ± 2.1
8. Fe3+ 2mM 69.2 ± 2.0 74.8 ± 3.4
9. Hg2+ 2mM 14.1 ± 1.6 9.3 ± 0.8
10. PMSF 2mM 12.2 ± 1.0 8.3 ± 1.2
11. pCMB 2mM 7.94 ± 0. 9 9.67 ± 0.4
12. EDTA 2mM 3.91 ± 0.6 3.47 ± 0.4
*Salts used for metal ions: Mg2+: MgSO4.7H2O, Zn2+: ZnSO4.7H2O, Hg2+: HgCl2, Ba2+: BaCl2, Mn2+: MnSO4, Ca2+: CaCl2.2H2O, Cu2+: CuSO4, Fe3+: FeCl3

60
Fig. 5 Schematic diagram of packed bed bioreactor (PBR) used for continuous generation of
fructose syrup from dandelion tap root extract (% fresh w/v) and pure chicory inulin using Ca-
alginate immobilized Aspergillus niger NFCCI 3879 exoinulinase. Labels : 1.Dandelion tap root
extract or pure chicory inulin; 2. Water inlet; 3. Substrate percolating on immobilized inulinase; 4.
Glass vessel with water jacket; 5. Ca-alginate immobilized inulinase (biocatalyst) of Aspergillus
niger; 6. Water outlet; 7. Generated fructose syrup; 8. TLC chromatogram showing fructose syrup
generation (Conditions for enzyme catalysis: pH- 5.0, Tem- 50°C).
7
8
1
3
7
4
5
2
6
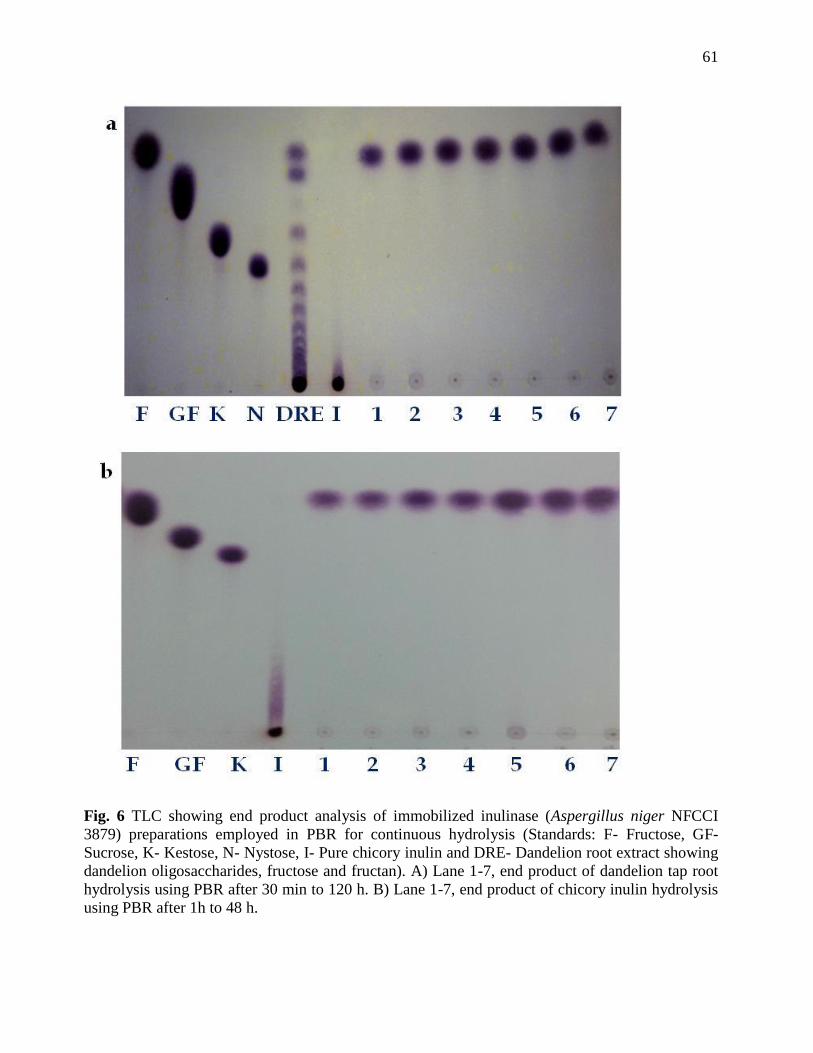
61
Fig. 6 TLC showing end product analysis of immobilized inulinase (Aspergillus niger NFCCI
3879) preparations employed in PBR for continuous hydrolysis (Standards: F- Fructose, GF-
Sucrose, K- Kestose, N- Nystose, I- Pure chicory inulin and DRE- Dandelion root extract showing
dandelion oligosaccharides, fructose and fructan). A) Lane 1-7, end product of dandelion tap root
hydrolysis using PBR after 30 min to 120 h. B) Lane 1-7, end product of chicory inulin hydrolysis
using PBR after 1h to 48 h.
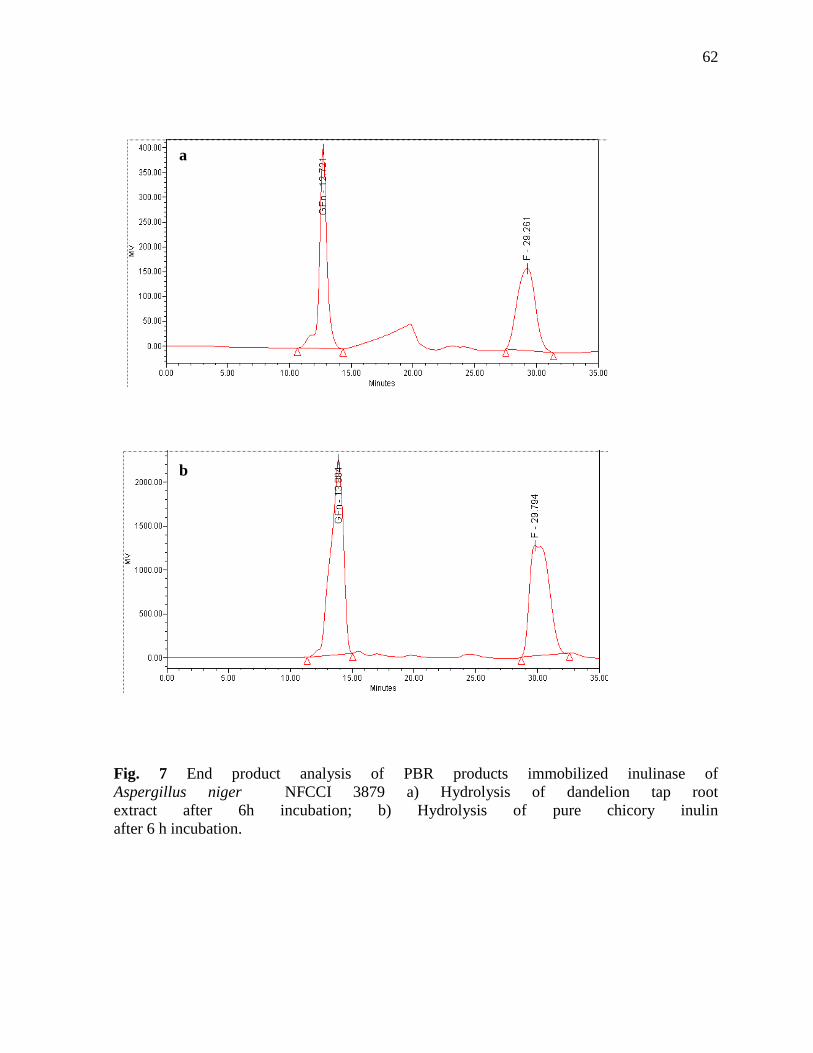
62
Fig. 7 End product analysis of PBR products immobilized inulinase of
Aspergillus niger NFCCI 3879 a) Hydrolysis of dandelion tap root
extract after 6h incubation; b) Hydrolysis of pure chicory inulin
after 6 h incubation.
a
b

63
Continuous fructose production was obtained with crude dandelion root, pure chicory
inulin and pure dahlia inulin using the PBR up-to 30 days (720 hrs). Maximum 90% of that the
entrapped enzyme worked well on inulin available in dandelion tap root and other forms and
such a system can be exploited in nutraceutical and pharmaceutical industries for continuous
generation of fructose syrup. Mode of action of exoinulinase from Aspergillus niger NFCCI 3879
was ascertained by analyzing the end products of enzyme action using HPLC (Rawat et al., 2015a).
Major product of inulin hydrolysis was fructose in case of all kinds of inulins.
Conclusion
Production of exoinulinase from newly isolated Aspergillus niger NFCCI 3879 was
statistically optimized using dandelion tap root extract (% fresh w/v) resulting in a ~2.5 fold (2337
nkat/ml) enhancement. Exoinulinase (1166 nkat/mg) immobilized in Ca-alginate beads was used
for continuous generation of fructose from crude inulin extracted from Taraxacum officinale
(dandelion) and chicory juice. Immobilized enzyme was optimally active at 50°C and pH 5.0 and
its kinetic parameters were 3.74 mM (Km) and 1.62 µm/min (Vmax). Continuous generation of
fructose syrup from low-cost dandelion root extract and chicory inulin using a packed bed
bioreactor (PBR) prepared by exoinulinase immobilized in alginate beads was demonstrated.
Successive degradation of dandelion oligosaccharides and fructans to pure fructose was observed
over 30 days period. The bioreactor had a half-life of 15 days and more than 90% (w/w) yield of
fructose was observed.

64
References
Balayan AM, Pivazian LA, Khachaturian RN, Afrikian EG, Abelian VA. 1996. Inulinases from
Penicillium palitans and Penicillium cyclopium. Biochem (Moscow) 61:645-650.
Barthomeuf C, Regerat F, Pourrat H. 1991. Production of inulinase by a new mold of Penicillium
rugulosum. J Ferment Bioeng 72:491-494.
Chen HQ, Chen XM, Li Y, Wang J, Jin ZY, Xu XM, Zhao JW, Chen TX and Xie ZJ. 2009.
Purification and characterization of exo and endo inulinase from Aspergillus ficuum JNSP5-
06. Food Chem 115:1206-1212.
Chen XM, Xu XM, Jin ZY, Chen HQ. 2012. Expression of an endoinulinase from Aspergillus
ficuum JNSP5-06 in Escherichia coli and its characterization. Carbol Poly 88:748-753.
Chi Z, Chi Z, Zhang T, Liu G, Yue L. 2009. Inulinase-expressing microorganisms and applications
of inulinases. Appl Microbiol Biotechnol 82:211-220.
El-souod ASM, Mohamed TM. Ali EMM, El-Badry MO, El-Keiy MM. 2014. Partial purification
of extracellular exo-inulinase from Ulocladium atrum J Gene. Engi. Biotech 12:15-20.
Fawzi ME. (2011). Comparative study of two purified inulinases from thermophile Thielavia
terrestris NRRL 8126 and mesophile Aspergillus foetidus NRRL 337 grown on Cichorium
intybus L. 42: 633-649.
Ganaie MA, Rawat HK, Wani OA, Gupta US, Kango N. 2014. Immobilization of
fructosyltransferase by chitosan and alginate for efficient production of
fructooligosaccharides. Proc Biochem 49:840-844.
Goosen C, Maarel van der MJEC, Dijkhuizen L. 2008. Exo-inulinase of Aspergillus niger N402: A
hydrolytic enzyme with significant transfructosylating activity. Biocat Bitrans 26:49-58.
Jain, SC. 2011. Characterization of inulin hydrolyzing enzymes from fungi. Ph.D. Thesis,
Dr. H.S. Gour University, Sagar (MP), India.
Jain SC, Jain PC, Kango N. 2012. Production of inulinase from Kluyveromyces marxianus using
dahlia tuber extract. Braz J Microbiol 43:62-69.
Kango N, Jain S.C. (2011). Production and properties of microbial inulinases: Recent advances.
Food Biotechnol 4: 165-212.
Kango N, Agrawal SC, Jain PC. 2003. Production of xylanase by Emericella nidulans NK-62 on
low-value lignocellulosic substrates. World J Microbiol Biotechnol 19:691-694.
Kango N. 2008. Production of inulinase using tap roots of dandelion (Taraxacum officinale) by
Aspergillus niger. J Food Eng 85:473-478.
Kaur N, Gupta K. 2002. Applications of inulin and oligofructose in health and nutrition.
J Biosci 27:703-714.
Laemmli U.K. 1970. Cleavage of structural proteins during the assembly of the head of
bacteriophage T4. Nature 227: 680-685.
Lowry OH, Rosebrough NJ, Farr AL, Randall RJ. 1951. Protein measurement with the Folin
phenol reagent. J. Biol. Chem. 193 (1): 265-75.
A

65
Mansouri M, Houbraken J, Samson RA, Frisvad JC, Christensen M, Tuthill DE, Koutaniemi S,
Hatakka A, Lankinen P. 2013. Penicillium subrubescens, a new species efficiently producing
inulinase. A. Van. Leeuw. 103:1343-1357.
Moriyama S, Akimoto H, Suetsugu N, Kawasaki S, Nakamura T, Ohta K. 2002. Purification and
properties of an exoinulinase from Penicillium sp. strain TN-88 and sequence analysis of the
encoding gene. J Biosci Biotechnol Biochem 66:1887-1896.
Nakamura T, Shitara A, Matsuda S, Matsuo T, Suiko M, Ohta K. 1997. Production, purification
and properties of endoinulinase of Penicillium sp. TN-88 that liberates inulotrioses.
J Ferment Bioeng 84:313-318.
Nakamura T, Nakatsu S. 1977. General properties of extracellular inulase from Penicillium.
Nippon Noge. Kaishi 51:681-689.
Onodera S. Shiomi N. 1992. Purification and subsite affinities of exoinulinase from Penicillium
trzebinskii. J Biosci Biotechnol Biochem 56:1443-1447.
Pessoni RA, Braga MR, Figueiredo-Ribeiro RC. 2007. Purification and properties of exo-
inulinases from Penicillium janczewskii growing on distinct carbon sources. Mycologia 99,
493-503.
Pitt JI. 1973. An appraisal of identification methods for Penicillium species: a novel taxonomic
criteria based on temperature and water relations. Mycologia 65:1135-1157.
Raper KB, Thom C. 1949. Manual of the Penicillia. Williams & Wilkins, Baltimore,USA.
Roberfroid M. 1993. Dietary fiber, inulin, and oligofructose: a review comparing their
physiological effects. Crit Revie Food Sci Nutri 33:103-148.
Singh P, Gill PK. 2006. Production of inulinases: Recent Advances. Food Technol Biotechnol,
44:151-162.
Singh RS, Sooch BS, Puri M. 2007. Optimization of medium and process parameters for the
production of inulinase from a newly isolated Kluyveromyces marxianus YS-1.
Biores Technol 98:2518-2525.
Trivedi S, Divecha J, Shah A. 2012. Optimization of inulinase production by a newly isolated
Aspergillus tubingensis CR16 using low cost substrates. Carbo Polymers: 483-490.
Van Loo J, Coussement P, De Leenheer L, Hoebregs H, Smits G. 1995. On the presence of inulin
and oligofructose as natural ingredients in western diet. Crit revie Food Sci Nutri
35:525-552.
Vandamme EJ, Derycke DG. 1983. Microbial inulinases: Fermentation process, properties and
applications. Advan Appl Microbiol 29:139-176.
Wang L, Huang Y, Long X, Meng X, Liu Z. 2011. Cloning of exoinulinase gene from Penicillium
janthinellum strain B01 and its high-level expression in Pichia pastoris.
J Appl Microbiol 111, 1371-1380.
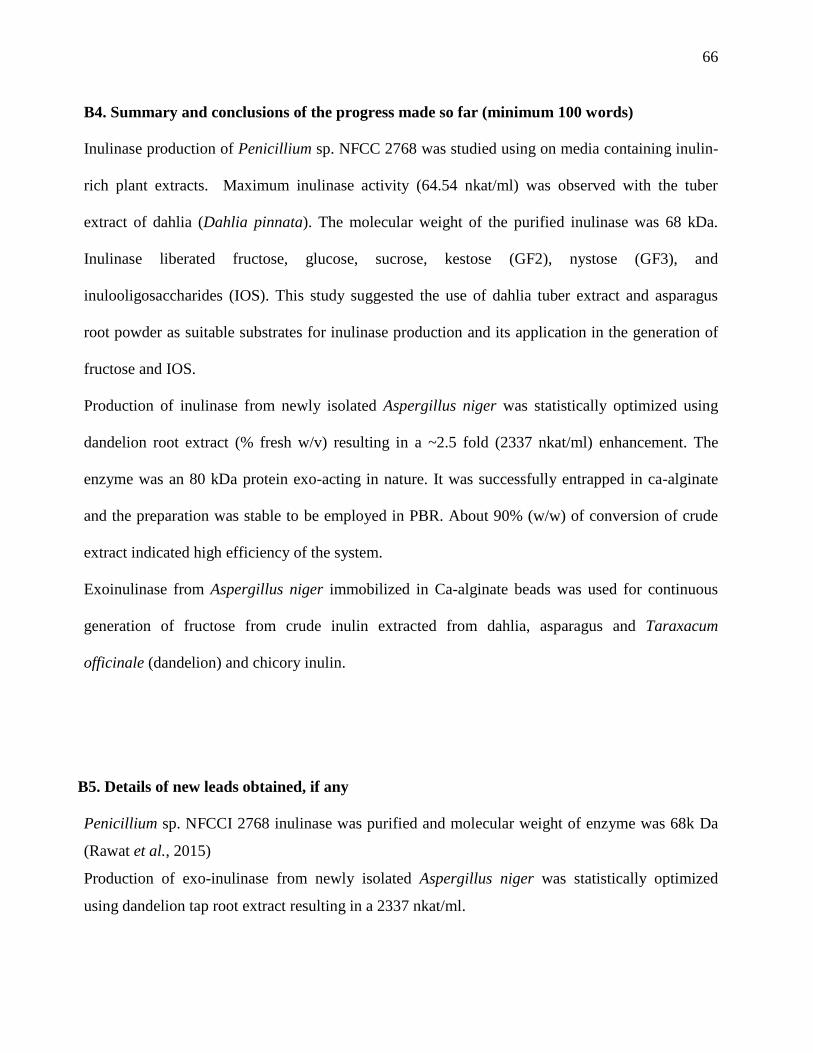
66
B4. Summary and conclusions of the progress made so far (minimum 100 words)
Inulinase production of Penicillium sp. NFCC 2768 was studied using on media containing inulin-
rich plant extracts. Maximum inulinase activity (64.54 nkat/ml) was observed with the tuber
extract of dahlia (Dahlia pinnata). The molecular weight of the purified inulinase was 68 kDa.
Inulinase liberated fructose, glucose, sucrose, kestose (GF2), nystose (GF3), and
inulooligosaccharides (IOS). This study suggested the use of dahlia tuber extract and asparagus
root powder as suitable substrates for inulinase production and its application in the generation of
fructose and IOS.
Production of inulinase from newly isolated Aspergillus niger was statistically optimized using
dandelion root extract (% fresh w/v) resulting in a ~2.5 fold (2337 nkat/ml) enhancement. The
enzyme was an 80 kDa protein exo-acting in nature. It was successfully entrapped in ca-alginate
and the preparation was stable to be employed in PBR. About 90% (w/w) of conversion of crude
extract indicated high efficiency of the system.
Exoinulinase from Aspergillus niger immobilized in Ca-alginate beads was used for continuous
generation of fructose from crude inulin extracted from dahlia, asparagus and Taraxacum
officinale (dandelion) and chicory inulin.
B5. Details of new leads obtained, if any
Penicillium sp. NFCCI 2768 inulinase was purified and molecular weight of enzyme was 68k Da
(Rawat et al., 2015)
Production of exo-inulinase from newly isolated Aspergillus niger was statistically optimized
using dandelion tap root extract resulting in a 2337 nkat/ml.

67
B6. Details of publications, patents and technology developed (Reprints enclosed)
1. Rawat H. K., Soni H., Treichel H. and Kango N. (2016) Biotechnological potential of
microbial inulinases: Recent perspective Critical Reviews in Food Science and Nutrition.
Accepted (Online issue) DOI: 10.1080/10408398.2016.1147419 (IF 5.42).
2. Rawat H. K., Ganaie M. A. and Kango N. (2015) Production of inulinase,
fructosyltransferase and sucrase from fungi on low-value inulin-rich substrates and their use
in generation of fructose and fructooligosaccharides. Antonie van Leeuwenhoek, 107:
799-811. Citation 11 (IF 1.9).
3. Rawat H. K., Jain S. C. and Kango N. (2015) Production and properties of inulinase from
Penicillium sp. NFCC 2768 grown on inulin containing vegetal infusions. Biocatalysis and
Biotransformation, 33: 61-68. (IF 0.9)
4. Rawat H. K., Soni H. and Kango N. (2015) Screening of inulinase producing fungi isolated
from inulin containing sources and use of exoinulinase in generation of fructose. Madhya
Bharti Journal of Science, 59: 10-14.
B7. Deliverable of the project
Inulinase was characterized from the native strains will be utilized by food and nutraceutical
industries of M.P. Present study will be useful in case of industrial scale production of fructose
syrup. An enzyme based process for fructose generation using microbial inulinase of selected
fungal strains.
B8. A brief para about ‘‘application and use of research outcome - the technology aspect”
Immobilization and successive recycling of inulinase will be facilitates its reuse and ensures
continuous production of high fructose syrup.
Optimization of Aspergillus niger
Purification and characterization of inulinase was done from Aspergillus niger NFCCI and
Penicillium sp. NFCCI 2768.

68
B9. Benefits that will accrue to M.P. on the completion of your research project
The project outcome will be useful for pharmaceutical, fermentation and food industries of
Madhya Pradesh. Based on the findings of the project the native isolates obtained from Sagar
MP may be utilized for production of inulinase. Inulinase thus obtained may be immobilized as
demonstrated in the report and a process of continuous generation of FOS or Fructose may be
developed.
B10. Agencies which can utilize the findings/ results/ outcome of the project
Production of high fructose syrup can be exploited in food, pharmaceutical and nutraceutical
industries or corporations of Madhya Pradesh.
B11. Further research potential and support required from the council, if any
Financial support has been submitted for agencies for further research.
Section C: Details of grant utilization
C1. Equipment acquired or place order with actual cost
Non-Recurring:
Amount Sanctioned & List of approved
Equipment
List of procured equipment
Rs. 55,000=00
Equipment (Microscopic Image
Projection System, CCD Camera)
01-MIPS Catcam, Microscope Eyepiece Digital Camera
(CC130): CatCam 130 1.3 Mega Pixel Microscope
Camera
Date of invoice: 8.10.2013
C2. Manpower staffing and expenditure details
Please see enclosed Utilization certificate
C3. Details of recurring expenditure
Please see enclosed Utilization certificate

69
List of Papers presented in conferences/seminars
I. Production, properties and immobilization of Penicillium sp. NFCCI 2768 inulinase grown
on inulin containing raw materials. Organized by (Madhya Pradesh Biotechnology Council,
Bhopal) M.P. Young Scientist Congress-28 Feb. to 1 March 2014.
Paper Presented in New Biology Stream
II. Screening, production and application of inulinase and fructosyltransferase (FTase)
producing microorganisms. FDEOLS-2014 (international Conference) Department of
Biotechnology, Dr. H.S. Gour University, Sagar (M.P.) during 13-15 February 2014.
Best Poster Award
III. Development of Bioprocess for generation of high fructose syrup (HFS) held at Department of
Microbiology, Dr. H.S. Gour University, Sagar (M.P.) National Science Day during 28 February
2013.
Best Poster Award
IV. Production and characterization of Aspergillus fumigatus inulinase and its application for
the generation of high fructose syrup (HFS) (ISCA chapter, Symposium) Department of
Zoology, Dr. H.S. Gour University, Sagar (M.P.) during 27-28 February 2014.
Presented Poster
V. Enzymes (Endo-inulinase from Fusarium oxysporum) Are Playing Role in Green
Chemistry (National Seminar) Organized by (Govt. Auto. Excellence Girls College, Sagar)
Delivered Lecture

70
Research Articles (Under Review)
5. Rawat H. K., Jain S.C., Soni H., Ahirwar S. and Kango N. (2015) Optimized production
and characterization of inulinase from newly isolated Hirsutella sp. and its potential for use
in the generation of inulooligosaccharide and fructose. Journal of Food Science and
Technology, JFST-S-15-02626-R1.
Honors and Awards received
1. Best Poster Presentation (First Prize) award in National Conference
(MRSC-2015) Organized by Maharaja Ranjit Singh College of Professional Sciences, Indore
‘Optimization and inulinase production from Aspergillus fumigatus for the generation of
inulooligosaccharides and fructose’ (16th October, 2015)
2. Best Oral Presentation award in National Conference (RACBS-2015) Organized by Dept.
of Zoology, Dr. H.S. Gour Central University, Sagar. ‘Biotransformation of sucrose into
fructooligosaccharide using A. fumigatus GNCC 1351’ (17 March 2015)
3. Best Poster Award in International Conference (FDEOLS-2014) in Microbial Technology
Discipline. Organized by Dept. of Biotechnology, Dr. H.S. Gour Central University, Sagar
‘Screening, production and application of inulinase and fructosyltrasferase (FTase)
producing microorganisms’ (13-15 February-2014).
4. Fellowship for Training of Young Scientist. MPCST, Young Scientist Congress-2014
Presented Research paper in New Biology Discipline during 28 Feb to March 1-2015.
5. Fellowship for Training of Young Scientist. MPCST, Young Scientist Congress-2014
Presented Research paper in New Biology Discipline during 28 Feb to March 1-2014.
6. Best Poster award in National Science Day- 2013 Sponsored by MPCST-Bhopal
organized by Dept of Applied Microbiology and Biotechnology Dr. H. S. Gour Central
University, Sagar ‘Bioprocess development for high fructose syrup generation’ (15 March
2013).
Paper presented in Conferences and Seminars
1. National conference on Bioremediation and our Environment Organized by Noble
College, Sagar Presented paper Continuous production of high fructose syrup using
Aspergillus fumigatus thermostable inulinase. 16-17th May 2015.
2. National conference on evolving trends in biotechnology ISCA, Sagar Chapter Presented
paper-Production and properties of inulinase producing Penicillium for the fructose
generation. 28-30 Mar 2015.
71
3. National conference Indian Science Congress Association (ISCA), Kolkata Presented
poster- ‘Isolation and screening of inulinase producing fungi isolated from decomposing
vegetal sources’ In New Biology (3-7 Jan 2013).
4. National seminar on Role of Green Technology Delivered lecture on ‘Enzymes
(Endoinulinase from Fusarium oxysporum) are playing role in green chemistry’. Organized
by Govt. Auto Girls P.G. College of Excellence, Sagar, M.P. (26-27th Feb 2014)
5. National symposium on Frontiers Modern Biology. Presented paper- Production and
characterization of Aspergillus fumigatus inulinase for generation of fructose syrup. ISCA
Sagar Chapter Central University, Sagar ( March 24-25th, 2014)
6. National Seminar of ISCA, Sagar Chapter Presented paper/abstract entitled-Isolation
and screening of inulin hydrolyzing Fungi from different vegetal sources’ 30 Sep-Oct 1
2012.

72

73

74

75
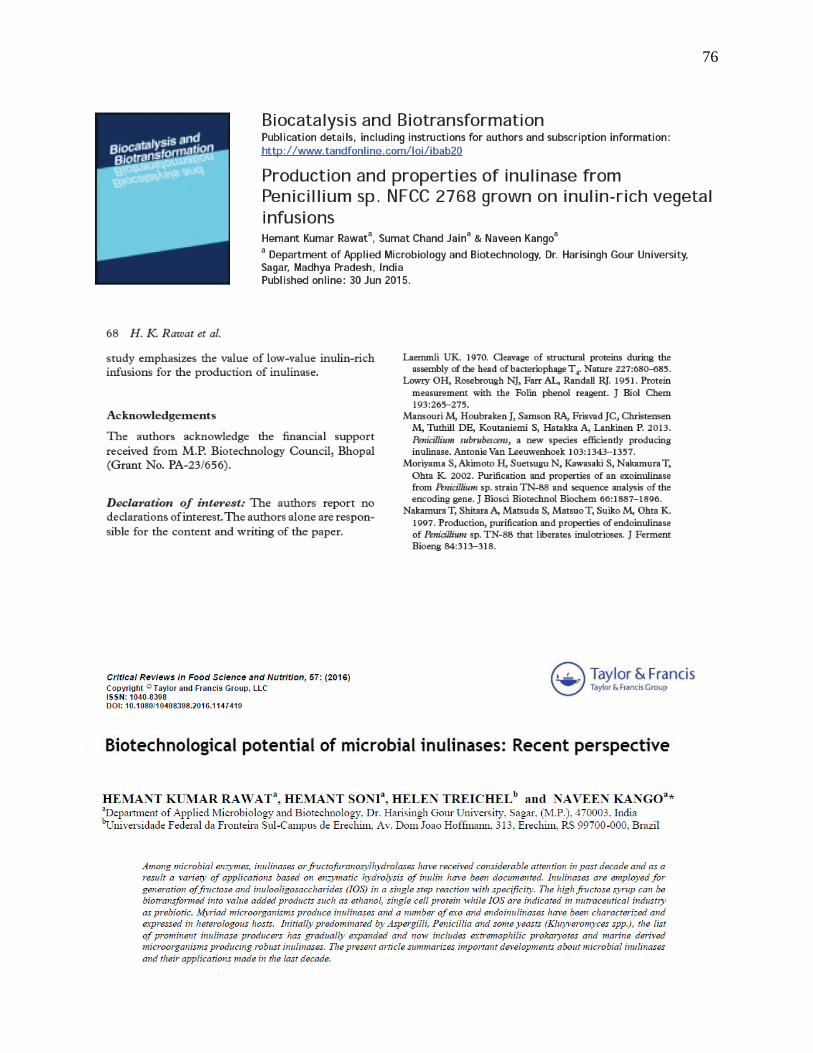
76
Related Documents