Progress on Tiger Team Project: Air Quality Reanalysis Georgia Institute of Technology Yongtao Hu, M. Talat Odman, Armistead G. Russell School of Civil & Environmental Engineering, Georgia Institute of Technology With thanks to project leaders Greg Carmichael and Pius Lee and other members GT-Emory AQAST Meeting, August 28 th , 2015

Welcome message from author
This document is posted to help you gain knowledge. Please leave a comment to let me know what you think about it! Share it to your friends and learn new things together.
Transcript
Progress on Tiger Team Project: Air Quality Reanalysis
Georgia Institute of Technology
Yongtao Hu, M. Talat Odman, Armistead G. Russell
School of Civil & Environmental Engineering, Georgia Institute of Technology
With thanks to project leaders Greg Carmichael and Pius Lee and other members
GT-Emory AQAST Meeting, August 28th, 2015

Part 1: Project Team and Major Goals
Georgia Institute of Technology

3
Air Quality Reanalysis (Configuration for 2010 HTAP production)
AQAST-9 June 2-4, 2015, St Louis, MO
Greg Carmichael1, Pius Lee2 , Brad Pierce3, Dick McNider4, Ted Russell5, Edward Hyer6, Yang Liu7, Arastoo Pour Biazar4,
Yongtao Hu5, Talat Odman5, Scott Spak1, David Edwards8, Ken Pickering9, Youhua Tang2, Li Pan2, Hyuncheol Kim2, Daniel Tong2
1 College of Engineering, University of Iowa, Iowa City, IA
2Air Resources Lab., NOAA Center for Weather and Climate Prediction, College Park, MD 3National Environmental Satellite and Information Service (NESDIS), Madison, WI
4Department of Atmospheric Science, University Alabama, Huntsville AL 5School of Civil and Environmental Engr., Georgia Institute of Technology, Atlanta, GA
6Naval Research Laboratory, Monterey, CA 7Department of Environmental Health, Emory University, Atlanta, GA
8 Corporation for Atmospheric Research, Boulder, CO
9Atmospheric Chemistry and Dynamics Lab., NASA, Greenbelt MD

4
Concept of Reanalysis A ‘reanalysis’ is a climate or weather model simulation of the past that includes data assimilation of historical observations. The observations can be very comprehensive (satellite, in situ, multiple variables) or relatively sparse (say, sea level pressure only), and the models themselves are quite varied. Generally these models are drawn from the weather forecasting community (at least for the atmospheric components) which explains the odd terminology. An ‘analysis’ from a weather forecasting model is the 6 hour (say) forecast from the time of observations. Weather forecasting groups realized a decade or so ago that the time series of their weather forecasts (the analyses) could not be used to track long term changes because their models had been updated many times over the decades. Thus the idea arose to ‘re-analyze’ the historical observations with a single consistent model. These sets of 6 hour forecasts using the data available at each point are then more consistent in time (and presumably more accurate) that the original analyses were. - See more at: http://www.realclimate.org/index.php/archives/2011/07/reanalyses-r-us/#sthash.WKOIKeHl.dpuf

5
Applications of Reanalysis
Reanalysis would be able to provide PM2.5 speciation data with national coverage at county level
AQAST-9 June 2-4, 2015, St Louis, MO
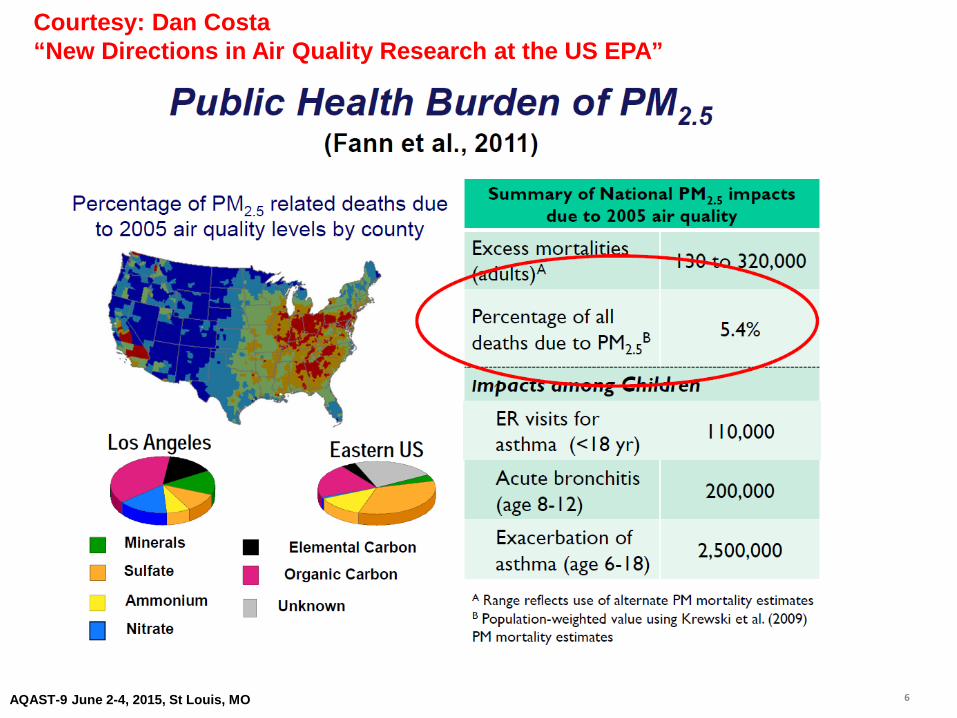
Courtesy: Dan Costa “New Directions in Air Quality Research at the US EPA”
6 AQAST-9 June 2-4, 2015, St Louis, MO
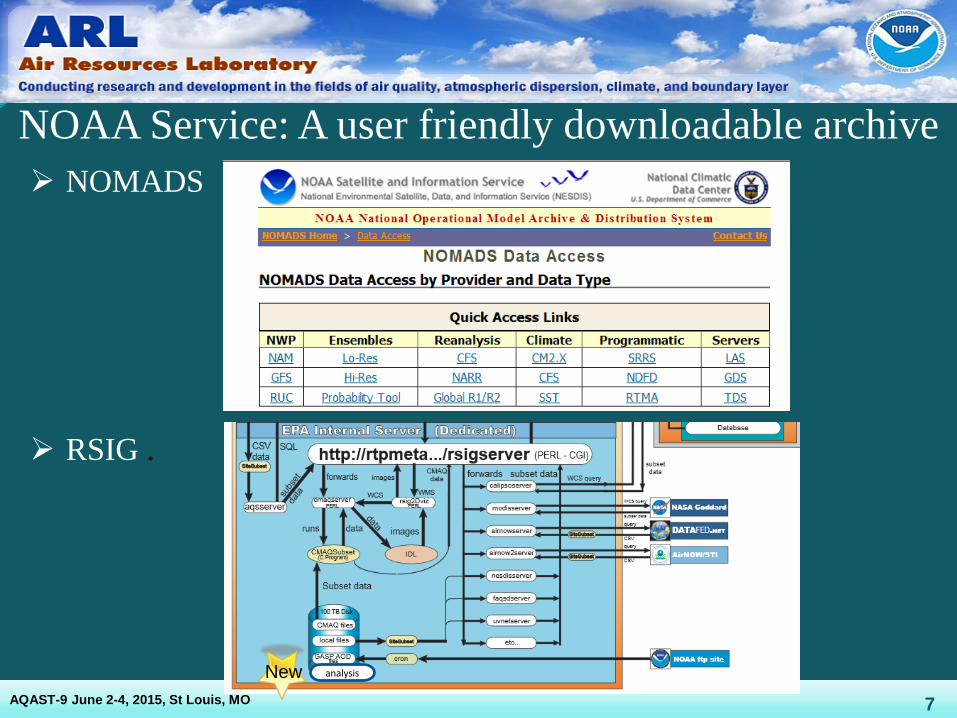
NOMADS
RSIG .
NOAA Service: A user friendly downloadable archive
7
analysis New AQAST-9 June 2-4, 2015, St Louis, MO

Part 2: Tasks to make the model more robust
Georgia Institute of Technology

WRF_ARW-MCIP-CMAQ forward model
CMAQ 4.7.1/CMAQ5.1
WRF-ARW (LCC) (42 σ-P model Layers)
LBC from GFS
Projection of endo-domain intermitten
sources: Obs’d wild fire and prescribed burns
Hourly 3-D Gridded Chemical
Concentration
MCIP
MODIS- AOD-based adjusted IC,
BC: RAQMS
C-grid
C-grid
Column integrated AOD C-grid
42 σ-P met. Layers
C-grid
C-grid
AQAST 7, Harvard University, June 17-19, 2014
EPA Emissions Inventory + simple obs-based adjustment

CMAQ4.7.1 Both CONUS(12 km) & SENEX (4 km)
Map projection & grid Lambert Conformal & Arakawa C staggering
Vert. co-ordinate 42 σ-p unevenly spaced levels
Gas chemistry Cb05 with 156 reactions
Aerosol chemistry Aero5 with updated evaporation enthalpy
Anthropogenic emission
2005NEI as base year, mobile projected using AQS*, area and off-road used CSPR^, point source uses 2012 CEM data
WRAP oil and gas emissions data
Biogenic emission BEIS-3.14
Lateral BC RAQM (B. Pierce)
42 vertical layers
WRF_ARW-MCIP-CMAQ model physics and chemistry options WRF-ARW Both North America (12 km) & CONUS (4 km)
Map projection & grid Lambert Conformal & Arakawa C staggering
Vert. co-ordinate 42 σ-p unevenly spaced levels
advection RK3 (Skamarock and Weisman (2008))
SW & LW radiation RRTMG (Iacono et al. 2008))
PBL Physics Mellor-Yamada-Janjic (MYJ) level 2.5 closure
Surface layer scheme Monin-Obukhov Similarity with viscous sub-layer
Land Surface Model NCEP NOAH
Cloud Microphysics Thompson et al. (2008)
Cloud convective mixing Betts-Miller-Janjic Mass adjustment
AQAST 7, Harvard University, June 17-19, 2014
AQ forecast: ^12 km nested to 4 km

11 AQAST 7, Harvard University, June 17-19, 2014
NMMB-CMAQ4.7.1 (22L)
Longitudinal cross-section along Denver (105W) at 20 UTC July 2, 2011 No spurious spikes of vertical gradients over complex terrain for O3 concentration
WRF_ARW-CMAQ4.7.1 (42L)

12 AQAST 7, Harvard University, June 17-19, 2014
NMMB-CMAQ4.7.1 (22L)
WRF_ARW-CMAQ4.7.1 (42L)
24 h averaged surface PM2.5 on July 3 2011 A mixed result as a general lower predicted value by 42L exacerbated under-bias, but the higher predicted values by 42L in Lower Middle helped.

13 13
Outline on progress The Regional Chemical Analysis TT started in 2013: Deliverable in 2014: Analysis fields for July 2011
provided for GaTech and UMD for SIP modeling o Assimilated exo-domain wild fire, O3 using RAQM o Upgrade emission based on NEI2011 o Assimilated wild-fire using NESDIS obs, PM2.5 constraints using MODIS AOD & AQS PM2.5 o Assimilated cloud attenuated photolytic rate o Mimicked SIP reduced RMSE by 400% for PM2.5
Deliverable in 2015: Analysis fields for 2010, support HTAP
o Assimilate lightning NOx, PAR, DYNAMO Isoprene User friendly portal and archive for chemical analysis fields over Continental U.S.
AQAST-9 June 2-4, 2015, St Louis, MO
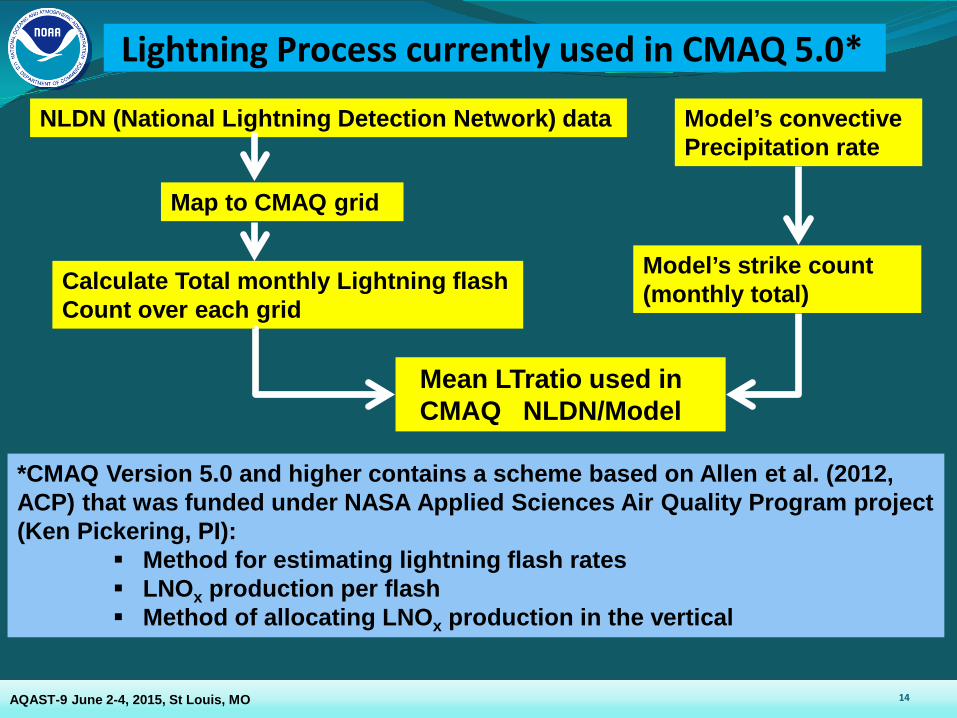
Lightning Process currently used in CMAQ 5.0*
*CMAQ Version 5.0 and higher contains a scheme based on Allen et al. (2012, ACP) that was funded under NASA Applied Sciences Air Quality Program project (Ken Pickering, PI):
Method for estimating lightning flash rates LNOx production per flash Method of allocating LNOx production in the vertical
NLDN (National Lightning Detection Network) data
Map to CMAQ grid
Calculate Total monthly Lightning flash Count over each grid
Model’s convective Precipitation rate
Model’s strike count (monthly total)
Mean LTratio used in CMAQ NLDN/Model
AQAST-9 June 2-4, 2015, St Louis, MO 14

July 1-10, 2011 NO2 (Left) Base (Right) with LNOx, (Bottom) Difference
38
36 98 100
Midwest convections. GOES13
AQAST-9 June 2-4, 2015, St Louis, MO 15

July 1-10, 2011 O3 (Left) Base (Right) with LNOx, (Bottom) Verification
AQAST-9 June 2-4, 2015, St Louis, MO
O3 10 days avg Stations Obs mean Mean bias RMSE Corr. Coef. Base 3222 36.45 -0.17 15.81 0.66
36.45 2.90 24.54 0.53
O3 10 days avg (RM) Stations Obs mean Mean bias RMSE Corr. Coef.
Base 483 42.36 1.32 13.32 0.61 Include LNOx 42.36 6.61 29.60 0.48
16
AQAST-9 June 2-4, 2015, St Louis, MO
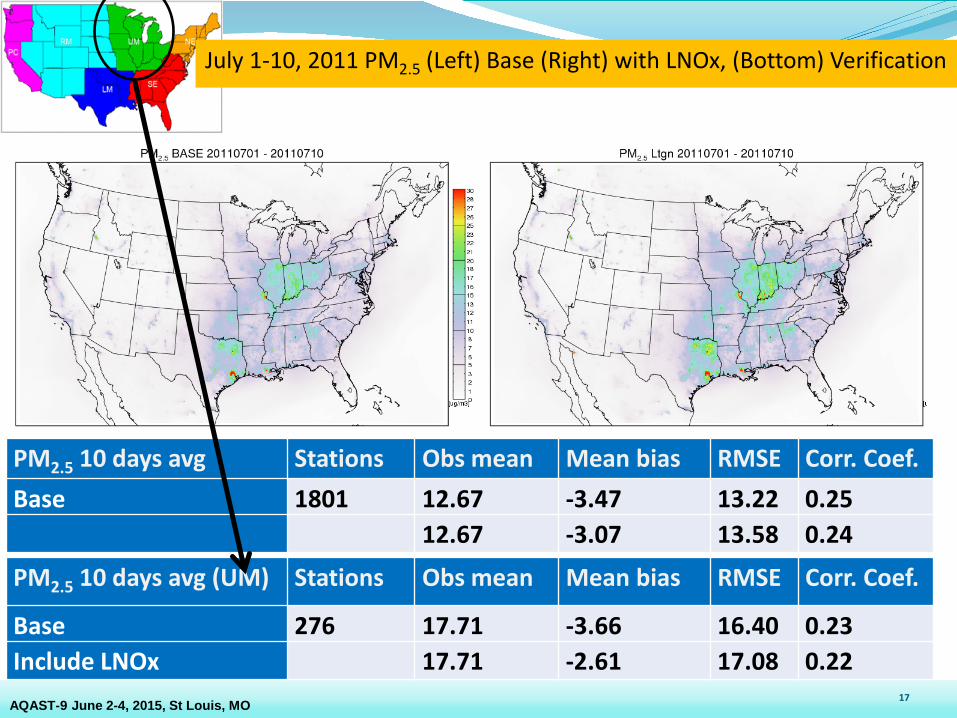
July 1-10, 2011 PM2.5 (Left) Base (Right) with LNOx, (Bottom) Verification
PM2.5 10 days avg Stations Obs mean Mean bias RMSE Corr. Coef. Base 1801 12.67 -3.47 13.22 0.25
12.67 -3.07 13.58 0.24 PM2.5 10 days avg (UM) Stations Obs mean Mean bias RMSE Corr. Coef.
Base 276 17.71 -3.66 16.40 0.23 Include LNOx 17.71 -2.61 17.08 0.22
17

Part 3: Data Assimilation Methodology
Georgia Institute of Technology

Optimal Interpolation (OI) OI simplifies the extended Kalman filter formulation
(Dee et al. Q. J. R. Meteor. Soc. 1998) by limiting the analysis problem to a subset of obs.
Obs far away (beyond background error correlation
length scale) have no effect in the analysis.
Injection of Obs through OI takes place at 1800 UTC daily.
)()( 1 HXYOHBHBHXX TTba −++= −
19 AQAST-9 June 2-4, 2015, St Louis, MO

Alternative methods: Emissions adjustments and model results based data fusion
Georgia Institute of Technology
Standard Forecasting
Off-line test
On-line test
Emissions Adjusting Period
DDM-3D
Inverse
WRF-SMOKE-CMAQ
WRF-SMOKE-CMAQ-DDM-3D
CMAQ
Obs
Inverse
CMAQ
Adjtd E
Inverse
Obs
Adjtd E
Inverse Adjtd E
Adjtd E Inverse
Adjtd E Adjtd E
Obs Obs
DDM-3D
Inverse
Evaluate

Georgia Institute of Technology
MODIS L2 C6 AOD Re-gridded Near Real-Time HiRes2 Products: 12-km versus 4-km

Part 4: Reanalysis fields for SIP modeling and health studies
Georgia Institute of Technology

Georgia Institute of Technology 17.36
Use Reanalysis fields for SIP modeling’s initial and boundary conditions

25
Decision on matching the GFS vertical structure 42-L was made for the chemical reanalysis forward model
The reanalysis forward model showed reasonable ozone cross-section in complex terrain
The reanalysis forward model is tested and used to generate July 2011 reanalysis fields for MDE for SIP modeling July 2011 analysis fields was used by Georgia Tech for a 14-day SIP
simulation and showed significant improvement in RMSE Data Set assimilated: RAQMS (MLS, OMI O3, MODIS AOD); HMS Fire; GOES
cloud fraction for photolytic rate correction; MODIS AOD; AQS O3, PM2.5 Assimilate lightning NOx: Use NOAA hourly reporting of the National
Lightning Detection Network to derive and distribute LNOx Preliminary surface NOx and O3 verification showed over-estimation Further improvement of LNOx assimilation algorithm is being test Analysis configuration also includes observation set on biogenic emission
from the DYNAMO team Production FY2010 in conjunction with HTAP support Portal via RSIG is being tested
Summary
AQAST-9 June 2-4, 2015, St Louis, MO

Supplement
Georgia Institute of Technology

27
Constrained
Satellite Products
Global Assimilation
+ AQ Assessments
+ State Implementation Plan Modeling
+ Rapid deployment of on-demand rapid-response forecasting; e.g., new fuel type,…, etc.
+ Health Impacts assessments
+ Demonstration of the impact of observations on AQ distributions
+ Ingestion of new AQAST products into operations
http://acmg.seas.harvard.edu/aqast/projects.html
AQAST Project: Air Quality Reanalysis (Translating Research to Services)
3:30-5:00 Session Yang Liu: MODIS C6
Alvarado & Hegarty: NH3 Huang, McNide, Lee : TSkin
AQAST-9 June 2-4, 2015, St Louis, MO

28
Lightning NOx
AIRNow
Cloud-obs Photolysis rates
Isoprene & PAR
done
done
done
Yet to do New
AQAST-9 June 2-4, 2015, St Louis, MO

29 AQAST 7, Harvard University, June 17-19, 2014
Re-configuration of vertical structure: Decision to match GFS (NCEP)
sigma Pres (hPa) Z (m)
1 1013 0
0.999 1012 4
0.996 1010 20
0.992 1007 48
0.985 993 92
0.864 872 1245
0.843 852 1430
0.824 836 1590
0.808 821 1735
0.322 348 8150
0.297 326 8580
0.278 310 8940
0.262 296 8580
Near surface
Top of fully dev PBL
tropopause

P3 Three and a half loops: Beltsville Padonia Fairhill Aldino Edgewood Essex Chesapeake Bay
30
CO (ppb) along the P3 Flight – July 2 2011: AOD_DA case vs. Obs
100
200
AQAST 7, Harvard University, June 17-19, 2014
Pan & Lee et al., AE 2014

31 AQAST 7, Harvard University, June 17-19, 2014
NMMB-CMAQ4.7.1 (22L)
WRF_ARW-CMAQ4.7.1 (42L)
Daily maximum 8 h averaged surface O3 on July 3 2011 The over bias across a large swath in the Southern U.S. was reduced by 42L

MODIS (Moderate Resolution Imaging Spectroradiometer) AOD
http://terra.nasa.gov/About/ Orbit: 705 km, 10:30 a.m. descending node (Terra) or 1:30 p.m. ascending node (Aqua)
Swath Dimensions:
2330 km (cross track) by 10 km (along track at nadir)
Spatial Resolution:
250 m (bands 1-2) 500 m (bands 3-7) 1000 m (bands 8-36)
Courtesy :NESDIS
32
National correlation map between AIRNow measurement and MODIS AOD
Typically good correlation between surface PM2.5 and AOD retrieved by MODIS
AQAST-9 June 2-4, 2015, St Louis, MO
Related Documents