IEEE TRANSACTIONS ON INSTRUMENTATION AND MEASUREMENT, VOL. 55, NO. 2, APRIL2006 625 Programmable Electronic Instrument for Condition Monitoring of In-Service Power Transformers Francisco Poza, Perfecto Mariño, Member, IEEE, Santiago Otero, and Fernando Machado Abstract—The objective of this paper is the design and develop- ment of the data-acquisition and storage parts of a measurement system that will be used for condition monitoring (CM) of power transformers. The data captured from the sensors and stored in the database will be used for the prediction of the power trans- former’s behavior. These data-storage and data-acquisition parts have been developed using data-warehouse (DW) techniques and virtual instruments (VIs). This paper makes a brief introduction to the whole CM system and describes in depth the data-acquisition and data-store subsystems. Then, the fundamental considerations about the installation and maintenance are outlined. Next, the results of the project are described, and other existing commercial CM systems are briefly discussed. Finally, the fundamental conclu- sions, obtained from the installation of this CM system, are shown. The CM system is currently installed and working properly in four electric power transformers. Index Terms—Condition monitoring (CM), data acquisition, database systems, power transformers, virtual instrument (VI). I. I NTRODUCTION C URRENTLY, there is an increasing interest in the de- velopment and application of condition monitoring (CM) techniques [1] for electrical equipment such us transformers, generators, and power induction motors. Power transformers’ failures carry great costs to electric companies, and their pre- vention is fundamental. CM permits the reduction of operating and maintenance costs, increasing the reliability. In order to help with the maintenance of power transformers, the authors have developed the data-acquisition and data-store parts of a CM system based on behavior models [2], from transformer’s physical variables such as temperature, moisture in oil, concentration of gases, and vibration. Despite there being several different commercial CM sys- tems (e.g., INSITE from Doble Engineering, SITRAM from Siemens, T-MONITOR from ABB, FARADAY T-MEDIC from General Electric, etc.), the justification for developing a new one is because different model types with different input pa- rameters must be tested. For this reason, the system should be open and easily reconfigurable for its adaptation to model changes. These characteristics are not fulfilled by commercial CM systems. Other drawbacks of existing commercial CM systems will be mentioned in the discussion section. Manuscript received June 15, 2004; revised December 7, 2005. This work was sponsored by two R&D projects from the following entities: R&D Na- tional Secretaryship and CICYT, Ref. DPI2000-1702, Central Government (Spain) and Presidency Department, Ref. PGIDT01TIC30301PR, Autonomous Government (Galicia, Spain). The authors are with the Electronic Technology Department, University of Vigo, Vigo 36200, Spain (e-mail: [email protected]; [email protected]; [email protected]; [email protected]). Digital Object Identifier 10.1109/TIM.2006.870122 During the development stages of the CM system, an ex- perimental power transformer (15 KV/400 V 1.5 MVA) has been used. This smaller power transformer was custom made with similar characteristics to the bigger real ones. In this experimental scenario, the behavior models have been designed and validated. Initially, these models have been fed with data from sensors installed both inside and outside the experimental transformer. In the current project, the models have been modified so that they only use data from external sensors or from internal ones that do not require opening the transformer when they are installed. This is fundamental since the installation of internal sensors in real working transformers is very costly, could inter- rupt the service, and could also void the transformer’s warranty conditions. This paper makes a brief introduction to the whole CM system and describes the hardware and software of the data- acquisition subsystem, which comprises the programmable electronic instrument (PEI), and the data-store (DS) subsystem. The PEI acquires, processes, and stores measurements from the sensors. The mission of the DS is to hold the data captured by the PEI subsystem and to present them in a suitable form to the prediction application (PA). This CM system is being tested in four 132-KV/66-KV 40-MVA power transformers with satisfactory results, and it is currently awaiting patent processing, with the reference number 200401029, from the Brands and Patents Spanish Office. II. SYSTEM ARCHITECTURE The architecture of the CM system is formed by three independent and interrelated subsystems: PEI, DS, and PA (Fig. 1). All subsystems currently run in the same industrial computer but have been independently designed with their communication interfaces clearly defined. This way, the pre- viously described subsystems can be executed in a distributed environment, and possible changes made in one of them do not affect the others. An important requirement for the system is that it has to operate properly inside a cabinet attached to one of the power-transformer sides. For this reason and due to the at- mospheric, mechanical, and electromagnetic hazard environ- ment, the chosen architecture was an industrial computer based on the 133.35-mm height (3U) peripheral component inter- connect (PCI) eXtensions for Instrumentation (PXI) standard [3], [4]. The PXI architecture presents, among others, the following advantages with respect to other architectures (for example, PCI or Versa Module Eurocard (VME) eXtensions 0018-9456/$20.00 © 2006 IEEE

Welcome message from author
This document is posted to help you gain knowledge. Please leave a comment to let me know what you think about it! Share it to your friends and learn new things together.
Transcript
IEEE TRANSACTIONS ON INSTRUMENTATION AND MEASUREMENT, VOL. 55, NO. 2, APRIL 2006 625
Programmable Electronic Instrument for ConditionMonitoring of In-Service Power Transformers
Francisco Poza, Perfecto Mariño, Member, IEEE, Santiago Otero, and Fernando Machado
Abstract—The objective of this paper is the design and develop-ment of the data-acquisition and storage parts of a measurementsystem that will be used for condition monitoring (CM) of powertransformers. The data captured from the sensors and stored inthe database will be used for the prediction of the power trans-former’s behavior. These data-storage and data-acquisition partshave been developed using data-warehouse (DW) techniques andvirtual instruments (VIs). This paper makes a brief introduction tothe whole CM system and describes in depth the data-acquisitionand data-store subsystems. Then, the fundamental considerationsabout the installation and maintenance are outlined. Next, theresults of the project are described, and other existing commercialCM systems are briefly discussed. Finally, the fundamental conclu-sions, obtained from the installation of this CM system, are shown.The CM system is currently installed and working properly in fourelectric power transformers.
Index Terms—Condition monitoring (CM), data acquisition,database systems, power transformers, virtual instrument (VI).
I. INTRODUCTION
CURRENTLY, there is an increasing interest in the de-velopment and application of condition monitoring (CM)
techniques [1] for electrical equipment such us transformers,generators, and power induction motors. Power transformers’failures carry great costs to electric companies, and their pre-vention is fundamental. CM permits the reduction of operatingand maintenance costs, increasing the reliability.
In order to help with the maintenance of power transformers,the authors have developed the data-acquisition and data-storeparts of a CM system based on behavior models [2], fromtransformer’s physical variables such as temperature, moisturein oil, concentration of gases, and vibration.
Despite there being several different commercial CM sys-tems (e.g., INSITE from Doble Engineering, SITRAM fromSiemens, T-MONITOR from ABB, FARADAY T-MEDIC fromGeneral Electric, etc.), the justification for developing a newone is because different model types with different input pa-rameters must be tested. For this reason, the system shouldbe open and easily reconfigurable for its adaptation to modelchanges. These characteristics are not fulfilled by commercialCM systems. Other drawbacks of existing commercial CMsystems will be mentioned in the discussion section.
Manuscript received June 15, 2004; revised December 7, 2005. This workwas sponsored by two R&D projects from the following entities: R&D Na-tional Secretaryship and CICYT, Ref. DPI2000-1702, Central Government(Spain) and Presidency Department, Ref. PGIDT01TIC30301PR, AutonomousGovernment (Galicia, Spain).
The authors are with the Electronic Technology Department, Universityof Vigo, Vigo 36200, Spain (e-mail: [email protected]; [email protected];[email protected]; [email protected]).
Digital Object Identifier 10.1109/TIM.2006.870122
During the development stages of the CM system, an ex-perimental power transformer (15 KV/400 V 1.5 MVA) hasbeen used. This smaller power transformer was custom madewith similar characteristics to the bigger real ones. In thisexperimental scenario, the behavior models have been designedand validated. Initially, these models have been fed with datafrom sensors installed both inside and outside the experimentaltransformer.
In the current project, the models have been modified sothat they only use data from external sensors or from internalones that do not require opening the transformer when they areinstalled. This is fundamental since the installation of internalsensors in real working transformers is very costly, could inter-rupt the service, and could also void the transformer’s warrantyconditions.
This paper makes a brief introduction to the whole CMsystem and describes the hardware and software of the data-acquisition subsystem, which comprises the programmableelectronic instrument (PEI), and the data-store (DS) subsystem.The PEI acquires, processes, and stores measurements from thesensors. The mission of the DS is to hold the data captured bythe PEI subsystem and to present them in a suitable form to theprediction application (PA).
This CM system is being tested in four 132-KV/66-KV40-MVA power transformers with satisfactory results, and it iscurrently awaiting patent processing, with the reference number200401029, from the Brands and Patents Spanish Office.
II. SYSTEM ARCHITECTURE
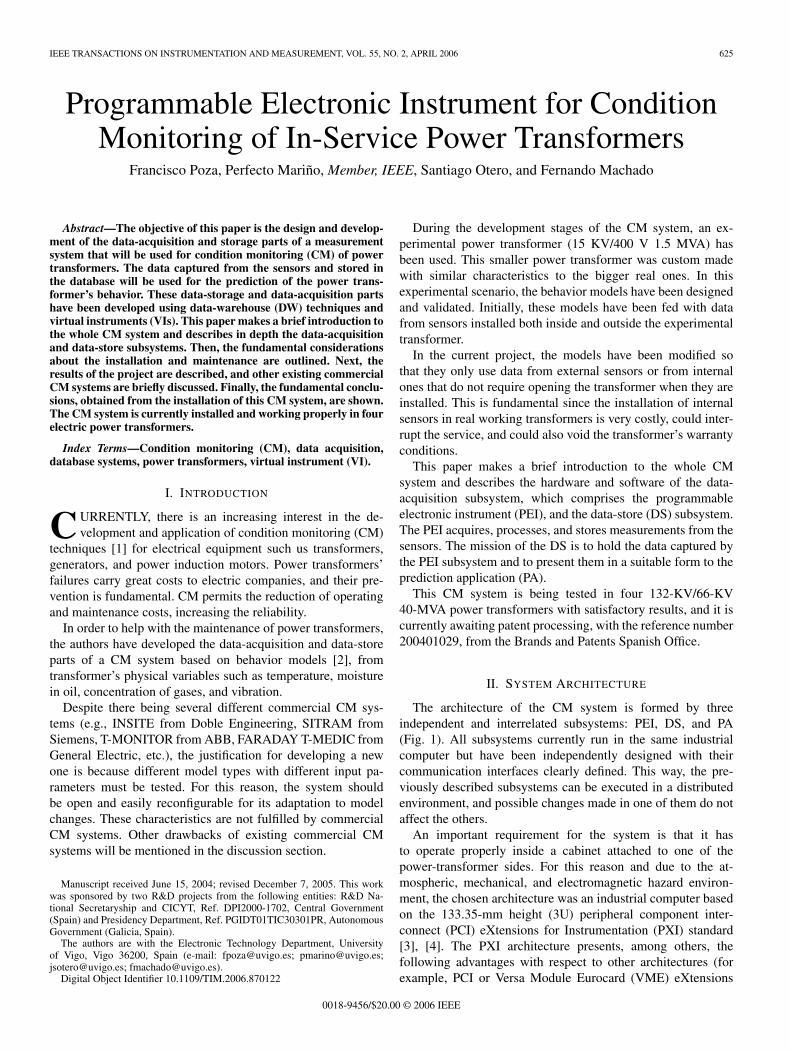
The architecture of the CM system is formed by threeindependent and interrelated subsystems: PEI, DS, and PA(Fig. 1). All subsystems currently run in the same industrialcomputer but have been independently designed with theircommunication interfaces clearly defined. This way, the pre-viously described subsystems can be executed in a distributedenvironment, and possible changes made in one of them do notaffect the others.
An important requirement for the system is that it hasto operate properly inside a cabinet attached to one of thepower-transformer sides. For this reason and due to the at-mospheric, mechanical, and electromagnetic hazard environ-ment, the chosen architecture was an industrial computer basedon the 133.35-mm height (3U) peripheral component inter-connect (PCI) eXtensions for Instrumentation (PXI) standard[3], [4]. The PXI architecture presents, among others, thefollowing advantages with respect to other architectures (forexample, PCI or Versa Module Eurocard (VME) eXtensions
0018-9456/$20.00 © 2006 IEEE
626 IEEE TRANSACTIONS ON INSTRUMENTATION AND MEASUREMENT, VOL. 55, NO. 2, APRIL 2006
Fig. 1. Architecture of the CM system.
for Instrumentation (VXI) [5]): small, compact, and ruggedindustrial Eurocard packaging, high-performance InternationalElectrotechnical Commission (IEC) connectors, specific cool-ing, and extended environmental requirements (temperature,humidity, IP level, etc.), low cost, multiple vendors, etc.
As was already described, the three subsystems are executedin the same computer, and as a result, they share the hardwareand software elements described next. The hardware core isbased on a PXI-1002 chassis inside which the NI-8176 embed-ded controller is housed (both from National Instruments). Theembedded controller is based on a Pentium-III microprocessorrunning at 1.26 GHz, with 512 MB RAM and 16 GB of harddisk storage. The operating system used is Microsoft’s W2000server.
Next, the PA subsystem will be briefly introduced and thedescription of the PEI and DS subsystems will be made inSections III and IV, respectively.
A. Prediction Application (PA)
The PA subsystem was developed by another investigationgroup. It is a monitoring system based on behavior models,so that the failure conditions are obtained comparing a set ofmeasured variables with their threshold values. These thresholdvalues are adaptive (not fixed); therefore, they are calculatedusing the global operating conditions of the power transformer.
The PA is basically a software application developed usingthe Visual C++ programming environment [6]. Several equa-tions have been used for making different mathematical modelsof the power transformer. These models simulate the powertransformer’s behavior under environmental and internal con-ditions like temperature [7], concentration of gases, moisturein oil, and vibrations [8]. This subsystem works with the mea-surements stored in the DS subsystem in two ways. First, themeasurements obtained from the power transformer are usedto carry out the tuning of the behavior mathematical models.This is done adjusting the different coefficients used in themathematical equations. Of course, for the correctness of thisstep, it is necessary that the power transformer is working fine.Once this tuning has been done, this subsystem is continuouslycomparing, in real time, the data measured and the valuescomputed by the models. In the case of significant variations
between them, the corresponding alarm will be triggered, and awarning message will be sent to the maintenance department.
III. PROGRAMMABLE ELECTRONIC INSTRUMENT (PEI)
The PEI subsystem carries out the measurement, processing,and storage of variables from the power transformer. The hard-ware used in this subsystem includes a set of sensors, precon-ditioning and conditioning equipment, and a data-acquisitioncard. The software is a custom-made virtual instrument (VI).These elements are described more in depth below.
A. Sensors
The CM system, developed for power-transformer monitor-ing, uses 26 external sensors: 17 analog and nine digital.
There are four PT100 sensors for the temperature measure-ment. The reference of all these PT100 is IEC60751, and theyhave a temperature coefficient α = 0.00385055 C−1. One isused for measuring the ambient temperature. The other two areused for measuring the temperature of the refrigeration oil in thebottom and top parts of the power transformer. The last one isencapsulated in the same probe with the capacitive hygrometer,which will be discussed next, and measures the temperatureinside the refrigeration-oil tank.
The current through the power transformer is measured atfour points using four current transducers. These current trans-ducers are intensity transformers specially designed for currentmeasurement. Three of them are used to measure the currents inthe R, S, and T phases of the power transformer’s high-voltageside. The nominal coil current ratio in amperes for these threesensors is 300/5. In the low-voltage side, only the current acrossthe S phase is measured. The current ratio in amperes for thisintensity measurement transformer is 400/5.
In the same way, four voltage transducers are used formeasuring the voltage in the R, S, and T phases of the high-voltage side and in the S phase of the low-voltage powertransformer’s side. These voltage transducers are voltage trans-formers specially designed for voltage measurement. Thenominal primary-to-secondary coil voltage ratios in volts are132 000/
√3 to 110/
√3 for high-voltage transformers and
66 000/√
3 to 110/√
3 for the low-voltage transformer.For the measurement of the transformer core vibrations, three
piezoelectric accelerometers are used. These small accelerom-eters are located in the lower side of the transformer’s oil tank,just under each phase, and have a sensitivity ranging from 1.006to 1.043 pC/ms−2.
The moisture in the refrigeration oil is measured with a thin-film capacitive sensor working like a hygrometer. The operationprinciple of this sensor is based on capacitance changes whenthe polymer thin film adsorbs water molecules. This sensorand one of the PT100’s, as aforementioned, are encapsulatedtogether in the same probe, which is immersed in the oil.
The last analog sensor is used for measuring the concen-tration of H2 and CO gases dissolved in the transformer’srefrigeration oil.
Finally, the nine digital sensors monitor the status of thehigh-voltage switch, oil pumps, and air fans of the power
POZA et al.: PROGRAMMABLE ELECTRONIC INSTRUMENT FOR POWER-TRANSFORMER CONDITION MONITORING 627
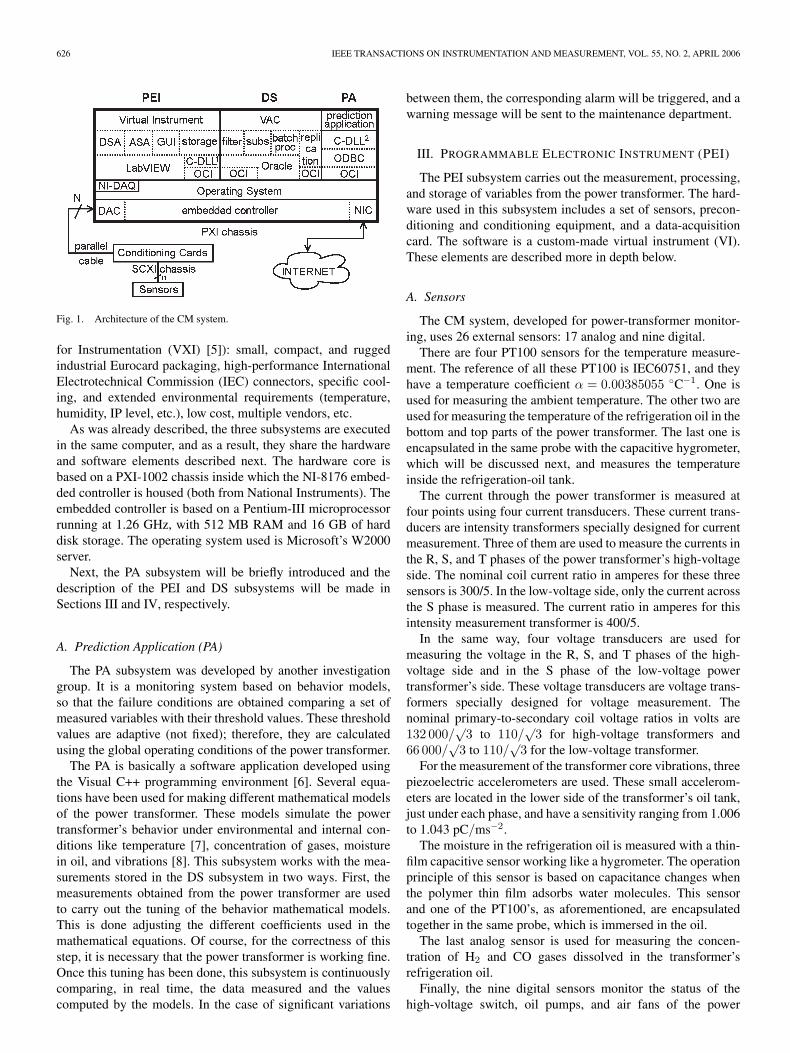
Fig. 2. Placement of sensors in the monitored power transformer.
transformer. These sensors are free voltage relay contacts thatshow the ON or OFF status of the aforementioned elements.
B. Preconditioning Equipment
Some of the previously described analog sensors havespecific commercial preconditioning equipment. Other analogsensors have needed custom-made preconditioning printedcircuit board (PCB) that have been designed according to theirspecifications.
Thus, the NEXUS equipment from Brüel&Kjaer is usedto convert the charge measurement from the piezoelectric ac-celerometers to a voltage signal ranging from −3.16 to 3.16 V.The DOMINO equipment from Doble Engineering suppliestwo analog 4–20-mA-current signals [9]. One of them is pro-portional to the moisture measurement from the capacitivehygrometer in percent of relative saturation (RS), ranging from0% to 100%. The other is proportional to the temperature of theoil that surrounds the capacitive hygrometer and ranges from−40 to 180 C. Finally, the HYDRAN equipment from GESyprotec supplies a 4–20-mA-current signal proportional to theconcentration of gases (ranging from 0 to 2000 ppm) measuredby its built-in sensor.
In addition, several specific PCB HALL cards with Hall-effect sensors have been designed. These cards isolate andcondition the voltage and current signals from the voltage andcurrent measurement transformers, attached in high- and low-voltage sides of the power transformer. The current and voltageoutputs from these sensors are 5 A and 110/
√3 V, respectively.
These values are out of the selected conditioning cards’ inputrange. Therefore, two types of Hall-effect sensors were usedfor current and voltage measures. The first supplies a nominalcurrent of 20 mA when a nominal current of 5 A is applied toits input. The second supplies also a nominal current of 20 mAwhen a nominal voltage of 110/
√3 V is applied to its input.
These two current signals are 50-Hz ac signals proportional tothe instant value of the original current and voltage.
The location in the power transformer of some of the sensorsand preconditioning equipment is depicted in Fig. 2.
C. Conditioning Equipment
For the final conditioning of the signals supplied by thedifferent sensors and preconditioning equipment, one four-slotSignal Conditioning eXtensions for Instrumentation (SCXI)-
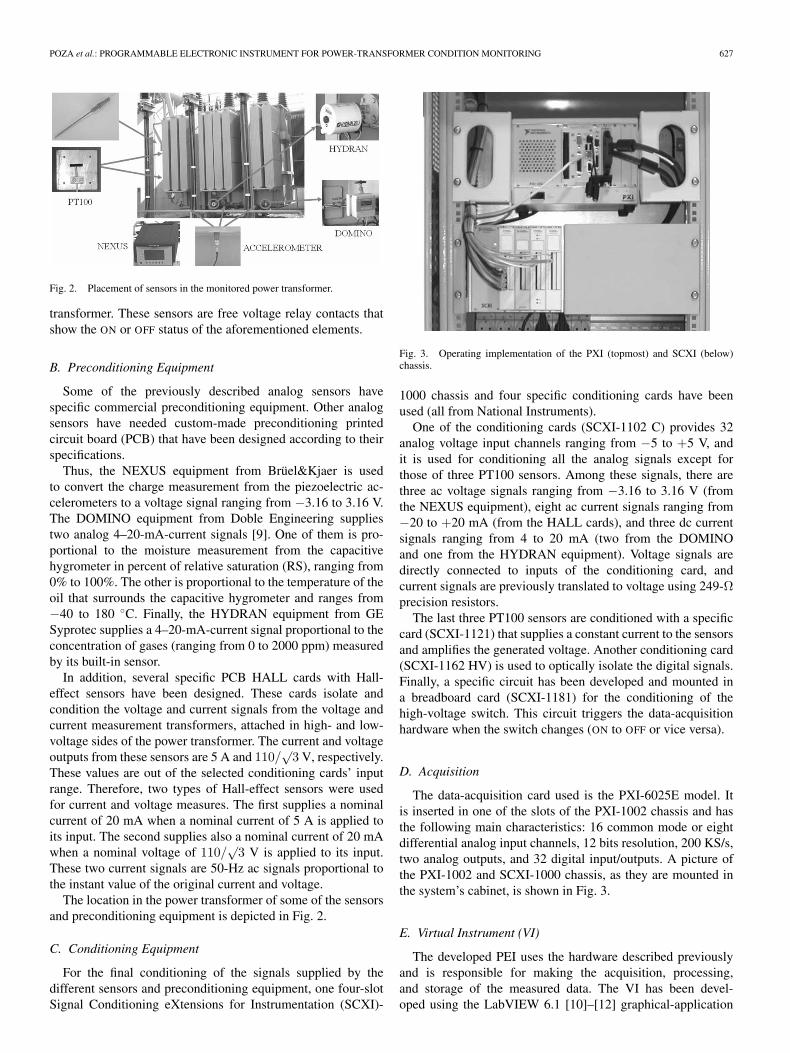
Fig. 3. Operating implementation of the PXI (topmost) and SCXI (below)chassis.
1000 chassis and four specific conditioning cards have beenused (all from National Instruments).
One of the conditioning cards (SCXI-1102 C) provides 32analog voltage input channels ranging from −5 to +5 V, andit is used for conditioning all the analog signals except forthose of three PT100 sensors. Among these signals, there arethree ac voltage signals ranging from −3.16 to 3.16 V (fromthe NEXUS equipment), eight ac current signals ranging from−20 to +20 mA (from the HALL cards), and three dc currentsignals ranging from 4 to 20 mA (two from the DOMINOand one from the HYDRAN equipment). Voltage signals aredirectly connected to inputs of the conditioning card, andcurrent signals are previously translated to voltage using 249-Ωprecision resistors.
The last three PT100 sensors are conditioned with a specificcard (SCXI-1121) that supplies a constant current to the sensorsand amplifies the generated voltage. Another conditioning card(SCXI-1162 HV) is used to optically isolate the digital signals.Finally, a specific circuit has been developed and mounted ina breadboard card (SCXI-1181) for the conditioning of thehigh-voltage switch. This circuit triggers the data-acquisitionhardware when the switch changes (ON to OFF or vice versa).
D. Acquisition
The data-acquisition card used is the PXI-6025E model. Itis inserted in one of the slots of the PXI-1002 chassis and hasthe following main characteristics: 16 common mode or eightdifferential analog input channels, 12 bits resolution, 200 KS/s,two analog outputs, and 32 digital input/outputs. A picture ofthe PXI-1002 and SCXI-1000 chassis, as they are mounted inthe system’s cabinet, is shown in Fig. 3.
E. Virtual Instrument (VI)
The developed PEI uses the hardware described previouslyand is responsible for making the acquisition, processing,and storage of the measured data. The VI has been devel-oped using the LabVIEW 6.1 [10]–[12] graphical-application

628 IEEE TRANSACTIONS ON INSTRUMENTATION AND MEASUREMENT, VOL. 55, NO. 2, APRIL 2006
Fig. 4. Four processes running within the PEI.
development environment from National Instruments. It isa multithreaded application where four processes are beingexecuted concurrently (Fig. 4).
One is the graphical user interface (GUI) that allows thesetting of all parameters related to the data storage (data sourcename, user, and password) and data acquisition (acquisitionperiod, sampling rate, number of samples, sensors that must beacquired, etc.) and also displays the different measured signals(Fig. 5).
A second process performs the acquisition of the analogsignals. For all the analog sensors (actually 17), 4000 samplesare acquired with a sampling rate of 4 kS/s. The intervalbetween acquisitions can be configured by the user through theGUI and currently is preset to 2.5 min. In order to satisfy the PAsubsystem requirements, a set of 25 different measurements areextracted from these 17 analog sensors. These measures are di-vided in two groups: fast and slow. For the fast ones (vibrations,voltages, and currents), it is necessary to calculate the frequencyspectrum using the discrete Fourier transform (DFT) and,therefore, to store the 50-Hz harmonics from 100 to 800 Hz.For the slow sensors, root mean square (RMS) values (voltages
Fig. 5. PEI GUI.
and currents) and mean values (temperatures, moisture in oil,and concentration of gases) are calculated. All these operationsare carried out using LabVIEW’s mathematical VIs.
POZA et al.: PROGRAMMABLE ELECTRONIC INSTRUMENT FOR POWER-TRANSFORMER CONDITION MONITORING 629
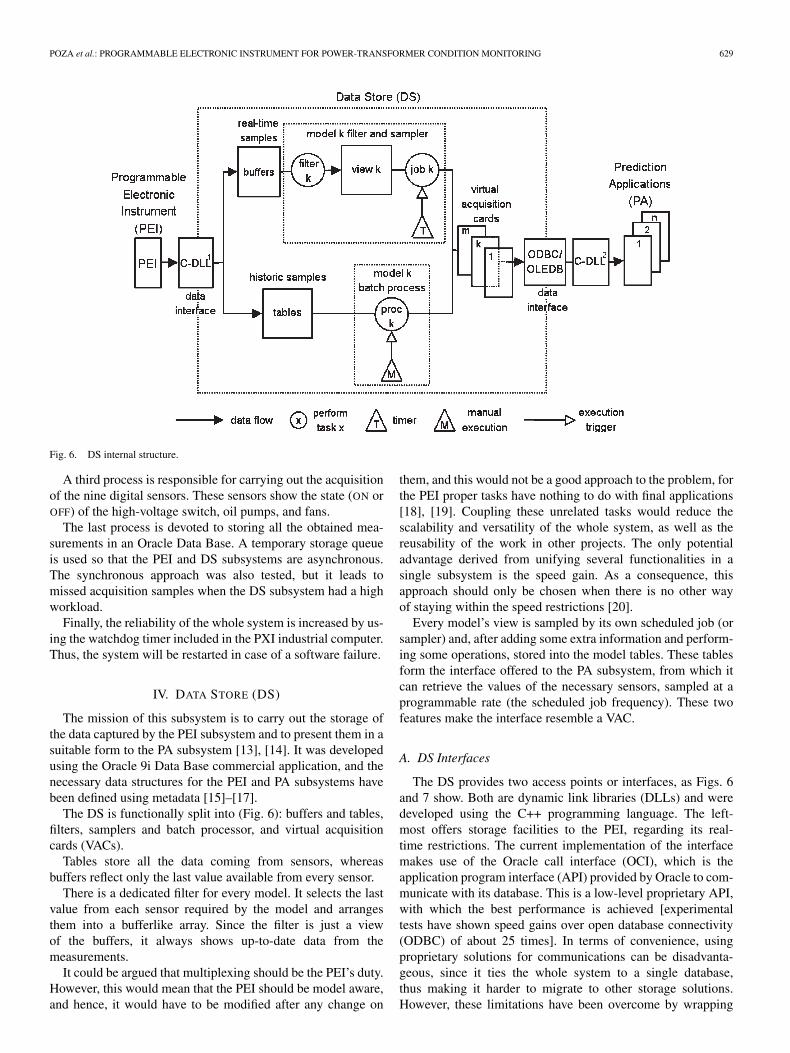
Fig. 6. DS internal structure.
A third process is responsible for carrying out the acquisitionof the nine digital sensors. These sensors show the state (ON orOFF) of the high-voltage switch, oil pumps, and fans.
The last process is devoted to storing all the obtained mea-surements in an Oracle Data Base. A temporary storage queueis used so that the PEI and DS subsystems are asynchronous.The synchronous approach was also tested, but it leads tomissed acquisition samples when the DS subsystem had a highworkload.
Finally, the reliability of the whole system is increased by us-ing the watchdog timer included in the PXI industrial computer.Thus, the system will be restarted in case of a software failure.
IV. DATA STORE (DS)
The mission of this subsystem is to carry out the storage ofthe data captured by the PEI subsystem and to present them in asuitable form to the PA subsystem [13], [14]. It was developedusing the Oracle 9i Data Base commercial application, and thenecessary data structures for the PEI and PA subsystems havebeen defined using metadata [15]–[17].
The DS is functionally split into (Fig. 6): buffers and tables,filters, samplers and batch processor, and virtual acquisitioncards (VACs).
Tables store all the data coming from sensors, whereasbuffers reflect only the last value available from every sensor.
There is a dedicated filter for every model. It selects the lastvalue from each sensor required by the model and arrangesthem into a bufferlike array. Since the filter is just a viewof the buffers, it always shows up-to-date data from themeasurements.
It could be argued that multiplexing should be the PEI’s duty.However, this would mean that the PEI should be model aware,and hence, it would have to be modified after any change on
them, and this would not be a good approach to the problem, forthe PEI proper tasks have nothing to do with final applications[18], [19]. Coupling these unrelated tasks would reduce thescalability and versatility of the whole system, as well as thereusability of the work in other projects. The only potentialadvantage derived from unifying several functionalities in asingle subsystem is the speed gain. As a consequence, thisapproach should only be chosen when there is no other wayof staying within the speed restrictions [20].
Every model’s view is sampled by its own scheduled job (orsampler) and, after adding some extra information and perform-ing some operations, stored into the model tables. These tablesform the interface offered to the PA subsystem, from which itcan retrieve the values of the necessary sensors, sampled at aprogrammable rate (the scheduled job frequency). These twofeatures make the interface resemble a VAC.
A. DS Interfaces
The DS provides two access points or interfaces, as Figs. 6and 7 show. Both are dynamic link libraries (DLLs) and weredeveloped using the C++ programming language. The left-most offers storage facilities to the PEI, regarding its real-time restrictions. The current implementation of the interfacemakes use of the Oracle call interface (OCI), which is theapplication program interface (API) provided by Oracle to com-municate with its database. This is a low-level proprietary API,with which the best performance is achieved [experimentaltests have shown speed gains over open database connectivity(ODBC) of about 25 times]. In terms of convenience, usingproprietary solutions for communications can be disadvanta-geous, since it ties the whole system to a single database,thus making it harder to migrate to other storage solutions.However, these limitations have been overcome by wrapping
630 IEEE TRANSACTIONS ON INSTRUMENTATION AND MEASUREMENT, VOL. 55, NO. 2, APRIL 2006
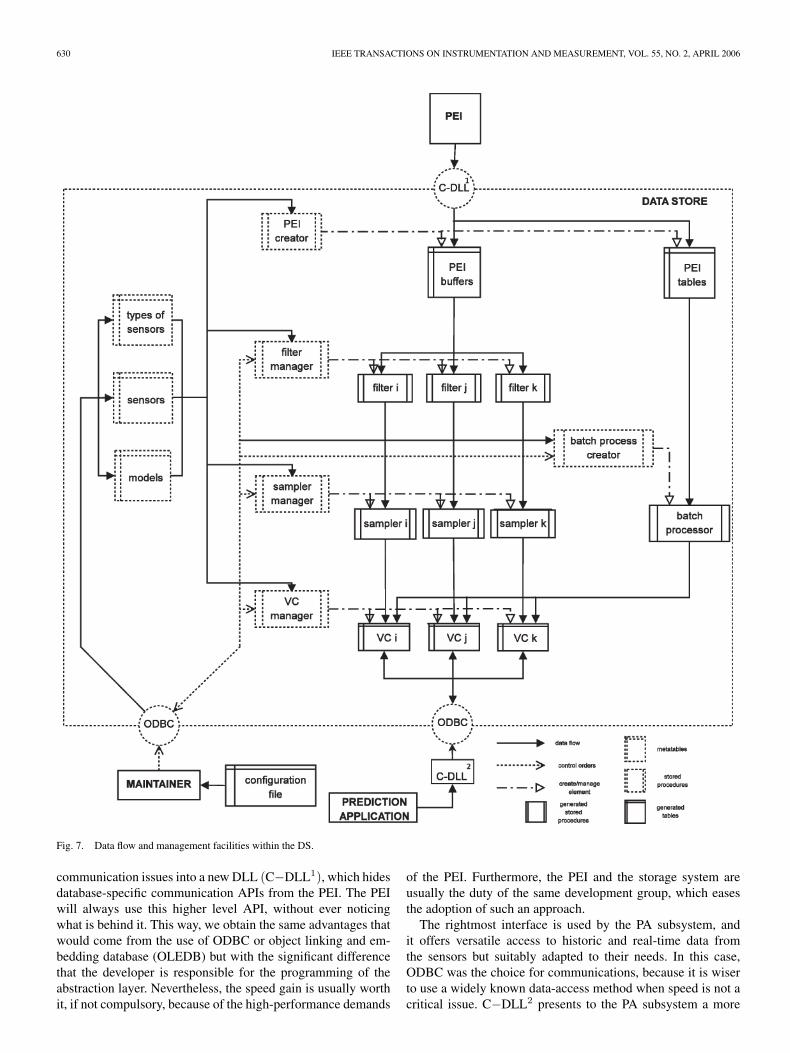
Fig. 7. Data flow and management facilities within the DS.
communication issues into a new DLL (C−DLL1), which hidesdatabase-specific communication APIs from the PEI. The PEIwill always use this higher level API, without ever noticingwhat is behind it. This way, we obtain the same advantages thatwould come from the use of ODBC or object linking and em-bedding database (OLEDB) but with the significant differencethat the developer is responsible for the programming of theabstraction layer. Nevertheless, the speed gain is usually worthit, if not compulsory, because of the high-performance demands
of the PEI. Furthermore, the PEI and the storage system areusually the duty of the same development group, which easesthe adoption of such an approach.
The rightmost interface is used by the PA subsystem, andit offers versatile access to historic and real-time data fromthe sensors but suitably adapted to their needs. In this case,ODBC was the choice for communications, because it is wiserto use a widely known data-access method when speed is not acritical issue. C−DLL2 presents to the PA subsystem a more
POZA et al.: PROGRAMMABLE ELECTRONIC INSTRUMENT FOR POWER-TRANSFORMER CONDITION MONITORING 631
suitable interface for data storage and retrieval than ODBCdoes. For the same reason, ODBC is also used by the maintainerapplication (Fig. 7).
B. Reconfigurability
The data-transformation stage is a critical part of any datawarehouse (DW), since it usually determines the overall perfor-mance of the system. It is also very important to keep scalabilityand extensibility in mind during the design stage, for the DWis likely to require additional features and raw power as theapplication processing needs grow. With this goal in mind, thesystem was designed so that it could be easily reconfigured atrun time.
The characteristics of filters, the frequency of samplers, andthe structure of the VACs can be easily reconfigured by meansof procedural language/structured query language (PL/SQL)stored procedures in the DS (look for the managers in Fig. 7).These procedures are to be called by the maintainer application(which could be the PA itself), although the prediction-algorithm designer could also create a text file (suitably for-matted) describing the configuration of the VACs, which wouldbe batch processed by an application provided by the system toload the new settings into the database.
C. Virtual Acquisition Cards (VACs)
The views are periodically sampled by scheduled jobs, whosefrequency is suitably configured after the prediction models’needs. In fact, the DS allows every model to have its own sam-pling frequency, since the samplers are dedicated and indepen-dent of each other. Some identifying information, such as thesampling instant, a sequence identifier, and the current samplerate, are added to data from sensors. Thus, the applicationsare provided with a powerful search engine from which theycan retrieve meaningful information about the conditions underwhich the data stream was obtained.
The resulting array of information is introduced into themodel tables, which are accessed by the final applications tofeed their prediction models. The models need some tuning be-fore bringing useful results. This adjustment is made establish-ing adequate coefficients for every model. These coefficients,as well as some other related data, are stored in tables in the DSitself. Of course, these tables are the exclusive responsibility ofthe final applications, and thus, they have complete access tothem, as opposed to the sensor tables, whose management theDS is completely responsible for. As a result, models have read-only access to sensor tables and complete access to any other.
As has already been said, models have access to the rawhistoric data introduced from the PEI. However, this accessis indirect, since the raw data means nothing to models, andthe DS is supposed to offer clean and ready-to-use data. Forthis purpose, sensor tables are batch processed to fill the modeltables.
After receiving orders from the maintainer application, thebatch processor (Figs. 6 and 7) picks from the PEI tables all therows corresponding to sensors needed by the VAC of choice(which is to say the model of choice). Once the entries have
been sorted by acquisition time, the resulting data stream issampled starting with the first samples in time, following a ratethat is configurable. The batch process ends when it reaches theend of the data stream or when the number of samples is limitedto a maximum, and it has been reached. Of course, the rowsin the PEI tables form a discrete stream, which is interpolatedusing a sample-and-hold (S/H) approach so that the softwaresample stage can be carried.
D. Metadata
One of the main achievements of the project is the ease of theinstallation and the maintenance processes of the DS, which isthe outcome of the use of metadata and stored procedures forthe generation of the software infrastructure [21].
There are several actors interacting with the DS (Fig. 7).
1) The installer is responsible for the installation process,which involves the creation of the software architecturewithin the database.
2) The maintainer makes use of the facilities created byinstaller to add new VACs to the system or to change theirconfiguration.
3) The final applications make use of the VACs created bythe maintainer.
E. Installation
During the installation process, the tables in which the meta-data are to be stored are created. These tables will be namedafter their functionality as metatables (see the left-hand side ofFig. 7).
One of the metatables keeps track of the list of sensorsinstalled in the power transformer, along with relevant infor-mation about them. Another stores the definition of the typesthe sensors are classified in. The remaining table is the one inwhich the definitions of the VACs are kept.
Several stored procedures (programmed using the PL/SQLlanguage) are installed during this stage. They are used togenerate and modify the VACs and their underlying softwarearchitecture. For this purpose, they use the VAC definitionsstored in the metatables (check for the stored procedures inFig. 7). Following a previous criterion, the stored procedureshave been called metaprocedures.
F. Maintenance
The maintainer makes use of the metaprocedures to createand configure the VACs. The process is carried out as follows.
1) First, the list of sensors measuring the state of the powertransformers along with relevant data associated is storedin the sensor and sensor-type tables.
2) Under the final application demands, the model tables arefilled with VAC definitions.
3) Once a VAC is defined, the maintainer triggers themetaprocedures so that, fed with the metadata, they createthe VACs and the supporting procedures (i.e., the filters
632 IEEE TRANSACTIONS ON INSTRUMENTATION AND MEASUREMENT, VOL. 55, NO. 2, APRIL 2006
Fig. 8. Daily variation of current (IAT_S) and temperature (TCS) of the power transformer.
and samplers). It should be noted that both the filters andthe samplers are created on the fly.
4) After the creation of a VAC, its life cycle continues withconfiguration tuning and definition changes.
5) The maintenance process of a VAC could eventuallyend if it is uninstalled. If so, the corresponding filterand sampler, as well as its description residing in themetatables, would also be deleted.
G. System Usage
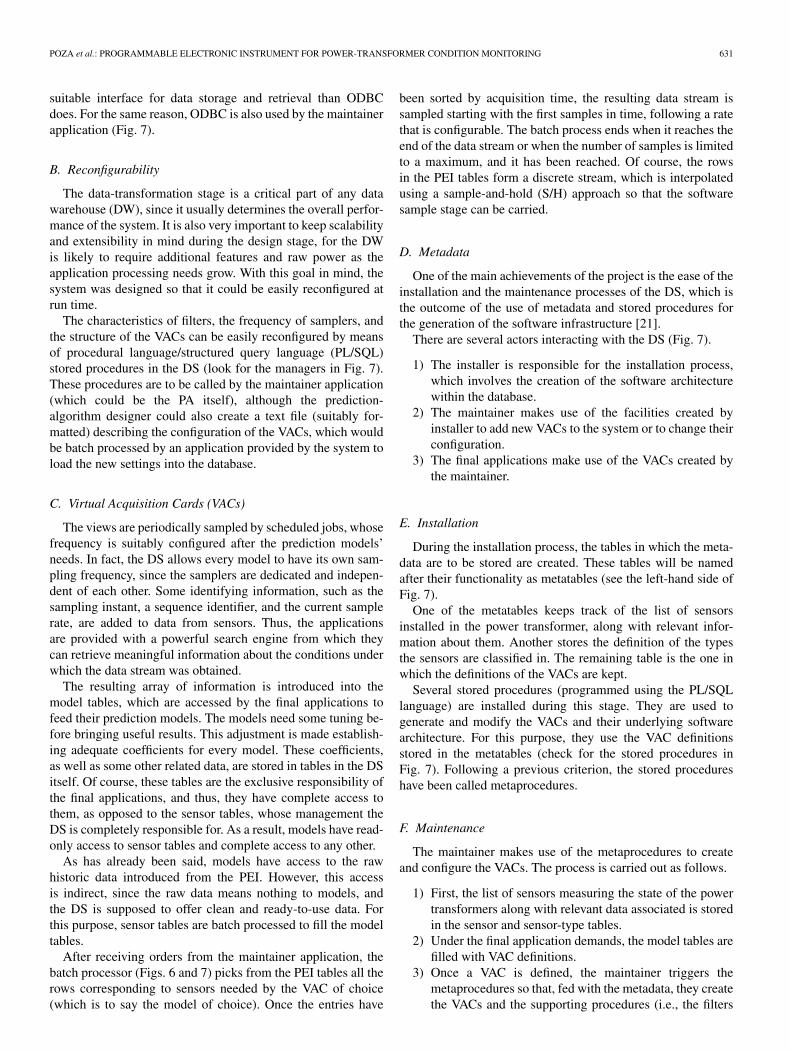
The PA has the VACs as its interface to the measurementsmade on the power transformers. The fact that VACs includemuch more than just samples from sensors along with the useof SQL for the queries makes them a powerful tool.
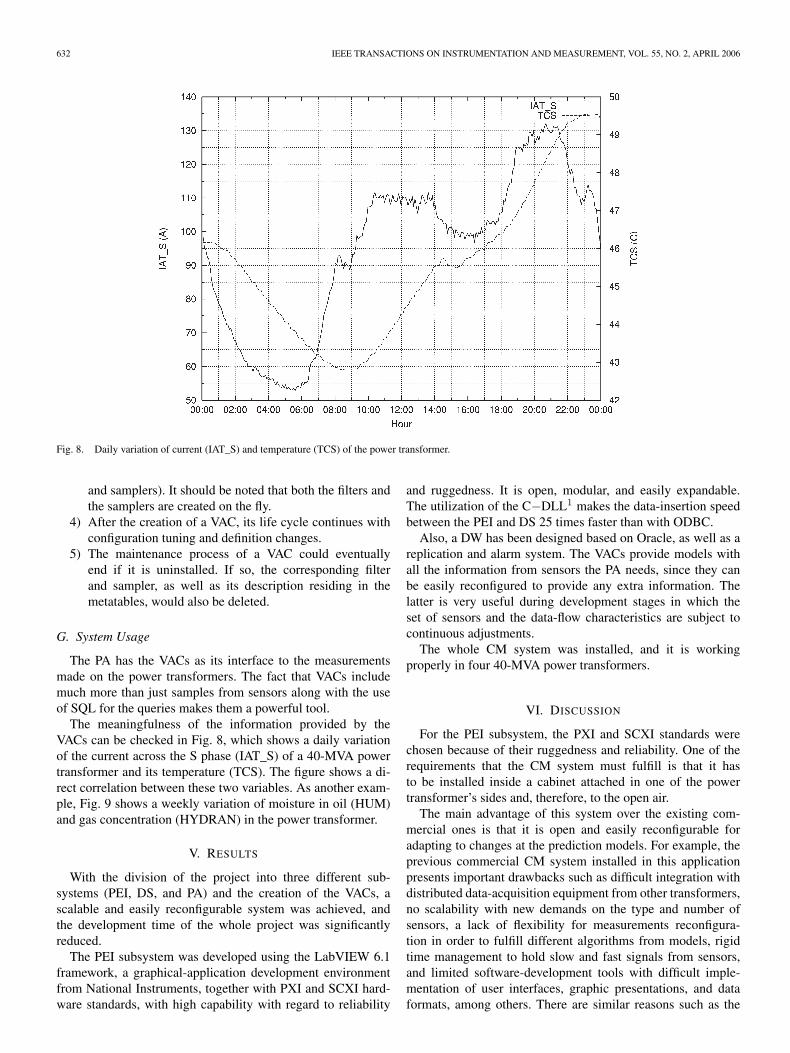
The meaningfulness of the information provided by theVACs can be checked in Fig. 8, which shows a daily variationof the current across the S phase (IAT_S) of a 40-MVA powertransformer and its temperature (TCS). The figure shows a di-rect correlation between these two variables. As another exam-ple, Fig. 9 shows a weekly variation of moisture in oil (HUM)and gas concentration (HYDRAN) in the power transformer.
V. RESULTS
With the division of the project into three different sub-systems (PEI, DS, and PA) and the creation of the VACs, ascalable and easily reconfigurable system was achieved, andthe development time of the whole project was significantlyreduced.
The PEI subsystem was developed using the LabVIEW 6.1framework, a graphical-application development environmentfrom National Instruments, together with PXI and SCXI hard-ware standards, with high capability with regard to reliability
and ruggedness. It is open, modular, and easily expandable.The utilization of the C−DLL1 makes the data-insertion speedbetween the PEI and DS 25 times faster than with ODBC.
Also, a DW has been designed based on Oracle, as well as areplication and alarm system. The VACs provide models withall the information from sensors the PA needs, since they canbe easily reconfigured to provide any extra information. Thelatter is very useful during development stages in which theset of sensors and the data-flow characteristics are subject tocontinuous adjustments.
The whole CM system was installed, and it is workingproperly in four 40-MVA power transformers.
VI. DISCUSSION
For the PEI subsystem, the PXI and SCXI standards werechosen because of their ruggedness and reliability. One of therequirements that the CM system must fulfill is that it hasto be installed inside a cabinet attached in one of the powertransformer’s sides and, therefore, to the open air.
The main advantage of this system over the existing com-mercial ones is that it is open and easily reconfigurable foradapting to changes at the prediction models. For example, theprevious commercial CM system installed in this applicationpresents important drawbacks such as difficult integration withdistributed data-acquisition equipment from other transformers,no scalability with new demands on the type and number ofsensors, a lack of flexibility for measurements reconfigura-tion in order to fulfill different algorithms from models, rigidtime management to hold slow and fast signals from sensors,and limited software-development tools with difficult imple-mentation of user interfaces, graphic presentations, and dataformats, among others. There are similar reasons such as the
POZA et al.: PROGRAMMABLE ELECTRONIC INSTRUMENT FOR POWER-TRANSFORMER CONDITION MONITORING 633
Fig. 9. Variation of moisture in oil (HUM) and gas concentration (HYDRAN) in the power transformer during a week.
aforementioned that discarded different commercial CM sys-tems, e.g., INSITE from Doble Engineering, SITRAM fromSiemens, T-MONITOR from ABB, FARADAY T-MEDIC fromGeneral Electric, etc.
Another considered alternative for the software developmentof the PEI and the DS was the utilization of the standardobject linking and embedding (OLE) for process control (OPC).OPC is a set of interfaces [22]–[24] based on Microsoft’sOLE/component object model (COM) and distributed COM(DCOM) technologies. It provides a standard interface to theapplications in order to exchange data in a common format,regardless of the data source: sensor, programmable logic con-troller (PLC), datalogging and supervisory control (DSC), su-pervisory control and data acquisition (SCADA), database, etc.This solution was not adopted because any commercial OPCserver supporting the sample rate required by the PA subsystemwas found. For a set of sensors, the rate needed was about4000 samples per second, since there are models that need towork at the frequency domain with harmonics from the gridcircuit up to 800 Hz. The development of a custom-made OPCserver with the needed characteristics was discarded, becausethe main contribution of the OPC technology is to allow severalclients to interact with the same server; in the CM system, theonly client would be the DS.
VII. CONCLUSION
After having installed four clone CM systems, the authorshave come to the following conclusions.
1) The division of the CM system into three decoupledsubsystems (PEI, DS, and PA) has simplified their paralleldevelopment by two fairly independent teams. The mod-
ularity of the system can allow the execution of thesubsystems in a distributed environment with no changes.
2) The use of the PXI and SCXI chassis enables the CM sys-tem to perform well in extreme and rugged environments.
3) The use of VACs greatly reduce the complexity andthe development time of PAs, since they are completelyreleased from preprocessing duties to get clean data andare able to focus on the prediction algorithm exclusively.Furthermore, VACs can be easily reconfigured to provideany extra information needed by the models. For thesame reason, the development stages of the forecastingalgorithms, in which the set of sensors and the samplingcharacteristics have not yet been established, speed up.Also, the modularity of the system and the easy configu-ration of new VAC cards make the installation of new CMsystems a really simple task.
4) The PEI and DS subsystems can be easily modified andreconfigured for adapting to the CM of other equip-ment that need the measurement of variables captured bysensors.
REFERENCES
[1] Y. Han and Y. H. Song, “Condition monitoring techniques for electricalequipment—A literature survey,” IEEE Trans. Power Del., vol. 18, no. 1,pp. 4–13, Jan. 2003.
[2] H. T. Grimmelius et al., “Three state-of-the-art methods for conditionmonitoring,” IEEE Trans. Ind. Electron., vol. 46, no. 2, pp. 407–416,Apr. 1999.
[3] E. Starkloff, T. Fountain, and G. Black, “The PXI modular instrumen-tation architecture,” in Proc. Int. Test Conf. (ITC), Charlotte, NC, 2003,pp. 156–165.
[4] PXI Specification. PCI eXtensions for Instrumentation. An Implementa-tion of CompactPCI, PXI Systems Alliance, San Diego, CA, Jul. 2000.revision 2.0.
634 IEEE TRANSACTIONS ON INSTRUMENTATION AND MEASUREMENT, VOL. 55, NO. 2, APRIL 2006
[5] IEEE Standard for VMEbus Extensions for Instrumentation: VXIbus,IEEE Std 1155, 1992.
[6] Data Acquisition and Control Handbook, Keithley Instruments Inc.,Cleveland, OH, 2001.
[7] B. García, J. C. Burgos, O. Bellón, J. Sanz, A. Alonso, J. Gardy,A. Ramos, E. Pérez, and J. Jiménez, “Temperature modeling for powertransformers monitoring,” Energy Computation, vol. 18, pp. 61–67, 2002,Cali, Colombia.
[8] B. García, J. C. Burgos, and A. Ramos, “Experiences in using thermal andvibration models as a diagnostic method of power transformers,” in Proc.CIGRE Transformer Colloq., Merida, México, 2003, pp. 183–188.
[9] P. Mariño, Enterprise-Wide Communications: Standards, Networksand Services. 2nd Edition Enhanced and Extended, 2003, Madrid, Spain:RA-MA.
[10] LabVIEW Measurements Manual, National Instruments Corp., Austin,TX, 2001. July 2000 ed., part no.: 322661A-01.
[11] LabVIEW User Manual, National Instruments Corp., Austin, TX, 2001.Jul. 2000 ed., part no.: 320999C-01.
[12] B. Mihura, LabVIEW for Data Acquisition, ser. National InstrumentsVirtual Instrumentation Series. Upper Saddle River, NJ: Prentice-Hall,2001.
[13] B. Devlin, Data Warehouse: From Architecture to Implementation.Reading, MA: Addison-Wesley, 1997.
[14] W. Inmon, Building the Datawarehouse. New York: Wiley, 1993.[15] P. Mariño, C. Sigüenza, J. Nogueira, F. Poza, and M. Domínguez,
“A reusable distributed software architecture driven by metadata,” inProc. Asia Pacific Software Engineering Conf., Takamatsu, Japan, 1999,pp. 246–249.
[16] ——, “Metadata driven data paths: Improving data warehouse plumbing,”in Proc. IASTED Int. Conf. Applied Informatics, Innsbruck, Austria, 2000,pp. 640–645.
[17] ——, “An event driven software architecture for enterprise wide datasource integration,” in Proc. Conf. Information Technology: Coding andComputing, Information Technology, Las Vegas, NV, 2000, pp. 140–145.
[18] H. Kopetz, Real Time Systems: Design Principles for DistributedEmbedded Applications. Boston, MA: Kluwer, 1997.
[19] E. Weyuker and F. Vokolos, “Experience with performance testing of soft-ware systems: Issues, an approach, and case study,” IEEE Trans. Softw.Eng., vol. 26, no. 12, pp. 1147–1156, Dec. 2000.
[20] T. Johnson, “Approximate analysis of reader/writer queues,” IEEE Trans.Softw. Eng., vol. 21, no. 3, pp. 209–218, Mar. 1995.
[21] D. Cowan and C. Lucena, “Abstract data views: An interface specificationconcept to enhance design for reuse,” IEEE Trans. Softw. Eng., vol. 21,no. 3, pp. 229–243, Mar. 1995.
[22] F. Iwanitz and J. Lange, OPC Fundamentals, Implementation and Appli-cation. Heidelberg, Germany: Hüthig Verlag, 2002. 2nd revision.
[23] R. Kondor, “Understanding OPC basics for new users,” The IndustrialEthernet Book, pp. 16–20, Mar. 2004.
[24] M. Leroux, “Staying in control: Industrial Ethernet and the enterprise,”The Industrial Ethernet Book, pp. 26–28, Mar. 2004.
Francisco Poza received the Ph.D. degree in elec-tronic engineering from the University of Vigo, Vigo,Spain, in 1997.
He is an Associate Professor in the ElectronicTechnology Department, University of Vigo. He isalso a Researcher of Digital Communications Di-vision from the Electronic Technology Department,University of Vigo.
Perfecto Mariño (M’95) received the Ph.D. de-gree in telecommunications engineering from thePolytechnic University of Madrid, Madrid, Spain, in1984.
In 1988, he was a Visiting Scientist in the Com-puter Science Department, Carnegie Mellon Uni-versity, Pittsburgh, PA. Since 1993, he has beena Professor in the Electronic Technology Depart-ment, University of Vigo, Vigo, Spain. He is alsothe Director of the Digital Communications Divi-sion from the Electronic Technology Department,
University of Vigo. He has been distinguished as an Expert on informa-tion technology by the Commission of the European Communities for theSPRINT (Luxembourg, 1991), COPERNICUS (Brussels, 1994), and ACTS(Brussels, 2002) programs. He served as General Manager of Communica-tions Technology and Information Society programs from the R&D Secretary(Autonomous Government Presidency, Galicia, Spain, 2002).
Santiago Otero received the M.S. degree in telecom-munications engineering from the University ofVigo, Vigo, Spain, in 2003.
Currently, he is a researcher with the Digital Com-munications Division, Electronic Technology De-partment, University of Vigo.
Fernando Machado received the M.S. degree intelecommunications engineering from the Universityof Vigo, Vigo, Spain, in 2000.
He is currently an Assistant Professor in the Elec-tronic Technology Department, University of Vigo.He is also a researcher with the Digital Communica-tions Division, Electronic Technology Department,University of Vigo.
Related Documents