1 PROGRAM REVIEW SELF STUDY MATHEMATICS Fall 2015

Welcome message from author
This document is posted to help you gain knowledge. Please leave a comment to let me know what you think about it! Share it to your friends and learn new things together.
Transcript

1
PROGRAM REVIEW SELF STUDY
MATHEMATICS
Fall 2015

2
1.1 Introduction. Introduce the program. Include the program’s catalogue description, its mission, the degrees and certificates offered, and a brief history of the program. Include the number and names of full-time faculty, adjunct faculty, and classified staff. Discuss any recent changes to the program or degrees (limit to 2-3 pages max). The mathematics department is one of the fundamental departments on campus. Most of the students at the college will take at least one mathematics class during their time at Solano. Traditionally math is both queen and servant of the sciences, for many of our students it is both the path that allows them access to their dreams and an obstacle in their way. Our mission is quite broad because we have both a large population of basic skills students we are remediating and we are a core part of STEM transfer programs. Our dual mission is difficult in its own right, but we are also challenged by a lack of adequate classroom space, a shortfall in the number of full-time faculty, a dearth of availability in adjunct faculty, fundamental changes in math curriculum at the high school level, the extra difficulties in teaching mathematics in an online environment, the growing numbers of disabled students who bring increasingly large challenges of their own to our classrooms, and the pace and complexity of the modern world which challenges all of our students to balance jobs, families, finances, and education. Our program’s description is as follows: Successful completion of this major will assure competence in mathematics through differential and integral calculus, providing an adequate background for employment in many technological and scientific areas as well as providing a firm foundation for students planning advanced study. We offer both an Associate in Arts Degree and an Associate in Science in Mathematics for Transfer which satisfies the mandates of SB 1440. The mathematics department started as a small department. In 1989 it saw its first growth to seven members when college readiness mathematics moved from the learning skills area to became part of the math department. In subsequent years we grew to have nineteen full-time faculty, but with retirees not being replaced we are now, as of Fall 2015, down to sixteen full-time faculty members. In 1989 students went straight from arithmetic to Math 305 (the first three chapters of elementary algebra) , the graduation requirement at that time. Since that time the graduation requirement has increased twice, first to the full elementary algebra course, and most recently to intermediate algebra. In the past students at the college had fewer required math courses and at the same time were better prepared for the courses they took. We have grappled with this in multiple ways. We changed our arithmetic classes from self-paced to lecture and have revised their content numerous times. We created a pre-algebra class between arithmetic and elementary algebra when our students were unable to make the transition successfully without it, and we have revised it several times as well. We created Math 112 as an alternative to Math 104. Math 112 serves as our intermediate algebra graduation requirement for our non-STEM students and an alternative pathway to Statistics and Liberal Arts math for our non-STEM

3
transfer students. In the 1990’s we received a Title III grant that gave us our first faculty computers and allowed us the time and support to embrace both the lean and lively movement in Calculus and pre-Calculus and the reform movement in intermediate algebra. Times changed and mathematics moved back to a more traditional bend, but some of both movements still flavor our courses today. The C-ID system is now changing how courses and programs articulate. The department is proud of how we have always maintained the standards and the content of our courses, so the C-ID process has been relatively painless. We have had to make small changes to some of our official course outlines to more clearly detail that items are covered in the required depth and breadth. However, the courses themselves did not have to change. We have had to make some modifications to the Statistics course since nationwide some of the emphases in the course are undergoing changes. Statewide there is also a real push in the basic skills area. That has been an ongoing process for the department for many years. We have created courses, modified courses, made self-paced versions, ended self-paced versions, created online and hybrid versions, adopted technology in courses, both removed and added calculators to courses, added study skills to courses, split courses into smaller pieces, and ended split courses, added guided notes to courses, added embedded tutors to courses, and experimented with supplemental instructors in courses. One of our big challenges in basic skills is proper placement into courses and we have created flow charts, worked with counseling, created a new Math 305, a summer bridge course to help with review and placement for students, and tried many other ways to improve it. But it still remains a significant issue. Part of the issue comes from our lack of full-time instructors and lack of classroom space, because sometimes it is apparent in the first week or so of a class that a student has been misplaced, but there are no spaces available in the more appropriate classes. There often haven’t been spaces available in the more appropriate classes for weeks or months, which may have led the student to try a class that was too high in the first place. We are proud of our Math Activities Center (MAC). It started in the early 1990’s and has been a valuable addition to the department since it opened. It opened on a shoestring budget with a little space and some equipment. We had to staff it with our basic skills para-educator and take most of the department’s reader money to pay for student workers. Neither of these resources were ever replaced, so our department lacks support staff in the basic skills and our faculty reader budget is smaller than it was when we had only six full-time instructors. Both of these deficits create additional unneeded challenges. Our students find the MAC an extremely helpful resource. It has space issues, so recently we had to remove access to the MAC for students in our highest transfer courses. We have also lost classified staffing in our MAC. We have been told that we will get half of one of our missing staff people back, but it has not yet materialized. Important one-on-one learning goes on in our Math Activities Center and we would like to ensure that this can continue and grow. Our MAC has grown more recently to include locations at both centers, but the budget and space it lacks are essential elements that foster student success. There is great potential to better assist student success with our MACs, but until we have more resources and space this growth will be severely limited.

4
One big change to our program will happen in the near future when students will be required to start taking their basic skills math courses starting in their first semester at Solano. This will be a big challenge for the department since our basic skills courses are often mostly filled before new students even have a chance to register. With fewer full-time faculty we have also seen a gradual shift away from full-time faculty teaching the lowest of our basic skills courses. Often in a semester we have just one or two full-time faculty teaching arithmetic and pre-algebra with the bulk of the load handled by adjunct faculty. We have some wonderful adjunct faculty members, but most are looking for full-time jobs and so our turnover is high and sometimes, like this semester, we unexpectedly lose adjunct faculty just before the semester starts and have to scramble to fill classes or cancel classes with a full enrollment of students. While the shift in full-time teaching can be traced partly to the lack of full-time faculty, it can also be traced to the lack of support in these classes. Some of these students are our most difficult students who have severe gaps in mathematical, social, and college skills. There are real teaching challenges in these classes that have not been addressed and are urgently in need of being addressed. Some of the fixes to basic skills may involve teaching more of the sequence in the same time slots to allow for easier movement of students to appropriate courses, but as we have already mentioned, we have a severe room shortage that prevents this. We do like to remember in the midst of our many challenges all the things that we do right. We have carefully constructed our curriculum so that when students start taking math courses they can progress smoothly from one course to the next. We uphold standards so that our transfer students are well prepared. We provide challenges and enrichment for our Calculus students so that they are ready for the demands of their futures. We build communities in our classrooms and in our MAC that enrich our students’ lives. As faculty we go the extra mile, adding extra students to classes when demand is high, constantly examining and changing how we teach to better serve our students, being available to them when needed, trying hard to accommodate the conflicts between our students lives as students and as people, adapting to new technologies, and fitting in the ever increasing out-of-classroom demands without sacrificing what we do for our students. Growing the mathematical skills of our students changes their lives and that is something we proudly accomplish everyday. As of Fall 2015, there are sixteen full-time faculty members: Darryl Allen, Kevin Brewer, Joseph Conrad, Sarah Donovan, Carlos Esteve, Thomas Grube, Susanna Gunther, Zachary Hannan, Alan Jian, Corrine Kirkbride, Will Martinelli, Svetlana Podkolzina, Genele Rhoads, Randy Robertson, Kheck Sengmany, and Barbara Villatoro. There are forty-seven adjunct faculty members: Jennifer Aguayo Vazquez, Matthew Allen, Joseph Almeida, Benjamin Bennett-Cauchon, Otto Bischof, Andrew Bloom, Madison Butts, Daniel Calef, Michael Challender, George Daugavietis, Christopher Fioritto, Ekaterina Fuchs, Sean Gregory, Ronald Harrow, Scott Immel, Tracey Johnson, Michieal Jones, Richard Kaeser,

5
Thomas Kim, Oanh Lam, Henry Lantzy, Robert Lombard, Rebecca Lum, Mark Lydon, Khalid Mahmood, Shaw Matthews, Gegham Melkonyan, Marion Mircheva, Farzan Riazati, Hector Rodriguez, Thomas Rutaganira, Loretta Scheu, Calvin Schmall, Glenn Scott, Robert Scott, Pamela Sheehan, Ashley Shimabuku, Slawomir Sieminski, Jennifer Smith, Somayeh Sohi, Domingo Soria Martin, Lawrence Sturgeon, Mary Valch, Newton Wai, Qiang Wang, Michael Watson, and Dmitriy Zhiv. There is one administrative assistant for the Mathematics Department: Danielle Gonzales and one classified staff person for the Math Activities Center: Doug Pierce. 1.2 Relationship to College Mission and Strategic Goals. Describe the program’s relationship to the overall mission of the college: “Solano Community College educates an ethnically and academically diverse student population drawn from our local communities and beyond. We are committed to help our students to achieve their educational, professional and personal goals centered on thoughtful curricula in basic skills education, workforce development and training, and transfer level education. The College accomplishes this three-fold mission through its dedicated teaching, innovative programs, broad curricula, and services that are responsive to the complex needs of all students.” The math department supports the overall mission of the college by degree-level math classes that are transferable to four-year institutions and an approved Associate Degree for Transfer (ADT). In addition to transferable classes, the department offers many basic skills classes. Many students arrive at SCC without a comprehensive or a solid foundation of high school level math skills. Our basic skills classes (Math 310, 320, 330) offer students a chance to learn the mathematical knowledge and critical thinking skills needed in Science, Technology, Engineering, and higher level Mathematics (STEM) courses. Using the matrix provided in Table 1, describe which of SCC’s Strategic Directions and Goals the program supports. Address only the goals relevant to the program. Limit evidence to one paragraph per objective. Table 1. SCC’s Strategic Directions and Goals
Goal 1: Foster Excellence in Learning
Obj. 1.1 Create an environment that is conducive to student learning Program Evidence: The Math Activity Center (MAC) provides a space at each campus for students to

6
work on homework and assignments designed for the MAC. There is an instructor present for students to ask questions. The tables are oriented to promote group collaboration. Several of the basic skills classes have an embedded tutor. There are a number of programs on campus that the math department works with such as First Year Experience, Puente, UMOJA, and Mathematics, Engineering, Science Achievement (MESA). There is a Math Club in which students participate. We offer courses in different modalities including online and hybrid and have offered different versions of a math refresher course.
Obj. 1.2 Create an environment that supports quality teaching Program Evidence: We have had weekly workshops called “Teacher Talks” where faculty share activities, information, or advice on various teaching topics. Many of our faculty are involved in professional organizations such as California Math Council Community Colleges (CMC^3), AMATYC, Math Educators of Solano County (MESC). Many teaching resources have been loaded onto My Groups, including sample course syllabi, MAC assignments, class pacing schedules and other shared documents.
Obj. 1.3 Optimize student performance on Institutional Core Competencies Program Evidence: I. Communication II. Critical Thinking and Information Competency III. Global Awareness By nature of our subject, the math department focuses on Competency II. All our courses seek to meet this goal. We also have a communication component to our PLOs where we seek to have students communicate the solutions of their problems effectively.
Goal 2: Maximize Student Access & Success
Obj. 2.1 Identify and provide appropriate support for underprepared students Program Evidence: In addition to the resources mentioned in Obj. 1.1, we refer students to the Disability Services Program, Academic Success and Tutoring Center, plus the myriad of online math resources for extra support.

7
Obj. 2.2 Update and strengthen career/technical curricula Program Evidence: Although we are not a career/technical program, we do offer service courses for the students of many of those programs, such as Math 160 for Allied Health students.
Obj. 2.3 Identify and provide appropriate support for transfer students Program Evidence: We have a strong curriculum for transfer students in addition to the resources referred to earlier. We have a transfer degree approved and many of our classes have been approved for C-ID, including those required for our ADT, as well as the UC TAG (Transfer Admission Guarantee).
Obj. 2.4 Improve student access to college facilities and services to students Program Evidence: Most math courses are offered at both centers, along with additional hours for drop-in tutoring and lab activities in the MAC at the centers. There has also been an increase in embedded tutors at all three campuses.
Obj. 2.5 Develop and implement an effective Enrollment Management Plan Program Evidence: The Math Department reviews its course offerings each semester and schedules classes at all locations and various times to address the requirements of students who are taking basic skills classes, classes needed for transfer and those who are taking major-level classes. We regularly adjust the schedule to meet changing student needs.
Goal 3: Strengthen Community Connections
Obj. 3.1 Respond to community needs Program Evidence: Our program is designed for students pursuing degrees in math or science as well as fulfilling general education requirements for any associate degree by offering

8
courses that satisfy prerequisites and general education requirements. We also provide basic skills courses that will meet the needs of anyone in the community who is not ready for transfer or degree-level math.
Obj. 3.2 Expand ties to the community Program Evidence: The math department has hosted MESC meetings and the Math Steeplechase, a competition for local high school students. At the Vacaville Center, several faculty and students held a Math and Science Family Fun Night where people of all ages came to engage with science exhibits and math puzzles.
Goal 4: Optimize Resources
Obj. 4.1 Develop and manage resources to support institutional effectiveness Program Evidence: We operate the MAC. This has texts, calculators, and computer programs for student use. We are in the process of adding another part-time staff person. We schedule our classes in the most efficient way to maximize our limited space.
Obj. 4.2 Maximize organizational efficiency and effectiveness Program Evidence: We work to schedule with maximum efficiency given our classroom allocation so that we have courses of all types available at all times and locations. We also work with science faculty and the dean to minimize scheduling conflicts with courses that STEM majors take so they are able to take all their required courses in the most efficient amount of time.
Obj. 4.3 Maintain up-to-date technology to support the curriculum and business functions Program Evidence: The college has provided smart classrooms for us and computers for the MAC and instructors. Despite the fact we were scheduled to have all the computers updated in Fall 2015, only the faculty computers were updated. We are looking forward to having the classroom and MAC computers updated and the operating system on all computers updated to the most recent version.

9
1.3 Enrollment. Utilizing data from Institutional Research and Planning (ITRP), analyze enrollment data. In table format, include the number of sections offered, headcounts, the full-time equivalent enrollment (FTES), and the WSCH for each semester since the last program review cycle. If data is available for the number of declared majors in the discipline, please include as well. Compare the enrollment pattern to that of the college as a whole, and explain some of the possible causal reasons for any identified trends. All measures of enrollment for the Math Department and the College dipped significantly from Fall 2009 to Fall 2012. Since Fall 2012, the Math department has enjoyed a steady upward trend, and has now surpassed the 2009 numbers by most measures. By contrast, enrollment for the College has been relatively flat since 2012, and the College has not yet rebounded to the 2009 numbers. The contrasting trends are illustrated clearly in the side-by-side comparison on the following page. The trend in Math Department enrollment can be attributed to a variety of causes:
● During the downward trend from 2009 – 2012 we were cutting sections that arguably had enough students to run the class.
● In recent years we have increased the number of sections in response to many sections being over-enrolled.
● The Student Success Task Force recommended 22 specific policy changes to improve educational achievement in the California Community Colleges, one of which states that community colleges, “Require students to begin addressing basic skills deficiencies in their first year.” This has led to more first-year students enrolling in our math courses at the beginning of their college career.

10

11
ENROLLMENT TRENDS FOR THE MATH DEPARTMENT AND THE COLLEGE
(Fall 2009 – Fall 2015) Math Department Enrollment Data, 2009-2015: Solano College Enrollment Data, 2009-2015:

12
1.4
Population Served. Utilizing data obtained from Institutional Research and Planning, analyze the population served by the program (gender, age, and ethnicity) and discuss any trends in enrollment since the last program review. Explain possible causal reasons for these trends, and discuss any actions taken by the program to recruit underrepresented groups. Mathematics – % Enrollment by Student Type
Fall 10
Spr 11
Sum 11
Fall 11
Spr 12
Fall 12
Spr 13
Sum 13
Fall 13
Spr 14
Sum 14
Fall 14
Spr 15
Sum 15
Continuing
67%
81%
63%
69%
80%
62%
76%
59%
61%
75%
38%
53%
69%
44%
First Time Student
23%
6%
6%
19%
6%
22%
9%
6%
24%
9%
9%
28%
7%
10%
First Time Transfer
3%
4%
8%
4%
4%
5%
6%
9%
5%
6%
15%
8%
7%
16%
Returning
5%
6%
10%
6%
8%
9%
8%
11%
8%
9%
13%
11%
11%
16%
Special Admit Student (K-12)
2%
2%
13%
1%
2%
1%
1%
15%
1%
1%
25%
1%
6%
14%
Uncollected
0%
0%
0%
0%
0%
0%
0%
0%
0%
0%
0%
0%
0%
0%
13
Unrecorded
Trend: The enrollment of continuing students is higher in the spring than the fall semesters, and has appeared to decrease recently. Reason: The sanctions imposed by ACCJC had a detrimental effect on enrollment for the whole college and it appears that recent removal of sanctions and public outreach has restored the reputation of the college. Planned Action: Continue participating as a department with community outreach such as the SCC Solano Mall outreach and other events. Mathematics - % Enrollment by Gender
Fall 10
Spr 11
Sum 11
Fall 11
Spr 12
Fall 12
Spr 13
Sum 13
Fall 13
Spr 14
Sum 14
Fall 14
Spr 15
Sum 15
Female
55%
56%
56%
55%
56%
55%
56%
61%
56%
56%
56%
56%
57%
59%
Male
44%
43%
43%
44%
42%
44%
43%
37%
43%
43%
42%
42%
41%
38%
Not
Reported
1%
1%
1%
1%
1%
1%
1%
2%
1%
1%
2%
2%
2%
3%
Total
100%
100%
100%
100%
100%
100%
100%
100%
100%
100%
100%
100%
100%
100%
Trend: More females than males are enrolling in our Mathematics courses, though there is still an equity gap in the number of females enrolling in higher-level math courses. Reason: This trend is prevalent throughout the state and nation. In addition, more four year universities are encouraging female students to attend their STEM courses as well as an increase in the number of our nursing students have contributed to the rise in the percentage of female students as well.

14
Planned Action: To increase the number of female students in STEM mathematics classes, we plan on making a brochure to hand out together with the syllabus in Math 104 and Math 11 classes.

15
Mathematics - % Enrollment by Student Age
Fall 10
Spr 11
Sum 11
Fall 11
Spr 12
Fall 12
Spr 13
Sum 13
Fall 13
Spr 14
Sum 14
Fall 14
Spr 15
Sum 15
0-17 7% 3% 14% 7% 2% 6% 2% 17% 7% 1% 24% 6% 27% 35%
18-25 68% 69% 61% 68% 70% 70% 71% 60% 69% 69% 52% 68% 34% 32%
26-30 9% 12% 11% 10% 11% 9% 11% 10% 10% 11% 10% 10% 14% 14%
31-35 5% 6% 7% 5% 6% 5% 6% 4% 5% 6% 5% 6% 7% 7%
36-40 3% 3% 3% 4% 4% 3% 3% 4% 3% 4% 4% 3% 5% 4%
41-45 3% 3% 2% 2% 3% 2% 3% 2% 3% 3% 2% 3% 6% 6%
46+ 4% 4% 3% 4% 5% 5% 5% 4% 4% 5% 3% 4% 6% 4%
Total 100% 100% 100% 100% 100% 100% 100% 100% 100% 100% 100% 100% 100% 100%
**Summer 2012 was cancelled by the Administration Trend: The majority of our students are “college age” (18-25). The second highest population is “returning adult students” (26-30). Reason: The higher numbers of students of traditional college age are obvious. Not surprisingly, enrollment of the 26-30 age group are the second highest. Many of these students are often students who had their college education interrupted for a variety of reasons, and have recently decided to return to college to finish their college education. Planned Action: Continue to advertise the many careers and opportunities awarded to people in STEM and allied health majors, of which mathematics is one. Mathematics - % Enrollment by Ethnicity
Fall 10
Spr 11
Sum 11
Fall 11
Spr 12
Fall 12
Spr 13
Sum 13
Fall 13
Spr 14
Sum 14
Fall 14
Spr 15
Sum 15
Am. Indian/ Alaskan Native
2%
2%
3%
3%
2%
3%
3%
3%
3%
3%
5%
3%
0.3%
0.2%
Asian/Pacific

16
Islander 17% 16% 21% 16% 17% 19%
18% 21% 19% 19% 24% 18% 6% 8%
Black Non-Hispanic
17%
16%
17%
18%
19%
20%
19%
21%
18%
19%
20%
19%
14%
14%
Hispanic
19%
18%
21%
21%
21%
23%
24%
24%
27%
27%
25%
29%
27%
26%
Other
14%
20%
13%
13%
11%
7%
7%
5%
4%
4%
3%
2%
20.7%
22.8%
White Non- Hispanic
30%
27%
25%
29%
30%
29%
30%
26%
29%
28%
24%
29%
32%
29%
Total 100% 100% 100% 100% 100% 100% 100% 100% 100% 100% 100% 100% 100% 100%
Trend: Almost one-third of our students are White/Non-Hispanic. Hispanic, Asian/Pacific Islander, Black/Non-Hispanic each constitutes approximately one-fifth. Reason: According to the US Census for 2014, the population for Solano County and CA are as follows:
Solano County California
Asian/Pacific Islander 16.6% 14.9%
Black Non-Hispanic 14.8% 6.5%
Hispanic 25.6% 37.6%
White Non-Hispanic 39.6% 40.1%
(http://www.census.gov/quickfacts/table/PST045215/06095,06) The trends somewhat mirror the ethnic population of the area we serve. The major difference is that we have a higher percent of White, Non-Hispanics enrolled in our mathematics classes. Planned Action: Improving the visibility of the mathematics department and illustrating the many rewards of taking mathematics classes to these underserved populations will allow these students to gain valuable knowledge of the mathematics department and the many advantages to taking mathematics courses. Creating brochures in Spanish and English that illustrate the

17
employment opportunities for people with college degrees in various fields of mathematics, especially comparing salaries and benefits of people with and without degrees would likely encourage students to take more classes in mathematics. 1.5 Status of Progress toward Goals and Recommendations. Report on the status of goals or recommendations identified in the previous educational master plan and program review. Table 2. Educational Master Plan
Educational Master Plan Status
1. Provide fundamental and advanced course offerings.
The number of courses offered has risen dramatically. The department has not introduced additional courses but Math 112 has been revamped.
2. Provide more classrooms at each campus for better access to permit learning and the ability to accommodate the needs of more students.
The number of classrooms has not changed. The department still needs devoted reliable classrooms. Currently many classrooms are assigned at the last minute and don’t always meet the needs of math instruction.
3. Explore combining basic skills and learning studies classes.
Courses offered as part of a learning community have diminished due to lack of funding and coordination.
4. Prepare for changes caused by Student Success Task Force (SB 1456) initiative.
Created a new course, Math 305 - Prepare for Math Success. The purpose of the course is to prepare students by reviewing the prerequisite course and learning math specific study skills.
5. Develop useful assessment measures. Nothing has changed and we’re still using Accuplacer as a recommendation for incoming students. A statewide common assessment test is being developed and we anticipate implementing it in the near future.
6. Continue to offer and investigate expanding online offerings.
The department offers online instruction for Statistics, Intermediate Algebra and

18
Elementary Algebra.
7. Update technology for classroom and faculty use.
Full-time faculty received new laptops in Fall 2015. Classroom and MAC technology has not been updated.
8. Expand the MAC to reflect increased demand by adding more space, a quiet room and group rooms and provide more computers to accommodate the increased use of software and online resources such as MyMathLab, Minitab, Maple, etc.
The MAC located at both centers now has a devoted space with consistent hours from 9AM-3PM. In the past, the centers offered a shared learning lab that provided both Math and English assistance.
9. Hire more full-time faculty including instructors with experience and interest in basic skills.
Department hired one new full-time faculty member in Fall 2013 with an interest in basic skills.
10. Restore MAC staff and add more student tutors.
MAC staffing has not changed. An attempt was made to hire a MAC computer lab technician in the Fall 2015 but a qualified applicant was not found.
11. Increase support for basic skills by adding supplemental instructors, embedded tutors and a first-year experience component.
The embedded tutor program has increased significantly and is in its fifth semester. Math courses have been a part of the First-Year Experience program since it began four years ago. Supplemental instructors are hard to find due to educational requirements, and math faculty have found that embedded tutors have done well serving their students in their basic skills math courses.
12. Hire an administrative assistant dedicated to the mathematics department.
The division hired an additional administrative assistant dedicated to math.
Table 3. Program Review Recommendations
Program Review Recommendations (Previous Cycle)
Status
1. Curriculum reviews every four years do The department invested significant time

19
not adequately address the needs of Solano College students. The math department should establish a procedure for evaluating and acting upon recommendations to curriculum changes in a timelier manner.
adjusting our courses to meet the standards of the California Math C-ID descriptors.
2. Course coordinators should be re-established. These coordinators are an important link with the adjunct faculty to insure that course instruction per the Section K is being properly accomplished.
The department has not done enough to improve communication with adjunct faculty. It’s even more important now since the demand for faculty from the increased number of math courses has been met by adjunct faculty members. Within My.Solano there is a MyGroups where faculty can find resources for our basic skills math courses including things like sample syllabi and pacing guidelines.
3. More discussion is needed on how to best implement the Statewide requirements as they relate to TBA (To Be Announced) hours.
The weekly time commitment of the MAC has been clarified and addressed by the department. The most significant change has been the implementation of required activities designed to go above and beyond mere homework sets. Course outlines were updated to include the necessary components for TBA designations.
1.6 Future Outlook. Describe both internal and external conditions expected to affect the future of the program in the coming years. Include labor market data as relevant for CTE programs (limit to one page or less). The following concerns need to be addressed as we look into the future of the Math program:
● Classroom: Currently we do not have enough classrooms in general, and not enough classrooms large enough to accommodate 35 or more students in many of our basic skills courses in particular, to meet enrollment demands. This shortage will only intensify as Math enrollment is projected to grow steadily in the foreseeable future.
● Staffing: We will face a severe shortage of Math faculty as many full-time members are expected to retire in the next five years, and we are losing adjunct members with no

20
adequate replacements in sight. Many local colleges are hiring full-time math faculty this year which will also impact the pool of adjuncts available.
● Specialized Faculty: As the number of DSP students is rising rapidly, we need faculty members who are specially trained to take care of their needs. We currently do not have such members.
● Effect of Common Core: Our curriculum needs to be aligned with K-12’s common core in order to better educate future students, who inevitably will come in with vastly different Math backgrounds.
● Basic Skills Success: It appears that a statewide common assessment test will be implemented in the near future. This implementation will provide us with a more consistent method for placement of basic skills students. Appropriate placement is a very important, and yet often overlooked, factor for student success in basic skills courses.
● Disjointedness between the Main Campus and the Centers: We need to establish better consistency in course offering, faculty staffing, Math Lab setting, etc, of the three campuses.

21
Curriculum Development, Assessment, and Outcomes Program Learning Outcomes (PLOs) 2.1 Using the chart provided, list the Program Learning Outcomes (PLOs) and which of the “core four” institutional learning outcomes (ILOs) they address. In the same chart, specifically state (in measurable terms) how your department assesses each PLO. For example, is there a capstone course (which one), is it a passing grade on certain assignments or exams that demonstrate acquisition of the PLO, is it acquiring specific skills necessary for a licensing exam, completing a portfolio, etc.? Table 4. Program Learning Outcomes
Program Learning Outcomes ILO (Core 4) How PLO is assessed
1. Solve problems by applying appropriate math concepts and ideas.
II. The capstone courses for our program are Math 011, Math 022, Math 023 and Math 040. The course-level assessments are used to generate an assessment of the program-level outcome.
2. Effectively communicate the solutions of these problems.
I. B. Same as PLO 1.
2.2 Report on how courses support the Program Learning Outcomes at which level (introduced (I), developing (D), or mastered (M)). Table 5. Program Courses and Program Learning Outcomes
Course PL01 PL02
Math 002 D D
Math 004 D D
Math 011 D D
Math 012 D D

22
Math 020 M M
Math 021 M M
Math 022 M M
Math 023 M M
Math 030 D D
Math 031 D D
Math 040 M M
Math 051 D D
Math 103 I I
Math 104 I I
Math 112 I I
Math 160 I I
Math 305 I I
Math 310 I I
Math 320 I I
Math 330 I I
Math 330A I I
Math 330B I I
2.3 Utilizing table 6, describe the results of program learning assessments and any planned actions to increase student success where deficits were noted. Results should be both quantitative and qualitative in nature, describing student strengths and areas of needed improvement. Action plans should be specific and link to any needed resources to achieve desired results. Table 6. Program Learning Assessments

23
Program Learning Outcomes
Date(s) Assessed
Results Action Plan
1. Solve problems by applying appropriate math concepts and ideas.
Summer 2012 (as part of the special SLO group), Fall 2013
The assessments for the course SLO’s which link to this PLO were analyzed in the following courses in either Summer 2012 and/or Fall 2013: Math 22, Math 23 and Math 40 and Math 11. These courses are the final math courses that a most transfer or major students would take and even though not all students will take each of the courses, they will likely take at least one of them to complete a degree or transfer. The assessments showed satisfactory to high performance on the outcomes at the course level. Students typically did well on solving typical problems although problems with multiple levels did create difficulties.
None
2. Effectively communicate the solutions of these problems.
Summer 2012, Fall 2013
Those assessments that specifically addressed this PLO showed poor results. However, only Math
Attention to effective communication, both in assessment and in specific course SLOs, should be addressed.
24
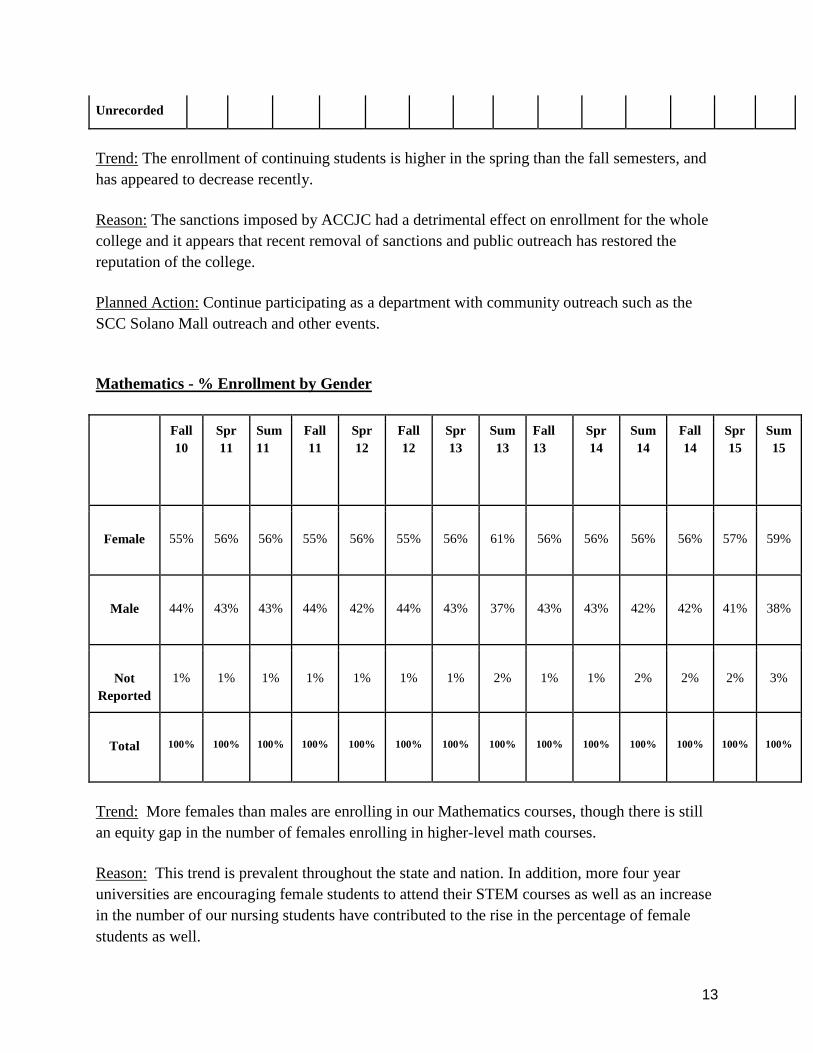
40 required some type of communication through writing a proof.
Instructors should be adding attention to communication in their classes. More assessments should be designed to measure this PLO. It would be helpful to have some course SLO’s added which specifically include consideration of this PLO at all levels of our curriculum not just the top level.
2.4 Describe any changes made to the program or courses that were a direct result of program learning assessments. No progress has been made in adjusting individual course SLO’s to incorporate PLO’S in a more significant way. Doing so is a goal of the department (see section 5.2). The discussion did lead to changing one of the SLO’s for Math 031 to better incorporate the actual course content. Student Learning Outcomes 2.5 Describe the current status of SLOs in your program. Are SLOs being updated as necessary? What is the planned assessment cycle (need to be assessed at least twice during the program review cycle)? Are assessment results driving course level planning? If deficiencies are noted, describe planned actions for change. Address how courses with multiple sections have been aligned so that a common tool is utilized to assess student learning outcomes; describe any steps taken to standardize measures. We have a lot of SLO assessment data collected since 2008. All of our SLOs are assessed, updated and the assessments are recorded regularly as requested by the college and in a timely fashion. The quality and consistency of the assessments has varied, but the department has worked to outline common assessments to be implemented when math is scheduled to assess all courses in the 2016-17 academic year.
25
The common assessments will mandate the type of problem(s) to be used in assessing courses and give guidelines for assessing the results through rubrics, but not prescribe one specific problem to be used. Results will then be correlated and reported in aggregate form. At the direction of the School of Mathematics and Sciences, the Mathematics department will be assessing all outcomes of all courses in the 2016-17 academic year and again in the 2018-19 academic year to assess all courses twice in the five-year program review cycle. The mathematics faculty continues to discuss the assessment results and modify SLOs according to the course requirements. 2.6 Review the course level SLOs completed by the program in the last year to ensure accuracy of information provided (core four, level of mastery, assessment tool, etc.). Note if any changes are needed. With the recent changes to the District’s GELOs and ILOs the department will review all of the above as it completes curriculum review in the 2016-17 academic year. Currently, all courses are appropriately mapped to the core four, etc. and assessments have adequately assessed the outcomes. 2.7 Describe any changes made to the program or courses that were a direct result of student learning outcomes assessments. As a result of our discussions and planned actions from SLO assessments, the following changes have been made:
● In an effort to create more class time during which students could be working problems, some instructors have put some of their lectures online, in response to low assessing students in their classroom. This is typically called a “flipped classroom.”
● SLOs for Math 21 and Math 31 were changed recently to better address the topics of those courses.
● In Math 4, the SLO assessments noted that students were not performing well on SLO1: Demonstrate the ability to use functions as a mathematical tool to model the conceptual ideas of algebra and trigonometry. In accordance with the planned action, two MAC assignments were created to address the topic which resulted in better assessment from the students.
● In Math 103, in response to students’ struggles with proofs, as evidenced by assessments of SLO1: Apply deductive reasoning to construct formal proofs of geometric theorems, new worksheets on proofs were created for instructor use.

26
● In Math 310, discussion of SLO results led to a concern that there was inadequate time to cover all topics thoroughly from the text. Prof. Carlos Esteve was awarded a sabbatical to write a new textbook for the class that became available in Spring 2013. It has been in use for the class since that time. Also, the topic of circles was moved to Math 320.
● As result of assessing Math 023 outcomes, Prof. Svetlana Podkolzina made some changes to Math 104 teaching to reinforce functional notation.
Curricular Offerings 2.8 Course offerings. Attach a copy of the course descriptions from the most current catalogue. Describe any changes to the course offering since the last program review cycle (course content, methods of instruction, etc.) and provide rationale for deletion or addition of new course offerings. Please see attachment at the end of the document that contains the course descriptions from the catalog. Three new courses have been added to the catalog for the Mathematics Department.
● Math 112: Math 112 is a four unit course currently called Algebraic Reasoning but will soon change it’s name to Intermediate Algebra for Liberal Arts. It is a course designed for students that will take Math 11 (Statistics) or Math 12 (Mathematical Ideas) as their transfer-level math course. This course has the same prerequisite as Math 104, Intermediate Algebra, and in the course students will develop their ability to solve problems with algebraic reasoning. Pre-Statistics courses have emerged in many community colleges from a widespread recognition that the traditional developmental Algebra sequence is not well-aligned with the study of Statistics. The catalog description for Math 112 includes a note that it is not for students who anticipate having a STEM major.
● Math 160: Math 160 is Math for Nursing School Students. This half-unit course is designed for students entering an RN program and focuses on reviewing topics that are critical to success for students entering an RN program. This course is Pass/No Pass only, and is most often taught over the summer.
● Math 305 - Math 305 is a half-unit course designed to help new math students review their current knowledge of mathematics in order to help them enroll in an appropriate math course for their ability level. The Math Department has found that a high proportion of students enroll in a math course different from their math ability level, and this course hopes to address that issue by having students spend more time assessing and remediating their math knowledge before taking a math course. They also spend time learning about math study skills in order to increase their chance of success in their math courses.

27
One course has been deleted from the catalog for the Mathematics Department. ● Math 18 - Math 18, Exploring Math and Science Teaching, was a two-unit course
designed to give students field experience in teaching mathematics and science. Students spent time assisting in classrooms in area schools. Due to low enrollment numbers the course was often not able to run, and thus, was forced to be deleted.
Other notable course offering changes:
● Our Statistics course (Math 11) is now being offered online in addition to face-to-face. The course content outline was also updated in order to be more descriptive.
● The majority of math courses have long had a laboratory component, but all course outlines were updated to include what material should be covered in the laboratory component of the course.
● Math 21 course, Analytic Geometry and Geometry II, had it’s course outline adjusted to include parametric equations in an effort to better align the course with C-ID.
● Math 31 course, Analytic Geometry and Calculus, had it’s course outline adjusted to reflect that power series were a required topic. This helps the course to better matriculate to courses with the CSU and UC system.
● Math 40, Introduction to Linear Algebra, had the prerequisite course increase to Math 21, due to the relatively high degree of mathematical maturity needed to be successful in the course. Also, course outline content was made more descriptive.
● Math 310, Arithmetic, had the topic of “circles” taken out of it’s curriculum, and it was placed in Math 320, Prealgebra, where it fits better. The topic of Volumes was added to the Math 320 curriculum as well.
● Math 330, Elementary Algebra, added scientific notation to it’s course content. This topic was often taught as it is important for students that will be taking science course, but was not explicitly stated on the course content outline.
● Math 330A and Math 330B, our Math 330 course separated into two semesters, had changes made to the course outlines to better align itself to the flow of curriculum taught in Math 330.
Also state whether a transfer degree has been established in accordance with SB 1440. The math department was one of the first at Solano to develop an approved Associate Degree for Transfer in accordance with SB 1440. All courses required by the degree have been approved for the C-ID descriptor. The current ADT in Mathematics at Solano has the following requirements:

28
The degree requirements for the traditional associate degree are identical to those of the ADT with the exception that Math 012 is also listed among the choices with Math 023 and Math 011. Include a discussion of courses offered at Centers (Vacaville, Vallejo, Travis) and any plans for expansion/contraction of offerings at the Centers. Currently the Math Department rarely offers courses at Travis Air Force Base, mainly due to low enrollment as well as restrictions on course scheduling that make it difficult to find faculty willing to teach there. The offerings at the other centers has shown a steady increase since Fall 2011. Due to an effort to try and reach “Center” status, enrollments spiked in Spring 2013. Growth has, as always, been stunted due to lack of available faculty. Math - Total Number of Sections Offered at the Centers
Fall 2011
Spr 2012
Fall 2012
Spr 2013
Sum 2013
Fall 2013
Spr 2014
Sum 2014
Fall 2014
Spr 2015
Fall 2015
Vacaville 9 11 12 22 6 18 17 6 18 19 20
Vallejo 10 14 13 18 8 12 16 5 14 16 16
Travis 0 1 0 1 0 2 0 0 0 0 0
2.9 Fill rates/Class size. Based on data from ITRP, discuss the trends in course fill rates and possible causes for these trends (include comparison/analysis of courses by modality if applicable). Address how the size of classes affects courses and if there are any necessary adjustments to course classroom maximums. If there are courses that are historically under-enrolled, discuss strategies that might increase enrollment.

29
The Math Department offers a large number of courses, so we chose to group them into three major categories in order to manage the analysis of fill rate and class size: Basic Skills Courses: 104, 112, 310, 320, 330, 330A, 330B Majors Track: 20, 21, 22, 23, 40 Other/Transfer: 2, 4, 11, 12, 30, 31, 51, 103, 114, 160 The fill rate for each semester was computed by finding the mean of the fill rates for all relevant sections. For the purpose of identifying trends, Summer semesters were excluded from the analysis. A large number of courses are not offered in the Summer, and the fill rate is very noisy
for those that are.
The fill rate for all categories is strong (almost always over 80%). The only notable trend in the data is that the Majors courses seem to have a much higher mean fill rate in the Spring semesters (often over 100%). The increased demand may be attributed to the fact that many of our advanced students “cram” more courses into their last semester before transfer to the university. It could also be that in their first-year students often take prerequisite courses to their major courses. The fill numbers for majors courses in the Spring are high enough to justify an increase in the number of sections offered.

30
The Math Department offers a variety of online and hybrid sections in Math 11, 104 and 330 in addition to the traditional (face-to-face) courses. Fill rates are compared by modality below:
The fill rate is generally lower for online and hybrid modalities in Math 11, Math 104 and Math 330. The department noted that the online and hybrid sections are generally full at the beginning of the semester, but a higher percentage of students drop the class before census when they discover they aren’t comfortable with the format. We believe that the best approach to improve the census fill rate is to incorporate an online orientation that is required prior to the course to help the student determine before the class if the online or hybrid format is one they are comfortable with. We plan to investigate the one currently being developed by the campus Distance Ed committee. The Math Department offers courses 330A and 330B as an alternative to Math 330. The fill rates for these courses are shown below. The fill rate was averaged each semester for 330A and 330B.

31
As can be seen, the fill rates for the summers, for Math 330A/B especially, are low. This is due to the fact that this course is often taken by students who struggle in basic skills math, and they need the extra time a full semester provides to complete the curriculum. Taking the course over an eight-week summer session does not help the typical Math 330A/B student. To investigate the relationship between class size and success rate, we produced scatterplots and searched for a correlation between fill rate and success rate in the three main course categories.
In the regression analysis for Basic Skills courses, we found a significant negative correlation (P<.01). The success rate dropped by 0.15 points for each 1 point increase in fill rate. This suggests that the existing basic skills class sizes may need to be reduced in order to increase success rate. Given the high fill rate for these courses (almost always exceeding 80%), we will also need to increase the number of sections offered. We had to remove several extreme and influential points from the regression analysis for the Majors Track courses (five unusual courses had fill rates in excess of 165%). Once these points were removed, we found a slight positive correlation between fill rate and success rate, but the correlation was not statistically significant.

32
Finally, we found a slight negative correlation for the Other courses, but the correlation was not statistically significant. Finally, we identified the following under-enrolled courses (below 70% on average):
Math 112 59.3% Math 114 68.2% Math 160 68.6%
For all three of these courses we typically offer only two sections, so the lower fill rate doesn’t impact the department’s fill rate significantly. It is necessary to maintain two sections of each course in order to provide scheduling flexibility to the students; in other words, a reduction in the number of sections would not significantly increase the fill rate of the remaining courses. In the case of Math 112, we expect the number of sections to increase due to change in university requirements that allow us to have it as a prerequisite for certain transfer-level courses. 2.10 Course sequencing. Report on whether courses have been sequenced for student progression through the major, how students are informed of this progression, and the efficacy of this sequencing. Report on whether curriculum is being offered in a reasonable time frame (limit to one or two paragraphs). The math courses are sequenced for students to progress through the courses and this progression is displayed in a flowchart (see Appendix) that is available to all students online on the Math Guide page of Solano’s website and posted in prominent locations such as the Math Activities Center. All the math courses are offered every regular semester in a variety of scheduling formats to accommodate different students’ schedules. A majority of the courses, mainly those that are most likely to fill based on student need, are also offered during the summer. Basic skills math, and statistics, along with periodic sequencing of pre-calculus and the first year of calculus, are also offered at the Vallejo and Vacaville Centers. 2.11 College Preparedness/Basic skills. Describe the basic skills component of the program, including how the basic skills offerings prepare students for success in transfer level courses. If your program doesn’t have designated basic skills courses, then explain how your courses support fundamental writing and/or mathematics competencies. Analyze courses with course advisories, prerequisites and/or corequisites to see whether this level of preparation supports student success. The Math Basic Skills sequence includes Math 310 (Arithmetic, 3 units), Math 320 (Pre-algebra, 4 units), Math 330 (Beginning Algebra, 5 units) and Math 104 (Intermediate Algebra, 5 units.) Algebra I and Algebra II from high school, with a grade of C or better, are considered equivalent to Math 330 and Math 104 respectively. Math 330 can also be taken over two semesters as Math 330A and 330B, for 3 units each. In Fall 2015, the Math Department offered 65 sections of basic

33
skills math courses which accounted for 53% of all math courses offered. With the exception of Math 310, each course has a Math Activity Center, one hour per week lab requirement. Additional funding and space would be required to incorporate the lab component into the arithmetic course. Two new math basic skills courses, Math 305 (Prepare for math success, 0.5 units) and Math 112 (Algebraic Reasoning, 4 units) have been recently created to help math basic skills students and provide them with more options. These courses are described in the paragraphs below. For many years the Math Department, led by the math basic skills coordinator, has worked on basic skills projects. The math basic skills group has regularly met during optional Flex-Cal sessions. The workshops are used to plan and assess projects, present information learned at conferences, share ideas for class activities, and collaborate on creating successful lesson plans. Some of the recent highlights of the basic skills group have been the First-Year Experience, creation of a website to help students assess their current math knowledge, embedded tutoring in basic skills math courses, and creating a new pathway to transfer-level math for liberal arts students. The newest iteration of a First Year Experience Program at Solano began in the year 2012. One math course, an elementary algebra, was a part of this program, and all students in the program took this course. Modifications were made in the second and third years when three math courses (Math 320, 330, and 104) were designated as FYE courses, and students in the courses were placed depending on their current math knowledge. These math courses were placed at the same days and times and allowed for students to move to a different class if they found they were not prepared for the course they enrolled in. Students took the same instructor the second semester for the next math course. The FYE data shows that besides Math 330, students in the program passed their math course at a higher rate than the general population, which included students in any year of their schooling at Solano. The persistence data, however, shows that students in the program continue to take math courses at a much higher rate than the average student, which addresses the 2012 Student Success Task Force Recommendation that we require students to begin addressing basic skills deficiencies in their first year. In Fall 2015, the coordinator of the FYE program resigned and left the program in peril. The Basic Skills committee is currently working to find a coordinator to keep this valuable program alive. Since spring 2014, embedded tutors have been hired to work in basic skills math courses. The embedded tutors attend class and help as needed during class and they also work one to two hours per week outside of the class time to meet with students and help them in small groups or one-on-one. A majority of the instructors working with embedded tutors express positive experiences and indicate that the tutors are helpful during class but, in most instances, the number of students taking advantage of the outside-of-class tutoring sessions is still lower than anticipated. Instructors utilizing the embedded tutors will continue to develop ways to encourage

34
students to participate. Funding for embedded tutors for next year has not yet been secured. Meetings with the Vice President for Student Success have been held to try to institutionalize funding for the embedded tutors. One of the issues with the low math basic skills pass rates is that students often take math courses without a solid understanding of the prerequisite material. During the summer of 2014 a drop-in math review, assessment, and advising project was held in the Academic Success Center. The result of this experiment was to create a ½-unit course for new math students. Math 305 was approved by the Curriculum Committee and two sections were offered during summer of 2015. The goal of the course is for students to gain a realistic awareness of their math preparation, review material from courses they’ve passed previously and enroll in the course that is most appropriate for them based on their math preparation. Algebraic Reasoning (Math 112) is a new alternative intermediate algebra course which targets two populations: students seeking to satisfy the math requirement for an AA degree and non-stem transfer students for which it will satisfy the prerequisite for transfer level courses Math 011 (Statistics) or Math 012 (Math Ideas). Two sections of Algebraic Reasoning have been offered each semester since fall 2014. Just recently, the CSU and UC systems provided a framework for approval of alternative courses such as Math 112 to serve as the prerequisite for a transfer level math course such as Math 011 or Math 012 for non-stem students. Since approximately 75% of the cohort of successful Math 104 students in fall semesters that enroll in a math class in the following spring semester take either Math 011 or Math 012, there is a large pool of students for Math 112 courses. The Math Department needs to work with counseling to identify the student majors for whom this is a good alternative and to encourage counselors to recommend this course to appropriate students. As this course gains popularity, we will modify the course as needed; apply for CSU and UC approval; and attempt to create an inexpensive textbook for students. A progression table with the number of students in each basic skills math course in a fall semester and their success rate and the cohort of the successful fall students who take the next math basic skills course in the following spring semester is available in the appendix. This data shows that the percent of students who took the math classes in sequences are often passing at the same or higher rate than the general pass rate for the class, indicating they are getting sufficient preparation in the previous class and that preparation helps them to be successful in the next class. Another issue shown in the progression tables is that many students that were successful in a math basic skills class in the fall do not enroll in the subsequent math course in the spring. Years of anecdotal evidence suggest that students are more successful in basic skills math if they continue taking courses without interruption until they complete their transfer level math course. The Math Department needs to develop a strategy that increases the percentage of these successful math students that continue with their math basic skills coursework in the
35
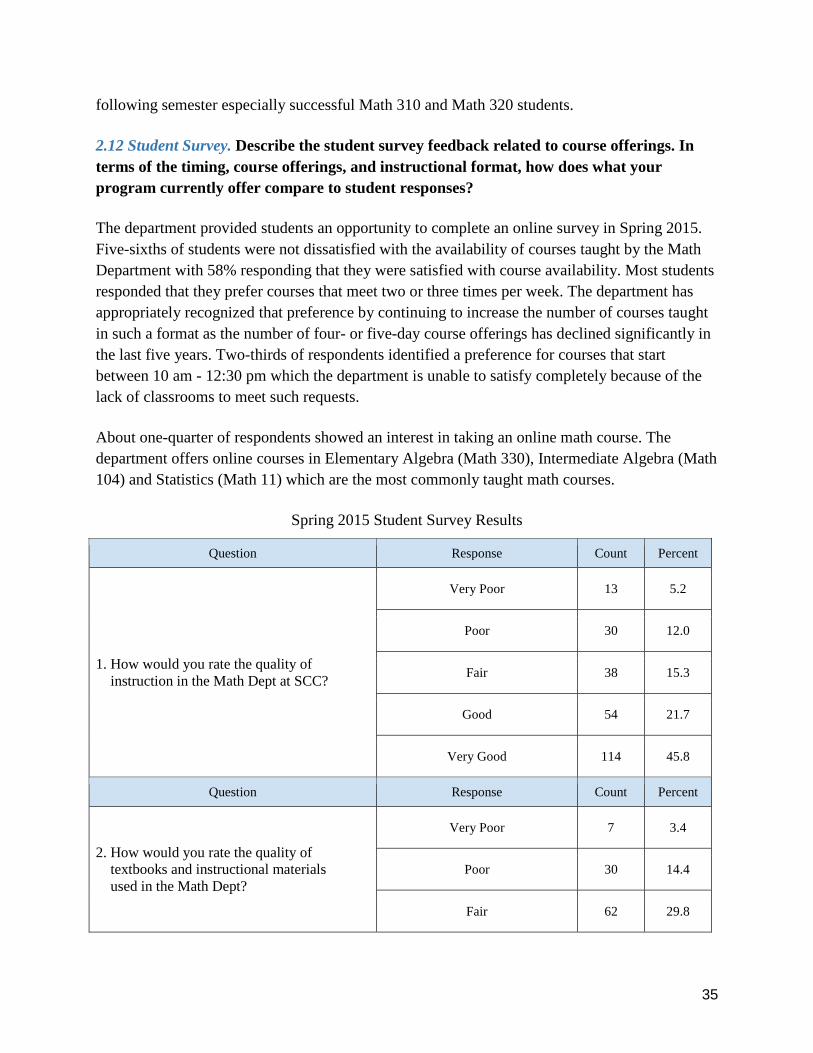
following semester especially successful Math 310 and Math 320 students. 2.12 Student Survey. Describe the student survey feedback related to course offerings. In terms of the timing, course offerings, and instructional format, how does what your program currently offer compare to student responses? The department provided students an opportunity to complete an online survey in Spring 2015. Five-sixths of students were not dissatisfied with the availability of courses taught by the Math Department with 58% responding that they were satisfied with course availability. Most students responded that they prefer courses that meet two or three times per week. The department has appropriately recognized that preference by continuing to increase the number of courses taught in such a format as the number of four- or five-day course offerings has declined significantly in the last five years. Two-thirds of respondents identified a preference for courses that start between 10 am - 12:30 pm which the department is unable to satisfy completely because of the lack of classrooms to meet such requests. About one-quarter of respondents showed an interest in taking an online math course. The department offers online courses in Elementary Algebra (Math 330), Intermediate Algebra (Math 104) and Statistics (Math 11) which are the most commonly taught math courses.
Spring 2015 Student Survey Results
Question Response Count Percent
1. How would you rate the quality of instruction in the Math Dept at SCC?
Very Poor 13 5.2
Poor 30 12.0
Fair 38 15.3
Good 54 21.7
Very Good 114 45.8
Question Response Count Percent
2. How would you rate the quality of textbooks and instructional materials used in the Math Dept?
Very Poor 7 3.4
Poor 30 14.4
Fair 62 29.8

36
Good 84 40.4
Very Good 25 12.0
Question Response Count Percent
3. How would you rate the quality of the math classrooms?
Very Poor 12 5.4
Poor 36 16.2
Fair 74 33.3
Good 70 31.5
Very Good 30 13.5
Question Response Count Percent
4. How would you rate the quality of the building and facilities?
Very Poor 31 11.0
Poor 64 22.7
Fair 64 22.7
Good 76 27.0
Very Good 47 16.7
Question Response Count Percent
5. Why are you taking this class? (mark all that apply)
AA Requirement 128 41.2
GE Requirement 104 33.4
Prerequisite 128 41.2
Required for Major 120 79.5
Required for Transfer 151 48.6
Question Response Count Percent

37
6. How satisfied are you with the availability of courses taught by the Math Dept?
Very Dissatisfied 12 3.9
Dissatisfied 37 11.9
Neutral 80 25.8
Satisfied 121 39.0
Very Satisfied 151 48.7
Question Response Count Percent
7. What would be your preferred time(s) for courses to start? (mark all that apply)
7-9:30 am 115 37.2
10-12:30 pm 211 68.3
1-4:30 pm 104 33.7
5-8 pm 65 21.0
Question Response Count Percent
8. What days of the week do you prefer your math classes to meet? (mark all that apply)
MW 144 46.3
TR 178 57.2
MWF 131 42.1
MTWR 52 16.7
MTWRF 38 12.2
Question Response Count Percent
9. What is the most important criterion you use the select your math courses?
Class Time 83 26.7
Instructor 167 53.4
Days of the Week 55 17.7
A Friend is Enrolled 3 1.0

38
Online Homework 3 1.0
Question Response Count Percent
10. Would you be interested in taking an online course in the Math Dept?
Yes, I have taken an online class before and liked it 23 7.5
No, I have taken an online class before and didn’t like it 60 19.6
Yes, I would like to try 59 19.3
No, I don’t want to try it 164 53.6
Question Response Count Percent
11. When creating your semester schedule, around what do you typically organize your schedule? (mark all that apply)
Courses for Major 196 63.6
Math Courses 63 20.5
Job Schedule 164 53.2
Family Responsibilities 107 34.7
Question Response Count Percent
12. Does the course you are now taking have a prerequisite requirement?
Yes, I took the prerequisite at SCC 190 61.9
No, the course does not have a prerequisite 55 17.9
Yes, but I did not take the prerequisite course at SCC 62 20.2
Question Response Count Percent
13. If the class you are now taking has a prerequisite and you took the prerequisite course at SCC, how well did that course prepare you?
Very Poor 6 3.2
Poor 11 5.8
Fair 41 21.7
Good 64 33.9
Very Good 67 35.4

39
Question Response Count Percent
14. Did you take the math assessment test? (The assessment test is given to help place students in the appropriate math course.)
Yes 237 76.9
No 49 15.9
I Don’t Recall 22 7.1
Question Response Count Percent
15. Did you enroll in the course recommended by your assessment results?
Yes 185 78.1
No 42 17.7
I Don’t Recall 10 4.2
Question Response Count Percent
16. How would you describe the accuracy of your course placement?
Very Poor 11 4.6
Poor 18 7.6
Fair 66 27.8
Good 88 37.1
Very Good 54 22.8
Question Response Count Percent
17. Which resource(s) offered at SCC do you regularly use? (mark all that apply)
Academic Success Center 58 21.6
Math Activities Center 222 82.8
Embedded Tutor 37 13.8
Tutoring Center 63 23.5
Instructor Office Hours 86 32.1
Question Response Count Percent
18. Which resource offered at SCC do you Academic Success Center 29 11.0

40
find the most helpful? Math Activities Center 138 52.3
Embedded Tutor 14 5.3
Tutoring Center 33 12.5
Instructor Office Hours 50 18.9
Question Response Count Percent
19. Have you used an online program such as MyMathLab, WebAssign, Connect Math, BVT Lab, etc. in any of your math courses at SCC?
Yes 195 65.2
No 104 34.8
Question Response Count Percent
20. How would you rate the effectiveness of the online program used in those courses?
Very Poor 25 13.0
Poor 10 5.2
Fair 41 21.2
Good 63 32.6
Very Good 54 28.0
Question Response Count Percent
21. How do you feel about the size of your math classes taught at SCC?
Too Few Students 9 3.0
Just Right 158 51.8
Too Many Students 20 6.6
Didn’t Affect Me 118 38.7
Question Response Count Percent
22. To what do you attribute your success or failure in math classes offered at SCC? (mark all that apply)
My Instructor 218 71.9
My Study Habits 199 65.7

41
SCC Resources 76 25.1
Circumstances in My Life 106 35.0
Question Response Count Percent
23. Have you taken a math course at SCC that required attendance in the Math Activity Center?
Yes 268 88.2
No 36 11.8
Question Response Count Percent
24. How many hours per week do you typically spend in the MAC?
0 hours 16 6.0
1 hour 133 49.6
2-3 hours 94 35.1
4 or more hours 25 9.3
Question Response Count Percent
25. How would you rate the effectiveness of the MAC?
Very Poor 28 10.5
Poor 30 11.3
Fair 78 29.3
Good 79 29.7
Very Good 51 19.2
Question Response Count Percent
26. What resource(s) in the MAC do you find helpful? (mark all that apply)
Assistance from Tutors/Instructors 174 68.2
Checkout Materials 46 18.0
Access to Computers/Printers 132 51.8
Opportunity to Work with Classmates 140 54.9
Question Response Count Percent

42
27. Do you think the number of hours that the MAC is open is sufficient?
Yes 179 74.3
No, the Fairfield MAC needs more hours 31 12.9
No, the Vacaville MAC needs more hours 18 7.5
No, the Vallejo MAC needs more hours 13 5.4
2.13 Four-year articulation (if applicable). Utilizing the most current data from the articulation officer, and tools such as ASSIST.org, state which of your courses articulate with the local four year institutions and whether additional courses should be planned for articulation (limit to one or two paragraphs). According to assist.org, we have articulation agreement with both UC and CSU for the following courses: Math 004, 011, 020, 021, 022, 023, 040, 030. We also have articulation agreement with UC for Math 031. No additional courses need to be planned for articulation. 2.14 High school articulation (if applicable). Describe the status of any courses with articulation/Tech Prep agreements at local high schools. What (if any) are your plans for increasing/strengthening ties with area high schools and advertising your program to prospective students? (limit to one or two paragraphs). Not applicable. 2.15 Distance Education (if applicable). Describe the distance education courses offered in your program, and any particular successes or challenges with these courses. Include the percentage of courses offered by modality and the rationale for this ratio. Then: 1) Discuss your program’s plans to expand or contract distance education offerings; 2) State how you ensure your online courses are comparable to in-class offerings Comparing Success Rate for Face-to-face/ online/hybrid classes. Solano offers online math classes for Statistics (math 11), Elementary Algebra (Math 330), and Intermediate algebra (Math 104). We also offer a hybrid version for Math 330 and Math 104 which meet once a week.

43
On average (Since fall 2014) Solano has offered two online Statistics courses, one online and one hybrid Elementary algebra, and one online and one hybrid intermediate algebra course each semester (spring/ fall). In the summer we offer two online statistics courses, one online elementary algebra, and two online intermediate algebra courses. Prior to Fall 2014, the elementary algebra had either one hybrid section or no distance education courses. Class lectures in the courses are a combination of recorded videos, pdf lectures, and live broadcast lectures. The online/ hybrid basic skills courses (Math 330 and Math 104) have embedded tutors in the course. All online/ hybrid classes require exams be taken in person at one of the Solano campuses. Success Rate Table: (Data from Spring/Summer 2015)
Class Number Who took the class
Number who passed the class
Percent who passed the class
Combined Face to Face (11, 330, 104)
2049 1100 54%
Combined Online/Hybrid (11, 330, 104)
270 95 35%
Overall, for the semesters when the online/hybrid courses were offered, it appears as if students in the online hybrid courses were less successful than in the traditional classroom environment. However, a more accurate assessment of the success of the Math DE classes is when the same instructor teaches both the online/hybrid course and the face-to-face course. The final semester success rates are shown in the Table below (looking at the percent who finished the course who passed. The table includes data from the online/hybrid classes and the same teacher who taught the face-to-face versions (Includes two math 104 classes, two math 11 classes, and four math 330 classes which were taught by the same instructor within the last two years). This indicates that retention in online classes may be a major factor in the difference in success rates. One possible explanation is that students sign up for online/hybrid classes for the flexibility for the schedule, but discover it wasn’t the best format for them or that they are unable/unwilling to complete the assignments necessary to complete the course(usually after census). One suggestion is to develop an assessment tool to help students determine if online/hybrid math is the best format for them before enrolling or a training for online courses that they complete prior to enrolling in online Math classes or during their assessments when enrolling at Solano.
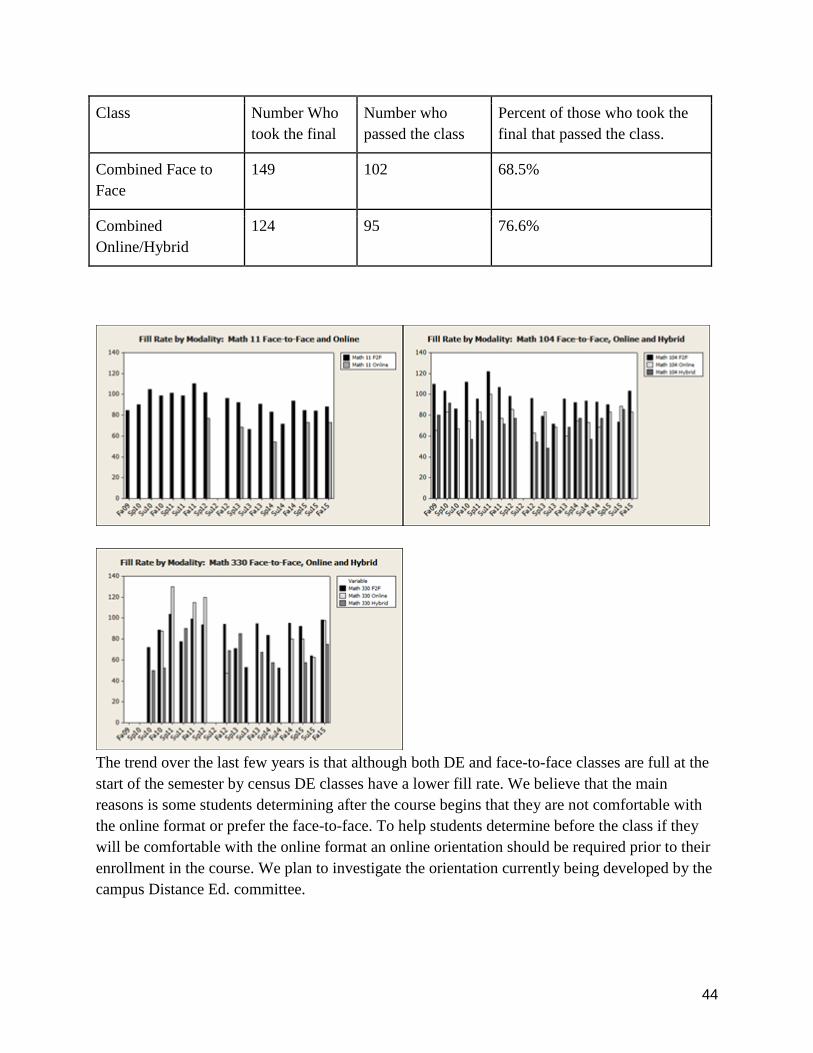
44
Class Number Who took the final
Number who passed the class
Percent of those who took the final that passed the class.
Combined Face to Face
149 102 68.5%
Combined Online/Hybrid
124 95 76.6%
The trend over the last few years is that although both DE and face-to-face classes are full at the start of the semester by census DE classes have a lower fill rate. We believe that the main reasons is some students determining after the course begins that they are not comfortable with the online format or prefer the face-to-face. To help students determine before the class if they will be comfortable with the online format an online orientation should be required prior to their enrollment in the course. We plan to investigate the orientation currently being developed by the campus Distance Ed. committee.

45
Survey Results: Questions Asked: Have they taken an Online Math class, and are they interested in an online math class. Conclusions: We need to ask in the future the current class they are enrolled in. Although 25% of those who responded stated they would like to take an online math class, it is impossible to know if we are meeting the demand because we do not know the classes they are currently in. There may be desire for some of the upper levels of math to have an online or hybrid version, it is also possible that the only people interested in online classes are in the basic skills/ statistics sequence – in which case we are meeting the need. We recommend on the next survey including a question that has the student identify the math class they currently are in/ took last. ACTION NEEDED: Add a survey for students wanting to enroll in any online/hybrid section of Math courses to the Math assessments. Example: ask the students about their experience with online classes and computers, etc. The counselor would then also advise the students about the hybrid course. However, even with all the assessment, advice, etc., the students can enroll if the course prerequisites have been met. The same challenge was seen in teaching math as a hybrid/online course that other departments noticed: enrollment dropped off rapidly. However, the student demand exists, especially for our military students and for our employed students. Currently the number of sections offered seems sufficient to meet the demand for students taking Math 330, Math 104, and Math 11. The math department will continue to monitor demand, and in future surveys will include questions to determine if demand exists to extend online/hybrid offerings to additional courses. In particular, to determine the need to develop online/hybrid versions of transfer level courses (such as pre-calculus, college algebra, and/or calculus) as courses offered in other colleges indicate that the success and retention rates for higher level math classes are similar to face-to-face courses and based on the percentage of students in the online class which are active military it is likely there is demand for higher math courses offered in that format for those students. The math department will compare SLO assessments and term grades for the hybrid/online sections vs. the face-to-face sections, in order to ensure that they continue to be comparable. The Math department maintains a policy for proctoring midterm and final exams to address concerns about academic integrity of online offerings. 2.16 Advisory Boards/Licensing (CTE) (if applicable). Describe how program curriculum has been influenced by advisory board/licensing feedback. How often are advisory board meetings held, provide membership information and what specific actions have been taken. Attach minutes from the past two years. Not applicable.
46
Student Equity & Success 3.1 Student Success. Anecdotally describe how the program works to promote student success. Include teaching innovations, use of student support services (library, counseling, DSP, etc), community partnerships, etc. Below we describe some of the efforts undertaken by the mathematics department over the last five years to promote student equity and success: For the majority of our math classes, a one hour per week MAC lab is required. Math professors assign lab assignments for students to complete in the MAC where an instructor, staff member, and student tutors are available. Since many students struggle with math, having a central location within the mathematics building and also at the centers where they can receive help promotes student success. At peak times the main campus MAC is crowded and stays over 80% capacity for hours. For night classes, the MAC hour is incorporated into the class time with an additional hour set aside for MAC activities. The mathematics department attempts to ensure that textbooks are available for our students. Copies of all required math textbooks are housed in the MAC and available for student use within the MAC. In addition, the math faculty works with publishers to obtain textbooks to be placed on reserve for student use in the library. The math department tries whenever possible to keep cost of course materials down. Some professors have used open source materials or have chosen low cost textbooks. For our beginning basic skills course, College Arithmetic (Math 310), an open source textbook written by one of our instructors is used in the majority of Math 310 sections which is available at a low cost or free as a pdf file. Often in their textbook orders, faculty give student a lower cost option such as an ebook or a publisher package such as MyMathLab. Also, the mathematics department attempts to ensure that calculators and appropriate math software are available for our students. Calculators and computers with appropriate math software are housed at all the MACs and available for student use within the MACs. In addition, multiple class sets of graphing calculators are available for student use in the classroom. To provide accessibility to our students each semester the math department currently offers six online (four online and two hybrid) math sections each semester. The online math courses offered are Elementary Algebra, Intermediate Algebra, and Statistics. To provide student feedback, many of our math instructors use a publisher provided online homework site connected to the textbook such as MyMathLab which also contains additional student resources which students can access at any time. Also various math faculty use canvas online site to store class resources which are easily accessed by students.
47
The math department has a designated basic skills coordinator which serves on the campus wide basic skills committee. This math basic skills coordinator helps implement and obtain funding for initiatives which will increase our basic skills students’ success rate. Past accomplishments have included things such as acquiring embedded tutors for basic skills math courses, creation of MAC activities, and the organizing and implementation of math courses for the First Year Experience program. For the last couple of years the math department has hosted a three hour basic skills math meeting during an optional day of Flex. Math faculty teaching basic skills courses have employed embedded tutors in their classroom through funding available from our basic skills program. A math faculty administers the embedded tutors program within the mathematics department. Math faculty using embedded tutors meet regularly to discuss how to effectively use their embedded tutors to increase student success in their courses. Anecdotally students in a course with an embedded tutor welcome and take advantage of the services of an embedded tutor and have a better chance of success in the course. In the future, we will start compiling data to determine the impact on success rates for math basic skills students in courses with an embedded tutor. The math department collaborates with the FYE program on campus. Since the inception of the FYE program four years ago math courses have been designated as FYE math courses and spaces are reserved in the course for FYE students. These courses all have an embedded tutor. The data shows that our FYE students have a higher persistence rate than comparable students. Students placed in an inappropriate math class impacts student success. The mathematics department cooperates with the counseling department to ensure that students are placed in the correct math course and counselors are aware of any curriculum changes. Individual math faculty members have teamed with a counselor to provide drop-in times when students can get specific math counseling to decide the correct math course for their ability level. In summer 2015 the math department offered Math 305 (Prepare for Math Success) for the first time to provide students with a more personalized math skills assessment and introduce them to specific math study skills. We hope to increase offerings of Math 305 in the future. The mathematics faculty cooperates with the DSP office to ensure that our DSP students receive the full, albeit reasonable, accommodations given them. The DSP office requested and the math department created a specific policy for DSP calculator usage. The resulting calculator policy has been helpful to DSP students, counselors, and the math faculty. A math professor works with the Umoja program and their math tutor to provide information on any math activities which would help their students. This has resulted in a cooperative relationship with the Umoja program sponsoring an embedded tutor who is providing math tutoring in the Umoja office. The Umoja program also periodically places an embedded tutor

48
from the Umoja program into basic skills math courses for which there are many Umoja students enrolled. The math department collaborates with the MESA program which targets underrepresented STEM students. A math faculty coauthored and helps the MESA director coordinate two recently awarded grants (NSF & TRIO) which provide support and scholarships to Solano College STEM students. A component of the grants involves math faculty serving as mentors for these students. Due to females being underrepresented in STEM math courses, a faculty member began an informal club called the Integals (a play on the math word Integrals), which aims to provide support and assistance to those students through dinners, get-togethers, and study sessions. Then, utilizing data from the office of Institutional Research and Planning, report on student success through course completion and retention data. Analyze by gender, age, ethnicity, and on-line (may analyze other variables such as disability, English as a second language, day vs night courses, as appropriate) Our data divides math courses into the following three groups: basic skills level math courses, transfer level math courses, and STEM math courses. Three years ago, the UC system started encouraging biology majors to not take the Applied Calculus series (Math 030 and 031) which switched those courses from the STEM to the transfer level category; thus data from the last three academic years from Fall 2012 through Summer 2015 are used in the following tables. Basic Skills (Math 310, 320, 330, 103, 104, 112, 114) Transfer Level (Math 011, 012, 030, 031) STEM (Math 002, 004, 051, 020, 021, 022, 023, 040) Cohort enrollments in Math courses by basic skills, transfer, and STEM levels Before looking at student success rates, it is informative to analyze the distribution of our mathematics students by cohort percentage enrollment in the basic skills, transfer, and STEM math level math courses. A major component which contributes to these cohort percentages is the initial math placement of a student. For instance, a student that initially enrolls in a beginning basic skills math course such as Math 310 or 320, even if successful, will have multiple math skills enrollments over a three year period. Conversely, a student that initially places at a STEM level math course will have no basic skills math course enrollments but if successful will have multiple STEM level math course enrollments over a three year time period. The four tables below give ethnic/racial, gender, age, and first semester math student cohort percentage math enrollments in basic skills, transfer, and STEM math level math courses over the three year period from Fall 2012 through Summer 2015.

49

50
MATH ENROLLMENT DATA % of cohort enrolled by math level
Fall 2012 thru
Summer 2015
Basic Skills Trans. Level
STEM Course
Cohort Enroll
Amer. Ind. (enrollments)
62.4% (176)
23.0% (65)
14.5% (41)
100% (282)
Asian/PI (enrollments)
44.8% (1954)
29.7% (1295)
25.5% (1111)
100% (4360)
Black/AA (enrollments)
73.6% (2876)
19.4% (759)
7.0% (275)
100% (3910)
Hispanic (enrollments)
60.2% (3287) 23.5% (1283)
16.3% (891)
100% (5461)
Other (enrollments)
44.9% (373) 32.7% (272)
22.4% (186)
100% (831)
White (enrollments)
55.9% (3341) 25.4% (1519)
18.7% (1121)
100% (5981)
TOTAL (enrollments)
57.7% (12007) 24.9% (5193)
17.4% (3625)
100% (20,825)

51
MATH ENROLLMENT DATA % of cohort enrolled by math level
Fall 2012 thru
Summer 2015
Basic Skills
Trans. Level
STEM Course
Cohort Enroll
Female (enrollments)
61.4% (7118)
26.9% (3112)
11.7% (1357)
100% (11587)
Male (enrollments)
52.7% (4697)
22.4% (2000)
24.9% (2222)
100% (8919)
No Report (enrollments)
60.7% (202)
25.5% (85)
13.8% (46)
100% (333)
TOTAL (enrollments)
57.7% (12017)
24.9% (5197)
17.4% (3625)
100% 20,839
MATH ENROLLMENT DATA % of cohort enrolled by math level
Fall 2012 thru
Summer 2015
Basic Skills
Trans. Level
STEM Course
Cohort Enroll
First sem. (enrollm
ents)
70.6% (3318)
18.7% (881)
10.6% (500)
100% (4699)

52
MATH ENROLLMENT DATA % of cohort enrolled by math level
Fall 2012 thru
Summer 2015
Basic Skills
Trans. Level
STEM Course
Cohort Enroll
Under 17 (enrollm
ents)
69.0% (341)
9.7% (48)
21.3% (105)
100% (494)
17-20 (enrollments)
51.8% (4817)
26.7% (2487)
21.5% (1998)
100% (9302)
21-25 (enrollments)
53.2% (2950)
28.3% (1572)
18.4% (1023)
100% (5545)
26-30 (enrollments)
63.8% (1380)
22.3% (483)
13.9% (300)
100% (2163)
Over 30 (enrollments)
75.8% (2520)
18.3% (607)
6.0% (199)
100% (3326)
TOTAL (enrollments)
57.7% (12008)
24.9% (5197)
17.4% (3625)
100% 20,830
These math enrollment percentages display the following trends. Within the ethnic/racial cohort groups, 73.6% of African American math enrollments are in basic skill level math courses, which are significantly higher than the campus wide average of 57.7% of all math enrollments being math basic skills enrollments. American Indian and Hispanic math students have slightly higher percentage enrollments in math basic skills courses, while White math students have slightly lower percentage enrollments in math basic skills courses. This pattern continues in transfer level math courses. In STEM math courses the previous pattern reverses. For STEM math courses the campus wide average is 17.4% of math enrollments are in math STEM courses. The percentage of African American math students who are enrolled in math STEM courses is significantly lower, American Indian and Hispanic slightly lower and White students slightly higher. Asian and Other math students share a different math enrollment pattern. Their math enrollments show a lower percentage than the total in basic skills math courses, and a higher percentage than the total in transfer and STEM level math courses. Although it is not apparent in the above statistics, there has been progress in increasing the number of African American, American Indian, and Hispanic STEM math course enrollments during the last three years. STEM math course enrollments in these three under-represented groups increased by 118

53
enrollments which is a 34% growth from Fall12/S13/X13 to Fall14/S15/X15 as compared to an increase of 87 STEM math course enrollments for Asian, Other, and White students which is an 11% growth during the same time period. The gender cohorts’ math enrollments display the following trends. Female students comprise 55.6% of total math enrollments and males 42.8% of total math enrollments. But within the gender cohorts the percentage of math enrollments are different. A higher percentage of female math enrollments are in math basic skills and transfer level courses. A significantly lower percentage of female math enrollments are in STEM math courses, all compared to male students. The age and first semester cohorts’ math enrollments display the following trends: our students aged 26 and older, as well as first semester math students, have higher cohort percentage enrollments in basic skills math courses and lower percentage enrollments in STEM and transfer level courses. Planned Actions based on cohort Math level enrollments 1. Increase STEM enrollments in cohorts with low percentage STEM enrollments, specifically African American, American Indian, Hispanic, and female students. Currently our MESA program works with first generation college students majoring in STEM fields and was recently awarded a TRIO and NSF grant to provide scholarships and support for STEM majors at Solano College. As part of these grants, math professors recommend students for these opportunities and serve as mentors for these students. The math department can encourage our eligible students to apply, especially those from cohorts with low STEM enrollments. As well, to encourage student interest in mathematics and STEM fields, the math faculty and the MAC director have sponsored a math club and encouraged students to take the AMAYTC and MESA challenge math examinations. 2. Continue our current efforts with embedded tutors, MAC and first year experience. As our success data, which is presented next, shows a trend that some of the cohorts, those having a high percentage of basic skills enrollments, also have lower math success rates. Currently the math department devotes a lot of its time and effort on math basic skill issues, since a majority of our math enrollments, 58%, are in basic skills math courses. Some of these efforts include embedded tutors, MAC assignments, and participating in first year experience. Our embedded tutors also work hours in the ASTC, meaning that students can almost always find someone they are comfortable with to help them. As these efforts succeed, they will have a greater effect on the success rates of those cohorts which are currently overrepresented in math basic skills courses.

54
Cohort success rates in Math courses by basic skills, transfer, and STEM levels The five tables below give ethnic/racial, gender, age, first semester math student, and online cohort percentage success rates in basic skills, transfer, and STEM math level math courses over the three year period from Fall 2012 through Summer 2015. MATH SUCCESS RATES
Fall 2012 thru
Summer 2015
Basic Skills Trans. Level
STEM Course
Cohort Totals
Amer. Ind. 52.3% 49.2% 43.9% 50.4%
Asian/PI 56.5% 65.6% 51.7% 58.0%
Black/AA 40.1% 49.9% 45.5% 42.4%
Hispanic 47.7% 60.6% 47.6% 50.7%
Other 55.2% 62.9% 47.9% 56.1%
White 56.1% 68.6% 55.2% 59.1%
TOTAL 50.0% 62.6% 51.0% 53.3%
MATH SUCCESS RATES
Fall 2012 thru
Summer 2015
Basic Skills Trans. Level
STEM Course
Cohort Totals
Female 50.9% 62.9% 50.3% 54.1%
Male 49.0% 62.0% 51.4% 52.5%
No Report 42.1% 67.1% 52.2% 49.9%
TOTAL 50.0% 62.6% 51.0% 53.3%
MATH SUCCESS RATES

55
Fall 2012 thru
Summer 2015
Basic Skills
Trans. Level
STEM Course
Cohort Totals
Under 17 70.7% 68.8% 76.2% 71.7%
17-20 42.6% 62.9% 49.5% 49.6%
21-25 49.9% 61.8% 48.4% 53.0%
26-30 56.2% 65.6% 60.3% 58.9%
Over 30 57.9% 60.5% 50.8% 57.9%
TOTAL 50.0% 62.6% 51.0% 53.3%
MATH SUCCESS RATES
Fall 2012 thru
Summer 2015
Basic Skills
Trans. Level
STEM Course
Cohort Totals
First math course
50% 68% 55% 54%
MATH SUCCESS RATES*
Fall 2012 thru
Summer 2015
Basic Skills
Trans. Level
Cohort Totals
Online/hybrid (enrollment)
28.4% (790)
38.3% (154)
30.0% (944)
*As discussed in section 2.15 on Distance Education part of the discrepancy in pass rates for DE versus face-to-face classes has to do with students staying enrolled but not completing the course. We can see when looking at the students who take the final exam (compared to face-to-face classes with the same instructor) the pass rates are similar. Please see Section 2.15 for more information.
56
These math success rates display the following trends. The overall success rate for all math enrollments in basic skills and STEM courses are similar, at 50% and 51% respectively, while the overall success rate in all transfer level math courses is a significantly higher 62.6%. Anecdotally, this higher success rate in transfer level math courses may be because students at the transfer math level are often more motivated to succeed in their last math course (satisfy their math requirements). Another factor may be that student success in the largest transfer level math course Statistics (Math 011) is often not as dependent on overall knowledge of the prerequisite math topics as much as other math courses which are more sequential in topics. Within the ethnic/racial cohort groups lower success rates mirror the percentage in math enrollment data. African American and Hispanic students have lower success rates in all three math levels, and American Indian students have lower success rates in transfer level and STEM math courses. Asian, Other, and White students have a higher success rate in basic skills and transfer level math courses and Asian and White students also have high success rates in STEM math courses. Within the gender cohorts the success rates for female and male math students are similar through all three math levels. The overall math success rates for females 54.1% is slightly higher than the overall math male success rate of 52.5%. Within the age cohorts, if the smallest enrollment group, aged under 17, is excluded, the overall math success rate increases as students get older. This trend is especially significant for age 17-20 basic skills math students whose success rate is 42.6% compared to the overall basic skills math success rate of 50%. As for first semester math students, this cohort of students has a success rate which is similar to the success rates of all math students with a 54% success rate compared to the total overall success rate of 53.3%. Our data for success rates are a three-year average of success rates from Fall 2012 through Summer 2015. While there is variance within success rates for individual semesters, one trend that is present in all the cohorts is an increased success rate in all three math levels during the summer semesters. This trend is expressed very significantly for first-semester math students in the summer. At first glance this may seem counterintuitive since the summer classes cover the same material in a six or eight week period as opposed to 16-week semester, but anecdotally faculty have noticed that these summer students often include high school students who want to get ahead or students enrolled at four-year universities, both of which groups could be expected to have higher success rates than average. Planned Actions based on cohort Math level success rates 1. Based on the enrollment data and success rates, efforts should emphasize basic skills math courses which comprise 57.7% of all math enrollments and whose success rate at 50% is

57
lowest among the three math levels. As the math department designs strategies to increase basic skills enrollment, special efforts should be made to include the following two cohorts, which have large basic skills enrollment and significantly lower math skills. These include the 17-20 age cohort and African-American students, which have basic skill math success rates of 42.6% and 40.1%, respectively. Currently the math department’s main basic skills initiatives, embedded tutors, First Year Experience, and the development of Math 112 and Math 305, all attempt to improve the performance of our basic skills students. 2. To ensure that the basic skills efforts are succeeding and are targeting cohorts with lower math success rates and that our initiatives are successful, the math department will establish a Student Success & Equity subcommittee. This subcommittee will maintain data to determine which initiatives increase student success rates and collaborate with programs such as Umoja, PUENTE, EOPS, and the counseling department to increase the outreach of our efforts to students. 3. The enrollment and student success rates indicate that many of our basic skills math students are non-STEM majors and that math students have a 62.6% success rate in transfer level math courses as opposed to 50% success rate in basic skills math courses. Math 112, which we recently modified, serves as an alternative to Intermediate Algebra (Math 104) for basic skills non-STEM majors. This course has been approved by UC system to serve as the prerequisite for transfer level math courses such as Statistics (Math 011) and Math Ideas (Math 012). We hope to eventually offer multiple sections of this course each semester and we also hope that it will provide a more successful path for non-STEM basic skills students into a transfer level math course in which students already have a higher success rate.

58
4. To investigate the relationship between class size and success rate, as reported in section 2.9, we produced scatterplots and searched for a correlation between fill rates and success rates for basic skill, transfer, and STEM math courses. In the regression analysis for basic skills math courses, we found a significant negative correlation of success rates with fill rates. This correlation was not found in transfer and STEM math courses. This suggests that basic skills math class sizes should be reduced in order to increase success rates. Since Math 330 (Elementary Algebra) has a 40 student class maximum, reducing its size would still allow for more than adequate FTES generation.
Persistence rate of math students enrolling the next semester in a course at SCC As the table below shows, 64% of math students during the last three years enrolled the next semester in at least one course at SCC. The yearly data show that the persistence rate was higher in fall semesters at 72% and lower in spring and summer semesters. As students often complete their course work, including degrees and certificates, in the spring semester and over summer, courses often contain students who are enrolled in universities. Thus, it was expected that the fall persistence rates would be significantly higher.
Fall 2012 thru
Summer 2015
Fall Spring Summer TOTAL
Next semester persistence rate
72% 59% 53% 64%

59
3.2 Degrees/Certificates Awarded (if applicable). Include the number of degrees and certificates awarded during each semester of the program review cycle. Describe the trends observed and any planned action relevant to the findings.
Degree 2009/2010 2010/2011 2011/2012 2012/2013 2013/2014
Math AA 12 6 18 16 6
Math AS for Transfer n/a n/a 2 1 5
Many students who complete all the math courses necessary for an associate’s degree in mathematics are transfer students that plan on earning at least a bachelor’s degree in math, engineering or a specific discipline in science. Therefore, most don’t take the steps necessary to apply for an AA degree. 3.3 Transfer (if applicable). Describe any data known about students in your program who are transfer eligible/ready (have 60 transferable units with English and math requirements met). Include how your program helps students become aware of transfer opportunities (limit to one or two paragraphs). The following data shows any student that took a math course at Solano in a particular year and the number of them 1) with a graduation record or 2) who got a transfer (enrolled) record at a four-year institution in the same academic year or after.

60
This data does seem to show that it can take years before a student taking a math course at Solano ends up transferring or receiving a degree at a four-year institution, but this is not uncommon for community college students. Importantly, Solano offers an Associate’s in Science in Mathematics for Transfer. Completion of this major will assure competence in mathematics through differential and integral calculus, providing an adequate background for employment in many technological and scientific areas as well as providing a firm foundation for students planning to pursue a baccalaureate degree in mathematics. Students completing an AS-T degree are guaranteed admission to the CSU system, but not to a particular campus or major. Students transferring to a CSU campus that does accept the AS-T will be required to complete no more than 60 units after transfer to earn a bachelor’s degree. Opportunities to learn about transferring are abundant on campus due to multiple transfer and career fairs that are held every year on the main campus, plus smaller fairs at the centers. Certain

61
opportunities are posted within the math building on the bulletin boards, and other opportunities sent as emails are directed to students meeting the requested criteria. The Transfer Center on campus has a lot of resources for students and math faculty encourage students to head there to get their questions answered. Since many students find role models in the math faculty, faculty members often spend time with students speaking with them about their goals and dreams and how they may achieve them once they leave Solano. 3.4 Career Technical Programs (if applicable). For career technical programs, describe how graduates are prepared with the professional and technical competencies that meet employment/ licensure standards. State if there are any efforts made to place students in the workforce upon graduation, including any applicable placement data. Not applicable.
Program Resources 4.1 Human Resources. Describe the adequacy of current staffing levels and a rationale for any proposed changes in staffing (FTES, retirements, etc.). Address how current staffing levels impact the program and any future goals related to human resources. Current staff levels are inadequate. Our full-time staff at its highest level was nineteen instructors. By Fall 2015 this had dropped to just sixteen due to the administration choosing not to replace positions when instructors retired. While this was our official head count as of Fall 2015, the actual full-time faculty equivalent was about fourteen for the past five years. The difference between the headcount and our FTE is because our faculty tend to be active in positions with released time, have received sabbaticals, and are occasionally on parental leave. Our percentage of classes taught by full-time instructors since 2008 ranges from a low of 37% in Spring 2013 to a high of 54% in Spring of 2012. Given the goal of 75% full-time to 25% part-time these levels are clearly inadequate. In Spring 2016, the number of full-time faculty increased to 18, due to the mandatory offer of employment to two adjunct instructors who had been overloaded improperly. Our adjunct staff used to be larger and when we advertised for an adjunct position we would get several qualified adjuncts. Lately we get perhaps one, or more often no, qualified candidate. The recent disasters with overloading adjunct instructors semester after semester has roots in inadequate full-time staffing as well as inadequate adjunct availability. While classes still get

62
cancelled sometimes due to lack of students, they often get cancelled due to lack of instructors even when the class is completely full of students. We can no longer find enough adjunct instructors to staff our classes. We also expect to lose many of our current adjunct instructors. We have many highly qualified young instructors that will be selected for full-time positions at other institutions in the near future. We also have three of our recent full-time retirees teaching as adjuncts, over time they will choose to fully retire. We will not be able to find adequate replacements when these occur. Our full-time staffing was decreasing even as we moved full-time instructors to have most or all of their load at our centers. We currently have two full-time instructors teaching solely in Vallejo and two full-time instructors teaching primarily in Vacaville. While our course offerings were reduced temporarily during the college’s very tight budget times, we are back now to having as many or more classes as we did prior to the cuts. We used to not teach many transfer level classes at the centers, but now we regularly teach through engineering calculus at the centers. This has really impacted coverage of classes. At one time, every major class was taught by a full-time instructor and now many are taught by adjunct instructors instead. We have some semesters where only one or perhaps two full-time instructors are teaching Arithmetic and Pre-Algebra, the most basic of our basic skills classes. We are quite simply understaffed. At one time it was easy to find exceptional adjunct instructors, now classes are cancelled because we cannot find anyone qualified to teach them. Having classes taught by full-time instructors rather than adjunct instructors typically increases the rigor and connectivity with other classes in the sequence. It exposes students to an instructor that they will continue to see throughout their time at Solano. It helps them to forge ties with the material and with the institution. Our program is suffering and will continue to suffer due to lack of available instructors. We cannot increase the number of sections that we offer, because we do not have instructors to teach them. In analyzing data for program review, we discovered that smaller class sizes correlate to increased student success. But we lack the personnel to increase the number of sections and decrease the size of the classes. Instead, most instructors take several students over their class maximums so as to try to accommodate as many students as possible. Unfortunately, in basic skills, this makes the class less successful for all students. There are innovative programs throughout the country trying to get more students through statistics. But again, with a lack of instructors this is not something that we will be investigating. We are at the point where it is taking all available personnel to try to maintain the status quo. In fall of 2015, the mathematics department generated 18.19% of the FTES of the college. This was accomplished with 12% of the full-time faculty at Solano, 18% of the adjunct faculty at Solano, and just 13% of the headcount of faculty for the college. We are clearly understaffed compared to what we generate. Back in the 1980’s we had a para-professional in our only basic skills class at that time, Arithmetic. Because we believed that creating our Math Activities Center (MAC) was worthwhile, we temporarily moved that position to become the classified staff to manage the

63
Math Activities Center. We know that the MAC has helped our students, so opening it was the right thing to do at the time. But since that time our basic skills program has grown tremendously. Now arithmetic, pre-algebra, elementary algebra, and intermediate algebra are all considered basic skills classes. At the time we had the para-professional, students could graduate with an AA with a course at the level of pre-algebra. Now they need a course at the level of intermediate algebra. At the basic skills level those who teach regularly are getting overwhelmed by increasingly underprepared students with ever increasing special needs. In the past these students never had to achieve at these levels. Our backgrounds and training are for teaching college classes, not for teaching basic skills or handling the plethora of disabilities we encounter every day. We are wearing out and burning out. The embedded tutors in basic skills classes funded by strategic proposals has helped, but we really could use a full-time para-professional to assist with the basic skills curriculum. Our largest class sizes of 35 and 40 are in the basic skills sequence and with the types of students we have in them these days they are increasingly unworkable. It would be wonderful to have a para-professional in these classes to assist the instructor and allow for more active learning and for the chance to give extra assistance to students that desperately need it. If we had a para-professional, they could offer mandatory discussion sections for large classes. The students in basic skills classes have low levels of math skills, but in addition they have very low levels of college skills and student skills. They need more help than a single instructor can give them. The Math Activities Center is also being overwhelmed with these students. Staffing was set up in the 1990’s when many of the most difficult to teach students did not take any courses higher than pre-algebra. It cannot cope well with the current influx of desperately needy students. They need someone dedicated to their level with some background in how to handle learning disabilities and how to foster study skills. They also seem to need and want continuity of instructional personnel throughout their course sequences that we cannot provide because we are so understaffed with instructors. If there was a para-professional dedicated to basic skills students, this would be an important resource for basic skills students through the gamut of different instructors throughout their basic skills career. They could be a source of continuity, support, and understanding so very important to these students. 4.2 Current Staffing. Describe how the members of the department have made significant contributions to the program, the college, and the community. Do not need to list all the faculty members’ names and all their specific activities, but highlight the significant contributions since the last program review cycle. The mathematics department is a large and diverse body of individuals who have made numerous contributions to the program, the college, and the community. Faculty, both full-time and adjunct, have taken part in SLO assessments and their review. We sit on various committees across the campus including the Academic Senate, where one of our members served as

64
president and the Curriculum Committee, where another one of our members served as the chair. We have now or over the past five years have had representation on every major campus-wide committee including the Distance Ed committee, Basic Skills Committee, FABPAC, and others. Some have made major contributions to the development and implementation of the two NSF grants awarded to the college. Outside the college, many attend conferences designed to give professional development to community college math instructors and several of our members have played significant roles in professional organizations including the Mathematics Educators of Solano County (president), California Mathematics Council Community Colleges (two presidents, two membership chairs), and the Mathematical Association of America (section vice chair). 4.3 Equipment. Address the currency of equipment utilized by the program and how it affects student services/success. Make recommendation (if relevant) for technology, equipment, and materials that would improve quality of education for students. The Math department needs the following three sets of computers in order to meet technology requirements of a large number of our courses as well as to provide instructors and students access to online math activities:
1. Desktop computers at teacher stations in the classroom. 2. Desktop computers in the Math Activities Center for students. 3. Laptop computers that can be transported from classroom to classroom for student use
during classes. Currently all these computers have very outdated operating systems and slow processors, and, in the case of laptops, very short battery lives. They need to be updated or replaced in order to give our students and instructors the proper and necessary tools to be successful. The projectors of the smart-classroom set-ups in all our classrooms were installed more than ten years ago. They are showing signs of severe deterioration in their abilities to project bright and clear images. In about half the classrooms, the screens were installed in the middle of the black boards. When they are pulled down, the boards become unusable. Both the projectors and screens need to be replaced/reinstalled for proper use. Currently we do not have document projectors (ELMO’s) in all our classrooms. We need to install one ELMO in each classroom. 4.4 Facilities. Describe the facilities utilized by your program. Comment on the adequacy of the facilities to meet program’s educational objectives. The department has seven classrooms dedicated to math instruction located in the 1500 building on the Fairfield campus. The classrooms offer enough space to enroll up to 40 students and provide a large chalkboard or whiteboard which is helpful when presenting course content. The

65
rooms are typically dirty with a buildup of dust and trash that slowly accumulates throughout the semester. The classrooms were refurbished during a remodel ten years ago, but have slowly deteriorated. The sheetrock has been damaged in a few classrooms along with other issues that have developed because of heavy usage over time. The faculty bathrooms in the 1500 building are nice but the students restrooms are too small and are typically filthy. Students often complain about the cleanliness of the restrooms or supplies such as paper towels or toilet paper that are missing. The quality of the student bathrooms requires significant improvement. Growth in the math department has been limited by a shortage of classrooms dedicated to math instruction but we do use an assortment of other classrooms around campus. However, some of these classrooms don’t provide an adequate environment for math because of limited board space, appropriate technological support or other concerns unique to the math department. The Vacaville and Vallejo Centers offer math courses as well, and the rooms there are still in good shape since the construction was finished within the last decade. 4.5 Budget/Fiscal Profile. Provide a five year historical budget outlook including general fund, categorical funding, Perkins, grants, etc. Discuss the adequacy of allocations for programmatic needs. This should be a macro rather than micro level analysis.
The general fund expenditures are in the table below.
Fiscal Year
6A -Academic Salaries
6C-Classified Salaries
6M -Benefits 7A - Supplies 7E - Other Operating
Total
2011 $ 2,187,347.66 $ 113,345.18 $ 639,513.39 $ 2,795.43 $ 2,523.87 $ 2,945,525.53
2012 $ 2,021,772.18 $ 77,826.33 $ 650,396.98 $ 1,706.57 $ 600.00 $ 2,752,302.06
2013 $ 1,941,006.66 $ 128,563.74 $ 533,206.41 $ 2,555.39 $ - $ 2,605,854.19
2014 $ 2,153,314.26 $ 121,806.28 $ 565,342.24 $ 995.06 $ 1,250.76 $ 2,842,708.60
2015 $ 2,336,424.14 $ 140,346.25 $ 660,941.17 $ (195.48) $ 794.73 $ 3,138,310.81
Most expenditures vary only with the number of faculty and staff employed over a given
year, while supplies usually consist of chalk, markers and office supplies. One element of the budget that has increased recently have been MAC tutor salaries (see chart below):
MAC Student tutor expenses

66
Term Year Total
Fall 2010 $7,000
Spring 2011 $7,800
Summer 2011 $800
Fall 2011 $6,600
Spring 2012 $7,800
Summer 2012
Fall 2012 $7,200
Spring 2013 $9,000
Summer 2013 $1,700
Fall 2013 $8,600
Spring 2014 $10,700
Summer 2014 $2,900
Fall 2014 $10,400
Spring 2015 $10,500
Summer 2015 $2,700
Fall 2015 $10,400
Spring 2016 $12,500 (estimated)

67
The increase in this expenditure is due to the minimum wage increases in the hourly rate for student tutors over the recent years. While we are happy for the higher pay for students, since the student tutors provide a good service and require a high level of qualification, it should be noted that the budget for tutor salaries will need to continue at the increased level to maintain the same number of tutors as is needed.
Programmatic Goals & Planning This section will be submitted to the governing board as an overview of programmatic strengths and areas of growth. 5.1 Summarize what you believe are your program’s strengths and major accomplishments in the last 5 years. Next, state the areas that are most in need of improvement.
The strengths of the math department consist in its commitment to serve the students who take math classes at the college, as well as in its commitment to actively participate in the life of the college and in various mathematics service organizations.
The department strives to serve the students of Solano Community College. Many students who take science classes also take math classes. The department coordinates its schedule with those in the sciences so that these students have as many options as possible for getting the classe that they need. The sdepartment has also recently increased the number of class offerings for certain types of classes. More STEM calculus classes are offered now than just a few years ago, in response to increased student need for these classes. The department has also upped the number of four- and five-unit classes offered in the three day format, since these have proved to be a popular option for students. Finally, the department was able to avoid cuts in support to the MAC on the Fairfield campus during financially challenging times; and the MACs at the centers in Vacaville and Vallejo even saw increased staffing.
The department actively contributes to the programs and goals that the college pursues. For instance, all of the department’s courses have had their SLOs assessed. All of the required courses have had CID approval. The department’s transfer degree is in place. Though understaffed, the department generates 16% - 19% of the FTES for the college. Finally, the department’s faculty are active in campus-wide committees, as well as in math service organizations and conference attendance.
Though the department has many strengths, there is room for improvement as well. Some of these needs stem from the ongoing demand for math classes at the college. The department needs more full-time faculty to meet this demand. Since full-time hires are hard to

68
come by, the department regularly looks to enlarge its pool of part-time faculty. But this has proved to be difficult in recent years. Low wages for part-timers at Solano College, compared to part-time wages for some nearby colleges, is one factor here. Finally, if the department had more classroom space it could offer more classes, especially at peak demand times.
In addition to the above needs, the department would benefit from improved communication with and mentorship of the part-time faculty.
The department teaches many basic skills level classes. These classes often contain many students who require special instructional attention. These students, as well as their instructors, would benefit if the department had a classified position for someone with special training in working with basic skills level students, especially those with learning disabilities. 5.2 Based on the self-study analysis, prioritize the program’s short (1-2 years) and long term goals (3+ years). Check whether the goal requires fiscal resources to achieve. Table 7. Short-Term and Long-Term Goals
Short-Term Goals
Planned Action Target Date Person Responsible
Source
1. Hire more full-time faculty
Argue for this at the Senate level, with the Dean’s help.
Next round of hiring, 2016-2017 year.
Senate Representative and Dean
GF
2. Classified hire for basic skills and learning disabilities.
Write job description and submit proposal.
Fall 2016 Department Faculty
GF
3. Provide more class-specific resources for part-time faculty.
Provide teaching resources for Math 104.
Fall 2016 Department Faculty
NR
4. Obtain more classroom space
Lobby for this currently, and as the new Math building is built
Ongoing Dean and VP NR

69
5. Increase the pool of part-time faculty.
Participate in hiring committees
Ongoing Department Faculty
GF
6. Update the classroom computers
Follow up with IT on potential timeline.
Fall 2016 Dean of Math/Science
GF
7. Improve classroom lighting
Facilities request Fall 2016 Department faculty
NR
8. Restore the technology/tutor classified position for the MAC.
Re-submit position for potential hiring
Fall 2016 Dean of Math/Science
GF
9. Adjust individual course SLO’s to incorporate PLO’s more significantly.
Initiate discussion in the department to identify potential changes
Fall 2016 Department Faculty
NR
10. Improve communication with faculty at the Vacaville and Vallejo Centers.
Increase email reporting of main campus discussions.
Fall 2016 Department Faculty
NR
Long-Term Goals Planned Action Target Date Person Responsible
Source
1. Explore online offerings for more classes.
Departmental discussion of feasibility
Fall 2017 Department Faculty
NR
2. Increase and update technology in the MAC.
Follow up with IT on potential timeline.
Fall 2017 Dean of Math/Science
GF

70
3. Restore MAC services for majors students.
Discuss options within the department
Fall 2017 Department Faculty
NR
4. Improve assessment and placement.
Departmental discussion of feasibility. Statewide assessment tool being developed.
Fall 2017 Department Faculty
NR
5. Explore changes to the pre-calculus sequence
Departmental discussion of feasibility
Fall 2017 Department Faculty
NR
6. Hire more full-time faculty
Argue for this at the Senate level, with the Dean’s help.
Next round of hiring, 2016-2017 year.
Senate Representative and Dean
GF
7. Obtain more classroom space
Lobby for this currently, and as the new Math building is built?
Ongoing Dean of Math/Science
NR
8. Explore the use of discussion sections for some classes.
Departmental discussion of feasibility
Fall 2017 Department Faculty
NR
9. Research policies and guidelines for placing basic skills students including those who took Common Core in high school.
Departmental discussion and research and correlation with counseling
Fall 2017 Department Faculty
NR
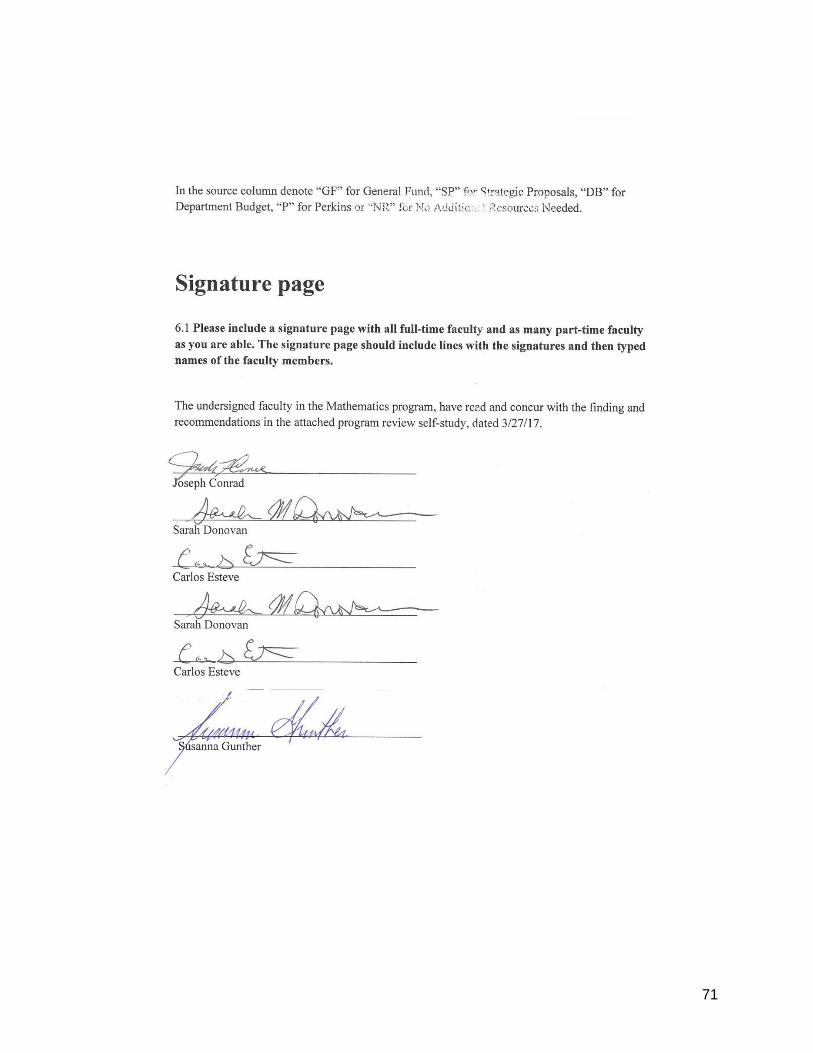
71

72

73
APPENDIX Math Courses Flowchart:
Progression table mentioned in section 2.11:
Semesters F 310 # Pass rate S 320 cohort # S 320 cohort Pass %
All S 320 Pass %
F10 & S11 204 50% 55 69% 56%
F11 & S12 280 50% 61 57% 58%
F12 & S13 258 49% 78 77% 65%
F13 & S14 233 48% 57 68% 56%

74
Semesters F 320 # Pass rate S 330 cohort # S 330 cohort Pass %
All S 330 Pass %
F10 & S11 238 58% 87 47% 47%
F11 & S12 201 66% 78 51% 40%
F12 & S13 211 70% 110 44% 48%
F13 & S14 179 58% 64 58% 44%
Semesters F 330 # Pass rate S 104 cohort # S 104 cohort Pass %
All S 104 Pass %
F10 & S11 589 42% 157 58% 51%
F11 & S12 501 46% 154 66% 49%
F12 & S13 490 40% 142 62% 52%
F13 & S14 541 43% 172 75% 55%

75
Semesters F 104 # Pass rate S cohort # S cohort Pass % All in class Pass %
F10 & S11 655 53% Math 11 #136 Math 12 #7 Math 51 #6 Math 02 #10 Math 04 #10 Math 30 #10
Math 11 48% Math 12 86% Math 51 50% Math 02 30% Math 04 30% Math 30 50%
Math 11 54% Math 12 84% Math 51 58% Math 02 31% Math 04 51% Math 30 56%
F11 & S12 715 46% Math 11 #94 Math 12 #17 Math 51 #6 Math 02 #13 Math 04 #10 Math 30 #9
Math 11 54% Math 12 100% Math 51 50% Math 02 46% Math 04 50% Math 30 56%
Math 11 63% Math 12 98% Math 51 52% Math 02 30% Math 04 42% Math 30 61%
F12 & S13 692 51% Math 11 #122 Math 12 #8 Math 51 #5 Math 02 #13 Math 04 #15 Math 30 < 9
Math 11 67% Math 12 09% Math 51 40% Math 02 46% Math 04 27% Math 30 ??
Math 11 64% Math 12 19% Math 51 48% Math 56 56% Math 04 34% Math 30 62%
F13 & S14 684 47% Math 11 #97 Math 12 #16
Math 11 51 % Math 12
Math 11 62%

76
Math 51 #1 Math 02 #8 Math 04 #24 Math 30 #9
94% Math 51 0% Math 02 25% Math 04 46% Math 30 67%
Math 12 89% Math 51 44% Math 02 54% Math 04 54% Math 30 76%
The math progression flowchart can be found at the following link: https://drive.google.com/file/d/0BzRCravLxvQOZjdNWWx3TDJjZzA/view
Related Documents