CLINICAL RESEARCH STUDY Prognostic Value of ECG Among Patients with Acute Pulmonary Embolism and Normal Blood Pressure Simone Vanni, MD, PhD, Gianluca Polidori, MD, Ruben Vergara, MD, Giuseppe Pepe, MD, PhD, Peiman Nazerian, MD, Federico Moroni, MD, Emanuele Garbelli, MD, Fabio Daviddi, MD, Stefano Grifoni, MD The Emergency Department, Azienda Ospedaliero-Universitaria Careggi, Florence, Italy. ABSTRACT OBJECTIVE: To investigate the prognostic value of electrocardiography (ECG) alone or in combination with echocardiography in patients with acute pulmonary embolism and normal blood pressure. METHODS: Consecutive adult patients presenting to the emergency department at Azienda Ospedaliero- Universitaria Careggi with the first episode of pulmonary embolism were included. Patients with systolic blood pressure less than 100 mm Hg were excluded. ECG and echocardiography were performed within 1 hour from diagnosis and evaluated in a blinded fashion. Right ventricular strain was diagnosed in the presence of one or more of the following ECG findings: complete or incomplete right ventricular branch block, S1Q3T3, and negative T wave in V1-V4. The main outcome measurement was clinical deterioration or death during in-hospital stay. The association of variables with the main outcome was evaluated by multivariate Cox survival analysis. RESULTS: A total of 386 patients with proved pulmonary embolism were included in the study; 201 patients (52%) had right ventricular dysfunction according to echocardiography, and 130 patients (34%) showed right ventricular strain. Twenty-three patients (6%) had clinical deterioration or died. At multivariate survival analysis, right ventricular strain was associated with adverse outcome (hazard ratio 2.58; 95% confidence interval, 1.05-6.36) independently of echocardiographic findings. Patients with both right ventricular strain and right ventricular dysfunction (26%) showed an 8-fold elevated risk of adverse outcome (hazard ratio 8.47; 95% confidence interval, 2.43-29.47). CONCLUSION: Right ventricular strain pattern on ECG is associated with adverse short-term outcome and adds incremental prognostic value to echocardiographic evidence of right ventricular dysfunction in patients with acute pulmonary embolism and normal blood pressure. © 2009 Elsevier Inc. All rights reserved. • The American Journal of Medicine (2009) 122, 257-264 KEYWORDS: Echocardiography; Electrocardiography; Prognosis; Pulmonary embolism; Right ventricular dys- function Pulmonary embolism has different clinical presentations, from mild complaints to shock. One of the main determi- nants of clinical presentation and prognosis is the extension of obstruction within the pulmonary circulation. 1 Accord- ingly, the presence of acute right ventricular dysfunction is an important prognostic factor. 1-5 In these studies, right ventricular dysfunction was diagnosed by echocardiogra- phy. However, echocardiography may be difficult to per- form in the emergency setting. Electrocardiography (ECG) has a widespread use and is easily performed and inter- preted in the emergency department. Some electrocardio- graphic signs, indicated as “right ventricular strain” pattern, were found to be related to the extension of obstruction in the pulmonary circulation 6 and to right ventricular pressure overload 7,8 with potential prognostic implications. Al- though ECG shares simple applicability and interpretation, and low cost, limited data are available about its prognostic Funding: None. Conflict of Interest: None of the authors have any conflicts of interest associated with the work presented in this manuscript. Authorship: All authors had access to the data and played a role in writing this manuscript. Requests for reprints should be addressed to Simone Vanni, MD, PhD, Emergency Department, AOU-Careggi, Viale Pieraccini 17, 50139 Firenze, Italy. E-mail address: [email protected] 0002-9343/$ -see front matter © 2009 Elsevier Inc. All rights reserved. doi:10.1016/j.amjmed.2008.08.031

Welcome message from author
This document is posted to help you gain knowledge. Please leave a comment to let me know what you think about it! Share it to your friends and learn new things together.
Transcript
C
PPSF
T
Pfno
a
w
EF
0d
LINICAL RESEARCH STUDY
rognostic Value of ECG Among Patients with Acuteulmonary Embolism and Normal Blood Pressure
imone Vanni, MD, PhD, Gianluca Polidori, MD, Ruben Vergara, MD, Giuseppe Pepe, MD, PhD, Peiman Nazerian, MD,ederico Moroni, MD, Emanuele Garbelli, MD, Fabio Daviddi, MD, Stefano Grifoni, MD
he Emergency Department, Azienda Ospedaliero-Universitaria Careggi, Florence, Italy.
OwMUb1pbomR(rscvoCap©
E-mail address
002-9343/$ -see foi:10.1016/j.amjm
ABSTRACT
BJECTIVE: To investigate the prognostic value of electrocardiography (ECG) alone or in combinationith echocardiography in patients with acute pulmonary embolism and normal blood pressure.ETHODS: Consecutive adult patients presenting to the emergency department at Azienda Ospedaliero-niversitaria Careggi with the first episode of pulmonary embolism were included. Patients with systoliclood pressure less than 100 mm Hg were excluded. ECG and echocardiography were performed withinhour from diagnosis and evaluated in a blinded fashion. Right ventricular strain was diagnosed in the
resence of one or more of the following ECG findings: complete or incomplete right ventricular branchlock, S1Q3T3, and negative T wave in V1-V4. The main outcome measurement was clinical deteriorationr death during in-hospital stay. The association of variables with the main outcome was evaluated byultivariate Cox survival analysis.ESULTS: A total of 386 patients with proved pulmonary embolism were included in the study; 201 patients52%) had right ventricular dysfunction according to echocardiography, and 130 patients (34%) showedight ventricular strain. Twenty-three patients (6%) had clinical deterioration or died. At multivariateurvival analysis, right ventricular strain was associated with adverse outcome (hazard ratio 2.58; 95%onfidence interval, 1.05-6.36) independently of echocardiographic findings. Patients with both rightentricular strain and right ventricular dysfunction (26%) showed an 8-fold elevated risk of adverseutcome (hazard ratio 8.47; 95% confidence interval, 2.43-29.47).ONCLUSION: Right ventricular strain pattern on ECG is associated with adverse short-term outcome anddds incremental prognostic value to echocardiographic evidence of right ventricular dysfunction inatients with acute pulmonary embolism and normal blood pressure.
2009 Elsevier Inc. All rights reserved. • The American Journal of Medicine (2009) 122, 257-264
KEYWORDS: Echocardiography; Electrocardiography; Prognosis; Pulmonary embolism; Right ventricular dys-function
iavpfhpgwtot
ulmonary embolism has different clinical presentations,rom mild complaints to shock. One of the main determi-ants of clinical presentation and prognosis is the extensionf obstruction within the pulmonary circulation.1 Accord-
Funding: None.Conflict of Interest: None of the authors have any conflicts of interest
ssociated with the work presented in this manuscript.Authorship: All authors had access to the data and played a role in
riting this manuscript.Requests for reprints should be addressed to Simone Vanni, MD, PhD,
mergency Department, AOU-Careggi, Viale Pieraccini 17, 50139irenze, Italy.
ront matter © 2009 Elsevier Inc. All rights reserved.ed.2008.08.031
ngly, the presence of acute right ventricular dysfunction isn important prognostic factor.1-5 In these studies, rightentricular dysfunction was diagnosed by echocardiogra-hy. However, echocardiography may be difficult to per-orm in the emergency setting. Electrocardiography (ECG)as a widespread use and is easily performed and inter-reted in the emergency department. Some electrocardio-raphic signs, indicated as “right ventricular strain” pattern,ere found to be related to the extension of obstruction in
he pulmonary circulation6 and to right ventricular pressureverload7,8 with potential prognostic implications. Al-hough ECG shares simple applicability and interpretation,
nd low cost, limited data are available about its prognostic
vsbema
ttaesttvvb
M
SPCpJphcElmttEmecongsotsppa
ima
MPpc
EIasa
tniusotc
EAtdsciTpsieee
ESe
ular d
258 The American Journal of Medicine, Vol 122, No 3, March 2009
alue in patients with pulmonary embolism,9,10 and notudy has specifically investigated patients with normallood pressure. This patient population represents the larg-st proportion of patients with pulmonary embolism and theain therapeutic challenge because of actual uncertainty
bout best treatment.11
The present study was designedo investigate the potential prognos-ic value of ECG in patients withn objectively confirmed pulmonarymbolism and normal blood pres-ure. Furthermore, we comparedhe prognostic relevance of elec-rocardiographic evidence of rightentricular strain with that of rightentricular dysfunction as revealedy echocardiography.
ATERIALS AND METHODS
etting and Selection ofarticipantsonsecutive adult patients whoresented from January 1998 toune 2006 to the emergency de-artment of a third-level teachingospital (Careggi, Florence, Italy) with the clinical suspi-ion of pulmonary embolism were considered for the study.xclusion criteria were systolic arterial pressure persistently
ess than 100 mm Hg, a prior documented episode of pul-onary embolism, and a history of severe chronic obstruc-
ive pulmonary disease or echocardiographic signs of long-erm right ventricular overload (see “Echocardiographicxamination”). Patients with life expectancy less than 6onths also were excluded. The diagnosis of pulmonary
mbolism was established by perfusion lung scan or spiralomputed tomography.4,5 A direct scan of the lungs wasbtained using the multislice computed tomographic scan-er Siemens Sensation 4 (Siemens Medical Systems, Erlan-en, Germany), with 1-mm slices every 20 mm and atandard sequential acquisition technique. After the injectionf contrast material, adjacent 3-mm slices were obtained overhe hilar region using the spiral acquisition technique. Totalcan time ranged from 5 to 10 minutes. The diagnosis ofulmonary embolism was based on the direct visualization ofartial or complete filling defects within the pulmonaryrteries.
Patients with proved pulmonary embolism were enrolledn the study and gave written consent to the use of theiredical information for research purposes. The study was
pproved by the institutional review board.
anagement Strategies and Study Designatients were managed as described.4 Briefly, the initialatient assessment in the emergency department included
CLINICAL SIGNIF
● Right ventricularciated with incrdeath or clinicashort term.
● Right ventricularcremental progndiographic evidedysfunction.
● Patients with rshould receive stand accurate evatherapy as patienphic right ventric
linical history, physical examination, chest x-ray, 12-lead n
CG, arterial blood gas analysis, and echocardiography.ntravenous unfractionated heparin was started as soons pulmonary embolism was suspected with standard do-es,12 and thrombolysis (recombined tissue plasminogenctivator, 100 mg intravenously for 2 hours) was insti-
tuted in patients with pulmonaryembolism and right ventriculardysfunction as deemed appropri-ate by the attending physician.
To establish the prognostic roleof ECG in normotensive patientsand to compare ECG prognosticvalue with echocardiography, bothECG and echocardiography wereperformed prospectively at pre-sentation blinded to the patient’sclinical history and other testresults.
The primary end point was acomposite of death for any causeand clinical deterioration (definedas progression to shock, mechanicalventilation, or cardiopulmonary re-suscitation, or the need for infusionof a catecholamine, except for do-pamine infused at a rate �5 �g/kg/min) during in-hospital stay.
The sample size was calculated assuming an incidence ofhe primary end point in normotensive patients with pulmo-ary embolism with or without right ventricular strain sim-lar to that of those patients with and without right ventric-lar dysfunction (�11% and 3%, respectively).4 When weet the type I error level at 5%, a sample size of 130 pairsf subjects offered 80% power to detect a difference fromhe incidence of the primary end point in the exposedompared with nonexposed patients.
lectrocardiography12-lead ECG was obtained in all patients with an objec-
ively confirmed pulmonary embolism within 1 hour fromiagnosis. ECG was indicative of acute right ventriculartrain when at least one of the following patterns was found:omplete or incomplete right bundle branch block, S wavesn lead I combined with Q waves in lead III with or without
inversion in lead III (S1Q3T3), or inverted T waves inrecordial leads V1, V2, and V3. We chose only these 3igns because we think they were the most frequently usedn the everyday practice. The ECGs were examined by 2xpert independent readers. Interobserver agreement (K co-fficient) was 0.88. In case of discordance, the ECG wasxamined by a third independent reader.
chocardiographic Examinationtandard color 2-dimensional echocardiographic Dopplerxaminations were performed within 1 hour from the diag-
CE
n pattern is asso-risk of all-cause
erioration in the
n pattern adds in-value to echocar-f right ventricular
ventricular strainlinical surveillancen for reperfusion
ith echocardiogra-ysfunction.
ICAN
straieasedl det
straiosticnce o
ightrict cluatiots w
osis of pulmonary embolism as previously described.4
Bwroaaeguhc
CIt(mtra
SDTwp
omarcpeerawropaEmccmltPtt
AFP
R
C
TRT
259Vanni et al ECG and Pulmonary Embolism Prognosis
riefly, patients with at least one of the following findingsere diagnosed with acute right ventricular dysfunction:
ight ventricular dilatation (end-diastolic diameter �30 mmr right/left ventricular end-diastolic diameter ratio �1 inpical 4-chamber view); paradoxical septal systolic motion;nd/or pulmonary hypertension (Doppler pulmonary accel-ration time �90 ms or presence of a right ventricular/atrialradient �30 mm Hg). Patients with signs of right ventric-lar overload in the presence of right ventricular free wallypertrophy (end-diastolic thickness �6 mm) were ex-luded from the study.
ardiac Troponin I Testingn a subset of patients (n � 78), starting from 2004, cardiacroponin I was determined on an ADVIA Centaur AnalyzerBayer VitalGmbH, Fernwald, Germany) according to theanufacturer’s instructions. The investigator responsible for
he measurements was unaware of the patients’ baseline pa-ameters or clinical course. Reported values in normal healthydults by our central laboratory are less than 0.15 ng/mL.
tatistical Analysisata points are expressed as means � standard deviation.he unpaired Student t test or 1-way analysis of varianceas used to compare normally distributed data where ap-
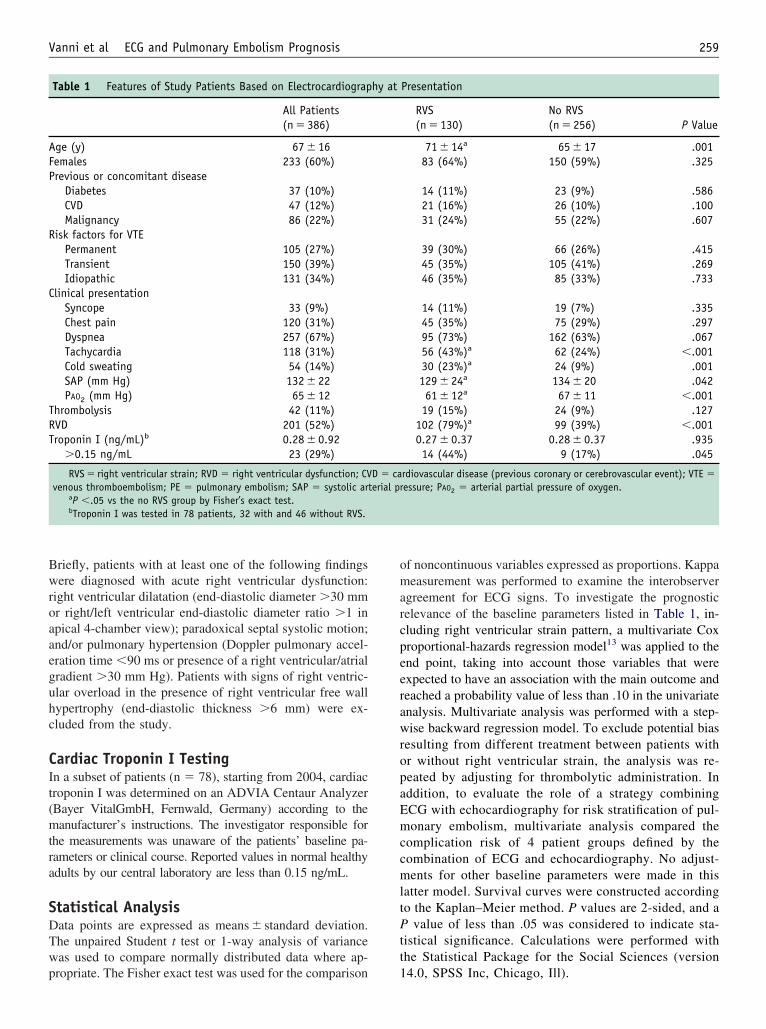
Table 1 Features of Study Patients Based on Electrocardiograp
All Patients(n � 386)
ge (y) 67 � 16emales 233 (60%)revious or concomitant disease
Diabetes 37 (10%)CVD 47 (12%)Malignancy 86 (22%)
isk factors for VTEPermanent 105 (27%)Transient 150 (39%)Idiopathic 131 (34%)
linical presentationSyncope 33 (9%)Chest pain 120 (31%)Dyspnea 257 (67%)Tachycardia 118 (31%)Cold sweating 54 (14%)SAP (mm Hg) 132 � 22PAO2 (mm Hg) 65 � 12
hrombolysis 42 (11%)VD 201 (52%)roponin I (ng/mL)b 0.28 � 0.92
�0.15 ng/mL 23 (29%)
RVS � right ventricular strain; RVD � right ventricular dysfunction; CVvenous thromboembolism; PE � pulmonary embolism; SAP � systolic art
aP �.05 vs the no RVS group by Fisher’s exact test.bTroponin I was tested in 78 patients, 32 with and 46 without RVS.
ropriate. The Fisher exact test was used for the comparison 1
f noncontinuous variables expressed as proportions. Kappaeasurement was performed to examine the interobserver
greement for ECG signs. To investigate the prognosticelevance of the baseline parameters listed in Table 1, in-luding right ventricular strain pattern, a multivariate Coxroportional-hazards regression model13 was applied to thend point, taking into account those variables that werexpected to have an association with the main outcome andeached a probability value of less than .10 in the univariatenalysis. Multivariate analysis was performed with a step-ise backward regression model. To exclude potential bias
esulting from different treatment between patients withr without right ventricular strain, the analysis was re-eated by adjusting for thrombolytic administration. Inddition, to evaluate the role of a strategy combiningCG with echocardiography for risk stratification of pul-onary embolism, multivariate analysis compared the
omplication risk of 4 patient groups defined by theombination of ECG and echocardiography. No adjust-ents for other baseline parameters were made in this
atter model. Survival curves were constructed accordingo the Kaplan–Meier method. P values are 2-sided, and a
value of less than .05 was considered to indicate sta-istical significance. Calculations were performed withhe Statistical Package for the Social Sciences (version
Presentation
RVS No RVSP Value(n � 130) (n � 256)
71 � 14a 65 � 17 .00183 (64%) 150 (59%) .325
14 (11%) 23 (9%) .58621 (16%) 26 (10%) .10031 (24%) 55 (22%) .607
39 (30%) 66 (26%) .41545 (35%) 105 (41%) .26946 (35%) 85 (33%) .733
14 (11%) 19 (7%) .33545 (35%) 75 (29%) .29795 (73%) 162 (63%) .06756 (43%)a 62 (24%) �.00130 (23%)a 24 (9%) .001129 � 24a 134 � 20 .04261 � 12a 67 � 11 �.001
19 (15%) 24 (9%) .127102 (79%)a 99 (39%) �.0010.27 � 0.37 0.28 � 0.37 .93514 (44%) 9 (17%) .045
rdiovascular disease (previous coronary or cerebrovascular event); VTE �essure; PAO2 � arterial partial pressure of oxygen.
hy at
D � caerial pr
4.0, SPSS Inc, Chicago, Ill).
R
PAct3wcncgpTt
ypTln(
p4Avca
c1(fah
EAur
ssttratydnayw9acp
m
C
DC
V
RRSTDP(Cs
260 The American Journal of Medicine, Vol 122, No 3, March 2009
ESULTS
atients and Managementtotal of 557 consecutive patients with an objectively
onfirmed acute pulmonary embolism were considered forhe study from January 1998 to June 2006. Of these patients,6 were excluded because of shock on admission (7%),hereas 123 additional patients (22%) were excluded be-
ause they had a documented previous episode of pulmo-ary embolism (50 patients), were affected by severehronic obstructive pulmonary disease, had echocardio-raphic signs of long-standing right ventricular overload (63atients), or lacked adequate acoustic window (14 patients).welve patients declined to participate. Therefore, 386 pa-
ients were included in the study.Patients had a mean age of 67 � 16 years (range 18-92
ears), and 233 (60%) were female (Table 1). Of the overallatients, 131 (34%) had an idiopathic pulmonary embolism.he diagnosis of pulmonary embolism was performed by
ung scan (162 patients), CT scan (195 patients), or pulmo-ary angiography (29 patients). A total of 234 patients61%) had a concomitant deep vein thrombosis.
Intravenous unfractionated heparin was started in allatients as soon as pulmonary embolism was suspected, and3 patients (11%) were treated with thrombolytic agents.fter the initial treatment, 375 patients (97%) receiveditamin K antagonists and 11 patients (3%) received a venaava filter because of permanent contraindications tonticoagulation.
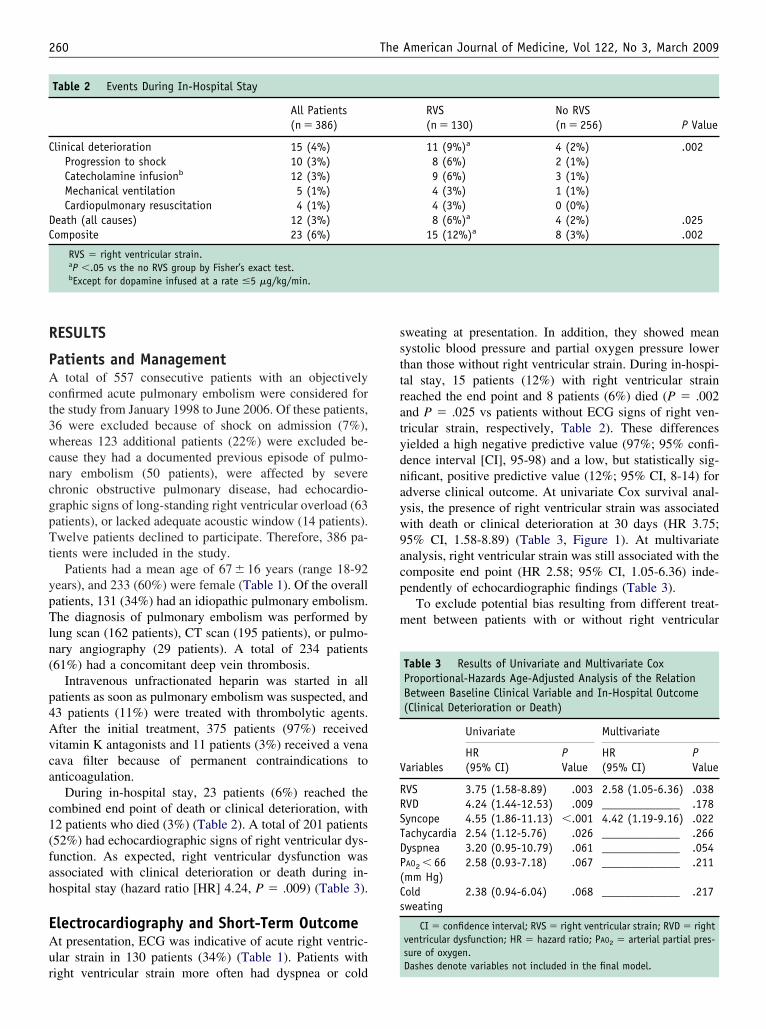
During in-hospital stay, 23 patients (6%) reached theombined end point of death or clinical deterioration, with2 patients who died (3%) (Table 2). A total of 201 patients52%) had echocardiographic signs of right ventricular dys-unction. As expected, right ventricular dysfunction wasssociated with clinical deterioration or death during in-ospital stay (hazard ratio [HR] 4.24, P � .009) (Table 3).
lectrocardiography and Short-Term Outcomet presentation, ECG was indicative of acute right ventric-lar strain in 130 patients (34%) (Table 1). Patients with
Table 2 Events During In-Hospital Stay
All Patients(n � 386)
linical deterioration 15 (4%)Progression to shock 10 (3%)Catecholamine infusionb 12 (3%)Mechanical ventilation 5 (1%)Cardiopulmonary resuscitation 4 (1%)
eath (all causes) 12 (3%)omposite 23 (6%)
RVS � right ventricular strain.aP �.05 vs the no RVS group by Fisher’s exact test.bExcept for dopamine infused at a rate �5 �g/kg/min.
ight ventricular strain more often had dyspnea or cold
weating at presentation. In addition, they showed meanystolic blood pressure and partial oxygen pressure lowerhan those without right ventricular strain. During in-hospi-al stay, 15 patients (12%) with right ventricular straineached the end point and 8 patients (6%) died (P � .002nd P � .025 vs patients without ECG signs of right ven-ricular strain, respectively, Table 2). These differencesielded a high negative predictive value (97%; 95% confi-ence interval [CI], 95-98) and a low, but statistically sig-ificant, positive predictive value (12%; 95% CI, 8-14) fordverse clinical outcome. At univariate Cox survival anal-sis, the presence of right ventricular strain was associatedith death or clinical deterioration at 30 days (HR 3.75;5% CI, 1.58-8.89) (Table 3, Figure 1). At multivariatenalysis, right ventricular strain was still associated with theomposite end point (HR 2.58; 95% CI, 1.05-6.36) inde-endently of echocardiographic findings (Table 3).
To exclude potential bias resulting from different treat-ent between patients with or without right ventricular
RVS No RVSP Value(n � 130) (n � 256)
11 (9%)a 4 (2%) .0028 (6%) 2 (1%)9 (6%) 3 (1%)4 (3%) 1 (1%)4 (3%) 0 (0%)8 (6%)a 4 (2%) .025
15 (12%)a 8 (3%) .002
Table 3 Results of Univariate and Multivariate CoxProportional-Hazards Age-Adjusted Analysis of the RelationBetween Baseline Clinical Variable and In-Hospital Outcome(Clinical Deterioration or Death)
ariables
Univariate Multivariate
HR(95% CI)
PValue
HR(95% CI)
PValue
VS 3.75 (1.58-8.89) .003 2.58 (1.05-6.36) .038VD 4.24 (1.44-12.53) .009 _____________ .178yncope 4.55 (1.86-11.13) �.001 4.42 (1.19-9.16) .022achycardia 2.54 (1.12-5.76) .026 _____________ .266yspnea 3.20 (0.95-10.79) .061 _____________ .054AO2 � 66mm Hg)
2.58 (0.93-7.18) .067 _____________ .211
oldweating
2.38 (0.94-6.04) .068 _____________ .217
CI � confidence interval; RVS � right ventricular strain; RVD � rightventricular dysfunction; HR � hazard ratio; PAO2 � arterial partial pres-sure of oxygen.
Dashes denote variables not included in the final model.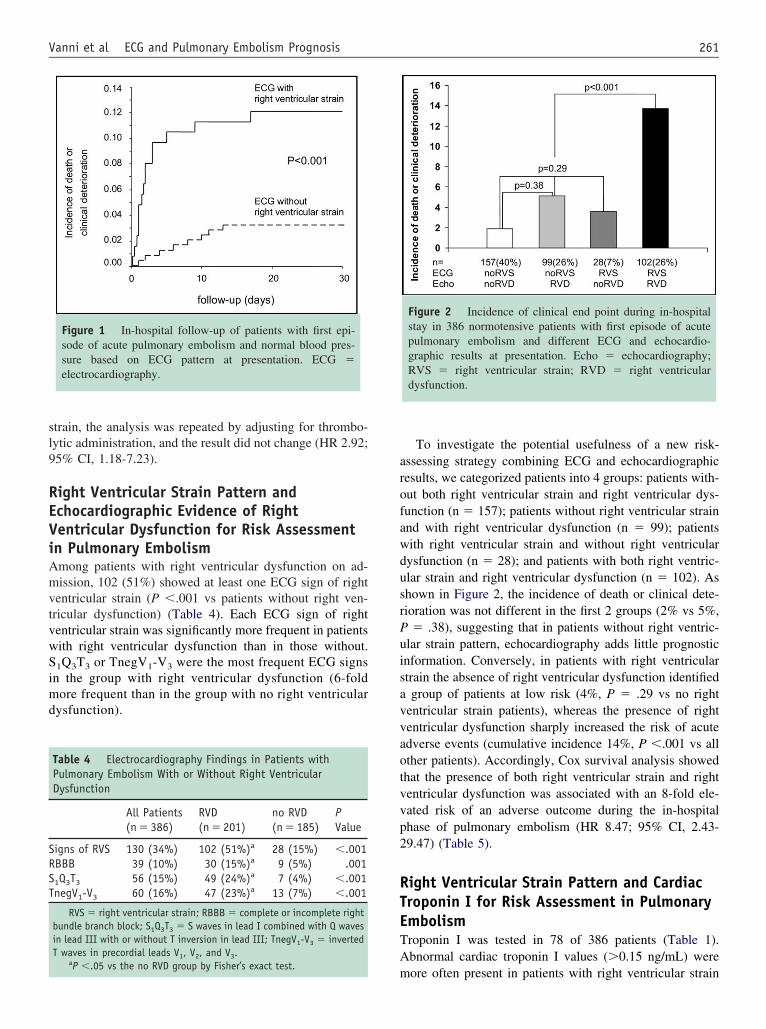
sl9
REViAmvtvwSimd
arofawdusrPuisavvaotvvp2
RTETA
SRST
261Vanni et al ECG and Pulmonary Embolism Prognosis
train, the analysis was repeated by adjusting for thrombo-ytic administration, and the result did not change (HR 2.92;5% CI, 1.18-7.23).
ight Ventricular Strain Pattern andchocardiographic Evidence of Rightentricular Dysfunction for Risk Assessmentn Pulmonary Embolismmong patients with right ventricular dysfunction on ad-ission, 102 (51%) showed at least one ECG sign of right
entricular strain (P �.001 vs patients without right ven-ricular dysfunction) (Table 4). Each ECG sign of rightentricular strain was significantly more frequent in patientsith right ventricular dysfunction than in those without.
1Q3T3 or TnegV1-V3 were the most frequent ECG signsn the group with right ventricular dysfunction (6-foldore frequent than in the group with no right ventricular
ysfunction).
Figure 1 In-hospital follow-up of patients with first epi-sode of acute pulmonary embolism and normal blood pres-sure based on ECG pattern at presentation. ECG �electrocardiography.
Table 4 Electrocardiography Findings in Patients withPulmonary Embolism With or Without Right VentricularDysfunction
All Patients RVD no RVD PValue(n � 386) (n � 201) (n � 185)
igns of RVS 130 (34%) 102 (51%)a 28 (15%) �.001BBB 39 (10%) 30 (15%)a 9 (5%) .0011Q3T3 56 (15%) 49 (24%)a 7 (4%) �.001negV1-V3 60 (16%) 47 (23%)a 13 (7%) �.001
RVS � right ventricular strain; RBBB � complete or incomplete rightbundle branch block; S1Q3T3 � S waves in lead I combined with Q wavesin lead III with or without T inversion in lead III; TnegV1-V3 � invertedT waves in precordial leads V1, V2, and V3.
a
mP �.05 vs the no RVD group by Fisher’s exact test.
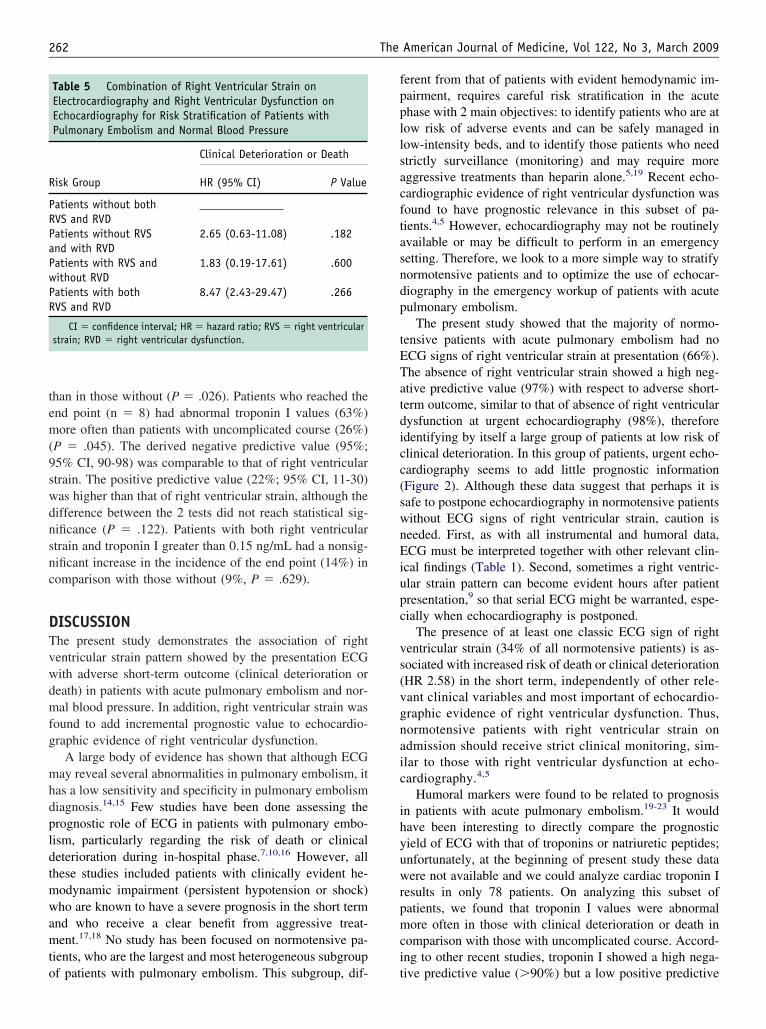
To investigate the potential usefulness of a new risk-ssessing strategy combining ECG and echocardiographicesults, we categorized patients into 4 groups: patients with-ut both right ventricular strain and right ventricular dys-unction (n � 157); patients without right ventricular strainnd with right ventricular dysfunction (n � 99); patientsith right ventricular strain and without right ventricularysfunction (n � 28); and patients with both right ventric-lar strain and right ventricular dysfunction (n � 102). Ashown in Figure 2, the incidence of death or clinical dete-ioration was not different in the first 2 groups (2% vs 5%,
� .38), suggesting that in patients without right ventric-lar strain pattern, echocardiography adds little prognosticnformation. Conversely, in patients with right ventriculartrain the absence of right ventricular dysfunction identifiedgroup of patients at low risk (4%, P � .29 vs no right
entricular strain patients), whereas the presence of rightentricular dysfunction sharply increased the risk of acutedverse events (cumulative incidence 14%, P �.001 vs allther patients). Accordingly, Cox survival analysis showedhat the presence of both right ventricular strain and rightentricular dysfunction was associated with an 8-fold ele-ated risk of an adverse outcome during the in-hospitalhase of pulmonary embolism (HR 8.47; 95% CI, 2.43-9.47) (Table 5).
ight Ventricular Strain Pattern and Cardiacroponin I for Risk Assessment in Pulmonarymbolismroponin I was tested in 78 of 386 patients (Table 1).bnormal cardiac troponin I values (�0.15 ng/mL) were
Figure 2 Incidence of clinical end point during in-hospitalstay in 386 normotensive patients with first episode of acutepulmonary embolism and different ECG and echocardio-graphic results at presentation. Echo � echocardiography;RVS � right ventricular strain; RVD � right ventriculardysfunction.
ore often present in patients with right ventricular strain
tem(9swdnsnc
DTvwdmfg
mhdpldtmwamto
fppllsacftasndp
tETatdicc(swnEiupc
vs(vgnaic
ihyuwrpmci
R
PRPaPwPR
262 The American Journal of Medicine, Vol 122, No 3, March 2009
han in those without (P � .026). Patients who reached thend point (n � 8) had abnormal troponin I values (63%)ore often than patients with uncomplicated course (26%)
P � .045). The derived negative predictive value (95%;5% CI, 90-98) was comparable to that of right ventriculartrain. The positive predictive value (22%; 95% CI, 11-30)as higher than that of right ventricular strain, although theifference between the 2 tests did not reach statistical sig-ificance (P � .122). Patients with both right ventriculartrain and troponin I greater than 0.15 ng/mL had a nonsig-ificant increase in the incidence of the end point (14%) inomparison with those without (9%, P � .629).
ISCUSSIONhe present study demonstrates the association of rightentricular strain pattern showed by the presentation ECGith adverse short-term outcome (clinical deterioration oreath) in patients with acute pulmonary embolism and nor-al blood pressure. In addition, right ventricular strain was
ound to add incremental prognostic value to echocardio-raphic evidence of right ventricular dysfunction.
A large body of evidence has shown that although ECGay reveal several abnormalities in pulmonary embolism, it
as a low sensitivity and specificity in pulmonary embolismiagnosis.14,15 Few studies have been done assessing therognostic role of ECG in patients with pulmonary embo-ism, particularly regarding the risk of death or clinicaleterioration during in-hospital phase.7,10,16 However, allhese studies included patients with clinically evident he-odynamic impairment (persistent hypotension or shock)ho are known to have a severe prognosis in the short term
nd who receive a clear benefit from aggressive treat-ent.17,18 No study has been focused on normotensive pa-
ients, who are the largest and most heterogeneous subgroup
Table 5 Combination of Right Ventricular Strain onElectrocardiography and Right Ventricular Dysfunction onEchocardiography for Risk Stratification of Patients withPulmonary Embolism and Normal Blood Pressure
isk Group
Clinical Deterioration or Death
HR (95% CI) P Value
atients without bothVS and RVD
______________
atients without RVSnd with RVD
2.65 (0.63-11.08) .182
atients with RVS andithout RVD
1.83 (0.19-17.61) .600
atients with bothVS and RVD
8.47 (2.43-29.47) .266
CI � confidence interval; HR � hazard ratio; RVS � right ventricularstrain; RVD � right ventricular dysfunction.
f patients with pulmonary embolism. This subgroup, dif- t
erent from that of patients with evident hemodynamic im-airment, requires careful risk stratification in the acutehase with 2 main objectives: to identify patients who are atow risk of adverse events and can be safely managed inow-intensity beds, and to identify those patients who needtrictly surveillance (monitoring) and may require moreggressive treatments than heparin alone.5,19 Recent echo-ardiographic evidence of right ventricular dysfunction wasound to have prognostic relevance in this subset of pa-ients.4,5 However, echocardiography may not be routinelyvailable or may be difficult to perform in an emergencyetting. Therefore, we look to a more simple way to stratifyormotensive patients and to optimize the use of echocar-iography in the emergency workup of patients with acuteulmonary embolism.
The present study showed that the majority of normo-ensive patients with acute pulmonary embolism had noCG signs of right ventricular strain at presentation (66%).he absence of right ventricular strain showed a high neg-tive predictive value (97%) with respect to adverse short-erm outcome, similar to that of absence of right ventricularysfunction at urgent echocardiography (98%), thereforedentifying by itself a large group of patients at low risk oflinical deterioration. In this group of patients, urgent echo-ardiography seems to add little prognostic informationFigure 2). Although these data suggest that perhaps it isafe to postpone echocardiography in normotensive patientsithout ECG signs of right ventricular strain, caution iseeded. First, as with all instrumental and humoral data,CG must be interpreted together with other relevant clin-
cal findings (Table 1). Second, sometimes a right ventric-lar strain pattern can become evident hours after patientresentation,9 so that serial ECG might be warranted, espe-ially when echocardiography is postponed.
The presence of at least one classic ECG sign of rightentricular strain (34% of all normotensive patients) is as-ociated with increased risk of death or clinical deteriorationHR 2.58) in the short term, independently of other rele-ant clinical variables and most important of echocardio-raphic evidence of right ventricular dysfunction. Thus,ormotensive patients with right ventricular strain ondmission should receive strict clinical monitoring, sim-lar to those with right ventricular dysfunction at echo-ardiography.4,5
Humoral markers were found to be related to prognosisn patients with acute pulmonary embolism.19-23 It wouldave been interesting to directly compare the prognosticield of ECG with that of troponins or natriuretic peptides;nfortunately, at the beginning of present study these dataere not available and we could analyze cardiac troponin I
esults in only 78 patients. On analyzing this subset ofatients, we found that troponin I values were abnormalore often in those with clinical deterioration or death in
omparison with those with uncomplicated course. Accord-ng to other recent studies, troponin I showed a high nega-
ive predictive value (�90%) but a low positive predictive
vterhhiElceciruptblttpsbr
vimbarrs
attdtsrtwspcEgudcdpta
rw
CTeEdtptst
R
1
1
1
1
1
1
1
263Vanni et al ECG and Pulmonary Embolism Prognosis
alue (�20%) for short-term adverse outcome.21,22 Of note,he same limitation was shared by right ventricular strain,chocardiography, and natriuretic peptides.4,5,21,22 For thiseason, strategies combining humoral and imaging testsave recently been investigated to better identify low- andigh-risk patients.19,23 To our knowledge no previous stud-es investigated the prognostic relevance of combiningCG and echocardiography in acute pulmonary embo-
ism. In our large cohort of normotensive patients, theombination of a right ventricular strain pattern withchocardiographic evidence of right ventricular dysfun-tion was able to identify a subgroup with an 8-foldncreased risk of adverse short-term outcome, similar to thateported for the combination of N-terminal pro-brain natri-retic peptide plus echocardiography (12-fold) and of tro-onin I plus echocardiography (10-fold).19 Reasonably,hese results provide the background for testing the possibleenefits of early pulmonary reperfusion, either by thrombo-ytics or other techniques, in patients with both right ven-ricular strain and right ventricular dysfunction at presenta-ion. On the other hand, we could not demonstrate theotential usefulness of combining troponin I and ECG re-ults for pulmonary embolism prognostication, probablyecause of the small number of patients with troponin Iesults.
Furthermore, other potential associations between rightentricular strain and anamnestic or clinical findings werenvestigated by multivariate analysis, but only syncope re-ained significant (Table 3). Although these findings may
e of potential clinical interest, 9% of patients had syncopet presentation and approximately 4% of patients had bothight ventricular strain and syncope in our cohort, largelyeducing the clinical impact of this subgroup for risktratification.
The main limitation in the use of right ventricular strains a prognostic tool in patients with pulmonary embolism ishat approximately 10% of the normal population may showhese signs, in particular incomplete or complete right bun-le branch block.15 Accordingly, in our series 7% of pa-ients without right ventricular dysfunction had at least oneign of right ventricular strain on admission. However, asevealed by univariate and multivariate analyses, right ven-ricular strain at ECG was not the only variable associatedith the combined end point (Table 3). These data again
uggest that a right ventricular strain pattern must be inter-reted together with other simple clinical variables thatontribute to recognize the prognostic significance ofCG findings. Moreover, in patients with uncertain ori-in of right ventricular strain pattern (acute right ventric-lar overload or not), echocardiography may erase anyoubt. Another important limitation is that the physiciansaring for the patients were aware of ECG and echocar-iographic results, thus introducing potential bias, inarticular because of differences in management andreatment. For this reason, we repeated the multivariate
nalysis by adjusting for thrombolytic treatment, andight ventricular strain remained significantly associatedith the end point.
ONCLUSIONShe present study of normotensive patients with pulmonarymbolism revealed that right ventricular strain pattern atCG is associated with short-term clinical deterioration andeath. When combined with echocardiography, right ven-ricular strain was better able to recognize normotensiveatients at high risk of clinical deterioration. These pa-ients might benefit by strict surveillance during hospitaltay and careful evaluation for pulmonary reperfusionherapy.
eferences1. Tapson VF. Acute pulmonary embolism. N Engl J Med. 2008;358:
1037-1052.2. Kasper W, Konstantinides S, Geibel A, et al. Prognostic significance of
right ventricular afterload stress detected by echocardiography in pa-tients with clinically suspected pulmonary embolism. Heart. 1997;77:346-349.
3. Goldhaber SZ, Visani L, De Rosa M. Acute pulmonary embolism:clinical outcomes in the International Cooperative Pulmonary Embo-lism Registry (ICOPER). Lancet. 1999;353:1386-1389.
4. Grifoni S, Olivotto I, Cecchini P, et al. Short-term clinical outcome ofpatients with acute pulmonary embolism, normal blood pressure, andechocardiographic right ventricular dysfunction. Circulation. 2000;101:2817-2822.
5. Kucher N, Rossi E, De Rosa M, Goldhaber SZ. Prognostic role ofechocardiography among patients with acute pulmonary embolism anda systolic arterial pressure of 90 mm Hg or higher. Arch Intern Med.2005;165:1777-1781.
6. Iles S, Le Heron CJ, Davies G, et al. ECG score predicts those with thegreatest percentage of perfusion defects due to acute pulmonary throm-boembolic disease. Chest. 2004;125:1651-1656.
7. Kucher N, Walpoth N, Wustmann K, et al. QR in V1 an ECG signassociated with right ventricular strain and adverse clinical outcome inpulmonary embolism. Eur Heart J. 2003;24:1113-1119.
8. Punukollu G, Gowda RM, Vasavada B, et al. Role of electrocardiog-raphy in identifying right ventricular dysfunction in acute pulmonaryembolism. Am J Cardiol. 2005;96:450-452.
9. Daniel KR, Courtney DM, Kline JA. Assessment of cardiac stressfrom massive pulmonary embolism with 12-lead ECG. Chest. 2001;120:474-481.
0. Geibel A, Zehender M, Kasper W, et al. Prognostic value of the ECGon admission in patients with acute major pulmonary embolism. EurRespir J. 2005;25:843-848.
1. Wan S, Quinlan DJ, Agnelli G, Eikelboom JW. Thrombolysis com-pared with heparin for the initial treatment of pulmonary embolism: ameta-analysis of the randomized controlled trials. Circulation. 2004;110:744-749.
2. Hyers TM, Agnelli G, Hull RD, et al. Sixth ACCP Consensus Con-ference on antithrombotic therapy. Antithrombotic therapy for venousthromboembolic disease. Chest. 2001;119:176S-193S.
3. Cox DR. Regression models and life tables (with discussion). J RStatist Soc B. 1972;34:187-220.
4. Manganelli D, Palla A, Donnamaria V, Giuntini C. Clinical featuresof pulmonary embolism. Doubts and certainties. Chest. 1995;107(1 Suppl):25S-32S.
5. Richman PB, Loutfi H, Lester SJ, et al. Electrocardiographic findingsin emergency department patients with pulmonary embolism. J EmergMed. 2004;27:121-126.
6. Kosuge M, Kimura K, Ishikawa T, et al. Prognostic significance ofinverted T waves in patients with acute pulmonary embolism. Circ J.
2006;70:750-755.
1
1
1
2
2
2
2
264 The American Journal of Medicine, Vol 122, No 3, March 2009
7. Task Force on Pulmonary Embolism, European Society of Cardiology.Guidelines on diagnosis and management of acute pulmonary embo-lism. Eur Heart J. 2000;21:1301-1336.
8. British Thoracic Society guidelines for the management of suspectedacute pulmonary embolism. Thorax. 2003;58:470-483.
9. Binder L, Pieske B, Olschewski M, et al. N-terminal pro-brain natri-uretic peptide or troponin testing followed by echocardiography forrisk stratification of acute pulmonary embolism. Circulation. 2005;112:1573-1579.
0. Konstantinides S, Geibel A, Heusel G, et al; Management Strateg-
ies and Prognosis of Pulmonary Embolism-3 Trial Investigators. Hepa-rin plus alteplase compared with heparin alone in patients withsubmassive pulmonary embolism. N Engl J Med. 2002;347:1143-1150.
1. Meyer T, Binder L, Hruska N, et al. Cardiac troponin I elevation inacute pulmonary embolism is associated with right ventriculardysfunction. J Am Coll Cardiol. 2000;36:1632-1636.
2. Kucher N, Goldhaber SZ. Cardiac biomarkers for risk stratification of patientswith acute pulmonary embolism. Circulation. 2003;108:2191-2194.
3. Kucher N, Wallmann D, Carone A, et al. Incremental prognostic valueof troponin I and echocardiography in patients with acute pulmonary
embolism. Eur Heart J. 2003;24:1651-1656.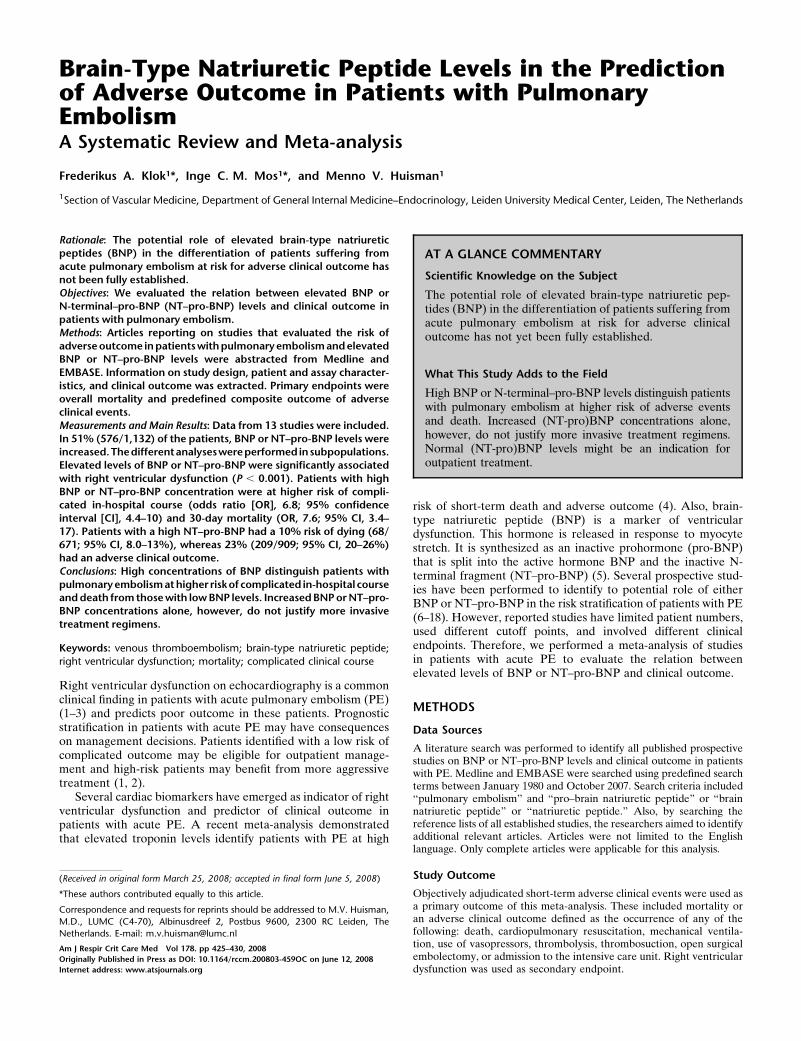
Brain-Type Natriuretic Peptide Levels in the Predictionof Adverse Outcome in Patients with PulmonaryEmbolismA Systematic Review and Meta-analysis
Frederikus A. Klok1*, Inge C. M. Mos1*, and Menno V. Huisman1
1Section of Vascular Medicine, Department of General Internal Medicine–Endocrinology, Leiden University Medical Center, Leiden, The Netherlands
Rationale: The potential role of elevated brain-type natriureticpeptides (BNP) in the differentiation of patients suffering fromacute pulmonary embolism at risk for adverse clinical outcome hasnot been fully established.Objectives: We evaluated the relation between elevated BNP orN-terminal–pro-BNP (NT–pro-BNP) levels and clinical outcome inpatients with pulmonary embolism.Methods: Articles reporting on studies that evaluated the risk ofadverse outcome in patients with pulmonaryembolism and elevatedBNP or NT–pro-BNP levels were abstracted from Medline andEMBASE. Information on study design, patient and assay character-istics, and clinical outcome was extracted. Primary endpoints wereoverall mortality and predefined composite outcome of adverseclinical events.Measurements and Main Results: Data from 13 studies were included.In 51% (576/1,132) of the patients, BNP or NT–pro-BNP levels wereincreased.Thedifferentanalyseswereperformedinsubpopulations.Elevated levels of BNP or NT–pro-BNP were significantly associatedwith right ventricular dysfunction (P , 0.001). Patients with highBNP or NT–pro-BNP concentration were at higher risk of compli-cated in-hospital course (odds ratio [OR], 6.8; 95% confidenceinterval [CI], 4.4–10) and 30-day mortality (OR, 7.6; 95% CI, 3.4–17). Patients with a high NT–pro-BNP had a 10% risk of dying (68/671; 95% CI, 8.0–13%), whereas 23% (209/909; 95% CI, 20–26%)had an adverse clinical outcome.Conclusions: High concentrations of BNP distinguish patients withpulmonaryembolismat higher risk of complicated in-hospital courseand death from those with low BNP levels. Increased BNP or NT–pro-BNP concentrations alone, however, do not justify more invasivetreatment regimens.
Keywords: venous thromboembolism; brain-type natriuretic peptide;
right ventricular dysfunction; mortality; complicated clinical course
Right ventricular dysfunction on echocardiography is a commonclinical finding in patients with acute pulmonary embolism (PE)(1–3) and predicts poor outcome in these patients. Prognosticstratification in patients with acute PE may have consequenceson management decisions. Patients identified with a low risk ofcomplicated outcome may be eligible for outpatient manage-ment and high-risk patients may benefit from more aggressivetreatment (1, 2).
Several cardiac biomarkers have emerged as indicator of rightventricular dysfunction and predictor of clinical outcome inpatients with acute PE. A recent meta-analysis demonstratedthat elevated troponin levels identify patients with PE at high
risk of short-term death and adverse outcome (4). Also, brain-type natriuretic peptide (BNP) is a marker of ventriculardysfunction. This hormone is released in response to myocytestretch. It is synthesized as an inactive prohormone (pro-BNP)that is split into the active hormone BNP and the inactive N-terminal fragment (NT–pro-BNP) (5). Several prospective stud-ies have been performed to identify to potential role of eitherBNP or NT–pro-BNP in the risk stratification of patients with PE(6–18). However, reported studies have limited patient numbers,used different cutoff points, and involved different clinicalendpoints. Therefore, we performed a meta-analysis of studiesin patients with acute PE to evaluate the relation betweenelevated levels of BNP or NT–pro-BNP and clinical outcome.
METHODS
Data Sources
A literature search was performed to identify all published prospectivestudies on BNP or NT–pro-BNP levels and clinical outcome in patientswith PE. Medline and EMBASE were searched using predefined searchterms between January 1980 and October 2007. Search criteria included‘‘pulmonary embolism’’ and ‘‘pro–brain natriuretic peptide’’ or ‘‘brainnatriuretic peptide’’ or ‘‘natriuretic peptide.’’ Also, by searching thereference lists of all established studies, the researchers aimed to identifyadditional relevant articles. Articles were not limited to the Englishlanguage. Only complete articles were applicable for this analysis.
Study Outcome
Objectively adjudicated short-term adverse clinical events were used asa primary outcome of this meta-analysis. These included mortality oran adverse clinical outcome defined as the occurrence of any of thefollowing: death, cardiopulmonary resuscitation, mechanical ventila-tion, use of vasopressors, thrombolysis, thrombosuction, open surgicalembolectomy, or admission to the intensive care unit. Right ventriculardysfunction was used as secondary endpoint.
AT A GLANCE COMMENTARY
Scientific Knowledge on the Subject
The potential role of elevated brain-type natriuretic pep-tides (BNP) in the differentiation of patients suffering fromacute pulmonary embolism at risk for adverse clinicaloutcome has not yet been fully established.
What This Study Adds to the Field
High BNP or N-terminal–pro-BNP levels distinguish patientswith pulmonary embolism at higher risk of adverse eventsand death. Increased (NT-pro)BNP concentrations alone,however, do not justify more invasive treatment regimens.Normal (NT-pro)BNP levels might be an indication foroutpatient treatment.
(Received in original form March 25, 2008; accepted in final form June 5, 2008)
*These authors contributed equally to this article.
Correspondence and requests for reprints should be addressed to M.V. Huisman,
M.D., LUMC (C4-70), Albinusdreef 2, Postbus 9600, 2300 RC Leiden, The
Netherlands. E-mail: [email protected]
Am J Respir Crit Care Med Vol 178. pp 425–430, 2008
Originally Published in Press as DOI: 10.1164/rccm.200803-459OC on June 12, 2008
Internet address: www.atsjournals.org
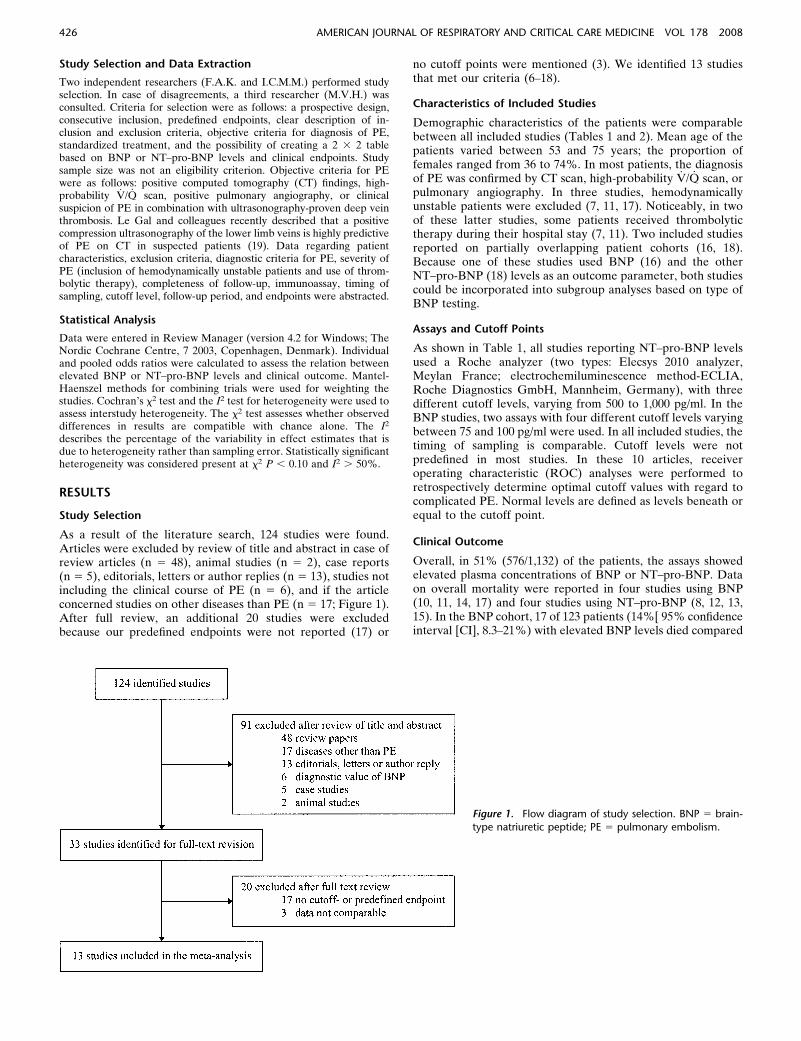
Study Selection and Data Extraction
Two independent researchers (F.A.K. and I.C.M.M.) performed studyselection. In case of disagreements, a third researcher (M.V.H.) wasconsulted. Criteria for selection were as follows: a prospective design,consecutive inclusion, predefined endpoints, clear description of in-clusion and exclusion criteria, objective criteria for diagnosis of PE,standardized treatment, and the possibility of creating a 2 3 2 tablebased on BNP or NT–pro-BNP levels and clinical endpoints. Studysample size was not an eligibility criterion. Objective criteria for PEwere as follows: positive computed tomography (CT) findings, high-probability _V/ _Q scan, positive pulmonary angiography, or clinicalsuspicion of PE in combination with ultrasonography-proven deep veinthrombosis. Le Gal and colleagues recently described that a positivecompression ultrasonography of the lower limb veins is highly predictiveof PE on CT in suspected patients (19). Data regarding patientcharacteristics, exclusion criteria, diagnostic criteria for PE, severity ofPE (inclusion of hemodynamically unstable patients and use of throm-bolytic therapy), completeness of follow-up, immunoassay, timing ofsampling, cutoff level, follow-up period, and endpoints were abstracted.
Statistical Analysis
Data were entered in Review Manager (version 4.2 for Windows; TheNordic Cochrane Centre, 7 2003, Copenhagen, Denmark). Individualand pooled odds ratios were calculated to assess the relation betweenelevated BNP or NT–pro-BNP levels and clinical outcome. Mantel-Haenszel methods for combining trials were used for weighting thestudies. Cochran’s x2 test and the I2 test for heterogeneity were used toassess interstudy heterogeneity. The x2 test assesses whether observeddifferences in results are compatible with chance alone. The I2
describes the percentage of the variability in effect estimates that isdue to heterogeneity rather than sampling error. Statistically significantheterogeneity was considered present at x2 P , 0.10 and I2 . 50%.
RESULTS
Study Selection
As a result of the literature search, 124 studies were found.Articles were excluded by review of title and abstract in case ofreview articles (n 5 48), animal studies (n 5 2), case reports(n 5 5), editorials, letters or author replies (n 5 13), studies notincluding the clinical course of PE (n 5 6), and if the articleconcerned studies on other diseases than PE (n 5 17; Figure 1).After full review, an additional 20 studies were excludedbecause our predefined endpoints were not reported (17) or
no cutoff points were mentioned (3). We identified 13 studiesthat met our criteria (6–18).
Characteristics of Included Studies
Demographic characteristics of the patients were comparablebetween all included studies (Tables 1 and 2). Mean age of thepatients varied between 53 and 75 years; the proportion offemales ranged from 36 to 74%. In most patients, the diagnosisof PE was confirmed by CT scan, high-probability _V/ _Q scan, orpulmonary angiography. In three studies, hemodynamicallyunstable patients were excluded (7, 11, 17). Noticeably, in twoof these latter studies, some patients received thrombolytictherapy during their hospital stay (7, 11). Two included studiesreported on partially overlapping patient cohorts (16, 18).Because one of these studies used BNP (16) and the otherNT–pro-BNP (18) levels as an outcome parameter, both studiescould be incorporated into subgroup analyses based on type ofBNP testing.
Assays and Cutoff Points
As shown in Table 1, all studies reporting NT–pro-BNP levelsused a Roche analyzer (two types: Elecsys 2010 analyzer,Meylan France; electrochemiluminescence method-ECLIA,Roche Diagnostics GmbH, Mannheim, Germany), with threedifferent cutoff levels, varying from 500 to 1,000 pg/ml. In theBNP studies, two assays with four different cutoff levels varyingbetween 75 and 100 pg/ml were used. In all included studies, thetiming of sampling is comparable. Cutoff levels were notpredefined in most studies. In these 10 articles, receiveroperating characteristic (ROC) analyses were performed toretrospectively determine optimal cutoff values with regard tocomplicated PE. Normal levels are defined as levels beneath orequal to the cutoff point.
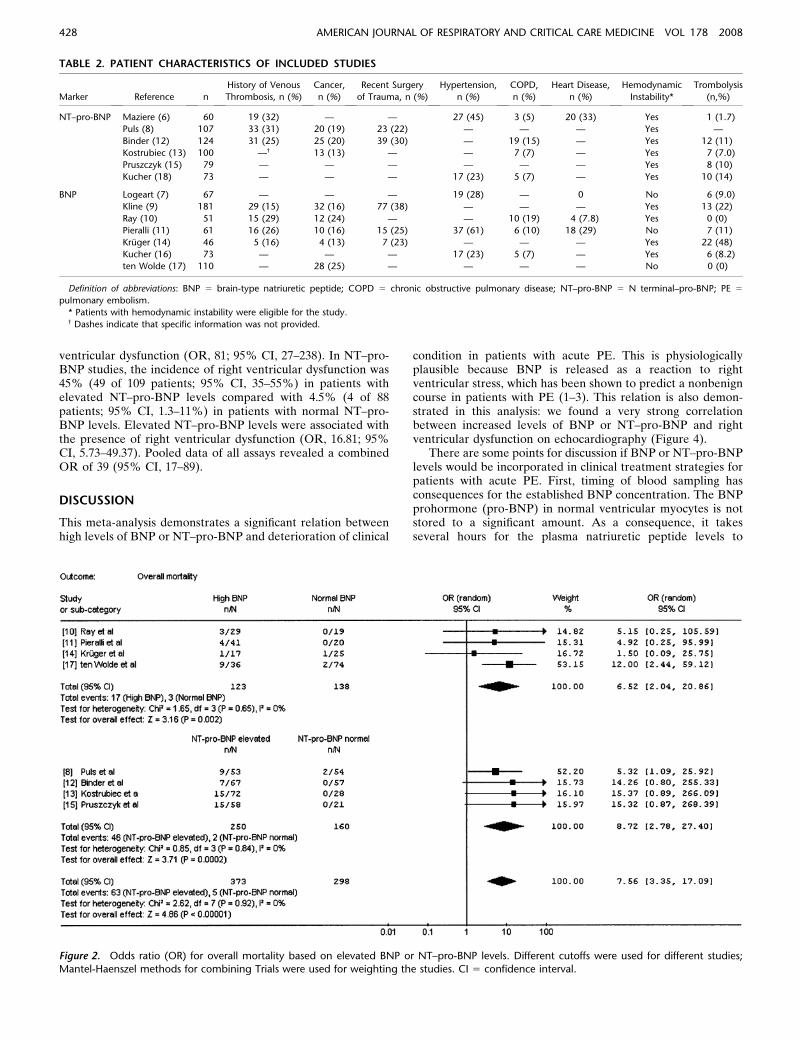
Clinical Outcome
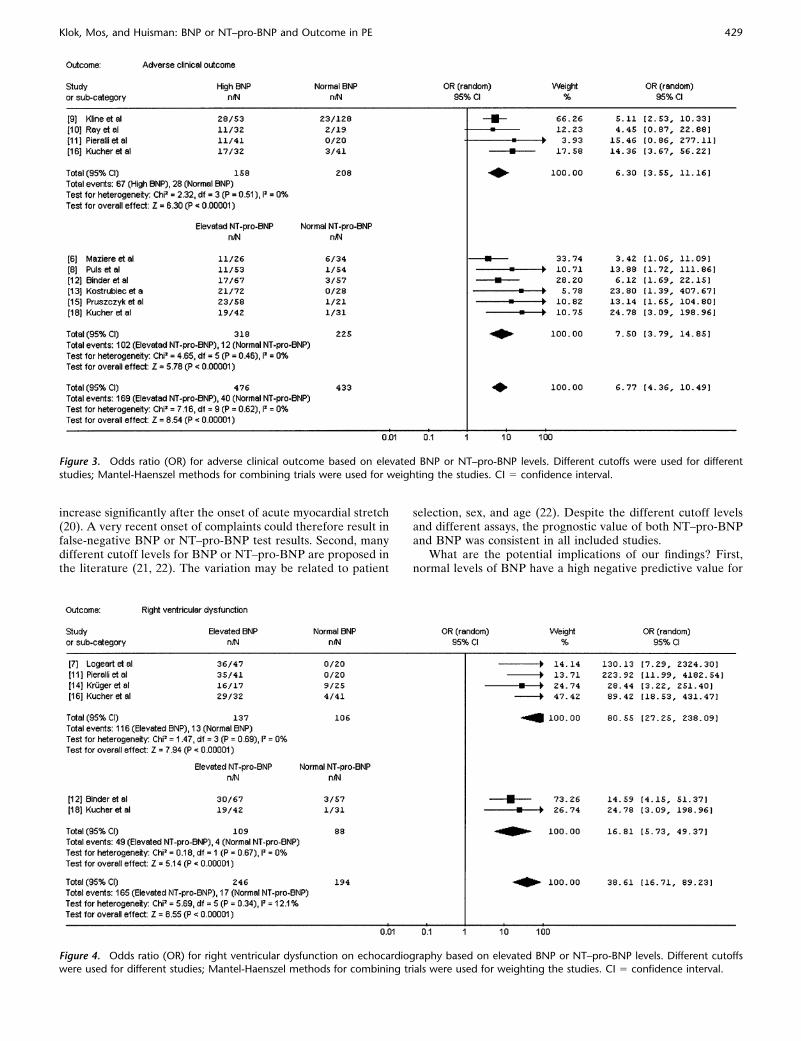
Overall, in 51% (576/1,132) of the patients, the assays showedelevated plasma concentrations of BNP or NT–pro-BNP. Dataon overall mortality were reported in four studies using BNP(10, 11, 14, 17) and four studies using NT–pro-BNP (8, 12, 13,15). In the BNP cohort, 17 of 123 patients (14%[ 95% confidenceinterval [CI], 8.3–21%) with elevated BNP levels died compared
Figure 1. Flow diagram of study selection. BNP 5 brain-type natriuretic peptide; PE 5 pulmonary embolism.
426 AMERICAN JOURNAL OF RESPIRATORY AND CRITICAL CARE MEDICINE VOL 178 2008
with 3 of 138 (2.2%; 95% CI, 0.45–6.2%) of those with normalBNP levels. This resulted in an overall odds ratio (OR) for deathof 6.5 (95% CI, 2.0–21; Figure 2). One study had a follow-up of 3months (17), as compared with the other three, which had in-hospital follow-up. If this single study was left out of the analysis,overall OR decreased to 3.3 (95% CI, 0.6–18). In the NT–pro-BNP cohort, 46 of 250 patients (18%; 95% CI, 14–24%) withelevated NT–pro-BNP levels died in comparison with 2 of 160(1.3%; 95% CI, 0.15–4.4%) of those with normal NT–pro-BNPlevels; OR for death was 8.7 (95% CI, 2.8–27%; Figure 2).
Numbers on PE-related mortality were only available inthree studies (11, 13, 17). Because follow-up time was dissimilarbetween these studies and not all mortality cases were adjudi-cated by an independent, blinded committee to determine thecause of death, we could not use PE-related mortality as anoutcome of this analysis.
Ten studies provided data on adverse clinical outcome (6, 8–13,15, 16, 18) of which six had NT–pro-BNP levels as an outcomeparameter (6, 8, 12, 13, 15, 18). Overall, criteria for adverseclinical outcome were comparable throughout all studies. In theBNP study group, 47 of 128 (37%; 95% CI, 28–46%) patientswith elevated BNP levels had adverse advents during follow-upin comparison with 28 of 208 (13%; 95% CI, 9.1–19%) patientswith normal plasma concentrations. High BNP levels wereassociated with a higher risk of occurrence of adverse clinical
events (OR, 6.3; 95% CI, 3.6–11; Figure 3). This OR was evenhigher (9.5; 95% CI, 3.5–25) after exclusion of one study with6 months of follow-up (9), thereby limiting the outcome to in-hospital clinical course. Of the 318 patients with elevatedNT–pro-BNP levels, 102 experienced short-term adverse events(32%; 95% CI, 27–38%) as compared with 12 of 225 (5.3%;95% CI, 2.8–9.1%) patients with normal NT–pro-BNP levels.Patients with high NT–pro-BNP serum concentration were athigher risk of complicated in-hospital course compared withpatients with normal levels (OR, 7.5; 95% CI, 3.8–15; Figure 3).Pooled data of all assays showed elevated BNP or NT–pro-BNPlevels in 52% of the patients with a risk of 23% (209/909; 95%CI, 20–26%) and an OR of 6.8 (95% CI, 4.4–10) towardcomplicated clinical course.
Right Ventricular Dysfunction
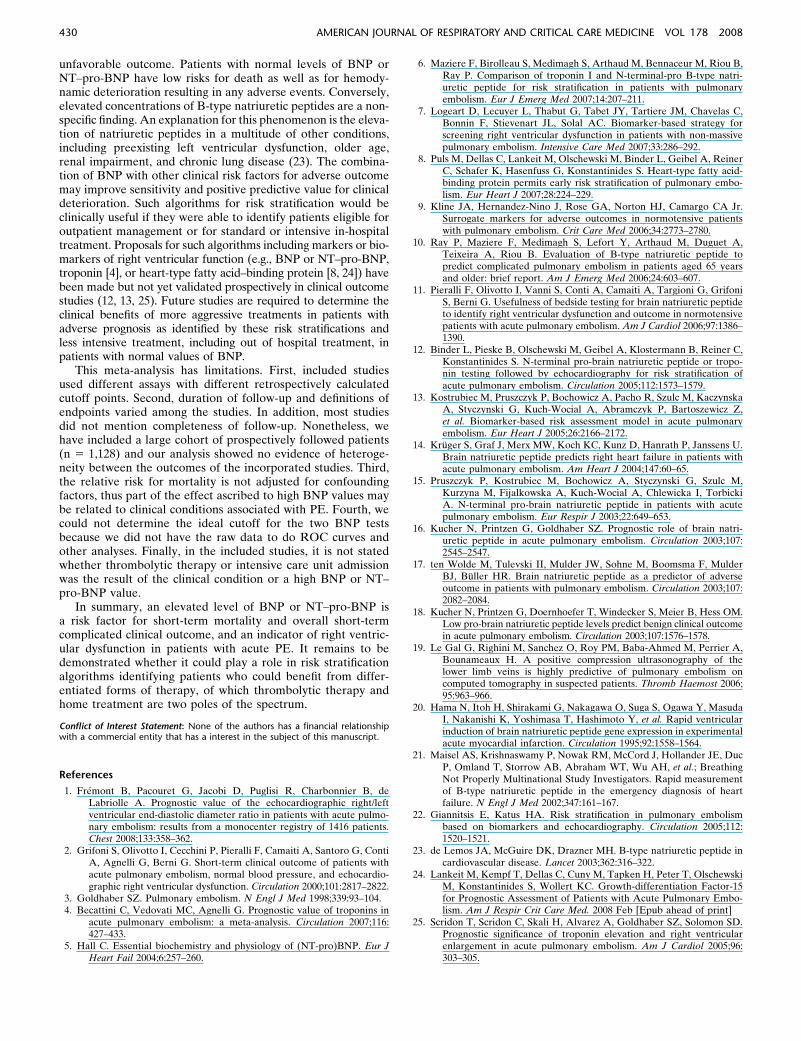
Data on right ventricular dysfunction were reported in sixstudies (Figure 4). Four studies were evaluating BNP (243patients) (7, 11, 14, 16) and two studies evaluated NT–pro-BNP levels (197 patients) (12, 18). The incidence of rightventricular dysfunction was 85% (116 of 137 patients; 95%CI, 78–90%) and 12% (13 of 106 patients; 95% CI, 6.7–20%) inpatients with and without elevated BNP levels, respectively(P , 0.0001). A positive association was found between in-creased concentration of BNP and the presence of right
TABLE 1. CHARACTERISTICS OF INCLUDED STUDIES
Marker Reference n
Female
(%) Age (yr)* Assay†
Timing of
Sampling Cutoff Follow-up PE Diagnosis
NT–pro-BNP Maziere (6) 60 60 72 6 15 Roche, Elecsys
2010 analyzer
Admission 1,000 pg/ml‡ In-hospital
stay
Pos CT, high prob _V/ _Q, pos
ultrasonography of lower limbsx
Puls (8) 107 63 61 6 6 Roche, Elecsys
2010 analyzer
Admission, 4 h,
8 h, 24 h
1,000 pg/ml 30 d Pos CT, high prob _V/ _Q, pos
ultrasonography of lower limbsx
Binder (12) 124 60 60 6 18 Roche, Elecsys
2010 analyzer
Admission, 4 h,
8 h, 24 h
1,000 pg/ml In-hospital
stay
Pos CT, high prob _V/ _Q, pos
ultrasonography of lower limbsx
Kostrubiec (13) 100 65 63 6 18 Roche, ECLIA Admission 600 pg/ml 40 d Pos CT, high prob _V/ _Q
Pruszczyk (15) 79 63 63 6 17 Roche, Elecsys
2010 analyzer
Admission 600 pg/ml In-hospital
stay
Pos CT, high prob _V/ _Q
Kucher (18) 73 41 61 6 18 Roche, Elecsys
2010 analyzer
Admission 500 pg/ml In-hospital
stay
Pos CT, high prob _V/ _Q
BNP Logeart (7) 67 41 64 6 17 Biosite Diagnostics,
Triage
Admission 100 pg/ml NAk Pos CT, high prob _V/ _Q
Kline (9) 181 58 53 6 17 Biosite Diagnostics,
Triage
Admission 90 pg/ml‡ 6 mo Pos CT, high prob _V/ _Q
Ray (10) 51 65 79 6 9 Biosite Diagnostics,
Triage
Admission 100 pg/ml In-hospital
stay
Pos CT, high prob _V/ _Q, pos
pulmonary angiography, pos
ultrasonography of lower limbsx
Pieralli (11) 61 74 75 6 14 Biosite Diagnostics,
Triage
Admission 89 pg/ml In-hospital
stay
Pos CT, pos pulmonary
angiography
Kruger (14) 46 36 57 6 19 Biosite Diagnostics,
Triage
Admission 90 pg/ml In-hospital
stay
Pos CT, high prob _V/ _Q,
pos pulmonary angiography,
typical clinical presentation and
suggestive echocardiography
Kucher (16) 73 41 61 6 18 Biosite Diagnostics,
Triage
Within 4 h 90 pg/ml‡ In-hospital
stay
Pos CT, high prob _V/ _Q, pos
pulmonary angiography,
embolectomy
ten Wolde (17) 110 —{ 58 6 18 Immunoradiometric
assay, Shionoria
Admission 75 pg/ml 3 mo Pos CT, high probability _V/ _Q,
non-high probability _V/ _Q and
pos ultrasonography of lower
limbs, pos pulmonary angiography
Definition of abbreviations: BNP 5 brain-type natriuretic peptide; CT 5 computed tomography; high prob 5 high-probability; NT–pro-BNP 5 N terminal–pro-BNP;
PE 5 pulmonary embolism; pos 5 positive.
This table includes data from 1,059 different patients, and a total of 1,132 patient test results; normal levels are defined as levels beneath or equal to the cutoff point.
* Values in this column are mean 6 SD.† Manufacturer and kind of assay (all were quantitative assays).k Not applicable: endpoint was right ventricular dysfunction at time of diagnosis.‡ Predefined cutoff point.x Typical clinical presentation and positive ultrasonography of lower limbs.{ Dash indicates that information was not provided.
Klok, Mos, and Huisman: BNP or NT–pro-BNP and Outcome in PE 427
ventricular dysfunction (OR, 81; 95% CI, 27–238). In NT–pro-BNP studies, the incidence of right ventricular dysfunction was45% (49 of 109 patients; 95% CI, 35–55%) in patients withelevated NT–pro-BNP levels compared with 4.5% (4 of 88patients; 95% CI, 1.3–11%) in patients with normal NT–pro-BNP levels. Elevated NT–pro-BNP levels were associated withthe presence of right ventricular dysfunction (OR, 16.81; 95%CI, 5.73–49.37). Pooled data of all assays revealed a combinedOR of 39 (95% CI, 17–89).
DISCUSSION
This meta-analysis demonstrates a significant relation betweenhigh levels of BNP or NT–pro-BNP and deterioration of clinical
condition in patients with acute PE. This is physiologicallyplausible because BNP is released as a reaction to rightventricular stress, which has been shown to predict a nonbenigncourse in patients with PE (1–3). This relation is also demon-strated in this analysis: we found a very strong correlationbetween increased levels of BNP or NT–pro-BNP and rightventricular dysfunction on echocardiography (Figure 4).
There are some points for discussion if BNP or NT–pro-BNPlevels would be incorporated in clinical treatment strategies forpatients with acute PE. First, timing of blood sampling hasconsequences for the established BNP concentration. The BNPprohormone (pro-BNP) in normal ventricular myocytes is notstored to a significant amount. As a consequence, it takesseveral hours for the plasma natriuretic peptide levels to
TABLE 2. PATIENT CHARACTERISTICS OF INCLUDED STUDIES
Marker Reference n
History of Venous
Thrombosis, n (%)
Cancer,
n (%)
Recent Surgery
of Trauma, n (%)
Hypertension,
n (%)
COPD,
n (%)
Heart Disease,
n (%)
Hemodynamic
Instability*
Trombolysis
(n,%)
NT–pro-BNP Maziere (6) 60 19 (32) — — 27 (45) 3 (5) 20 (33) Yes 1 (1.7)
Puls (8) 107 33 (31) 20 (19) 23 (22) — — — Yes —
Binder (12) 124 31 (25) 25 (20) 39 (30) — 19 (15) — Yes 12 (11)
Kostrubiec (13) 100 —† 13 (13) — — 7 (7) — Yes 7 (7.0)
Pruszczyk (15) 79 — — — — — — Yes 8 (10)
Kucher (18) 73 — — — 17 (23) 5 (7) — Yes 10 (14)
BNP Logeart (7) 67 — — — 19 (28) — 0 No 6 (9.0)
Kline (9) 181 29 (15) 32 (16) 77 (38) — — — Yes 13 (22)
Ray (10) 51 15 (29) 12 (24) — — 10 (19) 4 (7.8) Yes 0 (0)
Pieralli (11) 61 16 (26) 10 (16) 15 (25) 37 (61) 6 (10) 18 (29) No 7 (11)
Kruger (14) 46 5 (16) 4 (13) 7 (23) — — — Yes 22 (48)
Kucher (16) 73 — — — 17 (23) 5 (7) — Yes 6 (8.2)
ten Wolde (17) 110 — 28 (25) — — — — No 0 (0)
Definition of abbreviations: BNP 5 brain-type natriuretic peptide; COPD 5 chronic obstructive pulmonary disease; NT–pro-BNP 5 N terminal–pro-BNP; PE 5
pulmonary embolism.
* Patients with hemodynamic instability were eligible for the study.† Dashes indicate that specific information was not provided.
Figure 2. Odds ratio (OR) for overall mortality based on elevated BNP or NT–pro-BNP levels. Different cutoffs were used for different studies;Mantel-Haenszel methods for combining Trials were used for weighting the studies. CI 5 confidence interval.
428 AMERICAN JOURNAL OF RESPIRATORY AND CRITICAL CARE MEDICINE VOL 178 2008
increase significantly after the onset of acute myocardial stretch(20). A very recent onset of complaints could therefore result infalse-negative BNP or NT–pro-BNP test results. Second, manydifferent cutoff levels for BNP or NT–pro-BNP are proposed inthe literature (21, 22). The variation may be related to patient
selection, sex, and age (22). Despite the different cutoff levelsand different assays, the prognostic value of both NT–pro-BNPand BNP was consistent in all included studies.
What are the potential implications of our findings? First,normal levels of BNP have a high negative predictive value for
Figure 3. Odds ratio (OR) for adverse clinical outcome based on elevated BNP or NT–pro-BNP levels. Different cutoffs were used for different
studies; Mantel-Haenszel methods for combining trials were used for weighting the studies. CI 5 confidence interval.
Figure 4. Odds ratio (OR) for right ventricular dysfunction on echocardiography based on elevated BNP or NT–pro-BNP levels. Different cutoffswere used for different studies; Mantel-Haenszel methods for combining trials were used for weighting the studies. CI 5 confidence interval.
Klok, Mos, and Huisman: BNP or NT–pro-BNP and Outcome in PE 429
unfavorable outcome. Patients with normal levels of BNP orNT–pro-BNP have low risks for death as well as for hemody-namic deterioration resulting in any adverse events. Conversely,elevated concentrations of B-type natriuretic peptides are a non-specific finding. An explanation for this phenomenon is the eleva-tion of natriuretic peptides in a multitude of other conditions,including preexisting left ventricular dysfunction, older age,renal impairment, and chronic lung disease (23). The combina-tion of BNP with other clinical risk factors for adverse outcomemay improve sensitivity and positive predictive value for clinicaldeterioration. Such algorithms for risk stratification would beclinically useful if they were able to identify patients eligible foroutpatient management or for standard or intensive in-hospitaltreatment. Proposals for such algorithms including markers or bio-markers of right ventricular function (e.g., BNP or NT–pro-BNP,troponin [4], or heart-type fatty acid–binding protein [8, 24]) havebeen made but not yet validated prospectively in clinical outcomestudies (12, 13, 25). Future studies are required to determine theclinical benefits of more aggressive treatments in patients withadverse prognosis as identified by these risk stratifications andless intensive treatment, including out of hospital treatment, inpatients with normal values of BNP.
This meta-analysis has limitations. First, included studiesused different assays with different retrospectively calculatedcutoff points. Second, duration of follow-up and definitions ofendpoints varied among the studies. In addition, most studiesdid not mention completeness of follow-up. Nonetheless, wehave included a large cohort of prospectively followed patients(n 5 1,128) and our analysis showed no evidence of heteroge-neity between the outcomes of the incorporated studies. Third,the relative risk for mortality is not adjusted for confoundingfactors, thus part of the effect ascribed to high BNP values maybe related to clinical conditions associated with PE. Fourth, wecould not determine the ideal cutoff for the two BNP testsbecause we did not have the raw data to do ROC curves andother analyses. Finally, in the included studies, it is not statedwhether thrombolytic therapy or intensive care unit admissionwas the result of the clinical condition or a high BNP or NT–pro-BNP value.
In summary, an elevated level of BNP or NT–pro-BNP isa risk factor for short-term mortality and overall short-termcomplicated clinical outcome, and an indicator of right ventric-ular dysfunction in patients with acute PE. It remains to bedemonstrated whether it could play a role in risk stratificationalgorithms identifying patients who could benefit from differ-entiated forms of therapy, of which thrombolytic therapy andhome treatment are two poles of the spectrum.
Conflict of Interest Statement: None of the authors has a financial relationshipwith a commercial entity that has a interest in the subject of this manuscript.
References
1. Fremont B, Pacouret G, Jacobi D, Puglisi R, Charbonnier B, deLabriolle A. Prognostic value of the echocardiographic right/leftventricular end-diastolic diameter ratio in patients with acute pulmo-nary embolism: results from a monocenter registry of 1416 patients.Chest 2008;133:358–362.
2. Grifoni S, Olivotto I, Cecchini P, Pieralli F, Camaiti A, Santoro G, ContiA, Agnelli G, Berni G. Short-term clinical outcome of patients withacute pulmonary embolism, normal blood pressure, and echocardio-graphic right ventricular dysfunction. Circulation 2000;101:2817–2822.
3. Goldhaber SZ. Pulmonary embolism. N Engl J Med 1998;339:93–104.4. Becattini C, Vedovati MC, Agnelli G. Prognostic value of troponins in
acute pulmonary embolism: a meta-analysis. Circulation 2007;116:427–433.
5. Hall C. Essential biochemistry and physiology of (NT-pro)BNP. Eur JHeart Fail 2004;6:257–260.
6. Maziere F, Birolleau S, Medimagh S, Arthaud M, Bennaceur M, Riou B,Ray P. Comparison of troponin I and N-terminal-pro B-type natri-uretic peptide for risk stratification in patients with pulmonaryembolism. Eur J Emerg Med 2007;14:207–211.
7. Logeart D, Lecuyer L, Thabut G, Tabet JY, Tartiere JM, Chavelas C,Bonnin F, Stievenart JL, Solal AC. Biomarker-based strategy forscreening right ventricular dysfunction in patients with non-massivepulmonary embolism. Intensive Care Med 2007;33:286–292.
8. Puls M, Dellas C, Lankeit M, Olschewski M, Binder L, Geibel A, ReinerC, Schafer K, Hasenfuss G, Konstantinides S. Heart-type fatty acid-binding protein permits early risk stratification of pulmonary embo-lism. Eur Heart J 2007;28:224–229.
9. Kline JA, Hernandez-Nino J, Rose GA, Norton HJ, Camargo CA Jr.Surrogate markers for adverse outcomes in normotensive patientswith pulmonary embolism. Crit Care Med 2006;34:2773–2780.
10. Ray P, Maziere F, Medimagh S, Lefort Y, Arthaud M, Duguet A,Teixeira A, Riou B. Evaluation of B-type natriuretic peptide topredict complicated pulmonary embolism in patients aged 65 yearsand older: brief report. Am J Emerg Med 2006;24:603–607.
11. Pieralli F, Olivotto I, Vanni S, Conti A, Camaiti A, Targioni G, GrifoniS, Berni G. Usefulness of bedside testing for brain natriuretic peptideto identify right ventricular dysfunction and outcome in normotensivepatients with acute pulmonary embolism. Am J Cardiol 2006;97:1386–1390.
12. Binder L, Pieske B, Olschewski M, Geibel A, Klostermann B, Reiner C,Konstantinides S. N-terminal pro-brain natriuretic peptide or tropo-nin testing followed by echocardiography for risk stratification ofacute pulmonary embolism. Circulation 2005;112:1573–1579.
13. Kostrubiec M, Pruszczyk P, Bochowicz A, Pacho R, Szulc M, KaczynskaA, Styczynski G, Kuch-Wocial A, Abramczyk P, Bartoszewicz Z,et al. Biomarker-based risk assessment model in acute pulmonaryembolism. Eur Heart J 2005;26:2166–2172.
14. Kruger S, Graf J, Merx MW, Koch KC, Kunz D, Hanrath P, Janssens U.Brain natriuretic peptide predicts right heart failure in patients withacute pulmonary embolism. Am Heart J 2004;147:60–65.
15. Pruszczyk P, Kostrubiec M, Bochowicz A, Styczynski G, Szulc M,Kurzyna M, Fijalkowska A, Kuch-Wocial A, Chlewicka I, TorbickiA. N-terminal pro-brain natriuretic peptide in patients with acutepulmonary embolism. Eur Respir J 2003;22:649–653.
16. Kucher N, Printzen G, Goldhaber SZ. Prognostic role of brain natri-uretic peptide in acute pulmonary embolism. Circulation 2003;107:2545–2547.
17. ten Wolde M, Tulevski II, Mulder JW, Sohne M, Boomsma F, MulderBJ, Buller HR. Brain natriuretic peptide as a predictor of adverseoutcome in patients with pulmonary embolism. Circulation 2003;107:2082–2084.
18. Kucher N, Printzen G, Doernhoefer T, Windecker S, Meier B, Hess OM.Low pro-brain natriuretic peptide levels predict benign clinical outcomein acute pulmonary embolism. Circulation 2003;107:1576–1578.
19. Le Gal G, Righini M, Sanchez O, Roy PM, Baba-Ahmed M, Perrier A,Bounameaux H. A positive compression ultrasonography of thelower limb veins is highly predictive of pulmonary embolism oncomputed tomography in suspected patients. Thromb Haemost 2006;95:963–966.
20. Hama N, Itoh H, Shirakami G, Nakagawa O, Suga S, Ogawa Y, MasudaI, Nakanishi K, Yoshimasa T, Hashimoto Y, et al. Rapid ventricularinduction of brain natriuretic peptide gene expression in experimentalacute myocardial infarction. Circulation 1995;92:1558–1564.
21. Maisel AS, Krishnaswamy P, Nowak RM, McCord J, Hollander JE, DucP, Omland T, Storrow AB, Abraham WT, Wu AH, et al.; BreathingNot Properly Multinational Study Investigators. Rapid measurementof B-type natriuretic peptide in the emergency diagnosis of heartfailure. N Engl J Med 2002;347:161–167.
22. Giannitsis E, Katus HA. Risk stratification in pulmonary embolismbased on biomarkers and echocardiography. Circulation 2005;112:1520–1521.
23. de Lemos JA, McGuire DK, Drazner MH. B-type natriuretic peptide incardiovascular disease. Lancet 2003;362:316–322.
24. Lankeit M, Kempf T, Dellas C, Cuny M, Tapken H, Peter T, OlschewskiM, Konstantinides S, Wollert KC. Growth-differentiation Factor-15for Prognostic Assessment of Patients with Acute Pulmonary Embo-lism. Am J Respir Crit Care Med. 2008 Feb [Epub ahead of print]
25. Scridon T, Scridon C, Skali H, Alvarez A, Goldhaber SZ, Solomon SD.Prognostic significance of troponin elevation and right ventricularenlargement in acute pulmonary embolism. Am J Cardiol 2005;96:303–305.
430 AMERICAN JOURNAL OF RESPIRATORY AND CRITICAL CARE MEDICINE VOL 178 2008
intl.elsevierhealth.com/journals/thre
Thrombosis Research (2007) 120, 281–288
REGULAR ARTICLE
D-dimer level is associated with the extent ofpulmonary embolism
W. Ghanima a,d,e,⁎, M. Abdelnoor c, L.O. Holmen b, B.E. Nielssen b,S. Ross a, P.M. Sandset d,e
a Østfold Hospital Trust in Fredrikstad, Department of Medicine, Fredrikstad, Norwayb Østfold Hospital Trust in Fredrikstad, Department of Radiology, Fredrikstad, Norwayc Ullevål University Hospital Trust, Centre for Epidemiological Studies, Oslo, Norwayd Ullevål University Hospital Trust, Department of Hematology, Oslo, Norwaye Medical Clinic, Faculty Division Ullevål University Hospital, Oslo, Norway
Received 11 May 2006; received in revised form 25 August 2006; accepted 25 August 2006Available online 9 October 2006
⁎ Corresponding author. Departmentfax: +47 69347661.
E-mail address: waleed.ghanima@s
0049-3848/$ - see front matter © 200doi:10.1016/j.thromres.2006.08.006
Abstract
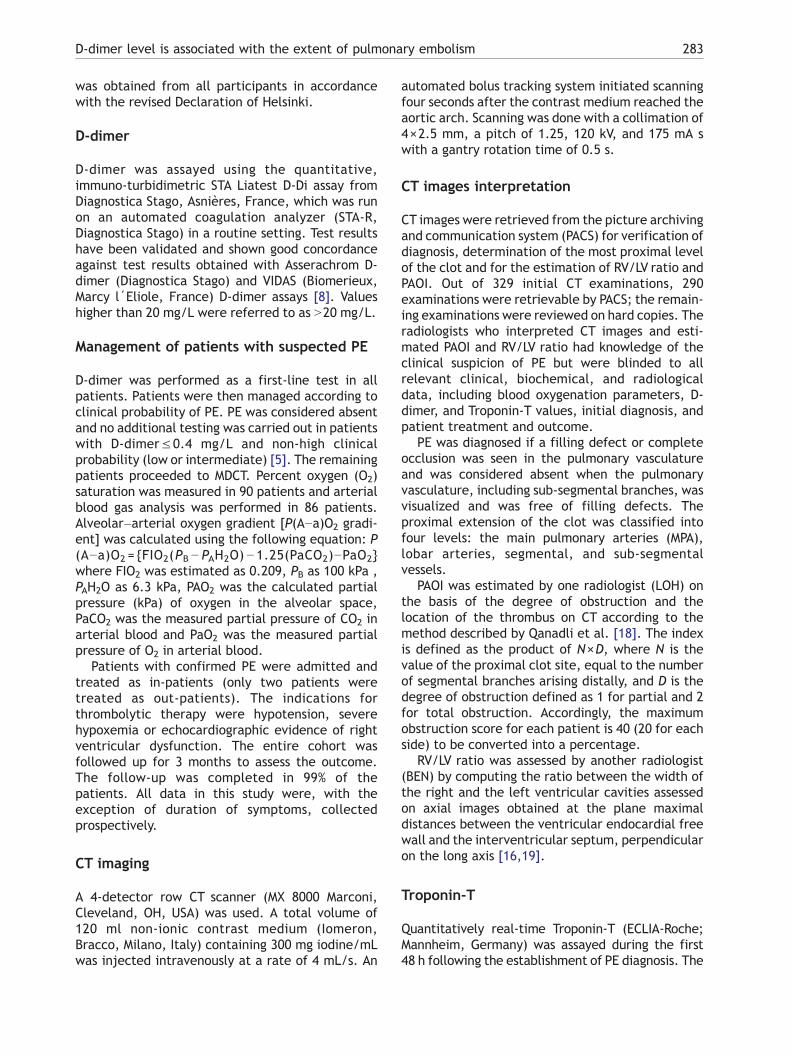
Objectives: Our aim was to study the association between the level of D-dimer andthe severity of pulmonary embolism (PE) as determined by various biochemical andradiological prognostic markers in order to investigate the potential value of D-dimeras a prognostic marker for the severity of PE.Patients and methods: PE was diagnosed in 100 consecutive out-patients by multi-detector computerized tomography. One patient was excluded and the final cohortconsisted of 99 patients. Pulmonary Artery Obstruction Index (PAOI) and RightVentricular/Left Ventricular (RV/LV) ratio were assessed.Results: The median value for D-dimer was 5.0 mg/L (inter-quartile range: 1.8,12.2). There was a significant association between log D-dimer, and between log RV/LV (r=0.45), log PAOI (r=0.5), and PaO2 (r=0.40). The multivariate analysis showed anincreased association between log D-dimer and between log RV/LV ratio (r=0.54) andlog PAOI (r=0.52) after adjusting for age, gender and for the duration of symptoms.Significant association was found between the level of D-dimer and the most proximallevel of PE (pb0.0005). There was a significant dose–response relationship betweenthe level D-dimer and between Troponin-T and the frequency of thrombolysis(pb0.0005). In the subgroup of patients with D-Dimer over the upper quartile
KEYWORDSPulmonary embolism;D-dimer;Prognosis;Pulmonary arteryobstruction;Right ventriculardysfunction
of Medicine, Østfold Hospital Trust in Fredrikstad, 1603 Fredrikstad, Norway. Tel.: +47 69860000;
o-hf.no (W. Ghanima).
6 Elsevier Ltd. All rights reserved.
282 W. Ghanima et al.
(N12.2), 12 (67%) patients had elevated Troponin-T and 8 (32%) patients receivedthrombolysis, compared to 1 (5%) patient with elevated Troponin-Tand none treatedwith thrombolysis in the subgroup of patients with D-dimerb lower quartile.Conclusions: We have shown that the level of D-dimer is related to the severity of PEassessed by various radiological, biochemical and clinical markers and might have apotential value as prognostic marker for the severity of PE.© 2006 Elsevier Ltd. All rights reserved.
Introduction
Plasma D-dimers are cross-linked fibrin derivativesproduced when fibrin is degraded by plasmin.Elevated levels of D-dimer are found in conditionsthat lead to activation of coagulation and fibrinformation [1], e.g., in patients with acute venousthromboembolism (VTE), but also in any othercondition associatedwith fibrin formation like cancer,pregnancy, surgery, and inflammatory disease.
D-dimer has been extensively evaluated inclinical studies over the last decade. It has provedto be a valuable test in the management of patientswith suspected VTE and is now widely applied as afirst step test in the diagnostic work-up of VTE [2,3].D-dimer is available in various formats that exhibitdifferent performances [4]. The most sensitiveassays can rule out VTE in up to 30% of the patients[5,6]. Elevated D-dimer, on the other hand, mayhave a predictive value in detecting PE [7], andthere is a dose–response relationship between thelevel of D-dimer and the frequency of PE amongpatients with suspected PE [8]. D-dimer may also beof value in predicting high risk for recurrence of VTEafter discontinuation of anticoagulation [9,10].
There is some evidence that the level of D-dimer iscorrelated with the extent of PE as assessed byventilation–perfusion scan [11], and with the degreeof pulmonary vascular obstruction assessed by pul-monary artery obstruction index (PAOI) [12], indicat-ing someassociation between the level of D-dimer andthe severity of PE, but there are limited data on otherprognostic markers and the clinical implications.
PE is a potentially fatal condition with a 3-monthmortality rate reaching up to 15% [13]. Parameterslike hypotension, right ventricular dysfunction andelevated troponin levels are associated with ad-verse prognosis and poor outcome [13–17]. Thesepatients may require more intensive treatment andusually benefit from thrombolytic therapy [3]. Atleast two radiological parameters have been shownto be associated with poor outcome and high in-hospital mortality: high PAOI and increased RightVentricle/Left Ventricle (RV/LV) ratio [16,17].
Patients with non-adverse prognostic factors havefavourable outcome and require only heparin,either unfractionated (UFH) or low-molecular-weight heparin (LMWH), followed by warfarin [3].
Due to the limited data on the association betweenlevel of D-dimer and ventilation–perfusion scanningand PAOI and lack of data regarding the associationwith other prognostic markers of PE severity, wecarried out this study to investigate the potentialvalue of D-dimer as a prognostic marker for theseverity of PE.
Patients and methods
Study population
495 consecutive patients referred to the EmergencyDepartment of the Østfold Hospital Trust, Fredrik-stad, Norway, for suspected PE between February2002 and December 2003, were recruited to a clinicaltrial evaluating adecision-based algorithmcombiningclinical probability assessment, D-dimer, and multi-detector computerized tomography (MDCT). 63patients were excluded for various reasons: protocolviolations in 23 patients; anticoagulation prior to(n=13) or during the follow-up period (n=9); contra-indication to intravenous iodinated contrast medium(n=6); refusal to consent (n=5); Ageb18 years (n=3);other reasons (n=4). The final cohort consisted of 432patients. The study design and main outcomes of thestudy have previously been reported in detail [5].
PE was initially diagnosed in 102 (23.6%) patients.CT images were unequivocally positive in 93 (21.5%)patients and were equivocal, but highly suggestive ofPE in nine patients. The CT imageswere subsequentlyevaluated by a reviewing committee to verify thediagnosis. PEwas deemedpresent by consensus in 100patients; one patient was excluded as thrombolysiswas given before CTwas performed. The final cohortfor this study therefore consisted of 99 patients,comprising both first episode and recurrent PE.
The study protocol was approved by the RegionalEthics Committee, and written informed consent
283D-dimer level is associated with the extent of pulmonary embolism
was obtained from all participants in accordancewith the revised Declaration of Helsinki.
D-dimer
D-dimer was assayed using the quantitative,immuno-turbidimetric STA Liatest D-Di assay fromDiagnostica Stago, Asnières, France, which was runon an automated coagulation analyzer (STA-R,Diagnostica Stago) in a routine setting. Test resultshave been validated and shown good concordanceagainst test results obtained with Asserachrom D-dimer (Diagnostica Stago) and VIDAS (Biomerieux,Marcy l´Eliole, France) D-dimer assays [8]. Valueshigher than 20 mg/L were referred to as N20 mg/L.
Management of patients with suspected PE
D-dimer was performed as a first-line test in allpatients. Patients were then managed according toclinical probability of PE. PE was considered absentand no additional testing was carried out in patientswith D-dimer≤0.4 mg/L and non-high clinicalprobability (low or intermediate) [5]. The remainingpatients proceeded to MDCT. Percent oxygen (O2)saturation was measured in 90 patients and arterialblood gas analysis was performed in 86 patients.Alveolar–arterial oxygen gradient [P(A−a)O2 gradi-ent] was calculated using the following equation: P(A−a)O2 = {FIO2(PB− PAH2O)− 1.25(PaCO2)−PaO2}where FIO2 was estimated as 0.209, PB as 100 kPa ,PAH2O as 6.3 kPa, PAO2 was the calculated partialpressure (kPa) of oxygen in the alveolar space,PaCO2 was the measured partial pressure of CO2 inarterial blood and PaO2 was the measured partialpressure of O2 in arterial blood.
Patients with confirmed PE were admitted andtreated as in-patients (only two patients weretreated as out-patients). The indications forthrombolytic therapy were hypotension, severehypoxemia or echocardiographic evidence of rightventricular dysfunction. The entire cohort wasfollowed up for 3 months to assess the outcome.The follow-up was completed in 99% of thepatients. All data in this study were, with theexception of duration of symptoms, collectedprospectively.
CT imaging
A 4-detector row CT scanner (MX 8000 Marconi,Cleveland, OH, USA) was used. A total volume of120 ml non-ionic contrast medium (Iomeron,Bracco, Milano, Italy) containing 300 mg iodine/mLwas injected intravenously at a rate of 4 mL/s. An
automated bolus tracking system initiated scanningfour seconds after the contrast medium reached theaortic arch. Scanning was done with a collimation of4×2.5 mm, a pitch of 1.25, 120 kV, and 175 mA swith a gantry rotation time of 0.5 s.
CT images interpretation
CT images were retrieved from the picture archivingand communication system (PACS) for verification ofdiagnosis, determination of the most proximal levelof the clot and for the estimation of RV/LV ratio andPAOI. Out of 329 initial CT examinations, 290examinations were retrievable by PACS; the remain-ing examinations were reviewed on hard copies. Theradiologists who interpreted CT images and esti-mated PAOI and RV/LV ratio had knowledge of theclinical suspicion of PE but were blinded to allrelevant clinical, biochemical, and radiologicaldata, including blood oxygenation parameters, D-dimer, and Troponin-T values, initial diagnosis, andpatient treatment and outcome.
PE was diagnosed if a filling defect or completeocclusion was seen in the pulmonary vasculatureand was considered absent when the pulmonaryvasculature, including sub-segmental branches, wasvisualized and was free of filling defects. Theproximal extension of the clot was classified intofour levels: the main pulmonary arteries (MPA),lobar arteries, segmental, and sub-segmentalvessels.
PAOI was estimated by one radiologist (LOH) onthe basis of the degree of obstruction and thelocation of the thrombus on CT according to themethod described by Qanadli et al. [18]. The indexis defined as the product of N×D, where N is thevalue of the proximal clot site, equal to the numberof segmental branches arising distally, and D is thedegree of obstruction defined as 1 for partial and 2for total obstruction. Accordingly, the maximumobstruction score for each patient is 40 (20 for eachside) to be converted into a percentage.
RV/LV ratio was assessed by another radiologist(BEN) by computing the ratio between the width ofthe right and the left ventricular cavities assessedon axial images obtained at the plane maximaldistances between the ventricular endocardial freewall and the interventricular septum, perpendicularon the long axis [16,19].
Troponin-T
Quantitatively real-time Troponin-T (ECLIA-Roche;Mannheim, Germany) was assayed during the first48 h following the establishment of PE diagnosis. The
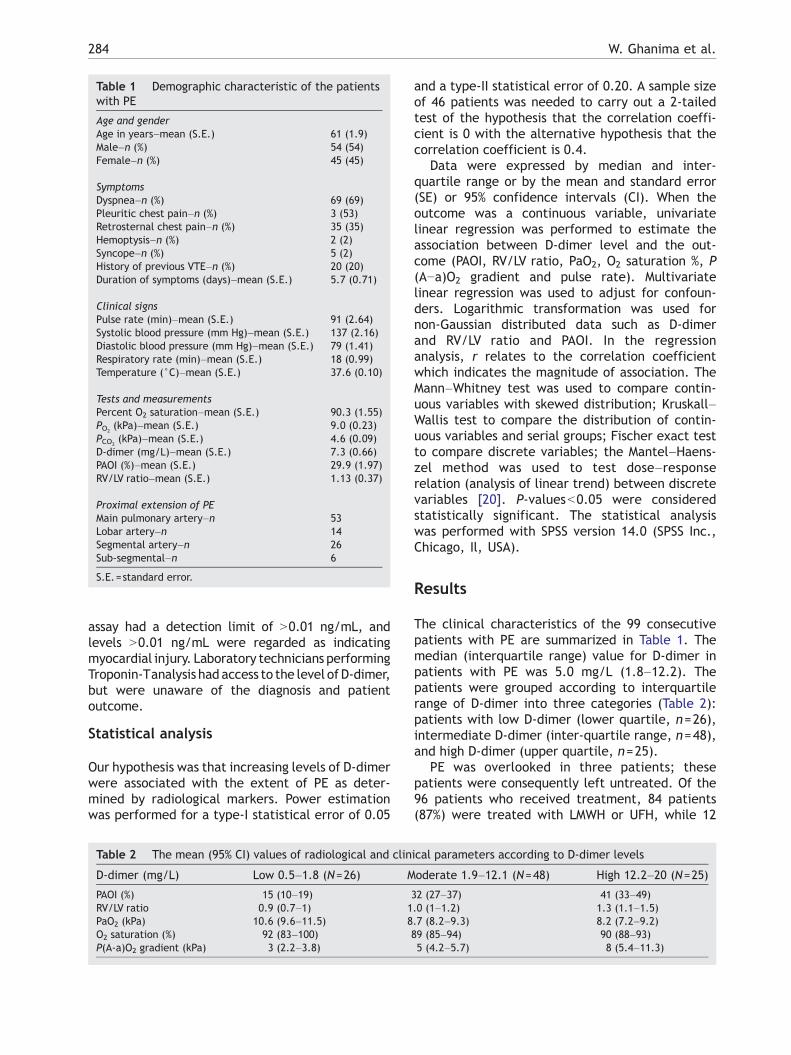
Table 1 Demographic characteristic of the patientswith PE
Age and genderAge in years–mean (S.E.) 61 (1.9)Male–n (%) 54 (54)Female–n (%) 45 (45)
SymptomsDyspnea–n (%) 69 (69)Pleuritic chest pain–n (%) 3 (53)Retrosternal chest pain–n (%) 35 (35)Hemoptysis–n (%) 2 (2)Syncope–n (%) 5 (2)History of previous VTE–n (%) 20 (20)Duration of symptoms (days)–mean (S.E.) 5.7 (0.71)
Clinical signsPulse rate (min)–mean (S.E.) 91 (2.64)Systolic blood pressure (mm Hg)–mean (S.E.) 137 (2.16)Diastolic blood pressure (mm Hg)–mean (S.E.) 79 (1.41)Respiratory rate (min)–mean (S.E.) 18 (0.99)Temperature (°C)–mean (S.E.) 37.6 (0.10)
Tests and measurementsPercent O2 saturation–mean (S.E.) 90.3 (1.55)PO2
(kPa)–mean (S.E.) 9.0 (0.23)PCO2
(kPa)–mean (S.E.) 4.6 (0.09)D-dimer (mg/L)–mean (S.E.) 7.3 (0.66)PAOI (%)–mean (S.E.) 29.9 (1.97)RV/LV ratio–mean (S.E.) 1.13 (0.37)
Proximal extension of PEMain pulmonary artery–n 53Lobar artery–n 14Segmental artery–n 26Sub-segmental–n 6
S.E.=standard error.
284 W. Ghanima et al.
assay had a detection limit of N0.01 ng/mL, andlevels N0.01 ng/mL were regarded as indicatingmyocardial injury. Laboratory technicians performingTroponin-Tanalysis had access to the level of D-dimer,but were unaware of the diagnosis and patientoutcome.
Statistical analysis
Our hypothesis was that increasing levels of D-dimerwere associated with the extent of PE as deter-mined by radiological markers. Power estimationwas performed for a type-I statistical error of 0.05
Table 2 The mean (95% CI) values of radiological and clin
D-dimer (mg/L) Low 0.5–1.8 (N=26) M
PAOI (%) 15 (10–19)RV/LV ratio 0.9 (0.7–1) 1PaO2 (kPa) 10.6 (9.6–11.5) 8O2 saturation (%) 92 (83–100)P(A-a)O2 gradient (kPa) 3 (2.2–3.8)
and a type-II statistical error of 0.20. A sample sizeof 46 patients was needed to carry out a 2-tailedtest of the hypothesis that the correlation coeffi-cient is 0 with the alternative hypothesis that thecorrelation coefficient is 0.4.
Data were expressed by median and inter-quartile range or by the mean and standard error(SE) or 95% confidence intervals (CI). When theoutcome was a continuous variable, univariatelinear regression was performed to estimate theassociation between D-dimer level and the out-come (PAOI, RV/LV ratio, PaO2, O2 saturation %, P(A−a)O2 gradient and pulse rate). Multivariatelinear regression was used to adjust for confoun-ders. Logarithmic transformation was used fornon-Gaussian distributed data such as D-dimerand RV/LV ratio and PAOI. In the regressionanalysis, r relates to the correlation coefficientwhich indicates the magnitude of association. TheMann–Whitney test was used to compare contin-uous variables with skewed distribution; Kruskall–Wallis test to compare the distribution of contin-uous variables and serial groups; Fischer exact testto compare discrete variables; the Mantel–Haens-zel method was used to test dose–responserelation (analysis of linear trend) between discretevariables [20]. P-valuesb0.05 were consideredstatistically significant. The statistical analysiswas performed with SPSS version 14.0 (SPSS Inc.,Chicago, Il, USA).
Results
The clinical characteristics of the 99 consecutivepatients with PE are summarized in Table 1. Themedian (interquartile range) value for D-dimer inpatients with PE was 5.0 mg/L (1.8–12.2). Thepatients were grouped according to interquartilerange of D-dimer into three categories (Table 2):patients with low D-dimer (lower quartile, n=26),intermediate D-dimer (inter-quartile range, n=48),and high D-dimer (upper quartile, n=25).
PE was overlooked in three patients; thesepatients were consequently left untreated. Of the96 patients who received treatment, 84 patients(87%) were treated with LMWH or UFH, while 12
ical parameters according to D-dimer levels
oderate 1.9–12.1 (N=48) High 12.2–20 (N=25)
32 (27–37) 41 (33–49).0 (1–1.2) 1.3 (1.1–1.5).7 (8.2–9.3) 8.2 (7.2–9.2)89 (85–94) 90 (88–93)5 (4.2–5.7) 8 (5.4–11.3)
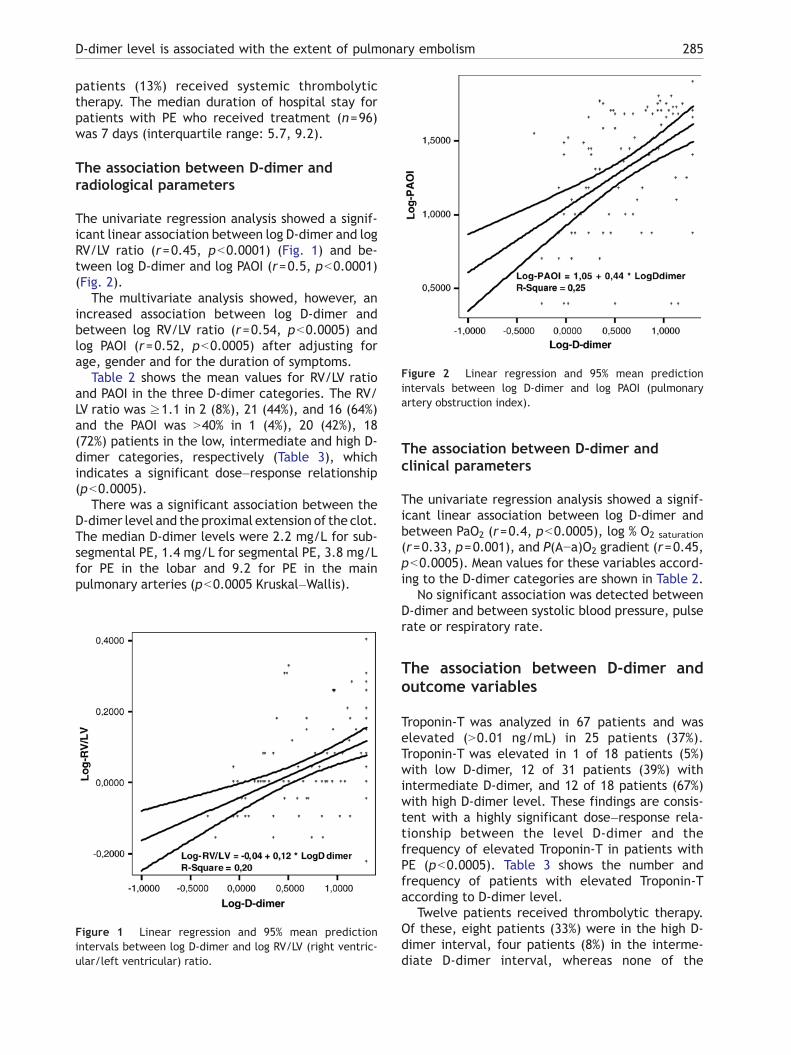
Figure 2 Linear regression and 95% mean predictionintervals between log D-dimer and log PAOI (pulmonaryartery obstruction index).
285D-dimer level is associated with the extent of pulmonary embolism
patients (13%) received systemic thrombolytictherapy. The median duration of hospital stay forpatients with PE who received treatment (n=96)was 7 days (interquartile range: 5.7, 9.2).
The association between D-dimer andradiological parameters
The univariate regression analysis showed a signif-icant linear association between log D-dimer and logRV/LV ratio (r=0.45, pb0.0001) (Fig. 1) and be-tween log D-dimer and log PAOI (r=0.5, pb0.0001)(Fig. 2).
The multivariate analysis showed, however, anincreased association between log D-dimer andbetween log RV/LV ratio (r=0.54, pb0.0005) andlog PAOI (r=0.52, pb0.0005) after adjusting forage, gender and for the duration of symptoms.
Table 2 shows the mean values for RV/LV ratioand PAOI in the three D-dimer categories. The RV/LV ratio was z1.1 in 2 (8%), 21 (44%), and 16 (64%)and the PAOI was N40% in 1 (4%), 20 (42%), 18(72%) patients in the low, intermediate and high D-dimer categories, respectively (Table 3), whichindicates a significant dose–response relationship(pb0.0005).
There was a significant association between theD-dimer level and the proximal extension of the clot.The median D-dimer levels were 2.2 mg/L for sub-segmental PE, 1.4 mg/L for segmental PE, 3.8 mg/Lfor PE in the lobar and 9.2 for PE in the mainpulmonary arteries (pb0.0005 Kruskal–Wallis).
Figure 1 Linear regression and 95% mean predictionintervals between log D-dimer and log RV/LV (right ventric-ular/left ventricular) ratio.
The association between D-dimer andclinical parameters
The univariate regression analysis showed a signif-icant linear association between log D-dimer andbetween PaO2 (r=0.4, pb0.0005), log % O2 saturation
(r=0.33, p=0.001), and P(A−a)O2 gradient (r=0.45,pb0.0005). Mean values for these variables accord-ing to the D-dimer categories are shown in Table 2.
No significant association was detected betweenD-dimer and between systolic blood pressure, pulserate or respiratory rate.
The association between D-dimer andoutcome variables
Troponin-T was analyzed in 67 patients and waselevated (N0.01 ng/mL) in 25 patients (37%).Troponin-T was elevated in 1 of 18 patients (5%)with low D-dimer, 12 of 31 patients (39%) withintermediate D-dimer, and 12 of 18 patients (67%)with high D-dimer level. These findings are consis-tent with a highly significant dose–response rela-tionship between the level D-dimer and thefrequency of elevated Troponin-T in patients withPE (pb0.0005). Table 3 shows the number andfrequency of patients with elevated Troponin-Taccording to D-dimer level.
Twelve patients received thrombolytic therapy.Of these, eight patients (33%) were in the high D-dimer interval, four patients (8%) in the interme-diate D-dimer interval, whereas none of the
Table 3 Number (%; 95% CI) of patients with elevated radiological and biochemical markers according to D-dimercategories
D-dimer (mg/L) Low 0.5–1.8 (N=26) Intermediate 1.9–12.1 (N=48) High 12.2–20 (N=25) p-value
PAOIN40% 1 (4%; 0–19) 20 (42%; 27–56) 18 (72%; 50–87) b0.0005RV/LV ratioN1.0 2 (8%; 0–25) 21 (44%; 29–58) 16 (64%; 42–82) b0.0005Troponin-TaN0.01 ng/mL 1 (5%; 0–27) 12 (39%; 21–57) 12 (67%; 40–86) b0.0005Thrombolytic therapy b 0 (0%; 0–11) 4 (8%; 2–20) 8 (33%; 15–55) =0.002a Troponin-Twas measured in 67 patients; 18 in the low, 31 in the intermediate and 18 in the high D-dimer category.b Three patients, one in each D-dimer category, did not receive any treatment for PE.
286 W. Ghanima et al.
patients in the low D-dimer category receivedthrombolytic therapy. This is again consistentwith a significant dose–response relationship(p=0.002).
A significant though weak linear association wasalso found between log D-dimer and the log durationof hospital stay (r=0.25, p=0.014). The medianduration of hospital stay was 5.5, 8, and 7 days forthe low, intermediate and high D-dimer categories,respectively.
Five patients (5%) died during the first 3 months.Time to death ranged from 28 to 67 days. Onepatient did not receive anticoagulation as PE wasoverlooked. Although all the four patients had D-dimer N1.8 mg/L, three patients were in theintermediate and one patient was in the high D-dimer interval. The difference in mortality was,however, not statistically significant (pN0.5).
Discussion
The current study indicates that the level of D-dimer is related to the severity of PE assessed byvarious clinical parameters like PaO2, P(A−a)O2
gradient and % O2 saturation, radiological markerslike RV/LV ratio, PAOI and the proximal level of PE,and the cardiac biomarker Troponin-T. Our studyconfirms previous findings by Kucher et al. whodemonstrated that PE patients with higher PAOIhave higher D-dimer values (VIDAS D-dimer) [12]and by Galle et al. who showed that D-dimer(Asserachrom D-dimer) correlates with the extentof PE assessed by ventilation–perfusion scan [11].However, our study is the first to demonstrate anassociation between D-dimer and RV/LV ratio andTroponin-T levels which are well recognised andvalidated prognostic markers for PE [16,19,21,23].
The univariate analyses showed moderate, butstatistically highly significant associations betweenD-dimer and RV/LV ratio and PAOI. In the multivar-iate analyses slightly higher associations were foundafter adjusting for age, gender and the duration ofsymptoms. The value of these radiological para-meters in predicting adverse outcome followingacute PE has been documented in several studies.
Most of these studies demonstrated a significantlyhigher mortality in patients with RV/LV ratioN1–1.5or PAOIN40–60 during the first 90 days following PE[16,17,19,21].
A significant, though weaker association was alsodemonstrated between the level of D-dimer andblood oxygenation parameters as PaO2, percent O2
saturation, and the P(A−a)O2 gradient. However, nosignificant association was found between D-dimerand systolic blood pressure. Five patients in thiscohort had a systolic blood pressure b100 mm Hg,two (2%) of whom had systolic blood pressureb90 mm Hg. The PAOI was N40 and RV/LV ratio N1in four of these patients. Nevertheless, only two ofthose received thrombolytic therapy. The frequencyof massive PE in this study and the rate ofthrombolytic treatment in this subgroup is compa-rable to that reported in the ICOPER study (4.5%),especially when considering that one patient pre-sented with a massive PE and hypotension but wasexcluded from the analysis as he received throm-bolytic therapy before CTwas performed [22].
Cardiac biomarkers have emerged as a promisingtool for risk stratification for PE [23–25]. Troponin-Tlevel correlates well with the right ventriculardysfunction [23]. However, the release of cardiacbiomarkers could be delayed until 6–12 h followingan episode of acute PE [24]. Our data show asignificant dose–response relationship between D-dimer and the presence of myocardial damage asindicated by the release of Troponin-T. Moreover, wealso found that the use of thrombolytic therapy,which was based on the clinical judgement by theattending physician, was associated with higherlevels of D-dimer.
Therewere no in-hospital deaths, and the 3-monthmortality rate in this cohort was very low. This low-mortality rate precludes us from making conclusionsregarding the predictive value of D-dimer on mortal-ity. Our study population was patients who werereferred to the emergency room for suspected PE.These patients might presumably have a lower co-morbidity compared to in-patientswho develop PE—aselection that could have contributed to this favour-able outcome. However, the proportion of patients
287D-dimer level is associated with the extent of pulmonary embolism
with hypotension in our study is comparable to thatreported by the ICOPER study group [22]. Wetherefore believe that it is unlikely that the lowmortality rate was a result of a selection bias.
Our results indicate that D-dimer can be ofunrecognised value as a prognostic marker thatcan be used alone or in combination with otherprognostic markers to streamline the managementof out-patients with suspected PE and to directrational use of resources. In general, the figures inTable 3 indicate a very low frequency (5%) ofelevated PAOI, RV/LV ratio or elevated Troponin-Tin patients in the low D-dimer category. Thefrequency of having elevated PAOI, RV/LV ratio orelevated Troponin-T increased to 40% in themoderate and 70% in high D-dimer categories.Moreover, the increment in the frequency wasconsistent for all three markers. These results maysuggest that further risk stratification of patientswith confirmed PE could be restricted to patientswith moderate and high D-dimer. The prognosticvalue of D-dimer and its clinical significance need,however, to be further evaluated in properlydesigned prospective studies that should, forcomparison, also include cardiac biomarkers, be-fore it can be applied in clinical practice.
This study has several limitations. First, Tropo-nin-T was only measured in two-thirds of thepatients and repeated measurements were notperformed routinely. Nonetheless, we have nosuspicion of any selection bias since the proportionof patients in which Troponin-T was performed wasbalanced in the three D-dimer categories. On theother hand, we cannot exclude that differentresults would have appeared if repeated measure-ments for Troponin-T had been performed. Second,D-dimer is not a universal test; many formats areavailable with different test performance andmethodology. This limitation might preclude theacceptance of D-dimer as a prognostic marker.Third, the study population consisted exclusivelyof out-patients and since D-dimer is frequentlyelevated in postoperative, obstetrical and oncologypatients [1], our conclusions should be restricted toout-patients. Adjustment for co-morbid conditionsis potentially interesting, but was not performeddue to the small sample size and lack of systematicinformation concerning other conditions that affectD-dimer. Fourth, physicians in charge of the patientswere not blinded to the actual D-dimer value.Although we cannot exclude that decision makingmight have been influenced by the actual D-dimervalue, we find this very unlikely since treatmentwas given according to international guidelines thatwere based on clinical and/or echocardiographiccriteria and the importance of D-dimer level was not
known. Finally, the inter- and intra-observer vari-ability in estimating PAOI and RV/LV ratio was notdetermined in this study, but previous reportsindicate very good agreement in the assessment ofthese parameters [18,26].
In conclusion, we have shown that the level of D-dimer is related to the severity of PE assessed byvarious radiological, biochemical and clinical mar-kers and could hence have a potential value asprognostic marker for PE.
References
[1] Gaffney PJ, Creighton LJ, Callus M, Thorpe R. Monoclonalantibodies to crosslinked fibrin degradation products (XL-FDP). II. Evaluation in a variety of clinical conditions. Br JHaematol 1988;68(1):91–6.
[2] Perrier A. D-dimer for suspected pulmonary embolism:whom should we test? Chest 2004;125(3):807–9.
[3] British Thoracic Society guidelines for the management ofsuspected acute pulmonary embolism. Thorax 2003;58(6):470–83.
[4] Dempfle CE, Zips S, Ergul H, Heene DL. The Fibrin AssayComparison Trial (FACT): evaluation of 23 quantitative D-dimer assays as basis for the development of D-dimer calibra-tors. FACT Study Group. Thromb Haemost 2001;85(4):671–8.
[5] Ghanima W, Almaas V, Aballi S, Dorje C, Nielssen BE, HolmenLO, et al. Management of suspected pulmonary embolism(PE) by D-dimer and multi-slice computed tomography inoutpatients: an outcome study. J Thromb Haemost 2005;3(9):1926–32.
[6] Perrier A, Desmarais S, Miron MJ, de MP, Lepage R, SlosmanD, et al. Non-invasive diagnosis of venous thromboembolismin outpatients. Lancet 1999;353(9148):190–5.
[7] Bosson JL, Barro C, Satger B, Carpentier PH, Polack B,Pernod G. Quantitative high D-dimer value is predictive ofpulmonary embolism occurrence independently of clinicalscore in a well-defined low risk factor population. J ThrombHaemost 2005;3(1):93–9.
[8] Ghanima W, Abdelnoor M, Mowinckel MC, Sandset PM. Theperformance of STA-Liatest D-dimer assay in out-patientswith suspected pulmonary embolism. Br J Haematol2006;132(2):210–5.
[9] Eichinger S, Minar E, Bialonczyk C, Hirschl M, QuehenbergerP, Schneider B, et al. D-dimer levels and risk of recurrentvenous thromboembolism. JAMA 2003;290(8):1071–4.
[10] Palareti G, Legnani C, Cosmi B, Valdre L, Lunghi B, BernardiF, et al. Predictive value of D-dimer test for recurrent venousthromboembolism after anticoagulation withdrawal in sub-jects with a previous idiopathic event and in carriers ofcongenital thrombophilia. Circulation 2003;108(3):313–8.
[11] Galle C, Papazyan JP, Miron MJ, Slosman D, Bounameaux H,Perrier A. Prediction of pulmonary embolism extent byclinical findings, D-dimer level and deep vein thrombosisshown by ultrasound. Thromb Haemost 2001;86(5):1156–60.
[12] Kucher N, Schroeder V, Kohler HP. Role of blood coagulationfactor XIII in patients with acute pulmonary embolism.Correlation of factor XIII antigen levels with pulmonaryocclusion rate, fibrinogen, D-dimer, and clot firmness.Thromb Haemost 2003;90(3):434–8.
[13] Goldhaber SZ, Visani L, De RM. Acute pulmonary embolism:clinical outcomes in the International Cooperative Pulmo-nary Embolism Registry (ICOPER). Lancet 1999;353(9162):1386–9.
288 W. Ghanima et al.
[14] Goldhaber SZ, Elliott CG. Acute pulmonary embolism: part II:risk stratification, treatment, and prevention. Circulation2003;108(23):2834–8.
[15] Grifoni S, Olivotto I, Cecchini P, Pieralli F, Camaiti A, SantoroG, et al. Short-term clinical outcome of patients with acutepulmonary embolism, normal blood pressure, and echocar-diographic right ventricular dysfunction. Circulation2000;101(24):2817–22.
[16] van der Meer RW, Pattynama PM, van Strijen MJ, van denBerg-Huijsmans AA, Hartmann IJ, Putter H, et al. Rightventricular dysfunction and pulmonary obstruction index athelical CT: prediction of clinical outcome during 3-monthfollow-up in patients with acute pulmonary embolism. Ra-diology 2005;235(3):798–803.
[17] Wu AS, Pezzullo JA, Cronan JJ, Hou DD, Mayo-Smith WW. CTpulmonary angiography: quantification of pulmonary em-bolus as a predictor of patient outcome—initial experience.Radiology 2004;230(3):831–5.
[18] Qanadli SD, El HM, Vieillard-Baron A, Joseph T, Mesurolle B,Oliva VL, et al. New CT index to quantify arterialobstruction in pulmonary embolism: comparison withangiographic index and echocardiography. AJR Am JRoentgenol 2001;176(6):1415–20.
[19] Ghuysen A, Ghaye B, Willems V, Lambermont B, Gerard P,Dondelinger RF, et al. Computed tomographic pulmonary
angiography and prognostic significance in patients withacute pulmonary embolism. Thorax 2005;60(11):956–61.
[20] Altman DG. Practical statistics for medical research. Firsted. Florida USA: Chapman & Hall/CRC; 1999.
[21] Schoepf UJ, Kucher N, Kipfmueller F, Quiroz R, Costello P,Goldhaber SZ. Right ventricular enlargement on chestcomputed tomography: a predictor of early death in acutepulmonary embolism. Circulation 2004;110(20):3276–80.
[22] Kucher N, Rossi E, De RM, Goldhaber SZ. Massive pulmonaryembolism. Circulation 2006;113(4):577–82.
[23] Konstantinides S, Geibel A, Olschewski M, Kasper W, HruskaN, Jackle S, et al. Importance of cardiac troponins I and T inrisk stratification of patients with acute pulmonary embo-lism. Circulation 2002;106(10):1263–8.
[24] Kucher N, Goldhaber SZ. Cardiac biomarkers for riskstratification of patients with acute pulmonary embolism.Circulation 2003;108(18):2191–4.
[25] Pruszczyk P, Bochowicz A, Torbicki A, Szulc M, Kurzyna M,Fijalkowska A, et al. Cardiac troponin T monitoringidentifies high-risk group of normotensive patients withacute pulmonary embolism. Chest 2003;123(6):1947–52.
[26] Quiroz R, Kucher N, Schoepf UJ, Kipfmueller F, Solomon SD,Costello P, et al. Right ventricular enlargement on chestcomputed tomography: prognostic role in acute pulmonaryembolism. Circulation 2004;109(20):2401–4.
Prognostic Value of Troponins in AcutePulmonary Embolism
A Meta-Analysis
Cecilia Becattini, MD; Maria Cristina Vedovati, MD; Giancarlo Agnelli, MD
Background—Whether elevated serum troponin levels identify patients with acute pulmonary embolism at high risk ofshort-term mortality or adverse outcome is undefined.
Methods and Results—We performed a meta-analysis of studies in patients with acute pulmonary embolism to assess theprognostic value of elevated troponin levels for short-term death and adverse outcome events (composite of death andany of the following: shock, need for thrombolysis, endotracheal intubation, catecholamine infusion, cardiopulmonaryresuscitation, or recurrent pulmonary embolism). Unrestricted searches of MEDLINE and EMBASE bibliographicdatabases from January 1998 to November 2006 were performed using the terms “troponin” and “pulmonaryembolism.” Additionally, review articles and bibliographies were manually searched. Cohort studies were included ifthey had used cardiac-specific troponin assays and had reported on short-term death or adverse outcome events. Arandom-effects model was used to pool study results; funnel-plot inspection was done to evaluate publication bias; andI2 testing was used to test for heterogeneity. Data from 20 studies (1985 patients) were included in the analysis. Overall,122 of 618 patients with elevated troponin levels died (19.7%; 95% confidence interval [CI], 16.6 to 22.8) comparedwith 51 of 1367 with normal troponin levels (3.7%; 95% CI, 2.7 to 4.7). Elevated troponin levels were significantlyassociated with short-term mortality (odds ratio [OR], 5.24; 95% CI, 3.28 to 8.38), with death resulting from pulmonaryembolism (OR, 9.44; 95% CI, 4.14 to 21.49), and with adverse outcome events (OR, 7.03; 95% CI, 2.42 to 20.43).Elevated troponin levels were associated with a high mortality in the subgroup of hemodynamically stable patients (OR,5.90; 95% CI, 2.68 to 12.95). Results were consistent for troponin I or T and prospective or retrospective studies.
Conclusions—Elevated troponin levels identify patients with acute pulmonary embolism at high risk of short-term deathand adverse outcome events. (Circulation. 2007;116:427-433.)
Key Words: meta-analysis � pulmonary embolism � thromboembolism � thrombosis � troponin
Acute pulmonary embolism has a wide spectrum ofclinical presentations. The short-term clinical outcome
of patients with pulmonary embolism varies from an earlyrecovery of symptoms to hemodynamic deterioration anddeath. Prognostic stratification of patients with acute pulmo-nary embolism is crucial to tailor in-hospital management andto potentially improve clinical outcome.1,2 Currently, prog-nostic stratification is based primarily on blood pressure atadmission. Systemic hypotension is associated with highin-hospital mortality, which increases up to �50% in patientswith shock.2 Among patients with normal blood pressure atadmission, right ventricular dysfunction at echocardiographyidentifies those at high risk for in-hospital mortality.3–6 Inthese patients, elevated levels of troponin have been shown tobe associated with right ventricular dysfunction at echocar-diography. The relationship between serum levels of troponin
and clinical outcome in patients with pulmonary embolismhas been assessed in a number of small studies but remainsundefined.
Clinical Perspective p 433We performed a meta-analysis aimed at assessing the
prognostic value of troponin for both short-term mortality andadverse outcome events in patients with acute pulmonaryembolism.
MethodsThe methods for this meta-analysis are in accordance with “Meta-Analysis of Observational Studies in Epidemiology: A Proposal forReporting.”7
Study ObjectivesThe primary objective of this analysis was to assess whether elevatedserum troponins are associated with short-term mortality in patients
Received December 13, 2006; accepted May 11, 2007.From the Medicina Interna e Cardiovascolare, Dipartimento di Medicina Interna, Università di Perugia, Perugia, Italy.The online-only Data Supplement, consisting of a table and figures, is available with this article at http://circ.ahajournals.org/cgi/content/
full/CIRCULATIONAHA.106.680421/DC1.Correspondence to Dr Cecilia Becattini, Medicina Interna e Cardiovascolare, Dipartimento di Medicina Interna, University of Perugia, Via G. Dottori
1, 06129 Perugia, Italy. E-mail [email protected]© 2007 American Heart Association, Inc.
Circulation is available at http://www.circulationaha.org DOI: 10.1161/CIRCULATIONAHA.106.680421
427
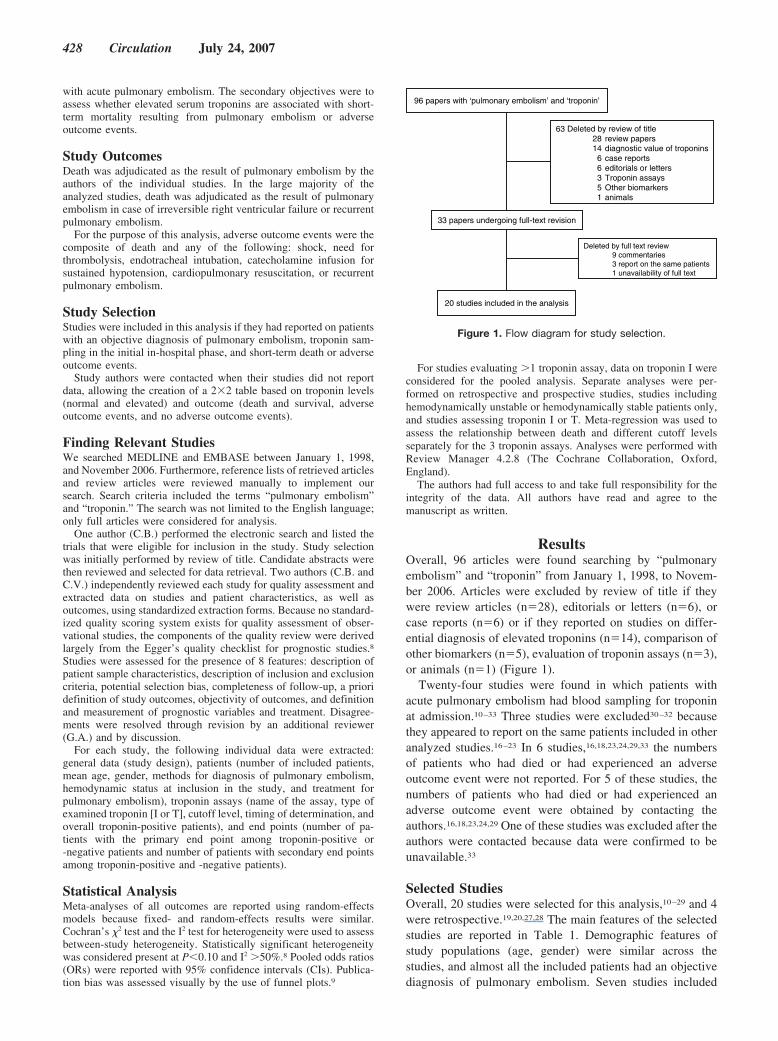
with acute pulmonary embolism. The secondary objectives were toassess whether elevated serum troponins are associated with short-term mortality resulting from pulmonary embolism or adverseoutcome events.
Study OutcomesDeath was adjudicated as the result of pulmonary embolism by theauthors of the individual studies. In the large majority of theanalyzed studies, death was adjudicated as the result of pulmonaryembolism in case of irreversible right ventricular failure or recurrentpulmonary embolism.
For the purpose of this analysis, adverse outcome events were thecomposite of death and any of the following: shock, need forthrombolysis, endotracheal intubation, catecholamine infusion forsustained hypotension, cardiopulmonary resuscitation, or recurrentpulmonary embolism.
Study SelectionStudies were included in this analysis if they had reported on patientswith an objective diagnosis of pulmonary embolism, troponin sam-pling in the initial in-hospital phase, and short-term death or adverseoutcome events.
Study authors were contacted when their studies did not reportdata, allowing the creation of a 2�2 table based on troponin levels(normal and elevated) and outcome (death and survival, adverseoutcome events, and no adverse outcome events).
Finding Relevant StudiesWe searched MEDLINE and EMBASE between January 1, 1998,and November 2006. Furthermore, reference lists of retrieved articlesand review articles were reviewed manually to implement oursearch. Search criteria included the terms “pulmonary embolism”and “troponin.” The search was not limited to the English language;only full articles were considered for analysis.
One author (C.B.) performed the electronic search and listed thetrials that were eligible for inclusion in the study. Study selectionwas initially performed by review of title. Candidate abstracts werethen reviewed and selected for data retrieval. Two authors (C.B. andC.V.) independently reviewed each study for quality assessment andextracted data on studies and patient characteristics, as well asoutcomes, using standardized extraction forms. Because no standard-ized quality scoring system exists for quality assessment of obser-vational studies, the components of the quality review were derivedlargely from the Egger’s quality checklist for prognostic studies.8Studies were assessed for the presence of 8 features: description ofpatient sample characteristics, description of inclusion and exclusioncriteria, potential selection bias, completeness of follow-up, a prioridefinition of study outcomes, objectivity of outcomes, and definitionand measurement of prognostic variables and treatment. Disagree-ments were resolved through revision by an additional reviewer(G.A.) and by discussion.
For each study, the following individual data were extracted:general data (study design), patients (number of included patients,mean age, gender, methods for diagnosis of pulmonary embolism,hemodynamic status at inclusion in the study, and treatment forpulmonary embolism), troponin assays (name of the assay, type ofexamined troponin [I or T], cutoff level, timing of determination, andoverall troponin-positive patients), and end points (number of pa-tients with the primary end point among troponin-positive or-negative patients and number of patients with secondary end pointsamong troponin-positive and -negative patients).
Statistical AnalysisMeta-analyses of all outcomes are reported using random-effectsmodels because fixed- and random-effects results were similar.Cochran’s �2 test and the I2 test for heterogeneity were used to assessbetween-study heterogeneity. Statistically significant heterogeneitywas considered present at P�0.10 and I2 �50%.8 Pooled odds ratios(ORs) were reported with 95% confidence intervals (CIs). Publica-tion bias was assessed visually by the use of funnel plots.9
For studies evaluating �1 troponin assay, data on troponin I wereconsidered for the pooled analysis. Separate analyses were per-formed on retrospective and prospective studies, studies includinghemodynamically unstable or hemodynamically stable patients only,and studies assessing troponin I or T. Meta-regression was used toassess the relationship between death and different cutoff levelsseparately for the 3 troponin assays. Analyses were performed withReview Manager 4.2.8 (The Cochrane Collaboration, Oxford,England).
The authors had full access to and take full responsibility for theintegrity of the data. All authors have read and agree to themanuscript as written.
ResultsOverall, 96 articles were found searching by “pulmonaryembolism” and “troponin” from January 1, 1998, to Novem-ber 2006. Articles were excluded by review of title if theywere review articles (n�28), editorials or letters (n�6), orcase reports (n�6) or if they reported on studies on differ-ential diagnosis of elevated troponins (n�14), comparison ofother biomarkers (n�5), evaluation of troponin assays (n�3),or animals (n�1) (Figure 1).
Twenty-four studies were found in which patients withacute pulmonary embolism had blood sampling for troponinat admission.10–33 Three studies were excluded30–32 becausethey appeared to report on the same patients included in otheranalyzed studies.16–23 In 6 studies,16,18,23,24,29,33 the numbersof patients who had died or had experienced an adverseoutcome event were not reported. For 5 of these studies, thenumbers of patients who had died or had experienced anadverse outcome event were obtained by contacting theauthors.16,18,23,24,29 One of these studies was excluded after theauthors were contacted because data were confirmed to beunavailable.33
Selected StudiesOverall, 20 studies were selected for this analysis,10–29 and 4were retrospective.19,20,27,28 The main features of the selectedstudies are reported in Table 1. Demographic features ofstudy populations (age, gender) were similar across thestudies, and almost all the included patients had an objectivediagnosis of pulmonary embolism. Seven studies included
96 papers with ‘pulmonary embolism’ and ‘troponin’
63 Deleted by review of title 28 review papers14 diagnostic value of troponins
6 case reports6 editorials or letters3 Troponin assays5 Other biomarkers1 animals
33 papers undergoing full-text revision
Deleted by full text review9 commentaries3 report on the same patients 1 unavailability of full text
20 studies included in the analysis
Figure 1. Flow diagram for study selection.
428 Circulation July 24, 2007
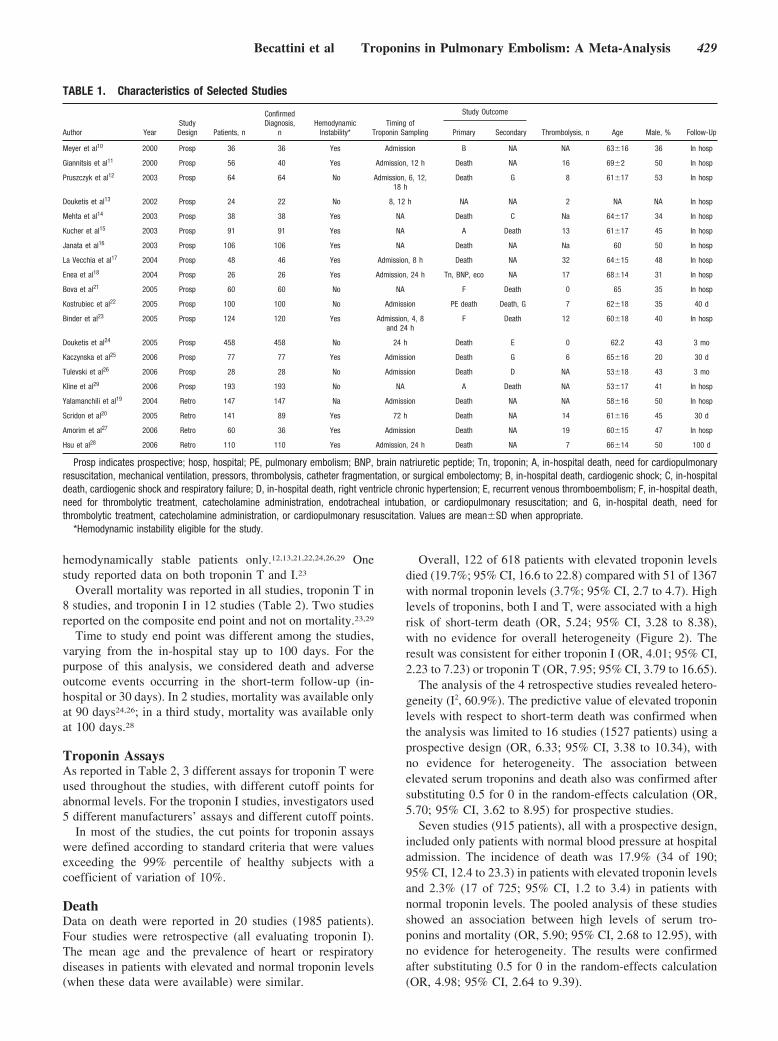
hemodynamically stable patients only.12,13,21,22,24,26,29 Onestudy reported data on both troponin T and I.23
Overall mortality was reported in all studies, troponin T in8 studies, and troponin I in 12 studies (Table 2). Two studiesreported on the composite end point and not on mortality.23,29
Time to study end point was different among the studies,varying from the in-hospital stay up to 100 days. For thepurpose of this analysis, we considered death and adverseoutcome events occurring in the short-term follow-up (in-hospital or 30 days). In 2 studies, mortality was available onlyat 90 days24,26; in a third study, mortality was available onlyat 100 days.28
Troponin AssaysAs reported in Table 2, 3 different assays for troponin T wereused throughout the studies, with different cutoff points forabnormal levels. For the troponin I studies, investigators used5 different manufacturers’ assays and different cutoff points.
In most of the studies, the cut points for troponin assayswere defined according to standard criteria that were valuesexceeding the 99% percentile of healthy subjects with acoefficient of variation of 10%.
DeathData on death were reported in 20 studies (1985 patients).Four studies were retrospective (all evaluating troponin I).The mean age and the prevalence of heart or respiratorydiseases in patients with elevated and normal troponin levels(when these data were available) were similar.
Overall, 122 of 618 patients with elevated troponin levelsdied (19.7%; 95% CI, 16.6 to 22.8) compared with 51 of 1367with normal troponin levels (3.7%; 95% CI, 2.7 to 4.7). Highlevels of troponins, both I and T, were associated with a highrisk of short-term death (OR, 5.24; 95% CI, 3.28 to 8.38),with no evidence for overall heterogeneity (Figure 2). Theresult was consistent for either troponin I (OR, 4.01; 95% CI,2.23 to 7.23) or troponin T (OR, 7.95; 95% CI, 3.79 to 16.65).
The analysis of the 4 retrospective studies revealed hetero-geneity (I2, 60.9%). The predictive value of elevated troponinlevels with respect to short-term death was confirmed whenthe analysis was limited to 16 studies (1527 patients) using aprospective design (OR, 6.33; 95% CI, 3.38 to 10.34), withno evidence for heterogeneity. The association betweenelevated serum troponins and death also was confirmed aftersubstituting 0.5 for 0 in the random-effects calculation (OR,5.70; 95% CI, 3.62 to 8.95) for prospective studies.
Seven studies (915 patients), all with a prospective design,included only patients with normal blood pressure at hospitaladmission. The incidence of death was 17.9% (34 of 190;95% CI, 12.4 to 23.3) in patients with elevated troponin levelsand 2.3% (17 of 725; 95% CI, 1.2 to 3.4) in patients withnormal troponin levels. The pooled analysis of these studiesshowed an association between high levels of serum tro-ponins and mortality (OR, 5.90; 95% CI, 2.68 to 12.95), withno evidence for heterogeneity. The results were confirmedafter substituting 0.5 for 0 in the random-effects calculation(OR, 4.98; 95% CI, 2.64 to 9.39).
TABLE 1. Characteristics of Selected Studies
Author YearStudyDesign Patients, n
ConfirmedDiagnosis,
nHemodynamic
Instability*Timing of
Troponin Sampling
Study Outcome
Thrombolysis, n Age Male, % Follow-UpPrimary Secondary
Meyer et al10 2000 Prosp 36 36 Yes Admission B NA NA 63�16 36 In hosp
Giannitsis et al11 2000 Prosp 56 40 Yes Admission, 12 h Death NA 16 69�2 50 In hosp
Pruszczyk et al12 2003 Prosp 64 64 No Admission, 6, 12,18 h
Death G 8 61�17 53 In hosp
Douketis et al13 2002 Prosp 24 22 No 8, 12 h NA NA 2 NA NA In hosp
Mehta et al14 2003 Prosp 38 38 Yes NA Death C Na 64�17 34 In hosp
Kucher et al15 2003 Prosp 91 91 Yes NA A Death 13 61�17 45 In hosp
Janata et al16 2003 Prosp 106 106 Yes NA Death NA Na 60 50 In hosp
La Vecchia et al17 2004 Prosp 48 46 Yes Admission, 8 h Death NA 32 64�15 48 In hosp
Enea et al18 2004 Prosp 26 26 Yes Admission, 24 h Tn, BNP, eco NA 17 68�14 31 In hosp
Bova et al21 2005 Prosp 60 60 No NA F Death 0 65 35 In hosp
Kostrubiec et al22 2005 Prosp 100 100 No Admission PE death Death, G 7 62�18 35 40 d
Binder et al23 2005 Prosp 124 120 Yes Admission, 4, 8and 24 h
F Death 12 60�18 40 In hosp
Douketis et al24 2005 Prosp 458 458 No 24 h Death E 0 62.2 43 3 mo
Kaczynska et al25 2006 Prosp 77 77 Yes Admission Death G 6 65�16 20 30 d
Tulevski et al26 2006 Prosp 28 28 No Admission Death D NA 53�18 43 3 mo
Kline et al29 2006 Prosp 193 193 No NA A Death NA 53�17 41 In hosp
Yalamanchili et al19 2004 Retro 147 147 Na Admission Death NA NA 58�16 50 In hosp
Scridon et al20 2005 Retro 141 89 Yes 72 h Death NA 14 61�16 45 30 d
Amorim et al27 2006 Retro 60 36 Yes Admission Death NA 19 60�15 47 In hosp
Hsu et al28 2006 Retro 110 110 Yes Admission, 24 h Death NA 7 66�14 50 100 d
Prosp indicates prospective; hosp, hospital; PE, pulmonary embolism; BNP, brain natriuretic peptide; Tn, troponin; A, in-hospital death, need for cardiopulmonaryresuscitation, mechanical ventilation, pressors, thrombolysis, catheter fragmentation, or surgical embolectomy; B, in-hospital death, cardiogenic shock; C, in-hospitaldeath, cardiogenic shock and respiratory failure; D, in-hospital death, right ventricle chronic hypertension; E, recurrent venous thromboembolism; F, in-hospital death,need for thrombolytic treatment, catecholamine administration, endotracheal intubation, or cardiopulmonary resuscitation; and G, in-hospital death, need forthrombolytic treatment, catecholamine administration, or cardiopulmonary resuscitation. Values are mean�SD when appropriate.
*Hemodynamic instability eligible for the study.
Becattini et al Troponins in Pulmonary Embolism: A Meta-Analysis 429
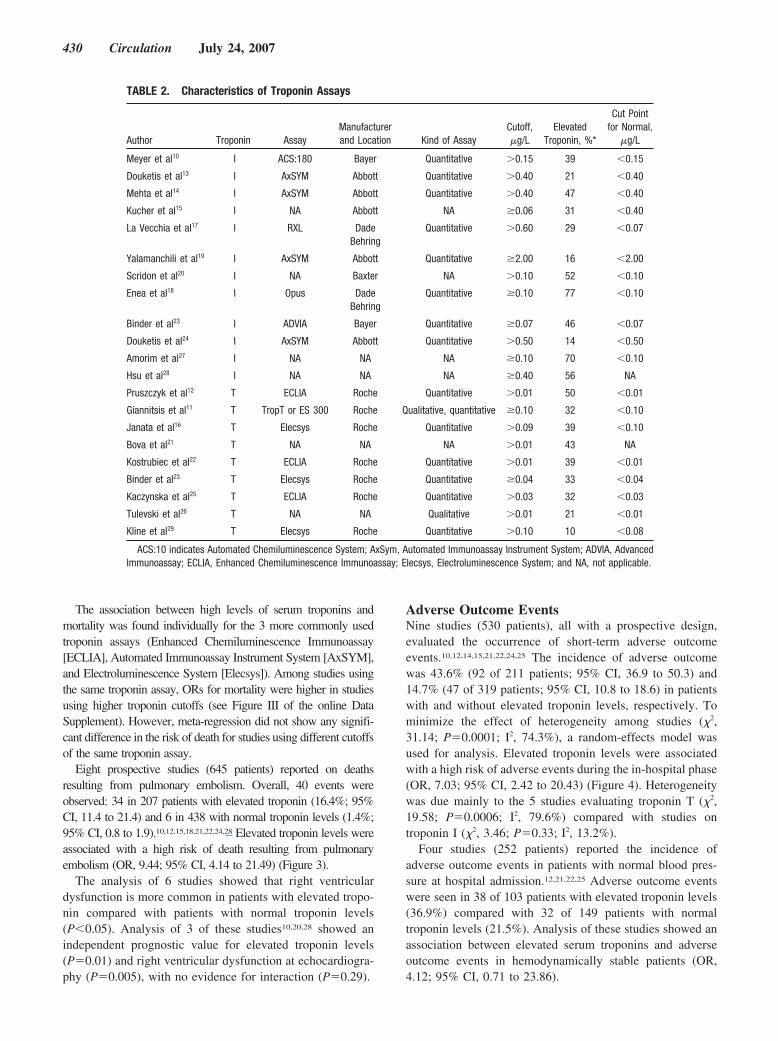
The association between high levels of serum troponins andmortality was found individually for the 3 more commonly usedtroponin assays (Enhanced Chemiluminescence Immunoassay[ECLIA], Automated Immunoassay Instrument System [AxSYM],and Electroluminescence System [Elecsys]). Among studies usingthe same troponin assay, ORs for mortality were higher in studiesusing higher troponin cutoffs (see Figure III of the online DataSupplement). However, meta-regression did not show any signifi-cant difference in the risk of death for studies using different cutoffsof the same troponin assay.
Eight prospective studies (645 patients) reported on deathsresulting from pulmonary embolism. Overall, 40 events wereobserved: 34 in 207 patients with elevated troponin (16.4%; 95%CI, 11.4 to 21.4) and 6 in 438 with normal troponin levels (1.4%;95% CI, 0.8 to 1.9).10,12,15,18,21,22,24,28 Elevated troponin levels wereassociated with a high risk of death resulting from pulmonaryembolism (OR, 9.44; 95% CI, 4.14 to 21.49) (Figure 3).
The analysis of 6 studies showed that right ventriculardysfunction is more common in patients with elevated tropo-nin compared with patients with normal troponin levels(P�0.05). Analysis of 3 of these studies10,20,28 showed anindependent prognostic value for elevated troponin levels(P�0.01) and right ventricular dysfunction at echocardiogra-phy (P�0.005), with no evidence for interaction (P�0.29).
Adverse Outcome EventsNine studies (530 patients), all with a prospective design,evaluated the occurrence of short-term adverse outcomeevents.10,12,14,15,21,22,24,25 The incidence of adverse outcomewas 43.6% (92 of 211 patients; 95% CI, 36.9 to 50.3) and14.7% (47 of 319 patients; 95% CI, 10.8 to 18.6) in patientswith and without elevated troponin levels, respectively. Tominimize the effect of heterogeneity among studies (�2,31.14; P�0.0001; I2, 74.3%), a random-effects model wasused for analysis. Elevated troponin levels were associatedwith a high risk of adverse events during the in-hospital phase(OR, 7.03; 95% CI, 2.42 to 20.43) (Figure 4). Heterogeneitywas due mainly to the 5 studies evaluating troponin T (�2,19.58; P�0.0006; I2, 79.6%) compared with studies ontroponin I (�2, 3.46; P�0.33; I2, 13.2%).
Four studies (252 patients) reported the incidence ofadverse outcome events in patients with normal blood pres-sure at hospital admission.12,21,22,25 Adverse outcome eventswere seen in 38 of 103 patients with elevated troponin levels(36.9%) compared with 32 of 149 patients with normaltroponin levels (21.5%). Analysis of these studies showed anassociation between elevated serum troponins and adverseoutcome events in hemodynamically stable patients (OR,4.12; 95% CI, 0.71 to 23.86).
TABLE 2. Characteristics of Troponin Assays
Author Troponin AssayManufacturerand Location Kind of Assay
Cutoff,�g/L
ElevatedTroponin, %*
Cut Pointfor Normal,
�g/L
Meyer et al10 I ACS:180 Bayer Quantitative �0.15 39 �0.15
Douketis et al13 I AxSYM Abbott Quantitative �0.40 21 �0.40
Mehta et al14 I AxSYM Abbott Quantitative �0.40 47 �0.40
Kucher et al15 I NA Abbott NA �0.06 31 �0.40
La Vecchia et al17 I RXL DadeBehring
Quantitative �0.60 29 �0.07
Yalamanchili et al19 I AxSYM Abbott Quantitative �2.00 16 �2.00
Scridon et al20 I NA Baxter NA �0.10 52 �0.10
Enea et al18 I Opus DadeBehring
Quantitative �0.10 77 �0.10
Binder et al23 I ADVIA Bayer Quantitative �0.07 46 �0.07
Douketis et al24 I AxSYM Abbott Quantitative �0.50 14 �0.50
Amorim et al27 I NA NA NA �0.10 70 �0.10
Hsu et al28 I NA NA NA �0.40 56 NA
Pruszczyk et al12 T ECLIA Roche Quantitative �0.01 50 �0.01
Giannitsis et al11 T TropT or ES 300 Roche Qualitative, quantitative �0.10 32 �0.10
Janata et al16 T Elecsys Roche Quantitative �0.09 39 �0.10
Bova et al21 T NA NA NA �0.01 43 NA
Kostrubiec et al22 T ECLIA Roche Quantitative �0.01 39 �0.01
Binder et al23 T Elecsys Roche Quantitative �0.04 33 �0.04
Kaczynska et al25 T ECLIA Roche Quantitative �0.03 32 �0.03
Tulevski et al26 T NA NA Qualitative �0.01 21 �0.01
Kline et al29 T Elecsys Roche Quantitative �0.10 10 �0.08
ACS:10 indicates Automated Chemiluminescence System; AxSym, Automated Immunoassay Instrument System; ADVIA, AdvancedImmunoassay; ECLIA, Enhanced Chemiluminescence Immunoassay; Elecsys, Electroluminescence System; and NA, not applicable.
430 Circulation July 24, 2007
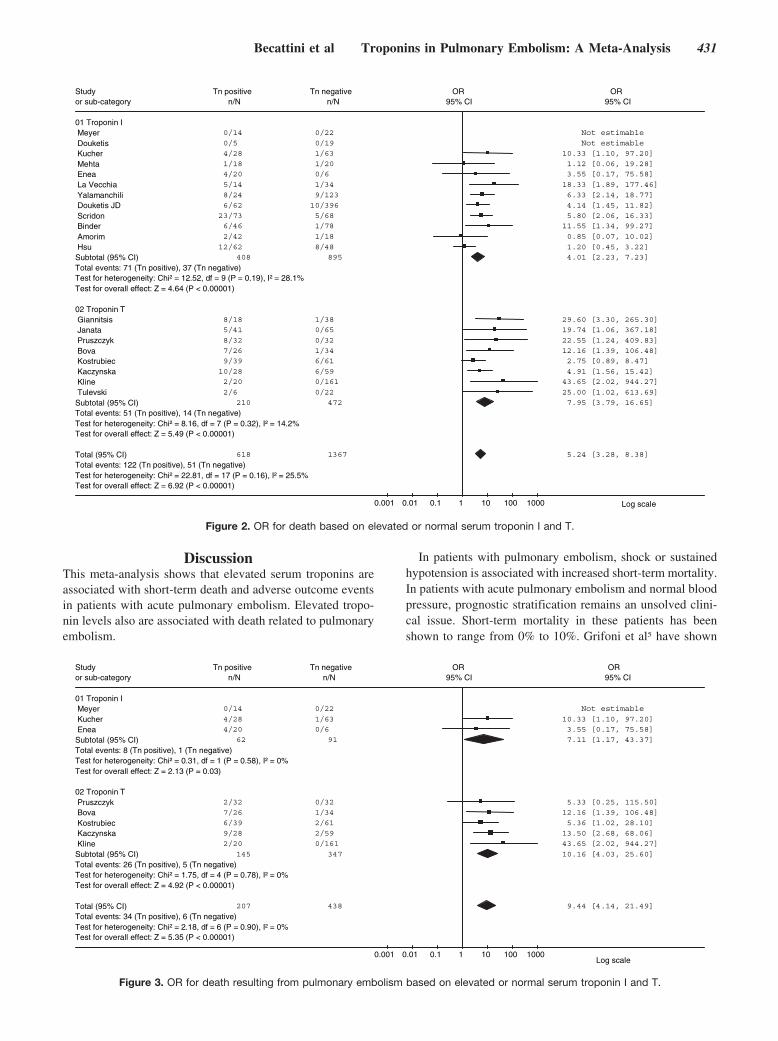
DiscussionThis meta-analysis shows that elevated serum troponins areassociated with short-term death and adverse outcome eventsin patients with acute pulmonary embolism. Elevated tropo-nin levels also are associated with death related to pulmonaryembolism.
In patients with pulmonary embolism, shock or sustainedhypotension is associated with increased short-term mortality.In patients with acute pulmonary embolism and normal bloodpressure, prognostic stratification remains an unsolved clini-cal issue. Short-term mortality in these patients has beenshown to range from 0% to 10%. Grifoni et al5 have shown
Study Tn positive Tn negative OR OR or sub-category n/N n/N 95% CI 95% CI
01 Troponin IMeyer 0/14 0/22 Not estimable
Douketis 0/5 0/19 Not estimable
Kucher 4/28 1/63 10.33 [1.10, 97.20]
Mehta 1/18 1/20 1.12 [0.06, 19.28]
Enea 4/20 0/6 3.55 [0.17, 75.58]
La Vecchia 5/14 1/34 18.33 [1.89, 177.46]
Yalamanchili 8/24 9/123 6.33 [2.14, 18.77]
Douketis JD 6/62 10/396 4.14 [1.45, 11.82]
Scridon 23/73 5/68 5.80 [2.06, 16.33]
Binder 6/46 1/78 11.55 [1.34, 99.27]
Amorim 2/42 1/18 0.85 [0.07, 10.02]
Hsu 12/62 8/48 1.20 [0.45, 3.22]
Subtotal (95% CI) 408 895 4.01 [2.23, 7.23]
Total events: 71 (Tn positive), 37 (Tn negative)Test for heterogeneity: Chi² = 12.52, df = 9 (P = 0.19), I² = 28.1%Test for overall effect: Z = 4.64 (P < 0.00001)
02 Troponin TGiannitsis 8/18 1/38 29.60 [3.30, 265.30]
Janata 5/41 0/65 19.74 [1.06, 367.18]
Pruszczyk 8/32 0/32 22.55 [1.24, 409.83]
Bova 7/26 1/34 12.16 [1.39, 106.48]
Kostrubiec 9/39 6/61 2.75 [0.89, 8.47]
Kaczynska 10/28 6/59 4.91 [1.56, 15.42]
Kline 2/20 0/161 43.65 [2.02, 944.27]
Tulevski 2/6 0/22 25.00 [1.02, 613.69]
Subtotal (95% CI) 210 472 7.95 [3.79, 16.65]
Total events: 51 (Tn positive), 14 (Tn negative)Test for heterogeneity: Chi² = 8.16, df = 7 (P = 0.32), I² = 14.2%Test for overall effect: Z = 5.49 (P < 0.00001)
Total (95% CI) 618 1367 5.24 [3.28, 8.38]
Total events: 122 (Tn positive), 51 (Tn negative)Test for heterogeneity: Chi² = 22.81, df = 17 (P = 0.16), I² = 25.5%Test for overall effect: Z = 6.92 (P < 0.00001)
0.001 0.01 0.1 1 10 100 1000 Log scale
Figure 2. OR for death based on elevated or normal serum troponin I and T.
Study Tn positive Tn negative OR OR or sub-category n/N n/N 95% CI 95% CI
01 Troponin IMeyer 0/14 0/22 Not estimable
Kucher 4/28 1/63 10.33 [1.10, 97.20]
Enea 4/20 0/6 3.55 [0.17, 75.58]
Subtotal (95% CI) 62 91 7.11 [1.17, 43.37]
Total events: 8 (Tn positive), 1 (Tn negative)Test for heterogeneity: Chi² = 0.31, df = 1 (P = 0.58), I² = 0%Test for overall effect: Z = 2.13 (P = 0.03)
02 Troponin TPruszczyk 2/32 0/32 5.33 [0.25, 115.50]
Bova 7/26 1/34 12.16 [1.39, 106.48]
Kostrubiec 6/39 2/61 5.36 [1.02, 28.10]
Kaczynska 9/28 2/59 13.50 [2.68, 68.06]
Kline 2/20 0/161 43.65 [2.02, 944.27]
Subtotal (95% CI) 145 347 10.16 [4.03, 25.60]
Total events: 26 (Tn positive), 5 (Tn negative)Test for heterogeneity: Chi² = 1.75, df = 4 (P = 0.78), I² = 0%Test for overall effect: Z = 4.92 (P < 0.00001)
Total (95% CI) 207 438 9.44 [4.14, 21.49]
Total events: 34 (Tn positive), 6 (Tn negative)Test for heterogeneity: Chi² = 2.18, df = 6 (P = 0.90), I² = 0%Test for overall effect: Z = 5.35 (P < 0.00001)
0.001 0.01 0.1 1 10 100 1000Log scale
Figure 3. OR for death resulting from pulmonary embolism based on elevated or normal serum troponin I and T.
Becattini et al Troponins in Pulmonary Embolism: A Meta-Analysis 431
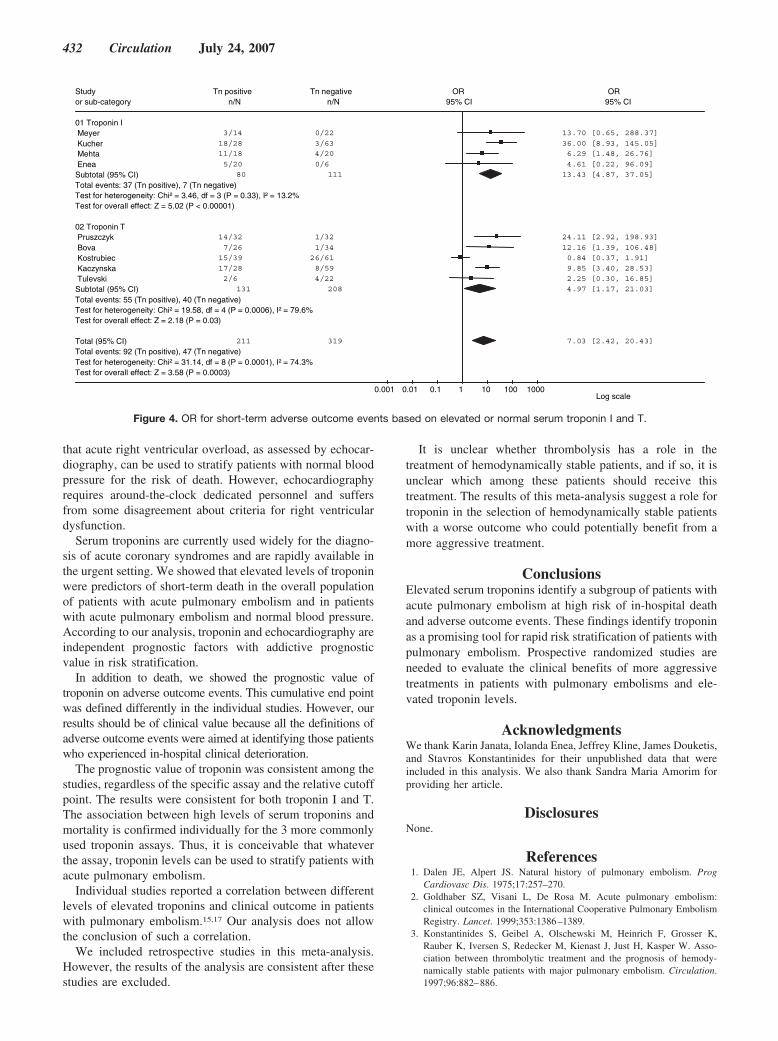
that acute right ventricular overload, as assessed by echocar-diography, can be used to stratify patients with normal bloodpressure for the risk of death. However, echocardiographyrequires around-the-clock dedicated personnel and suffersfrom some disagreement about criteria for right ventriculardysfunction.
Serum troponins are currently used widely for the diagno-sis of acute coronary syndromes and are rapidly available inthe urgent setting. We showed that elevated levels of troponinwere predictors of short-term death in the overall populationof patients with acute pulmonary embolism and in patientswith acute pulmonary embolism and normal blood pressure.According to our analysis, troponin and echocardiography areindependent prognostic factors with addictive prognosticvalue in risk stratification.
In addition to death, we showed the prognostic value oftroponin on adverse outcome events. This cumulative end pointwas defined differently in the individual studies. However, ourresults should be of clinical value because all the definitions ofadverse outcome events were aimed at identifying those patientswho experienced in-hospital clinical deterioration.
The prognostic value of troponin was consistent among thestudies, regardless of the specific assay and the relative cutoffpoint. The results were consistent for both troponin I and T.The association between high levels of serum troponins andmortality is confirmed individually for the 3 more commonlyused troponin assays. Thus, it is conceivable that whateverthe assay, troponin levels can be used to stratify patients withacute pulmonary embolism.
Individual studies reported a correlation between differentlevels of elevated troponins and clinical outcome in patientswith pulmonary embolism.15,17 Our analysis does not allowthe conclusion of such a correlation.
We included retrospective studies in this meta-analysis.However, the results of the analysis are consistent after thesestudies are excluded.
It is unclear whether thrombolysis has a role in thetreatment of hemodynamically stable patients, and if so, it isunclear which among these patients should receive thistreatment. The results of this meta-analysis suggest a role fortroponin in the selection of hemodynamically stable patientswith a worse outcome who could potentially benefit from amore aggressive treatment.
ConclusionsElevated serum troponins identify a subgroup of patients withacute pulmonary embolism at high risk of in-hospital deathand adverse outcome events. These findings identify troponinas a promising tool for rapid risk stratification of patients withpulmonary embolism. Prospective randomized studies areneeded to evaluate the clinical benefits of more aggressivetreatments in patients with pulmonary embolisms and ele-vated troponin levels.
AcknowledgmentsWe thank Karin Janata, Iolanda Enea, Jeffrey Kline, James Douketis,and Stavros Konstantinides for their unpublished data that wereincluded in this analysis. We also thank Sandra Maria Amorim forproviding her article.
DisclosuresNone.
References1. Dalen JE, Alpert JS. Natural history of pulmonary embolism. Prog
Cardiovasc Dis. 1975;17:257–270.2. Goldhaber SZ, Visani L, De Rosa M. Acute pulmonary embolism:
clinical outcomes in the International Cooperative Pulmonary EmbolismRegistry. Lancet. 1999;353:1386–1389.
3. Konstantinides S, Geibel A, Olschewski M, Heinrich F, Grosser K,Rauber K, Iversen S, Redecker M, Kienast J, Just H, Kasper W. Asso-ciation between thrombolytic treatment and the prognosis of hemody-namically stable patients with major pulmonary embolism. Circulation.1997;96:882–886.
Study Tn positive Tn negative OR OR or sub-category n/N n/N 95% CI 95% CI
01 Troponin IMeyer 3/14 0/22 13.70 [0.65, 288.37]
Kucher 18/28 3/63 36.00 [8.93, 145.05]
Mehta 11/18 4/20 6.29 [1.48, 26.76]
Enea 5/20 0/6 4.61 [0.22, 96.09]
Subtotal (95% CI) 80 111 13.43 [4.87, 37.05]
Total events: 37 (Tn positive), 7 (Tn negative)Test for heterogeneity: Chi² = 3.46, df = 3 (P = 0.33), I² = 13.2%Test for overall effect: Z = 5.02 (P < 0.00001)
02 Troponin TPruszczyk 14/32 1/32 24.11 [2.92, 198.93]
Bova 7/26 1/34 12.16 [1.39, 106.48]
Kostrubiec 15/39 26/61 0.84 [0.37, 1.91]
Kaczynska 17/28 8/59 9.85 [3.40, 28.53]
Tulevski 2/6 4/22 2.25 [0.30, 16.85]
Subtotal (95% CI) 131 208 4.97 [1.17, 21.03]
Total events: 55 (Tn positive), 40 (Tn negative)Test for heterogeneity: Chi² = 19.58, df = 4 (P = 0.0006), I² = 79.6%Test for overall effect: Z = 2.18 (P = 0.03)
Total (95% CI) 211 319 7.03 [2.42, 20.43]
Total events: 92 (Tn positive), 47 (Tn negative)Test for heterogeneity: Chi² = 31.14, df = 8 (P = 0.0001), I² = 74.3%Test for overall effect: Z = 3.58 (P = 0.0003)
0.001 0.01 0.1 1 10 100 1000Log scale
Figure 4. OR for short-term adverse outcome events based on elevated or normal serum troponin I and T.
432 Circulation July 24, 2007
4. Ribeiro A, Lindmarker P, Juhlin-Dannfelt A, Johnsson H, Jorfeldt L. Echo-cardiography Doppler in pulmonary embolism: right ventricular dysfunctionas a predictor of mortality rate. Am Heart J. 1997;134:479–487.
5. Grifoni S, Olivotto I, Cecchini P, Pieralli F, Camaiti A, Santoro G, ContiA, Agnelli G, Berni G. Short-term clinical outcome of patients withpulmonary embolism, normal blood pressure, and echocardiographicright ventricular dysfunction. Circulation. 2000;101:2817–2822.
6. Kucher N, Rossi E, De Rosa M, Goldhaber SZ. Prognostic role ofechocardiography among patients with acute pulmonary embolism and asystolic arterial pressure of 90 mm Hg or higher. Arch Intern Med.2005;165:1777–1781.
7. Stroup DF, Berlin JA, Morton SC, Olkin I, Williamson GD, Rennie D,Moher D, Becker BJ, Sipe TA, Thacker SB. Meta-analysis of observa-tional studies in epidemiology: a proposal for reporting: Meta-Analysis ofObservational Studies in Epidemiology (MOOSE) group. JAMA. 2000;283:2008–2012.
8. Higgins JPT, Thompson SG. Quantifying heterogeneity in a meta-anal-ysis. Stat Med. 2002;21:1539–1558.
9. Altman DG, Chalmers I, Egger M, Smith GD. Systematic Reviews inHealth Care: Meta-Analysis in Context. 2nd ed. London, UK: BlackwellBMJ Books; 2001.
10. Meyer T, Binder L, Hruska N, Luthe H, Buchwald AB. Cardiac troponinI elevation in acute pulmonary embolism is associated with right ventric-ular dysfunction. J Am Coll Cardiol. 2000;36:1632–1636.
11. Giannitsis E, Muller-Bardorff M, Kurowski V, Weidtmann B, WiegandU, Kampmann M, Katus HA. Independent prognostic value of cardiactroponin T in patients with confirmed pulmonary embolism. Circulation.2000;102:211–217.
12. Pruszczyk P, Bochowicz A, Torbicki A, Szulc M, Kurzyna M,Fijalkowska A, Kuch-Wocial A. Cardiac troponin T monitoring identifieshigh-risk group of normotensive patients with acute pulmonaryembolism. Chest. 2003;123:1947–1952.
13. Douketis JD, Crowther MA, Stanton EB, Ginsberg JS. Elevated cardiactroponin levels in patients with submassive pulmonary embolism. ArchIntern Med. 2002;162:79–81.
14. Mehta NJ, Jani K, Khan IA. Clinical usefulness and prognostic value ofelevated cardiac troponin I levels in acute pulmonary embolism. AmHeart J. 2003;145:821–825.
15. Kucher N, Wallmann D, Carone A, Windecker S, Meier B, Hess OM.Incremental prognostic value of troponin I and echocardiography in patientswith acute pulmonary embolism. Eur Heart J. 2003;24:1651–1656.
16. Janata K, Holzer M, Laggner AN, Mullner M. Cardiac troponin T in theseverity assessment of patients with pulmonary embolism: cohort study.BMJ. 2003;326:312–313.
17. La Vecchia L, Ottani F, Favero L, Spadaro GL, Rubboli A, Boanno C,Mezzena G, Fontanelli A, Jaffe AS. Increased cardiac troponin I onadmission predicts in-hospital mortality in acute pulmonary embolism.Heart. 2004;90:633–637.
18. Enea I, Ceparano G, Mazzarella G, Di Sarno R, Cangiano G, Busino CA.Biohumoral markers and right ventricular dysfunction in acute pulmonaryembolism: the answer to thrombolytic therapy. Ital Heart J Suppl. 2004;5:29–35.
19. Yalamanchili K, Sukhija R, Aronow WS, Sinha N, Fleisher AG, LehrmanSG. Prevalence of increased cardiac troponin I levels in patients with andwithout acute pulmonary embolism and relation of increased cardiactroponin I levels with in-hospital mortality in patients with acute pulmo-nary embolism. Am J Cardiol. 2004;93:263–264.
20. Scridon T, Scridon C, Skali H, Alvarez A, Goldhaber SZ, Solomon SD.Prognostic significance of troponin elevation and right ventricularenlargement in acute pulmonary embolism. Am J Cardiol. 2005;96:303–305.
21. Bova C, Crocco F, Ricchio R, Serafini O, Greco F, Noto A. Importanceof troponin T for the risk stratification of normotensive patients withpulmonary embolism: a prospective, cohort study with a three-monthfollow-up. Haematologica. 2005;90:423–424.
22. Kostrubiec M, Pruszczyk P, Bochowicz A, Pacho R, Szulc M, KaczynskaA, Styczynski G, Kuch-Wocial A, Abramczyk P, Bartoszewicz Z, BerentH, Kuczynska K. Biomarker-based risk assessment model in acute pul-monary embolism. Eur Heart J. 2005;26:2166–2172.
23. Binder L, Pieske B, Olschewski M, Geibel A, Klostermann B, Reiner C,Konstantinides S. N-terminal pro-brain natriuretic peptide or troponintesting followed by echocardiography for risk stratification of acutepulmonary embolism. Circulation. 2005;112:1573–1579.
24. Douketis JD, Leeuwenkamp O, Grobara P, Johnston M, Sohne M, TenWolde M, Buller H. The incidence and prognostic significance ofelevated cardiac troponins in patients with submassive pulmonaryembolism. J Thromb Haemost. 2005;3:508–513.
25. Kaczynska A, Pelsers MM, Bochowicz A, Kostrubiec M, Glatz JF,Pruszczyk P. Plasma heart-type fatty acid binding protein is superior totroponin and myoglobin for rapid risk stratification in acute pulmonaryembolism. Clin Chim Acta. 2006;371:117–123.
26. Tulevski II, ten Wolde M, van Veldhuisen DJ, Mulder JW, van der WallEE, Buller HR, Mulder BJ. Combined utility of brain natriuretic peptideand cardiac troponin T may improve rapid triage and risk stratification innormotensive patients with pulmonary embolism. Int J Cardiol. 2007;116:161–166.
27. Amorim S, Dias P, Rodrigues RA, Araujo V, Macedo F, Maciel MJ, Gon-calves FR. Troponin I as a marker of right ventricular dysfunction andseverity of pulmonary embolism. Rev Port Cardiol. 2006;25:181–186.
28. Hsu JT, Chu CM, Chang ST, Cheng HW, Cheng NJ, Chung CM. Prog-nostic role of right ventricular dilatation and troponin I elevation in acutepulmonary embolism. Int Heart J. 2006;47:775–781.
29. Kline JA, Hernandez-Nino J, Rose GA, Norton HJ, Camargo CA Jr.Surrogate markers for adverse outcomes in normotensive patients withpulmonary embolism. Crit Care Med. 2006;34:2773–2780.
30. Kucher N, Printzen G, Doernhoefer T, Windecker S, Meier B, Hess OM.Low pro-brain natriuretic peptide levels predict benign clinical outcomein acute pulmonary embolism. Circulation. 2003;107:1576–1578.
31. Kucher N, Printzen G, Goldhaber SZ. Prognostic role of brain natriureticpeptide in acute pulmonary embolism. Circulation. 2003;107:2545–2547.
32. Konstantinides S, Geibel A, Olschewski M, Kasper W, Hruska N, Jackle S,Binder L. Importance of cardiac troponins I and T in risk stratification ofpatients with acute pulmonary embolism. Circulation. 2002;106:1263–1268.
33. Calvo-Romero JM, Perez-Miranda M, Bureo-Dacal P. Syncope in acutepulmonary embolism. Eur J Emerg Med. 2004;11:208–209.
CLINICAL PERSPECTIVEIn-hospital mortality associated with pulmonary embolism ranges as widely as from 0% to 30%, depending on clinicalfeatures at admission. Hence, prognostic stratification of patients with acute pulmonary embolism is crucial to tailorin-hospital management and to improve patients’ outcome. In patients presenting with shock or hypotension, earlypulmonary reperfusion is required to reduce mortality. Prognostic stratification in patients with pulmonary embolism andnormal blood pressure is particularly complex. We performed a meta-analysis of studies aimed at assessing the prognosticvalue of troponin in patients with acute pulmonary embolism. This meta-analysis shows that elevated serum troponins areassociated with short-term death, death related to pulmonary embolism, and increased rate of adverse outcome events. Ofnote, elevated levels of troponin are predictors of short-term death in the overall population of patients with acutepulmonary embolism and in patients with acute pulmonary embolism and normal blood pressure. Troponin andechocardiography appear to be independent prognostic factors with addictive prognostic value. The advantages of troponinassay over other prognostic features are related to its ease of use and its wide and rapid availability. Prospective randomizedstudies are needed to evaluate the clinical benefits of more aggressive treatments in patients with pulmonary embolisms andelevated troponin levels. On the other hand, the benefit of simplified management strategies, including home treatment, forpatients with normal blood pressure, normal troponin levels, and normal echocardiography deserves to be further evaluated.
Becattini et al Troponins in Pulmonary Embolism: A Meta-Analysis 433
. . . . . . . . . . . . . . . . . . . . . . . . . . . . . . . . . . . . . . . . . . . . . . . . . . . . . . . . . . . . . . . . . . . . . . . . . . . . . . . . . . . . . . . . . . . . . . . . . . . . . . . . . . . . . . . . . . . . . . . . . . . . . . . . . . . . . . . . . . . . . . . . . . . . . . . . . . . . . . . . . . . . . . . . . . . . . . . . . . . . .
. . . . . . . . . . . . . . . . . . . . . . . . . . . . . . . . . . . . . . . . . . . . . . . . . . . . . . . . . . . . . . . . . . . . . . . . . . . . . . . . . . . . . . . . . . . . . . . . . . . . . . . . . . . . . . . . . . . . . . . . . . . . . . . . . . . . . . . . . . . . . . . . . . . . . . . . . . . . . . . . . . . . . . . . . . . . . . . . . . . . .
CLINICAL RESEARCHPulmonary hypertension
Prognostic value of right ventricular dysfunctionin patients with haemodynamically stablepulmonary embolism: a systematic reviewOlivier Sanchez1,2*, Ludovic Trinquart3,4, Isabelle Colombet2,5,6, Pierre Durieux2,5,6,Menno V. Huisman8, Gilles Chatellier2,5,6, and Guy Meyer1,2,7
1APHP, Division of Respiratory and Intensive Care Medicine, Georges Pompidou European Hospital, 75015 Paris, France; 2Universite Paris Descartes, 75006 Paris, France; 3APHP,Epidemiology and Clinical Research Unit, Georges Pompidou European Hospital, 75015 Paris, France; 4INSERM, CIE4, 75015 Paris, France; 5APHP, Hospital Informatics Department,Georges Pompidou European Hospital, 75015 Paris, France; 6INSERM, UMR-S 872, eq. 20, 75006 Paris, France; 7INSERM U 765, 75015 Paris, France; and 8Section of ClinicalVascular Medicine, Department of General Internal Medicine/Endocrinology, Leiden University Medical Center, Albinusdreef 2, Room C4-68, 2300 RC Leiden, The Netherlands
Received 29 December 2007; revised 22 April 2008; accepted 24 April 2008; online publish-ahead-of-print 21 May 2008
Aims To determine the prognostic value of right ventricular (RV) dysfunction assessed by echocardiography or spiral com-puted tomography (CT), or by increased levels of cardiac biomarkers [troponin, brain natriuretic peptide (BNP) andpro-BNP] in patients with haemodynamically stable pulmonary embolism (PE).
Methodsand results
We included all studies published between January 1985 and October 2007 estimating the relationship betweenechocardiography, CT or cardiac biomarkers and the risk of death in patients with haemodynamically stable PE.Twelve of 722 potentially relevant studies met inclusion criteria. The unadjusted risk ratio of RV dysfunction asassessed by echocardiography (five studies) or by CT (two studies) for predicting death was 2.4 [95% confidenceinterval (CI) 1.3–4.4]. The unadjusted risk ratio for predicting death was 9.5 (95% CI 3.2–28.6) for BNP (fivestudies), 5.7 (95% CI 2.2–15.1) for pro-BNP (two studies) and 8.3 (95% CI 3.6–19.3) for cardiac troponin (threestudies). Threshold values differed substantially between studies for all markers.
Conclusion RV dysfunction assessed by CT, echocardiography, or by cardiac biomarkers are all associated with an increased riskof mortality in patients with haemodynamically stable PE. These findings should be interpreted with caution becauseof the clinical and methodological diversity of studies.
- - - - - - - - - - - - - - - - - - - - - - - - - - - - - - - - - - - - - - - - - - - - - - - - - - - - - - - - - - - - - - - - - - - - - - - - - - - - - - - - - - - - - - - - - - - - - - - - - - - - - - - - - - - - - - - - - - - - - - - - - - - - - - - - - - - - - - - - - - - - - - - - - - - - - - - - - - -Keywords Pulmonary embolism † Prognosis † Right ventricular dysfunction † BNP † Echocardiography
IntroductionThe short-term prognosis of pulmonary embolism (PE) dependson haemodynamic status and underlying disease.1,2 It has beensuggested that patients with PE should be classified into twogroups: those with massive PE presenting with hypotension orshock, for whom the risk of death is high, and patients with non-massive PE who present with normal blood pressure and have alow risk of death.3 The debate has recently focused on a subgroupof normotensive patients with subclinical haemodynamic impair-ment detected by echocardiography, cardiac biomarkers or spiralcomputed tomography (CT). This subgroup of patients has beenshown to have a higher mortality rate in some studies but not
all case series.4,5 We carried out a meta-analysis to assess the prog-nostic value of right ventricular (RV) dysfunction as evaluated byechocardiography or spiral CT, and the prognostic value ofincreased levels of brain natriuretic peptide (BNP), pro-BNP andtroponin in patients with non-massive PE with a view to identifyingthis subgroup more accurately.
Methods
Search strategyWe searched for eligible studies published between January 1985and October 2007 using two strategies. In Medline, we used the fol-lowing strategy based on a Pubmed sensitive query to identify
* Corresponding author. Tel: þ33 1 56 09 34 61, Fax: þ33 1 56 09 32 55, Email: [email protected]
Published on behalf of the European Society of Cardiology. All rights reserved. & The Author 2008. For permissions please email: [email protected].
European Heart Journal (2008) 29, 1569–1577doi:10.1093/eurheartj/ehn208
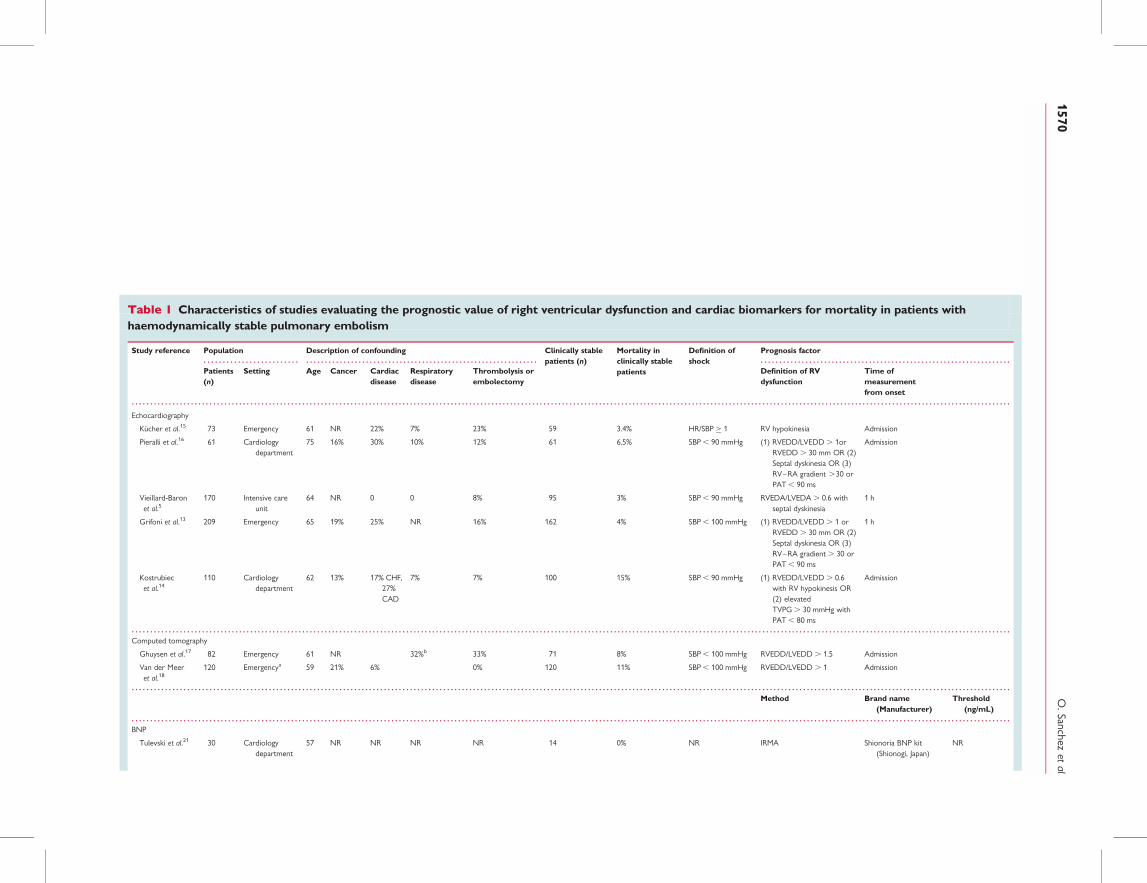
. . . . . . . . . . . . . . . . . . . . . . . . . . . . . . . . . . . . . . . . . . . . . . . . . . . . . . . . . . . . . . . . . . . . . . . . . . . . . . . . . . . . . . . . . . . . . . . . . . . . . . . . . . . . . . . . . . . . . . . . . . . . . . . . . . . . . . . . . . . . . . . . . . . . . . . . . .
. . . . . . . . . . . . . . . . . . . . . . . . . . . . . . . . . . . . . . . . . . . . . . . . . . . . . . . . . . . . . . . . . . . . . . . . . . . . . . . . . . . . . . . . . . . . . . . . . . . . . . . . . . . . . . . . . . . . . . . . . . . . . . . . . . . . . . . . . . . . . . . . . . . . . . . . . . . . . . . . . . . . . . . . . . . . . . . . . . . . . . . . . . . . . . . . . . . . . . . . . . . . . . . . . . . . . . . . . . . . . . . . . . . . . . . . . . . . .
. . . . . . . . . . . . . . . . . . . . . . . . . . . . . . . . . . . . . . . . . . . . . . . . . . . . . . . . . . . . . . . . . . . . . . . . . . . . . . . . . . . . . . . . . . . . . . . . . . . . . . . . . . . . . . . . . . . . . . . . . . . . . . . . . . . . . . . . . . . . . . . . . . . . . . . . . . . . . . . . . . . . . . . . . . . . . . . . . . . . . . . . . . . . . . . . . . . . . . . . . . . . . . . . . . . . . . . . . . . . . . . . . . . . . . . . . . . . .
. . . . . . . . . . . . . . . . . . . . . . . . . . . . . . . . . . . . . . . . . . . . . . . . . . . . . . . . . . . . . . . . . . . . . . . . . . . . . . . . . . . . . . . . . . . . . . . . . . . . . . . . . . . . . . . . . . . . . . . . . . . . . . . . . . . . . . . . . . . . . . . . . . . . . . . . . . . . . . . . . . . . . . . . . . . . . . . . . . . . . . . . . . . . . . . . . . . . . . . . . . . . . . . . . . . . . . . . . . . . . . . . . . . . . . . . . . . . .
. . . . . . . . . . . . . . . . . . . . . . . . . . . . . . . . . . . . . . . . . . . . . . . . . . . . . . . . . . . . . . . . . . . . . . . . . . . . . . . . . . . . . . . . . . . . . . . . . . . . . . . . . . . . . . . . . . . . . . . . . . . . . . . . . . . . . . . . . . . . . . . . . . . . . . . . . . . . . . . . . . . . . . . . . . . . . . . . . . . . . . . . . . . . . . . . . . . . . . . . . . . . . . . . . . . . . . . . . . . . . . . . . . . . . . . . . . . . .
Table 1 Characteristics of studies evaluating the prognostic value of right ventricular dysfunction and cardiac biomarkers for mortality in patients withhaemodynamically stable pulmonary embolism
Study reference Population Description of confounding Clinically stablepatients (n)
Mortality inclinically stablepatients
Definition ofshock
Prognosis factor
Patients(n)
Setting Age Cancer Cardiacdisease
Respiratorydisease
Thrombolysis orembolectomy
Definition of RVdysfunction
Time ofmeasurementfrom onset
Echocardiography
Kucher et al.15 73 Emergency 61 NR 22% 7% 23% 59 3.4% HR/SBP � 1 RV hypokinesia Admission
Pieralli et al.16 61 Cardiologydepartment
75 16% 30% 10% 12% 61 6.5% SBP , 90 mmHg (1) RVEDD/LVEDD . 1orRVEDD . 30 mm OR (2)Septal dyskinesia OR (3)RV–RA gradient .30 orPAT , 90 ms
Admission
Vieillard-Baronet al.5
170 Intensive careunit
64 NR 0 0 8% 95 3% SBP , 90 mmHg RVEDA/LVEDA . 0.6 withseptal dyskinesia
1 h
Grifoni et al.13 209 Emergency 65 19% 25% NR 16% 162 4% SBP , 100 mmHg (1) RVEDD/LVEDD . 1 orRVEDD . 30 mm OR (2)Septal dyskinesia OR (3)RV–RA gradient . 30 orPAT , 90 ms
1 h
Kostrubiecet al.14
110 Cardiologydepartment
62 13% 17% CHF,27%CAD
7% 7% 100 15% SBP , 90 mmHg (1) RVEDD/LVEDD . 0.6with RV hypokinesis OR(2) elevatedTVPG . 30 mmHg withPAT , 80 ms
Admission
Computed tomography
Ghuysen et al.17 82 Emergency 61 NR 32%b 33% 71 8% SBP , 100 mmHg RVEDD/LVEDD . 1.5 Admission
Van der Meeret al.18
120 Emergencya 59 21% 6% 0% 120 11% SBP , 100 mmHg RVEDD/LVEDD . 1 Admission
Method Brand name(Manufacturer)
Threshold(ng/mL)
BNP
Tulevski et al.21 30 Cardiologydepartment
57 NR NR NR NR 14 0% NR IRMA Shionoria BNP kit(Shionogi, Japan)
NR
O.Sanchez
etal
1570
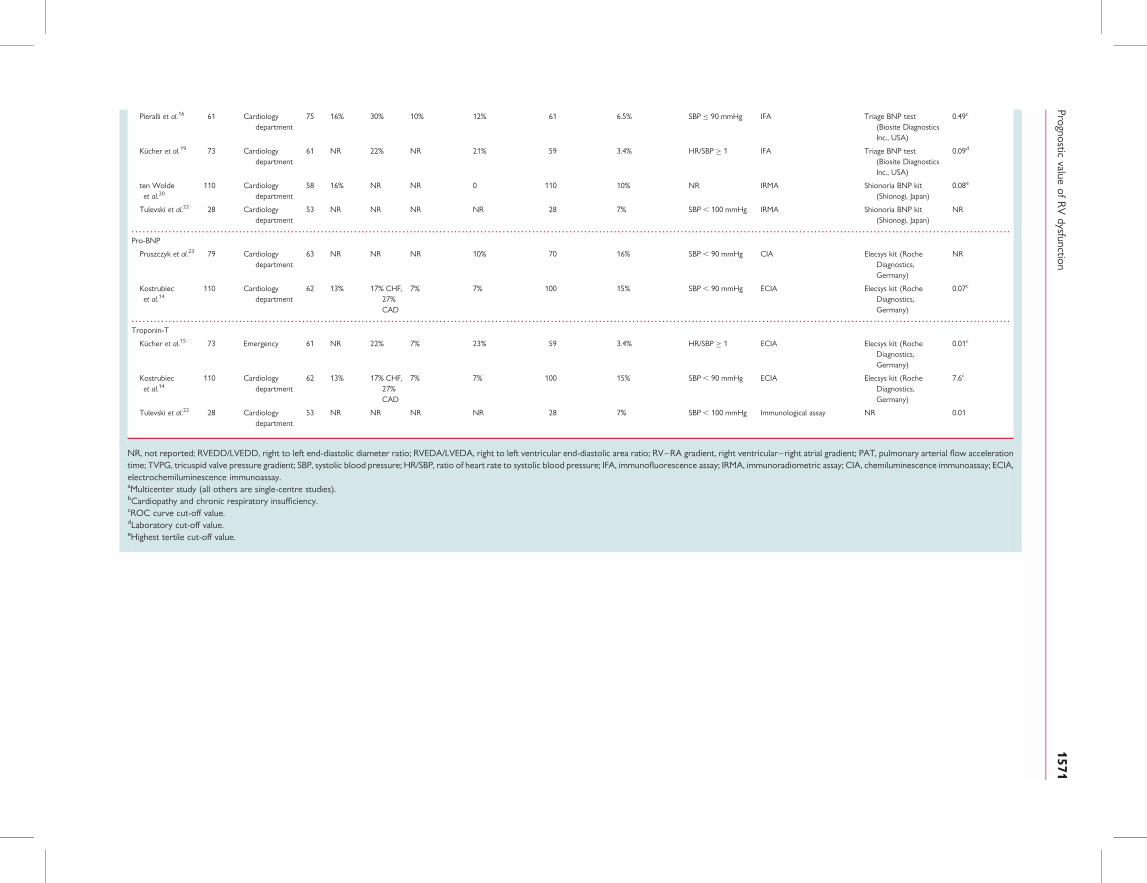
. . . . . . . . . . . . . . . . . . . . . . . . . . . . . . . . . . . . . . . . . . . . . . . . . . . . . . . . . . . . . . . . . . . . . . . . . . . . . . . . . . . . . . . . . . . . . . . . . . . . . . . . . . . . . . . . . . . . . . . . . . . . . . . . . . . . . . . . . . . . . . . . . . . . . . . . . . . . . . . . . . . . . . . . . . . . . . . . . . . . . . . . . . . . . . . . . . . . . . . . . . . . . . . . . . . . . . . . . . . . . . . . . . . . . . . . . . . . .
. . . . . . . . . . . . . . . . . . . . . . . . . . . . . . . . . . . . . . . . . . . . . . . . . . . . . . . . . . . . . . . . . . . . . . . . . . . . . . . . . . . . . . . . . . . . . . . . . . . . . . . . . . . . . . . . . . . . . . . . . . . . . . . . . . . . . . . . . . . . . . . . . . . . . . . . . . . . . . . . . . . . . . . . . . . . . . . . . . . . . . . . . . . . . . . . . . . . . . . . . . . . . . . . . . . . . . . . . . . . . . . . . . . . . . . . . . . . .
Pieralli et al.16 61 Cardiologydepartment
75 16% 30% 10% 12% 61 6.5% SBP � 90 mmHg IFA Triage BNP test(Biosite DiagnosticsInc., USA)
0.49c
Kucher et al.19 73 Cardiologydepartment
61 NR 22% NR 21% 59 3.4% HR/SBP � 1 IFA Triage BNP test(Biosite DiagnosticsInc., USA)
0.09d
ten Woldeet al.20
110 Cardiologydepartment
58 16% NR NR 0 110 10% NR IRMA Shionoria BNP kit(Shionogi, Japan)
0.08e
Tulevski et al.22 28 Cardiologydepartment
53 NR NR NR NR 28 7% SBP , 100 mmHg IRMA Shionoria BNP kit(Shionogi, Japan)
NR
Pro-BNP
Pruszczyk et al.23 79 Cardiologydepartment
63 NR NR NR 10% 70 16% SBP , 90 mmHg CIA Elecsys kit (RocheDiagnostics,Germany)
NR
Kostrubiecet al.14
110 Cardiologydepartment
62 13% 17% CHF,27%CAD
7% 7% 100 15% SBP , 90 mmHg ECIA Elecsys kit (RocheDiagnostics,Germany)
0.07c
Troponin-T
Kucher et al.15 73 Emergency 61 NR 22% 7% 23% 59 3.4% HR/SBP � 1 ECIA Elecsys kit (RocheDiagnostics,Germany)
0.01c
Kostrubiecet al.14
110 Cardiologydepartment
62 13% 17% CHF,27%CAD
7% 7% 100 15% SBP , 90 mmHg ECIA Elecsys kit (RocheDiagnostics,Germany)
7.6c
Tulevski et al.22 28 Cardiologydepartment
53 NR NR NR NR 28 7% SBP , 100 mmHg Immunological assay NR 0.01
NR, not reported; RVEDD/LVEDD, right to left end-diastolic diameter ratio; RVEDA/LVEDA, right to left ventricular end-diastolic area ratio; RV–RA gradient, right ventricular–right atrial gradient; PAT, pulmonary arterial flow accelerationtime; TVPG, tricuspid valve pressure gradient; SBP, systolic blood pressure; HR/SBP, ratio of heart rate to systolic blood pressure; IFA, immunofluorescence assay; IRMA, immunoradiometric assay; CIA, chemiluminescence immunoassay; ECIA,electrochemiluminescence immunoassay.aMulticenter study (all others are single-centre studies).bCardiopathy and chronic respiratory insufficiency.cROC curve cut-off value.dLaboratory cut-off value.eHighest tertile cut-off value.
Prognosticvalue
ofR
Vdysfunction
1571
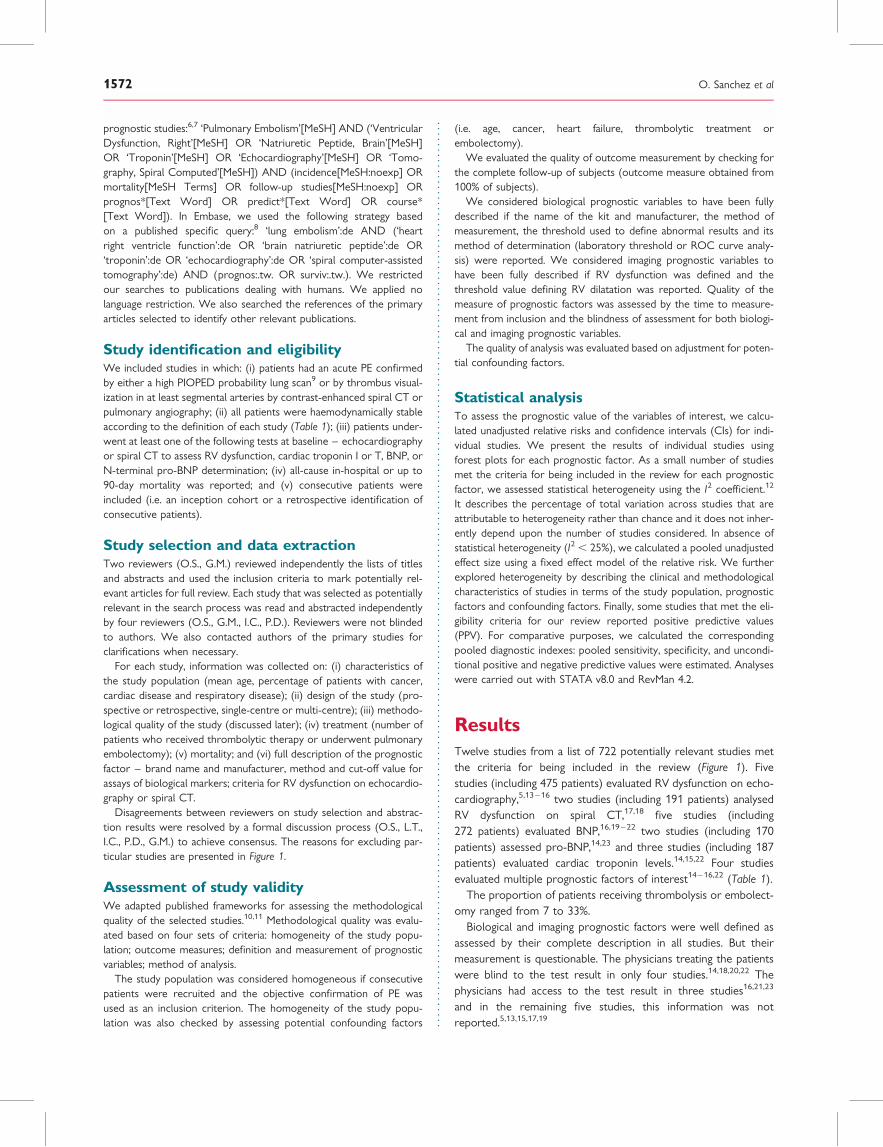
prognostic studies:6,7 ‘Pulmonary Embolism’[MeSH] AND (‘VentricularDysfunction, Right’[MeSH] OR ‘Natriuretic Peptide, Brain’[MeSH]OR ‘Troponin’[MeSH] OR ‘Echocardiography’[MeSH] OR ‘Tomo-graphy, Spiral Computed’[MeSH]) AND (incidence[MeSH:noexp] ORmortality[MeSH Terms] OR follow-up studies[MeSH:noexp] ORprognos*[Text Word] OR predict*[Text Word] OR course*[Text Word]). In Embase, we used the following strategy basedon a published specific query:8 ‘lung embolism’:de AND (‘heartright ventricle function’:de OR ‘brain natriuretic peptide’:de OR‘troponin’:de OR ‘echocardiography’:de OR ‘spiral computer-assistedtomography’:de) AND (prognos:.tw. OR surviv:.tw.). We restrictedour searches to publications dealing with humans. We applied nolanguage restriction. We also searched the references of the primaryarticles selected to identify other relevant publications.
Study identification and eligibilityWe included studies in which: (i) patients had an acute PE confirmedby either a high PIOPED probability lung scan9 or by thrombus visual-ization in at least segmental arteries by contrast-enhanced spiral CT orpulmonary angiography; (ii) all patients were haemodynamically stableaccording to the definition of each study (Table 1); (iii) patients under-went at least one of the following tests at baseline – echocardiographyor spiral CT to assess RV dysfunction, cardiac troponin I or T, BNP, orN-terminal pro-BNP determination; (iv) all-cause in-hospital or up to90-day mortality was reported; and (v) consecutive patients wereincluded (i.e. an inception cohort or a retrospective identification ofconsecutive patients).
Study selection and data extractionTwo reviewers (O.S., G.M.) reviewed independently the lists of titlesand abstracts and used the inclusion criteria to mark potentially rel-evant articles for full review. Each study that was selected as potentiallyrelevant in the search process was read and abstracted independentlyby four reviewers (O.S., G.M., I.C., P.D.). Reviewers were not blindedto authors. We also contacted authors of the primary studies forclarifications when necessary.
For each study, information was collected on: (i) characteristics ofthe study population (mean age, percentage of patients with cancer,cardiac disease and respiratory disease); (ii) design of the study (pro-spective or retrospective, single-centre or multi-centre); (iii) methodo-logical quality of the study (discussed later); (iv) treatment (number ofpatients who received thrombolytic therapy or underwent pulmonaryembolectomy); (v) mortality; and (vi) full description of the prognosticfactor – brand name and manufacturer, method and cut-off value forassays of biological markers; criteria for RV dysfunction on echocardio-graphy or spiral CT.
Disagreements between reviewers on study selection and abstrac-tion results were resolved by a formal discussion process (O.S., L.T.,I.C., P.D., G.M.) to achieve consensus. The reasons for excluding par-ticular studies are presented in Figure 1.
Assessment of study validityWe adapted published frameworks for assessing the methodologicalquality of the selected studies.10,11 Methodological quality was evalu-ated based on four sets of criteria: homogeneity of the study popu-lation; outcome measures; definition and measurement of prognosticvariables; method of analysis.
The study population was considered homogeneous if consecutivepatients were recruited and the objective confirmation of PE wasused as an inclusion criterion. The homogeneity of the study popu-lation was also checked by assessing potential confounding factors
(i.e. age, cancer, heart failure, thrombolytic treatment orembolectomy).
We evaluated the quality of outcome measurement by checking forthe complete follow-up of subjects (outcome measure obtained from100% of subjects).
We considered biological prognostic variables to have been fullydescribed if the name of the kit and manufacturer, the method ofmeasurement, the threshold used to define abnormal results and itsmethod of determination (laboratory threshold or ROC curve analy-sis) were reported. We considered imaging prognostic variables tohave been fully described if RV dysfunction was defined and thethreshold value defining RV dilatation was reported. Quality of themeasure of prognostic factors was assessed by the time to measure-ment from inclusion and the blindness of assessment for both biologi-cal and imaging prognostic variables.
The quality of analysis was evaluated based on adjustment for poten-tial confounding factors.
Statistical analysisTo assess the prognostic value of the variables of interest, we calcu-lated unadjusted relative risks and confidence intervals (CIs) for indi-vidual studies. We present the results of individual studies usingforest plots for each prognostic factor. As a small number of studiesmet the criteria for being included in the review for each prognosticfactor, we assessed statistical heterogeneity using the I2 coefficient.12
It describes the percentage of total variation across studies that areattributable to heterogeneity rather than chance and it does not inher-ently depend upon the number of studies considered. In absence ofstatistical heterogeneity (I2 , 25%), we calculated a pooled unadjustedeffect size using a fixed effect model of the relative risk. We furtherexplored heterogeneity by describing the clinical and methodologicalcharacteristics of studies in terms of the study population, prognosticfactors and confounding factors. Finally, some studies that met the eli-gibility criteria for our review reported positive predictive values(PPV). For comparative purposes, we calculated the correspondingpooled diagnostic indexes: pooled sensitivity, specificity, and uncondi-tional positive and negative predictive values were estimated. Analyseswere carried out with STATA v8.0 and RevMan 4.2.
ResultsTwelve studies from a list of 722 potentially relevant studies metthe criteria for being included in the review (Figure 1). Fivestudies (including 475 patients) evaluated RV dysfunction on echo-cardiography,5,13– 16 two studies (including 191 patients) analysedRV dysfunction on spiral CT,17,18 five studies (including272 patients) evaluated BNP,16,19 –22 two studies (including 170patients) assessed pro-BNP,14,23 and three studies (including 187patients) evaluated cardiac troponin levels.14,15,22 Four studiesevaluated multiple prognostic factors of interest14– 16,22 (Table 1).
The proportion of patients receiving thrombolysis or embolect-omy ranged from 7 to 33%.
Biological and imaging prognostic factors were well defined asassessed by their complete description in all studies. But theirmeasurement is questionable. The physicians treating the patientswere blind to the test result in only four studies.14,18,20,22 Thephysicians had access to the test result in three studies16,21,23
and in the remaining five studies, this information was notreported.5,13,15,17,19
O. Sanchez et al1572
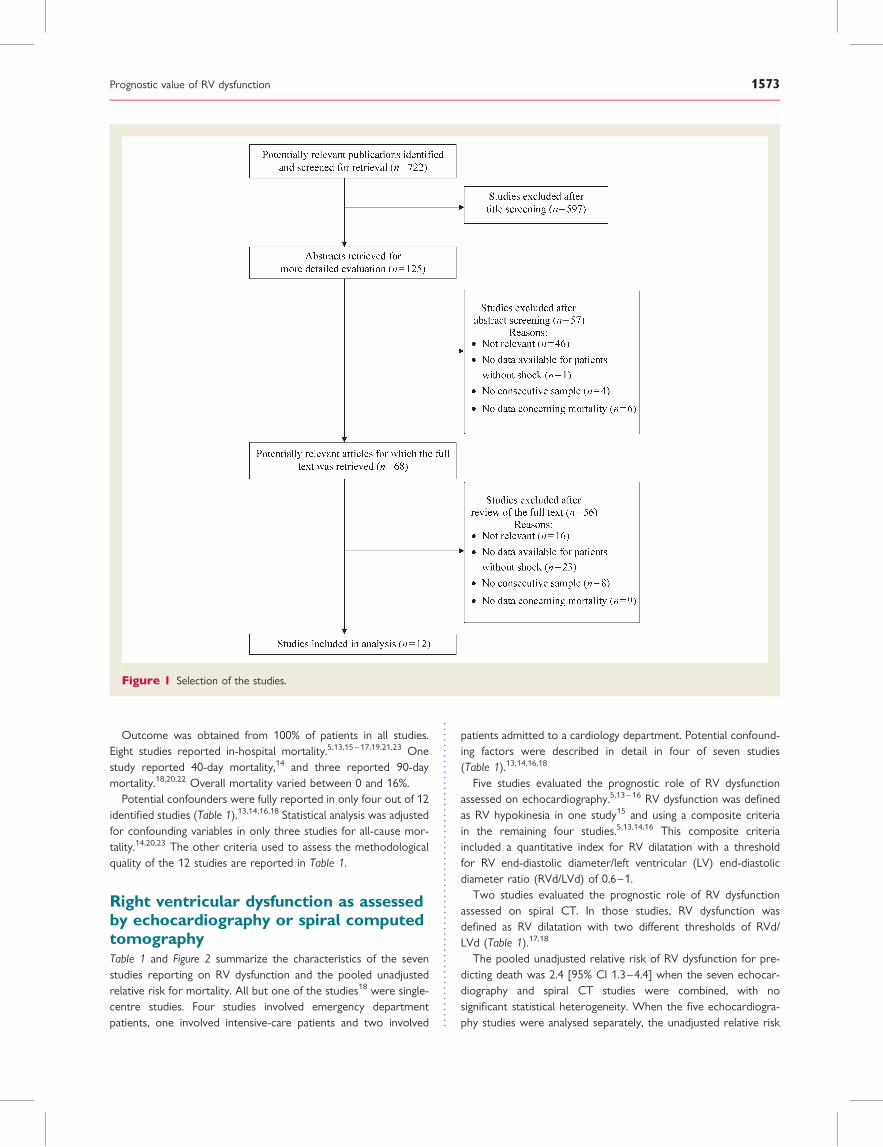
Outcome was obtained from 100% of patients in all studies.Eight studies reported in-hospital mortality.5,13,15 – 17,19,21,23 Onestudy reported 40-day mortality,14 and three reported 90-daymortality.18,20,22 Overall mortality varied between 0 and 16%.
Potential confounders were fully reported in only four out of 12identified studies (Table 1).13,14,16,18 Statistical analysis was adjustedfor confounding variables in only three studies for all-cause mor-tality.14,20,23 The other criteria used to assess the methodologicalquality of the 12 studies are reported in Table 1.
Right ventricular dysfunction as assessedby echocardiography or spiral computedtomographyTable 1 and Figure 2 summarize the characteristics of the sevenstudies reporting on RV dysfunction and the pooled unadjustedrelative risk for mortality. All but one of the studies18 were single-centre studies. Four studies involved emergency departmentpatients, one involved intensive-care patients and two involved
patients admitted to a cardiology department. Potential confound-ing factors were described in detail in four of seven studies(Table 1).13,14,16,18
Five studies evaluated the prognostic role of RV dysfunctionassessed on echocardiography.5,13– 16 RV dysfunction was definedas RV hypokinesia in one study15 and using a composite criteriain the remaining four studies.5,13,14,16 This composite criteriaincluded a quantitative index for RV dilatation with a thresholdfor RV end-diastolic diameter/left ventricular (LV) end-diastolicdiameter ratio (RVd/LVd) of 0.6–1.
Two studies evaluated the prognostic role of RV dysfunctionassessed on spiral CT. In those studies, RV dysfunction wasdefined as RV dilatation with two different thresholds of RVd/LVd (Table 1).17,18
The pooled unadjusted relative risk of RV dysfunction for pre-dicting death was 2.4 [95% CI 1.3–4.4] when the seven echocar-diography and spiral CT studies were combined, with nosignificant statistical heterogeneity. When the five echocardiogra-phy studies were analysed separately, the unadjusted relative risk
Figure 1 Selection of the studies.
Prognostic value of RV dysfunction 1573
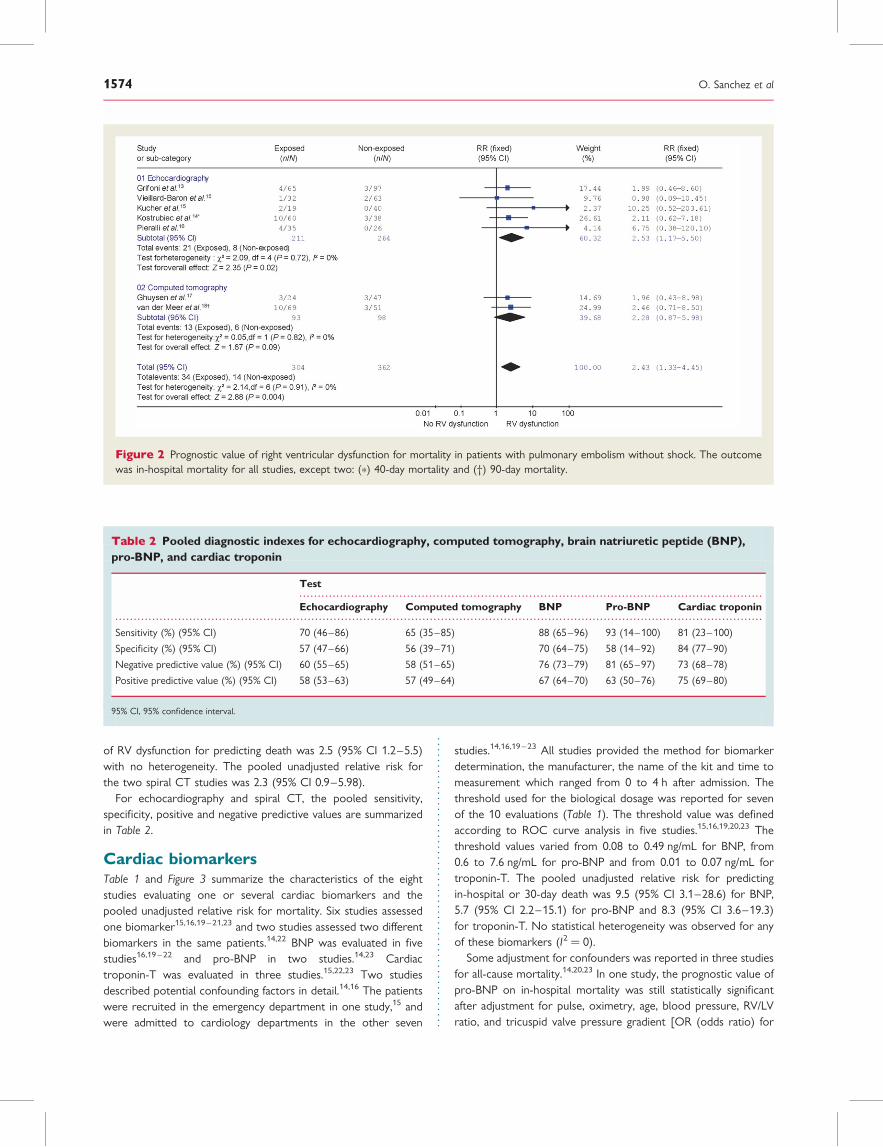
of RV dysfunction for predicting death was 2.5 (95% CI 1.2–5.5)with no heterogeneity. The pooled unadjusted relative risk forthe two spiral CT studies was 2.3 (95% CI 0.9–5.98).
For echocardiography and spiral CT, the pooled sensitivity,specificity, positive and negative predictive values are summarizedin Table 2.
Cardiac biomarkersTable 1 and Figure 3 summarize the characteristics of the eightstudies evaluating one or several cardiac biomarkers and thepooled unadjusted relative risk for mortality. Six studies assessedone biomarker15,16,19– 21,23 and two studies assessed two differentbiomarkers in the same patients.14,22 BNP was evaluated in fivestudies16,19 – 22 and pro-BNP in two studies.14,23 Cardiactroponin-T was evaluated in three studies.15,22,23 Two studiesdescribed potential confounding factors in detail.14,16 The patientswere recruited in the emergency department in one study,15 andwere admitted to cardiology departments in the other seven
studies.14,16,19– 23 All studies provided the method for biomarkerdetermination, the manufacturer, the name of the kit and time tomeasurement which ranged from 0 to 4 h after admission. Thethreshold used for the biological dosage was reported for sevenof the 10 evaluations (Table 1). The threshold value was definedaccording to ROC curve analysis in five studies.15,16,19,20,23 Thethreshold values varied from 0.08 to 0.49 ng/mL for BNP, from0.6 to 7.6 ng/mL for pro-BNP and from 0.01 to 0.07 ng/mL fortroponin-T. The pooled unadjusted relative risk for predictingin-hospital or 30-day death was 9.5 (95% CI 3.1–28.6) for BNP,5.7 (95% CI 2.2–15.1) for pro-BNP and 8.3 (95% CI 3.6–19.3)for troponin-T. No statistical heterogeneity was observed for anyof these biomarkers (I2 ¼ 0).
Some adjustment for confounders was reported in three studiesfor all-cause mortality.14,20,23 In one study, the prognostic value ofpro-BNP on in-hospital mortality was still statistically significantafter adjustment for pulse, oximetry, age, blood pressure, RV/LVratio, and tricuspid valve pressure gradient [OR (odds ratio) for
Figure 2 Prognostic value of right ventricular dysfunction for mortality in patients with pulmonary embolism without shock. The outcomewas in-hospital mortality for all studies, except two: (*) 40-day mortality and (†) 90-day mortality.
. . . . . . . . . . . . . . . . . . . . . . . . . . . . . . . . . . . . . . . . . . . . . . . . . . . . . . . . . . . . . . . . . . . . . . . . . . . . . . . . . . . . . . . . . . . . . . . . . . . . . . . . . . . . . . . . . . . . . . . . . . . . .
. . . . . . . . . . . . . . . . . . . . . . . . . . . . . . . . . . . . . . . . . . . . . . . . . . . . . . . . . . . . . . . . . . . . . . . . . . . . . . . . . . . . . . . . . . . . . . . . . . . . . . . . . . . . . . . . . . . . . . . . . . . . . . . . . . . . . . . . . . . . . . . . . . . . . . . . . . . . . . . . . . . . . . . . . . . . . . .
Table 2 Pooled diagnostic indexes for echocardiography, computed tomography, brain natriuretic peptide (BNP),pro-BNP, and cardiac troponin
Test
Echocardiography Computed tomography BNP Pro-BNP Cardiac troponin
Sensitivity (%) (95% CI) 70 (46–86) 65 (35–85) 88 (65–96) 93 (14–100) 81 (23–100)
Specificity (%) (95% CI) 57 (47–66) 56 (39–71) 70 (64–75) 58 (14–92) 84 (77–90)
Negative predictive value (%) (95% CI) 60 (55–65) 58 (51–65) 76 (73–79) 81 (65–97) 73 (68–78)
Positive predictive value (%) (95% CI) 58 (53–63) 57 (49–64) 67 (64–70) 63 (50–76) 75 (69–80)
95% CI, 95% confidence interval.
O. Sanchez et al1574
log NT-pro-BNP 1.9, 95% CI 1.1–3.2].23 In another study, theassociation between a BNP level .21.7 pmol/L and 90-daymortality was still statistically significant after adjustment for ageand cancer (OR 9.4, 95% CI 1.8–49.2).20 Finally another studyreported a significant increase in 40-day mortality risk whencardiac troponin was .0.07 mg/L after adjustment for age [HR(heart rate) 6.5, 95% CI 3.3–18.9].14
For BNP, pro-BNP, and cardiac troponin, the pooled sensitivity,specificity, positive and negative predictive values are summarizedin Table 2.
DiscussionThis systematic review suggests that RV dysfunction as assessed byechocardiography and spiral CT, or by increased levels of BNP,pro-BNP or troponin-T is associated with a higher risk of mortalityin clinically stable patients with PE. However, studies that met theeligibility criteria showed clinical and methodological diversitybecause of various criteria and thresholds used to define RV dys-function. Although all risk ratios associated with cardiac bio-markers were higher than those associated with cardiac imaging,one must not conclude that elevated biomarkers are associatedwith higher mortality risk than RV dysfunction on echocardiogra-phy. Moreover, all these markers do not measure RV dysfunctionin the same way: while CT provides information on RV dilatationonly, echocardiography also gives some information on contracti-lity, i.e. septal or RV hypo- or dyskinesia; cardiac troponin is amarker of myocardial injury. BNP or pro-BNP are two specificmarkers of wall ventricular stress but there are other reasons
for increased BNP or pro-BNP levels such as neurohumouralstimulation, inflammation, cytokines or ischaemia.
Besides, those elevated risk ratios should be interpreted cau-tiously, having regard to the low PPV. The large 95% CI of eachvalue of PPV underlines the degree of uncertainty of theseresults even when all potentially eligible studies are included inthe analysis.
The in-hospital mortality of patients with so-called massive PE,defined on the basis of systemic hypotension or cardiogenicshock ranges from 25 to .50%1,2,5 and most experts recommendthe use of aggressive treatments, including thrombolytic treatment,in these patients.3,24 BNP and troponin levels are usually high inthese patients, but are not particularly useful in this contextbecause the presence of cardiogenic shock per se is a major riskfactor for death in patients with PE. Recently, Becattini et al.25 per-formed a meta-analysis of studies in patients with acute PE toassess the prognostic value of elevated cardiac troponins for short-term death. The unadjusted OR associated with elevated troponinlevels was 5.2 (95% CI 3.3–8.4).25 However, the study eligibilitycriteria were less stringent. In particular, studies assessing troponinin patients with haemodynamic instability were eligible in thatanalysis. We focused our analysis on clinically stable patientsbecause a risk stratification tool that accurately predicts the prog-nosis of these patients may be useful for clinicians. The in-hospitalmortality of patients with PE and normal blood pressure has beenreported to vary from 3 to 15%.3,4 Patients estimated to be at lowrisk could be discharged early or managed entirely at homewhereas high-risk patients may benefit from a more carefulin-hospital follow-up. However, the use of these markers for
Figure 3 Prognostic value of cardiac biomarkers for mortality in patients with pulmonary embolism without shock. The outcome wasin-hospital mortality for all studies, except two: (*) 40-day mortality and (†) 90-day mortality.
Prognostic value of RV dysfunction 1575
guiding initial treatment, i.e. thrombolytic treatment, seemspremature because of several limitations.
Combination of imaging modalities with cardiac biomarkers mayfurther optimize risk stratification. In our review, only three studiesevaluated the prognostic value of RV dysfunction and cardiac bio-markers in the same population.14–16 We could extract the 2 � 2table crossing echocardiography and BNP results in one study16
and those crossing echocardiography and pro-BNP or cardiac tro-ponin results in another study.14 In the first study, the unadjustedrisk ratio for combination of a positive echocardiography andelevated BNP value was 18.0, 95% CI 1.0–318.9 vs. 6.8, 95% CI0.4–120.1 for echocardiography alone.16 In the second study, theunadjusted risk ratio for combination of a positive echocardiographyand elevated pro-BNP value was 2.7, 95% CI 0.9–8.6; that of com-bination of both positive echocardiography and cardiac troponin was1.7, 95% CI 0.6–4.5 vs. 2.1, 95% CI 0.6–7.2 for echocardiographyalone.14 Because of the small number of patients included, wecannot draw any definitive conclusion concerning the incrementalvalue of cardiac biomarkers in patients with positive imaging.
LimitationsWe encountered several methodological limitations, some ofwhich are inherent to any systematic review of prognosis studies,whereas others were related to the fact that few studies werespecifically designed to answer our research question.
First, we cannot entirely exclude the possibility of a publicationbias. We attempted to minimize it by reviewing abstracts of majorscientific meetings. Tests for asymmetry of the funnel plots werenot significant but are not useful because of the small number ofstudies. It is possible that our findings are partly affected by publi-cation bias, and that the prognostic value of biomarkers and RVdysfunction might be lower than reported in this review sincefailure to publish studies with negative or null findings contributesto publication bias. Secondly, we could only include a small numberof studies because most studies assessing prognostic factors for PEincluded both stable and unstable patients and the results wererarely reported separately for these two groups of patients.Thirdly, we were faced with clinical and methodological diversityin the studies in terms of study populations, prognostic variables,confounding variables, and outcome definition. The study settingwas either emergency department or a specialty department.Unclear reporting made it difficult to determine whether consecu-tive patients had been recruited in several studies. Differences inthe definition of cardiogenic shock used in eligible studies mayhave resulted in additional diversity in the study population asreflected by the wide range of in-hospital mortality across studies.
The methods used for the measurement and interpretation ofprognosis factors differed considerably between studies. Differenttechniques and thresholds were used in studies evaluating cardiacbiomarkers. In all studies, continuous data were handled by cat-egorization; the choice of threshold was data-dependent in fourstudies.14–16,19 We were not able to perform analysis using thebiomarkers on their original continuous scale nor using acommon threshold value for all studies. This is a limitation tothe study since categorizing continuous variables discards import-ant quantitative information and makes the results difficult tocompare between studies. Moreover, different definitions were
also used for echocardiography and spiral CT in studies evaluatingRV dysfunction. Heterogeneous reporting of confounding factorswas also noted, and the possible effect of such factors was not ana-lysed in all studies. Even when these factors were summarized forthe study population, no universally acknowledged method can beused to take them into account when pooling results.
We chose to study mortality as the primary outcome summar-izing studies. Unlike composite clinical outcomes, in-hospital mor-tality is an objective unbiased outcome (i.e. low censored bias) andpertinent for evaluations of the prognosis of PE. We chose toinclude four studies reporting 40-day and 90-day mortality,14,18,20
assuming that the death rate following PE peaks within 30 days.This was confirmed by the consistency in death rates and individualrelative risks between each of these four studies and other studiesevaluating the same prognostic factor.
Surprisingly, whatever the prognosis factor considered, wefound no statistical heterogeneity. This may be because we wereunable to pool relative risks adjusted for confounding factors.Further statistical exploration of heterogeneity was not possiblebecause of the small number of studies and the non-availabilityof data for individual patients.
ConclusionThis systematic review suggests that elevated cardiac biomarkersand RV dysfunction, demonstrated by echocardiography or spiralCT, are associated with increased risk of mortality in patientswith non-massive PE. These findings should be interpreted withcaution because of the clinical and methodological diversity ofstudies. Well-designed prospective studies, with pre-specified defi-nitions of RV dysfunction assessed by echocardiography and spiralCT as well as plasma-levels of cardiac biomarkers, are required totackle this research question specifically. Limitations of availablestudies preclude the use of these markers for selecting the appro-priate candidates to thrombolytic therapy among clinically stablepatients with PE.
AcknowledgementsWe thank Sophie Guiquerro, medical librarian, for help in designingthe literature searches.
Conflict of interest: none declared.
References1. Goldhaber SZ, Visani L, De Rosa M. Acute pulmonary embolism:
clinical outcomes in the International Cooperative PulmonaryEmbolism Registry (ICOPER). Lancet 1999;353:1386–1389.
2. Kasper W, Konstantinides S, Geibel A, Olschewski M, Heinrich F,Grosser KD, Rauber K, Iversen S, Redecker M, Kienast J. Manage-ment strategies and determinants of outcome in acute major pul-monary embolism: results of a multicenter registry. J Am CollCardiol 1997;30:1165–1171.
3. Guidelines on diagnosis and management of acute pulmonaryembolism. Task Force on Pulmonary Embolism, EuropeanSociety of Cardiology. Eur Heart J 2000;21:1301–1336.
4. Hamel E, Pacouret G, Vincentelli D, Forissier JF, Peycher P,Pottier JM, Charbonnier B. Thrombolysis or heparin therapy inmassive pulmonary embolism with right ventricular dilation:
O. Sanchez et al1576
results from a 128-patient monocenter registry. Chest 2001;120:120–125.
5. Vieillard-Baron A, Page B, Augarde R, Prin S, Qanadli S, Beauchet A,Dubourg O, Jardin F. Acute cor pulmonale in massive pulmonaryembolism: incidence, echocardiographic pattern, clinical implicationsand recovery rate. Intensive Care Med 2001;27:1481–1486.
6. McKibbon K, Eady A, Marks S. Evidence Based Principles and Practice.Hamilton, Canada: BC Dekker; 1999.
7. Wilczynski NL, Haynes RB. Developing optimal search strategiesfor detecting clinically sound prognostic studies in MEDLINE: ananalytic survey. BMC Med 2004;2:23.
8. Wilczynski NL, Haynes RB. Optimal search strategies for detectingclinically sound prognostic studies in EMBASE: an analytic survey.J Am Med Inform Assoc 2005;12:481–485.
9. Value of the ventilation/perfusion scan in acute pulmonary embo-lism. Results of the prospective investigation of pulmonary embo-lism diagnosis (PIOPED). The PIOPED Investigators. JAMA 1990;263:2753–2759.
10. Altman DG. Systematic reviews of evaluations of prognostic vari-ables. BMJ 2001;323:224–228.
11. Hayden JA, Cote P, Bombardier C. Evaluation of the quality ofprognosis studies in systematic reviews. Ann Intern Med 2006;144:427–437.
12. Higgins JP, Thompson SG. Quantifying heterogeneity in ameta-analysis. Stat Med 2002;21:1539–1558.
13. Grifoni S, Olivotto I, Cecchini P, Pieralli F, Camaiti A, Santoro G,Conti A, Agnelli G, Berni G. Short-term clinical outcome ofpatients with acute pulmonary embolism, normal blood pressure,and echocardiographic right ventricular dysfunction. Circulation2000;101:2817–2822.
14. Kostrubiec M, Pruszczyk P, Bochowicz A, Pacho R, Szulc M,Kaczynska A, Styczynski G, Kuch-Wocial A, Abramczyk P,Bartoszewicz Z, Berent H, Kuczynska K. Biomarker-based riskassessment model in acute pulmonary embolism. Eur Heart J2005;26:2166–2172.
15. Kucher N, Printzen G, Doernhoefer T, Windecker S, Meier B,Hess OM. Low pro-brain natriuretic peptide levels predictbenign clinical outcome in acute pulmonary embolism. Circulation2003;107:1576–1578.
16. Pieralli F, Olivotto I, Vanni S, Conti A, Camaiti A, Targioni G,Grifoni S, Berni G. Usefulness of bedside testing for brain
natriuretic peptide to identify right ventricular dysfunction andoutcome in normotensive patients with acute pulmonary embo-lism. Am J Cardiol 2006;97:1386–1390.
17. Ghuysen A, Ghaye B, Willems V, Lambermont B, Gerard P,Dondelinger RF, D’Orio V. Computed tomographic pulmonaryangiography and prognostic significance in patients with acute pul-monary embolism. Thorax 2005;60:956–961.
18. van der Meer RW, Pattynama PM, van Strijen MJ, van denBerg-Huijsmans AA, Hartmann IJ, Putter H, de Roos A,Huisman MV. Right ventricular dysfunction and pulmonaryobstruction index at helical CT: prediction of clinical outcomeduring 3-month follow-up in patients with acute pulmonary embo-lism. Radiology 2005;235:798–803.
19. Kucher N, Printzen G, Goldhaber SZ. Prognostic role of brainnatriuretic peptide in acute pulmonary embolism. Circulation2003;107:2545–2547.
20. ten Wolde M, TulevskiII, Mulder JW, Sohne M, Boomsma F,Mulder BJ, Buller HR. Brain natriuretic peptide as a predictor ofadverse outcome in patients with pulmonary embolism. Circulation2003;107:2082–2084.
21. TulevskiII, Hirsch A, Sanson BJ, Romkes H, van der Wall EE, vanVeldhuisen DJ, Buller HR, Mulder BJ. Increased brain natriureticpeptide as a marker for right ventricular dysfunction in acute pul-monary embolism. Thromb Haemost 2001;86:1193–1196.
22. TulevskiII, ten Wolde M, van Veldhuisen DJ, Mulder JW, van derWall EE, Buller HR, Mulder BJ. Combined utility of brain natriureticpeptide and cardiac troponin T may improve rapid triage and riskstratification in normotensive patients with pulmonary embolism.Int J Cardiol 2007;116:161–166.
23. Pruszczyk P, Kostrubiec M, Bochowicz A, Styczynski G, Szulc M,Kurzyna M, Fijalkowska A, Kuch-Wocial A, Chlewicka I,Torbicki A. N-terminal pro-brain natriuretic peptide in patientswith acute pulmonary embolism. Eur Respir J 2003;22:649–653.
24. Buller HR, Agnelli G, Hull RD, Hyers TM, Prins MH, Raskob GE.Antithrombotic therapy for venous thromboembolic disease: theSeventh ACCP Conference on Antithrombotic and ThrombolyticTherapy. Chest 2004;126:401S–428S.
25. Becattini C, Vedovati MC, Agnelli G. Prognostic value of troponinsin acute pulmonary embolism: a meta-analysis. Circulation 2007;116:427–433.
Prognostic value of RV dysfunction 1577
Blood Reviews (2005) 19, 179–202
www.elsevierhealth.com/journals/blre
REVIEW
The role of vena caval filters in the managementof venous thromboembolism
Christine L. Hanna,1, Michael B. Streiffb,*
a Division of Hematology, Department of Medicine and Department of Medical Oncology,Johns Hopkins Medical Institution, Bunting-Blaustein Cancer Research Building, 1650 Orleans Street,Room 346, Baltimore, MD 21231, USAb Division of Hematology, Department of Medicine, Johns Hopkins Medical Institution,Ross Research Building, Room 1025, 720 Rutland Avenue, Baltimore, MD 21205, USA
Summary Venous thromboembolism (VTE) is a significant cause of morbidity andmortality worldwide. Anticoagulation is the preferred treatment for VTE, however,in selected patient populations, the risk of bleeding from anticoagulation outweighsits benefit. For these patients, alternative methods of pulmonary embolism (PE)prevention are needed. In 1865, Armand Trousseau proposed the concept of venacaval interruption. This idea has evolved from surgical ligation of the inferior venacava (IVC) to the development of percutaneous IVC filters, and most recently,retrievable filters. With these advances in technology, there has been a dramaticincrease in the use of IVC filters. Despite the vast number of reports on the use ofIVC filters, there are limited data on their efficacy in many clinical circumstances.In this review, we will discuss the currently available IVC filters, data on their effi-cacy and safety and our assessment of appropriate indications for their use.
�c 2004 Elsevier Ltd. All rights reserved.
KEYWORDSInferior vena cavalfilter;Deep venousthrombosis;Venousthromboembolism;Pulmonary embolism;Anticoagulation
0d
6
j
Introduction
Venous thromboembolism (VTE) is a significantcause of morbidity and mortality, afflicting approx-imately 100 individuals per 100,000 populationeach year. The most common form of VTE is deep
268-960X/$ - see front matter �c 2004 Elsevier Ltd. All rights reseoi:10.1016/j.blre.2004.08.002
* Corresponding author. Tel.: +1 410 614 0727; fax: +1 41014 8601.
E-mail addresses: [email protected] (C.L. Hann), [email protected] (M.B. Streiff).
1 Tel.: +1 410 502 0926; fax: +1 410 502 0677.
venous thrombosis (DVT), which accounts for 2/3of episodes of VTE. The most life-threatening man-ifestation of VTE is PE.1 In the vast majority in-stances, VTE is effectively managed withconventional anticoagulation, which is associatedwith a low incidence of recurrent thromboticevents (0.6–1.5 events per 100 patient-years) andmajor bleeding during therapy (�0.9–4.6 eventsper 100 patient-years).2–4 Nevertheless, theincreasing medical complexity of patients in hospi-tal ensures that all clinicians occasionally will befaced with patients suffering with acute thrombosis
rved.
180 C.L. Hann, M.B. Streiff
for whom anticoagulation is absolutely contraindi-cated or complicated by life-threatening bleeding.In these instances, vena caval filters serve as a val-uable second line of defense against the mostfeared complication of VTE, fatal PE.
As with many areas of clinical medicine, venacaval interruption has witnessed substantial ad-vances in technology which have been accompa-nied by a dramatic expansion in use. One UnitedStates (US) single center retrospective reviewnoted a 5-fold increase in filter placement between1980 and 1996.5 In comparison, use of vena cavalfilters appears to be much lower in other developedcountries with health care systems of comparablequality.6 Much of the expanded use of filters canbe attributed to a dramatic broadening of the indi-cations for filter placement, despite the lack ofrandomized controlled data demonstrating theirutility in these clinical settings.
Since the development of stainless steel Green-field filter in 1973, over 500 English language clin-ical studies of vena caval filters have beenpublished. The vast number of papers makes clin-ical decision-making regarding vena caval filteruse challenging. In order to facilitate decision-making for the busy clinician, we will review thefollowing topics in this paper: (1) The differentvena caval filters currently available. (2) The datasupporting the safety and efficacy of filters. (3)The complications of vena caval filters. (4) Theliterature on suprarenal and superior vena cava(SVC) filter placement. (5) The advantages anddisadvantages of temporary and retrievable fil-ters. (6) The use magnetic resonance imaging invena caval filter recipients. (7) The need forlong-term anticoagulation for filter patients. (8)Our assessment of appropriate indications forfilter placement.
Historical perspective on vena cavalinterruption
The intellectual foundation of vena caval filtrationas a means to prevent PE can be traced histori-cally to two of the 19th century’s greatest physi-cians, Rudolf Virchow and Armand Trousseau. In1846, Virchow proposed the concept that pulmo-nary thrombi were in fact primarily emboli thatoriginated in the veins of the lower extremities.7
Two decades later, in his lectures at the HotelDieu, Paris, Trousseau8 suggested that a physicalbarrier to the migration of emboli might be aneffective preventive measure. Homans popular-ized femoral vein ligation for prevention of PE in
the US in the 1930s.9 However, an obvious short-coming of this procedure was the persistent riskof emboli from the contralateral extremity. Ochs-ner and DeBakey10 and O’Niel11 remedied this sit-uation by moving the point of ligation upward tothe IVC. Despite its theoretical advantages, venacaval ligation was complicated by PE originatingabove the ligature as well as substantial morbidityand mortality due to the approximately 50%reduction in venous return that occurred immedi-ately following the ligation.12 In addition, the col-laterals that developed following IVC ligation notinfrequently provided an alternative route forPE.13,14
These outcomes stimulated efforts to developapproaches to filter venous return through theIVC. Surgical solutions included the harp string gridfilter and IVC plication using sutures or staples.15–17
Technological approaches included the placementof serrated or channeled clips to the external sur-face of the vena cava.18–20 The hope fueling manyof these strategies was that IVC filtration ratherthan occlusion would produce improved results.Unfortunately, these hopes were largely unreal-ized. Venous stasis (16%), PE (4%) and operativemortality (10%) remained commonplace such thatthese approaches represented little improvementover surgical ligation.17
In 1970, Mobin-Uddin introduced the first percu-taneous device for vena caval interruption, the Mo-bin-Uddin umbrella filter. This device consisted ofa Silastic membrane attached to six stainless steelspokes, which served to anchor the device in thevena cava. It could be placed by venotomy avoidingthe complications associated with open surgicalprocedures.21 Initial problems with migration, ca-val occlusion and PE prompted an increase in thefilter’s size to 28 mm and the use of a heparin-coated Silastic membrane.22 Despite thesechanges, problems with caval occlusion (57% ofrecipients), PE (up to 8%) and migration persistedsuch that the Mobin-Uddin filter was removed fromthe market in 1977 soon after the introduction ofthe Greenfield filter.17,23,24
The stainless steel Kimray-Greenfield filter(SSGF) revolutionized the field of vena cavalinterruption after its introduction in 1973. Manyof its design features can be seen in currentlyavailable devices. The filter consists of a coneconstructed of stainless steel wire affixed to acentral apical cap. To maximize the filtrationarea, each wire is fashioned with alternating rightand left hand bends. At the caudal terminus,each wire has an anchoring hook to fix the devicein the vena cava (Fig. 1). The funnel shape of thefilter is designed such that the cross-sectional
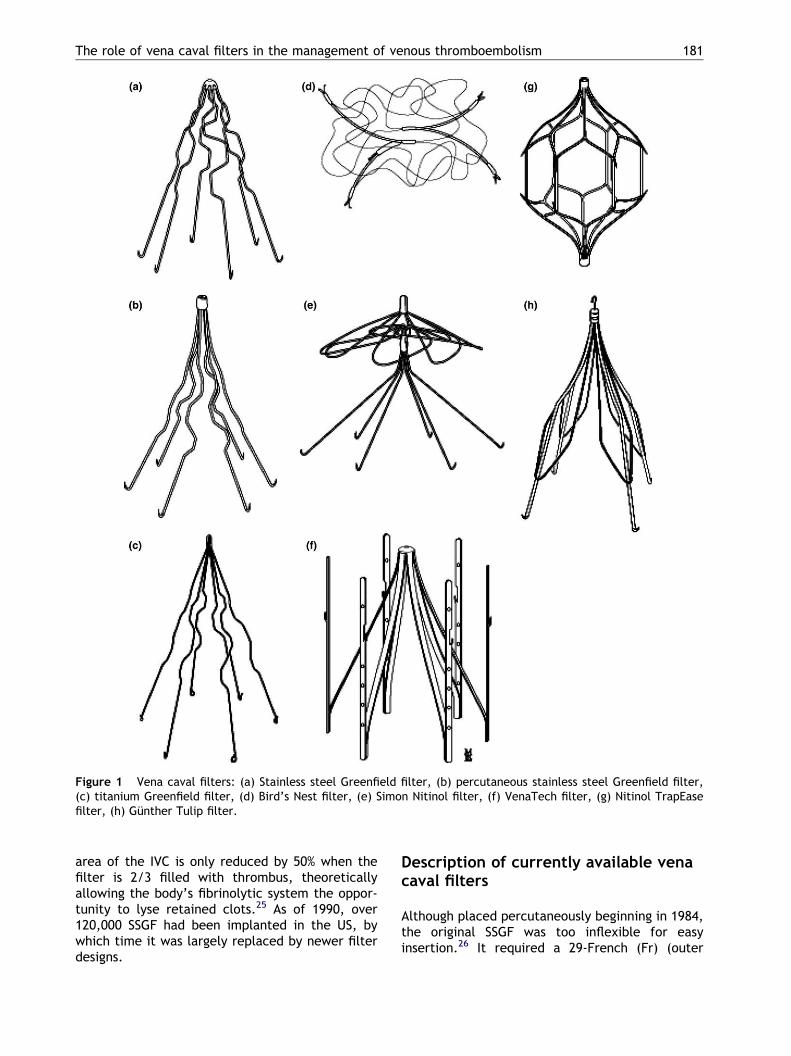
Figure 1 Vena caval filters: (a) Stainless steel Greenfield filter, (b) percutaneous stainless steel Greenfield filter,(c) titanium Greenfield filter, (d) Bird’s Nest filter, (e) Simon Nitinol filter, (f) VenaTech filter, (g) Nitinol TrapEasefilter, (h) Gunther Tulip filter.
The role of vena caval filters in the management of venous thromboembolism 181
area of the IVC is only reduced by 50% when thefilter is 2/3 filled with thrombus, theoreticallyallowing the body’s fibrinolytic system the oppor-tunity to lyse retained clots.25 As of 1990, over120,000 SSGF had been implanted in the US, bywhich time it was largely replaced by newer filterdesigns.
Description of currently available venacaval filters
Although placed percutaneously beginning in 1984,the original SSGF was too inflexible for easyinsertion.26 It required a 29-French (Fr) (outer
182 C.L. Hann, M.B. Streiff
diameter) introducer catheter which was felt to bepartly responsible for a high incidence of insertionsite DVT (45%) noted in some studies.27 Conse-quently, Greenfield and colleagues developed thetitanium Greenfield filter (TGF) (Boston Scien-tific/Meditech, Natick, MA, USA), which was intro-duced in 1988 and received US Food and DrugAdministration (FDA) approval in 1989. Its conicaldesign and the configuration of its six struts withterminal hooks were similar to the original SSGF(Fig. 1). The titanium alloy (Beta II titanium alloy)allowed for more flexibility such that the filtercould be introduced via a 12-Fr catheter (14.3 Frouter sheath diameter), which was hoped might re-duce the incidence of insertion site thrombosis(IST).28 In addition, since titanium is non-ferromag-netic, the filter should not be at risk for migrationduring magnetic resonance (MR) imaging andcauses minimal MR imaging artifact.29 Preliminaryclinical studies with the TGF revealed a high rateof distal slippage and penetration of the cavalwall,30 therefore, modifications of the hook designand base diameter were made resulting in the mod-ified-hook titanium Greenfield filter (MHTGF),which was introduced in 1991 (Fig. 1).31
Although migration and penetration were largelyimproved in the MHTGF, tilting remained an occa-sional problem. To remedy this situation, the stain-less steel percutaneous Greenfield filter (PGF)(Boston Scientific/Meditech, Natick, MA, USA) wasdeveloped. Similar to the SSGF in design, the PGF’sapical hub has a central hole, allowing placementover a guidewire to prevent filter tilting and asym-metry. Its design gives it increased flexibility allow-ing insertion via a small 12-Fr (15-Fr outerdiameter) catheter. The filter is comprised of sixstainless-steel struts, which are fitted into a cylin-drical hub. (Fig. 1) Once deployed the filter is 49mm in length and 32 mm in base diameter. ThePGF can be used in patients with IVC diameters of28 mm or less. To prevent migration, the anchorhooks are positioned bidirectionally with four di-rected superiorly and two directed inferiorly.32,33
Although the filter appears to be MR-safe, its stain-less steel composition causes significant imageartifact.33
The Bird’s Nest Filter (Guidant Corporation,Bloomington, IN, USA), introduced in 1982, has aunique structure comprised of four stainless steelwires 25 centimeter (cm) long which are foldedover several times and attached to two V-shapedstruts. These struts have hooks at the end, whichhelp affix the filter in the vena cava (Fig. 1).34 Itcan be inserted via a 14-Fr (outer diameter) cathe-ter. Since the Bird’s Nest filter expands up to adiameter of 60 mm, it is the filter of choice for
patients with vena caval diameters over 30 mm.35
The original version of the Bird’s Nest filter wasassociated with several fatal episodes of migration,a flaw that has been remedied with the introduc-tion of a new version with stiffer anchor struts.36,37
The Bird’s Nest Filter generates the largest MR arti-fact of any filter due to its stainless steel construc-tion but appears to be stable in magnetic fields upto 1.5 T.38
The LGM or VenaTech Filter (B. Braun/VenaTechEvanston, IL, USA) is made of Phynox (pacemakerlead material) with six struts arranged in a conicalfashion, similar to the Greenfield filter models.Side rails attached to the filter struts anchor the fil-ter in the vena cava (Fig. 1).39 The VenaTech Filterreceived FDA approval in 1989 and is MR-compati-ble.40 It is inserted using a 12-Fr sheath (outerdiameter 14-Fr) and can be placed in vena cavaeup to 28 mm in diameter.41
A modification of the original VenaTech Filter,the VenaTech Low-Profile (LP) Filter (B. Braun/VenaTech Evanston, IL, USA) was approved by theFDA in 2001. In contrast to its predecessor, theVenaTech LP filter utilizes eight Phynox wiresshaped in a conical fashion that fuse caudally inpairs to form side rails which secure the filter tothe vena cava wall. Each side rail has a hook, ori-ented either superiorly or inferiorly. (Fig. 1) Itcan be introduced by a 7-Fr (9-Fr outer diameter)sheath and once deployed is 43 mm in height and40 mm in diameter. It is limited to IVC diametersof 28 mm or less and is MR-compatible.42
The Simon Nitinol Filter (Bard, Covington, GA,USA) is composed of nickel and titanium (Nitinol),an alloy that possesses thermal memory properties.At 4 �C, the filter exists as a set of straight wiresthat automatically unfolds at body temperatureto form an umbrella filter of seven petals. Sixhooked struts anchor the filter in the vena cava.(Fig. 1) It received FDA approval in 1990 and is de-signed for IVC diameters of up to 28 mm.43–45
The TrapEase filter (Bard, Covington, GA, USA)is also composed of Nitinol and consists of twoconical filter baskets, one facing cranially, theother caudally that are connected together to cre-ate two levels of caval filtration. (Fig. 1) Whenviewed in cross-section, the filters form a filtra-tion plane composed of six diamond-shaped flowcorridors. Six struts with proximal and distal hooksanchor the baskets in the vena cava. The TrapEasefilter was approved for clinical use by the FDA in2000. It can be placed through a 6-Fr sheath inpatients with IVC diameters of up to 30 mm.The filter’s nickel titanium alloy ensures MRcompatibility and produces minimal imageartifact.46,47
The role of vena caval filters in the management of venous thromboembolism 183
The Gunther Tulip filter (Guidant Corporation,Bloomington, IN, USA) is constructed of Elgiloy,an MR-compatible alloy similar to Phynox that iscomposed of cobalt, chromium, nickel, iron,molybdenum and manganese. It has been in usein Europe since 1992, and was first available foruse in the US in 2001. In 2003, it received FDAapproval for use as a temporary filter. The filterbasket is formed by four struts stabilized by wireloops that extend 3/4 down the length of eachstrut. Hooks on the end of each strut attach thefilter to the vena caval wall. A hook on the filterapex facilitates retrieval (Fig. 1). It can be intro-duced using an 8.5-Fr sheath (11-Fr outer diame-ter) via the femoral or jugular route andremoved via a jugular approach.48–50 The GuntherTulip filter has also been used temporarily in theSVC for the treatment of an upper extremityDVT.51
Studies of IVC filter efficacy
The only purpose for placing an IVC filter is to pre-vent PE. Therefore, it is essential for every physi-cian to be familiar with the data supporting theeffectiveness of filters in this task as well as theiradverse effects. Unfortunately, the vast majorityof the data on vena caval filters is derived predom-inantly from unrandomized case series. Substantialdifferences exist between studies regarding thesubject populations (and their risk of recurrentVTE), as well as the intensity, comprehensivenessand duration of follow up. Therefore, the com-bined results of these studies presented in Table1 and Figs. 2–4 should be interpreted in light ofthese limitations. Nevertheless, in the absence ofrandomized comparisons of filters, these data arethe principal means available by which to assess fil-ter efficacy and safety. As shown in Table 1 and Fig.2, most of the available filters are roughly equiva-lent to one another but somewhat less effectivethan anticoagulation in the prevention of PE. Sev-eral recently released and/or less extensively stud-ied filter models (Gunther Tulip, Vena Tech LP,Nitinol TrapEase) appear to have lower PE eventrates. However, the small study populations, shortfollow up durations and wide 95% confidence inter-vals suggest that these estimates are fairly impre-cise and may rise with the study of additionalsubjects over longer periods of time.
While randomized comparisons of different filtermodels have not been performed, a single random-ized trial of vena caval filters in the management ofVTE has been published.52 Using a two by two fac-
torial design, Decousus and colleagues randomized400 patients with proximal DVT who were felt to beat high risk for PE to receive a vena caval filter orno filter and unfractionated heparin or enoxaparin.Four different types of permanent vena caval fil-ters were used: the VenaTech filter (56% of pa-tients randomized to the filter group), thetitanium Greenfield filter (26.5%), the Cardial filter(Bard, Saint-Etienne, France – not available in thiscountry) or the Bird’s Nest filter (15.5%). Two per-cent of patients randomized to receive a filter didnot have one placed. Baseline ventilation/per-fusion (V/Q) scans (or pulmonary angiography, ifV/Q scans were not available or abnormal) wereperformed within 48 h of enrollment and betweentreatment days 8 and 12 if no symptomatic PE oc-curred. All patients were treated with heparin for8–12 days. Warfarin was started on day 4 and hep-arin was continued until the international normal-ized ratio (INR) was 2 or more for twoconsecutive days. Ninety-nine percent of patientswere discharged on anticoagulation. Ninety-fourpercent received anticoagulation for at least 3months and 38% of patients were still on oral anti-coagulation at two years with no significant differ-ences between groups.
At day 12, filter recipients had significantly fewerPE than the no filter group (Filter group, 2 [1.1%]versus no filter group, 9 [4.8%], p = 0.03). However,when only symptomatic PE are considered, the dif-ference between the filter and no filter groups is nolonger significant (Filter, 2 (1.1%) versus no filter, 5(2.6%), p = 0.25). No differences in mortality orbleeding were evident between groups. At thetwo-year clinical follow up, symptomatic PEtended to be less frequent among filter recipients(6, 3.4%) than patients who received anticoagula-tion alone (12, 6.3%) although the difference wasnot significant (p = 0.16). In contrast, recurrentDVT was more common among filter recipients (Fil-ter 37 [20.8%] versus no filter 22 [11.8%], p = 0.02).Mortality (Filter 43 [21.6%] versus no filter 40[20.1%], p = 0.65) and major bleeding (Filter 17,[8.8%] versus no filter 22 [11.8%], p = 0.41) wereequivalent between the groups. These data indi-cate that filters when used in conjunction withanticoagulation offer a short-term reduction inthe total number of (symptomatic and asympto-matic) PE at the cost of a long-term increase inrecurrent DVT without any reduction in mortality.Unfortunately, since 94% of patients received atleast 3 months of anticoagulation, these data donot provide us with any insight into the outcomeof the typical patient who has a vena caval filterplaced, namely, those who have contraindicationsto anticoagulation.
Table 1 Compilation of vena caval filter studies.
Filter type Study # Patient # F/U duration(in months)
PE DVT IST IVCT Post-thromboticsyndrome
Stainless steel 41 3595 18 (1–60) 104/2997 (3.5%) 96/1634 (5.9%) 97/1131 (8.6%) 88/2488 (3.5%) 254/1353 (19%)Greenfield (range: 0–9%) (range: 0–18%) (range: 1–47%) (range: 0–18%) (range: 0–47%)
Fatal 38 (1.3%) 50/217 (23%)\
Titanium 10 649 5.8 (0–81) 19/556 (3.4%) 5/22 (22.7%) 35/267 (13.1%) 16/364 (4.4%) 34/236 (14.4%)Greenfield (range: 0–4.4%) (range: 0–36%) (range: 2–39%) (range: 1–31%) (range: 9–20%)
Fatal 10 (1.8%) 23/82 (28%)\
Percutaneousstainless steel
4 666 20.6 (8.5–26) 8/298 (2.7%)Fatal 1 (0.3%)
18/231 (7.8%) 10/231 (4.3%) 8/267 (3%) 62/231 (27%)
Greenfield
Bird’s Nest 18 1742 14.2 (0–60) 49/1441 (3.4%) 27/448 (6%) 31/417 (7.4%) 38/1334 (2.8%) 37/267 (14%)(range: 0–7.1%) (range: 0–20%) (range: 0–33%) (range: 0–15%) (range: 4–41%)Fatal 22 (1.5%) 23/101 (23%)\
VenaTech 16 1353 17.3 (0–65) 45/1266 (3.6%) 8/25 (32%) 40/261 (15.3%) 102/1074 (9.5%) 95/232 (41%)(range: 0–6.3%) (range: 8–44%) (range: 0–28%) (range: 24–59%)Fatal 12 (0.9%) 16/44 (36%)\
Simon nitinol 11 975 15 (0–62) 30/920 (3.3%) 11/123 (8.9%) 22/191 (11.5%) 47/898 (5.2%) 16/124 (12.9%)(range: 0–5.3%) (range: 8–11%) (range: 0–64%) (range: 0–50%) (range: 6–44%)Fatal 17 (1.8%) 11/36 (31%)\
Nitinol TrapEase 2 254 4.2 (4–6) 1/254 (0.4%) 3/254 (1.2%) 1/254 (0.4%) 5/254 (2%) NA(range: 0–0.5%) (range: 1.1–1.5%) (range: 0–1.5% (range: 1.6–3.5%)Fatal 0
Gunther Tulip 4 269 3.5 (3–4) 4/269 (1.5%) 0 0 8/124 (6.5%) NA(range: 0–3.6%) (range: 5.1–11.1%)Fatal 1 (0.4%)
VenaTech LP 1 30 2.3 0 10.3% NA 0 NA
Abbreviations: #= number, F/U = follow up, PE = pulmonary embolism, DVT = deep venous thrombosis, IST = insertion site thrombosis, IVCT = inferior vena caval thrombosis, \ refers toIST rate in populations with routine screening.Note: The denominators of the various complications only include evaluable patients (i.e. patients lost to follow up or dead are not included. Only a portion of the studies evaluatedpatients for all these events).Data on VenaTech LP filter based upon data published by Kinney TB.42
184C.L.
Han
n,M.B.Stre
iff
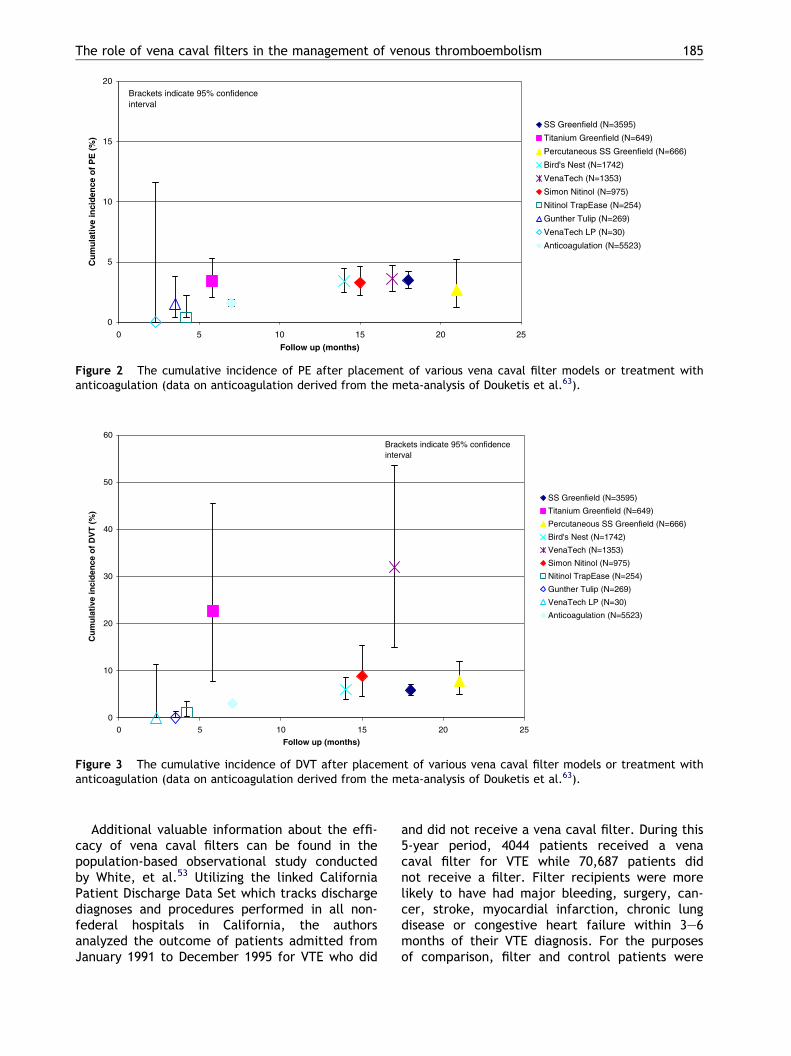
20 25
SS Greenfield (N=3595)
Titanium Greenfield (N=649)
Percutaneous SS Greenfield (N=666)
Bird's Nest (N=1742)
VenaTech (N=1353)
Simon Nitinol (N=975)
Nitinol TrapEase (N=254)
Gunther Tulip (N=269)
VenaTech LP (N=30)
Anticoagulation (N=5523)
Brackets indicate 95% confidenceinterval
0
5
10
15
20
0 5 10 15
Follow up (months)
Cu
mu
lati
ve in
cid
ence
of
PE
(%
)
Figure 2 The cumulative incidence of PE after placement of various vena caval filter models or treatment withanticoagulation (data on anticoagulation derived from the meta-analysis of Douketis et al.63).
0
10
20
30
40
50
60
0 5 10 15 20 25
Follow up (months)
Cu
mu
lati
ve in
cid
ence
of
DV
T (
%)
SS Greenfield (N=3595)
Titanium Greenfield (N=649)
Percutaneous SS Greenfield (N=666)
Bird's Nest (N=1742)
VenaTech (N=1353)
Simon Nitinol (N=975)
Nitinol TrapEase (N=254)
Gunther Tulip (N=269)
VenaTech LP (N=30)
Anticoagulation (N=5523)
Brackets indicate 95% confidenceinterval
Figure 3 The cumulative incidence of DVT after placement of various vena caval filter models or treatment withanticoagulation (data on anticoagulation derived from the meta-analysis of Douketis et al.63).
The role of vena caval filters in the management of venous thromboembolism 185
Additional valuable information about the effi-cacy of vena caval filters can be found in thepopulation-based observational study conductedby White, et al.53 Utilizing the linked CaliforniaPatient Discharge Data Set which tracks dischargediagnoses and procedures performed in all non-federal hospitals in California, the authorsanalyzed the outcome of patients admitted fromJanuary 1991 to December 1995 for VTE who did
and did not receive a vena caval filter. During this5-year period, 4044 patients received a venacaval filter for VTE while 70,687 patients didnot receive a filter. Filter recipients were morelikely to have had major bleeding, surgery, can-cer, stroke, myocardial infarction, chronic lungdisease or congestive heart failure within 3–6months of their VTE diagnosis. For the purposesof comparison, filter and control patients were
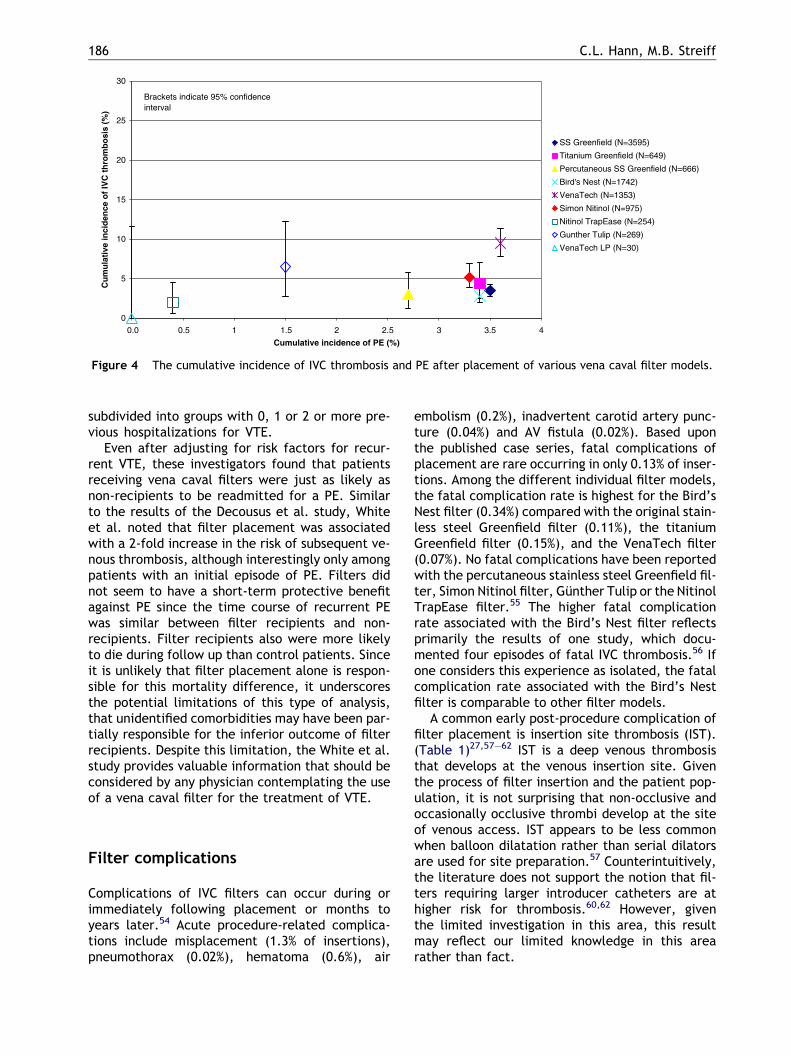
0
5
10
15
20
25
30
0.0 0.5 1 1.5 2 2.5 3 3.5 4
Cumulative incidence of PE (%)
Cu
mu
lati
ve in
cid
ence
of
IVC
th
rom
bo
sis
(%)
SS Greenfield (N=3595)
Titanium Greenfield (N=649)
Percutaneous SS Greenfield (N=666)
Bird's Nest (N=1742)
VenaTech (N=1353)
Simon Nitinol (N=975)
Nitinol TrapEase (N=254)
Gunther Tulip (N=269)
VenaTech LP (N=30)
Brackets indicate 95% confidenceinterval
Figure 4 The cumulative incidence of IVC thrombosis and PE after placement of various vena caval filter models.
186 C.L. Hann, M.B. Streiff
subdivided into groups with 0, 1 or 2 or more pre-vious hospitalizations for VTE.
Even after adjusting for risk factors for recur-rent VTE, these investigators found that patientsreceiving vena caval filters were just as likely asnon-recipients to be readmitted for a PE. Similarto the results of the Decousus et al. study, Whiteet al. noted that filter placement was associatedwith a 2-fold increase in the risk of subsequent ve-nous thrombosis, although interestingly only amongpatients with an initial episode of PE. Filters didnot seem to have a short-term protective benefitagainst PE since the time course of recurrent PEwas similar between filter recipients and non-recipients. Filter recipients also were more likelyto die during follow up than control patients. Sinceit is unlikely that filter placement alone is respon-sible for this mortality difference, it underscoresthe potential limitations of this type of analysis,that unidentified comorbidities may have been par-tially responsible for the inferior outcome of filterrecipients. Despite this limitation, the White et al.study provides valuable information that should beconsidered by any physician contemplating the useof a vena caval filter for the treatment of VTE.
Filter complications
Complications of IVC filters can occur during orimmediately following placement or months toyears later.54 Acute procedure-related complica-tions include misplacement (1.3% of insertions),pneumothorax (0.02%), hematoma (0.6%), air
embolism (0.2%), inadvertent carotid artery punc-ture (0.04%) and AV fistula (0.02%). Based uponthe published case series, fatal complications ofplacement are rare occurring in only 0.13% of inser-tions. Among the different individual filter models,the fatal complication rate is highest for the Bird’sNest filter (0.34%) compared with the original stain-less steel Greenfield filter (0.11%), the titaniumGreenfield filter (0.15%), and the VenaTech filter(0.07%). No fatal complications have been reportedwith the percutaneous stainless steel Greenfield fil-ter, Simon Nitinol filter, Gunther Tulip or the NitinolTrapEase filter.55 The higher fatal complicationrate associated with the Bird’s Nest filter reflectsprimarily the results of one study, which docu-mented four episodes of fatal IVC thrombosis.56 Ifone considers this experience as isolated, the fatalcomplication rate associated with the Bird’s Nestfilter is comparable to other filter models.
A common early post-procedure complication offilter placement is insertion site thrombosis (IST).(Table 1)27,57–62 IST is a deep venous thrombosisthat develops at the venous insertion site. Giventhe process of filter insertion and the patient pop-ulation, it is not surprising that non-occlusive andoccasionally occlusive thrombi develop at the siteof venous access. IST appears to be less commonwhen balloon dilatation rather than serial dilatorsare used for site preparation.57 Counterintuitively,the literature does not support the notion that fil-ters requiring larger introducer catheters are athigher risk for thrombosis.60,62 However, giventhe limited investigation in this area, this resultmay reflect our limited knowledge in this arearather than fact.
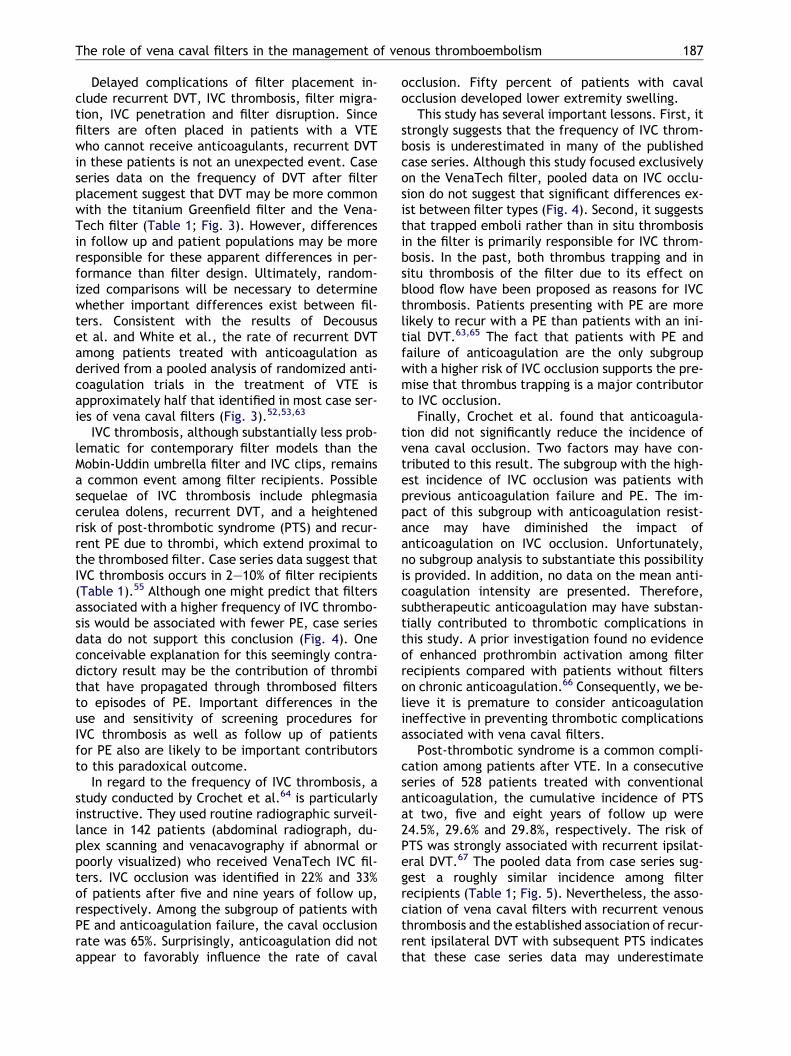
The role of vena caval filters in the management of venous thromboembolism 187
Delayed complications of filter placement in-clude recurrent DVT, IVC thrombosis, filter migra-tion, IVC penetration and filter disruption. Sincefilters are often placed in patients with a VTEwho cannot receive anticoagulants, recurrent DVTin these patients is not an unexpected event. Caseseries data on the frequency of DVT after filterplacement suggest that DVT may be more commonwith the titanium Greenfield filter and the Vena-Tech filter (Table 1; Fig. 3). However, differencesin follow up and patient populations may be moreresponsible for these apparent differences in per-formance than filter design. Ultimately, random-ized comparisons will be necessary to determinewhether important differences exist between fil-ters. Consistent with the results of Decoususet al. and White et al., the rate of recurrent DVTamong patients treated with anticoagulation asderived from a pooled analysis of randomized anti-coagulation trials in the treatment of VTE isapproximately half that identified in most case ser-ies of vena caval filters (Fig. 3).52,53,63
IVC thrombosis, although substantially less prob-lematic for contemporary filter models than theMobin-Uddin umbrella filter and IVC clips, remainsa common event among filter recipients. Possiblesequelae of IVC thrombosis include phlegmasiacerulea dolens, recurrent DVT, and a heightenedrisk of post-thrombotic syndrome (PTS) and recur-rent PE due to thrombi, which extend proximal tothe thrombosed filter. Case series data suggest thatIVC thrombosis occurs in 2–10% of filter recipients(Table 1).55 Although one might predict that filtersassociated with a higher frequency of IVC thrombo-sis would be associated with fewer PE, case seriesdata do not support this conclusion (Fig. 4). Oneconceivable explanation for this seemingly contra-dictory result may be the contribution of thrombithat have propagated through thrombosed filtersto episodes of PE. Important differences in theuse and sensitivity of screening procedures forIVC thrombosis as well as follow up of patientsfor PE also are likely to be important contributorsto this paradoxical outcome.
In regard to the frequency of IVC thrombosis, astudy conducted by Crochet et al.64 is particularlyinstructive. They used routine radiographic surveil-lance in 142 patients (abdominal radiograph, du-plex scanning and venacavography if abnormal orpoorly visualized) who received VenaTech IVC fil-ters. IVC occlusion was identified in 22% and 33%of patients after five and nine years of follow up,respectively. Among the subgroup of patients withPE and anticoagulation failure, the caval occlusionrate was 65%. Surprisingly, anticoagulation did notappear to favorably influence the rate of caval
occlusion. Fifty percent of patients with cavalocclusion developed lower extremity swelling.
This study has several important lessons. First, itstrongly suggests that the frequency of IVC throm-bosis is underestimated in many of the publishedcase series. Although this study focused exclusivelyon the VenaTech filter, pooled data on IVC occlu-sion do not suggest that significant differences ex-ist between filter types (Fig. 4). Second, it suggeststhat trapped emboli rather than in situ thrombosisin the filter is primarily responsible for IVC throm-bosis. In the past, both thrombus trapping and insitu thrombosis of the filter due to its effect onblood flow have been proposed as reasons for IVCthrombosis. Patients presenting with PE are morelikely to recur with a PE than patients with an ini-tial DVT.63,65 The fact that patients with PE andfailure of anticoagulation are the only subgroupwith a higher risk of IVC occlusion supports the pre-mise that thrombus trapping is a major contributorto IVC occlusion.
Finally, Crochet et al. found that anticoagula-tion did not significantly reduce the incidence ofvena caval occlusion. Two factors may have con-tributed to this result. The subgroup with the high-est incidence of IVC occlusion was patients withprevious anticoagulation failure and PE. The im-pact of this subgroup with anticoagulation resist-ance may have diminished the impact ofanticoagulation on IVC occlusion. Unfortunately,no subgroup analysis to substantiate this possibilityis provided. In addition, no data on the mean anti-coagulation intensity are presented. Therefore,subtherapeutic anticoagulation may have substan-tially contributed to thrombotic complications inthis study. A prior investigation found no evidenceof enhanced prothrombin activation among filterrecipients compared with patients without filterson chronic anticoagulation.66 Consequently, we be-lieve it is premature to consider anticoagulationineffective in preventing thrombotic complicationsassociated with vena caval filters.
Post-thrombotic syndrome is a common compli-cation among patients after VTE. In a consecutiveseries of 528 patients treated with conventionalanticoagulation, the cumulative incidence of PTSat two, five and eight years of follow up were24.5%, 29.6% and 29.8%, respectively. The risk ofPTS was strongly associated with recurrent ipsilat-eral DVT.67 The pooled data from case series sug-gest a roughly similar incidence among filterrecipients (Table 1; Fig. 5). Nevertheless, the asso-ciation of vena caval filters with recurrent venousthrombosis and the established association of recur-rent ipsilateral DVT with subsequent PTS indicatesthat these case series data may underestimate
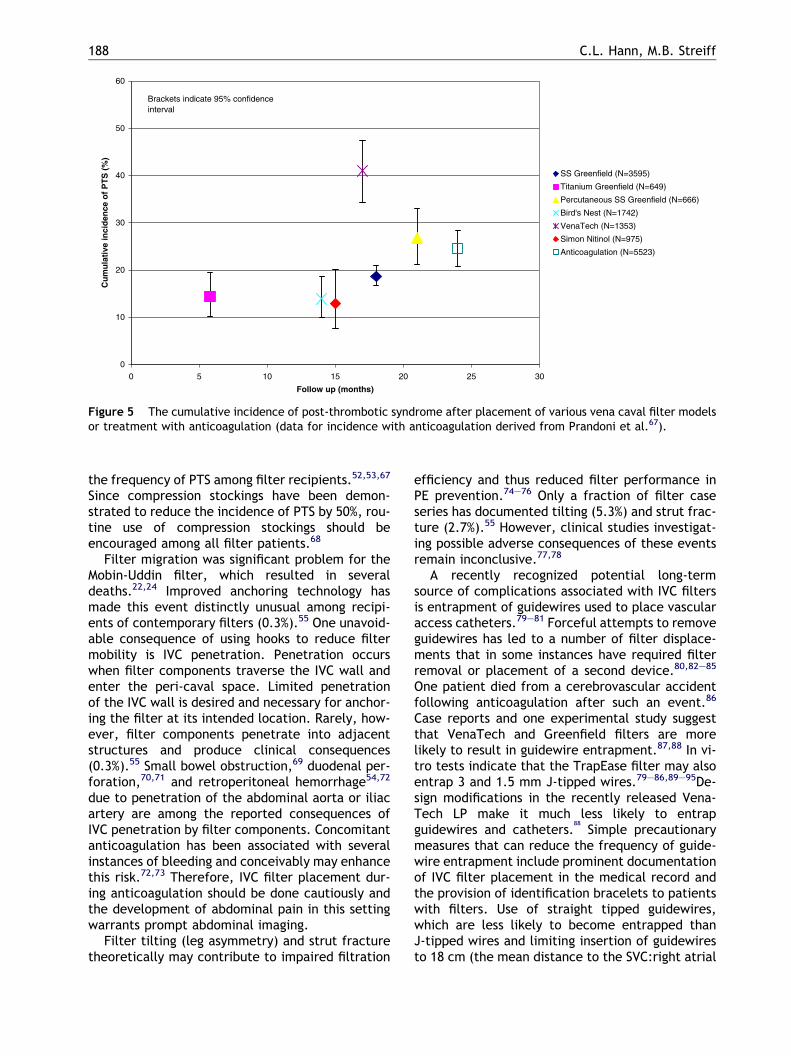
0
10
20
30
40
50
60
0 5 10 15 20 25 30
Follow up (months)
Cu
mu
lati
ve in
cid
ence
of
PT
S (
%)
SS Greenfield (N=3595)
Titanium Greenfield (N=649)
Percutaneous SS Greenfield (N=666)
Bird's Nest (N=1742)
VenaTech (N=1353)
Simon Nitinol (N=975)
Anticoagulation (N=5523)
Brackets indicate 95% confidenceinterval
Figure 5 The cumulative incidence of post-thrombotic syndrome after placement of various vena caval filter modelsor treatment with anticoagulation (data for incidence with anticoagulation derived from Prandoni et al.67).
188 C.L. Hann, M.B. Streiff
the frequency of PTS among filter recipients.52,53,67
Since compression stockings have been demon-strated to reduce the incidence of PTS by 50%, rou-tine use of compression stockings should beencouraged among all filter patients.68
Filter migration was significant problem for theMobin-Uddin filter, which resulted in severaldeaths.22,24 Improved anchoring technology hasmade this event distinctly unusual among recipi-ents of contemporary filters (0.3%).55 One unavoid-able consequence of using hooks to reduce filtermobility is IVC penetration. Penetration occurswhen filter components traverse the IVC wall andenter the peri-caval space. Limited penetrationof the IVC wall is desired and necessary for anchor-ing the filter at its intended location. Rarely, how-ever, filter components penetrate into adjacentstructures and produce clinical consequences(0.3%).55 Small bowel obstruction,69 duodenal per-foration,70,71 and retroperitoneal hemorrhage54,72
due to penetration of the abdominal aorta or iliacartery are among the reported consequences ofIVC penetration by filter components. Concomitantanticoagulation has been associated with severalinstances of bleeding and conceivably may enhancethis risk.72,73 Therefore, IVC filter placement dur-ing anticoagulation should be done cautiously andthe development of abdominal pain in this settingwarrants prompt abdominal imaging.
Filter tilting (leg asymmetry) and strut fracturetheoretically may contribute to impaired filtration
efficiency and thus reduced filter performance inPE prevention.74–76 Only a fraction of filter caseseries has documented tilting (5.3%) and strut frac-ture (2.7%).55 However, clinical studies investigat-ing possible adverse consequences of these eventsremain inconclusive.77,78
A recently recognized potential long-termsource of complications associated with IVC filtersis entrapment of guidewires used to place vascularaccess catheters.79–81 Forceful attempts to removeguidewires has led to a number of filter displace-ments that in some instances have required filterremoval or placement of a second device.80,82–85
One patient died from a cerebrovascular accidentfollowing anticoagulation after such an event.86
Case reports and one experimental study suggestthat VenaTech and Greenfield filters are morelikely to result in guidewire entrapment.87,88 In vi-tro tests indicate that the TrapEase filter may alsoentrap 3 and 1.5 mm J-tipped wires.79–86,89–95De-sign modifications in the recently released Vena-Tech LP make it much less likely to entrapguidewires and catheters.
88
Simple precautionarymeasures that can reduce the frequency of guide-wire entrapment include prominent documentationof IVC filter placement in the medical record andthe provision of identification bracelets to patientswith filters. Use of straight tipped guidewires,which are less likely to become entrapped thanJ-tipped wires and limiting insertion of guidewiresto 18 cm (the mean distance to the SVC:right atrial
The role of vena caval filters in the management of venous thromboembolism 189
junction) minimize the chances of this complica-tion.87,88,96 If a guidewire does become entrapped,physicians should immediately contact an interven-tional radiologist or vascular surgeon to safely re-move the wire under fluoroscopic guidance.
Suprarenal filter placement
The standard placement site of an IVC filter is at thelevel of the L3 vertebral body, caudal to the renalveins. Historically, this practice was followed fora variety of reasons including: (1) fear of occlusionof the renal veins in the event of filter occlusion,97,(2) the short length and wider diameter of thesuprarenal IVC compared with the infrarenal IVC,and (3) difficulty with visualization of the suprare-nal IVC during venography.98 Occasionally, how-ever, clot location or anatomic concerns (e.g.,gravid uterus) have dictated placement in thesuprarenal IVC (corresponding to the T12-L1 level).
Matchett et al.98 reported a retrospective re-view of filter placement between 1985 and 1998at a single institution. During this period, a totalof 764 filters were placed including 22 suprarenalfilters. The reasons for suprarenal filter placementincluded thrombus in IVC up to the renal veins,recurrent PE or an increase in thrombus despiteinfrarenal filter placement, poor placement or mal-position of an infrarenal filter, pregnancy or theintention to become pregnant and ovarian veinthrombosis. Complications of suprarenal filterplacement among the 18 patients with follow up in-cluded renal insufficiency (1 patient; 5.5%), PE (1patient; 5.5%), filter migration of greater than 2cm (5 patients; 27.7%), filter fracture (1 patient;5.5%) and IVC penetration (1 patient, 5.5%).98
Greenfield and Proctor99 reported on 148 pa-tients who received suprarenal filters. Of the 73 pa-tients (49%) available for follow-up, recurrent PEoccurred in six patients (8%), caval occlusion insix (8%), suspected/confirmed IVC penetration infour and one patient(s), respectively (total 7%),and migration in 11 (15%). Three different typesof filters were used: the original SSGF, the percuta-neous stainless steel GF and the titanium GF. Therates of recurrent PE, caval occlusion and filterlimb fracture were higher with the original SSGFthan the titanium Greenfield and percutaneousstainless steel Greenfield filters.99 Several otherstudies also have found similar results with supra-renal placement of vena caval filters.5,100,101 Incontrast, one report of 13 patients with stage IVcancer detailed progressive renal insufficiency infour patients, which was fatal in two.97
Although the data are limited, the available evi-dence suggests that in most respects suprarenal IVCfilters perform similar to infrarenal filters. How-ever, if IVC thrombosis occurs severe renal compro-mise is a significant possibility. Patients withthrombophilic states such as cancer appear to beparticularly at risk.97 Therefore, caution is war-ranted when contemplating suprarenal placementof an IVC filter in this patient population andimplantation should proceed only after a carefulreview of the risks and benefits of filter placement.
Superior vena cava filters
Upper extremity DVT (UEDVT) comprises 1–4% ofall episodes of DVT and can precipitate PE, post-thrombotic syndrome and SVC syndrome.102 Riskfactors for the development of UEDVT includeindwelling central venous catheters, implantedpacemakers and anatomic abnormalities such asthe thoracic outlet syndrome.102,103 Thrombophilicdisorders appear to be less commonly associatedwith UEDVT than lower extremity DVT.104,105 In asingle community hospital, the incidence of symp-tomatic UEDVT was 0.15% over a 2-year period.All patients were treated with anticoagulationand there were no reports of a symptomaticPE.106 Studies using ventilation perfusion scanninghave documented asymptomatic PE in up to 26%of patients with an average prevalence of12.8%.103,107,108 For patients with anatomic precip-itants, thrombolysis and surgical correction are thepreferred mode of therapy.109
Since PE can result from UEDVT, SVC filters havebeen placed in some patients with contraindica-tions to anticoagulation or failure of anticoagula-tion.110–113 In a cohort study of 72 patients with amean follow up of 7.8 months, Ascher et al. re-corded no episodes of migration, symptomaticSVC syndrome or PE. Forty-seven percent of pa-tients died during the index hospitalization an aver-age of 20 days after implantation. One filter wasmisplaced in the innominate vein but remainedpatent 2 months after insertion and a second filterwas dislodged during central line placement with aJ-tipped guidewire.113 Another study of 41 SVC fil-ter recipients reported no filter migration, frac-ture, dislodgment, SVC occlusion, or venousgangrene after 3 months of follow up. The onlyPE recorded occurred in a patient 44 months afterimplantation who had a lower extremity DVT.112 Incontrast, Lidagoster et al.114 reported a fatal epi-sode of SVC syndrome after the placement of aSVC filter. More recently, retrievable filters have
190 C.L. Hann, M.B. Streiff
been successful employed to treat patients withtemporary contraindications to anticoagulation.51
While the bulk of the literature on SVC filters sug-gests that filters are safe and effective, the num-ber of patients reported remains small and theduration of follow up is limited. Therefore, untilfurther information is available SVC filter useshould be restricted to situations in which antico-agulation is strictly contraindicated and retrievablefilters should be employed whenever possible.
Temporary or retrievable filters
Given the long-term complications of permanent fil-ters, development of a safe and effective temporaryfilter would be of great benefit to patients who havean acute episode of VTE and a short-term contraindi-cation to anticoagulation. Two different strategieshave been pursued to achieve this goal. One ap-proach has been to develop tethered temporary fil-tration devices, which can be easily removed whenno longer required.115 The Tempo filter (B. BraunMedical, Evanston, IL), the Prolyser filter (Cordis,Roden, The Netherlands), the Protect infusion cath-eter (Bard Radiology, Covington, GA), the Gunthertemporary filter (Cook Europe, Bjaevrskov, Den-mark) and the Antheor TB and TC filters (Boston Sci-entific Europe, Ratingen, Germany) are examples oftemporary devices.116–118 The Tempo Filter consistsof a cone shaped filter basket of six stainless steellegs,which are tethered in the IVC by a catheter thatis anchored at the insertion site by a subcutaneoustethering olive.115,116 While the initial experiencewith the device was positive,116 several episodes offilter migration to the right atrium due to catheterbuckling, one of which was fatal, have suspendedfurther development of this filter.119,120 The Pro-lyser filter and the Protect infusion catheter wereboth developed primarily for thrombolysis althoughthe Protect catheter has also been used successfullyfor PE prophylaxis in trauma patients.118,121 TheGunther temporary filter and the Antheor temporaryfilter models also have been used extensively duringthrombolytic therapy.118,122 The primary advantageof temporary filter systems is their ease of insertionand removal. Disadvantages of these filters includean increased incidence of infectious complications(because the filter remains attached to the subcuta-neous tissue), potentially less reliable performancein PE protection,118,122 and the potential require-ment for a permanent vena caval filter in the eventof filter thrombosis.
The second approach to temporary IVC filtrationis the retrievable filter. These filters resemble
permanent filters in that they are anchored in theIVC by tethering hooks. Since they do not havetethering catheters, they do not pose the infec-tious risk of temporary filters. The anchoringhooks, however, gradually become incorporatedin the wall of the IVC such that most retrievable fil-ters only can be left in place for a limited period oftime (several weeks) before they must be removed.Conversely, if the need for prolonged, indefinitevena caval interruption arises, these filters maybe left in place to function as permanent filters,an advantage over temporary devices.115
The Gunther Tulip filter is the only retrievable fil-ter approved for use in the US. Although the manu-facturer recommends that the Gunther Tulip filterbe removed within 10 days of placement, severalinvestigators have successfully retrieved filters thathave been implanted as long as a month.48–50,123
Others have extended the dwell time by periodic fil-ter repositioning.124,125 In a cohort of 90 patientswith Gunther Tulip filters, Millward et al. removed51 of the 52 devices successfully after a mean inser-tion time of 9 days. The only complication reportedwas filter occlusion, which occurred in two patients(5%).50 De Gregorio et al.125 had similar successretrieving 69 of 72 filters in which retrieval was at-tempted (96%). In contrast, Wicky et al.123 wereunable to remove 14 of 49 (19%) of Gunther Tulip fil-ters because of large trapped thrombi. Overall, theGunther Tulip filter performance appears to be sim-ilar to that of permanent filters in PE protection andcomplication rates. The Nitinol Trap Ease filter andthe Bird’s Nest filter have been employed as retriev-able filters although extensive experience in thiscapacity and FDA approval are lacking.126,127
In 2002, Asch reported an initial experience withthe Recovery Nitinol filter in 32 patients. The meanimplantation period was 53 days with the longestduration being 134 days. Filter retrieval was suc-cessful in all 24 patients in whom it was attempted.No symptomatic episodes of PE, IVC or insertionsite thrombosis were noted. One filter with trappedclot migrated 4 cm from its implantation site.128 Ifthese favorable results are replicated in largerstudies, the Recovery Nitinol filter will undoubtedlybecome an important tool in the treatment of pa-tients with thrombotic disease.
Should patients with permanent venacaval filters receive prophylacticanticoagulation?
As outlined in previous sections, vena caval filtershave been associated with a number of thrombotic
The role of vena caval filters in the management of venous thromboembolism 191
complications including IST, recurrent DVT and IVCthrombosis. Therefore, should all patients with avena caval filter receive long-term prophylacticanticoagulation to prevent these thrombotic com-plications? Anticoagulation with vitamin K antago-nists is know to be effective in prevention ofrecurrent thromboembolism, however this protec-tion comes at the price of an increase in hemorrha-gic morbidity and mortality, even when managedby specialized anticoagulation clinics. While anti-coagulation is often managed by anticoagulationclinics in Great Britain and Europe, managementby individual practitioners remains the predomi-nant mode of care in the US. Therefore, the risksof major bleeding associated with any program ofprophylactic anticoagulation in filter recipients inthe US are likely to be closer to 7–8% per patientyear of therapy rather than the 2–3% per patientyear commonly reported by anticoagulation clin-ics.129 Although anticoagulation has been reportedto reduce prothrombin activation in filter recipi-ents,66 it remains to be demonstrated that antico-agulation would prevent clinical events or moreimportantly reduce mortality in patients with fil-ters. At the conclusion of the Decousus et al.52
study, despite a doubling of the risk of recurrentDVT among filter recipients, there was no signifi-cant difference in mortality between the groups.
The case fatality rate of major bleeding in pa-tients with VTE has been estimated to be 13.4%while the case fatality rate of a recurrent DVT isapproximately 5%.63,130 This hemorrhagic mortalityrisk translates to an absolute fatal bleeding risk of0.3–1% per patient year depending upon the modeof anticoagulation management used (individualpractitioner versus anticoagulation managementclinic). In contrast, using the Decousus et al. data,the absolute excess risk of recurrent DVT among fil-ter recipients is on the order of 5% per patient yearcorresponding to an excess risk of thrombotic mor-tality of 0.25% per patient year.52 Therefore, evenwith optimal anticoagulation control, it is doubt-ful, whether indefinite anticoagulation for filterrecipients would result in net benefit, particularlyin the setting of individual practitioner manage-ment. Furthermore, since the risk of recurrentVTE declines over time while the risk of bleedingwith anticoagulation remains constant, it is likelythe risk:benefit ratio is likely to worsen as timepasses.131,132 In the near future, anticoagulantswith improved safety profiles will become clinicallyavailable which may favorably change the risk:ben-efit ratio for long-term anticoagulation for manyindications.133 Until that time, the available dataindicate that anticoagulation therapy for patientswith IVC filters should be guided by the thrombotic
history of the patient and not the presence of afilter.
Can patients with vena caval filtersundergo magnetic resonance imaging?
Magnetic resonance imaging has become anincreasingly important clinical imaging modality.Therefore, patients with vena caval filters arelikely to require MR imaging at some point duringtheir medical care. Thus far, no reports of filtermigration as a result of MR imaging have been pub-lished. Ferromagnetic alloys such as stainless steel(original stainless steel Greenfield filter, percuta-neous Greenfield filter and the Bird’s Nest filter)produce artifacts on MR imaging (greatest withthe SSGF and Bird’s Nest filter, much less withthe percutaneous Greenfield filter) but stainlesssteel filter components have been demonstratedto be stable in field strengths up to 1.5 T.29,33,38
The Simon Nitinol filter, Nitinol TrapEase filter,VenaTech filter, VenaTech LP filter, Gunther Tulipfilter and the titanium Greenfield filter are allcomposed of low ferromagnetic alloys which donot result in significant MR image deteriora-tion.29,44,134–137 MR imaging as early as one weekafter placement was not associated with any con-sequences in a small series of patients with the Si-mon Nitinol filter.44 While it is likely that other lowferromagnetic devices will behave similarly, datawith other filter models would be useful for clinicaldecision-making.
Indications for IVC filter placement
While the vast majority of patients with VTE can bemanaged with anticoagulation, there is a small sub-set of patients for whom anticoagulation is contra-indicated. Since patients with an acute episode ofVTE are at a substantial risk for recurrence in theabsence of anticoagulation,138,139 vena caval filtersrepresent a valuable treatment option for patientswho cannot receive anticoagulation.
Since the advent of improved percutaneoustechniques for filter placement, the number ofindications for vena caval filter placement as wellas the number of filters placed has increased dra-matically. One report on IVC filter usage revealeda 5-fold increase in the number of caval filtersplaced at a single institution from 1980 to 1996.5
Coincident with this trend has been increasing useof IVC filters for prophylactic indications despite
Table 2 Indications for IVC filter placement.
Appropriate IndicationContraindication to anticoagulation
Potential IndicationsFailure of adequate anticoagulationPulmonary thromboembolectomy patientsProphylaxis in high-risk trauma patientsExtensive free-floating iliofemoral thrombusThrombolysis of ilio-caval thrombus
Unsubstantiated indicationsTreatment of VTE inCancer patientsCOPD patientsPatients with poor cardiopulmonary reservePregnant patientsOrgan transplant patientsPatients with history of GI bleed
Prophylaxis in burn patientsProphylaxis in bariatric surgery patients
192 C.L. Hann, M.B. Streiff
the absence of compelling data demonstratingtheir efficacy in these situations.5 In the followingsections we review the data supporting the use ofvena caval filters for these extended indications(Table 2).
Potential indications for IVC filterplacement
Failure of anticoagulation
Prevention of recurrent VTE is commonly proposedas an indication for vena caval filter placement.Although episodes of VTE do occur in patientswho are therapeutically anticoagulated, these in-stances are unusual. Therefore, any patient withrecurrent VTE despite anticoagulation should becarefully evaluated before vena caval filter place-ment is entertained in order to avoid potentialtherapeutic catastrophes. First, it is important todetermine whether the patient has been consist-ently therapeutic in the period preceding therecurrent thrombotic event. If this is not the casethen, it is more appropriate to redouble effortsto maintain the patient in the therapeutic rangeand perhaps increase the target INR from 2–3 to2.5–3.5 rather than place a vena caval filter whichmay thrombose and cause more morbidity if sub-therapeutic anticoagulation continues. In the set-ting of a substantial pulmonary circulatory clotburden, thrombolysis followed by anticoagulationmay be more appropriate than filter placement. If
the patient has been clearly therapeutic, hyper-coaguable syndromes that require more intensiveor alternative forms of anticoagulation should beexcluded before a filter is placed.
Although many patients with the antiphospho-lipid antibody syndrome are safely managed withconventional intensity warfarin anticoagulation(INR 2-3),140 a subset of these patients requirehigh-intensity warfarin (INR 3-4) to prevent throm-botic events.141 A panel of coagulation assays thatare sensitive to the presence of antiphospholipidantibodies as well as immunoassays for anti-phospholipid binding protein antibodies (anticardi-olipin antibodies, anti-beta 2 glycoprotein Iantibodies) should be sent to diagnose thiscondition.142
Another hypercoaguable state that is stronglyassociated with resistance to conventional inten-sity warfarin anticoagulation is Trousseau’s syn-drome. First recognized by Armand Trousseau140 years ago, Trousseau’s syndrome is a malig-nancy-associated hypercoaguable state character-ized by arterial or venous thromboembolism(often migratory involving superficial veins),non-bacterial thrombotic endocarditis, dissemi-nated intravascular coagulation, and warfarinresistance.143 Since this condition is a systemichypercoaguable state, regional approaches to pre-vent thromboembolism such as vena caval filtersare never adequate and, in the authors’ anecdo-tal experience, are often associated with substan-tial thrombotic morbidity and mortality. Thiscondition is only remediable with heparinanticoagulation.
Pulmonary thromboembolectomy
In most patients, PE resolve with treatment suchthat they do not suffer any permanent clinicallyapparent physiologic sequelae. In a subset of pa-tients (3.8%), these emboli may persist or multiplesub-clinical episodes of PE may occur such thatthey develop chronic thromboembolic pulmonaryhypertension (CTEPH).144,145 Pulmonary thrombo-endarterectomy (PTE) has been reported to beassociated with improvements in survival, qualityof life and function in such patients. Despite a pau-city of data confirming their efficacy, vena cavalfilters are routinely placed in patients undergoingPTE in addition to life-long anticoagulation.146
While the employment of vena caval filters in thiscapacity appears to be logical, additional datademonstrating the safety and efficacy of IVC filtersare warranted in light of the Decousus et al. studyresults.
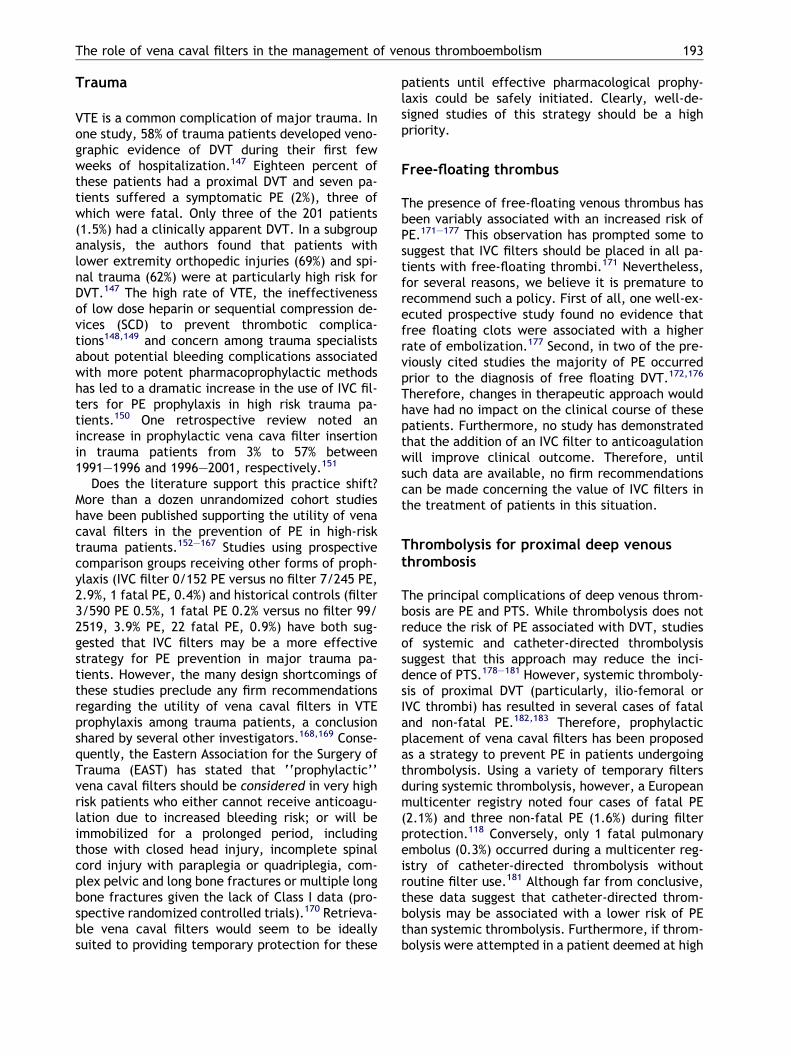
The role of vena caval filters in the management of venous thromboembolism 193
Trauma
VTE is a common complication of major trauma. Inone study, 58% of trauma patients developed veno-graphic evidence of DVT during their first fewweeks of hospitalization.147 Eighteen percent ofthese patients had a proximal DVT and seven pa-tients suffered a symptomatic PE (2%), three ofwhich were fatal. Only three of the 201 patients(1.5%) had a clinically apparent DVT. In a subgroupanalysis, the authors found that patients withlower extremity orthopedic injuries (69%) and spi-nal trauma (62%) were at particularly high risk forDVT.147 The high rate of VTE, the ineffectivenessof low dose heparin or sequential compression de-vices (SCD) to prevent thrombotic complica-tions148,149 and concern among trauma specialistsabout potential bleeding complications associatedwith more potent pharmacoprophylactic methodshas led to a dramatic increase in the use of IVC fil-ters for PE prophylaxis in high risk trauma pa-tients.150 One retrospective review noted anincrease in prophylactic vena cava filter insertionin trauma patients from 3% to 57% between1991–1996 and 1996–2001, respectively.151
Does the literature support this practice shift?More than a dozen unrandomized cohort studieshave been published supporting the utility of venacaval filters in the prevention of PE in high-risktrauma patients.152–167 Studies using prospectivecomparison groups receiving other forms of proph-ylaxis (IVC filter 0/152 PE versus no filter 7/245 PE,2.9%, 1 fatal PE, 0.4%) and historical controls (filter3/590 PE 0.5%, 1 fatal PE 0.2% versus no filter 99/2519, 3.9% PE, 22 fatal PE, 0.9%) have both sug-gested that IVC filters may be a more effectivestrategy for PE prevention in major trauma pa-tients. However, the many design shortcomings ofthese studies preclude any firm recommendationsregarding the utility of vena caval filters in VTEprophylaxis among trauma patients, a conclusionshared by several other investigators.168,169 Conse-quently, the Eastern Association for the Surgery ofTrauma (EAST) has stated that ‘‘prophylactic’’vena caval filters should be considered in very highrisk patients who either cannot receive anticoagu-lation due to increased bleeding risk; or will beimmobilized for a prolonged period, includingthose with closed head injury, incomplete spinalcord injury with paraplegia or quadriplegia, com-plex pelvic and long bone fractures or multiple longbone fractures given the lack of Class I data (pro-spective randomized controlled trials).170 Retrieva-ble vena caval filters would seem to be ideallysuited to providing temporary protection for these
patients until effective pharmacological prophy-laxis could be safely initiated. Clearly, well-de-signed studies of this strategy should be a highpriority.
Free-floating thrombus
The presence of free-floating venous thrombus hasbeen variably associated with an increased risk ofPE.171–177 This observation has prompted some tosuggest that IVC filters should be placed in all pa-tients with free-floating thrombi.171 Nevertheless,for several reasons, we believe it is premature torecommend such a policy. First of all, one well-ex-ecuted prospective study found no evidence thatfree floating clots were associated with a higherrate of embolization.177 Second, in two of the pre-viously cited studies the majority of PE occurredprior to the diagnosis of free floating DVT.172,176
Therefore, changes in therapeutic approach wouldhave had no impact on the clinical course of thesepatients. Furthermore, no study has demonstratedthat the addition of an IVC filter to anticoagulationwill improve clinical outcome. Therefore, untilsuch data are available, no firm recommendationscan be made concerning the value of IVC filters inthe treatment of patients in this situation.
Thrombolysis for proximal deep venousthrombosis
The principal complications of deep venous throm-bosis are PE and PTS. While thrombolysis does notreduce the risk of PE associated with DVT, studiesof systemic and catheter-directed thrombolysissuggest that this approach may reduce the inci-dence of PTS.178–181 However, systemic thromboly-sis of proximal DVT (particularly, ilio-femoral orIVC thrombi) has resulted in several cases of fataland non-fatal PE.182,183 Therefore, prophylacticplacement of vena caval filters has been proposedas a strategy to prevent PE in patients undergoingthrombolysis. Using a variety of temporary filtersduring systemic thrombolysis, however, a Europeanmulticenter registry noted four cases of fatal PE(2.1%) and three non-fatal PE (1.6%) during filterprotection.118 Conversely, only 1 fatal pulmonaryembolus (0.3%) occurred during a multicenter reg-istry of catheter-directed thrombolysis withoutroutine filter use.181 Although far from conclusive,these data suggest that catheter-directed throm-bolysis may be associated with a lower risk of PEthan systemic thrombolysis. Furthermore, if throm-bolysis were attempted in a patient deemed at high
194 C.L. Hann, M.B. Streiff
risk for embolization (e.g., poorly adherent IVC oriliac thrombi) or mortality from PE (patients withconcomitant PE or patients with limited cardiopul-monary reserve), the experience of Lorch et al.would suggest that retrievable filters such as theGunther Tulip filter might be a better option.
Unsubstantiated indications
Cancer patients
Malignancy is a well-documented independent riskfactor for the development of VTE. In a prospectiveregistry study of 5451 patients with objectivelyconfirmed DVT, cancer was present in 32% of pa-tients.184 Cancer patients also are known to be at2–3-fold higher risk for recurrent thrombosis aswell as bleeding complications compared withVTE patients without cancer.185,186 These datahave generated considerable interest in routineuse of vena caval filters to treat cancer patientswith VTE. Case series of IVC filters in cancer pa-tients indicate that filters can be effective in theprevention of PE (pooled frequency of symptomaticPE, 14/646 2.2%; fatal PE 5/646 0.8%).187–197 How-ever, unrandomized comparisons with anticoagula-tion have found greater thrombotic morbidityamong filter recipients and no improvement in sur-vival (Fig. 6).198–203 In one single institution retro-spective study of 166 cancer patients with VTE,
0
5
10
15
20
25
PE DVT
Ad
vers
e ev
ent
(% o
f su
bje
cts)
IVC filter (N=175) Antic
Figure 6 The frequency of adverse clinical events in studiestreatment of VTE in cancer patients.
serious, life- or limb-threatening thromboemboliccomplications developed in 17% of filter recipi-ents.203 Therefore, despite the greater hemorrha-gic morbidity of chronic anticoagulation in cancerpatients, its risk:benefit profile appears to be morefavorable than IVC filter use. Recent studies of lowmolecular weight heparin in the treatment ofmalignancy-associated VTE204 and clinical trials ofnew anti-thrombotic agents133 indicate that phar-macological approaches not mechanical ap-proaches will continue to be the preferredtherapy for most cancer patients with VTE.
High-risk orthopedic patients
Patients undergoing orthopedic surgery such as to-tal knee arthroplasty (TKA) or total hip arthropl-asty (THA) are considered at the highest risk forthe development of VTE due to a number of fac-tors which contribute to venous stasis such asposition on the operating table, the use of thightourniquets during knee arthroplasty to provide a‘‘bloodless field’’, post-operative immobility andvascular injury. In the absence of prophylaxis,the risk of proximal DVT in this patient populationis 10–20%.205 Several case series attest to the effi-cacy of IVC filters in the prevention of PE in ortho-pedic patients.206–209 However, none of thesestudies incorporated random or masked treatmentassignment or masked outcome assessment andfollow up was of limited intensity and duration.Furthermore, many advances in orthopedic VTE
IVC thrombosis Major bleeding
oagulation (N=251) Brackets indicate 95% confidenceinterval
of vena caval filter placement or anticoagulation for the
The role of vena caval filters in the management of venous thromboembolism 195
prophylaxis (low molecular weight heparin, syn-thetic polysaccharide factor Xa inhibitors, etc.)and anticoagulation monitoring (INR) have oc-curred since the publication of these studies.Therefore, with the availability of modern meth-ods of VTE prophylaxis, it is doubtful whetherIVC filter placement represents a useful optionfor the vast majority of orthopedic patients. Untilwell-designed studies demonstrate the utility ofvena caval filters for this purpose, this indicationfor filter placement should be considered one pri-marily of historical significance. As with any majorsurgical procedure, IVC filters, in particular,retrievable filters, remain a useful option forpatients who develop VTE in the immediate peri-operative period when full dose anticoagulationwould be contraindicated.139
Bariatric surgery
PE is considered the leading cause of perioperativedeath in bariatric surgical patients.210 Although thereported incidence of VTE in the immediate(30 days) post-operative period is 0–3%, nearlyone-third of these patients who develop PEdie.211 This finding may reflect the lack of cardiacand pulmonary reserve in patients who may havecor pulmonale from obesity hypoventilation syn-drome.210 A survey of the members of the Ameri-can Society of Bariatric Surgery found that of the31% who responded, 95% routinely used VTE proph-ylaxis. The most commonly used method was low-dose heparin (50%), followed by SCD (33%), lowmolecular weight heparins (13%) and other meth-ods (4%). Thirty-eight % of respondents used twoor more methods in combination. Despite this prac-tice, 48% of respondents reported at least one pa-tient death due to PE.212 As a result, placementof IVC filters has become a popular prophylaxisstrategy among some bariatric surgeons. Neverthe-less, little data exist to support this practice or anyVTE prophylaxis strategy in this patient population.Therefore, at the present time no firm recommen-dations for VTE prophylaxis can be made for thispatient population. Until appropriate clinical trialsare performed to address this deficiency in the lit-erature, methods of VTE prophylaxis employed forother high-risk populations such as orthopedic sur-gery patients should be utilized.
Other indications
Vena caval filter placement has also proposed forthe treatment of VTE during pregnancy. Intrinsic
(reductions in protein S activity, increases in fac-tor VIII, fibrinogen and von Willebrand factoractivity) and environmental (reduced activity,IVC compression) factors make pregnancy a highrisk period for thrombotic events.213–215 Severalcase series and case reports have documentedthe use of vena caval filters during preg-nancy.216–221 Although some authors have claimedthat anticoagulation alone may be insufficienttherapy for VTE during pregnancy, substantial evi-dence indicates that appropriately monitoredanticoagulation is effective for the vast majorityof patients.222,223 Therefore, IVC filters shouldbe strictly reserved for situations in which antico-agulation is contraindicated. In these instances,retrievable filters should be strongly consideredgiven the young age of potential recipients andthus the prolonged duration of time during whichthey will be at risk for complications associatedwith permanent filters.
Small clinical series have also described the useof vena caval filters in pediatric patients,224,225
transplant recipients226,227 and in patients with se-vere chronic obstructive pulmonary disease.228
Since none of these conditions intrinsically pre-clude anticoagulation, use of filters in these popu-lations should be restricted to patients who haveabsolute contraindications to anticoagulation. Pro-phylactic IVC filter placement has been describedin a small number of thermally injured patients.229
Further research to determine the efficacy of con-ventional VTE prophylactic methods and identifythe subsets of the burn patient population at high-est risk for VTE should be performed before consid-ering wider application of IVC filters for thisindication.
Conclusion
Despite improvements in VTE prophylaxis andincreasing acceptance of its importance amongphysicians, the incidence of VTE remains rela-tively stable. Therefore, the treatment of VTE willremain an important issue for many physicians. Anunprecedented number of new anti-thromboticmedications are under development or currentlyin clinical trials. While it is likely these new med-ications will provide even safer and more effec-tive pharmacological options for the treatmentof VTE, patients with contraindications to antico-agulation will remain a challenge for medical andsurgical practitioners. For these patients, IVC fil-ters will remain an important therapeutic alterna-tive. Similar to the evolution of pharmacological
196 C.L. Hann, M.B. Streiff
anti-thrombotic therapy, IVC filter technology hasadvanced dramatically. In addition to a wideassortment of permanent IVC filters, severalpromising retrievable filters are now becomingavailable for clinical use. If these devices proveto be as efficacious as permanent filters, they willlikely represent the future of IVC filters, providingthe clinician with greater flexibility to meet thedemands of a broad array of different clinical sit-uations. Ideally, these filters will offer all thebenefits of permanent filters without their long-term thrombotic consequences. Published clinicalevaluations of filter performance up to the pre-sent, however, have been almost exclusively clin-ical case series, which lack the rigor required toestablish clinical efficacy. It is these authors’ fer-vent hope that a serious effort will be made torigorously evaluate these new devices and estab-lish their benefits and risks for physicians. Withoutthese studies, IVC filters are destined to remain asubject of clinical controversy.
Practice points
� Vena caval filters appear to be effective in theprevention of PE.
� Vena caval filters are associated with anincreased risk of recurrent DVT.
� Vena caval filters are an important therapeuticoption for patients with VTE who have contra-indications to anticoagulation.
� In patients who appear to have failed anticoag-ulation, further investigation is warrantedprior to placing an vena caval filter, includinga search for an underlying hypercoaguablesyndrome such as the antiphospholipid syn-drome or Trousseau’s syndrome.
� To reduce the incidence of PTS routine use ofcompression stockings should be encouragedamong all filter patients.
Research agenda
� Randomized studies to evaluate the risks andbenefits of vena caval filters in various patientpopulations such as trauma and bariatric sur-gery are needed to assist clinicians in decisionmaking.
� Rigorous studies of retrievable filters areneeded to establish their efficacy and safety.
Acknowledgment
The authors thank Michael Linkinhoker, MA forhis vena caval filter illustration.
References
1. White RH. The epidemiology of venous thromboembolism.Circulation 2003;107:I4–8.
2. Kearon C, Gent M, Hirsh J, et al. A comparison of threemonths of anticoagulation with extended anticoagulationfor a first episode of idiopathic venous thromboembolism.N Engl J Med 1999;340:901–7.
3. Kearon C, Ginsberg JS, Kovacs MJ, et al. Comparison oflow-intensity warfarin therapy with conventional-inten-sity warfarin therapy for long-term prevention of recur-rent venous thromboembolism. N Engl J Med 2003;349:631–9.
4. Schulman S, Granqvist S, Holmstrom M, et al. The durationof oral anticoagulant therapy after a second episode ofvenous thromboembolism. The Duration of AnticoagulationTrial Study Group. N Engl J Med 1997;336:393–8.
5. Athanasoulis CA, Kaufman JA, Halpern EF, et al. Inferiorvena caval filters: review of a 26 year single center clinicalexperience. Radiology 2000;216:54–66.
6. Bergqvist D. The role of vena caval interruption in patientswith venous thromboembolism. Prog Cardiovasc Dis1994;37:25–37.
7. Virchow RLK (as translated by Matzdorff AC and Bell WR).first ed. Thrombosis and emboli. Canton, MA, USA: ScienceHistory Publications; 1998.
8. Trousseau A. Phlegmasia alba dolens. In: Trousseau A,editor. Clinique Medicale de l’Hotel-Dieu de Paris, vol.3. Paris: Balliere; 1865. p. 654–712.
9. Homans J. Thrombosis of deep veins of lower leg, causingpulmonary embolism. N Engl J Med 1934;211:993–7.
10. Ochsner A, DeBakey M. Intravenous clotting and its seque-lae. Surgery 1943;14:679.
11. O’Neil EE. Ligation of the Inferior vena cava in theprevention and treatment of pulmonary embolism. N EnglJ Med 1945;252:641–6.
12. Maraan BM, Taber RE. The effects of inferior vena cavalligation on cardiac output. Surgery 1968;63:966–9.
13. Gurewich G, Thomas DP, Rabinov KR. Pulmonary embolismafter ligation of the inferior vena cava. N Engl J Med1966;274:1350–4.
14. Piccone Jr VA, Vidal E, Yarnoz M, et al. The late results ofcaval ligation. Surgery 1970;68:980–98.
15. Spencer FC, Quattlebaum JK, Quattlebaum Jr JK, Sharp EH,Jude JR. Plication of the inferior vena cava for pulmonaryembolism: a report of twenty cases. Ann Surg1962;155:827–37.
16. Ravitch MM, Snodgrass E, McEnany T, Rivarola A. Compart-mentalization of the vena cava with the mechanicalstapler. Surg Gynecol Obstet 1966;122:561–6.
17. Mansour M, Chang AE, Sindelar WF. Interruption of theinferior vena cava for the prevention of recurrent pulmo-nary embolism. Am Surg 1985;51:375–80.
18. Adams JT, DeWeese JA. Partial interruption of the inferiorvena cava with a new plastic clip. Surg Gynecol Obstet1966;123:1087–8.
19. Miles RM. Prevention of pulmonary emboli by the use of aplastic vena caval clip. Ann Surg 1966;163:192–8.
The role of vena caval filters in the management of venous thromboembolism 197
20. Moretz WH, Rhode CM, Shepherd MH. Prevntion of pulmo-nary emboli by partial occlusion of the inferior vena cava.Am Surg 1959;25:617–26.
21. Mobin-Uddin K, McLean R, Bolooki H, Jude JR. Cavalinterruption for prevention of pulmonary embolism. Long-term results of a new method. Arch Surg 1969;99:711–5.
22. Mobin-Uddin K, Utley JR, Bryant LR. The inferior vena cavaumbrella filter. Prog Cardiovasc Dis 1975;17:391–9.
23. Adelson J, Steer ML, Glotzer DJ, et al. Thromboembolismafter insertion of the Mobin-Uddin caval filter. Surgery1980;87:184–9.
24. Cimochowski GE, Evans RH, Zarins CK, Lu CT, DeMeesterTR. Greenfield filter versus Mobin-Uddin umbrella: thecontinuing quest for the ideal method of vena cavalinterruption. J Thorac Cardiovasc Surg 1980;79:358–65.
25. Greenfield LJ, McCurdy JR, Brown PP, Elkins RC. A newintracaval filter permitting continued flow and resolutionof emboli. Surgery 1973;73:599–606.
26. Tadavarthy SM, Castaneda-Zuniga W, Salomonowitz E,et al. Kimray-Greenfield vena cava filter: percutaneousintroduction. Radiology 1984;151:525–6.
27. Kantor A, Glanz S, Gordon DH, Sclafani SJA. Percutaneousinsertion of the Kimray-Greenfield Filter: incidence ofFemoral Vein Thrombosis. AJR Am J Roentgenol1987;149:1065–6.
28. Greenfield LJ, Cho KJ, Pais SO, Van Aman M. Preliminaryclinical experience with the Titanium Greenfield vena cavalfilter. Arch Surg 1989;124:657–9.
29. Teitelbaum GP, Bradley Jr WG, Klein BD. MR imagingartifacts, ferromagnetism, and magnetic torque of intra-vascular filters, stents, and coils. Radiology1988;166:657–64.
30. Teitelbaum GP, Jones DL, van Breda A, et al. Vena cavalfilter splaying: potential complication of use of thetitanium Greenfield filter. Radiology 1989;173:809–14.
31. Greenfield LJ, Cho KJ, Proctor MC, et al. Results of amulticenter study of the modified-hook titanium Greenfieldfilter. J Vasc Surg 1991;14:253–7.
32. Cho KJ, Greenfield LJ, Proctor MC, et al. Evaluation of anew percutaneous stainless steel Greenfield filter. J VascInterv Radiol 1997;8:181–7.
33. Johnson SP, Raiken DP, Grebe PJ, Diffin DC, LeyendeckerJR. Single institution prospective evaluation of the over-the-wire Greenfield vena caval filter. J Vasc Interv Radiol1998;9:766–73.
34. Roehm JOJ, Gianturco C, Barth MH, Wright KC. Percuta-neous transcatheter filter for the inferior vena cava: a newdevice for the treatment of patients with pulmonaryembolism. Radiology 1984;150:255–7.
35. Reed RA, Teitelbaum GP, Taylor FC, Pentecost MJ, RoehmJO. Use of the Bird’s Nest filter in oversized inferior venaecavae. J Vasc Interv Radiol 1991;2:447–50.
36. Roehm JOJ, Johnsrude IS, Barth MH, Gianturco C. Thebird’s nest inferior vena cava filter: progress report.Radiology 1988;168:745–9.
37. Ferris EJ, McCowan TC, Carver DK, McFarland D. Percuta-neous inferior vena caval filters: follow-up of seven designsin 320 patients. Radiology 1993;188:851–6.
38. Watanabe AT, Teitelbaum GP, Gomes AS, Roehm Jr JO. MRimaging of the bird’s nest filter. Radiology 1990;177:578–9.
39. Ricco JB, Crochet D, Sebilotte P, et al. Percutaneoustransvenous caval interruption with the LGM filter: earlyresults of a multicenter trial. Ann Vasc Surg 1988;3:242–7.
40. Millward SF, Peterson RA, Moher D, et al. LGM (Vena Tech)vena caval filter: experience at a single institution. J VascInterv Radiol 1994;5:351–6.
41. Taylor FC, Awh MH, Kahn CEJ, Lu CT. Vena Tech vena cavafilter: experience and early follow-up. J Vasc Interv Radiol1991;2:435–40.
42. Kinney TB. Update on inferior vena cava filters. J VascInterv Radiol 2003;14:425–40.
43. Simon M, Athanasoulis CA, Kim D, et al. Simon nitinolinferior vena cava filter: initial clinical experience. Work inprogress. Radiology 1989;172:99–103.
44. Grassi CJ, Matsumoto AH, Teitelbaum GP. Vena cavalocclusion after Simon nitinol filter placement: identifica-tion with MR imaging in patients with malignancy. J VascInterv Radiol 1992;3:535–9.
45. Poletti PA, Becker CD, Prina L, et al. Long-term results ofthe Simon nitinol inferior vena cava filter. Eur Radiol1998;8:289–94.
46. Rousseau H, Perreault P, Otal P, et al. The 6-F nitinolTrapEase inferior vena cava filter: results of a prospectivemulticenter trial. J Vasc Interv Radiol 2001;12:299–304.
47. Schutzer R, Ascher E, Hingorani A, Jacob T, Kallakuri S.Preliminary results of the new 6F TrapEase inferior venacava filter. Ann Vasc Surg 2003;17:103–6.
48. Neuerburg JM, Gunther RW, Vorwerk D, et al. Results of amulticenter study of the retrievable Tulip Vena Cava Filter:early clinical experience. Cardiovasc Intervent Radiol1997;20:10–6.
49. Millward SF, Bhargava A, Aquino Jr J, et al. Gunther Tulipfilter: preliminary clinical experience with retrieval. J VascInterv Radiol 2000;11:75–82.
50. Millward SF, Oliva VL, Bell SD, et al. Gunther Tulipretrievable vena cava filter: results from the Registry ofthe Canadian Interventional Radiology Association. J VascInterv Radiol 2001;12:1053–8.
51. Nadkarni S, Macdonald S, Cleveland TJ, Gaines PA. Place-ment of a retrievable Gunther Tulip filter in the superiorvena cava for upper extremity deep venous thrombosis.Cardiovasc Intervent Radiol 2002;25:524–6.
52. Decousus H, Leizorovicz A, Parent F, et al. A clinical trialof vena caval filters in the prevention of pulmonaryembolism in patients with proximal deep-vein thrombosis.Prevention du Risque d’Embolie Pulmonaire par Interrup-tion Cave Study Group. N Engl J Med 1998;338:409–15.
53. White RH, Zhou H, Kim J, Romano PS. A population-basedstudy of the effectiveness of inferior vena cava filter useamong patients with venous thromboembolism. Arch InternMed 2000;160:2033–41.
54. Ray CE, Kaufman Jr JA. Complications of inferior vena cavafilters. Abdom Imaging 1996;21:368–74.
55. Streiff MB. Vena caval filters: a review for intensive carespecialists. J Intensive Care Med 2003;18:59–79.
56. Mohan CR, Hoballah JJ, Sharp WJ, et al. Comparativeefficacy and complications of vena caval filters. J Vasc Surg1995;21:235–45.
57. Mewissen MW, Erickson SJ, Foley WD, et al. Thrombosis atvenous insertion sites after inferior vena caval filterplacement. Radiology 1989;173:155–7.
58. Dorfman GS, Cronan JJ, Paolella LP, et al. Iatrogenicchanges at the venotomy site after percutaneous place-ment of the Greenfield filter. Radiology 1989;173:159–62.
59. Tobin KD, Pais SO, Austin CB. Femoral vein thrombosisfollowing percutaneous placement of the Greenfield filter.Invest Radiol 1989;24:442–5.
60. Blebea J, Wilson R, Waybill P, et al. Depp venous throm-bosis after percutaneous insertion of vena caval filters.J Vasc Surg 1999;30:821–9.
61. Molgaard CP, Yucel EKGSC, Knox TA, Waltman AC. Access-site thrombosis after placement of inferior vena cava filterswith 12-14F delivery sheaths. Radiology 1992;185:257–61.
198 C.L. Hann, M.B. Streiff
62. Aswad MA, Sandager GP, Pais SO, et al. Early duplex scanevaluation of four vena caval interruption devices. J VascSurg 1996;24:809–18.
63. Douketis JD, Kearon C, Bates S, Duku EK, Ginsberg JS. Riskof fatal pulmonary embolism in patients with treatedvenous thromboembolism. JAMA 1998;279:458–62.
64. Crochet DP, Brunel P, Trogrlic S, et al. Long-term follow-up of Vena Tech-LGM filter: predictors and frequency ofcaval occlusion. J Vasc Interv Radiol 1999;10:137–42.
65. Murin S, Romano PS, White RH. Comparison of outcomesafter hospitalization for deep venous thrombosis or pul-monary embolism. Thromb Haemost 2002;88:407–14.
66. Halbmayer WM, Haushofer A, Toth E, Fischer M. Inferiorvena caval filters and systemic prothrombin activation inorally anticoagulated patients. Lancet 1992;340:853.
67. Prandoni P, Villalta S, Bagatella P, et al. The clinicalcourse of deep-vein thrombosis. Prospective long-termfollow-up of 528 symptomatic patients. Haematologica1997;82:423–8.
68. Brandjes DP, Buller HR, Heijboer H, et al. Randomised trialof effect of compression stockings in patients withsymptomatic proximal-vein thrombosis. Lancet 1997;349:759–62.
69. Kupferschmid JP, Dickson CS, Townsend RN, Diamond DL.Small-bowel obstruction from an extruded Greenfield filterstrut: an unusual late complication. J Vasc Surg1992;16:113–5.
70. Appleberg M, Crozier JA. Duodenal penetration by aGreenfield caval filter. Aust N Z J Surg 1991;61:957–60.
71. Bianchini AU, Mehta SN, Mulder DS, Barkun AN, Mayrand S.Duodenal perforation by a Greenfield filter: endoscopicdiagnosis. Am J Gastroenterol 1997;92:686–7.
72. Woodward EB, Farber A, Wagner WH, et al. Delayedretroperitoneal arterial hemorrhage after inferior venacava (IVC) filter insertion: case report and literature reviewof caval perforations by IVC filters. Ann Vasc Surg2002;16:193–6.
73. Howerton RM, Watkins M, Feldman L. Late arterial hemor-rhage secondary to a Greenfield filter requiring operativeintervention. Surgery 1991;109:265–8.
74. Katsamouris AA, Waltman AC, Delichatsios MA, Athanasou-lis CA. Inferior vena cava filters: in vitro comparison of clottrapping and flow dynamics. Radiology 1988;166:361–6.
75. Thompson BH, Cragg AH, Smith TP, et al. Thrombus-trapping efficiency of the Greenfield filter in vivo. Radiol-ogy 1989;172:979–81.
76. Greenfield LJ, Proctor MC. Experimental embolic captureby asymmetric Greenfield filters. J Vasc Surg1992;16:436–43.
77. Kinney TB, Rose SC, Weingarten KE, et al. IVC filter tilt andasymmetry: comparison of the over-the-wire stainless-steel and titanium Greenfield IVC filters. J Vasc IntervRadiol 1997;8:1029–37.
78. Greenfield LJ, Proctor MC, Cho KJ, Wakefield TW. Limbasymmetry in titanium Greenfield filters: clinically signif-icant?. J Vasc Surg 1997;26:770–5.
79. Streib EW, Wagner JW. Complications of vascular accessprocedures in patients with vena cava filters. J Trauma2000;49:553–7.
80. Dardik A, Campbell KA, Yeo CJ, Lipsett PA. Vena cava filterensnarement and delayed migration: an unusual series ofcases. J Vasc Surg 1997;26:869–74.
81. Andrews RT, Geschwind JF, Savader SJ, Venbrux AC.Entrapment of J-tip guidewires by Venatech and stain-less-steel Greenfield vena cava filters during central venouscatheter placement: percutaneous management in fourpatients. Cardiovasc Intervent Radiol 1998;21:424–8.
82. Marelich GP, Tharratt RS. Greenfield inferior vena cavafilter dislodged during central venous catheter placement.Chest 1994;106:957–9.
83. Loesberg A, Taylor FC, Awh MH. Dislodgment of inferiorvena caval filters during ‘‘blind’’ insertion of centralvenous catheters. AJR Am J Roentgenol 1993;161:637–8.
84. Argiris A, Rademaker J, Mahmud M. Dislodgment of aninferior vena cava filter to the internal jugular vein.Intensive Care Med 1997;23:1186–7.
85. Browne RJ, Estrada FP. Guidewire entrapment duringGreenfield filter deployment. J Vasc Surg 1998;27:174–6.
86. Gibson MP, Chung RS, Husni EA, Kuivinen EP. Dislodgmentand entrapment of a Greenfield filter. J Vasc Interv Radiol1999;10:378–9.
87. Kaufman JA, Thomas JW, Geller SC, Rivitz SM, WaltmanAC. Guide-wire entrapment by inferior vena caval filters: invitro evaluation. Radiology 1996;198:71–6.
88. Stavropoulos SW, Itkin M, Trerotola SO. In vitro study ofguide wire entrapment in currently available inferior venacava filters. J Vasc Interv Radiol 2003;14:905–10.
89. Drummond JC, Spaeth JP, Dharan M. The IJ guide-wire is‘‘stuck’’. Anesthesiology 1997;86:745–6.
90. Amesbury S, Vargish T, Hall J. An unusual complication ofcentral venous catheterization. Chest 1995;107:296.
91. Rosenblum JD, Boyle CM. Percutaneous retrieval of a Vena-Tech filter displaced during central line placement. AJR AmJ Roentgenol 1996;166:994–5.
92. Johnson D, Harshfield D. Radiological case of the month.Inadvertant guidewire entrapment by IVC filter duringsubclavian line placement. J Ark Med Soc 1993;89:517–8.
93. Urbaneja A, Fontaine AB, Bruckner M, Spigos DG. Evulsionof a Vena Tech filter during insertion of a central venouscatheter. J Vasc Interv Radiol 1994;5:783–5.
94. Morgan JT, Sussman SK. ‘‘Monorail technique’’ for removalof entrapped exchange wire in a Greenfield filter. J VascInterv Radiol 1998;9:469–70.
95. Arpasi P, Kirsch MJ. Dislodgment of a stainless-steelGreenfield filter during exchange of a central venouscatheter [letter]. J Vasc Interv Radiol 1997;8:1080–2.
96. Andrews RT, Bova DA, Venbrux AC. How much guidewire istoo much? Direct measurement of the distance fromsubclavian and internal jugular vein access sites to thesuperior vena cava-atrial junction during central venouscatheter placement. Crit Care Med 2000;28:138–42.
97. Marcy PY, Magne N, Frenay M, Bruneton JN. Renal failuresecondary to thrombotic complications of suprarenal infe-rior vena cava filter in cancer patients. Cardiovasc Inter-vent Radiol 2001;24:257–9.
98. Matchett WJ, Jones MP, McFarland DR, Ferris EJ. Suprare-nal vena caval filter placement: follow-up of four filtertypes in 22 patients. J Vasc Interv Radiol 1998;9:588–93.
99. Greenfield LJ, Proctor MC. Suprarenal filter placement. JVasc Surg 1998;28:432–8.
100. Orsini RA, Jarrell BE. Suprarenal placement of vena cavalfilters: indications, techniques and results. J Vasc Surg1984;1:124–35.
101. Brenner DW, Brenner CJ, Scott J, et al. SuprarenalGreenfield filter placement to prevent pulmonary embolusin patients with vena caval tumor thrombi. J Urol1992;147:19–23.
102. Kommareddy A, Zaroukian MH, Hassouna HI. Upper extrem-ity deep venous thrombosis. Semin Thromb Hemost2002;28:89–99.
103. Prandoni P, Polistena P, Bernardi E, et al. Upper-extremitydeep vein thrombosis. Risk factors, diagnosis, and compli-cations. Arch Intern Med 1997;157:57–62.
The role of vena caval filters in the management of venous thromboembolism 199
104. Martinelli I, Cattaneo M, Panzeri D, Taioli E, Mannucci PM.Risk factors for deep venous thrombosis of the upperextremities. Ann Intern Med 1997;126:707–11.
105. Ruggeri M, Castaman G, Tosetto A, Rodeghiero F. Lowprevalence of thrombophilic coagulation defects inpatients with deep vein thrombosis of the upper limbs.Blood Coagul Fibrinolysis 1997;8:191–4.
106. Mustafa S, Stein PD, Patel KC, et al. Upper extremity deepvenous thrombosis. Chest 2003;123:1953–6.
107. Monreal M, Lafoz E, Ruiz J, Valls R, Alastrue A. Upper-extremity deep venous thrombosis and pulmonary embo-lism. A prospective study. Chest 1991;99:280–3.
108. Hingorani A, Ascher E, Lorenson E, et al. Upper extremitydeep venous thrombosis and its impact on morbidity andmortality rates in a hospital-based population. J Vasc Surg1997;26:853–60.
109. Machleder HI. Evaluation of a new treatment strategy forPaget–Schroetter syndrome: spontaneous thrombosis ofthe axillary-subclavian vein. J Vasc Surg 1993;17:305–15.
110. Owen EWJ, Schoettle GPJ, Harrington OB. Placement of aGreenfield filter in the superior vena cava. Ann Thorac Surg1992;53:896–7.
111. Pais SO, Orchis DF, Mirvis SE. Superior vena caval place-ment of Kimray-Greenfield filter. Radiology1987;165:385–6.
112. Spence LD, Gironta MG, Malde HM, et al. Acute upperextremity deep venous thrombosis: safety and effective-ness of superior vena caval filters. Radiology1999;210:53–8.
113. Ascher E, Hingorani A, Tsemekhin B, Yorkovich W, GunduzY. Lessons learned from a 6-year clinical experience withsuperior vena cava Greenfield filters. J Vasc Surg2000;32:881–7.
114. Lidagoster MI, Widman WD, Chevinski AH. Superior venacaval occlusion after filter insertion. J Vasc Surg1994;20:158–9.
115. Millward SF. Temporary and retrievable inferior vena cavafilters: Current status. J Vasc Interv Radiol 1998;9:381–7.
116. Bovyn G, Gory P, Reynaud P, Ricco JB. The Tempofilter: amulticenter study of a new temporary caval filter implan-table for up to six weeks. Ann Vasc Surg 1997;11:520–8.
117. Vos LD, Tielbeek AV, Bom EP, Gooszen HC, VroegindeweijD. The Gunther temporary inferior vena cava filter forshort-term protection against pulmonary embolism. Cardi-ovasc Intervent Radiol 1997;20:91–7.
118. Lorch H, Welger D, Wagner V, et al. Current practice oftemporary vena cava filter insertion: a multicenter regis-try. J Vasc Interv Radiol 2000;11:83–8.
119. Rossi P, Arata FM, Bonaiuti P, Pedicini V. Fatal outcome inatrial migration of the Tempofilter. Cardiovasc InterventRadiol 1999;22:227–31.
120. Kelly IM, Boyd CS. Buckling of the tethering catheter causesmigration of a temporary caval filter to the right atrium.Clin Radiol 1999;54:398–401.
121. Hughes GC, Smith TP, Eachempati SR, Vaslef SN, Reed RL.The use of a temporary vena caval interruption device inhigh-risk trauma patients unable to receive standardvenous thromboembolism prophylaxis. J Trauma1999;46:246–9.
122. Lorch H, Zwaan M, Siemens HJ, et al. Temporary vena cavafilters and ultrahigh streptokinase thrombolysis therapy: aclinical study. Cardiovasc Intervent Radiol 2000;23:273–8.
123. Wicky S, Doenz F, Meuwly JY, et al. Clinical experiencewith retrievable Gunther Tulip vena cava filters. J EndovascTher 2003;10:994–1000.
124. Tay KH, Martin ML, Fry PD, Webb JG, Machan LS. RepeatedGunther Tulip inferior vena cava filter repositioning to
prolong implantation time. J Vasc Interv Radiol2002;13:509–12.
125. de Gregorio MA, Gamboa P, Gimeno MJ, et al. The GuntherTulip retrievable filter: prolonged temporary filtration byrepositioning within the inferior vena cava. J Vasc IntervRadiol 2003;14:1259–65.
126. Nutting C, Coldwell D. Use of a TrapEase device as atemporary caval filter. J Vasc Interv Radiol 2001;12:991–3.
127. Cope C, Baum RA, Duszak RAJ. Temporary use of a Bird’sNest filter during iliocaval thrombolysis. Radiology1996;198:765–7.
128. Asch MR. Initial experience in humans with a newretrievable inferior vena cava filter. Radiology 2002;225:835–44.
129. Ansell J, Hirsh J, Dalen J, et al. Managing oral anticoag-ulant therapy. Chest 2001;119:22S–38S.
130. Linkins LA, Choi PT, Douketis JD. Clinical impact ofbleeding in patients taking oral anticoagulant therapy forvenous thromboembolism: a meta-analysis. Ann Intern Med2003;139:893–900.
131. van Dongen CJ, Vink R, Hutten BA, Buller HR, Prins MH. Theincidence of recurrent venous thromboembolism aftertreatment with vitamin K antagonists in relation to timesince first event: a meta-analysis. Arch Intern Med2003;163:1285–93.
132. Palareti G, Leali N, Coccheri S, et al. Bleeding complica-tions of oral anticoagulant treatment: an inception-cohort,prospective collaborative study (ISCOAT). Italian Study onComplications of Oral Anticoagulant Therapy. Lancet1996;348:423–8.
133. Schulman S, Wahlander K, Lundstrom T, Clason SB, ErikssonH. Secondary prevention of venous thromboembolism withthe oral direct thrombin inhibitor ximelagatran. N Engl JMed 2003;349:1713–21.
134. Kim D, Edelman RR, Margolin CJ, et al. The Simon nitinolfilter: evaluation by MR and ultrasound. Angiology1992;43:541–8.
135. Teitelbaum GP, Ortega HV, Vinitski S, et al. Low-artifactintravascular devices: MR imaging evaluation. Radiology1988;168:713–9.
136. Kiproff PM, Deeb ZL, Contractor FM, Khoury MB. Magneticresonance characteristics of the LGM vena cava filter:technical note. Cardiovasc Intervent Radiol 1991;14:254–5.
137. Bucker A, Neuerburg JM, Adam GB, et al. Real-time MRguidance for inferior vena cava filter placement in ananimal model. J Vasc Interv Radiol 2001;12:753–6.
138. Douketis JD, Foster GA, Crowther MA, Prins MH, GinsbergJS. Clinical risk factors and timing of recurrent venousthromboembolism during the initial 3 months of anticoag-ulant therapy. Arch Intern Med 2000;160:3431–6.
139. Kearon C, Hirsh J. Management of anticoagulation beforeand after elective surgery. N Engl J Med 1997;336:1506–11.
140. Crowther MA, Ginsberg JS, Julian J, et al. A comparison oftwo intensities of warfarin for the prevention of recurrentthrombosis in patients with the antiphospholipid antibodysyndrome. N Engl J Med 2003;349:1133–8.
141. Khamashta MA, Cuadrado MJ, Mujic F, et al. The manage-ment of thrombosis in the antiphospholipid-antibody syn-drome. N Engl J Med 1995;332:993–7.
142. Wilson WA, Gharavi AE, Koike T, et al. Internationalconsensus statement on preliminary classification criteriafor definite antiphospholipid syndrome: report of aninternational workshop. Arthritis Rheum 1999;42:1309–11.
200 C.L. Hann, M.B. Streiff
143. Sack GH, Levin J, Bell WR. Trousseau’s syndrome and othermanifestations of chronic disemminated coagulopathy inpatients with neoplasms: clinical, pathophysiological andtherapeutic features. Medicine 1977;56:1–37.
144. Pengo V, Lensing AW, Prins MH, et al. Incidence of chronicthromboembolic pulmonary hypertension after pulmonaryembolism. N Engl J Med 2004;350:2257–64.
145. Jamieson SW, Nomura K. Indications for and the results ofpulmonary thromboendarterectomy for thromboembolicpulmonary hypertension. Semin Vasc Surg 2000;13:236–44.
146. Mo M, Kapelanski DP, Mitruka SN, et al. Reoperativepulmonary thromboendarterectomy. Ann Thorac Surg1999;68:1770–6.
147. Geerts WH, Code KI, Jay RM, Chen E, Szalai JP. Aprospective study of venous thromboembolism after majortrauma. N Engl J Med 1994;331:1601–6.
148. Velmahos GC, Nigro J, Tatevossian R, et al. Inability of anaggressive policy of thromboprophylaxis to prevent deepvenous thrombosis (DVT) in critically injured patients: arecurrent methods of DVT prophylaxis insufficient. J Am CollSurg 1998;187:529–33.
149. Upchurch GRJ, Demling RH, Davies J, Gates JD, Knox JB.Efficacy of subcutaneous heparin in prevention of venousthromboembolic events in trauma patients. Am Surg1995;61:749–55.
150. Devlin JW, Tyburski JG, Moed B. Implementation andevaluation of guidelines for use of enoxaparin as deep veinthrombosis prophylaxis after major trauma. Pharmaco-therapy 2001;21:740–7.
151. Carlin AM, Tyburski JG, Wilson RF, Steffes C. Prophylacticand therapeutic inferior vena cava filters to preventpulmonary emboli in trauma patients. Arch Surg2002;137:521–5.
152. Webb LX, Rush PT, Fuller SB, Meredith JW. Greenfield filterprophylaxis of pulmonary embolism in patients undergoingsurgery for acetabular fracture. J Orthop Trauma1992;6:139–45.
153. Rogers FB, Shackford SR, Wilson J, Ricci MA, Morris CS.Prophylactic vena cava filter insertion in severely injuredtrauma patients: indications and preliminary results. JTrauma 1993;35:637–41.
154. Leach TA, Pastena JA, Swan KG, et al. Surgical prophylaxisfor pulmonary embolism. Am Surg 1994;60:292–5.
155. Rosenthal D, McKinsey JF, Levy AM, Lamis PA, Clark MD.Use of the Greenfield filter in patients with major trauma.Cardiovasc Surg 1994;2:52–5.
156. Wilson JT, Rogers FB, Wald SL, Shackford SR, Ricci MA.Prophylactic vena cava filter insertion in patients withtraumatic spinal cord injury: preliminary results. Neuro-surgery 1994;35:234–9.
157. Winchell RJ, Hoyt DB, Walsh JC, Simons RK, Eastman AB.Risk factors associated with pulmonary embolism despiteroutine prophylaxis: implications for improved protection.J Trauma 1994;37:600–6.
158. Khansarinia S, Dennis JW, Veldenz HC, Butcher JL,Hartland L. Prophylactic Greenfield filter placement inselected high-risk trauma patients. J Vasc Surg 1995;22:231–5.
159. Rogers FB, Shackford SR, Ricci MA, Wilson JT, Parsons S.Routine prophylactic vena cava filter insertion inseverely injured trauma patients decreases the incidenceof pulmonary embolism. J Am Coll Surg 1995;180:641–7.
160. Zolfaghari D, Johnson B, Weireter LJ, Britt LD. Expandeduse of inferior vena cava filters in the trauma population.Surg Annu 1995;27:99–105.
161. Patton JHJ, Fabian TC, Croce MA, et al. ProphylacticGreenfield filters: acute complications and long-termfollow-up [see comments]. J Trauma 1996;41:231–6.
162. Rodriguez JL, Lopez JM, Proctor MC, et al. Early place-ment of prophylactic vena caval filters in injured patientsat high risk for pulmonary embolism. J Trauma1996;40:797–802.
163. Gosin JS, Graham AM, Ciocca RG, Hammond JS. Efficacy ofprophylactic vena cava filters in high-risk trauma patients.Ann Vasc Surg 1997;11:100–5.
164. Rogers FB, Shackford SR, Ricci MA, Huber BM, Atkins T.Prophylactic vena cava filter insertion in selected high-riskorthopaedic trauma patients. J Orthop Trauma1997;11:267–72.
165. Rogers FB, Strindberg G, Shackford SR, et al. Five-yearfollow-up of prophylactic vena cava filters in high-risktrauma patients. Arch Surg 1998;133:406–11.
166. Greenfield LJ, Proctor MC, Michaels AJ, Taheri PA.Prophylactic vena caval filters in trauma: the rest of thestory. J Vasc Surg 2000;32:490–7.
167. Wojcik R, Cippolle MD, Fearen I, et al. Long-term follow upof trauma patients with a vena caval filter. J Trauma2000;49:839–43.
168. Velmahos GC, Kern J, Chan LS, et al. Prevention of venousthromboembolism after injury: an evidence-based report –Part I: analysis of risk factors and evaluation of the role ofvena caval filters. J Trauma 2000;49:132–9.
169. Cheung MC, Geerts WH. Prophylactic inferior vena cavalfilter use in trauma: a systematic review. Blood2003;102:886a.
170. Rogers FB, Cipolle MD, Velmahos G, Rozycki G, LuchetteFA. Practice management guidelines for the prevention ofvenous thromboembolism in trauma patients: the EASTpractice management guidelines work group. J Trauma2002;53:142–64.
171. Norris CS, Greenfield LJ, Herrmann JB. Free-floatingiliofemoral thrombus: a risk of pulmonary embolism. ArchSurg 1985;120:806–8.
172. Voet D, Afschrift M. Floating thrombi: diagnosis and follow-up by Duplex ultrasound. Br J Radiol 1991;64:1010–4.
173. Monreal M, Ruiz J, Salvador R, et al. Recurrent pulmonaryembolism: a prospective study. Chest 1989;95:976–9.
174. Radomski JS, Jarrell BE, Carabasi RA, Yang S-L, Koolpe H.Risk of pulmonary embolus with inferior vena cava throm-bosis. Am Surg 1987;53:97–101.
175. Berry RE, George JE, Shaver WA. Free-floating thrombus: aretrospective analysis. Ann Surg 1990;211:719–23.
176. Baldridge ED, Martin MA, Welling RE. Clinical significance offree-floating venous thrombi. J Vasc Surg 1990;11:62–9.
177. Pacouret G, Alison D, Pottier J-M, et al. Free-floatingthrombus and embolic risk in patients with angiographicallyconfirmed proximal deep venous thrombosis: a prospectivestudy. Arch Int Med 1997;157:305–8.
178. Arnesen H, Hoiseth A, Ly B. Streptokinase or heparin in thetreatment of deep vein thrombosis. Follow-up results of aprospective study. Acta Med Scand 1982;211:65–8.
179. Elliot MS, Immelman EJ, Jeffery P, et al. A comparativerandomized trial of heparin versus streptokinase in thetreatment of acute proximal venous thrombosis: an interimreport of a prospective trial. Br J Surg 1979;66:838–43.
180. Grossman C, McPherson S. Safety and efficacy of catheter-directed thrombolysis for iliofemoral venous thrombosis.AJR Am J Roentgenol 1999;172:667–72.
181. Mewissen MW, Seabrook GR, Meissner MH, et al. Catheter-directed thrombolysis for lower extremity deep venousthrombosis: report of a national multicenter registry.Radiology 1999;211:39–49.
The role of vena caval filters in the management of venous thromboembolism 201
182. Martin M, Eickerling B. Todliche lungenembolie unterultrahoch-dosierter Streptokinase-Behandlung. Dtsch MedWochenschr 1990;115:1812.
183. Grimm W, Schwieder G, Wagner T. Fatal pulmonaryembolism in venous thrombosis of the leg and pelvisduring lysis therapy. Dtsch Med Wochenschr 1990;115:1183–7.
184. Goldhaber SZ, Tapson VF. A prospective registry of 5451patients with ultrasound-confirmed deep vein thrombosis.Am J Cardiol 2004;93:259–62.
185. Prandoni P, Lensing AW, Piccioli A, et al. Recurrentvenous thromboembolism and bleeding complicationsduring anticoagulant treatment in patients withcancer and venous thrombosis. Blood 2002;100:3484–8.
186. Hutten BA, Prins MH, Gent M, et al. Incidence ofrecurrent thromboembolic and bleeding complicationsamong patients with venous thromboembolism in relationto both malignancy and achieved international normalizedratio: a retrospective analysis. J Clin Oncol 2000;18:3078–83.
187. Martin B, Martyak TE, Stoughton TL, Collazo WA, Pearl W.Experience with the Gianturco-Roehm Bird’s Nest venacava filter. Am J Cardiol 1990;66:1275–7.
188. Cantelmo NL, Menzoian JO, Logerfo FW, Fasulo G, MozdenPJ. Clinical experience with vena caval filters in high-riskcancer patients. Cancer 1982;50:341–4.
189. Walsh DB, Downing S, Nauta R, Gomes MN. Metastaticcancer: a relative contraindication to vena caval filterplacement. Cancer 1987;59:161–3.
190. Whitney BA, Kerstein MD. Thrombocytopenia and cancer:use of the Kim-Ray Greenfield filter to prevent thrombo-embolism. South Med J 1987;80:1246–8.
191. Muchmore JH, Dunlap JN, Culicchia F, Kerstein MD. Deepvein thrombophlebitis and pulmonary embolism inpatients with malignant gliomas. South Med J 1989;82:1352–6.
192. Hubbard KP, Roehm JOJ, Abbruzzese JL. The Bird’s NestFilter. An alternative to long-term oral anticoagulation inpatients with advanced malignancies. Am J Clin Oncol1994;17:115–7.
193. Cohen JR, Grella L, Citron M. Greenfield filter instead ofheparin as primary treatment for deep venous thrombosisor pulmonary embolism in patients with cancer. Cancer1992;70:1993–6.
194. Rosen MP, Porter DH, Kim D. Reassessment of vena cavalfilter use in patients with cancer. J Vasc Interv Radiol1994;5:501–6.
195. Lossef SV, Barth KH. Outcome of patients with advancedneoplastic disease receiving vena caval filters. J Vasc IntervRadiol 1995;6:273–7.
196. Schwarz RE, Marrero AM, Conlon KC, Burt M. Inferior venacava filters in cancer patients: indications and outcome. JClin Oncol 1996;14:652–7.
197. Greenfield LJ, Proctor MC, Saluja A. Clinical results ofGreenfield filter use in patients with cancer. CardiovascSurg 1997;5:145–9.
198. Cohen JR, Tenenbaum N, Citron M. Greenfield filter asprimary therapy for deep venous thrombosis and/orpulmonary embolism in patients with cancer. Surgery1991;109:12–5.
199. Olin JW, Young JR, Graor RA, et al. Treatment of deepvein thrombosis and pulmonary emboli in patients withprimary and metastatic brain tumors. Arch Int Med1987;147:2177–9.
200. Calligaro KD, Bergen WS, Haut MJ, Savarese RP, DeLauren-tis DA. Thromboembolic complications in patients with
advanced cancer: anticoagulation versus Greenfield filterplacement. Ann Vasc Surg 1991;5:186–9.
201. Levin JM, Schiff D, Loeffler JS, et al. Complicationsof therapy for venous thromboembolic disease inpatients with brain tumors. Neurology 1993;43:1111–4.
202. Schiff D, DeAngelis LM. Therapy of venous thromboembo-lism in patients with brain metastases. Cancer1994;73:493–8.
203. Ihnat DM, Mills JL, Hughes JD, et al. Treatment of patientswith venous thromboembolism and malignant disease:should vena cava filter placement be routine?. J Vasc Surg1998;28:800–7.
204. Lee AY, Levine MN, Baker RI, et al. Low-molecular-weightheparin versus a coumarin for the prevention of recurrentvenous thromboembolism in patients with cancer. N Engl JMed 2003;349:146–53.
205. Geerts WH, Heit JA, Clagett GP, et al. Prevention ofvenous thromboembolism. Chest 2001;119:132S–75S.
206. Vaughn BK, Knezevich S, Lombardi AVJ, Mallory TH. Use ofthe Greenfield filter to prevent fatal pulmonary embolismassociated with total hip and knee arthroplasty. J BoneJoint Surg Am 1989;71:1542–8.
207. Emerson RHJ, Cross R, Head WC. Prophylactic andearly therapeutic use of the Greenfield filter in hipand knee joint arthroplasty. J Arthroplasty 1991;6:129–35.
208. Bicalho PS, Hozack WJ, Rothman RH, Eng K. Treatment ofearly symptomatic pulmonary embolism after total jointarthroplasty. J Arthroplasty 1996;11:522–4.
209. Woolson ST, Harris WH. Greenfield vena caval filter formanagement of selected cases of venous thromboembolicdisease following hip surgery. Clin Orthoped Rel Res1986;204:201–6.
210. Byrne TK. Complications of surgery for obesity. Surg ClinNorth Am 2001;81:1181-viii.
211. Brolin RE. Gastric bypass. Surg Clin North Am2001;81:1077–95.
212. Wu EC, Barba CA. Current practices in the prophylaxis ofvenous thromboembolism in bariatric surgery. Obes Surg2000;10:7–13.
213. Cerneca F, Ricci G, Simeone R, et al. Coagulation andfibrinolysis changes in normal pregnancy. Increased levelsof procoagulants and reduced levels of inhibitors duringpregnancy induce a hypercoagulable state, combined witha reactive fibrinolysis. Eur J Obstet Gynecol Reprod Biol1997;73:31–6.
214. Clark P, Brennand J, Conkie JA, et al. Activated protein Csensitivity, protein C, protein S and coagulation in normalpregnancy. Thromb Haemost 1998;79:1166–70.
215. Gates S. Thromboembolic disease in pregnancy. Curr OpinObstet Gynecol 2000;12:117–22.
216. Aburahma AF, Boland JP. Management of deep veinthrombosis of the lower extremity in pregnancy: a chal-lenging dilemma. Am Surg 1999;65:164–7.
217. Aburahma AF, Mullins DA. Endovascular caval interruptionin pregnant patients with deep vein thrombosis of thelower extremity. J Vasc Surg 2001;33:375–8.
218. Banfield PJ, Pittam M, Marwood R. Recurrent pulmo-nary embolism in pregnancy managed with the Green-field vena caval filter. Int J Gynaecol Obstet 1990;33:275–8.
219. Narayan H, Cullimore J, Krarup K, et al. Experience withthe Cardial inferior vena cava filter as prophylaxis againstpulmonary embolism in pregnant women with extensivedeep venous thrombosis. Br J Obstet Gynaecol1992;99:637–40.
202 C.L. Hann, M.B. Streiff
220. Neill AM, Appleton DS, Richards P. Retrievable inferiorvena caval filter for thromboembolic disease in pregnancy.Br J Obstet Gynaecol 1997;104:1416–8.
221. Owen RJ, Krarup KC. Case report: the successful use andremoval of the Gunther Tulip inferior vena caval filter inpregnancy. Clin Radiol 1997;52:241–3.
222. Greer IA. Prevention and management of venous throm-boembolism in pregnancy. Clin Chest Med 2003;24:123–37.
223. Bates SM, Ginsberg JS. How we manage venous thrombo-embolism during pregnancy. Blood 2002;100:3470–8.
224. Reed RA, Teitelbaum GP, Stanley P, et al. The use ofinferior vena cava filters in pediatric patients for pulmo-nary embolus prophylaxis. Cardiovasc Intervent Radiol1996;19:401–5.
225. Cahn MD, Rohrer MJ, Martella MB, Cutler BS. Long-termfollow-up of Greenfield inferior vena cava filter placementin children. J Vasc Surg 2001;34:820–5.
226. Walker III HS, Pennington DG. Inferior vena caval filters inheart transplant recipients with perioperative deep veinthromboses. J Heart Transplant 1990;9:579–80.
227. Kanda Y, Yamamoto R, Chizuka A, et al. Treatment ofdeep vein thrombosis using temporary vena caval filtersafter allogeneic bone marrow transplantation. Leuk Lym-phoma 2000;38:429–33.
228. Pomper SR, Lutchman G. The role of intracaval filters inpatients with COPD and DVT. Angiology 1991;42: 85–9.
229. Still J, Friedman B, Furman S, et al. Experience with theinsertion of vena caval filters in acutely burned patients.Am Surg 2000;66:277–9.
Related Documents