
Welcome message from author
This document is posted to help you gain knowledge. Please leave a comment to let me know what you think about it! Share it to your friends and learn new things together.
Transcript

New Year Picks 2021 Jan 2021
2
2021: A year of resuscitation of growth
As the year 2020 draws to a close and most people would be happy to see
the back of 2020, but surely 2020 will be written in the history books for
multiple reasons. An interesting article by a leading publication indicated
that COVID 19 was the biggest story in the history of mankind. Other
events which have had similar impact in terms of media mentions were the
two world wars. COVID 19 will shape up businesses over the coming
decade but it has also taught people a very valuable lesson that life is not
be hoarded but to be lived. This means, risk taking will be coming back
meaningfully and a stronger than expected economic revival is likely. The
key themes for 2021 are as follows:
Digital, Healthcare and Telecom will continue to have a good run in 2021:
All these themes were promising even before COVID 19 but the pandemic has
resulted in business transformation decisions which were unthinkable a year
back. IT companies in India are winning big transformational deals which will
have huge implications over the next few years. Similarly, healthcare and
telecom sectors have seen massive changes. Business models are set to evolve
further and stocks in these sectors will continue to outperform in 2021.
Year of small and mid caps: After a prolonged period of weakness, the small
and midcap stocks have outperformed the large cap indices by a significant
margin. The year 2021 will be a year of economic revival with GDP growth rate
closer to double digits. Notwithstanding the low base, the economic revival will
usher stronger earnings growth. In a year of strong earnings growth, mid and
small caps tend to see market beating earnings growth and rerating. Small and
mid cap stocks are likely to deliver very strong returns and when combined with
other dominant themes then returns will be even stronger.
BFSI and Atmanirbhar to see strong traction: The immense liquidity within
banking system has meant that the sector is now focused on growth. NPAs are
likely to be contained well and the banks have raised enough capital to tide over
the stress challenges. As growth becomes the focus for banks, stock returns will
track credit growth and pre provision profits which are likely to be significant.
Apart from BFSI, the Union Budget for 2021 will be very critical with major
schemes for manufacturing companies expected. This could mean a wide range
of Atmanirbhar (self-sufficiency) schemes are in the fray. This could help the
manufacturing sector immensely.
Sector rotation and impetus on infrastructure will be critical: Equities have
seen significant flow of FII liquidity and solid sector rotation theme playing out.
Even PSUs have started performing in the last couple of months as they were
immensely undervalued. Sector rotation theme is likely to play out in the early
part of 2021 as underperforming sectors like FMCG could gain traction. Also,
budget could put more thrust on the infrastructure sector as that is the key for
creating jobs. Thus, sector rotation and selective plays related to infra could
deliver good returns in 2021.
Our top picks for 2021 are:
Infosys, Bharti Airtel, Colgate, Relaxo Footwear, Amber
Enterprises, Ujjivan Small Finance, Star Cement, Solara Active
Pharma and Nocil.
NeerajChadawar |[email protected] |
New Year Picks 2021 Jan 2021
3
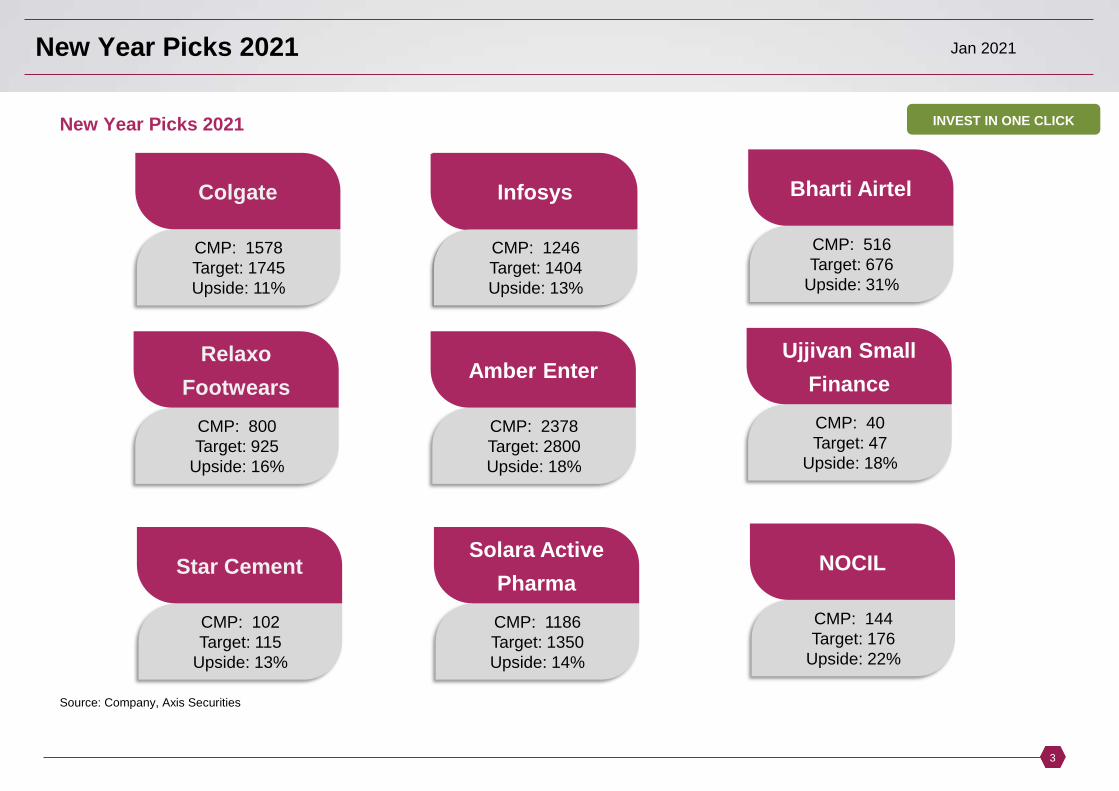
New Year Picks 2021
Source: Company, Axis Securities
CMP: 1578
Target: 1745
Upside: 11%
Colgate
Sector witnessing
consistent price and
value growth
Bharti Airtel
CMP: 516
Target: 676
Upside: 31%
Bharti Airtel
CMP: 1246
Target: 1404
Upside: 13%
Infosys
CMP: 800
Target: 925
Upside: 16%
Relaxo
Footwears
CMP: 40
Target: 47
Upside: 18%
Ujjivan Small
Finance
CMP: 2378
Target: 2800
Upside: 18%
Amber Enter
CMP: 102
Target: 115
Upside: 13%
Star Cement
CMP: 144
Target: 176
Upside: 22%
NOCIL
CMP: 1186
Target: 1350
Upside: 14%
Solara Active
Pharma
INVEST IN ONE CLICK
New Year Picks 2021 Jan 2021
4
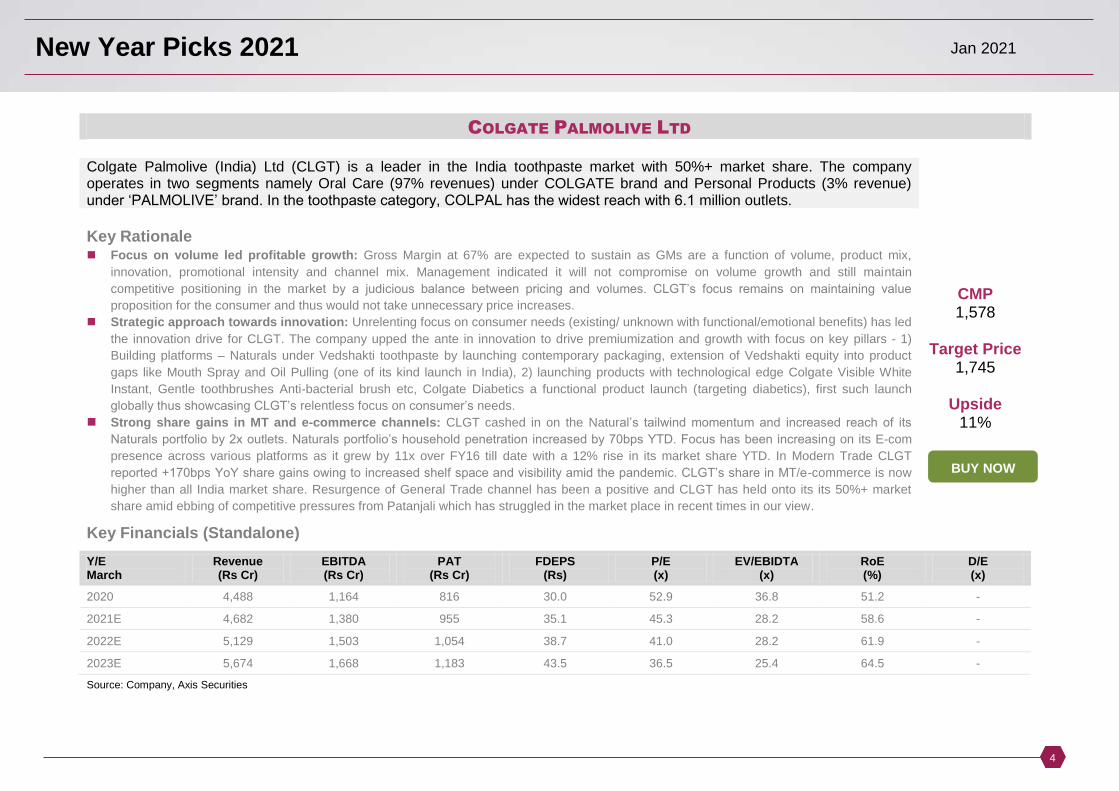
COLGATE PALMOLIVE LTD
Colgate Palmolive (India) Ltd (CLGT) is a leader in the India toothpaste market with 50%+ market share. The company operates in two segments namely Oral Care (97% revenues) under COLGATE brand and Personal Products (3% revenue) under ‘PALMOLIVE’ brand. In the toothpaste category, COLPAL has the widest reach with 6.1 million outlets.
Key Rationale Focus on volume led profitable growth: Gross Margin at 67% are expected to sustain as GMs are a function of volume, product mix,
innovation, promotional intensity and channel mix. Management indicated it will not compromise on volume growth and still maintain
competitive positioning in the market by a judicious balance between pricing and volumes. CLGT’s focus remains on maintaining value
proposition for the consumer and thus would not take unnecessary price increases.
Strategic approach towards innovation: Unrelenting focus on consumer needs (existing/ unknown with functional/emotional benefits) has led
the innovation drive for CLGT. The company upped the ante in innovation to drive premiumization and growth with focus on key pillars - 1)
Building platforms – Naturals under Vedshakti toothpaste by launching contemporary packaging, extension of Vedshakti equity into product
gaps like Mouth Spray and Oil Pulling (one of its kind launch in India), 2) launching products with technological edge Colgate Visible White
Instant, Gentle toothbrushes Anti-bacterial brush etc, Colgate Diabetics a functional product launch (targeting diabetics), first such launch
globally thus showcasing CLGT’s relentless focus on consumer’s needs.
Strong share gains in MT and e-commerce channels: CLGT cashed in on the Natural’s tailwind momentum and increased reach of its
Naturals portfolio by 2x outlets. Naturals portfolio’s household penetration increased by 70bps YTD. Focus has been increasing on its E-com
presence across various platforms as it grew by 11x over FY16 till date with a 12% rise in its market share YTD. In Modern Trade CLGT
reported +170bps YoY share gains owing to increased shelf space and visibility amid the pandemic. CLGT’s share in MT/e-commerce is now
higher than all India market share. Resurgence of General Trade channel has been a positive and CLGT has held onto its its 50%+ market
share amid ebbing of competitive pressures from Patanjali which has struggled in the market place in recent times in our view.
CMP 1,578
Target Price
1,745
Upside 11%
Key Financials (Standalone)
Y/E March
Revenue (Rs Cr)
EBITDA (Rs Cr)
PAT (Rs Cr)
FDEPS (Rs)
P/E (x)
EV/EBIDTA (x)
RoE (%)
D/E (x)
2020 4,488 1,164 816 30.0 52.9 36.8 51.2 - 2021E 4,682 1,380 955 35.1 45.3 28.2 58.6 - 2022E 5,129 1,503 1,054 38.7 41.0 28.2 61.9 - 2023E 5,674 1,668 1,183 43.5 36.5 25.4 64.5 - Source: Company, Axis Securities
BUY NOW
New Year Picks 2021 Jan 2021
5
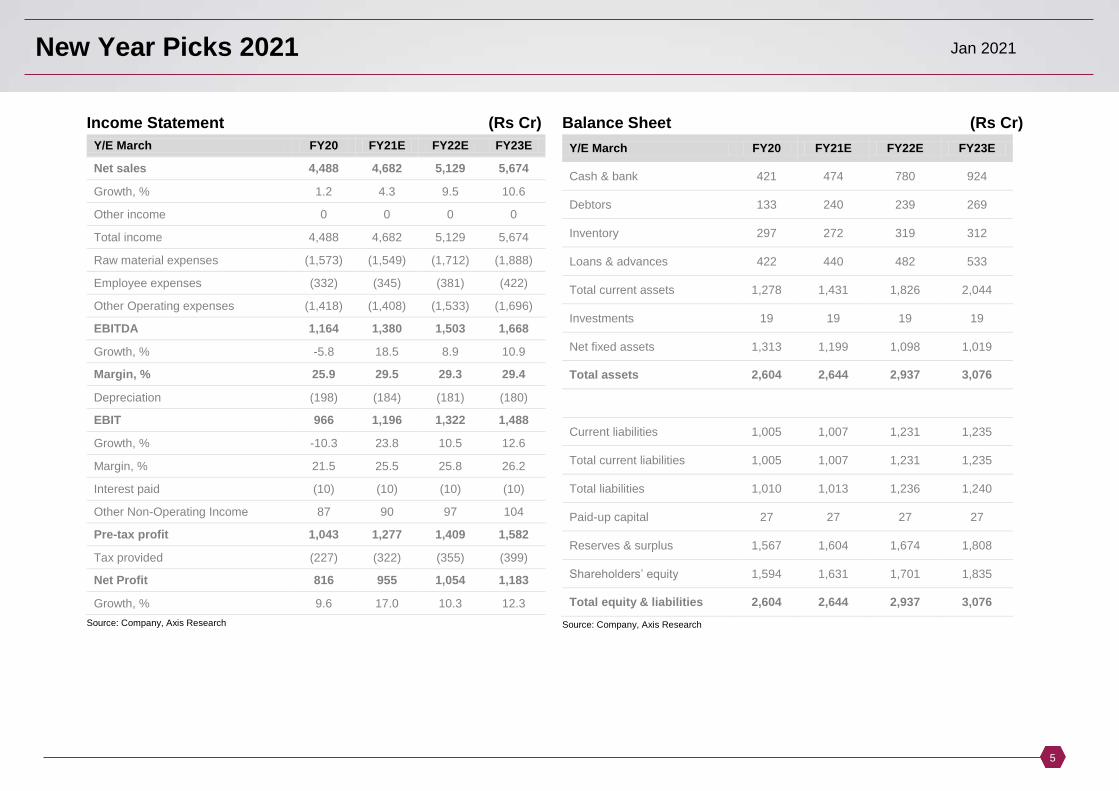
Income Statement (Rs Cr)
Y/E March FY20 FY21E FY22E FY23E
Net sales 4,488 4,682 5,129 5,674 Growth, % 1.2 4.3 9.5 10.6 Other income 0 0 0 0 Total income 4,488 4,682 5,129 5,674 Raw material expenses (1,573) (1,549) (1,712) (1,888) Employee expenses (332) (345) (381) (422) Other Operating expenses (1,418) (1,408) (1,533) (1,696) EBITDA 1,164 1,380 1,503 1,668 Growth, % -5.8 18.5 8.9 10.9 Margin, % 25.9 29.5 29.3 29.4 Depreciation (198) (184) (181) (180) EBIT 966 1,196 1,322 1,488 Growth, % -10.3 23.8 10.5 12.6 Margin, % 21.5 25.5 25.8 26.2 Interest paid (10) (10) (10) (10) Other Non-Operating Income 87 90 97 104 Pre-tax profit 1,043 1,277 1,409 1,582 Tax provided (227) (322) (355) (399) Net Profit 816 955 1,054 1,183 Growth, % 9.6 17.0 10.3 12.3
Source: Company, Axis Research
Balance Sheet (Rs Cr)
Y/E March FY20 FY21E FY22E FY23E
Cash & bank 421 474 780 924
Debtors 133 240 239 269
Inventory 297 272 319 312
Loans & advances 422 440 482 533
Total current assets 1,278 1,431 1,826 2,044
Investments 19 19 19 19
Net fixed assets 1,313 1,199 1,098 1,019 Total assets 2,604 2,644 2,937 3,076
Current liabilities 1,005 1,007 1,231 1,235
Total current liabilities 1,005 1,007 1,231 1,235
Total liabilities 1,010 1,013 1,236 1,240
Paid-up capital 27 27 27 27
Reserves & surplus 1,567 1,604 1,674 1,808
Shareholders’ equity 1,594 1,631 1,701 1,835
Total equity & liabilities 2,604 2,644 2,937 3,076 Source: Company, Axis Research
New Year Picks 2021 Jan 2021
6
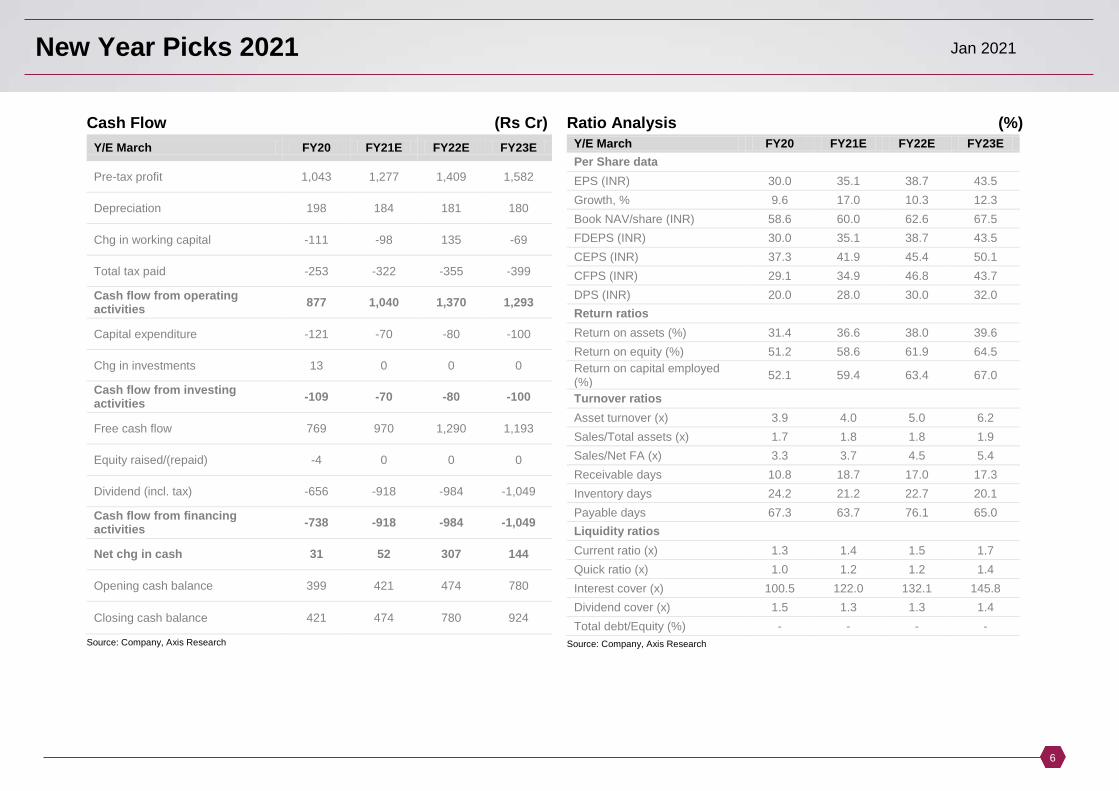
Cash Flow (Rs Cr)
Y/E March FY20 FY21E FY22E FY23E
Pre-tax profit 1,043 1,277 1,409 1,582
Depreciation 198 184 181 180
Chg in working capital -111 -98 135 -69
Total tax paid -253 -322 -355 -399 Cash flow from operating activities 877 1,040 1,370 1,293
Capital expenditure -121 -70 -80 -100
Chg in investments 13 0 0 0 Cash flow from investing activities -109 -70 -80 -100
Free cash flow 769 970 1,290 1,193
Equity raised/(repaid) -4 0 0 0
Dividend (incl. tax) -656 -918 -984 -1,049 Cash flow from financing activities -738 -918 -984 -1,049
Net chg in cash 31 52 307 144
Opening cash balance 399 421 474 780
Closing cash balance 421 474 780 924 Source: Company, Axis Research
Ratio Analysis (%)
Y/E March FY20 FY21E FY22E FY23E
Per Share data
EPS (INR) 30.0 35.1 38.7 43.5
Growth, % 9.6 17.0 10.3 12.3
Book NAV/share (INR) 58.6 60.0 62.6 67.5
FDEPS (INR) 30.0 35.1 38.7 43.5
CEPS (INR) 37.3 41.9 45.4 50.1
CFPS (INR) 29.1 34.9 46.8 43.7
DPS (INR) 20.0 28.0 30.0 32.0
Return ratios
Return on assets (%) 31.4 36.6 38.0 39.6
Return on equity (%) 51.2 58.6 61.9 64.5
Return on capital employed (%)
52.1 59.4 63.4 67.0
Turnover ratios
Asset turnover (x) 3.9 4.0 5.0 6.2
Sales/Total assets (x) 1.7 1.8 1.8 1.9
Sales/Net FA (x) 3.3 3.7 4.5 5.4
Receivable days 10.8 18.7 17.0 17.3
Inventory days 24.2 21.2 22.7 20.1
Payable days 67.3 63.7 76.1 65.0
Liquidity ratios
Current ratio (x) 1.3 1.4 1.5 1.7
Quick ratio (x) 1.0 1.2 1.2 1.4
Interest cover (x) 100.5 122.0 132.1 145.8
Dividend cover (x) 1.5 1.3 1.3 1.4
Total debt/Equity (%) - - - -
Source: Company, Axis Research
New Year Picks 2021 Jan 2021
7
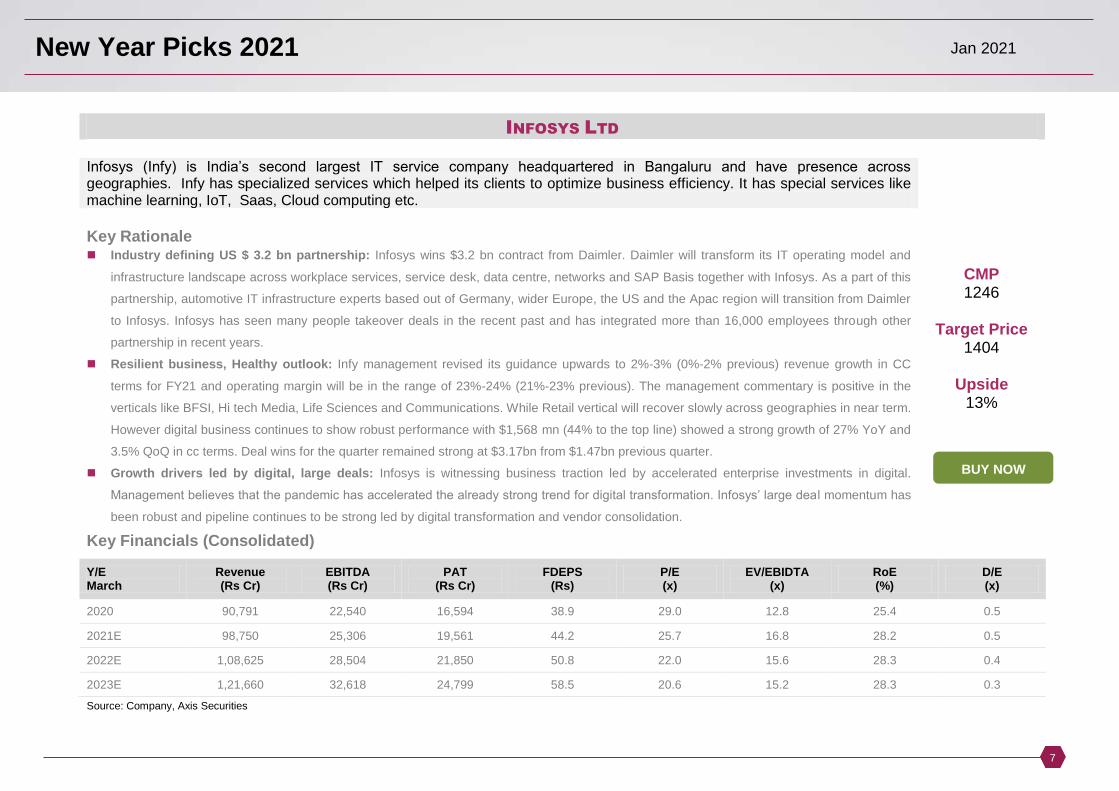
INFOSYS LTD
Infosys (Infy) is India’s second largest IT service company headquartered in Bangaluru and have presence across geographies. Infy has specialized services which helped its clients to optimize business efficiency. It has special services like machine learning, IoT, Saas, Cloud computing etc.
Key Rationale Industry defining US $ 3.2 bn partnership: Infosys wins $3.2 bn contract from Daimler. Daimler will transform its IT operating model and
infrastructure landscape across workplace services, service desk, data centre, networks and SAP Basis together with Infosys. As a part of this
partnership, automotive IT infrastructure experts based out of Germany, wider Europe, the US and the Apac region will transition from Daimler
to Infosys. Infosys has seen many people takeover deals in the recent past and has integrated more than 16,000 employees through other
partnership in recent years.
Resilient business, Healthy outlook: Infy management revised its guidance upwards to 2%-3% (0%-2% previous) revenue growth in CC
terms for FY21 and operating margin will be in the range of 23%-24% (21%-23% previous). The management commentary is positive in the
verticals like BFSI, Hi tech Media, Life Sciences and Communications. While Retail vertical will recover slowly across geographies in near term.
However digital business continues to show robust performance with $1,568 mn (44% to the top line) showed a strong growth of 27% YoY and
3.5% QoQ in cc terms. Deal wins for the quarter remained strong at $3.17bn from $1.47bn previous quarter.
Growth drivers led by digital, large deals: Infosys is witnessing business traction led by accelerated enterprise investments in digital.
Management believes that the pandemic has accelerated the already strong trend for digital transformation. Infosys’ large deal momentum has
been robust and pipeline continues to be strong led by digital transformation and vendor consolidation.
CMP 1246
Target Price
1404
Upside 13%
Key Financials (Consolidated)
Y/E March
Revenue (Rs Cr)
EBITDA (Rs Cr)
PAT (Rs Cr)
FDEPS (Rs)
P/E (x)
EV/EBIDTA (x)
RoE (%)
D/E (x)
2020 90,791 22,540 16,594 38.9 29.0 12.8 25.4 0.5 2021E 98,750 25,306 19,561 44.2 25.7 16.8 28.2 0.5 2022E 1,08,625 28,504 21,850 50.8 22.0 15.6 28.3 0.4 2023E 1,21,660 32,618 24,799 58.5 20.6 15.2 28.3 0.3 Source: Company, Axis Securities
BUY NOW
New Year Picks 2021 Jan 2021
8
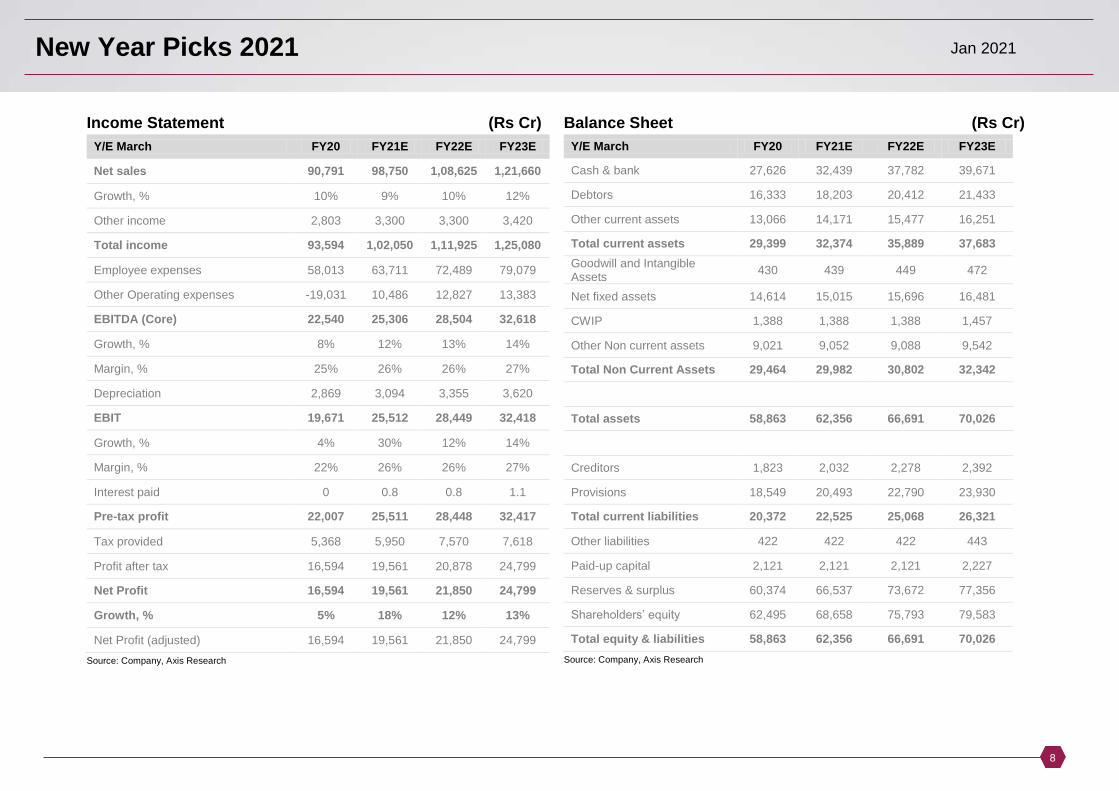
Income Statement (Rs Cr)
Y/E March FY20 FY21E FY22E FY23E
Net sales 90,791 98,750 1,08,625 1,21,660
Growth, % 10% 9% 10% 12%
Other income 2,803 3,300 3,300 3,420
Total income 93,594 1,02,050 1,11,925 1,25,080
Employee expenses 58,013 63,711 72,489 79,079
Other Operating expenses -19,031 10,486 12,827 13,383
EBITDA (Core) 22,540 25,306 28,504 32,618
Growth, % 8% 12% 13% 14%
Margin, % 25% 26% 26% 27%
Depreciation 2,869 3,094 3,355 3,620
EBIT 19,671 25,512 28,449 32,418
Growth, % 4% 30% 12% 14%
Margin, % 22% 26% 26% 27%
Interest paid 0 0.8 0.8 1.1
Pre-tax profit 22,007 25,511 28,448 32,417
Tax provided 5,368 5,950 7,570 7,618
Profit after tax 16,594 19,561 20,878 24,799
Net Profit 16,594 19,561 21,850 24,799
Growth, % 5% 18% 12% 13%
Net Profit (adjusted) 16,594 19,561 21,850 24,799
Source: Company, Axis Research
Balance Sheet (Rs Cr)
Y/E March FY20 FY21E FY22E FY23E
Cash & bank 27,626 32,439 37,782 39,671
Debtors 16,333 18,203 20,412 21,433
Other current assets 13,066 14,171 15,477 16,251
Total current assets 29,399 32,374 35,889 37,683
Goodwill and Intangible Assets
430 439 449 472
Net fixed assets 14,614 15,015 15,696 16,481
CWIP 1,388 1,388 1,388 1,457
Other Non current assets 9,021 9,052 9,088 9,542
Total Non Current Assets 29,464 29,982 30,802 32,342
Total assets 58,863 62,356 66,691 70,026
Creditors 1,823 2,032 2,278 2,392
Provisions 18,549 20,493 22,790 23,930
Total current liabilities 20,372 22,525 25,068 26,321
Other liabilities 422 422 422 443
Paid-up capital 2,121 2,121 2,121 2,227
Reserves & surplus 60,374 66,537 73,672 77,356
Shareholders’ equity 62,495 68,658 75,793 79,583
Total equity & liabilities 58,863 62,356 66,691 70,026
Source: Company, Axis Research
New Year Picks 2021 Jan 2021
9
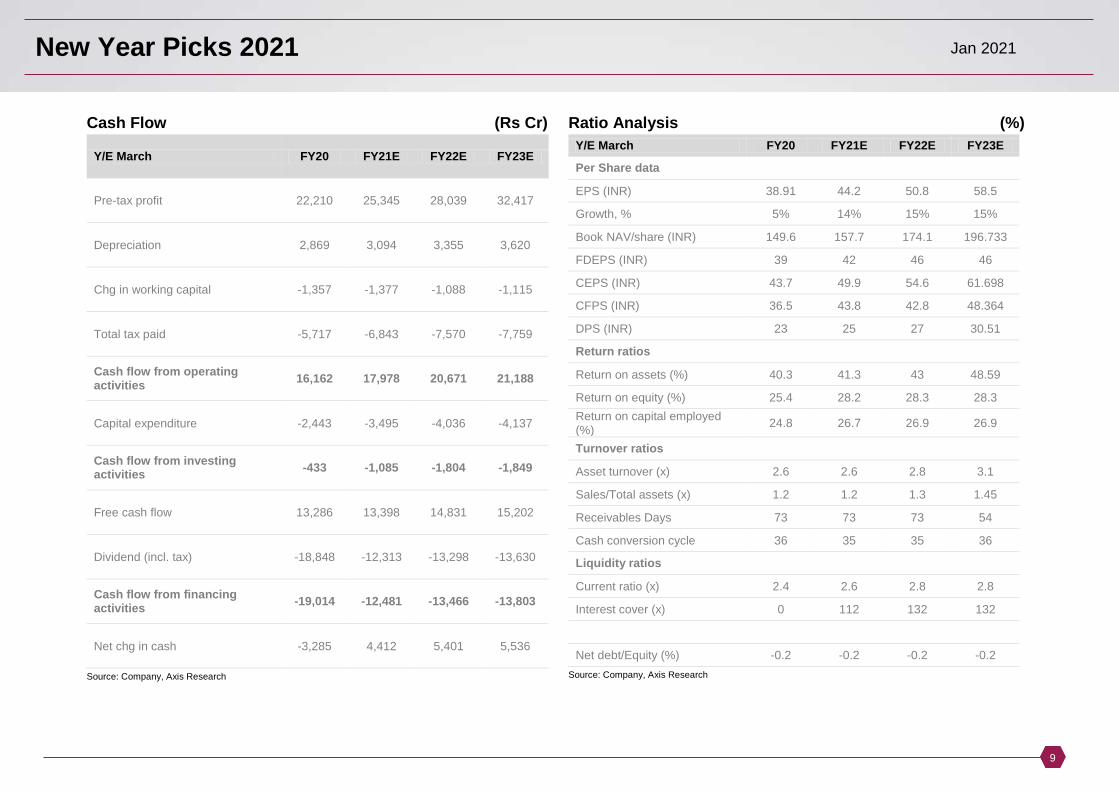
Cash Flow (Rs Cr)
Y/E March FY20 FY21E FY22E FY23E
Pre-tax profit 22,210 25,345 28,039 32,417
Depreciation 2,869 3,094 3,355 3,620
Chg in working capital -1,357 -1,377 -1,088 -1,115
Total tax paid -5,717 -6,843 -7,570 -7,759
Cash flow from operating activities
16,162 17,978 20,671 21,188
Capital expenditure -2,443 -3,495 -4,036 -4,137
Cash flow from investing activities
-433 -1,085 -1,804 -1,849
Free cash flow 13,286 13,398 14,831 15,202
Dividend (incl. tax) -18,848 -12,313 -13,298 -13,630
Cash flow from financing activities
-19,014 -12,481 -13,466 -13,803
Net chg in cash -3,285 4,412 5,401 5,536
Source: Company, Axis Research
Ratio Analysis (%)
Y/E March FY20 FY21E FY22E FY23E
Per Share data
EPS (INR) 38.91 44.2 50.8 58.5
Growth, % 5% 14% 15% 15%
Book NAV/share (INR) 149.6 157.7 174.1 196.733
FDEPS (INR) 39 42 46 46
CEPS (INR) 43.7 49.9 54.6 61.698
CFPS (INR) 36.5 43.8 42.8 48.364
DPS (INR) 23 25 27 30.51
Return ratios
Return on assets (%) 40.3 41.3 43 48.59
Return on equity (%) 25.4 28.2 28.3 28.3
Return on capital employed (%)
24.8 26.7 26.9 26.9
Turnover ratios
Asset turnover (x) 2.6 2.6 2.8 3.1
Sales/Total assets (x) 1.2 1.2 1.3 1.45
Receivables Days 73 73 73 54
Cash conversion cycle 36 35 35 36
Liquidity ratios
Current ratio (x) 2.4 2.6 2.8 2.8
Interest cover (x) 0 112 132 132
Net debt/Equity (%) -0.2 -0.2 -0.2 -0.2
Source: Company, Axis Research
New Year Picks 2021 Jan 2021
10
BHARTI AIRTEL LTD
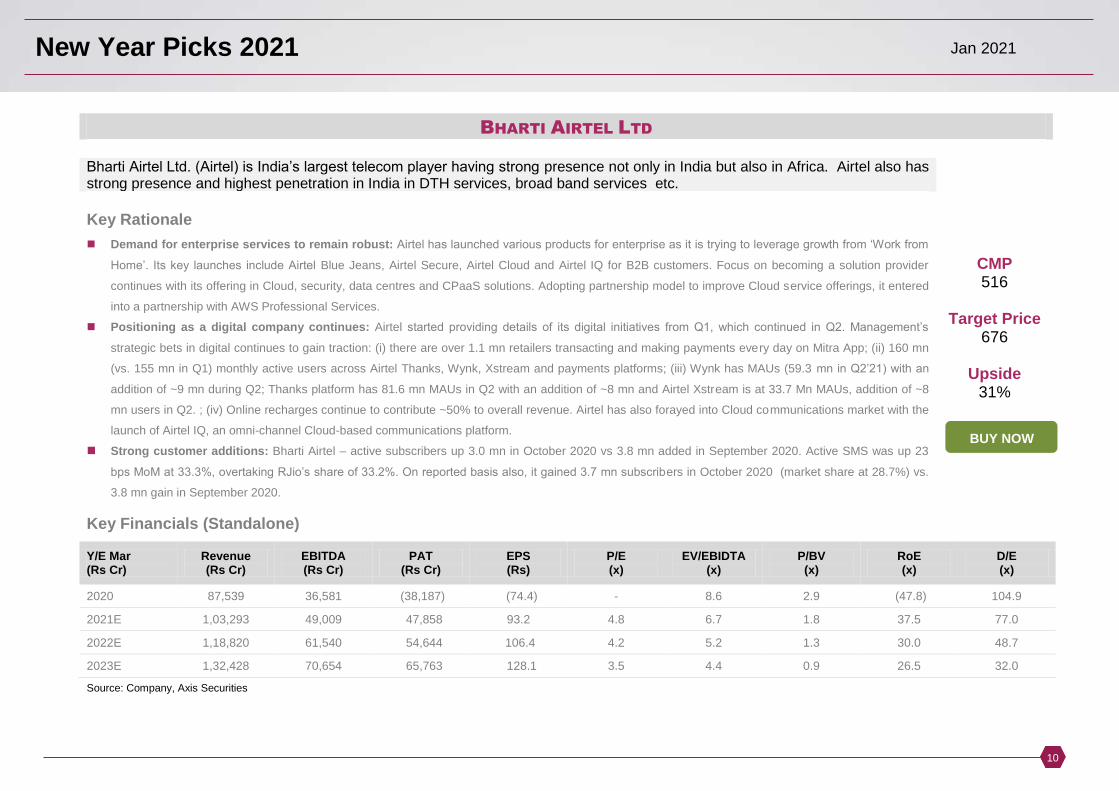
Bharti Airtel Ltd. (Airtel) is India’s largest telecom player having strong presence not only in India but also in Africa. Airtel also has strong presence and highest penetration in India in DTH services, broad band services etc.
Key Rationale
Demand for enterprise services to remain robust: Airtel has launched various products for enterprise as it is trying to leverage growth from ‘Work from
Home’. Its key launches include Airtel Blue Jeans, Airtel Secure, Airtel Cloud and Airtel IQ for B2B customers. Focus on becoming a solution provider
continues with its offering in Cloud, security, data centres and CPaaS solutions. Adopting partnership model to improve Cloud service offerings, it entered
into a partnership with AWS Professional Services.
Positioning as a digital company continues: Airtel started providing details of its digital initiatives from Q1, which continued in Q2. Management’s
strategic bets in digital continues to gain traction: (i) there are over 1.1 mn retailers transacting and making payments every day on Mitra App; (ii) 160 mn
(vs. 155 mn in Q1) monthly active users across Airtel Thanks, Wynk, Xstream and payments platforms; (iii) Wynk has MAUs (59.3 mn in Q2’21) with an
addition of ~9 mn during Q2; Thanks platform has 81.6 mn MAUs in Q2 with an addition of ~8 mn and Airtel Xstream is at 33.7 Mn MAUs, addition of ~8
mn users in Q2. ; (iv) Online recharges continue to contribute ~50% to overall revenue. Airtel has also forayed into Cloud communications market with the
launch of Airtel IQ, an omni-channel Cloud-based communications platform.
Strong customer additions: Bharti Airtel – active subscribers up 3.0 mn in October 2020 vs 3.8 mn added in September 2020. Active SMS was up 23
bps MoM at 33.3%, overtaking RJio’s share of 33.2%. On reported basis also, it gained 3.7 mn subscribers in October 2020 (market share at 28.7%) vs.
3.8 mn gain in September 2020.
CMP 516
Target Price
676
Upside 31%
Key Financials (Standalone)
Y/E Mar (Rs Cr)
Revenue (Rs Cr)
EBITDA (Rs Cr)
PAT (Rs Cr)
EPS (Rs)
P/E (x)
EV/EBIDTA (x)
P/BV (x)
RoE (x)
D/E (x)
2020 87,539 36,581 (38,187) (74.4) - 8.6 2.9 (47.8) 104.9
2021E 1,03,293 49,009 47,858 93.2 4.8 6.7 1.8 37.5 77.0
2022E 1,18,820 61,540 54,644 106.4 4.2 5.2 1.3 30.0 48.7
2023E 1,32,428 70,654 65,763 128.1 3.5 4.4 0.9 26.5 32.0
Source: Company, Axis Securities
BUY NOW
New Year Picks 2021 Jan 2021
11
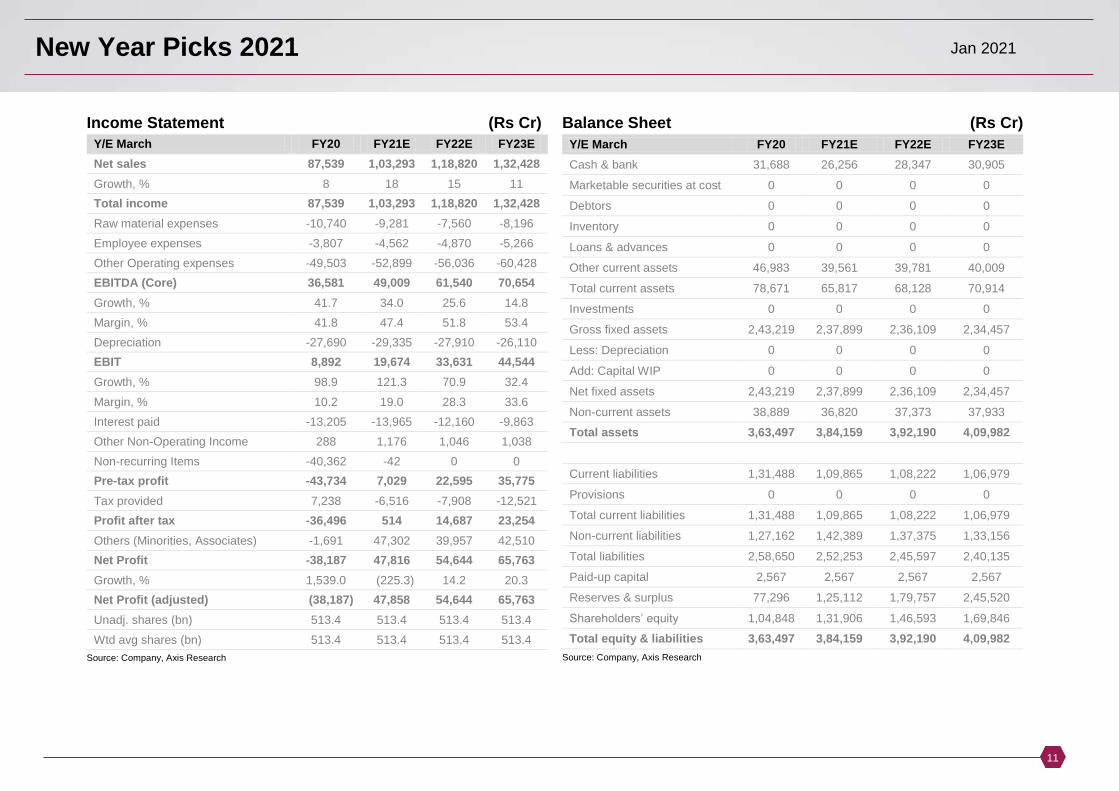
Income Statement (Rs Cr)
Y/E March FY20 FY21E FY22E FY23E
Net sales 87,539 1,03,293 1,18,820 1,32,428
Growth, % 8 18 15 11
Total income 87,539 1,03,293 1,18,820 1,32,428
Raw material expenses -10,740 -9,281 -7,560 -8,196
Employee expenses -3,807 -4,562 -4,870 -5,266
Other Operating expenses -49,503 -52,899 -56,036 -60,428
EBITDA (Core) 36,581 49,009 61,540 70,654
Growth, % 41.7 34.0 25.6 14.8
Margin, % 41.8 47.4 51.8 53.4
Depreciation -27,690 -29,335 -27,910 -26,110
EBIT 8,892 19,674 33,631 44,544
Growth, % 98.9 121.3 70.9 32.4
Margin, % 10.2 19.0 28.3 33.6
Interest paid -13,205 -13,965 -12,160 -9,863
Other Non-Operating Income 288 1,176 1,046 1,038
Non-recurring Items -40,362 -42 0 0
Pre-tax profit -43,734 7,029 22,595 35,775
Tax provided 7,238 -6,516 -7,908 -12,521
Profit after tax -36,496 514 14,687 23,254
Others (Minorities, Associates) -1,691 47,302 39,957 42,510
Net Profit -38,187 47,816 54,644 65,763
Growth, % 1,539.0 (225.3) 14.2 20.3
Net Profit (adjusted) (38,187) 47,858 54,644 65,763
Unadj. shares (bn) 513.4 513.4 513.4 513.4
Wtd avg shares (bn) 513.4 513.4 513.4 513.4
Source: Company, Axis Research
Balance Sheet (Rs Cr)
Y/E March FY20 FY21E FY22E FY23E
Cash & bank 31,688 26,256 28,347 30,905 Marketable securities at cost 0 0 0 0 Debtors 0 0 0 0 Inventory 0 0 0 0 Loans & advances 0 0 0 0 Other current assets 46,983 39,561 39,781 40,009 Total current assets 78,671 65,817 68,128 70,914 Investments 0 0 0 0 Gross fixed assets 2,43,219 2,37,899 2,36,109 2,34,457 Less: Depreciation 0 0 0 0 Add: Capital WIP 0 0 0 0 Net fixed assets 2,43,219 2,37,899 2,36,109 2,34,457 Non-current assets 38,889 36,820 37,373 37,933 Total assets 3,63,497 3,84,159 3,92,190 4,09,982 Current liabilities 1,31,488 1,09,865 1,08,222 1,06,979 Provisions 0 0 0 0 Total current liabilities 1,31,488 1,09,865 1,08,222 1,06,979 Non-current liabilities 1,27,162 1,42,389 1,37,375 1,33,156 Total liabilities 2,58,650 2,52,253 2,45,597 2,40,135 Paid-up capital 2,567 2,567 2,567 2,567 Reserves & surplus 77,296 1,25,112 1,79,757 2,45,520 Shareholders’ equity 1,04,848 1,31,906 1,46,593 1,69,846 Total equity & liabilities 3,63,497 3,84,159 3,92,190 4,09,982
Source: Company, Axis Research
New Year Picks 2021 Jan 2021
12
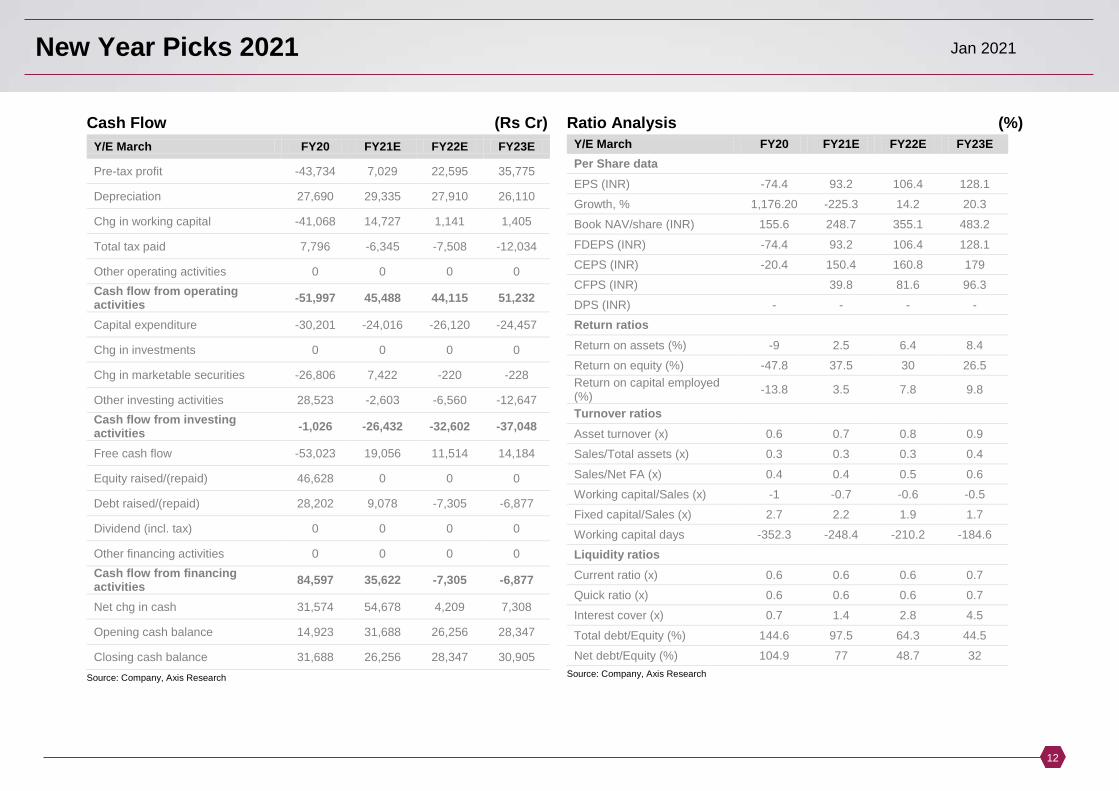
Cash Flow (Rs Cr)
Y/E March FY20 FY21E FY22E FY23E
Pre-tax profit -43,734 7,029 22,595 35,775
Depreciation 27,690 29,335 27,910 26,110
Chg in working capital -41,068 14,727 1,141 1,405
Total tax paid 7,796 -6,345 -7,508 -12,034
Other operating activities 0 0 0 0
Cash flow from operating activities
-51,997 45,488 44,115 51,232
Capital expenditure -30,201 -24,016 -26,120 -24,457
Chg in investments 0 0 0 0
Chg in marketable securities -26,806 7,422 -220 -228
Other investing activities 28,523 -2,603 -6,560 -12,647
Cash flow from investing activities
-1,026 -26,432 -32,602 -37,048
Free cash flow -53,023 19,056 11,514 14,184
Equity raised/(repaid) 46,628 0 0 0
Debt raised/(repaid) 28,202 9,078 -7,305 -6,877
Dividend (incl. tax) 0 0 0 0
Other financing activities 0 0 0 0
Cash flow from financing activities
84,597 35,622 -7,305 -6,877
Net chg in cash 31,574 54,678 4,209 7,308
Opening cash balance 14,923 31,688 26,256 28,347
Closing cash balance 31,688 26,256 28,347 30,905
Source: Company, Axis Research
Ratio Analysis (%)
Y/E March FY20 FY21E FY22E FY23E
Per Share data
EPS (INR) -74.4 93.2 106.4 128.1
Growth, % 1,176.20 -225.3 14.2 20.3
Book NAV/share (INR) 155.6 248.7 355.1 483.2
FDEPS (INR) -74.4 93.2 106.4 128.1
CEPS (INR) -20.4 150.4 160.8 179
CFPS (INR)
39.8 81.6 96.3
DPS (INR) - - - -
Return ratios
Return on assets (%) -9 2.5 6.4 8.4
Return on equity (%) -47.8 37.5 30 26.5
Return on capital employed (%)
-13.8 3.5 7.8 9.8
Turnover ratios
Asset turnover (x) 0.6 0.7 0.8 0.9
Sales/Total assets (x) 0.3 0.3 0.3 0.4
Sales/Net FA (x) 0.4 0.4 0.5 0.6
Working capital/Sales (x) -1 -0.7 -0.6 -0.5
Fixed capital/Sales (x) 2.7 2.2 1.9 1.7
Working capital days -352.3 -248.4 -210.2 -184.6
Liquidity ratios
Current ratio (x) 0.6 0.6 0.6 0.7
Quick ratio (x) 0.6 0.6 0.6 0.7
Interest cover (x) 0.7 1.4 2.8 4.5
Total debt/Equity (%) 144.6 97.5 64.3 44.5
Net debt/Equity (%) 104.9 77 48.7 32
Source: Company, Axis Research
New Year Picks 2021 Jan 2021
13
RELAXO FOOTWEAR LTD
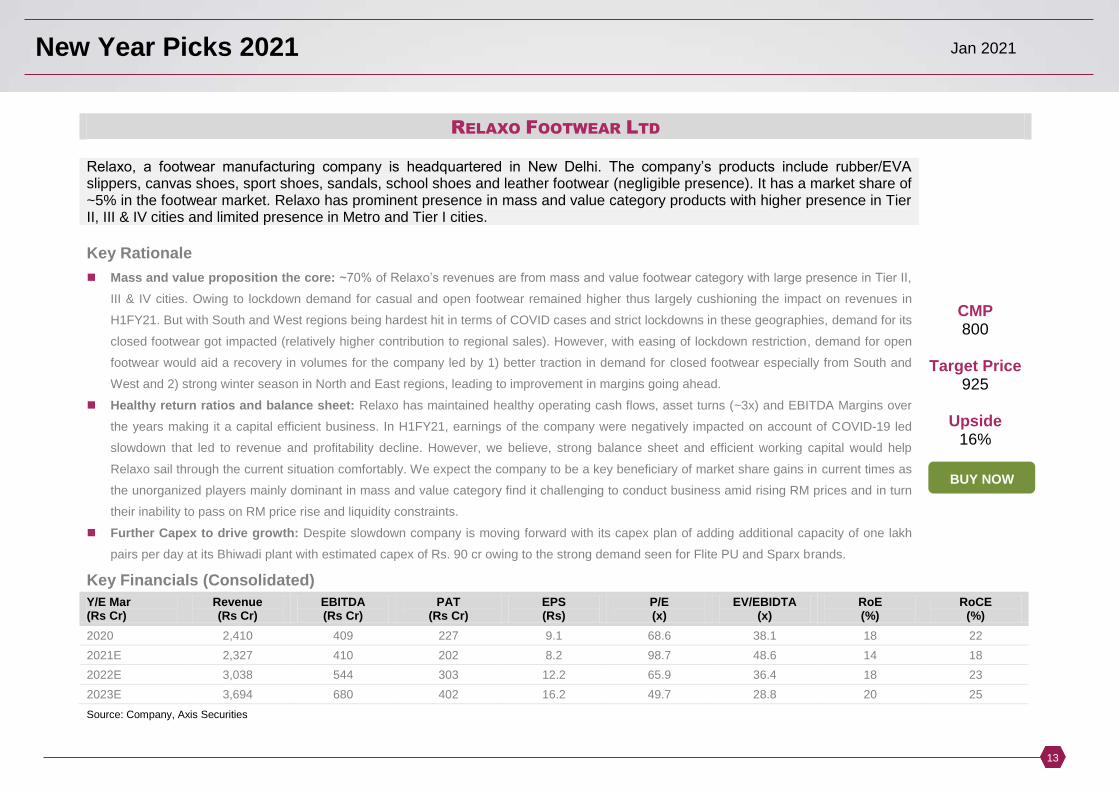
Relaxo, a footwear manufacturing company is headquartered in New Delhi. The company’s products include rubber/EVA slippers, canvas shoes, sport shoes, sandals, school shoes and leather footwear (negligible presence). It has a market share of ~5% in the footwear market. Relaxo has prominent presence in mass and value category products with higher presence in Tier II, III & IV cities and limited presence in Metro and Tier I cities.
Key Rationale
Mass and value proposition the core: ~70% of Relaxo’s revenues are from mass and value footwear category with large presence in Tier II,
III & IV cities. Owing to lockdown demand for casual and open footwear remained higher thus largely cushioning the impact on revenues in
H1FY21. But with South and West regions being hardest hit in terms of COVID cases and strict lockdowns in these geographies, demand for its
closed footwear got impacted (relatively higher contribution to regional sales). However, with easing of lockdown restriction, demand for open
footwear would aid a recovery in volumes for the company led by 1) better traction in demand for closed footwear especially from South and
West and 2) strong winter season in North and East regions, leading to improvement in margins going ahead.
Healthy return ratios and balance sheet: Relaxo has maintained healthy operating cash flows, asset turns (~3x) and EBITDA Margins over
the years making it a capital efficient business. In H1FY21, earnings of the company were negatively impacted on account of COVID-19 led
slowdown that led to revenue and profitability decline. However, we believe, strong balance sheet and efficient working capital would help
Relaxo sail through the current situation comfortably. We expect the company to be a key beneficiary of market share gains in current times as
the unorganized players mainly dominant in mass and value category find it challenging to conduct business amid rising RM prices and in turn
their inability to pass on RM price rise and liquidity constraints.
Further Capex to drive growth: Despite slowdown company is moving forward with its capex plan of adding additional capacity of one lakh
pairs per day at its Bhiwadi plant with estimated capex of Rs. 90 cr owing to the strong demand seen for Flite PU and Sparx brands.
CMP 800
Target Price
925
Upside 16%
Key Financials (Consolidated)
Y/E Mar (Rs Cr)
Revenue (Rs Cr)
EBITDA (Rs Cr)
PAT (Rs Cr)
EPS (Rs)
P/E (x)
EV/EBIDTA (x)
RoE (%)
RoCE (%)
2020 2,410 409 227 9.1 68.6 38.1 18 22 2021E 2,327 410 202 8.2 98.7 48.6 14 18 2022E 3,038 544 303 12.2 65.9 36.4 18 23 2023E 3,694 680 402 16.2 49.7 28.8 20 25 Source: Company, Axis Securities
BUY NOW
New Year Picks 2021 Jan 2021
14
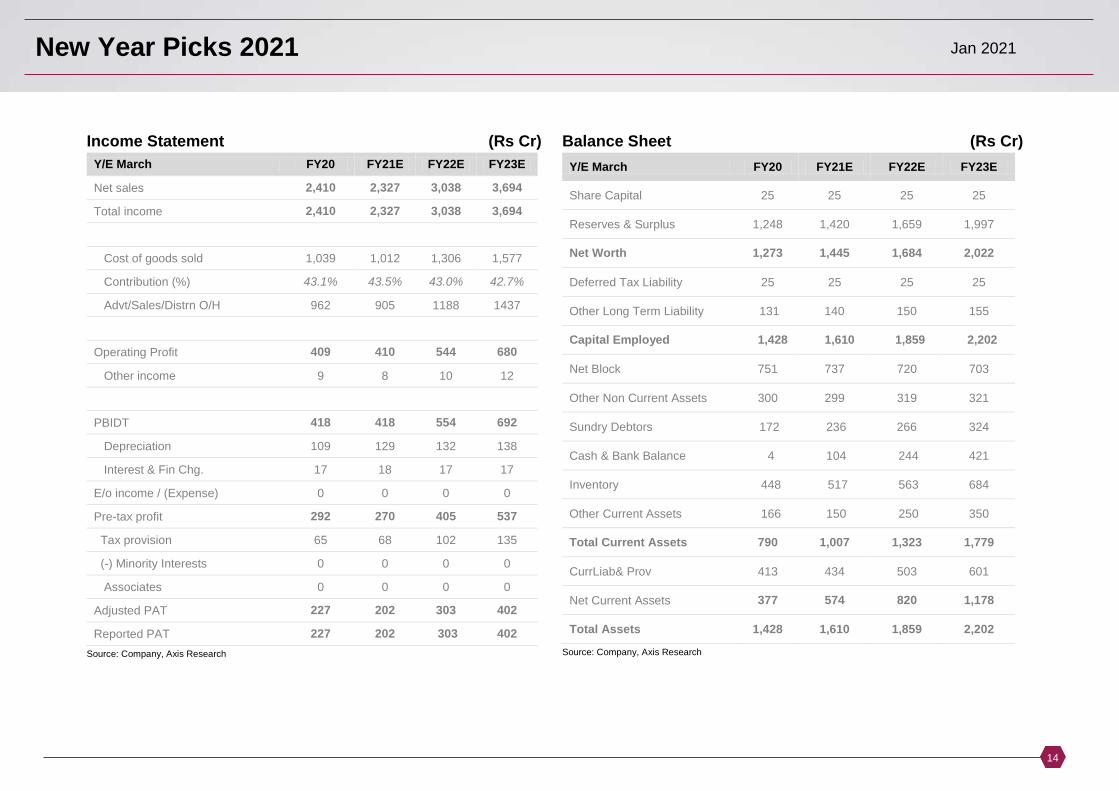
Income Statement (Rs Cr)
Y/E March FY20 FY21E FY22E FY23E
Net sales 2,410 2,327 3,038 3,694
Total income 2,410 2,327 3,038 3,694
Cost of goods sold 1,039 1,012 1,306 1,577
Contribution (%) 43.1% 43.5% 43.0% 42.7%
Advt/Sales/Distrn O/H 962 905 1188 1437
Operating Profit 409 410 544 680
Other income 9 8 10 12
PBIDT 418 418 554 692
Depreciation 109 129 132 138
Interest & Fin Chg. 17 18 17 17
E/o income / (Expense) 0 0 0 0
Pre-tax profit 292 270 405 537
Tax provision 65 68 102 135
(-) Minority Interests 0 0 0 0
Associates 0 0 0 0
Adjusted PAT 227 202 303 402
Reported PAT 227 202 303 402
Source: Company, Axis Research
Balance Sheet (Rs Cr)
Y/E March FY20 FY21E FY22E FY23E
Share Capital 25 25 25 25
Reserves & Surplus 1,248 1,420 1,659 1,997
Net Worth 1,273 1,445 1,684 2,022
Deferred Tax Liability 25 25 25 25
Other Long Term Liability 131 140 150 155
Capital Employed 1,428 1,610 1,859 2,202
Net Block 751 737 720 703
Other Non Current Assets 300 299 319 321
Sundry Debtors 172 236 266 324
Cash & Bank Balance 4 104 244 421
Inventory 448 517 563 684
Other Current Assets 166 150 250 350
Total Current Assets 790 1,007 1,323 1,779
CurrLiab& Prov 413 434 503 601
Net Current Assets 377 574 820 1,178
Total Assets 1,428 1,610 1,859 2,202
Source: Company, Axis Research
New Year Picks 2021 Jan 2021
15
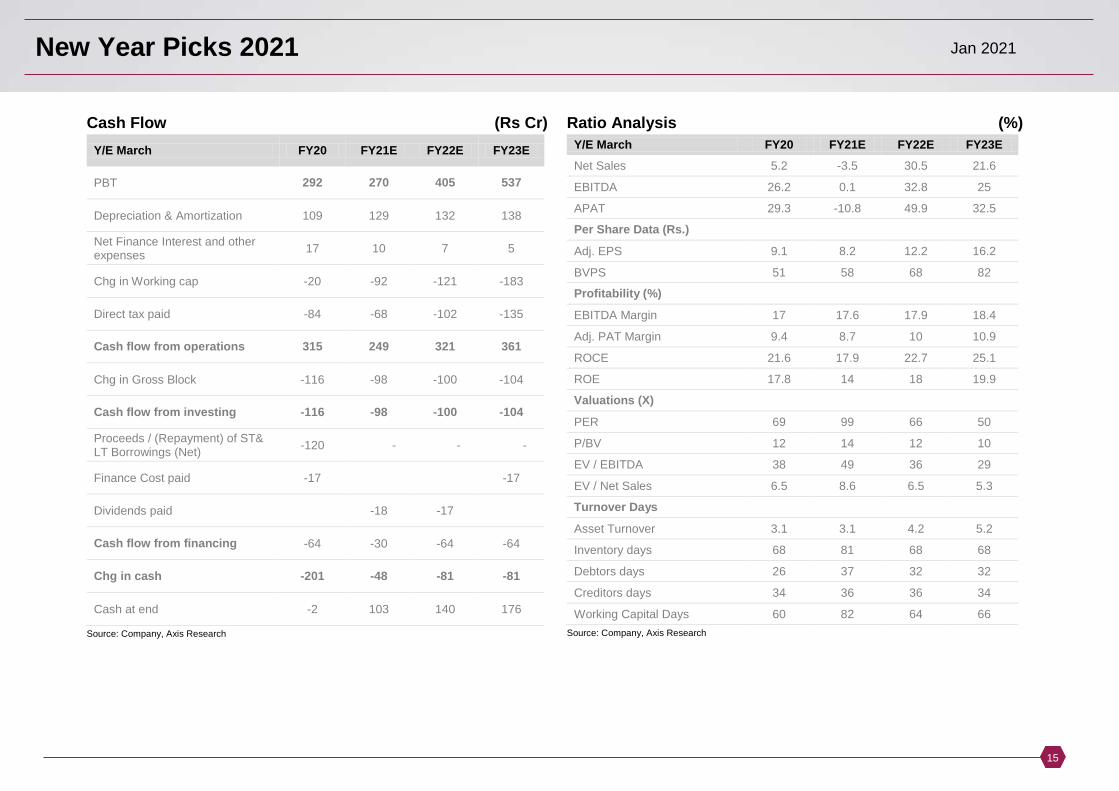
Cash Flow (Rs Cr)
Y/E March FY20 FY21E FY22E FY23E
PBT 292 270 405 537
Depreciation & Amortization 109 129 132 138
Net Finance Interest and other expenses
17 10 7 5
Chg in Working cap -20 -92 -121 -183
Direct tax paid -84 -68 -102 -135
Cash flow from operations 315 249 321 361
Chg in Gross Block -116 -98 -100 -104
Cash flow from investing -116 -98 -100 -104
Proceeds / (Repayment) of ST& LT Borrowings (Net)
-120 - - -
Finance Cost paid -17
-17
Dividends paid
-18 -17
Cash flow from financing -64 -30 -64 -64
Chg in cash -201 -48 -81 -81
Cash at end -2 103 140 176
Source: Company, Axis Research
Ratio Analysis (%)
Y/E March FY20 FY21E FY22E FY23E
Net Sales 5.2 -3.5 30.5 21.6
EBITDA 26.2 0.1 32.8 25
APAT 29.3 -10.8 49.9 32.5
Per Share Data (Rs.)
Adj. EPS 9.1 8.2 12.2 16.2
BVPS 51 58 68 82
Profitability (%)
EBITDA Margin 17 17.6 17.9 18.4
Adj. PAT Margin 9.4 8.7 10 10.9
ROCE 21.6 17.9 22.7 25.1
ROE 17.8 14 18 19.9
Valuations (X)
PER 69 99 66 50
P/BV 12 14 12 10
EV / EBITDA 38 49 36 29
EV / Net Sales 6.5 8.6 6.5 5.3
Turnover Days
Asset Turnover 3.1 3.1 4.2 5.2
Inventory days 68 81 68 68
Debtors days 26 37 32 32
Creditors days 34 36 36 34
Working Capital Days 60 82 64 66
Source: Company, Axis Research
New Year Picks 2021 Jan 2021
16
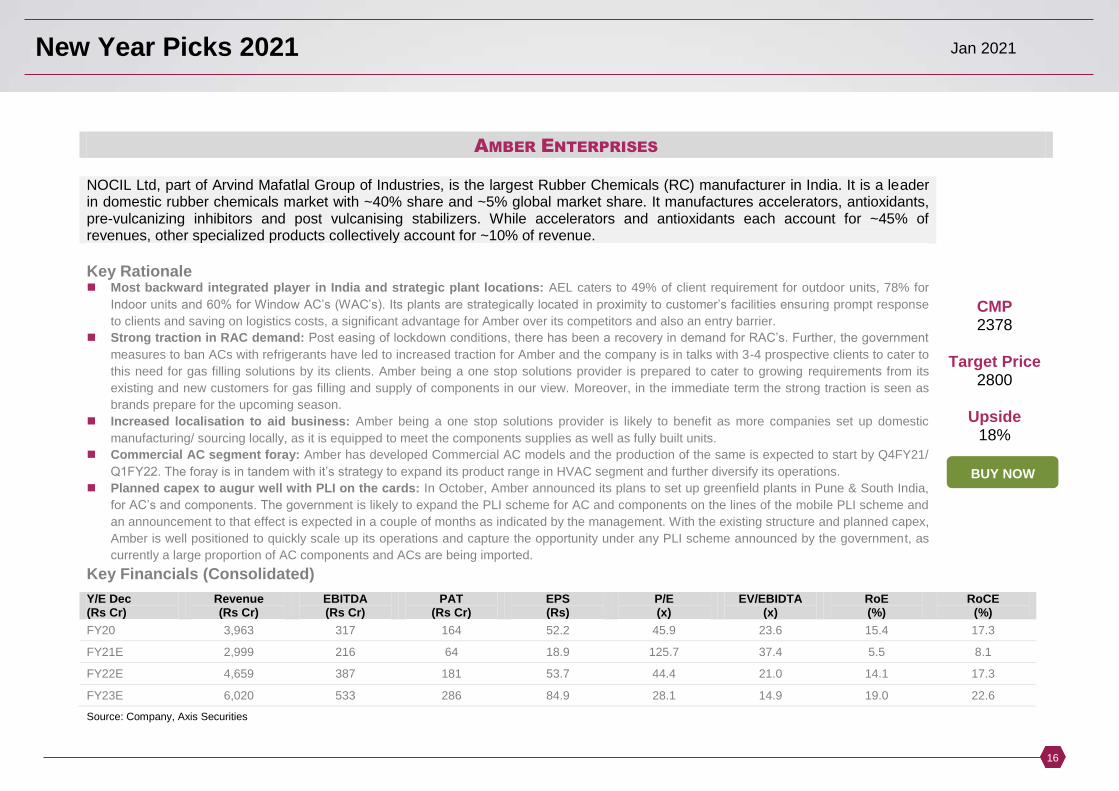
AMBER ENTERPRISES
NOCIL Ltd, part of Arvind Mafatlal Group of Industries, is the largest Rubber Chemicals (RC) manufacturer in India. It is a leader in domestic rubber chemicals market with ~40% share and ~5% global market share. It manufactures accelerators, antioxidants, pre-vulcanizing inhibitors and post vulcanising stabilizers. While accelerators and antioxidants each account for ~45% of revenues, other specialized products collectively account for ~10% of revenue.
Key Rationale Most backward integrated player in India and strategic plant locations: AEL caters to 49% of client requirement for outdoor units, 78% for
Indoor units and 60% for Window AC’s (WAC’s). Its plants are strategically located in proximity to customer’s facilities ensuring prompt response
to clients and saving on logistics costs, a significant advantage for Amber over its competitors and also an entry barrier.
Strong traction in RAC demand: Post easing of lockdown conditions, there has been a recovery in demand for RAC’s. Further, the government
measures to ban ACs with refrigerants have led to increased traction for Amber and the company is in talks with 3-4 prospective clients to cater to
this need for gas filling solutions by its clients. Amber being a one stop solutions provider is prepared to cater to growing requirements from its
existing and new customers for gas filling and supply of components in our view. Moreover, in the immediate term the strong traction is seen as
brands prepare for the upcoming season.
Increased localisation to aid business: Amber being a one stop solutions provider is likely to benefit as more companies set up domestic
manufacturing/ sourcing locally, as it is equipped to meet the components supplies as well as fully built units.
Commercial AC segment foray: Amber has developed Commercial AC models and the production of the same is expected to start by Q4FY21/
Q1FY22. The foray is in tandem with it’s strategy to expand its product range in HVAC segment and further diversify its operations.
Planned capex to augur well with PLI on the cards: In October, Amber announced its plans to set up greenfield plants in Pune & South India,
for AC’s and components. The government is likely to expand the PLI scheme for AC and components on the lines of the mobile PLI scheme and
an announcement to that effect is expected in a couple of months as indicated by the management. With the existing structure and planned capex,
Amber is well positioned to quickly scale up its operations and capture the opportunity under any PLI scheme announced by the government, as
currently a large proportion of AC components and ACs are being imported.
CMP 2378
Target Price
2800
Upside 18%
Key Financials (Consolidated)
Y/E Dec (Rs Cr)
Revenue (Rs Cr)
EBITDA (Rs Cr)
PAT (Rs Cr)
EPS (Rs)
P/E (x)
EV/EBIDTA (x)
RoE (%)
RoCE (%)
FY20 3,963 317 164 52.2 45.9 23.6 15.4 17.3
FY21E 2,999 216 64 18.9 125.7 37.4 5.5 8.1
FY22E 4,659 387 181 53.7 44.4 21.0 14.1 17.3
FY23E 6,020 533 286 84.9 28.1 14.9 19.0 22.6
Source: Company, Axis Securities
BUY NOW
New Year Picks 2021 Jan 2021
17
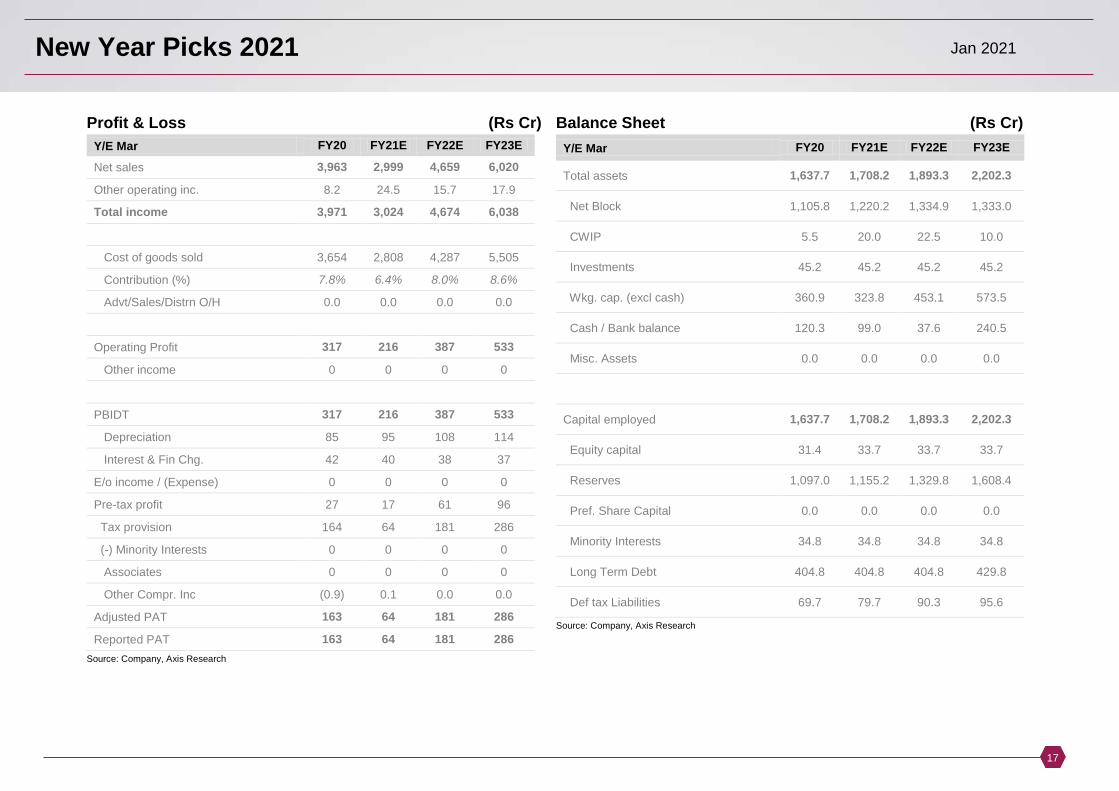
Profit & Loss (Rs Cr)
Y/E Mar FY20 FY21E FY22E FY23E
Net sales 3,963 2,999 4,659 6,020
Other operating inc. 8.2 24.5 15.7 17.9
Total income 3,971 3,024 4,674 6,038
Cost of goods sold 3,654 2,808 4,287 5,505
Contribution (%) 7.8% 6.4% 8.0% 8.6%
Advt/Sales/Distrn O/H 0.0 0.0 0.0 0.0
Operating Profit 317 216 387 533
Other income 0 0 0 0
PBIDT 317 216 387 533
Depreciation 85 95 108 114
Interest & Fin Chg. 42 40 38 37
E/o income / (Expense) 0 0 0 0
Pre-tax profit 27 17 61 96
Tax provision 164 64 181 286
(-) Minority Interests 0 0 0 0
Associates 0 0 0 0
Other Compr. Inc (0.9) 0.1 0.0 0.0
Adjusted PAT 163 64 181 286
Reported PAT 163 64 181 286
Source: Company, Axis Research
Balance Sheet (Rs Cr)
Y/E Mar FY20 FY21E FY22E FY23E
Total assets 1,637.7 1,708.2 1,893.3 2,202.3
Net Block 1,105.8 1,220.2 1,334.9 1,333.0
CWIP 5.5 20.0 22.5 10.0
Investments 45.2 45.2 45.2 45.2
Wkg. cap. (excl cash) 360.9 323.8 453.1 573.5
Cash / Bank balance 120.3 99.0 37.6 240.5
Misc. Assets 0.0 0.0 0.0 0.0
Capital employed 1,637.7 1,708.2 1,893.3 2,202.3
Equity capital 31.4 33.7 33.7 33.7
Reserves 1,097.0 1,155.2 1,329.8 1,608.4
Pref. Share Capital 0.0 0.0 0.0 0.0
Minority Interests 34.8 34.8 34.8 34.8
Long Term Debt 404.8 404.8 404.8 429.8
Def tax Liabilities 69.7 79.7 90.3 95.6
Source: Company, Axis Research
New Year Picks 2021 Jan 2021
18
Cash Flow (Rs Cr)
Y/E Mar FY20 FY21E FY22E FY23E
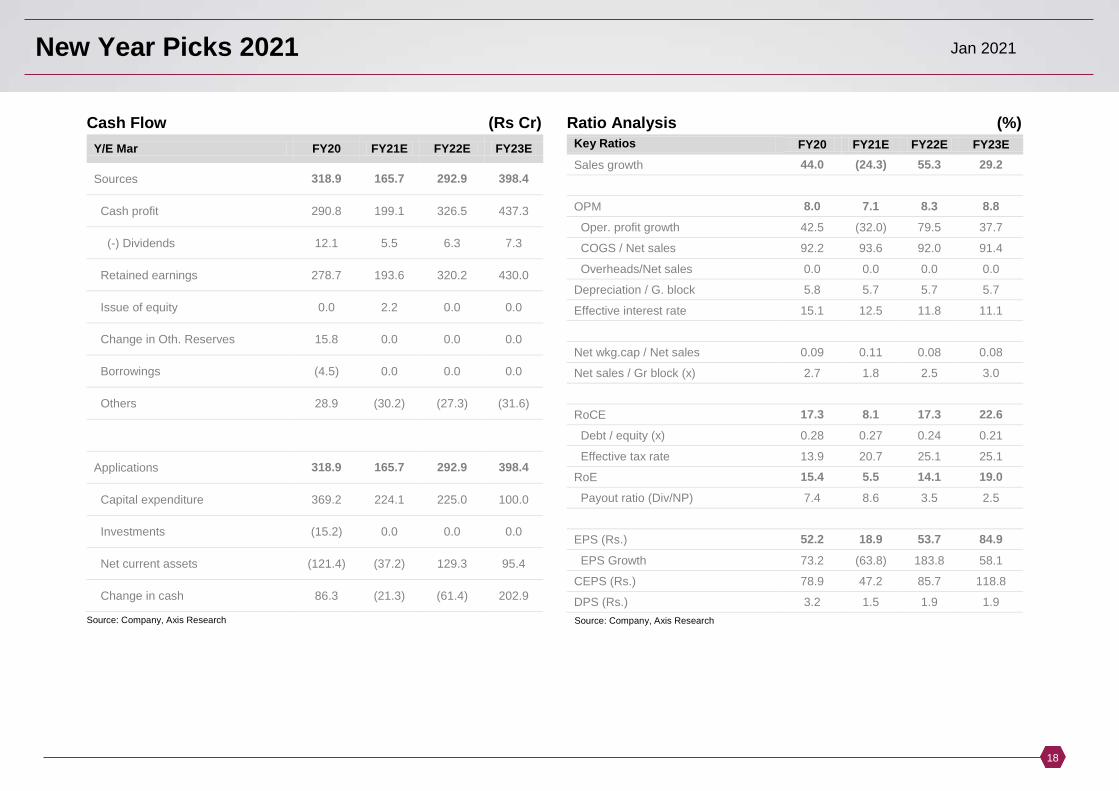
Sources 318.9 165.7 292.9 398.4
Cash profit 290.8 199.1 326.5 437.3
(-) Dividends 12.1 5.5 6.3 7.3
Retained earnings 278.7 193.6 320.2 430.0
Issue of equity 0.0 2.2 0.0 0.0 Change in Oth. Reserves 15.8 0.0 0.0 0.0
Borrowings (4.5) 0.0 0.0 0.0
Others 28.9 (30.2) (27.3) (31.6)
Applications 318.9 165.7 292.9 398.4
Capital expenditure 369.2 224.1 225.0 100.0 Investments (15.2) 0.0 0.0 0.0
Net current assets (121.4) (37.2) 129.3 95.4
Change in cash 86.3 (21.3) (61.4) 202.9 Source: Company, Axis Research
Ratio Analysis (%)
Key Ratios FY20 FY21E FY22E FY23E
Sales growth 44.0 (24.3) 55.3 29.2
OPM 8.0 7.1 8.3 8.8
Oper. profit growth 42.5 (32.0) 79.5 37.7
COGS / Net sales 92.2 93.6 92.0 91.4
Overheads/Net sales 0.0 0.0 0.0 0.0
Depreciation / G. block 5.8 5.7 5.7 5.7
Effective interest rate 15.1 12.5 11.8 11.1
Net wkg.cap / Net sales 0.09 0.11 0.08 0.08
Net sales / Gr block (x) 2.7 1.8 2.5 3.0
RoCE 17.3 8.1 17.3 22.6
Debt / equity (x) 0.28 0.27 0.24 0.21
Effective tax rate 13.9 20.7 25.1 25.1
RoE 15.4 5.5 14.1 19.0
Payout ratio (Div/NP) 7.4 8.6 3.5 2.5
EPS (Rs.) 52.2 18.9 53.7 84.9
EPS Growth 73.2 (63.8) 183.8 58.1
CEPS (Rs.) 78.9 47.2 85.7 118.8
DPS (Rs.) 3.2 1.5 1.9 1.9
Source: Company, Axis Research
New Year Picks 2021 Jan 2021
19
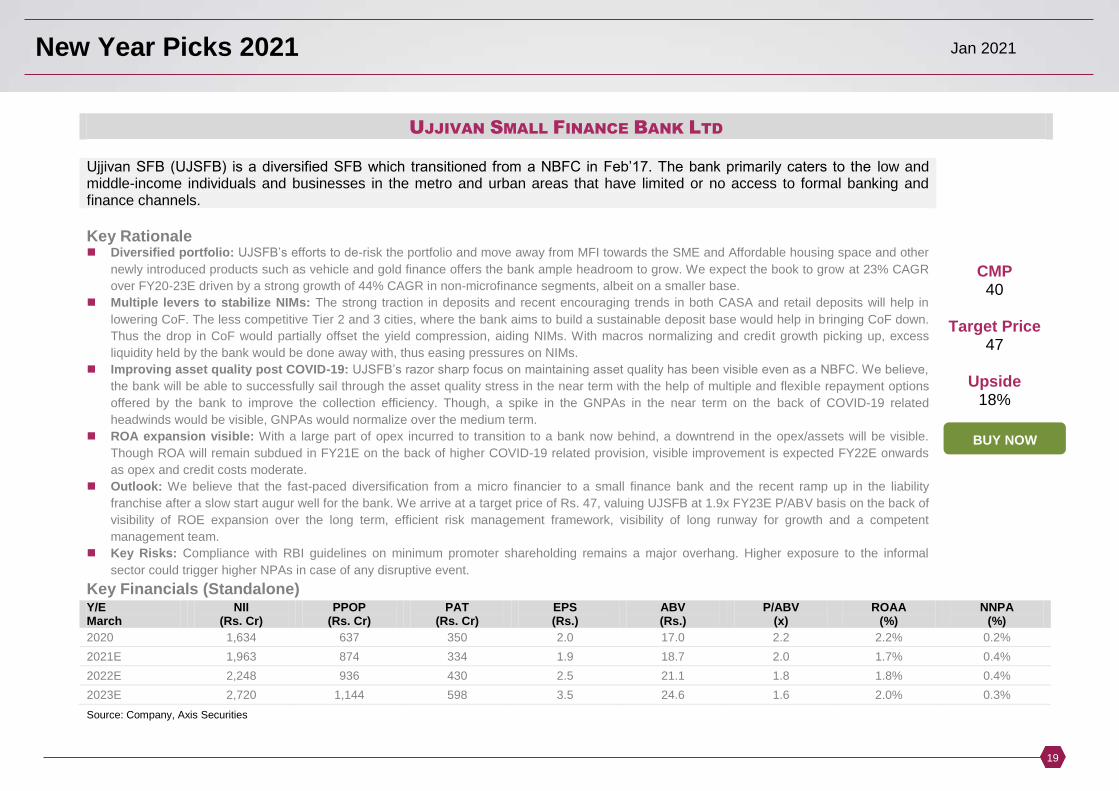
UJJIVAN SMALL FINANCE BANK LTD
Ujjivan SFB (UJSFB) is a diversified SFB which transitioned from a NBFC in Feb’17. The bank primarily caters to the low and middle-income individuals and businesses in the metro and urban areas that have limited or no access to formal banking and finance channels.
Key Rationale Diversified portfolio: UJSFB’s efforts to de-risk the portfolio and move away from MFI towards the SME and Affordable housing space and other
newly introduced products such as vehicle and gold finance offers the bank ample headroom to grow. We expect the book to grow at 23% CAGR
over FY20-23E driven by a strong growth of 44% CAGR in non-microfinance segments, albeit on a smaller base.
Multiple levers to stabilize NIMs: The strong traction in deposits and recent encouraging trends in both CASA and retail deposits will help in
lowering CoF. The less competitive Tier 2 and 3 cities, where the bank aims to build a sustainable deposit base would help in bringing CoF down.
Thus the drop in CoF would partially offset the yield compression, aiding NIMs. With macros normalizing and credit growth picking up, excess
liquidity held by the bank would be done away with, thus easing pressures on NIMs.
Improving asset quality post COVID-19: UJSFB’s razor sharp focus on maintaining asset quality has been visible even as a NBFC. We believe,
the bank will be able to successfully sail through the asset quality stress in the near term with the help of multiple and flexible repayment options
offered by the bank to improve the collection efficiency. Though, a spike in the GNPAs in the near term on the back of COVID-19 related
headwinds would be visible, GNPAs would normalize over the medium term.
ROA expansion visible: With a large part of opex incurred to transition to a bank now behind, a downtrend in the opex/assets will be visible.
Though ROA will remain subdued in FY21E on the back of higher COVID-19 related provision, visible improvement is expected FY22E onwards
as opex and credit costs moderate.
Outlook: We believe that the fast-paced diversification from a micro financier to a small finance bank and the recent ramp up in the liability
franchise after a slow start augur well for the bank. We arrive at a target price of Rs. 47, valuing UJSFB at 1.9x FY23E P/ABV basis on the back of
visibility of ROE expansion over the long term, efficient risk management framework, visibility of long runway for growth and a competent
management team.
Key Risks: Compliance with RBI guidelines on minimum promoter shareholding remains a major overhang. Higher exposure to the informal
sector could trigger higher NPAs in case of any disruptive event.
CMP 40
Target Price
47
Upside 18%
Key Financials (Standalone) Y/E March
NII (Rs. Cr)
PPOP (Rs. Cr)
PAT (Rs. Cr)
EPS (Rs.)
ABV (Rs.)
P/ABV (x)
ROAA (%)
NNPA (%)
2020 1,634 637 350 2.0 17.0 2.2 2.2% 0.2% 2021E 1,963 874 334 1.9 18.7 2.0 1.7% 0.4% 2022E 2,248 936 430 2.5 21.1 1.8 1.8% 0.4% 2023E 2,720 1,144 598 3.5 24.6 1.6 2.0% 0.3% Source: Company, Axis Securities
BUY NOW
New Year Picks 2021 Jan 2021
20
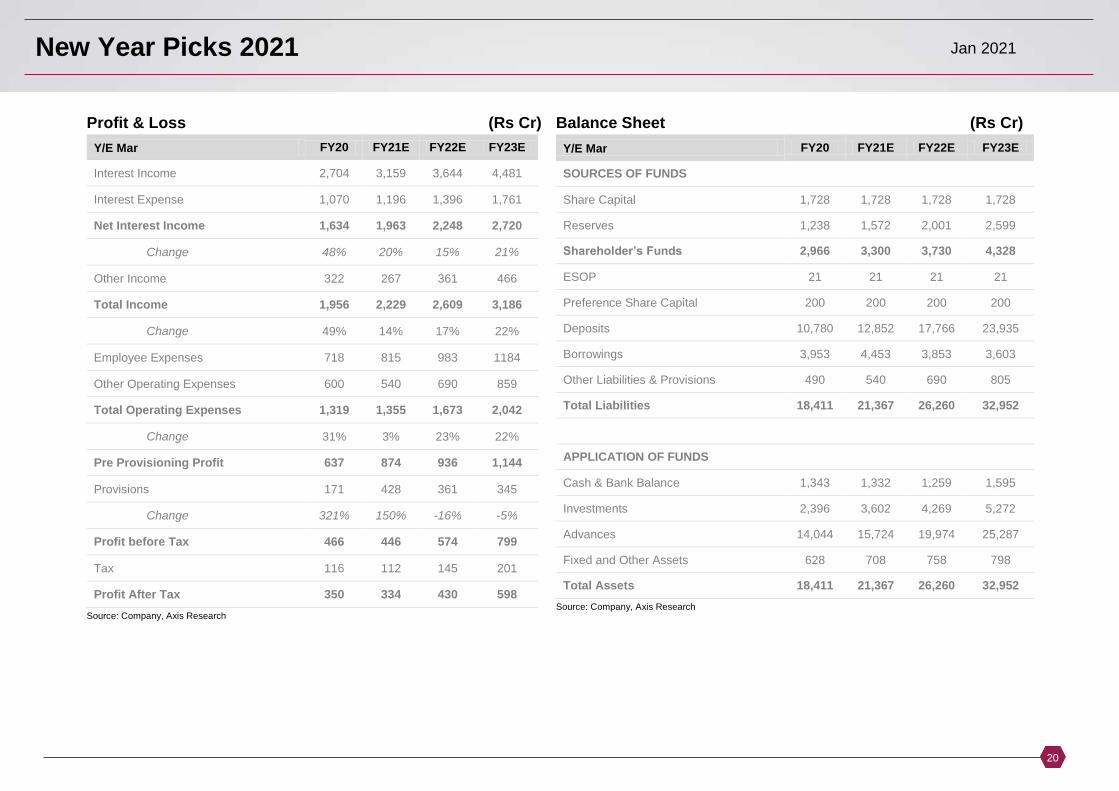
Profit & Loss (Rs Cr)
Y/E Mar FY20 FY21E FY22E FY23E
Interest Income 2,704 3,159 3,644 4,481
Interest Expense 1,070 1,196 1,396 1,761
Net Interest Income 1,634 1,963 2,248 2,720
Change 48% 20% 15% 21%
Other Income 322 267 361 466
Total Income 1,956 2,229 2,609 3,186
Change 49% 14% 17% 22%
Employee Expenses 718 815 983 1184
Other Operating Expenses 600 540 690 859
Total Operating Expenses 1,319 1,355 1,673 2,042
Change 31% 3% 23% 22%
Pre Provisioning Profit 637 874 936 1,144
Provisions 171 428 361 345
Change 321% 150% -16% -5%
Profit before Tax 466 446 574 799
Tax 116 112 145 201
Profit After Tax 350 334 430 598
Source: Company, Axis Research
Balance Sheet (Rs Cr)
Y/E Mar FY20 FY21E FY22E FY23E
SOURCES OF FUNDS
Share Capital 1,728 1,728 1,728 1,728
Reserves 1,238 1,572 2,001 2,599
Shareholder’s Funds 2,966 3,300 3,730 4,328
ESOP 21 21 21 21
Preference Share Capital 200 200 200 200
Deposits 10,780 12,852 17,766 23,935
Borrowings 3,953 4,453 3,853 3,603
Other Liabilities & Provisions 490 540 690 805
Total Liabilities 18,411 21,367 26,260 32,952
APPLICATION OF FUNDS
Cash & Bank Balance 1,343 1,332 1,259 1,595
Investments 2,396 3,602 4,269 5,272
Advances 14,044 15,724 19,974 25,287
Fixed and Other Assets 628 708 758 798
Total Assets 18,411 21,367 26,260 32,952
Source: Company, Axis Research
New Year Picks 2021 Jan 2021
21
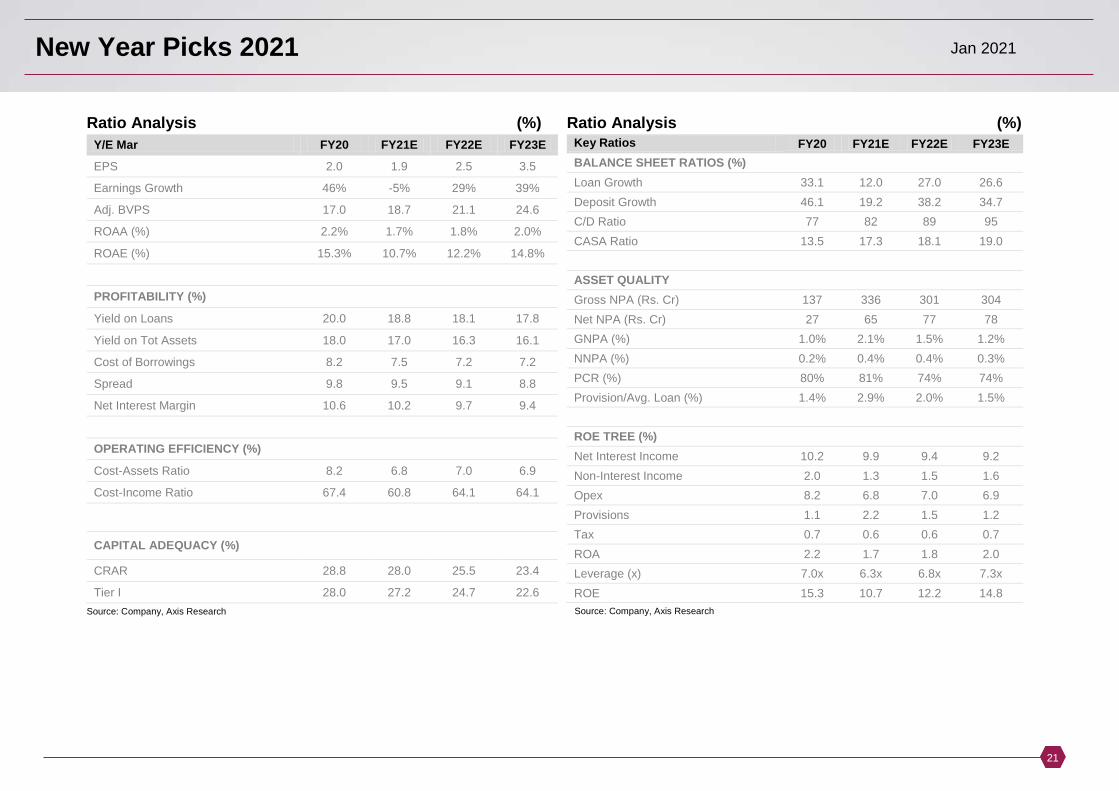
Ratio Analysis (%)
Y/E Mar FY20 FY21E FY22E FY23E
EPS 2.0 1.9 2.5 3.5 Earnings Growth 46% -5% 29% 39% Adj. BVPS 17.0 18.7 21.1 24.6 ROAA (%) 2.2% 1.7% 1.8% 2.0% ROAE (%) 15.3% 10.7% 12.2% 14.8%
PROFITABILITY (%)
Yield on Loans 20.0 18.8 18.1 17.8 Yield on Tot Assets 18.0 17.0 16.3 16.1 Cost of Borrowings 8.2 7.5 7.2 7.2 Spread 9.8 9.5 9.1 8.8 Net Interest Margin 10.6 10.2 9.7 9.4
OPERATING EFFICIENCY (%)
Cost-Assets Ratio 8.2 6.8 7.0 6.9 Cost-Income Ratio 67.4 60.8 64.1 64.1
CAPITAL ADEQUACY (%)
CRAR 28.8 28.0 25.5 23.4 Tier I 28.0 27.2 24.7 22.6
Source: Company, Axis Research
Ratio Analysis (%) Key Ratios FY20 FY21E FY22E FY23E
BALANCE SHEET RATIOS (%)
Loan Growth 33.1 12.0 27.0 26.6 Deposit Growth 46.1 19.2 38.2 34.7 C/D Ratio 77 82 89 95 CASA Ratio 13.5 17.3 18.1 19.0
ASSET QUALITY
Gross NPA (Rs. Cr) 137 336 301 304 Net NPA (Rs. Cr) 27 65 77 78 GNPA (%) 1.0% 2.1% 1.5% 1.2% NNPA (%) 0.2% 0.4% 0.4% 0.3% PCR (%) 80% 81% 74% 74% Provision/Avg. Loan (%) 1.4% 2.9% 2.0% 1.5%
ROE TREE (%)
Net Interest Income 10.2 9.9 9.4 9.2 Non-Interest Income 2.0 1.3 1.5 1.6 Opex 8.2 6.8 7.0 6.9 Provisions 1.1 2.2 1.5 1.2 Tax 0.7 0.6 0.6 0.7 ROA 2.2 1.7 1.8 2.0 Leverage (x) 7.0x 6.3x 6.8x 7.3x ROE 15.3 10.7 12.2 14.8
Source: Company, Axis Research
New Year Picks 2021 Jan 2021
22
STAR CEMENT LTD
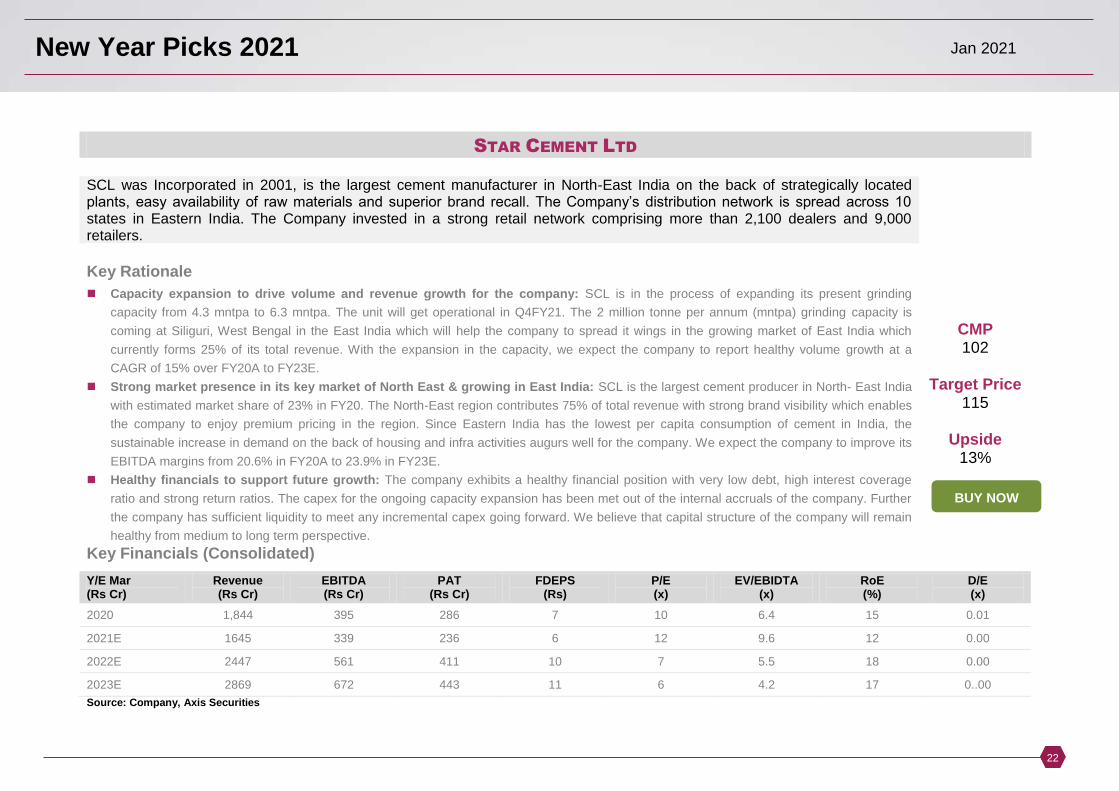
SCL was Incorporated in 2001, is the largest cement manufacturer in North-East India on the back of strategically located plants, easy availability of raw materials and superior brand recall. The Company’s distribution network is spread across 10 states in Eastern India. The Company invested in a strong retail network comprising more than 2,100 dealers and 9,000 retailers.
Key Rationale
Capacity expansion to drive volume and revenue growth for the company: SCL is in the process of expanding its present grinding
capacity from 4.3 mntpa to 6.3 mntpa. The unit will get operational in Q4FY21. The 2 million tonne per annum (mntpa) grinding capacity is
coming at Siliguri, West Bengal in the East India which will help the company to spread it wings in the growing market of East India which
currently forms 25% of its total revenue. With the expansion in the capacity, we expect the company to report healthy volume growth at a
CAGR of 15% over FY20A to FY23E.
Strong market presence in its key market of North East & growing in East India: SCL is the largest cement producer in North- East India
with estimated market share of 23% in FY20. The North-East region contributes 75% of total revenue with strong brand visibility which enables
the company to enjoy premium pricing in the region. Since Eastern India has the lowest per capita consumption of cement in India, the
sustainable increase in demand on the back of housing and infra activities augurs well for the company. We expect the company to improve its
EBITDA margins from 20.6% in FY20A to 23.9% in FY23E.
Healthy financials to support future growth: The company exhibits a healthy financial position with very low debt, high interest coverage
ratio and strong return ratios. The capex for the ongoing capacity expansion has been met out of the internal accruals of the company. Further
the company has sufficient liquidity to meet any incremental capex going forward. We believe that capital structure of the company will remain
healthy from medium to long term perspective.
CMP 102
Target Price
115
Upside 13%
Key Financials (Consolidated)
Y/E Mar (Rs Cr)
Revenue (Rs Cr)
EBITDA (Rs Cr)
PAT (Rs Cr)
FDEPS (Rs)
P/E (x)
EV/EBIDTA (x)
RoE (%)
D/E (x)
2020 1,844 395 286 7 10 6.4 15 0.01 2021E 1645 339 236 6 12 9.6 12 0.00 2022E 2447 561 411 10 7 5.5 18 0.00 2023E 2869 672 443 11 6 4.2 17 0..00 Source: Company, Axis Securities
BUY NOW
New Year Picks 2021 Jan 2021
23
Profit & Loss (Rs Cr)
Y/E Mar FY20 FY21E FY22E FY23E
Net sales 1844 1645 2447 2869 Other operating income 0 0 0 0 Total income 1844 1645 2447 2869
Raw Material 402 390 574 672 Power & Fuel 362 303 449 521 Freight & Forwarding 353 313 463 547 Employee benefit expenses 127 123 148 162 Other Expenses 205 177 253 283
EBITDA 395 339 561 685 Other income 29 28 42 58
PBIDT 424 367 603 743 Depreciation 93 93 133 142 Interest & Fin Chg. 9 7 6 5 E/o income / (Expense) 0 0 0 0 Pre-tax profit 322 267 464 596 Tax provision 34 28 49 149 RPAT 287 239 414 447 Minority Interests -1.8 -3.5 -3.5 -3.5 Associates 0 0 0 0 APAT after EO item 286 236 411 443
Source: Company, Axis Research
Balance Sheet (Rs Cr)
Y/E Mar FY20 FY21E FY22E FY23E
Total assets 2358 2557 2972 3400
Net Block 934 907 993 1081
CWIP 238 38 18 18
Investments 0 0 0 0
Wkg. cap. (excl cash) 283 254 377 441
Cash / Bank balance 282 533 692 941
Misc. Assets 62 83 89 92
Capital employed 2358 2557 2972 3400
Equity capital 41 41 41 41
Reserves 1816 2014 2387 2792
Minority Interests 70 70 70 70
Borrowings 11 2 2 2
Def tax Liabilities 0 0 0 0
Other Liabilities and Provision 42 43 47 49 Source: Company, Axis Research
New Year Picks 2021 Jan 2021
24
Ratio Analysis (%) Y/E Mar FY20 FY21E FY22E FY23E
Profit before tax 322 267 464 596
Depreciation 92 93 133 142
Interest Expenses 9 7 6 5
Non-operating/ EO item -27 -27 -35 -47
Change in W/C 138 35 -127 -69
Income Tax -51 -28 -49 -149 Operating Cash Flow 483 347 392 478
Capital Expenditure -227 -266 -240 -230
Investments 0 0 0 0
Others 92 -182 -170 -187 Investing Cash Flow -136 -448 -411 -416
Borrowings -40 -9 0 0
Interest Expenses -10 -7 -6 -5
Dividend paid -50 -41 -41 -41
Others -102 0 0 0 Financing Cash Flow -201 -57 -48 -46
Change in Cash 146 -158 -66 15
Opening Cash 95 241 83 17
Closing Cash 241 83 17 32 Source: Company, Axis Research
Ratio Analysis (%) Key Ratios FY20 FY21E FY22E FY23E
Operational Ratios
Sales growth 1% -11% 49% 17%
OPM 21.4% 20.6% 22.9% 23.9%
Op. profit growth -12% -14% 66% 22%
COGS / Net sales 61% 61% 61% 61%
Overheads/Net sales 18% 18% 16% 16%
Depreciation / G. block 8% 7% 8% 8%
Efficiency Ratios
Total Asset turnover (x) 0.78 0.64 0.82 0.84
Sales/Gross block (x) 1.59 1.15 1.47 1.51
Sales/Net block(x) 1.98 1.82 2.47 2.66
Working capital/Sales (x) 0.26 0.27 0.23 0.22
Valuation Ratios
P/BV (x) 1.46 1.31 1.12 0.96
EV/Ebitda (x) 6.43 9.63 5.53 4.16
EV/Sales (x) 1.38 1.98 1.27 0.99
EV/Tonne $ (x) 80 70 67 61
Return Ratios
ROE 15 12 18 16
ROCE 17 13 19 21
ROIC 18 17 27 32
Leverage Ratios
Debt / equity (x) 0.01 0.00 0.00 0.00
Net debt/ Equity (x) -0.14 -0.25 -0.27 -0.32
Interest Coverage ratio (x) 35 40 78 120
Source: Company, Axis Research
New Year Picks 2021 Jan 2021
25
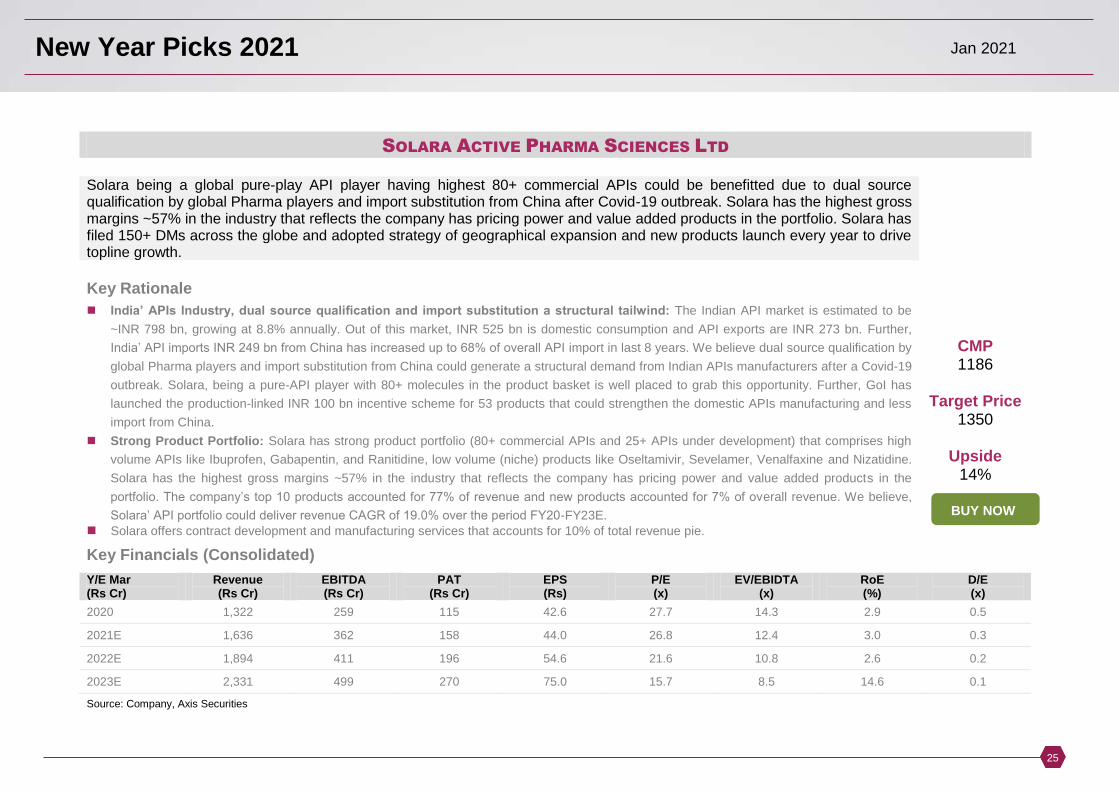
SOLARA ACTIVE PHARMA SCIENCES LTD
Solara being a global pure-play API player having highest 80+ commercial APIs could be benefitted due to dual source qualification by global Pharma players and import substitution from China after Covid-19 outbreak. Solara has the highest gross margins ~57% in the industry that reflects the company has pricing power and value added products in the portfolio. Solara has filed 150+ DMs across the globe and adopted strategy of geographical expansion and new products launch every year to drive topline growth.
Key Rationale
India’ APIs Industry, dual source qualification and import substitution a structural tailwind: The Indian API market is estimated to be
~INR 798 bn, growing at 8.8% annually. Out of this market, INR 525 bn is domestic consumption and API exports are INR 273 bn. Further,
India’ API imports INR 249 bn from China has increased up to 68% of overall API import in last 8 years. We believe dual source qualification by
global Pharma players and import substitution from China could generate a structural demand from Indian APIs manufacturers after a Covid-19
outbreak. Solara, being a pure-API player with 80+ molecules in the product basket is well placed to grab this opportunity. Further, GoI has
launched the production-linked INR 100 bn incentive scheme for 53 products that could strengthen the domestic APIs manufacturing and less
import from China.
Strong Product Portfolio: Solara has strong product portfolio (80+ commercial APIs and 25+ APIs under development) that comprises high
volume APIs like Ibuprofen, Gabapentin, and Ranitidine, low volume (niche) products like Oseltamivir, Sevelamer, Venalfaxine and Nizatidine.
Solara has the highest gross margins ~57% in the industry that reflects the company has pricing power and value added products in the
portfolio. The company’s top 10 products accounted for 77% of revenue and new products accounted for 7% of overall revenue. We believe,
Solara’ API portfolio could deliver revenue CAGR of 19.0% over the period FY20-FY23E.
Solara offers contract development and manufacturing services that accounts for 10% of total revenue pie.
CMP 1186
Target Price
1350
Upside 14%
Key Financials (Consolidated)
Y/E Mar (Rs Cr)
Revenue (Rs Cr)
EBITDA (Rs Cr)
PAT (Rs Cr)
EPS (Rs)
P/E (x)
EV/EBIDTA (x)
RoE (%)
D/E (x)
2020 1,322 259 115 42.6 27.7 14.3 2.9 0.5 2021E 1,636 362 158 44.0 26.8 12.4 3.0 0.3 2022E 1,894 411 196 54.6 21.6 10.8 2.6 0.2 2023E 2,331 499 270 75.0 15.7 8.5 14.6 0.1 Source: Company, Axis Securities
BUY NOW
New Year Picks 2021 Jan 2021
26
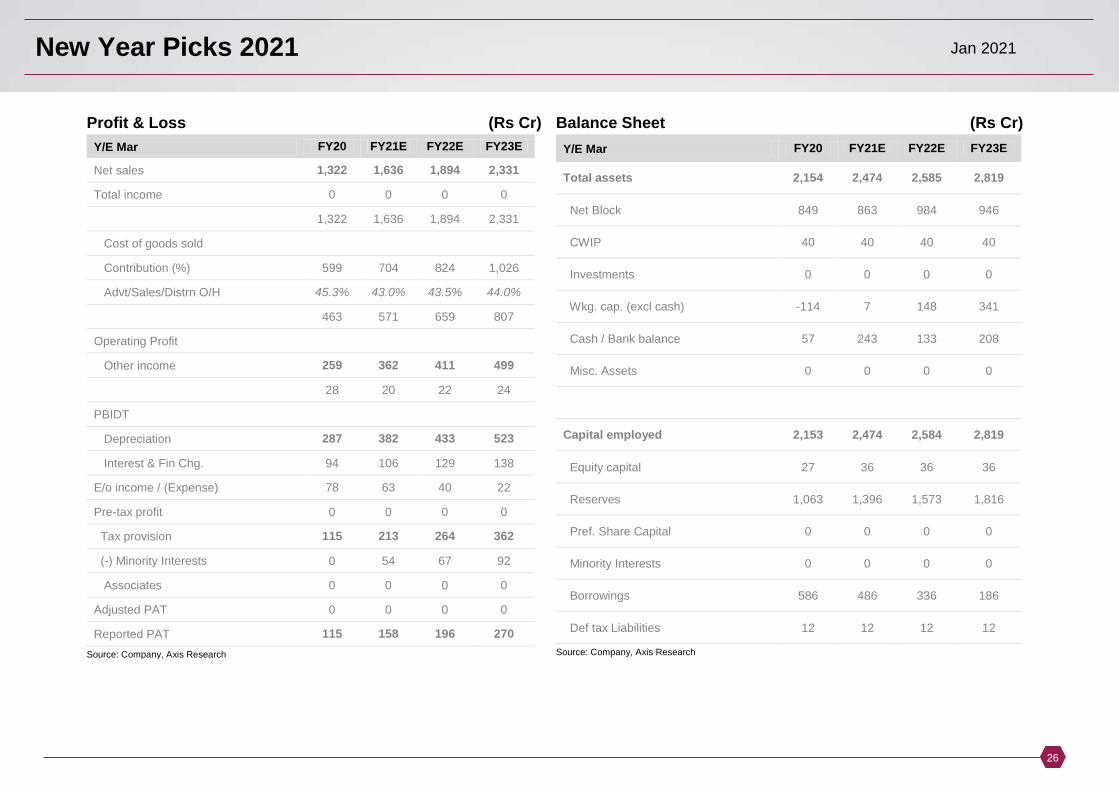
Profit & Loss (Rs Cr)
Y/E Mar FY20 FY21E FY22E FY23E
Net sales 1,322 1,636 1,894 2,331
Total income 0 0 0 0
1,322 1,636 1,894 2,331
Cost of goods sold
Contribution (%) 599 704 824 1,026
Advt/Sales/Distrn O/H 45.3% 43.0% 43.5% 44.0%
463 571 659 807
Operating Profit
Other income 259 362 411 499
28 20 22 24
PBIDT
Depreciation 287 382 433 523
Interest & Fin Chg. 94 106 129 138
E/o income / (Expense) 78 63 40 22
Pre-tax profit 0 0 0 0
Tax provision 115 213 264 362
(-) Minority Interests 0 54 67 92
Associates 0 0 0 0
Adjusted PAT 0 0 0 0
Reported PAT 115 158 196 270
Source: Company, Axis Research
Balance Sheet (Rs Cr)
Y/E Mar FY20 FY21E FY22E FY23E
Total assets 2,154 2,474 2,585 2,819
Net Block 849 863 984 946
CWIP 40 40 40 40
Investments 0 0 0 0
Wkg. cap. (excl cash) -114 7 148 341
Cash / Bank balance 57 243 133 208
Misc. Assets 0 0 0 0
Capital employed 2,153 2,474 2,584 2,819
Equity capital 27 36 36 36
Reserves 1,063 1,396 1,573 1,816
Pref. Share Capital 0 0 0 0
Minority Interests 0 0 0 0
Borrowings 586 486 336 186
Def tax Liabilities 12 12 12 12 Source: Company, Axis Research
New Year Picks 2021 Jan 2021
27
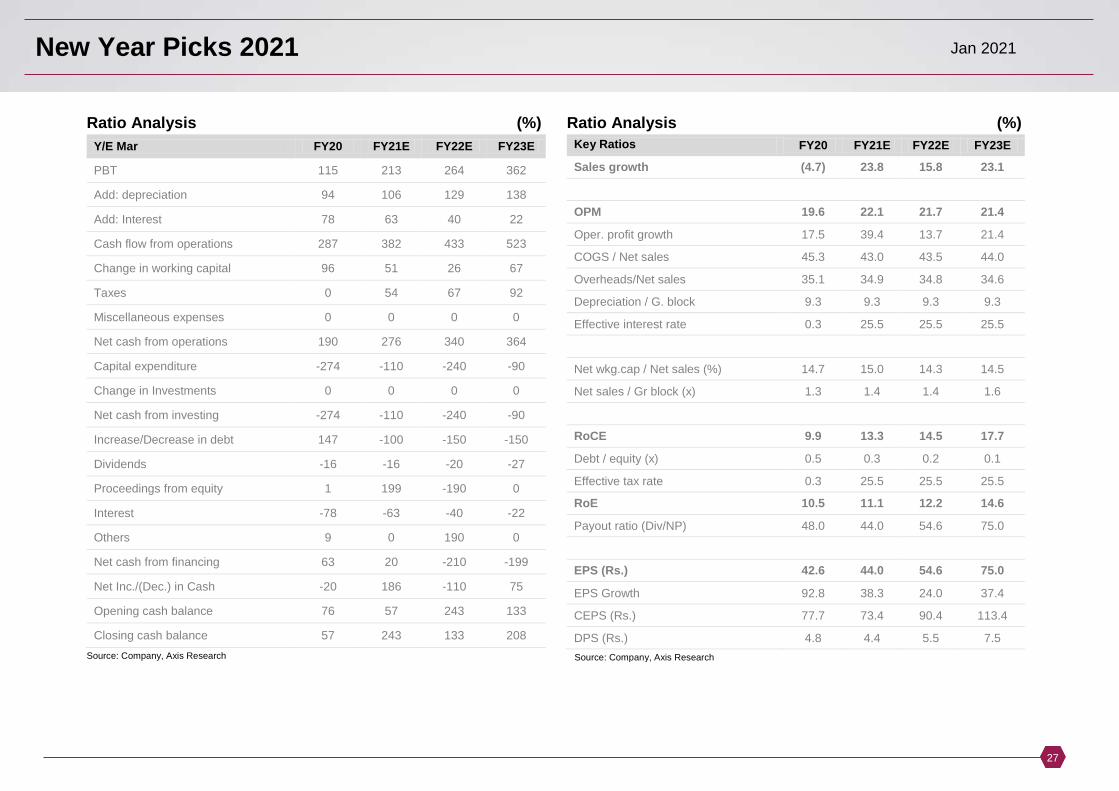
Ratio Analysis (%)
Y/E Mar FY20 FY21E FY22E FY23E
PBT 115 213 264 362 Add: depreciation 94 106 129 138 Add: Interest 78 63 40 22 Cash flow from operations 287 382 433 523 Change in working capital 96 51 26 67 Taxes 0 54 67 92 Miscellaneous expenses 0 0 0 0 Net cash from operations 190 276 340 364 Capital expenditure -274 -110 -240 -90 Change in Investments 0 0 0 0 Net cash from investing -274 -110 -240 -90 Increase/Decrease in debt 147 -100 -150 -150 Dividends -16 -16 -20 -27 Proceedings from equity 1 199 -190 0 Interest -78 -63 -40 -22 Others 9 0 190 0 Net cash from financing 63 20 -210 -199 Net Inc./(Dec.) in Cash -20 186 -110 75 Opening cash balance 76 57 243 133 Closing cash balance 57 243 133 208
Source: Company, Axis Research
Ratio Analysis (%)
Key Ratios FY20 FY21E FY22E FY23E
Sales growth (4.7) 23.8 15.8 23.1 OPM 19.6 22.1 21.7 21.4 Oper. profit growth 17.5 39.4 13.7 21.4 COGS / Net sales 45.3 43.0 43.5 44.0 Overheads/Net sales 35.1 34.9 34.8 34.6 Depreciation / G. block 9.3 9.3 9.3 9.3 Effective interest rate 0.3 25.5 25.5 25.5 Net wkg.cap / Net sales (%) 14.7 15.0 14.3 14.5 Net sales / Gr block (x) 1.3 1.4 1.4 1.6 RoCE 9.9 13.3 14.5 17.7 Debt / equity (x) 0.5 0.3 0.2 0.1 Effective tax rate 0.3 25.5 25.5 25.5 RoE 10.5 11.1 12.2 14.6 Payout ratio (Div/NP) 48.0 44.0 54.6 75.0 EPS (Rs.) 42.6 44.0 54.6 75.0 EPS Growth 92.8 38.3 24.0 37.4 CEPS (Rs.) 77.7 73.4 90.4 113.4 DPS (Rs.) 4.8 4.4 5.5 7.5
Source: Company, Axis Research
New Year Picks 2021 Jan 2021
28
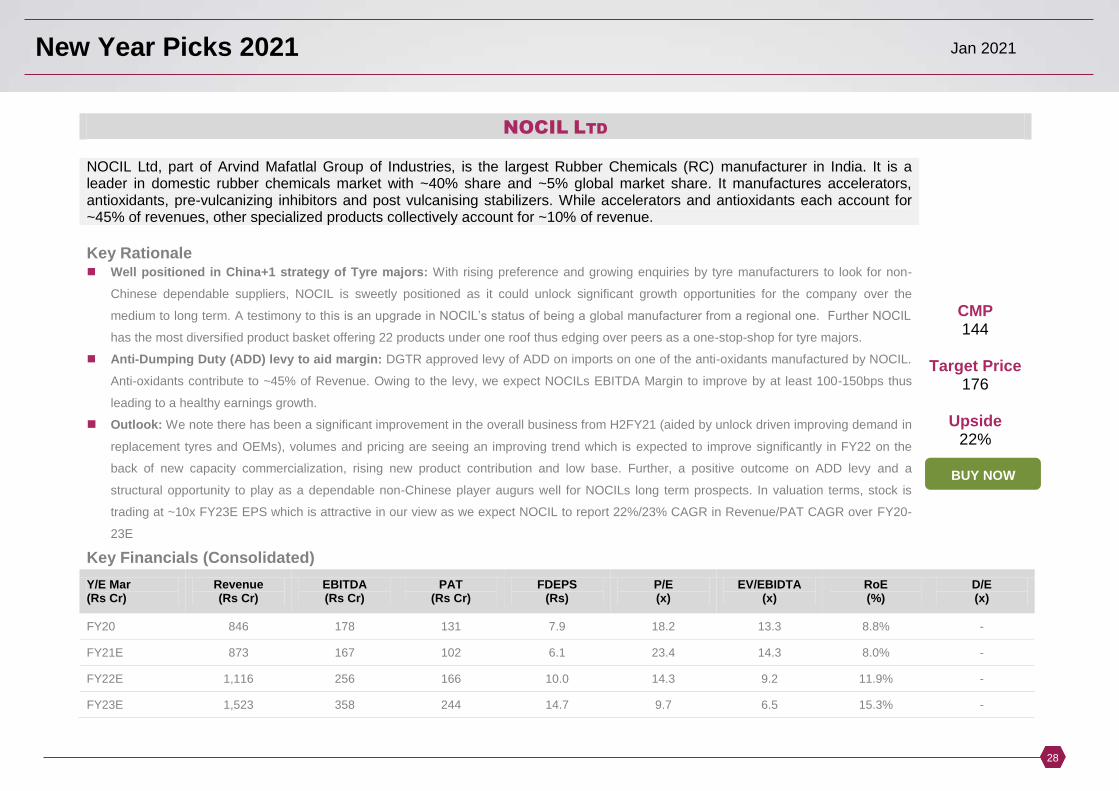
NOCIL LTD
NOCIL Ltd, part of Arvind Mafatlal Group of Industries, is the largest Rubber Chemicals (RC) manufacturer in India. It is a leader in domestic rubber chemicals market with ~40% share and ~5% global market share. It manufactures accelerators, antioxidants, pre-vulcanizing inhibitors and post vulcanising stabilizers. While accelerators and antioxidants each account for ~45% of revenues, other specialized products collectively account for ~10% of revenue.
Key Rationale Well positioned in China+1 strategy of Tyre majors: With rising preference and growing enquiries by tyre manufacturers to look for non-
Chinese dependable suppliers, NOCIL is sweetly positioned as it could unlock significant growth opportunities for the company over the
medium to long term. A testimony to this is an upgrade in NOCIL’s status of being a global manufacturer from a regional one. Further NOCIL
has the most diversified product basket offering 22 products under one roof thus edging over peers as a one-stop-shop for tyre majors.
Anti-Dumping Duty (ADD) levy to aid margin: DGTR approved levy of ADD on imports on one of the anti-oxidants manufactured by NOCIL.
Anti-oxidants contribute to ~45% of Revenue. Owing to the levy, we expect NOCILs EBITDA Margin to improve by at least 100-150bps thus
leading to a healthy earnings growth.
Outlook: We note there has been a significant improvement in the overall business from H2FY21 (aided by unlock driven improving demand in
replacement tyres and OEMs), volumes and pricing are seeing an improving trend which is expected to improve significantly in FY22 on the
back of new capacity commercialization, rising new product contribution and low base. Further, a positive outcome on ADD levy and a
structural opportunity to play as a dependable non-Chinese player augurs well for NOCILs long term prospects. In valuation terms, stock is
trading at ~10x FY23E EPS which is attractive in our view as we expect NOCIL to report 22%/23% CAGR in Revenue/PAT CAGR over FY20-
23E
CMP 144
Target Price
176
Upside 22%
Key Financials (Consolidated)
Y/E Mar (Rs Cr)
Revenue (Rs Cr)
EBITDA (Rs Cr)
PAT (Rs Cr)
FDEPS (Rs)
P/E (x)
EV/EBIDTA (x)
RoE (%)
D/E (x)
FY20 846 178 131 7.9 18.2 13.3 8.8% - FY21E 873 167 102 6.1 23.4 14.3 8.0% - FY22E 1,116 256 166 10.0 14.3 9.2 11.9% - FY23E 1,523 358 244 14.7 9.7 6.5 15.3% -
BUY NOW
New Year Picks 2021 Jan 2021
29
Source: Company, Axis Securities
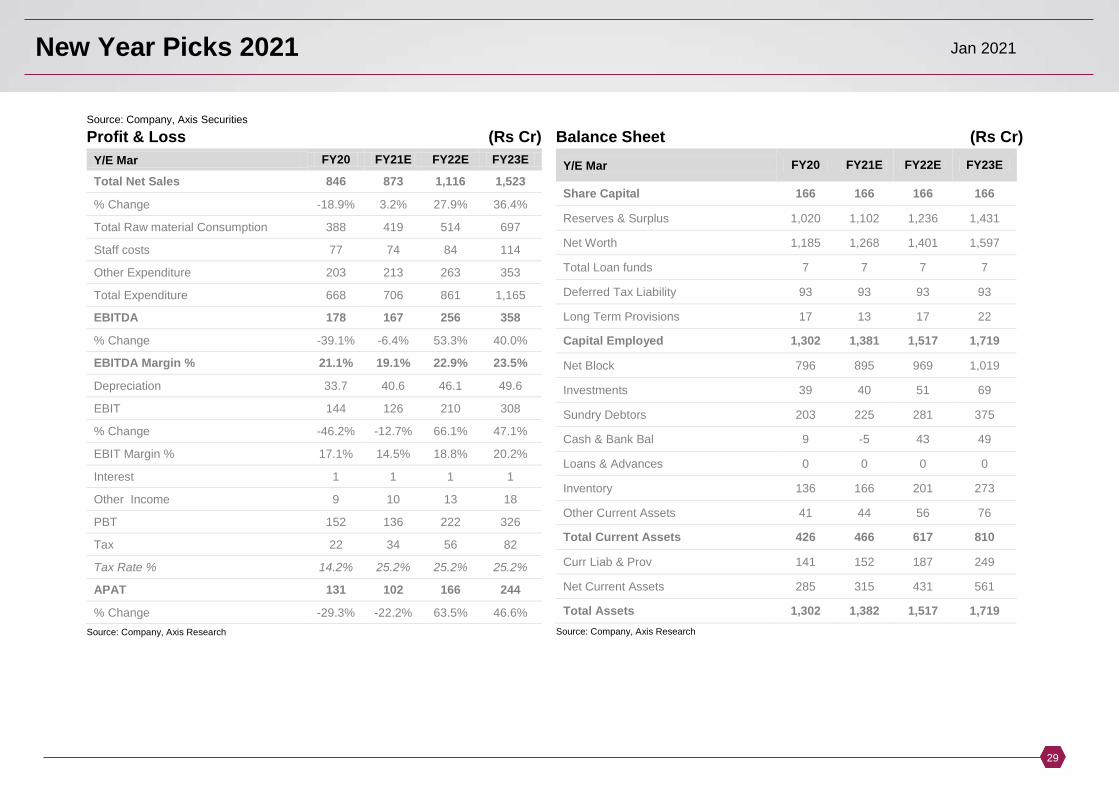
Profit & Loss (Rs Cr)
Y/E Mar FY20 FY21E FY22E FY23E
Total Net Sales 846 873 1,116 1,523
% Change -18.9% 3.2% 27.9% 36.4%
Total Raw material Consumption 388 419 514 697
Staff costs 77 74 84 114
Other Expenditure 203 213 263 353
Total Expenditure 668 706 861 1,165
EBITDA 178 167 256 358
% Change -39.1% -6.4% 53.3% 40.0%
EBITDA Margin % 21.1% 19.1% 22.9% 23.5%
Depreciation 33.7 40.6 46.1 49.6
EBIT 144 126 210 308
% Change -46.2% -12.7% 66.1% 47.1%
EBIT Margin % 17.1% 14.5% 18.8% 20.2%
Interest 1 1 1 1
Other Income 9 10 13 18
PBT 152 136 222 326
Tax 22 34 56 82
Tax Rate % 14.2% 25.2% 25.2% 25.2%
APAT 131 102 166 244
% Change -29.3% -22.2% 63.5% 46.6%
Source: Company, Axis Research
Balance Sheet (Rs Cr)
Y/E Mar FY20 FY21E FY22E FY23E
Share Capital 166 166 166 166
Reserves & Surplus 1,020 1,102 1,236 1,431
Net Worth 1,185 1,268 1,401 1,597
Total Loan funds 7 7 7 7
Deferred Tax Liability 93 93 93 93
Long Term Provisions 17 13 17 22
Capital Employed 1,302 1,381 1,517 1,719
Net Block 796 895 969 1,019
Investments 39 40 51 69
Sundry Debtors 203 225 281 375
Cash & Bank Bal 9 -5 43 49
Loans & Advances 0 0 0 0
Inventory 136 166 201 273
Other Current Assets 41 44 56 76
Total Current Assets 426 466 617 810
Curr Liab & Prov 141 152 187 249
Net Current Assets 285 315 431 561
Total Assets 1,302 1,382 1,517 1,719
Source: Company, Axis Research
New Year Picks 2021 Jan 2021
30
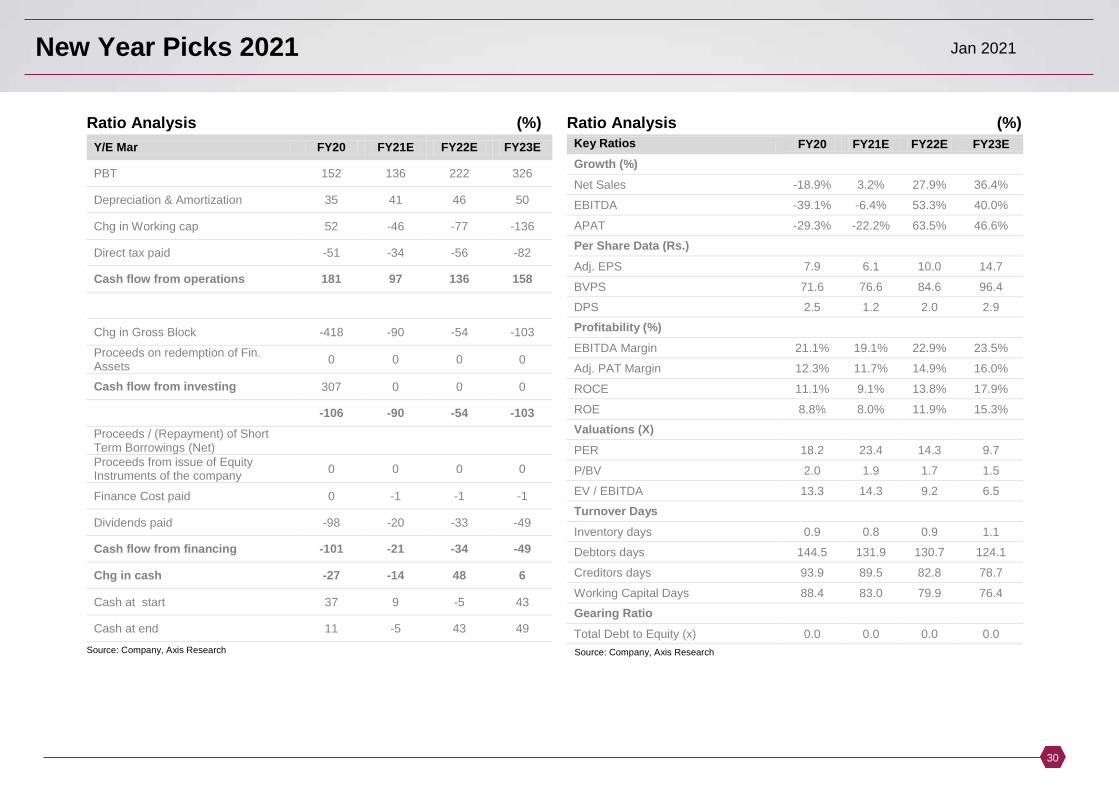
Ratio Analysis (%)
Y/E Mar FY20 FY21E FY22E FY23E
PBT 152 136 222 326
Depreciation & Amortization 35 41 46 50
Chg in Working cap 52 -46 -77 -136
Direct tax paid -51 -34 -56 -82
Cash flow from operations 181 97 136 158
Chg in Gross Block -418 -90 -54 -103
Proceeds on redemption of Fin. Assets 0 0 0 0
Cash flow from investing 307 0 0 0
-106 -90 -54 -103
Proceeds / (Repayment) of Short Term Borrowings (Net)
Proceeds from issue of Equity Instruments of the company 0 0 0 0
Finance Cost paid 0 -1 -1 -1
Dividends paid -98 -20 -33 -49
Cash flow from financing -101 -21 -34 -49
Chg in cash -27 -14 48 6
Cash at start 37 9 -5 43
Cash at end 11 -5 43 49
Source: Company, Axis Research
Ratio Analysis (%)
Key Ratios FY20 FY21E FY22E FY23E
Growth (%)
Net Sales -18.9% 3.2% 27.9% 36.4%
EBITDA -39.1% -6.4% 53.3% 40.0%
APAT -29.3% -22.2% 63.5% 46.6%
Per Share Data (Rs.)
Adj. EPS 7.9 6.1 10.0 14.7
BVPS 71.6 76.6 84.6 96.4
DPS 2.5 1.2 2.0 2.9
Profitability (%)
EBITDA Margin 21.1% 19.1% 22.9% 23.5%
Adj. PAT Margin 12.3% 11.7% 14.9% 16.0%
ROCE 11.1% 9.1% 13.8% 17.9%
ROE 8.8% 8.0% 11.9% 15.3%
Valuations (X)
PER 18.2 23.4 14.3 9.7
P/BV 2.0 1.9 1.7 1.5
EV / EBITDA 13.3 14.3 9.2 6.5
Turnover Days
Inventory days 0.9 0.8 0.9 1.1
Debtors days 144.5 131.9 130.7 124.1
Creditors days 93.9 89.5 82.8 78.7
Working Capital Days 88.4 83.0 79.9 76.4
Gearing Ratio
Total Debt to Equity (x) 0.0 0.0 0.0 0.0
Source: Company, Axis Research
New Year Picks 2021 Jan 2021
31
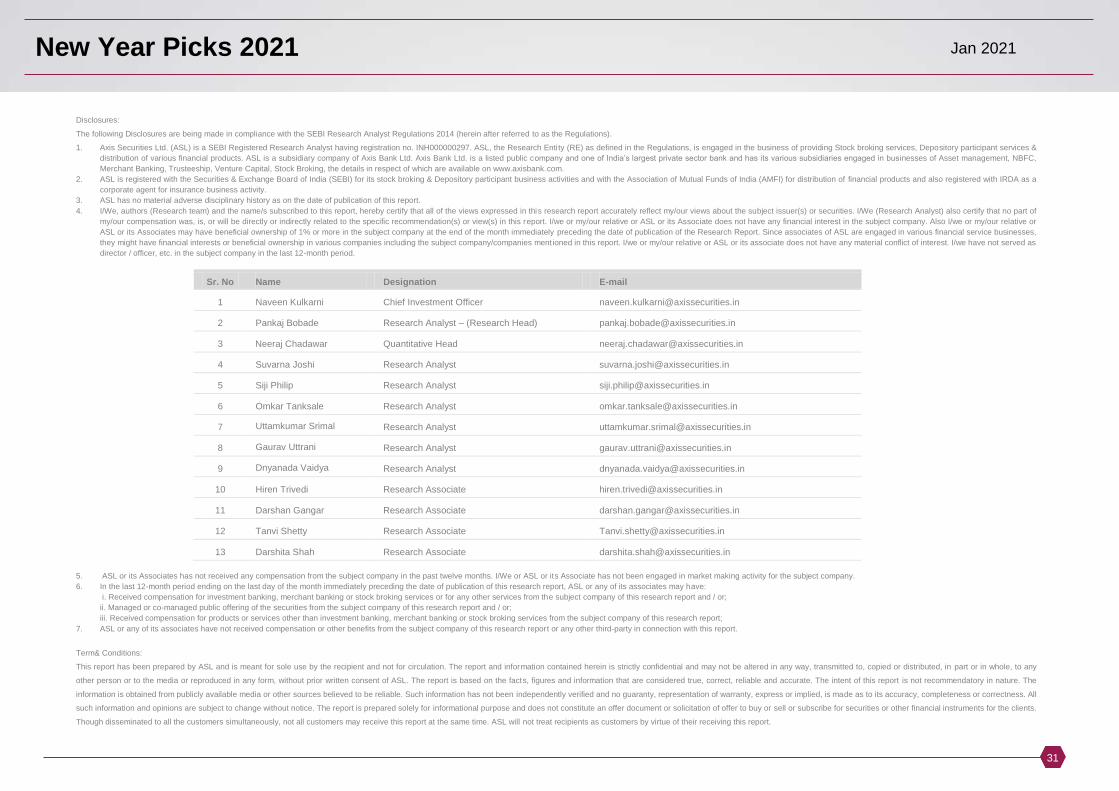
Disclosures:
The following Disclosures are being made in compliance with the SEBI Research Analyst Regulations 2014 (herein after referred to as the Regulations).
1. Axis Securities Ltd. (ASL) is a SEBI Registered Research Analyst having registration no. INH000000297. ASL, the Research Enti ty (RE) as defined in the Regulations, is engaged in the business of providing Stock broking services, Depository participant services &
distribution of various financial products. ASL is a subsidiary company of Axis Bank Ltd. Axis Bank Ltd. is a listed public company and one of India’s largest private sector bank and has its various subsidiaries engaged in businesses of Asset management, NBFC,
Merchant Banking, Trusteeship, Venture Capital, Stock Broking, the details in respect of which are available on www.axisbank.com.
2. ASL is registered with the Securities & Exchange Board of India (SEBI) for its stock broking & Depository participant business activities and with the Association of Mutual Funds of India (AMFI) for distribution of financial products and also registered with IRDA as a
corporate agent for insurance business activity.
3. ASL has no material adverse disciplinary history as on the date of publication of this report.
4. I/We, authors (Research team) and the name/s subscribed to this report, hereby certify that all of the views expressed in this research report accurately reflect my/our views about the subject issuer(s) or securities. I/We (Research Analyst) also certify that no part of
my/our compensation was, is, or will be directly or indirectly related to the specific recommendation(s) or view(s) in this report. I/we or my/our relative or ASL or its Associate does not have any financial interest in the subject company. Also I/we or my/our relative or
ASL or its Associates may have beneficial ownership of 1% or more in the subject company at the end of the month immediately preceding the date of publication of the Research Report. Since associates of ASL are engaged in various financial service businesses,
they might have financial interests or beneficial ownership in various companies including the subject company/companies mentioned in this report. I/we or my/our relative or ASL or its associate does not have any material conflict of interest. I/we have not served as
director / officer, etc. in the subject company in the last 12-month period.
Sr. No Name Designation E-mail 1 Naveen Kulkarni Chief Investment Officer [email protected] 2 Pankaj Bobade Research Analyst – (Research Head) [email protected] 3 Neeraj Chadawar Quantitative Head [email protected] 4 Suvarna Joshi Research Analyst [email protected] 5 Siji Philip Research Analyst [email protected] 6 Omkar Tanksale Research Analyst [email protected] 7 Uttamkumar Srimal Research Analyst [email protected] 8 Gaurav Uttrani Research Analyst [email protected] 9 Dnyanada Vaidya Research Analyst [email protected] 10 Hiren Trivedi Research Associate [email protected] 11 Darshan Gangar Research Associate [email protected] 12 Tanvi Shetty Research Associate [email protected] 13 Darshita Shah Research Associate [email protected]
5. ASL or its Associates has not received any compensation from the subject company in the past twelve months. I/We or ASL or its Associate has not been engaged in market making activity for the subject company.
6. In the last 12-month period ending on the last day of the month immediately preceding the date of publication of this research report, ASL or any of its associates may have:
i. Received compensation for investment banking, merchant banking or stock broking services or for any other services from the subject company of this research report and / or;
ii. Managed or co-managed public offering of the securities from the subject company of this research report and / or;
iii. Received compensation for products or services other than investment banking, merchant banking or stock broking services from the subject company of this research report;
7. ASL or any of its associates have not received compensation or other benefits from the subject company of this research report or any other third-party in connection with this report.
Term& Conditions:
This report has been prepared by ASL and is meant for sole use by the recipient and not for circulation. The report and information contained herein is strictly confidential and may not be altered in any way, transmitted to, copied or distributed, in part or in whole, to any
other person or to the media or reproduced in any form, without prior written consent of ASL. The report is based on the facts, figures and information that are considered true, correct, reliable and accurate. The intent of this report is not recommendatory in nature. The
information is obtained from publicly available media or other sources believed to be reliable. Such information has not been independently verified and no guaranty, representation of warranty, express or implied, is made as to its accuracy, completeness or correctness. All
such information and opinions are subject to change without notice. The report is prepared solely for informational purpose and does not constitute an offer document or solicitation of offer to buy or sell or subscribe for securities or other financial instruments for the clients.
Though disseminated to all the customers simultaneously, not all customers may receive this report at the same time. ASL will not treat recipients as customers by virtue of their receiving this report.
New Year Picks 2021 Jan 2021
32
Disclaimer:
Nothing in this report constitutes investment, legal, accounting and tax advice or a representation that any investment or strategy is suitable or appropriate to the recipient’s specific circumstances. The securities and
strategies discussed and opinions expressed, if any, in this report may not be suitable for all investors, who must make their own investment decisions, based on their own investment objectives, financial positions and
needs of specific recipient.
This report may not be taken in substitution for the exercise of independent judgment by any recipient. Each recipient of this report should make such investigations as it deems necessary to arrive at an independent
evaluation of an investment in the securities of companies referred to in this report (including the merits and risks involved), and should consult its own advisors to determine the merits and risks of such an investment.
Certain transactions, including those involving futures, options and other derivatives as well as non-investment grade securities involve substantial risk and are not suitable for all investors. ASL, its directors, analysts or
employees do not take any responsibility, financial or otherwise, of the losses or the damages sustained due to the investments made or any action taken on basis of this report, including but not restricted to, fluctuation in
the prices of shares and bonds, changes in the currency rates, diminution in the NAVs, reduction in the dividend or income, etc. Past performance is not necessarily a guide to future performance. Investors are advice
necessarily a guide to future performance. Investors are advised to see Risk Disclosure Document to understand the risks associated before investing in the securities markets. Actual results may differ materially from those
set forth in projections. Forward-looking statements are not predictions and may be subject to change without notice.
ASL and its affiliated companies, their directors and employees may; (a) from time to time, have long or short position(s) in, and buy or sell the securities of the company(ies) mentioned herein or (b) be engaged in any other
transaction involving such securities or earn brokerage or other compensation or act as a market maker in the financial instruments of the company(ies) discussed herein or act as an advisor or investment banker,
lender/borrower to such company(ies) or may have any other potential conflict of interests with respect to any recommendation and other related information and opinions. Each of these entities functions as a separate,
distinct and independent of each other. The recipient should take this into account before interpreting this document.
ASL and / or its affiliates do and seek to do business including investment banking with companies covered in its research reports. As a result, the recipients of this report should be aware that ASL may have a potential
conflict of interest that may affect the objectivity of this report. Compensation of Research Analysts is not based on any specific merchant banking, investment banking or brokerage service transactions. ASL may have
issued other reports that are inconsistent with and reach different conclusion from the information presented in this report. The Research reports are also available & published on AxisDirect website.
Neither this report nor any copy of it may be taken or transmitted into the United State (to U.S. Persons), Canada, or Japan or distributed, directly or indirectly, in the United States or Canada or distributed or redistributed in
Japan or to any resident thereof. If this report is inadvertently sent or has reached any individual in such country, especially, USA, the same may be ignored and brought to the attention of the sender. This report is not
directed or intended for distribution to, or use by, any person or entity who is a citizen or resident of or located in any locality, state, country or other jurisdiction, where such distribution, publication, availability or use would
be contrary to law, regulation or which would subject ASL to any registration or licensing requirement within such jurisdiction. The securities described herein may or may not be eligible for sale in all jurisdictions or to
certain category of investors.
The Disclosures of Interest Statement incorporated in this document is provided solely to enhance the transparency and should not be treated as endorsement of the views expressed in the report. The Company reserves
the right to make modifications and alternations to this document as may be required from time to time without any prior notice. The views expressed are those of the analyst(s) and the Company may or may not subscribe
to all the views expressed therein.
Copyright in this document vests with Axis Securities Limited.
Axis Securities Limited, Corporate office: Unit No. 2, Phoenix Market City, 15, LBS Road, Near Kamani Junction, Kurla (west), Mumbai-400070, Tel No. – 022-40508080/ 022-61480808, Regd. off.- Axis House, 8th Floor,
Wadia International Centre, PandurangBudhkar Marg, Worli, Mumbai – 400 025. Compliance Officer: AnandShaha, Email: [email protected], Tel No: 022-42671582.SEBI-Portfolio Manager Reg. No.
INP000000654
Related Documents


