Profitability expectations and uncertainty in the photovoltaic diffusion process in Germany and Spain, 2004-2013. Javier López Prol Wegener Center for Climate and Global Change. University of Graz, Austria. Abstract. Photovoltaic (PV) technology shows the greatest potential towards the decarbonization of electricity generation. Regulation, by setting incentives, has shaped the expected profitability of PV installations, which has therefore triggered the diffusion of the technology. This paper studies the diffusion process of PV in Germany and Spain during the last decade by looking at the link between regulation, expected profitability (reflected in the Internal Rate of Return) and diffusion (installed capacity) in 3 different segments: residential, commercial-industrial and utility. We find that not only the expected profitability level matters, but also its relative evolution to the profit rate of the economy, which reflects the evolution of the opportunity cost of capital. Whereas both expected profitability and diffusion evolved smoothly in Germany, showing a clear correlation, Spain experienced a diffusion and profitability bubble. However, the profitability bubble was not the cause of the diffusion bubble, as it is generally though, but in some extend its consequence. Although the correlation between expected profitability and diffusion cannot be seen in Spain, our conceptual model is able to explain the evolution of PV diffusion by integrating the “Net Profitability Index” concept, as well as the role of uncertainty and capital mobility. Finally, the sensitivity analysis shows that for achieving a 5% return on investment without any subsidy, in Spain and Germany respectively: the PV system price should drop by 35% and 65% relative to 2013 levels, electricity price should be 3.5 and 3 times higher, or its annual escalation rate 6% and 11%. Keywords: Internal rate of returm, solar orchads, profitability, diffusion.

Welcome message from author
This document is posted to help you gain knowledge. Please leave a comment to let me know what you think about it! Share it to your friends and learn new things together.
Transcript

Profitability expectations and uncertainty in the photovoltaic diffusion
process in Germany and Spain, 2004-2013.
Javier López Prol
Wegener Center for Climate and Global Change. University of Graz, Austria.
Abstract.
Photovoltaic (PV) technology shows the greatest potential towards the decarbonization of
electricity generation. Regulation, by setting incentives, has shaped the expected profitability of
PV installations, which has therefore triggered the diffusion of the technology. This paper
studies the diffusion process of PV in Germany and Spain during the last decade by looking at the
link between regulation, expected profitability (reflected in the Internal Rate of Return) and
diffusion (installed capacity) in 3 different segments: residential, commercial-industrial and
utility. We find that not only the expected profitability level matters, but also its relative
evolution to the profit rate of the economy, which reflects the evolution of the opportunity cost
of capital. Whereas both expected profitability and diffusion evolved smoothly in Germany,
showing a clear correlation, Spain experienced a diffusion and profitability bubble. However, the
profitability bubble was not the cause of the diffusion bubble, as it is generally though, but in
some extend its consequence. Although the correlation between expected profitability and
diffusion cannot be seen in Spain, our conceptual model is able to explain the evolution of PV
diffusion by integrating the “Net Profitability Index” concept, as well as the role of uncertainty
and capital mobility. Finally, the sensitivity analysis shows that for achieving a 5% return on
investment without any subsidy, in Spain and Germany respectively: the PV system price should
drop by 35% and 65% relative to 2013 levels, electricity price should be 3.5 and 3 times higher,
or its annual escalation rate 6% and 11%.
Keywords: Internal rate of returm, solar orchads, profitability, diffusion.

2
1. Introduction
Expectations and uncertainty play a key role in the diffusion of novel technologies
(Rosenberg, 1976; Ireland and Stoneman, 1986; Alkemade and Suurs, 2012). Photovoltaic (PV)
technology shows the greatest potential towards the decarbonization of electricity generation,
not only for its technological developments, but also for the dramatic cost decline experienced
during the last decades and forecasted for the next years (EPIA & GP, 2011; IEA, 2014; MIT,
2015; NREL, 2016)
Within those technological expectations, profitability has a major relevance in determining
the diffusion of the technology, since investment decisions are mainly based on expected
profitability forecasts. However, expected profitability is difficult to estimate for PV investments.
Although the main cost is the initial investment and there are no fuel costs, the uncertainty
comes mainly from the variability of PV generation on the one hand, and the uncertain evolution
of electricity prices during the lifetime of the investment (25-30 years) on the other hand. That is
why regulation has played a significant role incentivizing this technology, not only for the
economic direct effect of the financial incentives, but also for the certainty provided to investors
by guaranteeing that all the electricity generated would be purchased during the lifetime of the
system at a given price, which ensures a certain income flow (Klessman et al, 2011; Grau, 2014).
Knowing the income flow during the lifetime of the investment, and given the certainty of the
initial investment, which is the largest cost of the system (Operation and Maintenance —O&M
hereafter— account for around an annual 1% of the total system price), the estimation of the
Internal Rate of Return (IRR) of the investment becomes accurately estimable.
In this paper we will study the diffusion process of the PV technology in Germany and Spain
between 2004 and 2013. Germany is the leading country in terms of PV installed capacity, both
per capita and in absolute terms, with more than 34 GW installed capacity in 2014 (REN21,
2015). Spain, which was the leading country in 2008, accounting for 45% of the global PV
market (ASIF, 2009 and 2011), lies now in the sixth position with a virtually paralyzed PV
3
market, after having experienced a boom and bust cycle in both the diffusion of the technology
and the profitability of the installations. (Del Rio and Mir-Artigues 2012 and 2014; Mir-Artigues,
2013; Prieto and Hall 2013).
Our hypothesis is that regulation, by setting financial incentives (Mainly Feed-in Tariffs —
FiTs—, but also investment subsidies and soft loans), has shaped the expected profitability of PV
installations, and likewise the expected profitability has largely determined the diffusion of the
technology.
We will estimate the expected Internal Rate of Return (IRR) for three different types of
installations/segments: small scale (residential segment), medium scale (commercial and
industrial), and large scale (utility), and then study and compare its evolution in both countries
and how it is related to the diffusion of the technology. Finally, we will carry out a sensitivity
analysis, which will allow us to assess how far PV technology is from achieving competitiveness
at current market prices.
Several papers have already studied the profitability of PV installations from different
perspectives. Spertino et al. (2013) calculate the Net Present Value and the IRR for several case
studies in Germany and Italy over the period 2005-2013, focusing on rooftop installations. The
results obtained by Spertino et al. for Italy show a similar evolution to that experienced in Spain,
and the results for Germany are consistent with our estimations for the Residential and
Commercial-Industrial segments. Talavera et al. (2010) carries out a comprehensive sensitivity
analysis on the determinants of PV profitability for the Euro Area, Japan and the USA. Their
results are interesting as long as they show how different factors affect the profitability of PV
depending on different market and regulatory circumstances. In the three cases, they find that
the initial investment and the PV yield-electricity price (these both have the same quantitative
effect on the IRR) are the most important factors determining the profitability of PV
investments. Other analyses focus on the profitability of PV for self-consumption applications,
such as Colmenar Santos et al (2012), Chiaroni et al. (2014) and Talavera et al. (2014). We follow

4
and develop the methodology used in this previous literature, and try to not only quantify
profitability, but link it to the regulations which shaped it and the diffusion that it triggered.
This paper is organized as follows: section 2 reviews the IRR methodology and the data and
assumptions used for its calculation, focusing on the difference between static and dynamic
determinants of profitability; being the latter those who determine its fluctuations over the
period studied. Section 3 presents the main results, focusing on the link between regulation,
expected profitability and diffusion, stressing the role of the solar orchads owning structure on
the formation of the Spanish PV bubble, and presenting a conceptual framework to explain how
these elements affect diffusion. Section 4 studies the sensitivity of profitability to the main
market factors (system price and electricity price levels and evolution), and shows the economic
circumstances under which Utility PV would reach competitiveness. Finally, section 5 concludes.
2. Methodology and data
2.1. Methodology
2.1.1. The Internal Rate of return
There are many ways to evaluate the profitability of a PV investment. Nofuentes et al. (2002)
review how different profitability indicators can be applied to Grid-Connected Photovoltaic
Systems (GCPVS). The most useful indicators are Net Present Value (NPV), Profitability Index
(PI), Pay-Back Time (PBT), and Internal Rate of Return (IRR).
The NPV is simply the sum of all the cash flows of the investment lifetime (revenues less
expenditures), discounted to the present. The investment is profitable when NPV>0. However,
this indicator forces us to make an assumption about the discount rate, and it might not be
suitable for comparison of investments with different initial costs and lifetimes, because it is an
absolute value instead of a relative measure (as the IRR), and because the assumption about the
discount rate implies an arbitrary discrimination based on the lifetime of the investment.

5
The profitability index (PI) is the ratio between the net present value and the life cycle cost of
the investment. It shows the same information than the NPV but relative to the cost of the
investment.
The Payback Time (PBT) shows the time required to recover the money invested. It is a useful
indicator but it dismisses the cash inflows received after that moment and it is not very useful
for comparisons because it only provides information about the time to recover the investment,
but not about profitability itself.
Finally, the IRR shows the discount rate at which the net present value equals zero. It is the
most useful indicator for several reasons: it does not force us to make any assumption about the
discount rate; it provides a relative result easily comparable among different types of
investment, and it is indeed the most popular indicator amongst investors.
The calculation of the IRR derives from the NPV equation (1). As we have already mentioned,
it is sum of the present worth of the cash inflows during the lifetime of the investment
(𝑃𝑊[𝐶𝐼𝐹(𝑁)]) minus the Life Cycle Cost of the investment from the user standpoint1 (𝐿𝐶𝐶𝑢𝑠𝑝)
𝑁𝑃𝑉 = 𝑃𝑊[𝐶𝐼𝐹(𝑁)] − 𝐿𝐶𝐶𝑢𝑠𝑝 (1)
The present worth of the cash inflows has two main components: the electricity price (𝑃𝑢
[€/kWh]), and the annual electricity yield of the system (𝐸𝑝𝑣 [kWh/kWpy]).
Besides these two main elements we will include the grid-access charge (γ) and the
generation tax (λ) for the case of Spain. The last element of eq. 2 depicts the effect of the annual
escalation rate of energy prices (εPU [%]), the annual degradation rate of the system (𝑑𝑔 [%]) and
the discount rate (𝑑 [%]):
𝑃𝑊[𝐶𝐼𝐹(𝑁)] = (𝑃𝑢 − γ) ∗ (1 − 𝜆) ∗ 𝐸𝑝𝑣 ∗𝐾𝑃𝑈∗(1−𝐾𝑃𝑈
𝑁 )
1−𝐾𝑃𝑈 (2)
1 The LCC can be considered either from the point of view of the system (excluding investment subsidies,
soft loans or any other incentive), or from the point of view of the user including all available incentives
(Nofuentes et al. 2002: 556). As we are interested in the investor’s perspective we will analyze the LCC from the
user standpoint.

6
Being 𝑁 the lifetime of the investment and 𝐾𝑃𝑈:
𝐾𝑃𝑈 = (1+ε𝑃𝑈)∗(1−𝑑𝑔)
1+𝑑 (3)
On the other hand, the 𝐿𝐶𝐶𝑢𝑠𝑝 comprises the present worth of the initial investment of the
PV system (𝑃𝑊[𝑃𝑉𝐼𝑁] [€/kWp]) and the present worth of the annual operation and
maintenance (O&M) costs (𝑃𝑊[𝑃𝑉𝑂𝑀] [€/kWpy]):
𝐿𝐶𝐶𝑢𝑠𝑝 = 𝑃𝑊[𝑃𝑉𝐼𝑁] + 𝑃𝑊[𝑃𝑉𝑂𝑀] (4)
The main parameters regarding the initial investment are the system cost itself (𝑃𝑉𝐼𝑁
[€/Wp]), the investment subsidy (𝑃𝑉𝐼𝑆 [€/Wp]) and the financial conditions: percentage
financed (α), interest rate (𝑖), and the maturity of the loan (𝑁𝑙):
𝑃𝑊[𝑃𝑉𝐼𝑁] = (1 − 𝛼) ∗ (𝑃𝑉𝐼𝑁 − 𝑃𝑉𝐼𝑆) + 𝛼 ∗ (𝑃𝑉𝐼𝑁 − 𝑃𝑉𝐼𝑆) ∗ 𝑖 ∗(1+𝑖)𝑁𝑙
(1+𝑖)𝑁𝑙−1∗
1−𝑞𝑁𝑙
1−𝑞 (5)
𝑞 being:
𝑞 =1
1+𝑑 (6)
Finally, the present worth of the O&M costs is simply:
𝑃𝑊[𝑃𝑉𝑂𝑀] = 𝑃𝑉𝑂𝑀 ∗𝐾𝑃𝑉∗(1−𝐾𝑃𝑉
𝑁 )
1−𝐾𝑃𝑉 (7)
εOM being the escalation rate of O&M costs and KPV:
𝐾𝑃𝑉 = (1+ε𝑂𝑀)
1+𝑑 (8)
In conclusion, we must calculate the discount rate (d) of eq. 9 when NPV=0:
𝑁𝑃𝑉 = (𝑃𝑢 − γ) ∗ (1 − 𝜆) ∗ 𝐸𝑝𝑣 ∗𝐾𝑃𝑈∗(1−𝐾𝑃𝑈
𝑁 )
1−𝐾𝑃𝑈
−(1 − 𝛼) ∗ (𝑃𝑉𝐼𝑁 − 𝑃𝑉𝐼𝑆) + 𝛼 ∗ (𝑃𝑉𝐼𝑁 − 𝑃𝑉𝐼𝑆) ∗ 𝑖 ∗(1+𝑖)𝑁𝑙
(1+𝑖)𝑁𝑙−1∗
1−𝑞𝑁𝑙
1−𝑞

7
−𝑃𝑉𝑂𝑀 ∗𝐾𝑃𝑉∗(1−𝐾𝑃𝑉
𝑁
1−𝐾𝑃𝑉= 0 (9)
This methodology follows the developments and terminology of previous literature
(Nofuentes et al., 2002; Talavera and Nofuentes, 2010; Talavera et al., 2014), and includes the
effects of the recent generation and grid-access charges for the case of Spain.
In the case of Germany, FiTs are provided for 20 years. Since the lifetime of the system is 25
years we have to add those last five years to the present worth of the cash inflows. For the sake
of simplicity we get rid of the taxes and call A to the last element of equation (2), the discount
factor. We call A’ to the same discount factor but for the last 5 years (n=5 instead of 20). Then we
have
𝑃𝑊[𝐶𝐼𝐹(𝑁)] = 𝑃𝑢 ∗ 𝐸𝑝𝑣 ∗ 𝐴 + 𝑃𝑢′ ∗ 𝐸𝑝𝑣 ∗ 𝐴′ (10)
Where the first addend represents the cash inflows of the first 20 years and the second
represents the cash inflows of the remaining 5 years. 𝑃𝑢′ represents the wholesale electricity
price (at which the electricity must be sold once FiTs expire) in the year 20, that is:
𝑃𝑢′ = 𝑃𝑢 ∗ (1 + ε𝑝𝑢 )𝑛′ (11)
Note that 𝑃𝑢 here refers to the current wholesale price of electricity, not to the Feed-in Tariff.
2.1.2. Installation categories
The main obstacle we face in the present work is the temporal and spatial inconsistency of
the installation categories: Residential or small scale (R), Commercial-Industrial or medium
scale (C-I) and Utility or large scale (U). That is, on the one hand, due to the many regulation
changes happened in Spain, which changed the criteria for FiT categories not only in terms of
installed capacity, but also in qualitative terms (rooftop vs. ground-mounted), as summarized in
Table 1. On the other hand, due to the different categorization criteria applied in Germany and
Spain in the data, which make the diffusion data only comparable in general terms. The diffusion
data is structured as follows:

8
Table 1. Installation categories for the diffusion data:
Residential or
small scale
Commercial-
Industrial or
medium scale
Utility or large
scale
Germany <10kW 10-500kW >500kW
Spain <5kW 5kW-1MW >1MW
Figure 1. Installation categories established by each regulation in Spain for the application to
Feed-in Tariffs (RD: Royal Decree; L: Law).
To overcome this limitation we apply the following criteria for the definition of the three
different segments for the calculation of the IRR:
(i) Residential or small scale (R): They face the highest installation and financing costs,
and receive the highest FiTs. As the system is usually rooftop we assume horizontal
tilt.
(ii) Commercial industrial (C-I): they face intermediate installation and financing costs,
and receive the medium FiT levels. As the system is usually rooftop we assume
horizontal tilt.
9
(iii) Utility or large scale (U): They face the lowest installation costs and receive the
lowest FiTs. As the system is usually ground-mounted we assume optimal tilt of the
panels and therefore optimal irradiation.
These criteria allow us to build, although not perfectly consistent categories, coherent and
comparable groups. The data assumed for each category are summarized in the next section.
2.2. Data: determinants of profitability
2.2.1. Static determinants
2.2.1.1. Irradiation
The amount of solar resource is one of the main determinants of profitability. Although
variable along the day and the year, the solar irradiance is constant in the long term. The
electricity yield of the PV system depends mainly on climate conditions (solar irradiation),
technological development (cell efficiency, performance ratio and degradation rate) and
mounting conditions (vertical, horizontal or optimal tilt). Since roofs are not usually designed for
PV systems, we assume horizontal tilt and the country average irradiation for R and C-I
segments. Ground-mounted systems however, can be designed to optimize the irradiation
caught by the panels, and large investors have more flexibility to locate the system in optimal
conditions. Consequently we assume for the U segment optimal tilt and sunniest location
(Andalucia2 in Spain and Bayern in Germany), which entails between 21 and 23% higher PV
yield than the other two segments. This segment is therefore not directly comparable with the
other two, and represents the profitability of PV in the countries’ best conditions.
The data regarding the PV electricity yield of the systems is taken from the PVGIS project
developed by the European Commission. It refers to the potential solar electricity [kWh/kWp]
generated by a 1 kWp system per year with photovoltaic modules mounted at optimal or
horizontal tilt and assuming system performance ratio 0.75. The data represent the average of
2 Murcia is slightly sunnier tan Andalucia, but we chose the latter because is more representative of the
location where most of the utility installations are located.

10
the period 1998-2011 (Šúri M., et al., 2007; Huld T. et al., 2012). Likewise, the efficiency of the
system degrades at an annual rate of 0.8% (Dirk et al., 2012). The comparison between the solar
irradiation and PV yield in both countries can be seen in figure 2:
Figure 2. Global irradiation and solar electricity potential in Spain and Germany.
Source: PV GIS
2.2.1.2. Financing cost
The financing conditions have a significant impact in the profitability of any investment.
Previous literature has paid little attention to this factor, assuming either own capital
investments or hundred per cent financed. According to the information provided by the Spanish
PV Industry association (UNEF), which is consistent with previous literature (Prieto and Hall,
2013), we assume that 80% of the investment is financed at 10 years maturity. The most critical
parameter regarding financing conditions is, however, the interest rate. Although the interest
rate is in principle a dynamic determinant of profitability, as it changes nearly every day,
provided that this is a long term investment the investors discount the future evolution of
interest rates during the maturity of the loan. Therefore, instead of just taking the current
interest rate in each moment of time, we apply the average interest rates for the period 2004-
2015. This is exactly the same duration than the maturity of the loan: 10 years.

11
Likewise, we differentiate amongst the three segments, taking the average interest rate for
household purchase for R segment, the average for loans below 1M€ for C-I segment, and the
average for loans above 1M€ for U segment, according to the ECB. We observe that whilst the
range amongst segments is wide in Spain (3.8-7.2%), interest rates are more homogeneous
amongst segments in Germany (4.2-4.3%).
During the years 2004 and 2005 soft loans have been provided by ICO and IDAE3 with an
interest rate equal to the euribor-6months plus a maximum premium for intermediary financial
institutions of 1,025 percentage points. Since the Euribor of the period has been around 2%, we
assume the soft loans to have an interest rate of 3%.
2.2.1.3. Other static determinants
There is consensus in the literature in the assumption of operation and maintenance cost
(O&M) as 1% of the initial investment (Sick & Erge, 1996; Konen et.al., 2000; Talavera et al.,
2010; Talavera et al., 2014). Likewise, and according to Talavera et al. (2010) we assume an
annual escalation rate of O&M costs of 1%.
2.2.2. Dynamic determinants
2.2.2.1. Electricity price/Feed-in Tariffs
The first dynamic determinant, in the sense that they determine the fluctuations over the
studied period, is the electricity price at which the electricity generated by the system is sold to
the grid. This price is determined by the Feed-in Tariffs (FiTs) established by the governments.
The FiTs consist in preferential electricity prices paid to PV generators. There are usually
different FiT levels for different types of installations (larger installations enjoy lower costs and
therefore receive lower FiTs). In Spain no FiTs were available anymore since 2012 for new
installations, so the electricity price paid to new installations became that of the wholesale
electricity market (pool price). Likewise, we assume an average escalation rate of electricity
3 ICO: Instituto de Crédito Oficial; IDAE: Instituto para la Diversificación y el Ahorro de la Energía.
12
prices of 2% for both countries, in accordance with Talavera et.al. (2010) and EPIA (2011). We
will carry out a sensitivity analysis of both electricity price and its escalation rate in section 4.
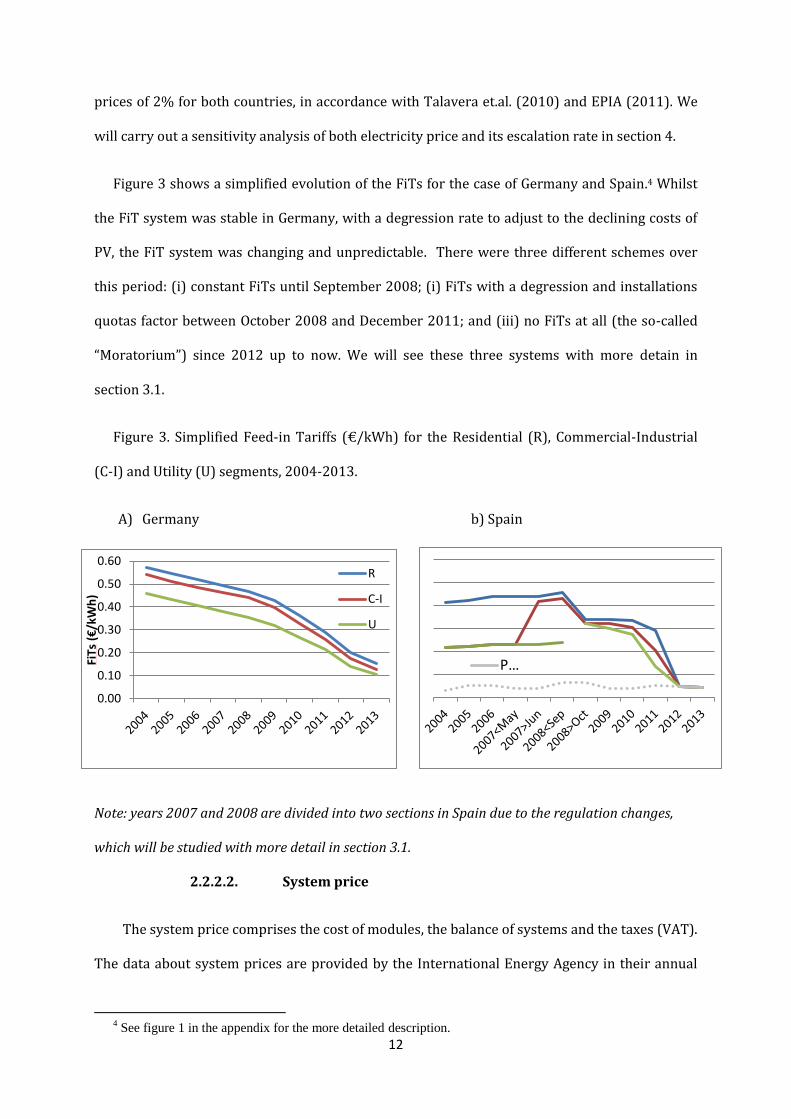
Figure 3 shows a simplified evolution of the FiTs for the case of Germany and Spain.4 Whilst
the FiT system was stable in Germany, with a degression rate to adjust to the declining costs of
PV, the FiT system was changing and unpredictable. There were three different schemes over
this period: (i) constant FiTs until September 2008; (i) FiTs with a degression and installations
quotas factor between October 2008 and December 2011; and (iii) no FiTs at all (the so-called
“Moratorium”) since 2012 up to now. We will see these three systems with more detain in
section 3.1.
Figure 3. Simplified Feed-in Tariffs (€/kWh) for the Residential (R), Commercial-Industrial
(C-I) and Utility (U) segments, 2004-2013.
A) Germany b) Spain
Note: years 2007 and 2008 are divided into two sections in Spain due to the regulation changes,
which will be studied with more detail in section 3.1.
2.2.2.2. System price
The system price comprises the cost of modules, the balance of systems and the taxes (VAT).
The data about system prices are provided by the International Energy Agency in their annual
4 See figure 1 in the appendix for the more detailed description.
0.00
0.10
0.20
0.30
0.40
0.50
0.60
FiTs
(€
/kW
h)
R
C-I
U
P…
13
PV trends reports. These reports provide rough numbers, and only since 2011 they started
differentiating between three categories (before there were only installations below and above
10kW).
There are no data about Spain for the years 2004 and 2005, so we estimate it from the
values of the years 2003 and 2006 assuming a constant evolution. There are no data about
Germany for the year 2004. For the years 2006-2010 there are two ranks of prices: one for
installations below 10KW and the other for those above that level. As we have three categories,
we assume the lowest price per Watt for the large-scale (U), the highest for the small-scale (R),
and the mean for the medium-scale (C-I).
The data is expressed in €/W (nominal power), whilst the PV yield in our equation is
expressed in kWh/kWp (peak power), so we must convert nominal into peak power. The ratio
between the peak and nominal power is neither fixed nor standardized; it varies across
installations5. According to a research carried out by the Spanish PV industry association, the
peak/nominal ratio is 1,1 in the north of Spain and 1,15 in the south (ASIF, 2011:67). We
therefore assume a ratio of 1,13 for Spain as a whole, and a 1,1 ratio for Germany.
We must also include the Value Added Tax. In Spain, VAT has been modified twice during
this decade: from 16 to 18% in July 2010, and from 18 to 21% in September 2012. We add the
VAT for each year and assume 17% and 20% for 2010 and 2012 respectively. The VAT in
Germany was 16% until 2006 and 19% since 2007.
Initial investment subsidies were in place mainly in 2004 and 2005 in Spain, and amounted
up to 40% of the installation cost. According to Bernal-Agustin and Dufo-López (2006:1111), in
the year 2004 IDAE subsidized as an average, 27% of the cost of the installation for power
5 Peak power vs. Nominal power: peak power is the quantity of kW installed in the solar panels, whilst nominal
power refers to the power of the inverter (the device that transforms the energy generated by the panels into
energy suitable for consumption). Peak power is usually higher than nominal power, as the inverter determines
the bottleneck of energy fed into the grid. In other words, having a higher peak power than nominal power
allows using the inverter at a 100% capacity longer than if both values were the same (ASIF, 2011).

14
ratings of less than 100kW, and 11% for installations greater than 100kW”. However, there is
not any official statistical database about financial incentives (neither soft loans nor investment
subsidies). Thus, for each segment we will calculate an upper bound with all possible incentives
(40% subsidy and 3% soft loan), and a lower bound for installations with neither subsides nor
soft loans.
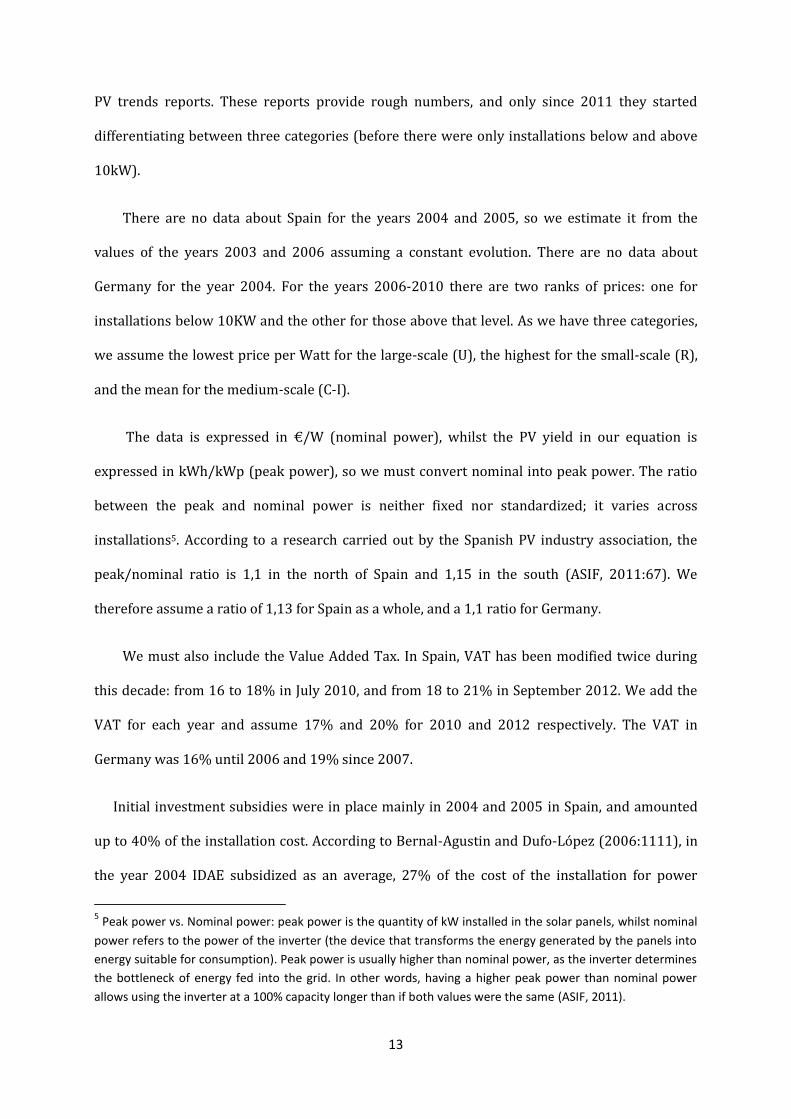
Figure 4. System prices (investment cost) for the Residential (R), Commercial-Industrial (C-I)
and Utility (U) segments, 2005-2013.
a) Germany b) Spain
Source: IEA and own calculations.
Again, we can see that the downward trend in Germany has been more stable during the
studied period. In Spain however, prices kept high until 2008 due to the silicon scarcity
(international factor) and peak demand (national factor) during 2007-2008, and then
plummeted in 2009.
Finally, all the data and assumptions, as well as their sources are summarized in table 2.
2005 2006 2007 2008 2009 2010 2011 2012 2013
0
2,000
4,000
6,000
8,000
10,000
2005 2006 2007 2008 2009 2010 2011 2012 2013
Syst
em
Pri
ce (€
/kW
p) R
C-I
U

15
Table 2. Data summary
LCCUSP
PVIN
(€/kWp)
PVIS
(€/kWp) i (%) Nl (years) PVOM (€/y) ε PVOM (%)
Initial
investment
(System
price)
Investment
subsidy
Annual
interest
rate
Loan
duration
Operation &
Maintenance
costs
Escalation
rate of O&M
costs
Germany Figure 3.A -
R: 4.2
C-I: 4.3
U: 4.2 10 1% of PVIN 1%
Spain Figure 3.B
Up to 40%
(2004-
2005)
R:7.2
C-I:5.3
U:3.8
Source IEA MINETUR,
IDAE
ECB, IDAE
UNEF UNEF
Talavera et
al. (2010)
Konnen et
al. (2000)
PW CIF(N) Charges/taxes
Pu
(€/kWh) ε Pu (%)
EPV
(kWh/y) dg (%)
γ λ
PV
electricity
price/FiTs
Escalation
rate of PV
electricity
price
PV
electricity
yield per
year
Degradat
ion rate
of the PV
system
Grid-access
charge
(€/MWh)
Generation
tax (%)
Germany Figure 4.A
2%
R, C-I: 762
U: 935
0.8%
- -
Spain Figure 4.B
R, C-I:
1,165
U: 1,406
0.5
(since 2011)
7
(since
2013)
Source Regulation
, OMIE
EPIA
(2011) PVGIS
Dirk et
al.
(2012)
RDL 14/2010
RD 1544/2011
RD
15/2012

16
3. Results and discussion
3.1. Regulation
The main financial incentive provided to PV generators was the Feed-in Tariff. As
aforementioned, the FiTs consist in preferential electricity prices paid to PV generators, which
are higher the smaller installation, as it can be seen in figure 3. In Germany, FiTs were provided
for 20 years. The FiTs levels diminished over time for new installations to adapt to the
decreasing costs of the PV technology at a certain rate (degression rate). The installation
categories for receiving FiTs were slightly changed in 2012, and the degression rate was
increased in the last years. A closer look at the German FiT system can be found in Grau (2012
and 2014) and Hoppman et al. (2014).
In Spain, we can differentiate three different regulation schemes during this period (see
figures 1 and 3.B or figure A2 in the appendix):
(i) FiTs: Between 20046 and September 2008 there were constant Feed-in Tariffs
provided to PV generators for 25 years. In June 2007, the FiTs for installations
between 100kW-10MW almost doubled (from 23 to 42 €cent/kWh).
(ii) Quota + degression: In October 2008 the system changed due to the diffusion bubble
created during the previous year. FiT levels decreased, the categories were changed
(from (a) ≤100kW, (b) 100kW-10MW and (c) 10-50MW; to (a’) roof≤20kW, (b’) roof
20kW-2MW, and (c’) ground≤10MW); and both degression rates and installation
quotas for each category were established. Besides, FiTs levels were further
decreased and a grid access charge (0.5€/MWh) established in the year 2011.
(iii) Moratorium: FiTs were finally removed in January 2012, so new installations would
have to sell the electricity generated at pool price. A 7% generation tax was also
established in January 2013.
6 FiTs were in place already since 1998.

17
Del Rio (2008) studies the evolution of the Spanish renewable energy policies between 1998
and 2008 from a regulatory perspective, and more detailed study of the evolution of the PV
regulation and market in Spain can be found in Del Rio and Mir-Artigues (2012, 2014), Mir-
Artigues (2013) and Prieto and Hall (2013).
In conclusion, we can see that the regulation was stable and predictable in Germany, whilst it
was very unstable and erratic in Spain. In addition to the mentioned changes for new
installations, the government also made retroactive cutbacks for installations already
functioning; so that the number of hours remunerated was limited, harming therefore the actual
profitability of existing installations. According to Mir-Artigues et al. those retroactive cutbacks
caused a fall in profitability of around 2 percentage points, remaining always above 7%.
According to UNEF (2013a, 2013b, 2015) these retroactive changes broke the legal certainty of
investors, destroying therefore the profitability expectations created by FiTs, and causing an
unquantifiable damage to the link between expected profitability and diffusion.
3.2. Expected profitability
Expected profitability of PV installations in Germany has ranged between 5 and 12%, being
consistently higher the larger installation. Until 2011 the cost decline was faster than the
degression rate of the Feed-in Tariffs (See figures 3.A and 4.A), leading to an upward trend of the
expected profitability until that year. Since 2011, however, the decline of the FiTs has been faster
than the cost drop, causing the decrease of the profitability, which was in 2013 the lowest of the
period studied.
In Spain, FiTs were not high enough to make PV investment profitable in 2004-2005, so only
installations that could access to investment subsidies (up to 40%) and/or soft loans (3%) could
get positive returns. Between June 2007, and October 2008, when the diffusion bubble happened
(around half of the cumulative installed capacity in 2013 had been deployed in that period

18
according to the National Commission for Market and Competence: CNMC), “intended”7 expected
profitability was lower than 5% for all segments. Paradoxically, it was in 2009-2011, when the
incentives were lowered and the degression rate established, when profitability rocketed,
because the costs (system prices) fell faster than the FiTs (see figures 3.B and 4.B).
Consequently, we find that the profitability bubble (2009-2011) was not the cause of the
diffusion bubble (June 2007- September 2008). On the opposite, PV system prices peaked in
2007-2008 due to both international (silicon scarcity) and national (demand tensions) factors,
and plummeted in 2009-2010 when the demand fell, so the causality seems to be the opposite:
the diffusion bubble was in some extent the cause of the subsequent profitability bubble.
Figure 5. Profitability (Internal Rate of Return, left axis, lines) and diffusion (annual installed
capacity, right axis, bars). Note that the left axes (profitability) are in the same scale, so both
figures are visually comparable, whereas the right axes (diffusion) are in different scales.
A) Germany, 2005-2013 B) Spain, 2004-2013
Note: In Spain there were regulation changes in June 2007 and September 2008. The
profitability values for those two years reflect the situation after the reform. Therefore, the
7 As we will see later, actual expected profitability was higher due to the solar orchads owning structure. But
these levels were the ones intended by the regulation without considering the effect of solar orchads.
-1,600
-600
400
1,400
2,400
3,400
4,400
5,400
6,400
7,400
-5%
0%
5%
10%
15%
20%
25%
200520062007200820092010201120122013
Dif
fusi
on
(M
W)
Pro
fita
bili
ty(I
RR
)
-600
-100
400
900
1,400
1,900
2,400
2,900
-5%
0%
5%
10%
15%
20%
25%
Dif
fusi
on
(M
W)
Pro
fita
bili
ty (
IRR
)

19
R² = 0.5394
-200
0
200
400
600
800
1000
0.00 1.00 2.00 3.00
Net Profitability Index
R² = 0.6835
-1000
0
1000
2000
3000
4000
5000
0.00 1.00 2.00 3.00Net Profitability Index
profitability levels associated with the diffusion bubble of June 2007-September2008 are those
of 2007. Sources: Profitability: own calculations. Diffusion: Fraunhofer, PSE AG and CNMC.
3.3. Diffusion
In Germany, where the regulation was stable and the profitability easily predictable, there
seems to be a link between expected profitability and diffusion, which is stronger the larger
installation. However, not only the level of profitability matters, but also its relative evolution to
the profit rate of the economy. This is reasonable, since a higher profit rate entails a higher
opportunity cost of capital, and the existence of attractive investment opportunities in other
sectors. Therefore, we compute the Net Profitability Index as the ratio between the PV expected
profitability index (2005=100), and the general profit rate of the economy provided by Eurostat
(net returns on net capital stock, 2005=100). We can see then that diffusion accelerates when
the expected profitability increases higher than the profit rate of the economy, and slows down
in the opposite situation. Likewise, the sensitivity of diffusion to the evolution of the Net
Profitability Index seems to be higher the larger installation, which could be explained by the
higher capital mobility amongst sectors of the large investors than that of households and
medium/small firms, for whom investment alternatives are usually more limited.
Figure 6: Correlation between the Net Profitability Index (defined as the ratio between the
expected profitability index of PV and the profit rate index of the economy as a whole), and the
diffusion rate (annual installed capacity) between 2005-2013 for the segments
a) Residential B) Commercial-Industrial C) Utility
R² = 0.322
0
100
200
300
400
500
600
0.00 0.50 1.00 1.50 2.00
Dif
uss
ion
In
de
x
Net Profitability Index

20
In Spain, however, the link between expected profitability and diffusion cannot be drawn. This
might be due to three factors:
(i) The continuous regulation changes: the qualitative change of categories (from
installed capacity to type of installation: rooftop/ground mounted) makes it
impossible to follow the evolution of the different segments along time. Besides, the
retroactive changes broke the legal certainty harming therefore the link between
expected profitability and diffusion, as regulatory risk increased. Finally, the
installation quotas entail a cap on installed capacity, limiting therefore the diffusion
of the technology independently of the expected profitability.
(ii) The external shock caused by the economic and financial crises: the real estate bubble
bust and the subsequent economic crisis caused a capital flight from the construction
and real estate to the PV sector (Del Rio and Mir-Artiges 2012, 2014), due to the
similarities between both sectors, and the innovative “solar orchads” owning
structure, and the financialization of the PV sector (Prieto and Hall 2013:34-35). This
explanation is consistent with our previous finding that not only the static level of
profitability matters, but its relative evolution to the profit rate of the economy.
Thus, although expected profitability were low, its increasing trend relative to the
general profit rate of the economy, (which fell by 10.5% in 2008, and by a cumulative
18% between 2007-2009, the sharpest fall since oil crises in the seventies according
to AMECO database) caused a surge in deployment. Besides, it was regarded as a safe
investment, since it was guaranteed by the government (retroactive cutbacks were
carried out later), in a time of high economic uncertainty, which stresses the
relevance of certainty for the diffusion of novel technologies in particular, and for
investment decisions in general.
(iii) The distortionary effect of the “solar orchads” owning structure: this innovative
owning structure allowed investors to obtain higher profitability levels than those

21
intended by regulators (see fig 4.B). Due to the relevance of this factor in the Spanish
PV bubble we will study it closely in the following section.
3.4. The solar orchads owning structure.
A “solar orchad” is an innovative owning structure for PV installations through which small
investors come together to build a large (and therefore low cost) installation, formed by many
small ones so that they can receive the highest Feed-in Tariffs. Solar orchads are usually ground-
mounted, so they enjoy lower costs than small scale rooftop installations, and they are able to
install optimally inclined solar panels, being therefore able to minimize costs and maximize
revenues; both for the optimal exploitation of solar irradiance, and for the application of small-
scale high FiTs.
We can therefore analyse the impact of solar orchads, both in terms of the profitability
increase for investors, and in terms of the extra-policy cost caused. We define “extra-policy cost”
as the difference between the FiT actually paid to solar orchads, and the FiT they would receive
in the case that the solar orchad were considered as one installation. Profitability soars to a
range between 11.8-13% depending on the FiT finally received: medium or high. We can identify
4 different cases depending on the FiT they actually receive (medium or high), and the one they
should receive according to their actual total size (low or medium FiTs for large or medium scale
installations respectively).
As shown in table 2, the medium scale (C-I) solar orchads receiving medium FiTs do not
entail any extra policy cost, since its higher profitability comes from cost minimization and
system optimization. The other cases, however, entail an extra policy cost, since the FiT these
installations receive is higher than the one they would get if the installation were considered as
one. The paradigmatic case is the large installation (10-50MW) receiving the high FiT for small
installations (≤100kW), increasing expected profitability by 11.3 percentage points and causing
an extra-policy cost of 210.62€ per Mega Watt hour generated.
Table 3: classification and impact of solar orchads:

22
Actual
scale
Actual
FiT
Profitability Extra policy
cost
(€/MWh)
Intended
(%)
Achieved
(%) Gain (pp)
1 Medium
(C-I)
Medium
4.2 11.8 7.6 0
2 High 13 8.8 22.88
3 Large
(U)
Medium 1.7
11.8 10.1 187.74
4 High 13 11.3 210.62
Solar orchads have played a determinant role in the Spanish PV diffusion bubble. Although
the profitability provided by the FiTs was designed to lie below 5% for all installation types in
average conditions, this owning structure allowed investors to minimize costs (through lower
installation, O&M and financing costs) and maximize revenues (through system optimization
and FiTs rent-seeking), achieving expected average profitability levels of between 11.8-13% in a
time of plummeting profit rate, and causing a high extra-policy cost that would lead to the
cutbacks between 2008-2011 and to the total collapse of the FiT system in 2012.
3.5. A simple conceptual model
With all the insights obtained during the previous analysis, we can build a simple conceptual
model to explain the diffusion process of PV technology. The fact that the economic and
regulatory conditions in Germany and Spain, as well as the diffusion process, were so different
between each other, confirms the suitability of this model to explain the diffusion process of
novel technologies.
The expected profitability (𝜋𝑃𝑉𝑒 ) is the main variable determining the diffusion process of the
PV technology. The expected profitability, likewise, is determined by the costs (system prices),
and the revenues (electricity prices). Solar irradiation, whilst obviously affecting the profitability
level of the technology, does not dynamically affect its evolution over time. Since renewable
energies have preferential access to electricity markets we do not have to care about demand
issues here. Regulation plays a key role on ensuring revenues through FiTs and removing

23
uncertainties associated to demand factors by establishing that all electricity generated by the
PV installation will be purchased by the electricity system. However, not only the level of
profitability matters, but its dynamic evolution to the profit rate of the economy (net surplus on
net capital stock: 𝜋), since it represents the opportunity cost of capital and the existence of
better economic alternative in other sectors of the economy.
We can construct then, the Net Profitability Index as the factor between the expected
profitability index and the index of the profit rate of the economy. By doing so, we can see the
dynamic evolution of these two factors. If the capital mobility between sectors is high we can
expect that the difference between the PV expected profitability and the profit rate of the
economy and therefore the fluctuations of the NPI will be low, since capital will quickly switch to
the more profitable sectors. Likewise, the segments with higher capital mobility (β) will show a
stronger relationship between the NPI and the diffusion rate, since relative profitability changes
will quickly translate into higher investment. Thus, the NPI will increase when the profitability
of PV grows faster than the general profit rate of the economy (causing a higher diffusion rate),
and will decrease otherwise.
The last relevant factor is uncertainty (δ). The link between the NPI and the diffusion rate will
be significant as far as the expected profitability is a reasonably certain condition. That is, even if
the expected profitability is high and increasing, it will not entail diffusion if it is uncertain.
Figure 7 show graphically this simple conceptual model and equation 12 presents its analytical
formalization. In the rest of this section we will briefly explain the diffusion process in Germany
and Spain according to this framework.

24
Figure 7. Conceptual model Regulation-Profitability-Diffusion.
𝐷 =𝜋𝑃𝑉
𝑒
𝜋(1 − 𝛿)𝛽 (12)
In Germany, expected PV profitability grew faster than the profit rate of the economy
between 2005 and 2011 leading to an increasing NPI and therefore diffusion rate. Between
2011-2013 the diffusion rate was still positive but declining due to the lower NPI caused
likewise by the faster drop of the PV expected profitability than the fall of the profit rate. Since
both the regulation and the market dynamics were stable and predictable in Germany,
uncertainty was low and therefore the link between the NPI and the diffusion rate relatively
strong. The larger investing segment (with higher capital mobility) showed indeed a stronger
correlation between the NPI and the diffusion rate.
In Spain, on the contrary, the link between NPI and diffusion cannot be seen, due to the
factors mentioned in section 3.3 and to the legal uncertainty caused by the retroactive cutbacks
which broke the legal certainty provided by the previous regulations. The diffusion bubble of
2007-2008 happened because the PV profitability soared (from values below 5% and even
negative to up to 13% considering solar orchads) in a moment of historical fall of the profit rate
of the economy. NPI therefore rocketed in a moment of legal certainty (retroactive cutbacks
were made afterwards), when the link between NPI and diffusion was strong, making
consequently the diffusion rate to go through the roof. Quota establishment in 2008 broke any

25
further link between profitability and diffusion by establishing a limit on the amount of installed
capacity able to receive FiTs.
4. Competitiveness assessment/sensitivity analysis
Finally, we carry out a sensitivity analysis which can be interpreted as a competitiveness
assessment. We do so by estimating how a change in the main market parameters would affect
profitability. The base case corresponds to the Utility segment (large scale) in 2013, selling the
electricity at wholesale price (i.e. no FiTs). We can see then how far from being profitable is the
technology at current market prices. As we assume 80% of the investment is externally financed
at market interest rates, this calculations include the cost of debt, but not the remaining cost of
equity (or opportunity cost of the own capital). Consequently, the zero threshold would be the
point where all costs are covered at zero profit for the investor. Competitiveness, therefore,
would be achieved when profitability covers the opportunity cost of capital (return on equity
(ROE) demanded by investors). The ROE demanded by investors is the risk free interest rate
plus a risk premium, which is different amongst countries and sectors, and likely to vary over
time. Where to set the competitiveness threshold is, thus, a matter of discussion.
Previous literature has shed some light regarding the cost of capital of renewable
investments in Europe. Table 4 summarizes the most representative estimations of the
Weighted Average Cost of Capital (WACC) and Return On Equity (ROE) for Germany and Spain,
for PV (EPIA, 2011) and onshore wind (Noothout et al. 2016). The conclusion we can draw for
these numbers is that the cost of capital for renewable investments is structurally higher in
Spain than in Germany, according to Noothout et al. (2016: 141), driven mainly by the additional
risk posed by policy design and sudden regulatory change, which supports our previous analysis
and stresses the significant role of regulations on providing certainty and the disastrous
consequences of legal uncertainty.
Table 4. Weighted Average Cost of Capital (WACC) and return On Equity (ROE) estimated for
Photovoltaics (PV) and Onshore Wind (OW)

26
WACC ROE
Germany 3.4-4.5% (OW)
4.4-6.5% (PV) 6-9% (OW)
Spain 10% (0W)
6.1-8.2% (PV) 13-15% (OW)
Sources: EPIA 2011 for PV and Noothout et al. 2016 for OW.
Figure 8 shows the IRR as a function of the main market determinants: system price, current
electricity price and its annual escalation rate, departing from the base case of the utility
segment in the year 2013 (see table 5). We find, on the one hand, that the IRR responds
exponentially to PV cost declines and linearly to both the current electricity price and its
escalation rate, which is consistent with the results of Talavera et al. (2010). On the other hand,
we find that the sensitivity of IRR is higher to the current electricity price than to its escalation
rate in Germany, and the opposite in Spain.
If we simplify the competitiveness-cost of capital discussion mentioned above and set a
threshold at 5% IRR, Spain would need either a 35% cost drop, a 3.5 times higher electricity
price or a 6% annual increase of electricity prices to achieve competitiveness. Germany would
achieve a zero net position when costs decline by 50%, electricity prices double or its escalation
rate reaches an annual 7%; and competitiveness when the system price falls by 65%, electricity
price triples or its escalation rate reaches 11%.
We should take these results with caution, not only for the competitiveness-cost of capital
discussion already mentioned, but also for the discussions regarding the real market value of PV
electricity, and its downwards evolution as penetration increases due to the cannibalization
effect caused by the merit order effect (Sensfuß et al., 2008; Hirt et al. 2013; Ueckerdt, 2013).

27
Table 5. Base case parameters
PVIN (€/kWp) Pu (€/kWh) ε Pu (%)
Initial investment
(System price)
PV electricity
price/FiTs
Escalation rate of
PV electricity price
Germany 1,515 0.03778
2%
Spain 1,285 0,04426
Figure 8. Sesitivity analysis: profitability (IRR) as a function of the initial investment (system
price, PVIN), electricity price (Pu) and escalation rate of electricity price (ε Pu)
Conclusions
We have drawn a conceptual model to explain the diffusion process of PV technology in
Germany and Spain as a function of the expected profitability and regulation design. We have
found that not only the expected profitability level matters, but its dynamic comparison with the
profit rate of the economy, which represents the opportunity cost of capital and the existence of
investment opportunities in other sectors. This model is able to explain the PV diffusion process
in Spain and Germany over the period 2004-2013, and is likely to be extensible to the diffusion
process of other technologies. More research is needed to empirically test this model. Although
uncertainty is not an observable parameter, it could be considered as constant and test for
-10%
-5%
0%
5%
10%
15%
20%
25%
1 1.5 2 2.5 3 3.5 4 4.5 5
1 0.9 0.8 0.7 0.6 0.5 0.4 0.3 0.2
Pro
fita
bili
ty (
IRR
: %
)
Variation factor: -10%
-5%
0%
5%
10%
15%
20%
25%
1 1.5 2 2.5 3 3.5 4 4.5 5 5.5
1 0.9 0.8 0.7 0.6 0.5 0.4 0.3 0.2 0.1
Pro
fita
bili
ty (
IRR
: %
)
Variation factor
PVin
Pu
εpu
Pu & εpu
PVin
Pu & εpu
PVin
Pu & εpu
PVin

28
structural breaks (e.g., when retroactive cutbacks are carried out). Likewise, capital mobility is
not directly observable, but we can assume that large investors have higher capital mobility than
small ones.
In Germany, we have observed a clear correlation between profitability and diffusion, which
is stronger the larger installation types or investing segments. In Spain, however, the correlation
between profitability and diffusion cannot be seen due to the external shock derived from the
financial and economic crises, the continuous regulation changes and quota establishment, and
the distortionary effect of the “solar orchads” owning structure. This owning structure allowed
investors to obtain average profitability levels up to 13%, just in 2008 when the profit rate of the
economy was experiencing its sharpest drop since the seventies, and even though the intended
average profitability provided by FiTs was supposed to lie below 5%.
Consequently, the profitability bubble in Spain was not the cause of the diffusion bubble, but
in some extent the consequence, as it kept system prices high due to demand pressures until the
bust in 2008. Then system prices fell much faster than FiTs, causing a profitability bubble just
when the government was decreasing the incentives. This profitability bubble did not translate
into another diffusion bubble due to the establishment of installations quotas. The cause of the
diffusion bubble was, therefore, the sharp increase of the net profitability index (expected
profitability of PV over the profit rate of the economy), due to the solar orchards owning
structure, which allowed investors to increase profitability up to 13%, and the shrink of the
profit rate of the economy due to financial and economic crisis (it fell by 10.5% in 2008, and by a
cumulative 18% between 2007-2009).
In order to achieve a 5% return on investment without any incentives for large installations
optimally located, the system price should drop by 35% relative to 2013 levels in Spain,
wholesale electricity price should be 3.5 times higher or its annual escalation 6%. In Germany,
the same result would be obtained when either the system price falls by 65%, electricity price
triples or its escalation rate reaches an annual 11%.

29
In conclusion, we have found that the diffusion process of PV depends mainly on the joint
evolution of the expected profitability of PV and the profit rate of the economy (what we have
called Net Profitability Index), link which is stronger the higher capital mobility of the investing
segment. The regulation plays a major role not only by allowing positive profitability levels, but
also by providing certainty about the future realization of current profitability expectations.
Further research is needed to empirically test our simple conceptual model with richer
statistical data, and extend its application to the analysis of the diffusion process of other novel
technologies. Likewise, in order to accurately assess the competitiveness of PV, more research is
needed on market value of non-dispatchable electricity, the cannibalization effect caused by
higher PV penetration levels.

30
References
Alkemade, F; Suurs, Roald A.A. (2012): “Patterns of expectations for emerging sustainable technologies”.
In: Technological Forecasting and Social Change 79 (3), S. 448–456
ASIF - Asociación de la industria fotovoltaica
_(2009). Hacia la consolidación de la energía fotovoltaica en España. Informe annual 2009.
_ (2011). Hacia el crecimiento sostenido de la fotovoltaica en España. Informe annual 2011.
Bernal-Agustín and Dufo López (2006). Economical and environmental analysis of grid-connected
photovoltaic systems in Spain. Renewable Energy 31, pp. 1107-1128.
Chiarioni D, Chiesa V, Colasanti L, Cucchiella F, D’Adamo I, Frattini F, (2014). Evaluating solar energy
profitability: A focus on the role of self-consumption. Energy Conversion and Management 88, pp.
317–331.
Colmenar-Santos A, Campíñez-Romero S, Pérez-Molina C, Castro-Gil M (2012). Profitability analysis of
grid-connected photovoltaic facilities for household electricity self-sufficiency. Energy Policy 51,
pp.749–764.
Del Rio and Mir-Artigues
_(2012). Support for solar PV deployment in Spain: some policy lessons. Renewable and sustainable
Energy Reviews, 16, pp. 5557-5566.
_(2014). A Cautionary tale: Spain’s solar PV investment bubble. International Institute for Sustainable
Development.
Dirk C. and Kurtz Sarah (2012). Photovoltaic degradation risk. National Renewable Energy Laboratory,
presented at the 2012 World Renewable Energy Forum, Denver, Colorado, May 13-17, 2012.
Edenholfer O, Hirth L, Knopf B, Pahle M, Schömer S, Schmid E, Ueckerdt F. (2013). On the economics of
renewable energy sources. Energy Economics Volume 40, Supplement 1, December 2013, Pages
S12–S23. Supplement Issue: Fifth Atlantic Workshop in Energy and Environmental Economics.
EPIA – European Photovoltaic Industry Association
_(2011). Solar Photovoltaics. Competing in the energy sector. On the road to competitiveness.
http://helapco.gr/pdf/tn_jsp.pdf
_ (2014). Global market outlook for photovoltaics 2014-2018.
http://www.kigeit.org.pl/FTP/PRCIP/Literatura/093_EPIA_Global_Market_Outlook_for_Photovoltaics
_2014-2018.pdf
EPIA and GP – European Photovoltaic Industry Association and Greenpeace (2011). Solar photovoltaic
electricity empowering the world.
http://www.greenpeace.org/international/Global/international/publications/climate/2011/Final
%20SolarGeneration%20VI%20full%20report%20lr.pdf
Grau T.
_(2012). Responsive adjustment of feed-in tariffs to dynamic PV technology development Discussion
papers 1189. German Institute for Economic Research.
_(2014). Comparison of Feed-in Tariffs and tenders to remunerate solar power generation. Discussion
papers 1363. German Institute for Economic Research.
Hirth, L. (2013): The Market Value of Variable Renewables. Energy Policy 38, 218-236
Huld T, Müller R, Gambardella A. (2012). A new solar radiation database for estimating PV performancein
Europe and Africa. Solar Energy 86 (2012) 1803-1815.

31
IEA – Internation Energy Agency (2014). Technology Roadmap Solar Photovoltaic Energy. Energy
Technology perspectives.
https://www.iea.org/publications/freepublications/publication/TechnologyRoadmapSolarPhotov
oltaicEnergy_2014edition.pdf
Ireland, N. and P. Stoneman, (1986). Technological Diffusion, Expectations and Welfare. Oxford Economic
Papers, 38(Z), 283-304, July 1986.
Jordan D. C., and Kurtz S. R. (2013). Photovoltaic Degradation Rates—an Analytical Review. Progress in
Photovoltaics: Research and Applications 21, pp. 12-29.
Klessmann C, Held A, Rathmann M, Ragwitz M (2011). Status and perspectives of renewable energy policy
and deployment in the European Union-What is needed to reach the 2020 targets? Energy Policy 39
(2011) 7637-7657.
Mir-Artigues P, (2012). La regulación fotovoltaica y solar termoeléctrica en España. Cuadernos económicos
del ICE, 83, pp. 185-205.
Mir-Artigues P. and del Río E. (2014). Combibing tariffs, investment subsidies and soft loans in a renewable
electricity deployment policy. Energy policy 69, pp. 430-442.
Mir-Artiges P, Cerá E, Del Río P. (2015). Analyzing the impact of cost-containment mechanisms on the
profitability of solar PV plants in Spain. Renewable and Sustaibable Energy Reviews 46, pp. 166-177.
MIT – Massachusetts Institute of Technology 2015. The future of Solar Energy. Energy Initiative
Massachusetts Institute of Technology.
https://mitei.mit.edu/system/files/MIT%20Future%20of%20Solar%20Energy%20Study_compre
ssed.pdf
Nofuentes G, Aguilera j, and Muñoz FJ (2002). Tools for the Profitability Analysis of Grid-Connected
Photovoltaics. Progress in photovoltaics: research and applications. Prog. Photovolt: Res. Appl.
2002; 10:555–570
Paul Noothout P, de Jager D, Tesnière L,van Rooijen S, Karypidis N, Brückmann R, Jirouš F, Breitschopf B,
Angelopoulos D, Doukas H, Konstantinavičiūtė I, Resch G. (2016). The impact of risks in renewable
energy investments and the role of smart policies. Diacore project.
http://diacore.eu/images/files2/WP3-Final%20Report/diacore-2016-impact-of-risk-in-res-
investments.pdf
Prieto, P and Hall CAS. (2013). “The historical, legal, political, social and economic context of solar
photovoltaics in Spain”. In: Spain’s photovoltaic revolution. The energy return on investment.
Springer, pp. 21-39.
REN21 – Renewable Energy Policy Network for the 21st Century (2015).Renewables 2015. Global Status
report.
http://www.ren21.net/wp-content/uploads/2015/07/REN12-GSR2015_Onlinebook_low1.pdf
Rosenberg, N. (1976). On technological expectations. The Economic Journal, 86, 1976, pp. 523-535
Sensfuß F, Ragwitza M,Genoeseb M. (2008). The merit-order effect: A detailed analysis of the price effect of
renewable electricity generation on spot market prices in Germany. Energy Policy. Volume 36, Issue
8, August 2008, Pages 3086–3094.
Spertino F, Di Leo P, Cocina V. (2013). Economic analysis of investment in the rooftop photovoltaic systems:
a long-term research in the two main markets. Renewable and Sustainable Energy Reviews 28, pp.
531-540.
32
Šúri M, Huld T. A., Dunlop E. D., Ossenbrink H. A. (2007). Potential of solar electricity generation in the
European Union member states and candidate countries. Solar Energy 81 (2007) 1295–1305.
Talavera DL, Nofuentes G, Aguilera J. (2010). The internal rate of return of photovoltaic grid-connected
systems: a comprehensive sensitivity analyses. Renewable Energy 35, pp. 101–111.
Talavera DL, Nofuentes G, Aguilera J, Fuentes M. (2007). Tables for the estimation of the internal rate of
return of photovoltaic grid connected systems. Renewable and Sustainable Energy Reviews 11, pp.
447–466.
Talavera DL, De la Casa J, Mu Talavera DL, Nofuentes G, Aguilera J oz-Cerón, E, Almonacid, G (2014). Grid
parity and self consumption with photovoltaic systems under the present regulatory framework in
Spain. The case of the University of Jaén Campus. Renewable and Sustainable Energy Reviews 33, pp.
752–771.
UNEF – Unión Española de Fotovoltaica
_(2013a). Hacia nuevos modelos de desarrollo para la energía solar fotovoltaica. Informe anual 2013.
_(2013b). La energía fotovoltaica conquista el Mercado. Informe anual 2014.
_(2015). La energía fotovoltaica una alternativa real. Informe anual 2015.
WBGU – German Advisory Council on Climate Change (2011) . World in transition. A social contract
towards sustainability.
http://www.wbgu.de/fileadmin/templates/dateien/veroeffentlichungen/hauptgutachten/jg2011/
wbgu_jg2011_en.pdf
E-references
NREL (2016) http://www.nrel.gov/ncpv/images/efficiency_chart.jpg

33
Apendix
Figure A1: Feed-in Tariffs structure in Germany /(€cesnts/kWh)
On building Open space a b c d e
2004-2012 <30kWp 30-100kWp 100kWp-
1MWp >1MW
2012-2013 <10kWp 10-40kWp 40kWp-1MWp 1-10MWp <10MWp
Figure A2. FiTs structure, regulation schemes and Pool electricity price in Spain (€/kWh).
00
10
20
30
40
50
60
70
Jan
Mai
Sep
Jan
Mai
Sep
Jan
Mai
Sep
Jan
Mai
Sep
Jan
Mai
Sep
Jan
Mai
Sep
Jan
Mai
Sep
Jan
Mai
Sep
Jan
Mai
Sep
Jan
Mai
Sep
2004 2005 2006 2007 2008 2009 2010 2011 2012 2013
a b c d e
0
0.05
0.1
0.15
0.2
0.25
0.3
0.35
0.4
0.45
0.5
Mar
ch
July
No
vem
be
r
Mar
ch
July
No
vem
be
r
Mar
ch
July
No
vem
be
r
Mar
ch
July
No
vem
be
r
Mar
ch
July
No
vem
be
r
Mar
ch
July
No
vem
be
r
Mar
ch
July
No
vem
be
r
Mar
ch
July
No
vem
be
r
Mar
ch
July
No
vem
be
r
Mar
ch
July
No
vem
be
r
Mar
ch
July
No
vem
be
r
19982003
2004 2005 2006 2007 2008 2009 2010 2011 2012 2013 2014
€/k
Wh
≤100kW ≤100kW
roof≤20kW
100KW-50MW
Pool
100kW-10MW
10-50MW
roof 20kW-2MW ground≤10MW
FIT Cap + degression Moratorium
RD 2818/1998
RD 436/2004
RD 661/2007
RD 1578/2008
RD 1565/2010
RDL 1/2012
γ: grid acces charge
λ: generation charge
Related Documents