209 | Page PROFITABILITY ANALYSIS IN SELECT CEMENT COMPANIES -A DU PONT APPROACH Dr. K. Bhagyalakshmi 1 , Dr. P. Krishnama Chary 2 1 Lecturer, Dept. of Commerce and Business Management, University College for Women, Kakatiya University, Warangal, Telangana. (India) 2 Professor, University College of Commerce and Business Management and Director IQAC, Kakatiya University, Warangal, Telangana, (India) ABSTRACT The profit margin measures the relationship between profit and sales. Financial soundness of a firm is depends upon its profitability. The management of the firm naturally eager to measure its operating efficiency. Similarly the owners invest their funds in the expectation of reasonable returns. The operating efficiency of a firm and its ability to ensure adequate returns to its shareholders depends ultimately on the profits earned by it. Cement is vital to the construction sector and all infrastructural projects. The construction sector alone constitutes 7 per cent of the country's gross domestic product (GDP). Since the cement sector notably plays a critical role in the economic growth of the country, the present paper focuses on the analysis of profitability of the six selected cement companies viz., Ultra Tech, The India, J.K, ACC, Ambuja and Madras Cements Ltd. during 10 years period from 2003-04 to 2012-13, in terms of P/V Ratio, Operating Profit Ratio, Net Earnings Ratio, Dividend Pay Out and Earnings Retention Ratios etc. by using the Statistical techniques like Percentages, Ratios, Averages, Standard Deviation (S.D), coefficient of variation (C.V) and Du Pont Approach. Since the Return on Investment (ROI) is one of the most successful yet simple technique ever conceived to aid both decision-making and performance evaluation, it also analysed in detail in this paper. The paper concludes that, the highest average P/V ratio, OPR and NER and ROI are observed in Ambuja Cements Ltd. among the selected cement companies. Keywords: DPO, NER, OPR, P/V, ROI etc. I. INTRODUCTION The profit margin measures the relationship between profit and sales. Financial soundness of a firm is depends upon its profitability. The management of the firm naturally eager to measure its operating efficiency. Similarly the owners invest their funds in the expectation of reasonable returns. The operating efficiency of a firm and its ability to ensure adequate returns to its shareholders depends ultimately on the profits earned by it. The profitability of a firm can be measured by following profitability ratios. 1.1. Contribution Margin Contribution margin concept indicates the profit potential of a business enterprise and also highlights the relationship between cost, sales and profit. Contribution margin is the excess of sales revenue over variable

Welcome message from author
This document is posted to help you gain knowledge. Please leave a comment to let me know what you think about it! Share it to your friends and learn new things together.
Transcript

209 | P a g e
PROFITABILITY ANALYSIS IN SELECT CEMENT
COMPANIES -A DU PONT APPROACH
Dr. K. Bhagyalakshmi1, Dr. P. Krishnama Chary
2
1Lecturer, Dept. of Commerce and Business Management, University College for Women,
Kakatiya University, Warangal, Telangana. (India)
2Professor, University College of Commerce and Business Management and Director IQAC,
Kakatiya University, Warangal, Telangana, (India)
ABSTRACT
The profit margin measures the relationship between profit and sales. Financial soundness of a firm is depends
upon its profitability. The management of the firm naturally eager to measure its operating efficiency. Similarly
the owners invest their funds in the expectation of reasonable returns. The operating efficiency of a firm and its
ability to ensure adequate returns to its shareholders depends ultimately on the profits earned by it. Cement is
vital to the construction sector and all infrastructural projects. The construction sector alone constitutes 7 per
cent of the country's gross domestic product (GDP). Since the cement sector notably plays a critical role in the
economic growth of the country, the present paper focuses on the analysis of profitability of the six selected
cement companies viz., Ultra Tech, The India, J.K, ACC, Ambuja and Madras Cements Ltd. during 10 years
period from 2003-04 to 2012-13, in terms of P/V Ratio, Operating Profit Ratio, Net Earnings Ratio, Dividend
Pay Out and Earnings Retention Ratios etc. by using the Statistical techniques like Percentages, Ratios,
Averages, Standard Deviation (S.D), coefficient of variation (C.V) and Du Pont Approach. Since the Return on
Investment (ROI) is one of the most successful yet simple technique ever conceived to aid both decision-making
and performance evaluation, it also analysed in detail in this paper. The paper concludes that, the highest
average P/V ratio, OPR and NER and ROI are observed in Ambuja Cements Ltd. among the selected cement
companies.
Keywords: DPO, NER, OPR, P/V, ROI etc.
I. INTRODUCTION
The profit margin measures the relationship between profit and sales. Financial soundness of a firm is depends
upon its profitability. The management of the firm naturally eager to measure its operating efficiency. Similarly
the owners invest their funds in the expectation of reasonable returns. The operating efficiency of a firm and its
ability to ensure adequate returns to its shareholders depends ultimately on the profits earned by it. The
profitability of a firm can be measured by following profitability ratios.
1.1. Contribution Margin
Contribution margin concept indicates the profit potential of a business enterprise and also highlights the
relationship between cost, sales and profit. Contribution margin is the excess of sales revenue over variable

210 | P a g e
expenses. From contribution margin, fixed expenses are deducted giving finally operating income or loss.
Contribution margin is thus used to recover fixed costs. Once the fixed costs are recovered, any remaining
contribution margin adds directly to the operating income of the firm. Contribution margin is a highly useful
technique for planning and decision- making by the management. The contribution margin can also be
expressed in the form of a percentage. The contribution margin ratio is also known as “Contribution to Sales”
(C/S) ratio or Profit-Volume (P/V) ratio. This ratio denotes the percentage of each sales rupee available to cover
the fixed costs and to provide operating income to a firm. The ratio helps in knowing the effect on income of a
firm due to increase or decrease in sales volume. The P/V ratio is useful to management in deciding whether to
increase sales volume.
1.2. Operating Profit Margin
The operating profit (and net profit margin) is an indicative of management‟s ability to operate the business with
sufficient success not only to recover from revenues of the period, the cost of merchandise or services, the
expenses of operating the business (including depreciation) and the cost of borrowed funds, but also to leave a
margin of reasonable compensation to the owners for providing their capital at risk.
1.3. Net Profit Margin
The net profit margin measures the relationship between net profits and sales. The ratio of net profit (after
interest and taxes) to sales essentially expresses the cost price effectiveness of the operation. A high net profit
margin would ensure adequate return to the owners as well as enable a firm to with stand adverse economic
conditions when selling price is declining cost of production is rising and demand for the product is falling. A
low net profit margin has the opposite implications. However, a firm with low profit margin can earn a high rate
of return on investment if it has a higher inventory turnover. The profit margin should, therefore, be evaluated in
relation to the turnover ratio. In other words, the overall rate of return is the product of the net profit margin and
the investment turnover ratio.
1.4. Return on Investment (Du Pont Approach)
Return on investment is one of the most successful yet simple technique ever conceived to aid both decision-
making and performance evaluation. This technique was first developed by Du Pont Company for analysing and
controlling financial performance. It brings together the activity ratios and profit margin on sales and shows how
these ratios interact to determine profitability of assets.
According to “Du Pont Approach” Return on investment can be computed with the help of the following
formula:
Return on Investment (ROI) = Sales / Total Assets * Earnings After Tax / Sales
The first term of the equation expresses the total asset turnover. This measures efficiency of asset management.
Other things being equal, the greater the index, the more efficiently assets are being managed. The second term
of the Du Pont analysis exhibits the return on sales ratio. It measures efficiency of expense control since the
difference between sales and earnings after tax presents the expenses and taxes of the company, the smaller
these expenses, the higher will be the ratio of earnings after taxes to sales. In other words, larger return on sales
would mean the management success in controlling expenses. Thus, the second term of the Du Pont analysis is

211 | P a g e
an index of expense control. If the index of asset management efficiency is multiplied by the index of expense
control, the result is a magnified index of the company‟s financial well being. In order to make the analysis
more meaningful the ROI of the company must be compared with industry averages and with the company‟s
own ROI of the past years. Where the company‟s ROI is below the industry average, the Du Pont analysis
provides sufficient clue to deficiency in asset management or absence of effective expense control or both.
Further, if a comparative study of the company‟s ROI of the past few years reveals declining tendency, if
focuses attention on the management efficiency of the company. Thus calls for prompt corrective action before
the situation goes out of control.
II. NEED FOR THE STUDY
The cement sector notably plays a critical role in the economic growth of the country and its journey towards
conclusive growth. Cement is vital to the construction sector and all infrastructural projects. The construction
sector alone constitutes 7 per cent of the country's gross domestic product (GDP). The industry occupies an
important place in the Indian economy because of its strong linkages to other sectors such as construction,
transportation, coal and power. India is the second largest producer of quality cement in the world. The cement
industry in India comprises 183 large cement plants and over 365 mini cement plants. Currently there are 40
players in the industry across the country. Since the operating efficiency of a firm and its ability to ensure
adequate returns to its shareholders depends ultimately on the profits earned by it and Return on Investment is
the ultimate parameter of the financial performance of a firm, the need is felt to undertake a study on the
profitability of the selected cement companies.
III. OBJECTIVES
The following are the objectives of the study.
1) To present the conceptual framework of profit margin.
2) To analyse the profitability of select cement companies in terms of Profit-Volume (P/V) Ratio,
Operating Profit Ratio (OPR) and Net Earnings Ratios (NER) including Dividend Pay Out (DPO) and
Earnings Retention Ratios (ERR).
3) To examine the Return on Investment (ROI) of select cement companies by using the Du Pont
Approach.
IV. SOURCES OF DATA AND METHODOLOGY
4.1. Sources of Data: The present study is based on secondary data. The sources of secondary data consists of
Annual Reports, circulars, research periodicals, Text Books, news papers like Economic Times, websites and
other published sources. The data collected from the above sources for the period of 10 years from 2003-04 to
2012-13.
4.2. Methodology: The following methodology is adopted for conducting the study.
Aggregate financial variables relating to profitability of selected cement companies are processed, tabulated,
analyzed and interpreted for a period of 10 years i.e. from 2003-04 to 2012-13 with the help of statistical

212 | P a g e
techniques like Percentages, Ratios, Averages, Standard Deviation (S.D), and Coefficient of Variation (C.V) and
also Du Pont Approach. Finally conclusions have been drawn based on the facts revealed by the study.
V. SELECTION OF SAMPLE
For the purpose of the present study, six cement companies have been selected as sample namely, 1.Ultra-tech
Cement Ltd., 2. The India Cements Ltd., 3.J.K Cement Ltd., 4. ACC Ltd., 5. Ambuja Cements Ltd. and 6.
Madras Cements ltd.
VI. ANALYSIS AND DISCUSSIONS
The collected data of selected companies have been analysed as under.
Now it is proposed to examine the structure of profitability of the selected cement companies in terms of P/V
Ratio, Operating Profit ratio and Net Earnings ratio. These ratios are based on the premise that a firm should
earn sufficient profit on each rupee of sales. If adequate profits are not earned on sales, there will be difficulty in
meeting the operating expenses and no returns will be available to the owners.
6.1. P/V Ratio
The analysis of P/V ratio of the selected cement companies is given in TABLE 1 during the study period. All the
selected companies have shown an increase in the contribution margin in absolute terms from 2003-04 to
Table-1 P/V Ratio
(Source: Annual Reports)
Year
/Company 2003-04 2004-05 2005-06 2006-07 2007-08 2008-09 2009-10 2010-11 2011-12 2012-13 Avg. S.D C.V
Ultra-tech
Cement
Ltd.
21.68 16.38 19.93 25.44 28.08 26.45 27.36 25.00 24.14 23.70 23.82 3.60 15.13
The India
Cements
Ltd
22.17 19.75 16.76 29.69 33.93 27.90 21.29 15.75 24.49 21.44 23.32 5.75 24.66
J.K.
Cement
Ltd.
18.19 18.41 24.32 28.45 22.63 26.76 20.14 22.85 22.65 22.71 3.49 15.38
ACC Ltd. 29.57 31.24 30.23 30.59 29.01 30.10 26.23 25.01 22.00 22.09 27.61 3.52 12.75
Ambuja
Cements
Ltd.
34.50 33.48 38.61 40.99 32.13 26.23 28.33 25.99 25.72 26.71 31.27 5.56 17.77
Madras
Cements
Ltd.
24.39 31.88 26.05 31.67 34.47 30.31 33.20 31.37 30.38 27.97 30.17 3.16 10.46
Sample Average 26.48

213 | P a g e
to 2012-13. The highest contribution margin is found as Rs. 5,013.57 Cr. in respect of Ultra Tech Cement Ltd in
2012-13. Coming to the percentage of contribution to sales, all the selected companies showed a mixed trend
during the period. The four companies viz. Ultra-tech, The India, J.K and Madras Cements Ltd. improved their
P/V (Contribution to Sales Ratio) from 2003-04 to 2007-08 but they are decreased in subsequent years. The P/V
ratios are increased from 21.68% to 28.08%, from 22.17% to 33.93%, from 18.19% to 28.45% and from 24.39%
to 34.47% in Ultra-tech, The India, J.K and Madras Cements Ltd. respectively from 2003-04 to 2007-08, but
they are decreased to 23.70%, 21.44% , 22.65% and 27.97% by the end of the study period in such companies
respectively. The other two companies namely ACC and Ambuja also shown an increase in the ratio from 2003-
04 to 2006-07, as they are increased from 29.57% to 30.59% and 34.50% to 40.99%, but they are decreased to
22.09% and 26.71% by the year 2012-13. It can be understood that all the companies showed a good increase in
the first half period and decline in the remaining half of the study period. However the earlier four companies
namely, Ultra Tech, The India (except 2012-13), J.K. and Madras Cements companies have increased their P/V
ratios by 2012-13 in comparison with the results of 2003-04. Though there is decline in the P/V ratio of the
other two companies i.e. ACC and Ambuja by the end of the year 2012-13, it is higher when compared to the
other selected companies. The P/V ratio is very high as 40.99% in 2006-07, 38.61% in 2005-06 and 34.50% in
2003-04 in the case of Ambuja followed by 34.47% in Madras Cements Ltd. in 2007-08 during the period. The
ratio is least as 15.75% in The India cements during 2010-11 among the selected companies.
The highest average P/V ratio is registered as 31.27% in Ambuja and the standard deviation is 5.56 with the co-
efficient of variation as 17.77%, it is followed by Madras Cements Ltd. with the average of 30.17%. The least
average P/V ratio is stood at 22.71% and the standard deviation of 3.49 with the co-efficient of variation as
15.38% in J.K. Cement ltd. The three companies are here with better P/V ratios, i.e. Ambuja with 31.27%,
Madras Cements with 30.17% and ACC with 27.61% than the sample margin (26.48%). It indicates that
relatively higher profitability of different products, processes or departments, so that development of sales
strategy is facilitated. A high C/S or P/V ratio implies that comparatively large amount may be spent by way of
advertising and sales promotion for additional sales in as much as the contribution from such sales will be
adequate to recover fixed costs and contribute further towards profit. Since the capacity utilisation of these
companies below 100%, it is advantageous to go for increase in sales volume as net income will go up because
of higher sales volume. Again, for price reduction due to acute competition, the P/V ratio may be used by the
management. On the other hand the remaining three companies, i.e. Ultra Tech, The India and J.K. have shown
lower average P/V ratios than the sample average. A firm with lower P/V ratio will not be finding profitable to
have increase in sales volume much profitable. In fact enterprises having a lower P/V ratio should aim at
reducing costs and expenses before thinking of increasing the sales volume.
6.2. Operating Profit Ratio
TABLE 2 illustrates the trends of operating profit of the selected cement companies during the study period. All
the selected companies showed a mixed trend during the period. The four companies viz. Ultra-tech, The India,
J.K and Madras Cements Ltd. improved their profit margins from 2003-04 to 2007-08 but they are decreased in
subsequent years. The operating profit ratios are increased from 14.18% to 31.22%, from 8.47% to 31.36%,
from 12.63% to 29.04% and from 23.88% to 37.69% in Ultra-tech, The India, J.K and Madras Cements Ltd.
respectively from 2003-04 to 2007-08, but they are decreased to 22.57%, 18.24% , 19.23% and 27.04% by the

214 | P a g e
end of the study period in such companies respectively. The other two companies namely ACC and Ambuja also
shown an increase in the ratio from 2003-04 to 2006-07, as they are increased from 18.00% to 29.00% and
29.83% to 39.25%, but they are decreased to 15.00% and 18.00% by the year 2012-13. It can be understood that
all the companies showed a good increase in the first half period and decline in the remaining half of the study
period. However all the companies have increased their operating profit ratios by 2012-13 in comparison with
the results of 2003-04(except in Ambuja and ACC during 2012-13).
The operating profit ratio is very high as 39.25% in 2006-07 in the case of Ambuja followed by 37.69% in
Madras Cements Ltd. during 2007-08. The ratio is least as 8.47% in The India cements during 2003-04 among
the selected companies. The highest average ratio is registered as 28.80% in Ambuja and the standard deviation
is 6.11 with the co- efficient of variation as 21.23%. The least average operating profit ratio is stood at 19.99%
and the standard deviation of 8.18 with the co-efficient of variation as 40.90% in The India cements. The two
companies
Table-2 Operating Profit Ratio
(Source: Annual Reports)
only here with better operating margin, i.e. Ambuja with 28.80% and Madras Cements with 28.49% than the
sample margin (23.94%).This indicates the management‟s ability to operate the business with sufficient success.
The other four companies are recorded with the average which is nearer to sample average.
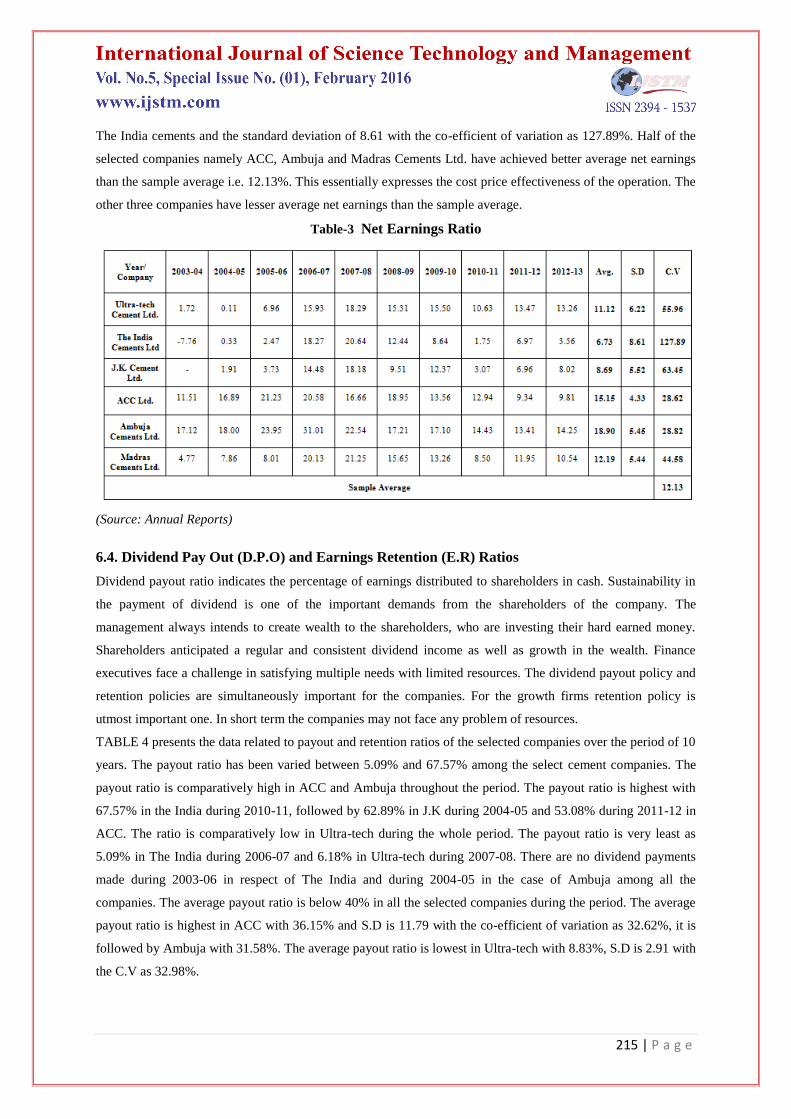
6.3. Net Earnings Ratio
The trends of net earnings ratio of the selected companies are examined, which is presented in TABLE 3. It also
showed a mixed trend in the same manner as the operating profit ratios showed. Here also all the companies
showed an increase in the first half period and decline in later years. The highest net earnings ratio is also
recorded in Ambuja with 31.01% in 2006-07, and it is followed by Madras Cements Ltd. with 21.25% during
2007-08. The net earnings are lowest as -7.76% (negative) in 2003-04 in respect of The India cements Ltd.
The average net earnings show that, the Ambuja has occupied the highest average net earnings ratio with
18.90% and the standard deviation of 5.45 with the co-efficient of variation as 28.82%. The second highest
average ratio is registered as 15.15% in ACC cements. The average net earnings ratio is very least as 6.73% in
215 | P a g e
The India cements and the standard deviation of 8.61 with the co-efficient of variation as 127.89%. Half of the
selected companies namely ACC, Ambuja and Madras Cements Ltd. have achieved better average net earnings
than the sample average i.e. 12.13%. This essentially expresses the cost price effectiveness of the operation. The
other three companies have lesser average net earnings than the sample average.
Table-3 Net Earnings Ratio
(Source: Annual Reports)
6.4. Dividend Pay Out (D.P.O) and Earnings Retention (E.R) Ratios
Dividend payout ratio indicates the percentage of earnings distributed to shareholders in cash. Sustainability in
the payment of dividend is one of the important demands from the shareholders of the company. The
management always intends to create wealth to the shareholders, who are investing their hard earned money.
Shareholders anticipated a regular and consistent dividend income as well as growth in the wealth. Finance
executives face a challenge in satisfying multiple needs with limited resources. The dividend payout policy and
retention policies are simultaneously important for the companies. For the growth firms retention policy is
utmost important one. In short term the companies may not face any problem of resources.
TABLE 4 presents the data related to payout and retention ratios of the selected companies over the period of 10
years. The payout ratio has been varied between 5.09% and 67.57% among the select cement companies. The
payout ratio is comparatively high in ACC and Ambuja throughout the period. The payout ratio is highest with
67.57% in the India during 2010-11, followed by 62.89% in J.K during 2004-05 and 53.08% during 2011-12 in
ACC. The ratio is comparatively low in Ultra-tech during the whole period. The payout ratio is very least as
5.09% in The India during 2006-07 and 6.18% in Ultra-tech during 2007-08. There are no dividend payments
made during 2003-06 in respect of The India and during 2004-05 in the case of Ambuja among all the
companies. The average payout ratio is below 40% in all the selected companies during the period. The average
payout ratio is highest in ACC with 36.15% and S.D is 11.79 with the co-efficient of variation as 32.62%, it is
followed by Ambuja with 31.58%. The average payout ratio is lowest in Ultra-tech with 8.83%, S.D is 2.91 with
the C.V as 32.98%.

216 | P a g e
Table-4 Dividend Pay Out (D.P.O) and Earnings Retention (ER) Ratios
Company/
Year
2003-
04
2004-
05
2005-
06
2006-
07
2007-
08
2008-
09
2009-
10
2010-
11
2011-
12
2012-
13 Avg. S.D C.V
Ultra-tech
Cement
Ltd.
D.P.O 16.03 9.20 9.48 6.37 6.18 6.37 6.83 9.56 8.96 9.29 8.83 2.91 32.98
E.R 83.97 90.80 90.52 93.63 93.82 93.63 93.17 90.44 91.04 90.71 91.17 2.91 3.19
The India
Cements
Ltd
D.P.O 0.00 0.00 0.00 5.09 8.34 13.05 16.01 67.57 20.96 37.59 16.86 21.34 126.53
E.R 100.00 100.00 100.00 94.91 91.66 86.95 83.99 32.43 79.04 62.41 83.14 21.34 25.66
J.K.
Cement
Ltd.
D.P.O
62.89 23.55 13.70 13.19 17.19 18.56 21.83 19.72 19.46 23.34 15.21 65.17
E.R 100 37.11 76.45 86.30 86.81 82.81 81.44 78.17 80.28 80.54 78.99 16.13 20.42
ACC Ltd.
D.P.O 32.97 26.65 22.72 26.06 30.95 26.87 51.12 39.67 53.08 51.41 36.15 11.79 32.62
E.R 67.03 73.35 77.28 73.94 69.05 73.13 48.88 60.33 46.92 48.59 63.85 11.79 18.47
Ambuja
Cements
Ltd.
D.P.O 42.11 0.00 32.71 30.15 23.89 30.00 31.40 39.90 42.70 42.91 31.58 12.89 40.81
E.R 57.89 100.00 67.29 69.85 76.11 70.00 68.60 60.10 57.30 57.09 68.42 12.89 18.83
Madras
Cements
Ltd.
D.P.O 26.79 21.74 23.08 9.80 11.66 13.33 13.33 13.89 15.63 17.65 16.69 5.51 33.02
E.R 73.21 78.26 76.92 90.20 88.34 86.67 86.67 86.11 84.38 82.35 83.31 5.51 6.62
(Source: Annual Reports)
In contrast to the payout ratio, retention of the earnings is high in all the selected companies except ACC and
Ambuja. The Ultra-tech has been observed with higher retention ratios. The payout ratio is less than 10% during
the whole period except 2003-04 (16.03%), thus it has been ploughing back 90% of earnings. In this way it has
been following too conservative retention policy for the future growth and for the wealth maximisation. The
passive residual policies of the companies will have a positive impact on the book value and market value of the
equity shares of the company.
6.5. Return on Investment - Du Pont Approach
The analysis of the return on investment (ROI) of the selected cement companies is presented in TABLE 5
during the study period of 10 years i.e. from 2003-04 to 2012-13. As the first term of the Du Pont Approach
equation is efficiency of asset management, it is observed that, all the selected companies have shown an
increase in the total assets turnover ratio by the end of the year 2012-13 when compared to the year 2003-04
despite of fluctuations. The highest total assets turnover is found as 1.06 times in Ultra Tech during 2005-06 and
lowest assets turnover is recorded with 0.28 times in J.K ltd during 2004-05. Coming to the trends of second
term of equation i.e. profit margin, the four selected companies namely, Ultra-Tech, The India, J.K and Madras
cements ltd. have shown an increase in the net profit margin by the year 2012-13 when compared to the year
2003-04, While the other two companies viz; ACC and Ambuja have shown a small decline. The Ambuja is

217 | P a g e
found with the highest profit margin of 31.01% in 2006-07 and lowest is stood at 0.33% in The India during
2004-05 among all the selected companies.
Table-5 Return on Investment (%) - Du Pont Approach
Year/
Compan
y
2003-04 2004-05 2005-06 2006-07 2007-08 2008-09 2009-10 2010-11 2011-12 2012-13 Avg. S.D C.V
Ultra-
tech
Cement
Ltd
(ROI)
0.72 0.08 7.40 16.80 16.10 12.67 13.10 7.02 11.20 10.24 9.53 5.80 60.52
A.T 0.60 0.74 1.06 1.05 0.88 0.83 0.84 0.66 0.83 0.77 0.83
P.M 1.20 0.11 6.96 15.93 18.29 15.31 15.5 10.63 13.47 13.26 11.07
The
India
Cements
Ltd
(ROI)
-2.39 0.12 1.12 10.06 10.05 6.13 4.66 0.86 3.55 1.86 3.60 4.20 115.5
A.T 0.31 0.36 0.45 0.55 0.49 0.49 0.54 0.49 0.51 0.52 0.47
P.M -7.76 0.33 2.47 18.27 20.64 12.44 8.64 1.75 6.97 3.56 6.73
J.K.
Cement
Ltd.
(ROI)
0.53 2.22 10.92 13.92 6.59 7.61 1.88 4.95 5.99 6.07 4.40 71.85
A.T 0.28 0.60 0.75 0.77 0.69 0.61 0.61 0.71 0.75 0.64
P.M 1.91 3.73 14.48 18.18 9.51 12.37 3.07 6.96 8.02 8.69
ACC
Ltd.
(ROI)
9.70 11.23 20.86 20.52 14.25 15.94 10.09 11.15 8.9 9.06 13.17 4.60 34.56
A.T 0.84 0.66 0.98 1.00 0.86 0.84 0.74 0.86 0.95 0.92 0.87
P.M 11.51 16.89 21.23 20.58 16.66 18.95 13.56 12.94 9.34 9.81 15.15
Ambuja
Cements
Ltd.
(ROI)
8.40 11.46 24.79 26.7 17.94 13.74 12.25 10.65 10.44 9.99 14.64 6.41 43.81
A.T 0.49 0.64 1.03 0.86 0.80 0.80 0.72 0.74 0.78 0.70 0.76
P.M 17.12 18.00 23.95 31.01 22.54 17.21 17.10 14.43 13.41 14.25 18.90
Madras
Cements
Ltd.(RO
I)
2.61 4.04 5.56 15.68 12.17 7.96 6.73 3.70 6.42 6.31 7.12 4.01 56.35
A.T 0.55 0.51 0.69 0.78 0.57 0.51 0.51 0.44 0.54 0.60 0.57
P.M 4.77 7.86 8.01 20.13 21.25 15.65 13.26 8.50 11.95 10.54 12.19
(Source: Annual Reports); AT: Assets Turnover; P.M: Profit Margin
It is observed from the average analysis that the highest total assets turnover ratio is registered as 0.87 times in
respect of ACC ltd; it implies that for every 1rupee of investment in total assets results in the revenue of Rs.0.87

218 | P a g e
in ACC ltd for the study period. It is followed by 0.83 times in Ultra-tech for the period of 10years. While the
least average turnover is recorded as 0.47 times in The India cements ltd. The highest average profit margin
ratio is found with 18.90%, which indicates that for every 1 rupee of sales, Rs. 0.18 earned as net profit in
Ambuja Cements ltd. and followed by ACC ltd with 15.15% for the period. While the lowest profit margin is
recorded with 6.73% in The India cements ltd. for the period.
It is analysed through the DuPont approach that, the first term of the equation i.e. total assets turnover ratio is
highest with 0.87 times in ACC. This measures efficiency of asset management. Other things being equal the
greater the index, the more efficiently assets are being managed. Thus it can be said that, the first index i.e. the
asset management is better in ACC Ltd. The second term of the Du Pont analysis, i.e. the profit margin is
highest with 18.90% in Ambuja. It measures efficiency of expense control. The larger the return on sales would
mean the management success in controlling expenses. It is an index of expense control. Thus it can be
understood that, the second index, i.e. expense control is better in Ambuja cements ltd among all the selected
companies for the period of 10 years. The ROI is calculated by multiplying the first term of the Du Pont
Approach with the second term.
The analysis reveals that, The ROI is varied between 0.53% and 26.70% among the selected companies. All the
selected companies have shown fluctuating trend in ROI during the period. But all the selected companies have
shown increase in ROI except ACC as the ROI is almost same by the end of study period. The highest ROI is
found as 26.70% in 2006-07 in respect of Ambuja. While the lowest ratio is registered as 0.12% in 2004-05 in
the case of The India cements ltd. Ultimately it is to be noted that, the average ROI is highest in Ambuja with
14.64%, it may due to the good improvement in assets turnover and profit margin from 2003-04 to 2012-13, as
it is comparatively higher through out the period. These are the important reasons for the better ROI in Ambuja.
The standard deviation of the ratios is 6.41 and the co-efficient if variation as 43.81%. While the least average
ROI is found to be 3.60% in The India cement ltd, and the Standard Deviation is 4.20 and the co-efficient of
variation as 115.50% during the period. The lowest ROI in The India might be due to the lowest average total
assets turnover and lowest average profit margin among the selected companies.
VII. CONCLUSIONS
1) All the selected companies have shown an increase in the contribution margin in absolute terms from 2003-
04 to 2012-13. The highest contribution margin is found as Rs. 5,013.57 Cr. in respect of Ultra Tech
Cement Ltd in 2012-13.
2) The four companies namely, Ultra Tech, The India (except 2012-13), J.K. and Madras Cements companies
have increased their P/V ratios by 2012-13 in comparison with the results of 2003-04. Though there is a
decline in the P/V ratio of the other two companies i.e. ACC and Ambuja by the end of the year 2012-13,
the ratio is higher when compared to the other selected companies.
3) The highest average P/V ratio is registered as 31.27% in Ambuja for the period of 10 years, followed by
Madras Cements Ltd. with the average of 30.17%. It indicates that relatively higher profitability of different
products, processes or departments. While the least average P/V ratio is stood at 22.71% in J.K. Cement
Ltd.

219 | P a g e
4) All the selected cement companies have shown an average Operating Profit Ratio ranging between 20%
and 29% (with few exceptions).
5) The highest Operating Profit Ratio is found in Ambuja with 39.25% in the year 2006-07 and the lowest
Operating Profit Ratio is registered as 8.47% in the year 2003-04 in the India Cements Ltd among the
selected companies during the study period.
6) All the selected cement companies have shown an average Net Earnings Ratio ranging between 7% and
19% (with fluctuations in some years). This essentially expresses the cost price effectiveness of the
operations.
7) The highest Net Earnings Ratio is found in Ambuja with 31.01% in the year 2006-07 and the lowest Net
Earnings Ratio is registered as 0.11% in the Ultra Tech Cement Ltd. in 2004-05 among the selected
companies during the study period.
8) All the selected cement companies have shown higher retention ratios when compared to the dividend
payout ratios.
9) Ultra Tech has been following too conservative retention policy for the future growth and for the wealth
maximisation. Whereas in ACC and Ambuja, payout ratio is higher than the other companies.
10) Return on investment is one of the most successful yet simple techniques ever conceived to aid decision-
making and performance evaluation. According to equation of Du Pont Approach in calculating ROI, the
first index reflects the asset management (measured in terms of total assets turnover) and the second index
reflects the expense control (measured in terms of Net Profit Margin).
11) The average analysis shows that the first index (Assets Turnover) is highest in ACC Ltd with 0.87 times.
This reflects the efficiency of assets management in ACC Ltd. While the second index is highest in Ambuja
Cements Ltd with 18.90% for the study period of 10 years. It indicates that the Ambuja Cements ltd.
efficiently controlling the expenses.
12) The average ROI is highest in Ambuja with 14.64%; it might be due to the good improvement in assets
turnover, which implies the efficient management of assets and better profit margin which denotes the
efficient control of expenses from 2003-04 to 2012-13. It is followed by ACC Ltd. with 13.17% and the
least ROI is observed with 3.60% in The India Cements Ltd.
VIII. SUGGESTIONS
1) Cement companies are advised to improve their P/V ratios, high P/V ratio indicates that, relatively high
profitability of different products, processes or departments, which facilitates to spend a large amount on
advertising and sales promotion for additional sales in as much as the contribution from such sales will be
adequate to recover fixed costs and contribute further towards profit. The three selected companies namely,
Ultra Tech, The India and J.K have shown lower P/V ratios among the selected companies. A firm with
lower P/V ratio will not be finding profitable to have increase in sales volume much profitable. Hence it is
recommended to these three companies having lower P/V ratios should aim at reducing costs and expenses
before thinking of increasing the sales volume.
2) Since the capacity utilisation of the selected cement companies is below 100%, it is suggested that, to
improve the capacity utilisation, which facilitates to increased sales volume and net income.

220 | P a g e
3) The Operating Profit Ratio (OPR) and Net Earnings Ratio (NER) are comparatively lower in The India
Cements Ltd. followed by J.K Cement Ltd. among the selected companies. Since The Operating Profit
Ratio and Net Earnings Ratios are an indicative of management‟s ability to operate the business with
sufficient success not only to recover from revenues of the period, the cost of merchandise or services, the
expenses of operating the business (including depreciation) and the cost of borrowed funds, but also to
leave a margin of reasonable compensation to the owners for providing their capital at risk, it is suggested
that to improve their profit ratios by reducing the cost.
4) The analysis according to Du Pont Approach reveals that, the ROI (Return On Investment) is found to be
less in the case of The India Cements Ltd and J.K Cement Ltd. among the selected cement companies.
Since it is the ultimate index of performance evaluation, these companies are suggested to improve the ROI
by taking appropriate measures such as by improving the Assets Turnover and resorting to Expense
Control.
REFERENCES
[1]. Sharma, N.K. (2002). “Financial Appraisal of Cement Industry in India”, Management accountant.
[2]. Ramachandira Reddy and Yuvaraja Reddy. (2007) „„Financial Performance through Market Value Added
Approach‟‟ the Management Accountant, Jan 2007.
[3]. Luther, C.T. Sam. (2007). “Liquidity, Risk and Profitability Analysis-A Case Study of Madras Cements
Ltd.”, The Management Accountant, October 2007, pp- 785-789.
[4]. Mistry, D S. (2010). “Determinants of Dividend Pay-out Ratio- A firm level study of major Gujarat Pharma
Players”, BIFT‟s Journal of International Management & Research, Vol. II, Issue No. 2, pp.52-71.
[5]. Krishnamachary, Prof. P. (1990) “Investment management in Public Enterprises (with special reference to
selected undertakings)”, Readings in Public Enterprises, Hyderabad, Vikas Publications, Volume IV.
[6]. Shin, H. H., & Soenen, L. (1998). Efficiency of working capital management and corporate profitability.
Financial Practice and Education, 8(2), 37-45.
[7]. James C. Van Horne, John Martin Wachowicz , “Fundamentals of Financial Management”, Prentice Hall
of India (PHI), 2005.
[8]. Prasanna Chandra, “Financial Management”, Tata McGraw-Hill Education, 2008 .
[9]. I.M. Pandey, “Financial Management”, Vikas Publishing House Pvt. Ltd, 01-Nov-2009
[10]. Websites:
www.indiacements.co.in,
www.ultratechcement.com,
www.jkcement.com,
www.acclimited.com,
www.worldcement.com,
www.eindiabooks.com,
Related Documents