1 Profiling Tools New User Training June 16, 2020 Woo-Sun Yang User Engagement Group

Welcome message from author
This document is posted to help you gain knowledge. Please leave a comment to let me know what you think about it! Share it to your friends and learn new things together.
Transcript

1
Profiling Tools
New User TrainingJune 16, 2020
Woo-Sun YangUser Engagement Group
2
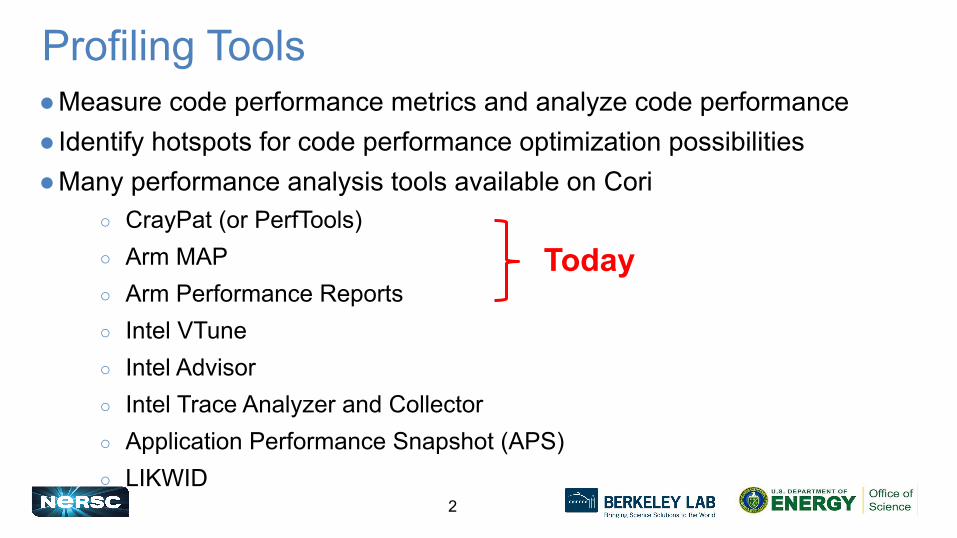
Profiling Tools●Measure code performance metrics and analyze code performance● Identify hotspots for code performance optimization possibilities●Many performance analysis tools available on Cori
○ CrayPat (or PerfTools)○ Arm MAP○ Arm Performance Reports○ Intel VTune○ Intel Advisor○ Intel Trace Analyzer and Collector○ Application Performance Snapshot (APS)○ LIKWID
Today
3
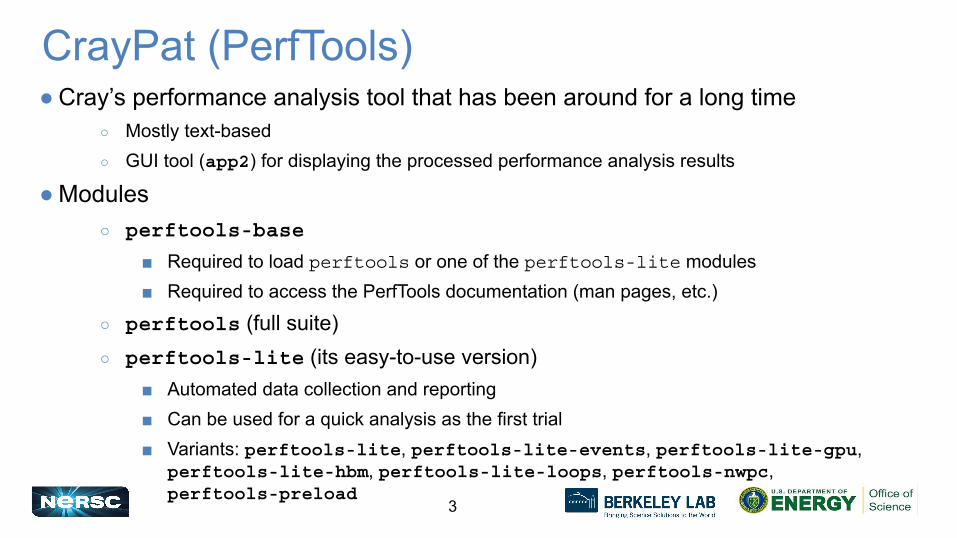
CrayPat (PerfTools)● Cray’s performance analysis tool that has been around for a long time
○ Mostly text-based○ GUI tool (app2) for displaying the processed performance analysis results
● Modules○ perftools-base
■ Required to load perftools or one of the perftools-lite modules■ Required to access the PerfTools documentation (man pages, etc.)
○ perftools (full suite) ○ perftools-lite (its easy-to-use version)
■ Automated data collection and reporting■ Can be used for a quick analysis as the first trial■ Variants: perftools-lite, perftools-lite-events, perftools-lite-gpu,
perftools-lite-hbm, perftools-lite-loops, perftools-nwpc, perftools-preload

4
CrayPat (PerfTools) (cont’d)● Unload the darshan module
$ module unload darshan
● Load perftools-base and perftools (or perftools-lite) before starting to compile
● Object codes (*.o) must be generated, as in$ cc -c myprog.c
$ cc -o myprog myprog.o
● Run instrumented executables in $SCRATCH● For more info:
○ https://docs.nersc.gov/development/performance-debugging-tools/craypat/○ Man pages and help utility: intro_craypat, pat_build, pat_report, pat_help, …
5
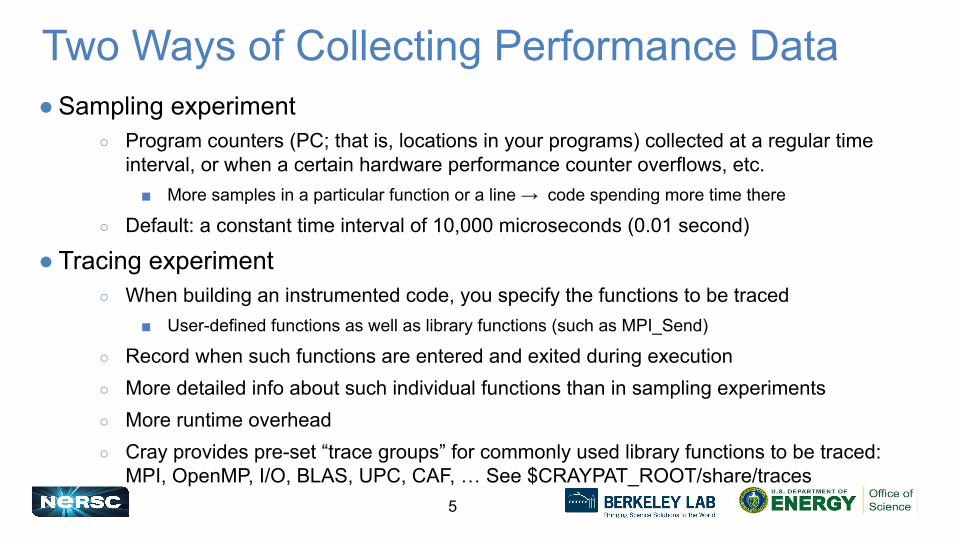
Two Ways of Collecting Performance Data● Sampling experiment
○ Program counters (PC; that is, locations in your programs) collected at a regular time interval, or when a certain hardware performance counter overflows, etc.
■ More samples in a particular function or a line → code spending more time there
○ Default: a constant time interval of 10,000 microseconds (0.01 second)
● Tracing experiment○ When building an instrumented code, you specify the functions to be traced
■ User-defined functions as well as library functions (such as MPI_Send)
○ Record when such functions are entered and exited during execution○ More detailed info about such individual functions than in sampling experiments○ More runtime overhead○ Cray provides pre-set “trace groups” for commonly used library functions to be traced:
MPI, OpenMP, I/O, BLAS, UPC, CAF, … See $CRAYPAT_ROOT/share/traces
6
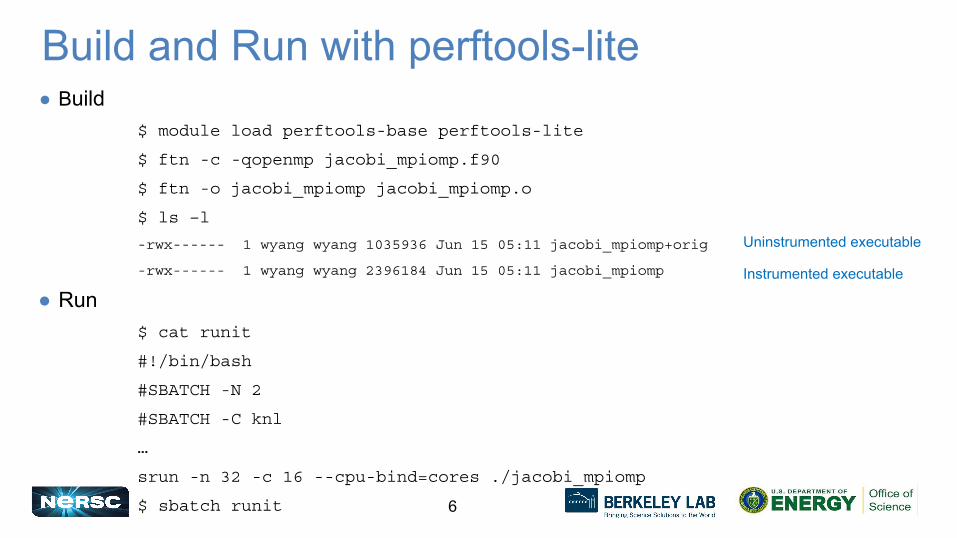
Build and Run with perftools-lite● Build
$ module load perftools-base perftools-lite
$ ftn -c -qopenmp jacobi_mpiomp.f90
$ ftn -o jacobi_mpiomp jacobi_mpiomp.o
$ ls –l
-rwx------ 1 wyang wyang 1035936 Jun 15 05:11 jacobi_mpiomp+orig
-rwx------ 1 wyang wyang 2396184 Jun 15 05:11 jacobi_mpiomp
● Run$ cat runit
#!/bin/bash
#SBATCH -N 2
#SBATCH -C knl
…
srun -n 32 -c 16 --cpu-bind=cores ./jacobi_mpiomp
$ sbatch runit
Uninstrumented executable
Instrumented executable
7
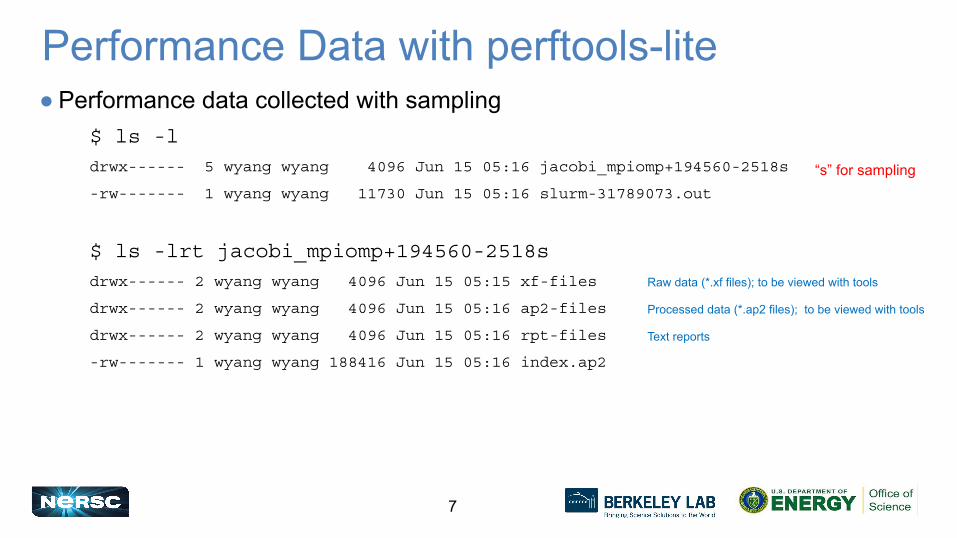
Performance Data with perftools-lite● Performance data collected with sampling
$ ls -ldrwx------ 5 wyang wyang 4096 Jun 15 05:16 jacobi_mpiomp+194560-2518s
-rw------- 1 wyang wyang 11730 Jun 15 05:16 slurm-31789073.out
$ ls -lrt jacobi_mpiomp+194560-2518sdrwx------ 2 wyang wyang 4096 Jun 15 05:15 xf-files
drwx------ 2 wyang wyang 4096 Jun 15 05:16 ap2-files
drwx------ 2 wyang wyang 4096 Jun 15 05:16 rpt-files
-rw------- 1 wyang wyang 188416 Jun 15 05:16 index.ap2
“s” for sampling
Processed data (*.ap2 files); to be viewed with tools
Raw data (*.xf files); to be viewed with tools
Text reports
8
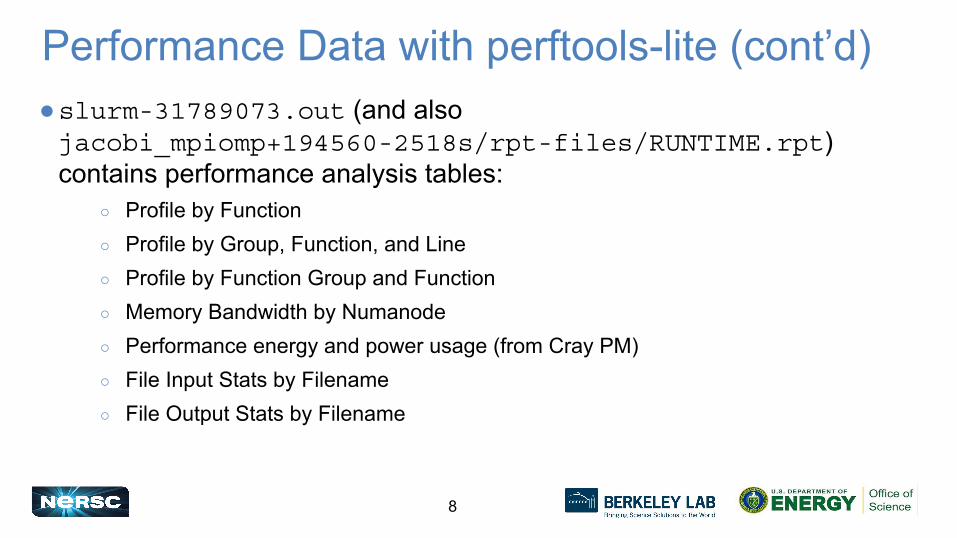
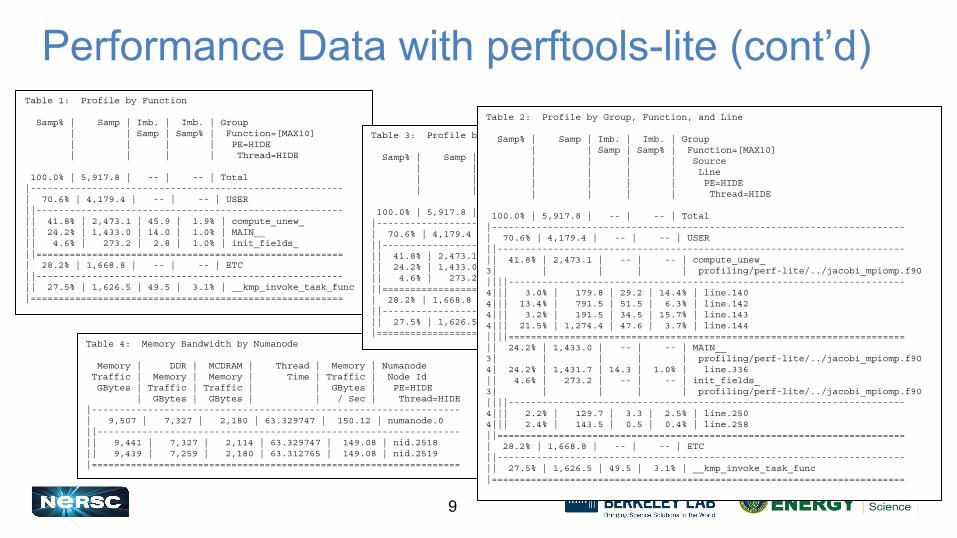
Performance Data with perftools-lite (cont’d)●slurm-31789073.out (and also jacobi_mpiomp+194560-2518s/rpt-files/RUNTIME.rpt) contains performance analysis tables:
○ Profile by Function○ Profile by Group, Function, and Line○ Profile by Function Group and Function○ Memory Bandwidth by Numanode○ Performance energy and power usage (from Cray PM)○ File Input Stats by Filename○ File Output Stats by Filename
9
Performance Data with perftools-lite (cont’d)Table 1: Profile by Function
Samp% | Samp | Imb. | Imb. | Group | | Samp | Samp% | Function=[MAX10] | | | | PE=HIDE | | | | Thread=HIDE
100.0% | 5,917.8 | -- | -- | Total|--------------------------------------------------------| 70.6% | 4,179.4 | -- | -- | USER||-------------------------------------------------------|| 41.8% | 2,473.1 | 45.9 | 1.9% | compute_unew_|| 24.2% | 1,433.0 | 14.0 | 1.0% | MAIN__|| 4.6% | 273.2 | 2.8 | 1.0% | init_fields_||=======================================================| 28.2% | 1,668.8 | -- | -- | ETC||-------------------------------------------------------|| 27.5% | 1,626.5 | 49.5 | 3.1% | __kmp_invoke_task_func|========================================================
Table 4: Memory Bandwidth by Numanode
Memory | DDR | MCDRAM | Thread | Memory | Numanode Traffic | Memory | Memory | Time | Traffic | Node Id GBytes | Traffic | Traffic | | GBytes | PE=HIDE | GBytes | GBytes | | / Sec | Thread=HIDE|------------------------------------------------------------------| 9,507 | 7,327 | 2,180 | 63.329747 | 150.12 | numanode.0||-----------------------------------------------------------------|| 9,441 | 7,327 | 2,114 | 63.329747 | 149.08 | nid.2518|| 9,439 | 7,259 | 2,180 | 63.312765 | 149.08 | nid.2519|==================================================================
Table 3: Profile by Function Group and Function
Samp% | Samp | Imb. | Imb. | Team | Group | | Samp | Samp% | Size | Function=[MAX10] | | | | | Thread=HIDE | | | | | PE=HIDE
100.0% | 5,917.8 | -- | -- | -- | Total|---------------------------------------------------------------| 70.6% | 4,179.4 | -- | -- | -- | USER||--------------------------------------------------------------|| 41.8% | 2,473.1 | 0.8 | 0.0% | 4 | compute_unew_|| 24.2% | 1,433.0 | 0.4 | 0.0% | 4 | MAIN__|| 4.6% | 273.2 | 1.4 | 0.7% | 4 | init_fields_||==============================================================| 28.2% | 1,668.8 | -- | -- | -- | ETC||--------------------------------------------------------------|| 27.5% | 1,626.5 | 1.0 | 0.1% | 4 | __kmp_invoke_task_func|===============================================================
Table 2: Profile by Group, Function, and Line
Samp% | Samp | Imb. | Imb. | Group | | Samp | Samp% | Function=[MAX10] | | | | Source | | | | Line | | | | PE=HIDE | | | | Thread=HIDE
100.0% | 5,917.8 | -- | -- | Total|--------------------------------------------------------------------------| 70.6% | 4,179.4 | -- | -- | USER||-------------------------------------------------------------------------|| 41.8% | 2,473.1 | -- | -- | compute_unew_3| | | | | profiling/perf-lite/../jacobi_mpiomp.f90||||-----------------------------------------------------------------------4||| 3.0% | 179.8 | 29.2 | 14.4% | line.1404||| 13.4% | 791.5 | 51.5 | 6.3% | line.1424||| 3.2% | 191.5 | 34.5 | 15.7% | line.1434||| 21.5% | 1,274.4 | 47.6 | 3.7% | line.144||||=======================================================================|| 24.2% | 1,433.0 | -- | -- | MAIN__3| | | | | profiling/perf-lite/../jacobi_mpiomp.f904| 24.2% | 1,431.7 | 14.3 | 1.0% | line.336|| 4.6% | 273.2 | -- | -- | init_fields_3| | | | | profiling/perf-lite/../jacobi_mpiomp.f90||||-----------------------------------------------------------------------4||| 2.2% | 129.7 | 3.3 | 2.5% | line.2504||| 2.4% | 143.5 | 0.5 | 0.4% | line.258||=========================================================================| 28.2% | 1,668.8 | -- | -- | ETC||-------------------------------------------------------------------------|| 27.5% | 1,626.5 | 49.5 | 3.1% | __kmp_invoke_task_func|==========================================================================
10
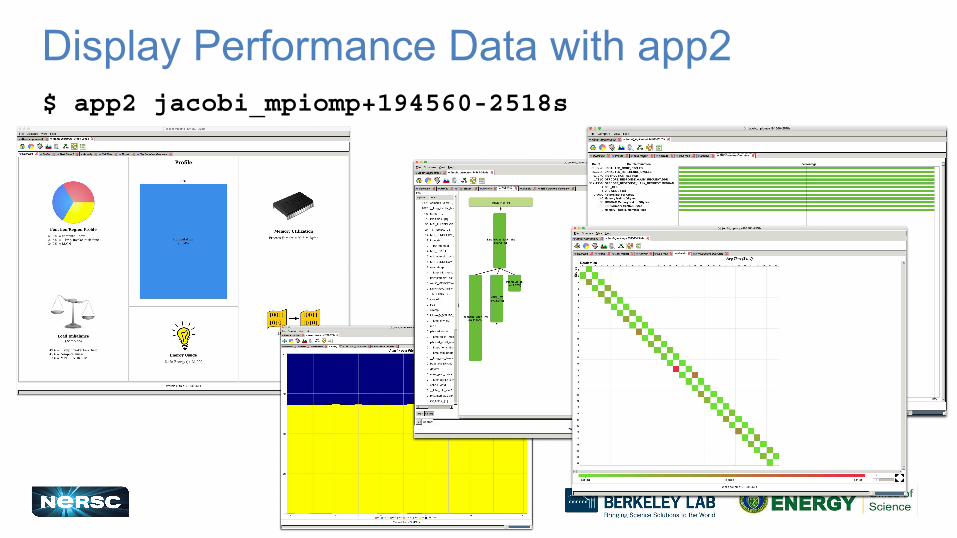
Display Performance Data with app2$ app2 jacobi_mpiomp+194560-2518s
11
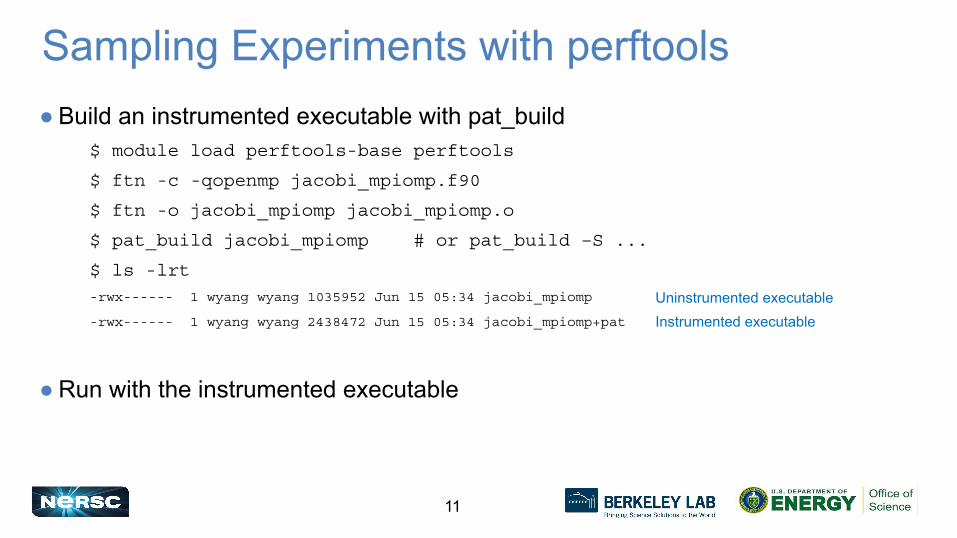
Sampling Experiments with perftools● Build an instrumented executable with pat_build
$ module load perftools-base perftools
$ ftn -c -qopenmp jacobi_mpiomp.f90
$ ftn -o jacobi_mpiomp jacobi_mpiomp.o
$ pat_build jacobi_mpiomp # or pat_build –S ...
$ ls -lrt-rwx------ 1 wyang wyang 1035952 Jun 15 05:34 jacobi_mpiomp
-rwx------ 1 wyang wyang 2438472 Jun 15 05:34 jacobi_mpiomp+pat
● Run with the instrumented executable
Uninstrumented executableInstrumented executable
12
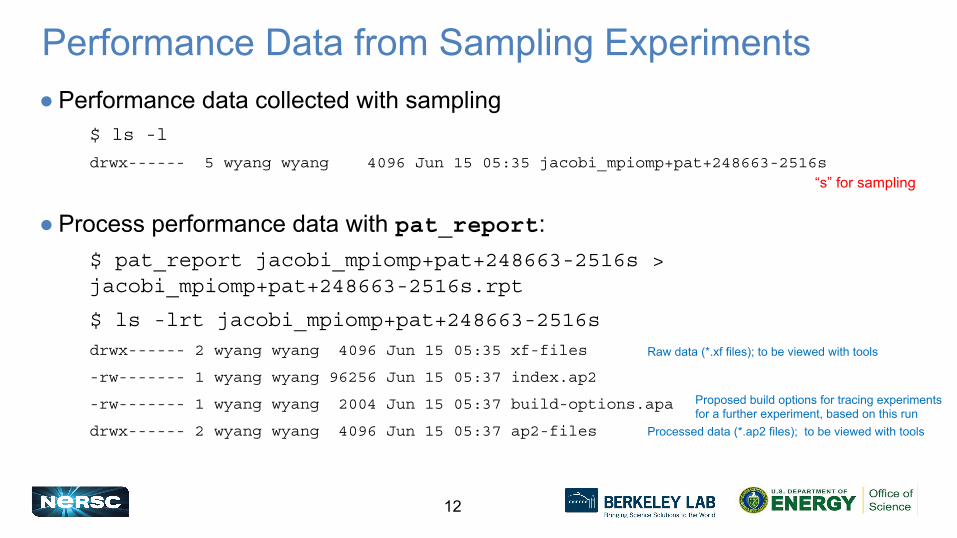
Performance Data from Sampling Experiments● Performance data collected with sampling
$ ls -l
drwx------ 5 wyang wyang 4096 Jun 15 05:35 jacobi_mpiomp+pat+248663-2516s
● Process performance data with pat_report:$ pat_report jacobi_mpiomp+pat+248663-2516s > jacobi_mpiomp+pat+248663-2516s.rpt
$ ls -lrt jacobi_mpiomp+pat+248663-2516sdrwx------ 2 wyang wyang 4096 Jun 15 05:35 xf-files
-rw------- 1 wyang wyang 96256 Jun 15 05:37 index.ap2
-rw------- 1 wyang wyang 2004 Jun 15 05:37 build-options.apa
drwx------ 2 wyang wyang 4096 Jun 15 05:37 ap2-files
“s” for sampling
Processed data (*.ap2 files); to be viewed with tools
Raw data (*.xf files); to be viewed with tools
Proposed build options for tracing experiments for a further experiment, based on this run

13
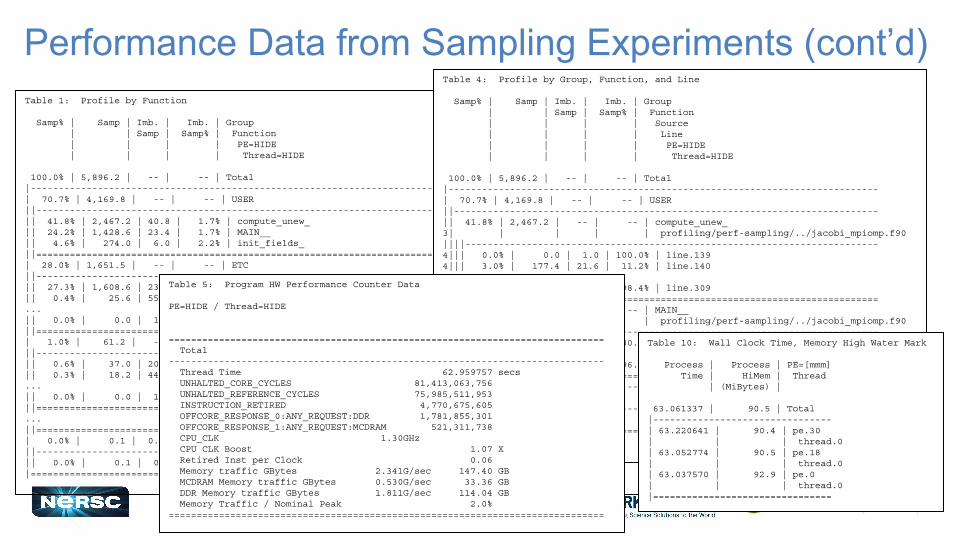
Performance Data from Sampling Experiments (cont’d)
●pat_report output shows performance analysis tables:○ Profile by Function○ Profile of maximum function times○ Profile by Function Group and Function○ Profile by Group, Function, and Line○ Program HW Performance Counter Data○ File Input Stats by Filename○ File Output Stats by Filename○ Program energy and power usage (from Cray PM)○ Memory Bandwidth by Numanode○ Wall Clock Time, Memory High Water Mark
14
Performance Data from Sampling Experiments (cont’d)Table 1: Profile by Function
Samp% | Samp | Imb. | Imb. | Group | | Samp | Samp% | Function | | | | PE=HIDE | | | | Thread=HIDE
100.0% | 5,896.2 | -- | -- | Total|-----------------------------------------------------------------------------| 70.7% | 4,169.8 | -- | -- | USER||----------------------------------------------------------------------------|| 41.8% | 2,467.2 | 40.8 | 1.7% | compute_unew_|| 24.2% | 1,428.6 | 23.4 | 1.7% | MAIN__|| 4.6% | 274.0 | 6.0 | 2.2% | init_fields_||============================================================================| 28.0% | 1,651.5 | -- | -- | ETC||----------------------------------------------------------------------------|| 27.3% | 1,608.6 | 23.4 | 1.5% | __kmp_invoke_task_func|| 0.4% | 25.6 | 55.4 | 70.6% | _INTERNAL_25_______src_kmp_barrier_cpp_38a91946::__kmp_hyper_barrier_gather...|| 0.0% | 0.0 | 1.0 | 100.0% | __pat_thread_process_all||============================================================================| 1.0% | 61.2 | -- | -- | MPI||----------------------------------------------------------------------------|| 0.6% | 37.0 | 20.0 | 36.2% | MPI_ALLREDUCE|| 0.3% | 18.2 | 44.8 | 73.3% | MPI_SENDRECV...|| 0.0% | 0.0 | 1.0 | 100.0% | mpi_sendrecv_||============================================================================...||============================================================================| 0.0% | 0.1 | 0.9 | 96.8% | SYSIO||----------------------------------------------------------------------------|| 0.0% | 0.1 | 0.9 | 96.8% | read|=============================================================================
Table 4: Profile by Group, Function, and Line
Samp% | Samp | Imb. | Imb. | Group | | Samp | Samp% | Function | | | | Source | | | | Line | | | | PE=HIDE | | | | Thread=HIDE
100.0% | 5,896.2 | -- | -- | Total|-----------------------------------------------------------------------------| 70.7% | 4,169.8 | -- | -- | USER||----------------------------------------------------------------------------|| 41.8% | 2,467.2 | -- | -- | compute_unew_3| | | | | profiling/perf-sampling/../jacobi_mpiomp.f90||||--------------------------------------------------------------------------4||| 0.0% | 0.0 | 1.0 | 100.0% | line.1394||| 3.0% | 177.4 | 21.6 | 11.2% | line.140...4||| 0.0% | 0.1 | 1.9 | 98.4% | line.309||||==========================================================================|| 24.2% | 1,428.6 | -- | -- | MAIN__3| | | | | profiling/perf-sampling/../jacobi_mpiomp.f90||||--------------------------------------------------------------------------4||| 0.0% | 0.9 | 3.1 | 80.6% | line.165...4||| 0.0% | 0.1 | 0.9 | 96.8% | line.337||||==========================================================================|| 4.6% | 274.0 | -- | -- | init_fields_3| | | | | profiling/perf-sampling/../jacobi_mpiomp.f90||||--------------------------------------------------------------------------...|==========================================================================
Table 5: Program HW Performance Counter Data
PE=HIDE / Thread=HIDE
============================================================================== Total------------------------------------------------------------------------------ Thread Time 62.959757 secs UNHALTED_CORE_CYCLES 81,413,063,756 UNHALTED_REFERENCE_CYCLES 75,985,511,953 INSTRUCTION_RETIRED 4,770,675,605 OFFCORE_RESPONSE_0:ANY_REQUEST:DDR 1,781,855,301 OFFCORE_RESPONSE_1:ANY_REQUEST:MCDRAM 521,311,738 CPU_CLK 1.30GHz CPU CLK Boost 1.07 X Retired Inst per Clock 0.06 Memory traffic GBytes 2.341G/sec 147.40 GB MCDRAM Memory traffic GBytes 0.530G/sec 33.36 GB DDR Memory traffic GBytes 1.811G/sec 114.04 GB Memory Traffic / Nominal Peak 2.0%==============================================================================
Table 10: Wall Clock Time, Memory High Water Mark
Process | Process | PE=[mmm] Time | HiMem | Thread | (MiBytes) |
63.061337 | 90.5 | Total|--------------------------------| 63.220641 | 90.4 | pe.30| | | thread.0| 63.052774 | 90.5 | pe.18| | | thread.0| 63.037570 | 92.9 | pe.0| | | thread.0|================================
15
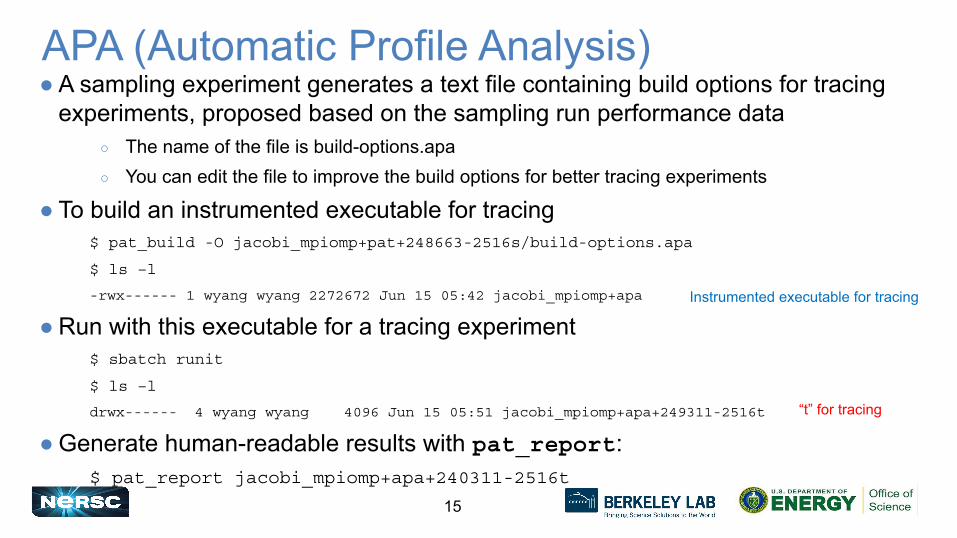
APA (Automatic Profile Analysis)● A sampling experiment generates a text file containing build options for tracing
experiments, proposed based on the sampling run performance data○ The name of the file is build-options.apa○ You can edit the file to improve the build options for better tracing experiments
● To build an instrumented executable for tracing$ pat_build -O jacobi_mpiomp+pat+248663-2516s/build-options.apa
$ ls –l
-rwx------ 1 wyang wyang 2272672 Jun 15 05:42 jacobi_mpiomp+apa
● Run with this executable for a tracing experiment$ sbatch runit
$ ls –l
drwx------ 4 wyang wyang 4096 Jun 15 05:51 jacobi_mpiomp+apa+249311-2516t
● Generate human-readable results with pat_report:$ pat_report jacobi_mpiomp+apa+240311-2516t
“t” for tracing
Instrumented executable for tracing
16
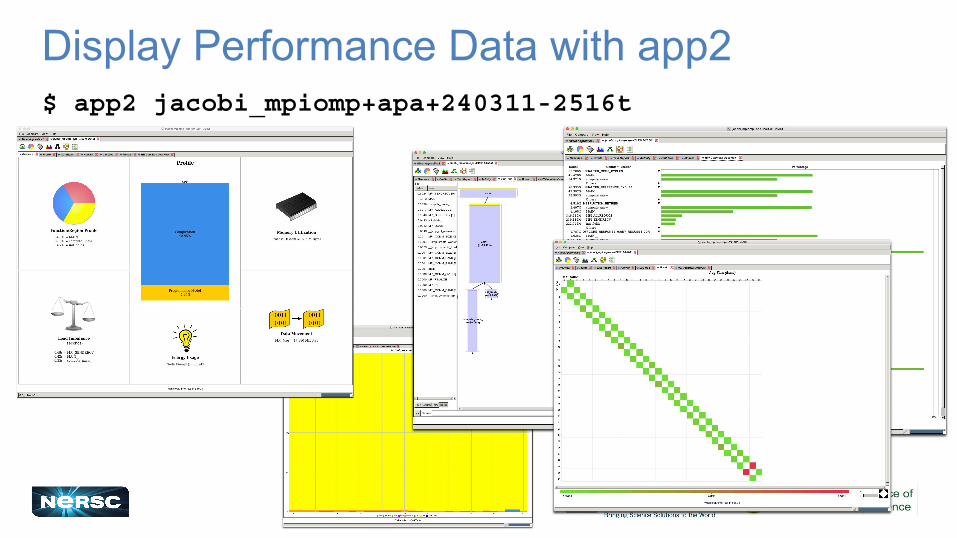
Display Performance Data with app2$ app2 jacobi_mpiomp+apa+240311-2516t
17
Tracing Experiments with perftools● Build an instrumented executable with pat_build:
$ module load perftools-base perftools
$ ftn -c -qopenmp jacobi_mpiomp.f90
$ ftn -o jacobi_mpiomp jacobi_mpiomp.o
$ pat_build -u jacobi_mpiomp
$ ls -lrt
-rwx------ 1 wyang wyang 1035952 Jun 15 06:27 jacobi_mpiomp
-rwx------ 1 wyang wyang 1861408 Jun 15 06:27 jacobi_mpiomp+pat
● Some pat_build options for tracing:○ -u: All user-defined functions are traced (>= 1200 bytes by default)
○ -u -Dtrace-text-size=600: All user-defined functions of size >= 600 bytes are traced
○ -w -T compute_unew_,init_fields_: compute_unew_ and init_fields_ functions in my code are traced
○ -w -T compute_unew_,init_fields_ -g mpi,omp,sysio: compute_unew_ and init_fields_ functions in my code as well as MPI, OpenMP and I/O library functions are traced
○ -w -t tracefile: The functions listed in the file ‘tracefile’ are traced
Uninstrumented executableInstrumented executable
18
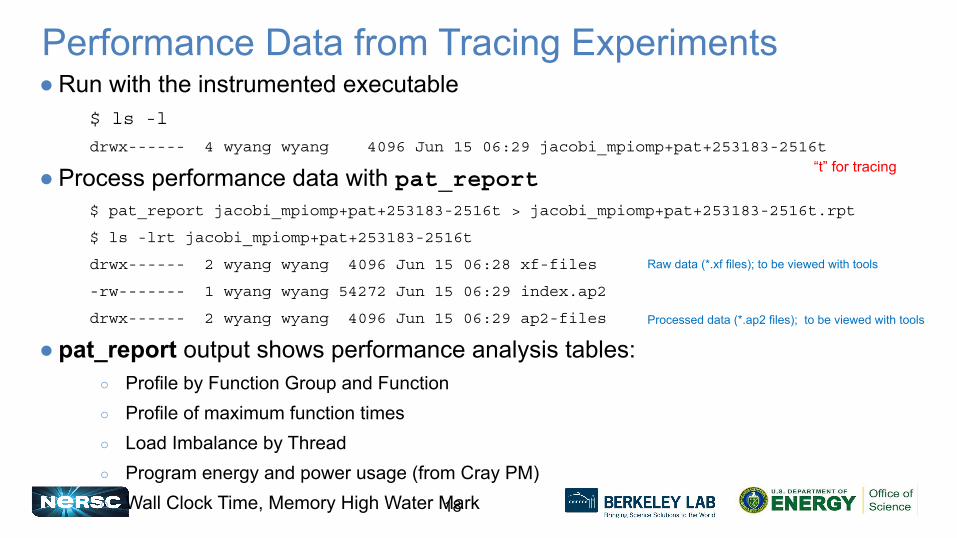
Performance Data from Tracing Experiments● Run with the instrumented executable
$ ls -l
drwx------ 4 wyang wyang 4096 Jun 15 06:29 jacobi_mpiomp+pat+253183-2516t
● Process performance data with pat_report$ pat_report jacobi_mpiomp+pat+253183-2516t > jacobi_mpiomp+pat+253183-2516t.rpt
$ ls -lrt jacobi_mpiomp+pat+253183-2516t
drwx------ 2 wyang wyang 4096 Jun 15 06:28 xf-files
-rw------- 1 wyang wyang 54272 Jun 15 06:29 index.ap2
drwx------ 2 wyang wyang 4096 Jun 15 06:29 ap2-files
● pat_report output shows performance analysis tables:○ Profile by Function Group and Function○ Profile of maximum function times○ Load Imbalance by Thread○ Program energy and power usage (from Cray PM)○ Wall Clock Time, Memory High Water Mark
“t” for tracing
Processed data (*.ap2 files); to be viewed with tools
Raw data (*.xf files); to be viewed with tools

19
Performance Data from Tracing Experiments (cont’d)Table 1: Profile by Function Group and Function
Time% | Time | Imb. | Imb. | Calls | Group | | Time | Time% | | Function | | | | | PE=HIDE | | | | | Thread=HIDE
100.0% | 62.658105 | -- | -- | 30.0 | Total|-------------------------------------------------------------------| 100.0% | 62.657164 | -- | -- | 25.0 | USER||------------------------------------------------------------------|| 55.2% | 34.606555 | 0.271067 | 0.8% | 4.0 | main|| 40.1% | 25.121592 | 0.542069 | 2.2% | 20.0 | compute_unew_|| 4.7% | 2.929017 | 0.035166 | 1.2% | 1.0 | init_fields_||==================================================================| 0.0% | 0.000917 | 0.000479 | 35.4% | 3.0 | ETC||------------------------------------------------------------------|| 0.0% | 0.000917 | 0.000479 | 35.4% | 3.0 | __kmp_create_worker||==================================================================| 0.0% | 0.000024 | -- | -- | 2.0 | MPI||------------------------------------------------------------------|| 0.0% | 0.000014 | 0.000004 | 22.8% | 1.0 | MPI_FINALIZE|| 0.0% | 0.000010 | 0.000002 | 20.2% | 1.0 | MPI_INIT|===================================================================
Table 4: Load Imbalance by Thread
Max. Time | Imb. | Imb. | Thread | Time | Time% | PE=HIDE
62.658501 | -- | -- | Total|---------------------------------------| 62.691284 | 0.032783 | 0.1% | thread.0|=======================================
Table 2: Profile of maximum function times
Time% | Time | Imb. | Imb. | Function | | Time | Time% | PE=[max,min] | | | | Thread=HIDE|-----------------------------------------------------------| 100.0% | 34.877623 | 0.271067 | 0.8% | main||----------------------------------------------------------|| 100.0% | 34.877623 | -- | -- | pe.16|| 97.7% | 34.058597 | -- | -- | pe.6||==========================================================| 73.6% | 25.663661 | 0.542069 | 2.2% | compute_unew_||----------------------------------------------------------|| 73.6% | 25.663661 | -- | -- | pe.6|| 71.2% | 24.829502 | -- | -- | pe.16||==========================================================| 8.5% | 2.964182 | 0.035166 | 1.2% | init_fields_||----------------------------------------------------------|| 8.5% | 2.964182 | -- | -- | pe.24|| 8.3% | 2.891668 | -- | -- | pe.2||==========================================================| 0.0% | 0.001397 | 0.000479 | 35.4% | __kmp_create_worker||----------------------------------------------------------|| 0.0% | 0.001397 | -- | -- | pe.5|| 0.0% | 0.000566 | -- | -- | pe.2||==========================================================| 0.0% | 0.000017 | 0.000004 | 22.8% | MPI_FINALIZE||----------------------------------------------------------|| 0.0% | 0.000017 | -- | -- | pe.16|| 0.0% | 0.000011 | -- | -- | pe.24||==========================================================| 0.0% | 0.000013 | 0.000002 | 20.2% | MPI_INIT||----------------------------------------------------------|| 0.0% | 0.000013 | -- | -- | pe.24|| 0.0% | 0.000009 | -- | -- | pe.28|===========================================================
Table 6: Wall Clock Time, Memory High Water Mark
Process | Process | PE=[mmm] Time | HiMem | Thread | (MiBytes) |
63.225551 | 88.6 | Total|--------------------------------| 63.257213 | 88.7 | pe.31| | | thread.0| 63.206376 | 88.7 | pe.4| | | thread.0| 63.188369 | 88.8 | pe.2| | | thread.0|================================
Table 5: Program energy and power usage (from Cray PM)
Node | Node | Process | Node Id Energy | Power | Time | PE=HIDE (J) | (W) | | Thread=HIDE
30,789 | 486.971 | 63.225551 | Total|---------------------------------------------| 15,397 | 243.427 | 63.251118 | nid.2517| 15,392 | 243.544 | 63.199985 | nid.2516|=============================================
20
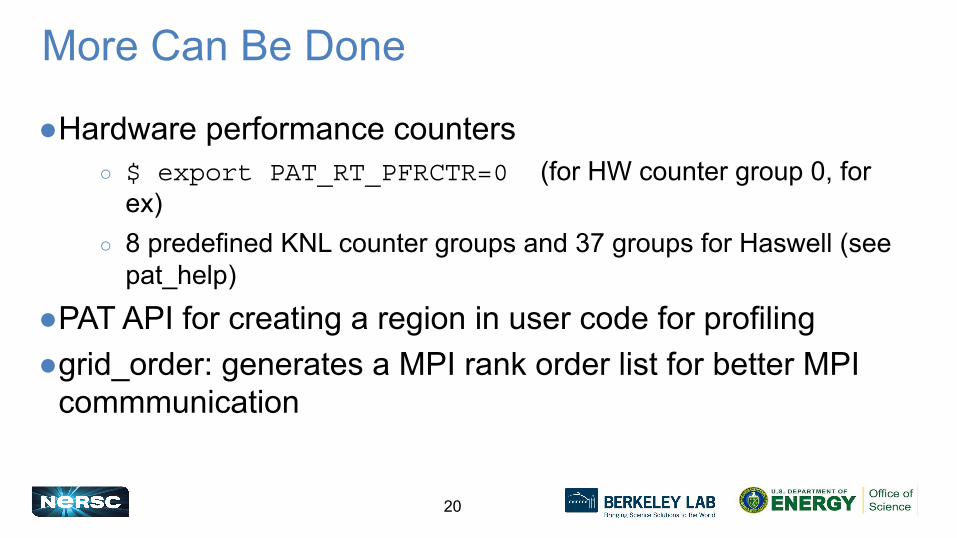
More Can Be Done
●Hardware performance counters○ $ export PAT_RT_PFRCTR=0 (for HW counter group 0, for
ex)○ 8 predefined KNL counter groups and 37 groups for Haswell (see
pat_help)
●PAT API for creating a region in user code for profiling●grid_order: generates a MPI rank order list for better MPI
commmunication
21
Arm MAP
● Arm’s parallel profiling tool with GUI○ Part of the Arm Forge tool
● Based on sampling● Source lines are annotated with performance data for easy spotting of hotspots● Time series of performance metrics for all MPI processes are displayed● Licenses for running up to 4,096 processes; shared with other users● Use NX or Arm Forge remote client for fast X11 responses (see the Debugging
Tools slides on this)● For info:
○ https://developer.arm.com/docs/101136/latest/arm-forge
○ https://docs.nersc.gov/programming/performance-debugging-tools/map/
22
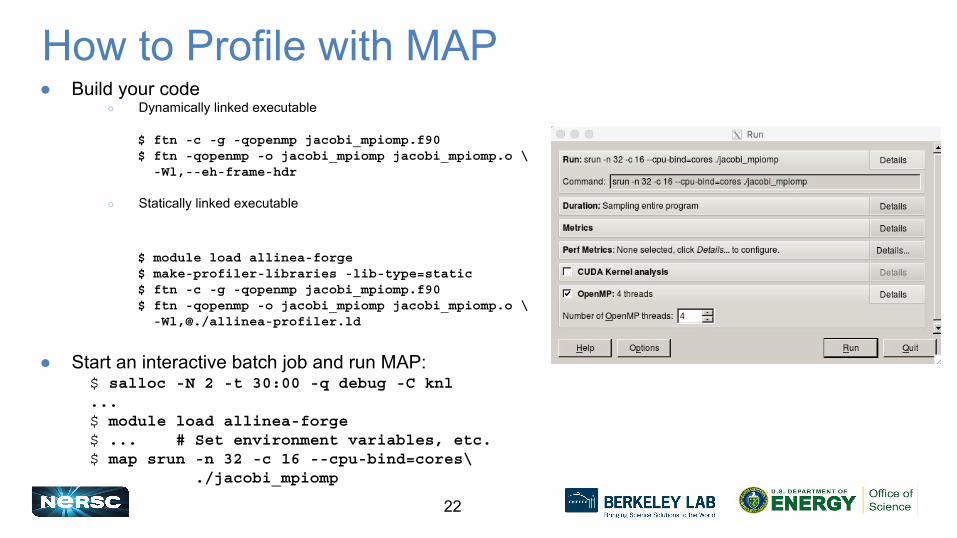
How to Profile with MAP● Build your code
○ Dynamically linked executable
$ ftn -c -g -qopenmp jacobi_mpiomp.f90$ ftn -qopenmp -o jacobi_mpiomp jacobi_mpiomp.o \ -Wl,--eh-frame-hdr
○ Statically linked executable
$ module load allinea-forge$ make-profiler-libraries -lib-type=static$ ftn -c -g -qopenmp jacobi_mpiomp.f90$ ftn -qopenmp -o jacobi_mpiomp jacobi_mpiomp.o \ -Wl,@./allinea-profiler.ld
● Start an interactive batch job and run MAP:$ salloc -N 2 -t 30:00 -q debug -C knl...$ module load allinea-forge$ ... # Set environment variables, etc.$ map srun -n 32 -c 16 --cpu-bind=cores\ ./jacobi_mpiomp
23
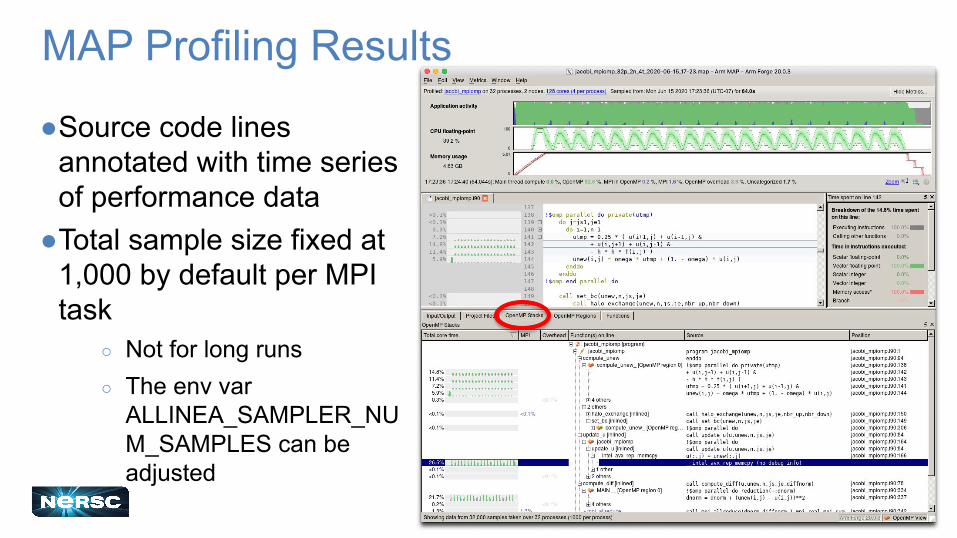
MAP Profiling Results
●Source code lines annotated with time series of performance data
●Total sample size fixed at 1,000 by default per MPI task
○ Not for long runs○ The env var
ALLINEA_SAMPLER_NUM_SAMPLES can be adjusted
24
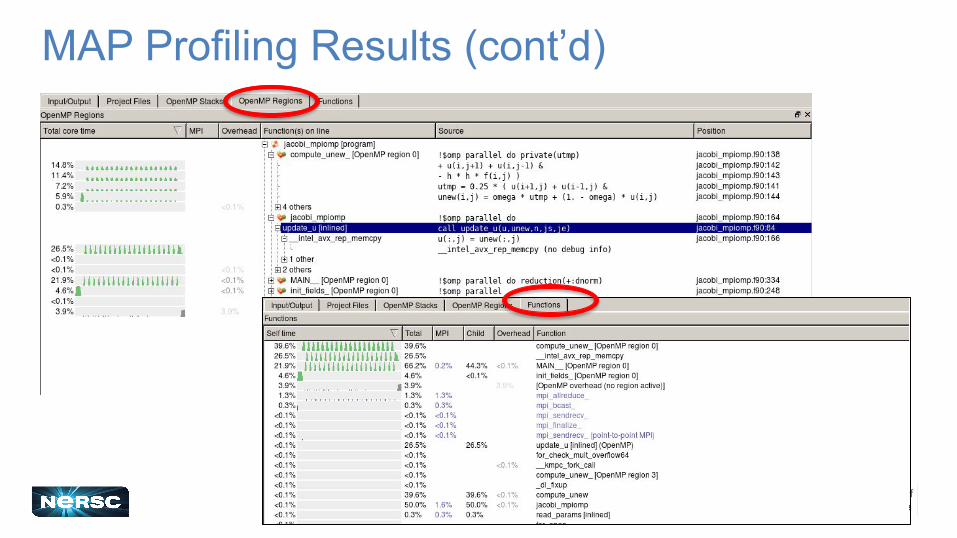
MAP Profiling Results (cont’d)
25
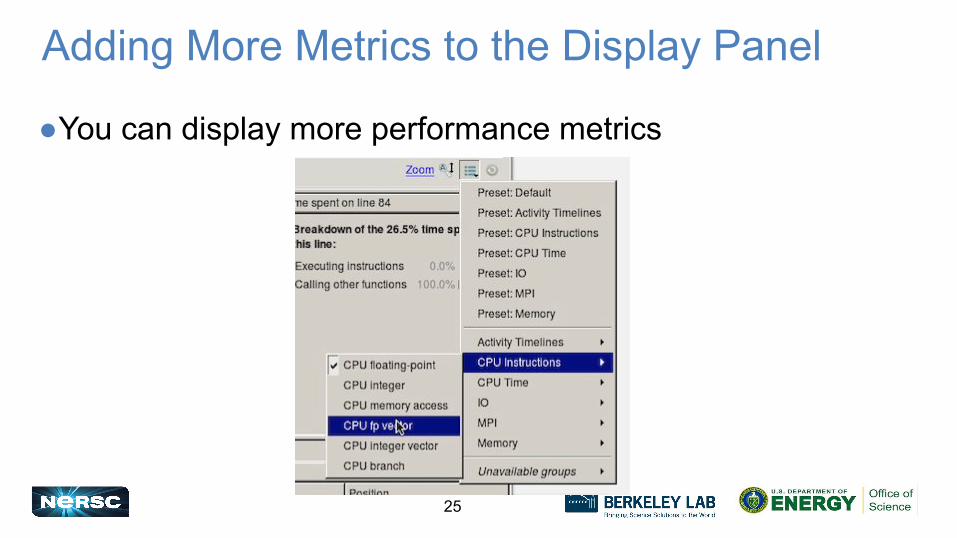
Adding More Metrics to the Display Panel
●You can display more performance metrics

26
Profiling Only Part of a Program● C
○ Include■ #include “mapsampler_api.h”
■ allinea_start_sampling();
■ allinea_stop_sampling();
○ -I${ALLINEA_TOOLS_DIR}/${ALLINEA_TOOLS_VERSION}/map/wrapper
○ -L${ALLINEA_TOOLS_DIR}/${ALLINEA_TOOLS_VERSION}/lib/64 -lmap-sampler
● Fortran○ Include
■ CALL ALLINEA_START_SAMPLING()
■ CALL ALLINEA_STOP_SAMPLING()
○ -L${ALLINEA_TOOLS_DIR}/${ALLINEA_TOOLS_VERSION}/lib/64 -lmap-sampler
● Before starting your program$ export ALLINEA_SAMPLER_DELAY_START=1
27
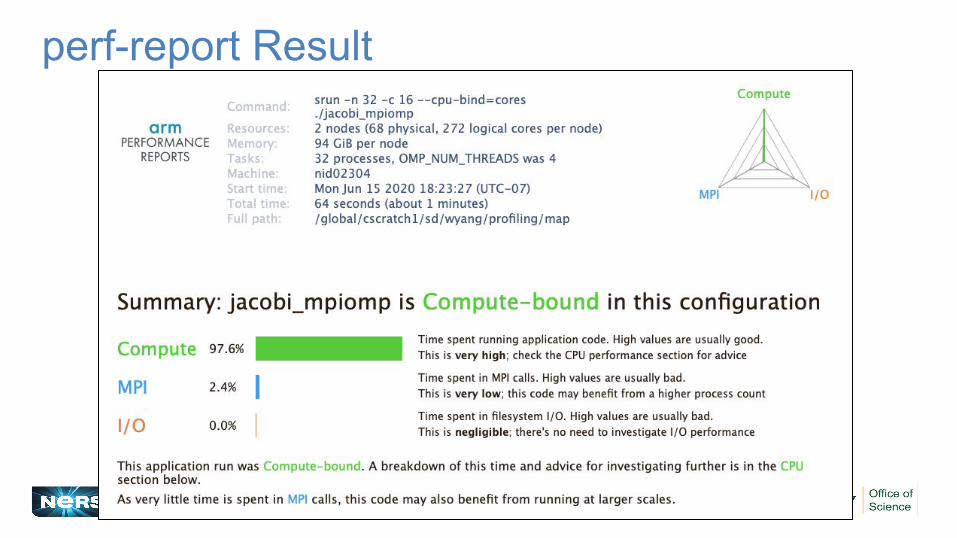
Arm Performance Reports●Arm tool for a quick characterization/summary of parallel
code performance:○ Compute-bound○ MPI-bound or○ I/O-bound
●Results in html and plain-text files●Build exactly the same way as you do for MAP●For info:
○ https://docs.nersc.gov/development/performance-debugging-tools/performancereports/
28
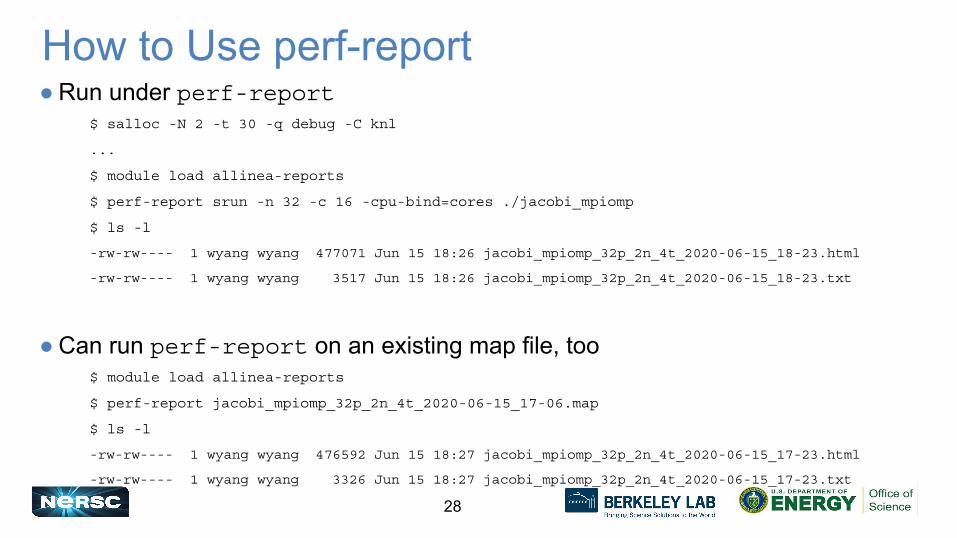
How to Use perf-report● Run under perf-report
$ salloc -N 2 -t 30 -q debug -C knl
...
$ module load allinea-reports
$ perf-report srun -n 32 -c 16 -cpu-bind=cores ./jacobi_mpiomp
$ ls -l
-rw-rw---- 1 wyang wyang 477071 Jun 15 18:26 jacobi_mpiomp_32p_2n_4t_2020-06-15_18-23.html
-rw-rw---- 1 wyang wyang 3517 Jun 15 18:26 jacobi_mpiomp_32p_2n_4t_2020-06-15_18-23.txt
● Can run perf-report on an existing map file, too$ module load allinea-reports
$ perf-report jacobi_mpiomp_32p_2n_4t_2020-06-15_17-06.map
$ ls -l
-rw-rw---- 1 wyang wyang 476592 Jun 15 18:27 jacobi_mpiomp_32p_2n_4t_2020-06-15_17-23.html
-rw-rw---- 1 wyang wyang 3326 Jun 15 18:27 jacobi_mpiomp_32p_2n_4t_2020-06-15_17-23.txt
29
perf-report Result
30
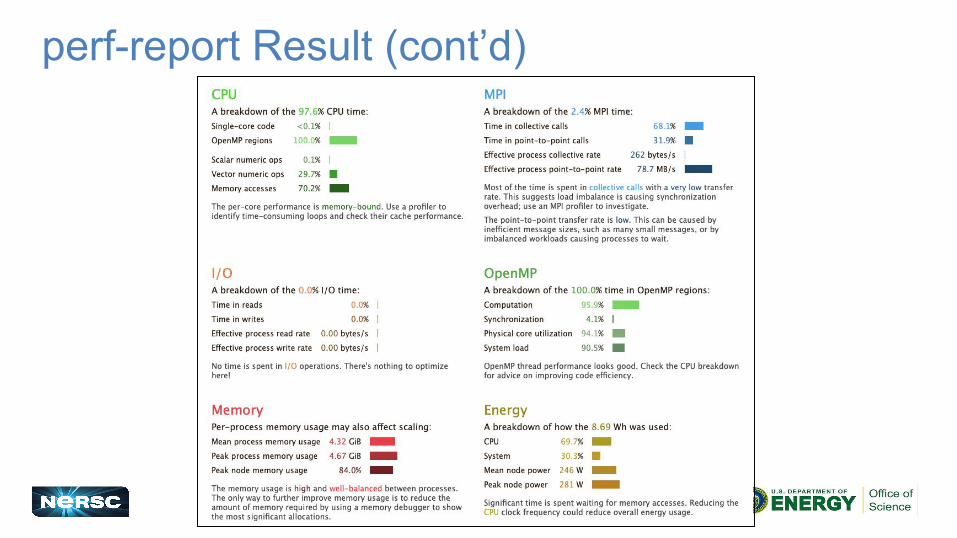
perf-report Result (cont’d)

31
Arm Tools Tutorial on July 16, 2020!
●½-day tutorial for Arm tools○ Arm Forge
■ DDT - debugger■ MAP – performance profiling
○ Performance Reports: performance summary●Beginning/Intermediate level●Will teach how to profile Python apps, too●By Arm engineer● Info and registration
○ https://www.nersc.gov/users/training/events/arm-debugging-and-profiling-tools-tutorial-june-25-2020/

32
Thank You and Welcome to
NERSC!
Related Documents