Profiling Ruby Ian Pointer (@carsondial) March 10, 2015

Welcome message from author
This document is posted to help you gain knowledge. Please leave a comment to let me know what you think about it! Share it to your friends and learn new things together.
Transcript

Profiling RubyIan Pointer (@carsondial)
March 10, 2015
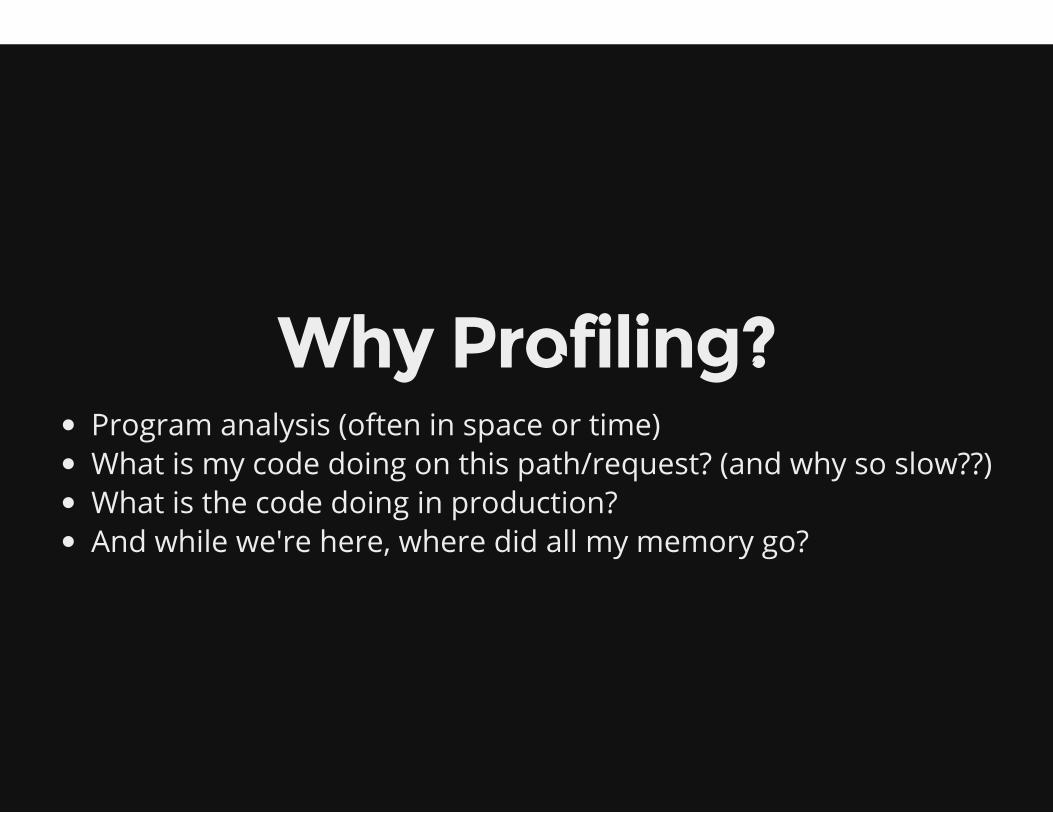
Why Profiling?Program analysis (often in space or time)What is my code doing on this path/request? (and why so slow??)What is the code doing in production?And while we're here, where did all my memory go?

The World of MRIJealous of all the JVM goodness (e.g. VisualVM)Bits and pieces (memprof, etc.)2.x brings a host of improvements
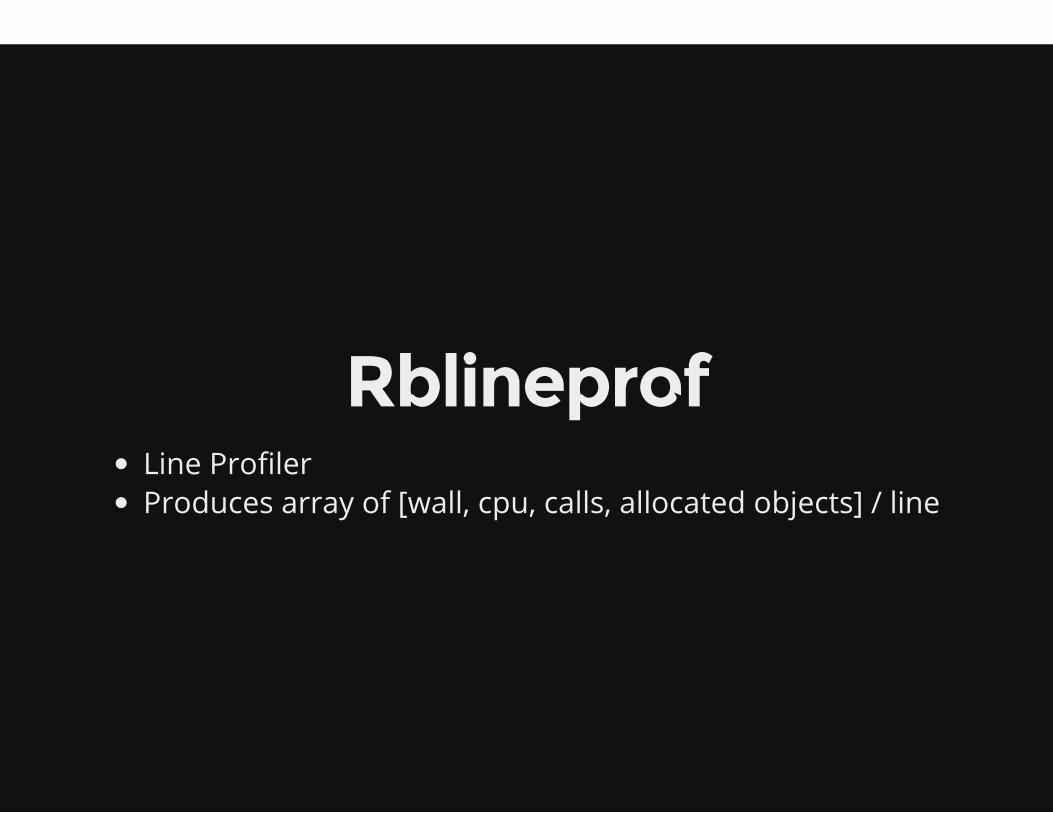
RblineprofLine ProfilerProduces array of [wall, cpu, calls, allocated objects] / line
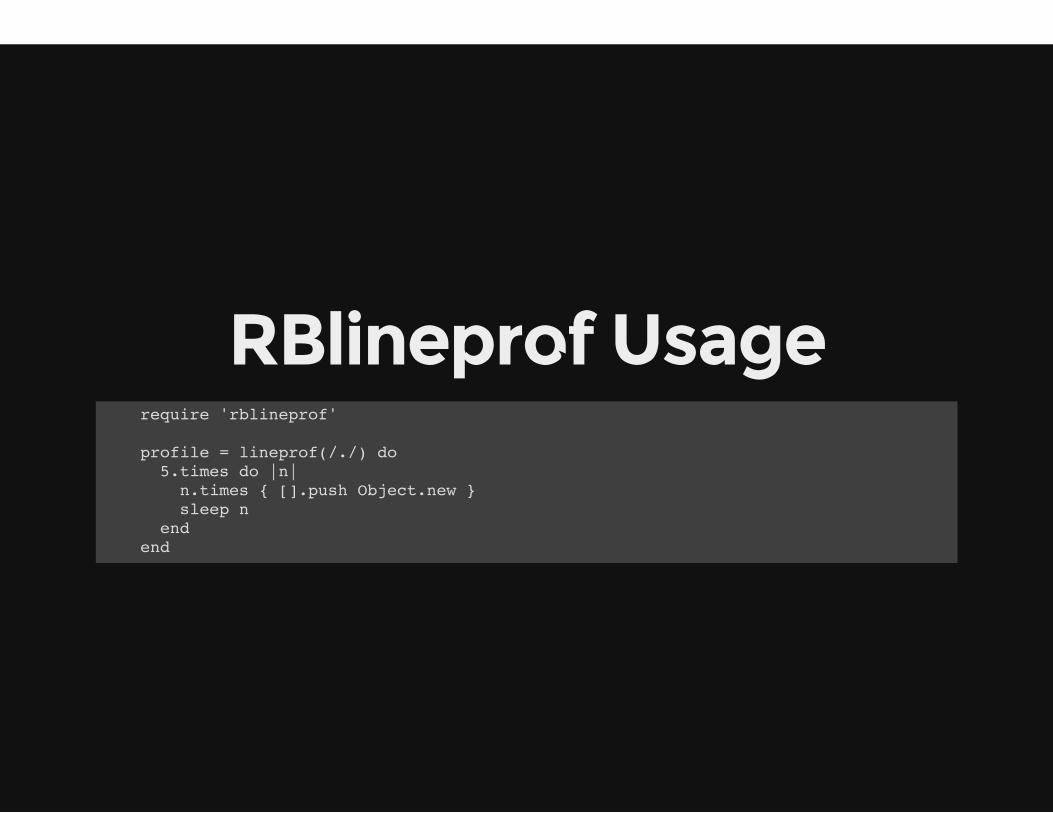
RBlineprof Usage require 'rblineprof'
profile = lineprof(/./) do
5.times do |n|
n.times { [].push Object.new }
sleep n
end
end
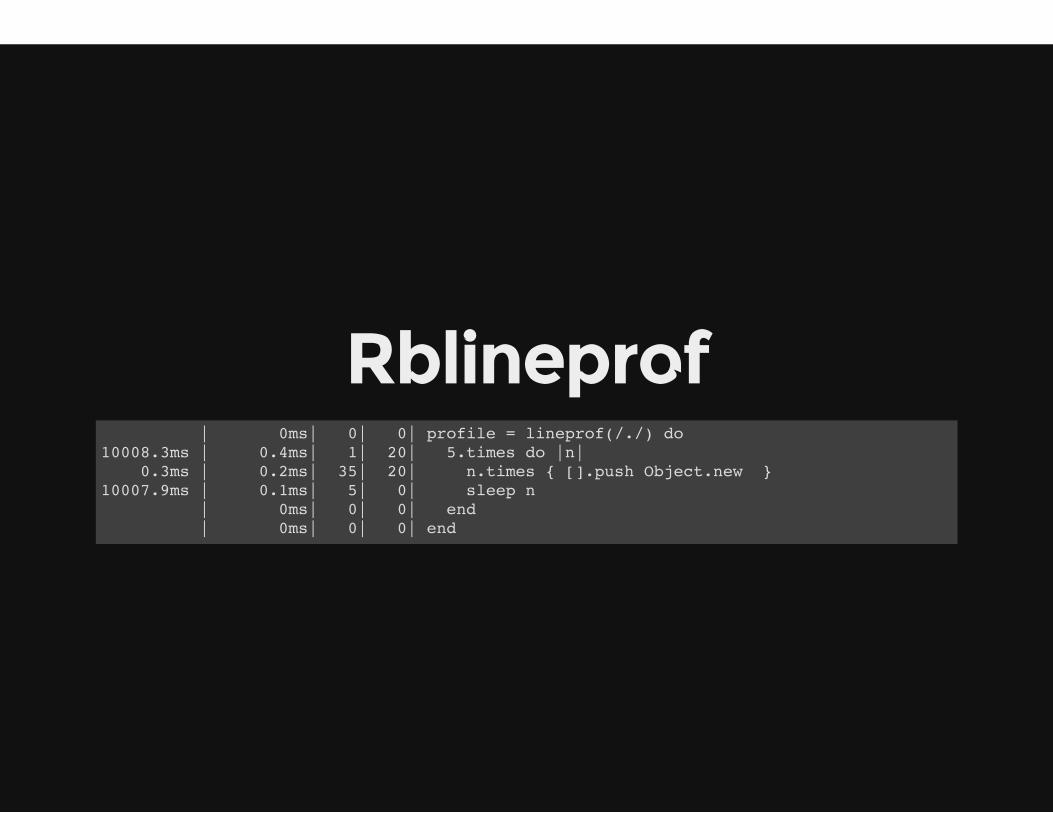
Rblineprof | 0ms| 0| 0| profile = lineprof(/./) do
10008.3ms | 0.4ms| 1| 20| 5.times do |n|
0.3ms | 0.2ms| 35| 20| n.times { [].push Object.new }
10007.9ms | 0.1ms| 5| 0| sleep n
| 0ms| 0| 0| end
| 0ms| 0| 0| end
Peek-rblineprofPeek plugin for Rblineprof
Support for Pygments highlighting
Heavyweight approach

rbtracestrace, but for RubyWorks on 1.8 upLow production impact (mostly)
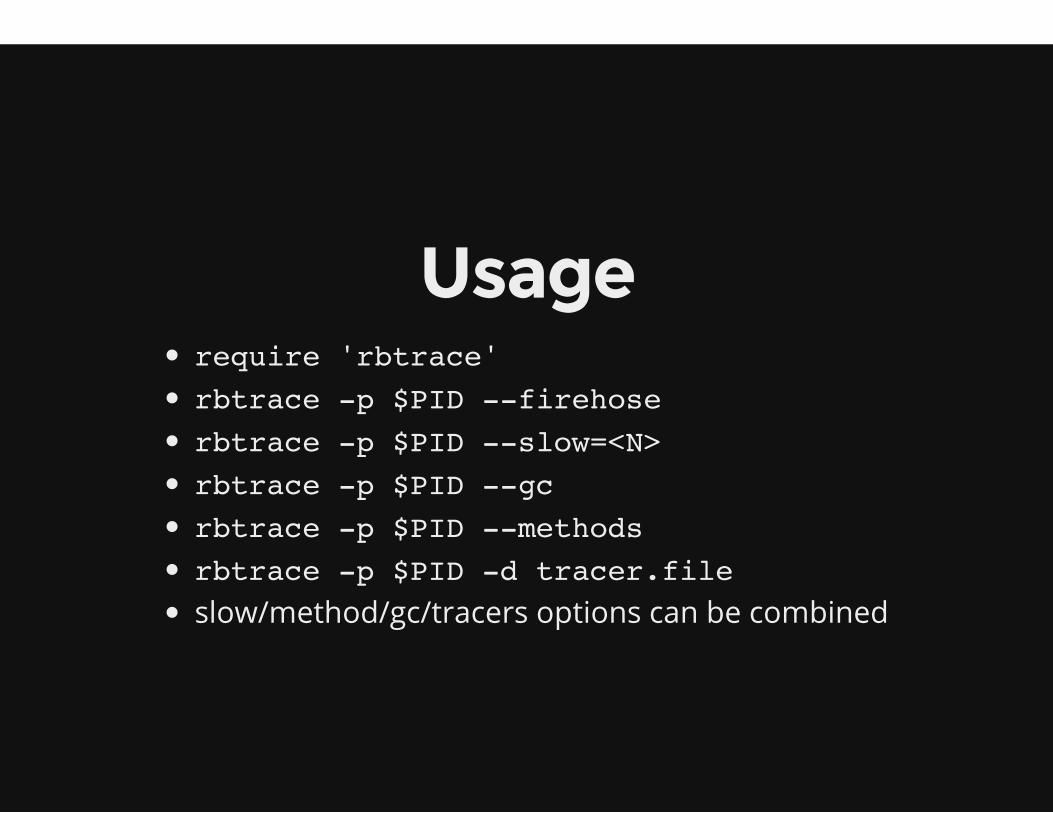
Usagerequire 'rbtrace'rbtrace -p $PID --firehoserbtrace -p $PID --slow=<N>rbtrace -p $PID --gcrbtrace -p $PID --methodsrbtrace -p $PID -d tracer.fileslow/method/gc/tracers options can be combined
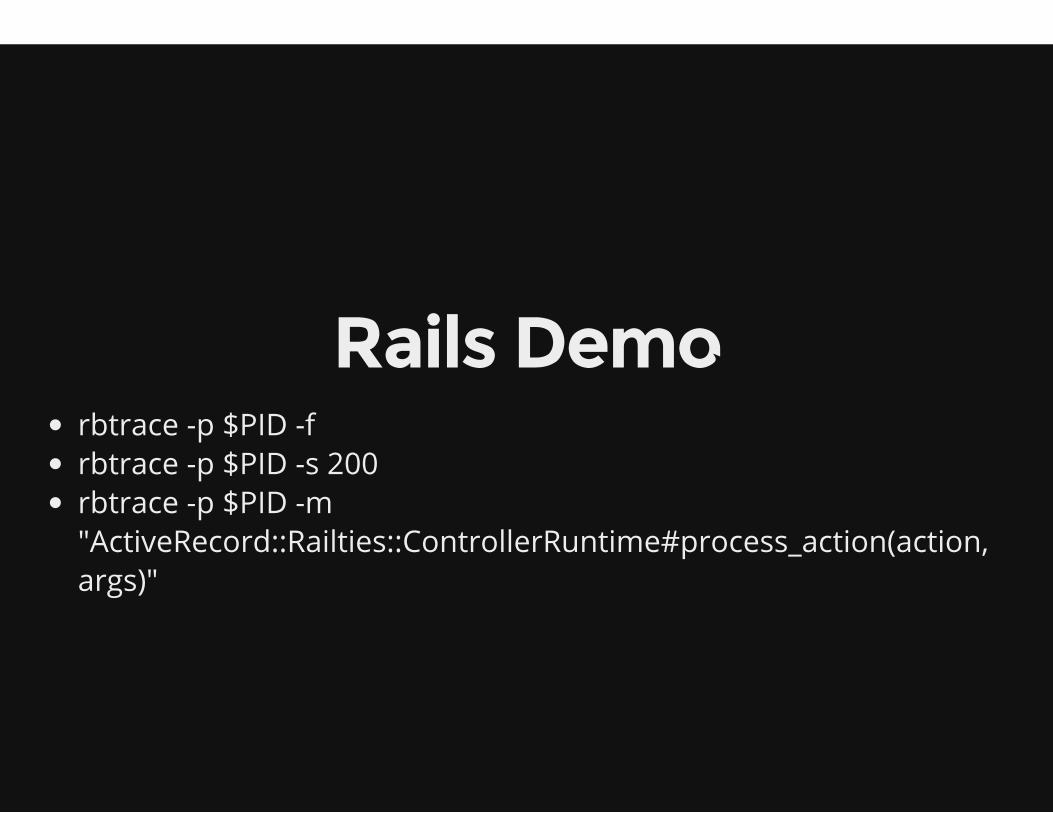
Rails Demorbtrace -p $PID -frbtrace -p $PID -s 200rbtrace -p $PID -m"ActiveRecord::Railties::ControllerRuntime#process_action(action,args)"

StackprofCall-stack sample profiler (using new rb_profile_frames() in2.1)Very low-overhead operationSamples on wall time, cpu time, object allocation counts orYOUR_CUSTOM_PHASE_OF_THE_MOONStandalone & Rack middlewareOff and on-able (accumulates between start/stop)Defaults: cpu, 1000 microsecond intervals

Stackprof UsageStackProf.run(out: 'tmp/app.stackprof') do ...end
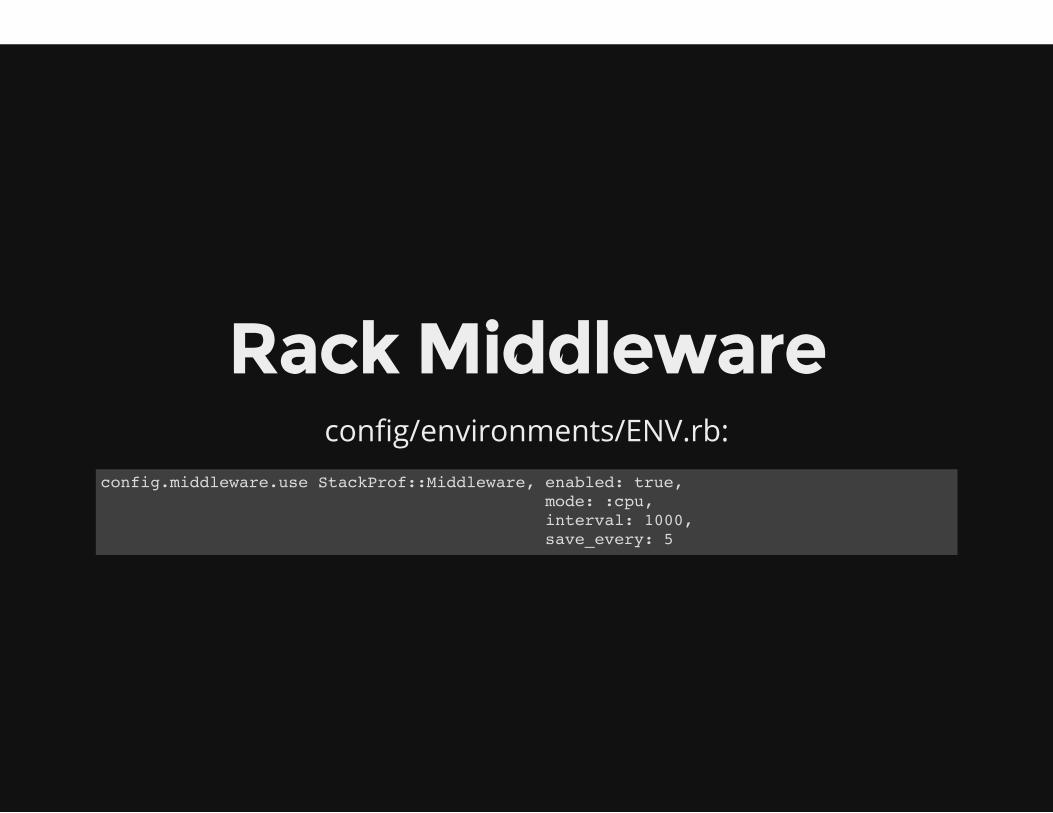
Rack Middlewareconfig/environments/ENV.rb:
config.middleware.use StackProf::Middleware, enabled: true, mode: :cpu, interval: 1000, save_every: 5
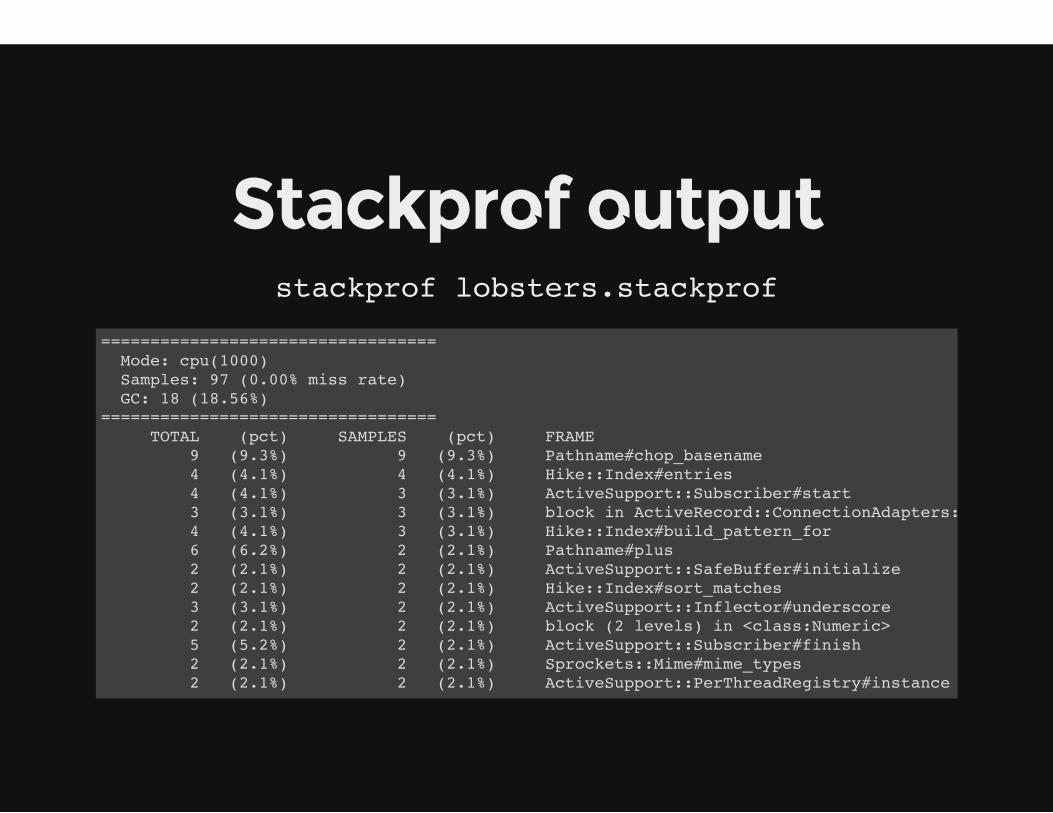
Stackprof outputstackprof lobsters.stackprof
================================== Mode: cpu(1000) Samples: 97 (0.00% miss rate) GC: 18 (18.56%)================================== TOTAL (pct) SAMPLES (pct) FRAME 9 (9.3%) 9 (9.3%) Pathname#chop_basename 4 (4.1%) 4 (4.1%) Hike::Index#entries 4 (4.1%) 3 (3.1%) ActiveSupport::Subscriber#start 3 (3.1%) 3 (3.1%) block in ActiveRecord::ConnectionAdapters::AbstractMysqlAdapter#execute 4 (4.1%) 3 (3.1%) Hike::Index#build_pattern_for 6 (6.2%) 2 (2.1%) Pathname#plus 2 (2.1%) 2 (2.1%) ActiveSupport::SafeBuffer#initialize 2 (2.1%) 2 (2.1%) Hike::Index#sort_matches 3 (3.1%) 2 (2.1%) ActiveSupport::Inflector#underscore 2 (2.1%) 2 (2.1%) block (2 levels) in <class:Numeric> 5 (5.2%) 2 (2.1%) ActiveSupport::Subscriber#finish 2 (2.1%) 2 (2.1%) Sprockets::Mime#mime_types 2 (2.1%) 2 (2.1%) ActiveSupport::PerThreadRegistry#instance
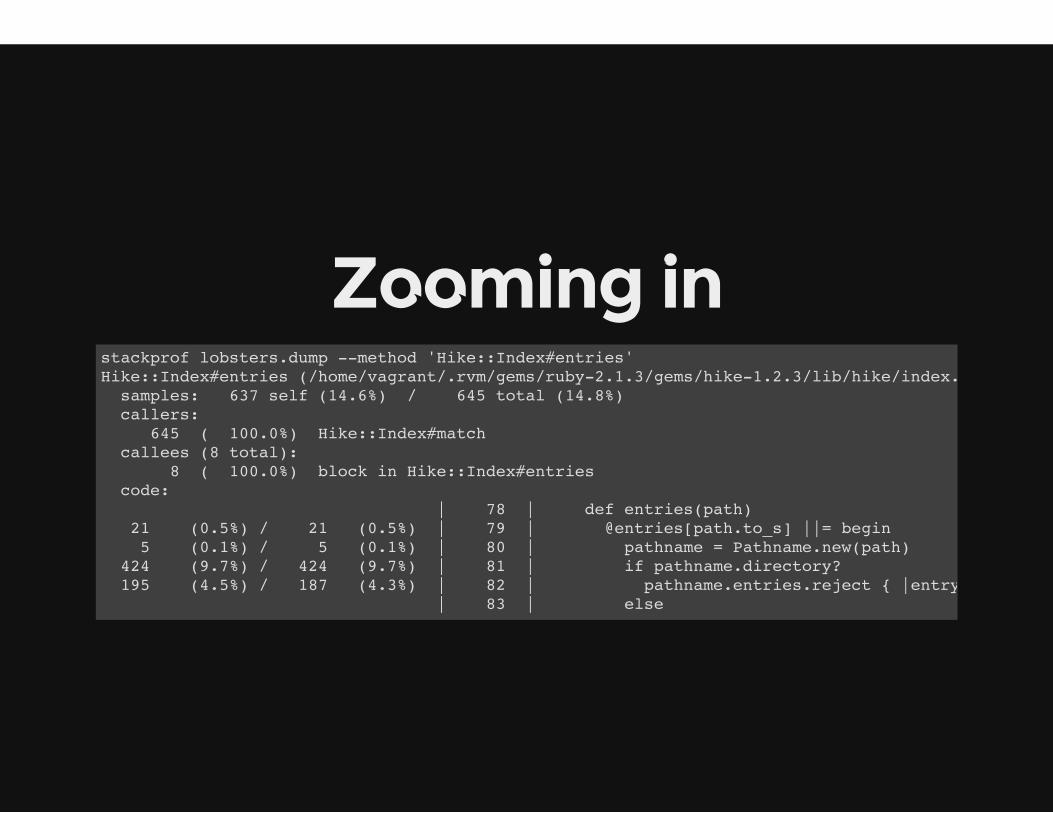
Zooming instackprof lobsters.dump --method 'Hike::Index#entries'
Hike::Index#entries (/home/vagrant/.rvm/gems/ruby-2.1.3/gems/hike-1.2.3/lib/hike/index.rb:78)
samples: 637 self (14.6%) / 645 total (14.8%)
callers:
645 ( 100.0%) Hike::Index#match
callees (8 total):
8 ( 100.0%) block in Hike::Index#entries
code:
| 78 | def entries(path)
21 (0.5%) / 21 (0.5%) | 79 | @entries[path.to_s] ||= begin
5 (0.1%) / 5 (0.1%) | 80 | pathname = Pathname.new(path)
424 (9.7%) / 424 (9.7%) | 81 | if pathname.directory?
195 (4.5%) / 187 (4.3%) | 82 | pathname.entries.reject { |entry| entry.to_s =~ /^\.|~$|^\#.*\#$/ }.sort
| 83 | else

Flamegraphs!
Flamegraphs!
FLAMEGRAPHS!

FlamegraphsWhat are they?Visualization technique for sample stack tracesTurning thousands of dense traces into a single imageInvented by Brendan Gregg (Joyent / Netflix)
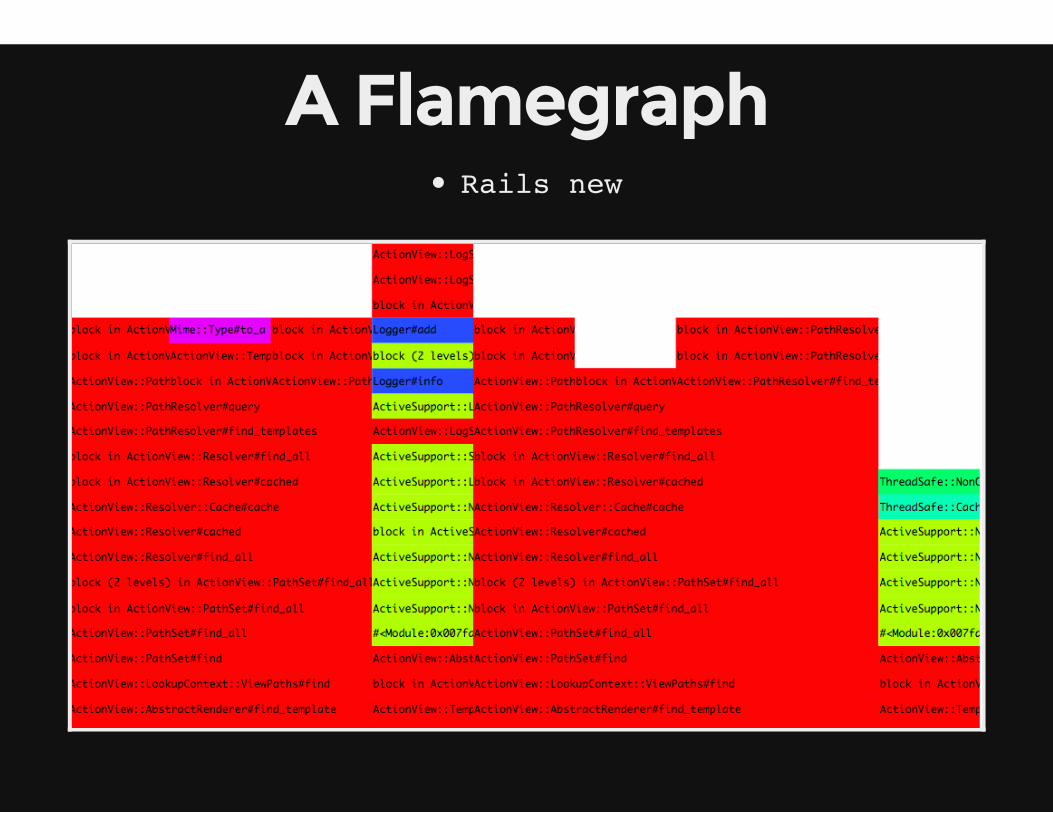
A FlamegraphRails new
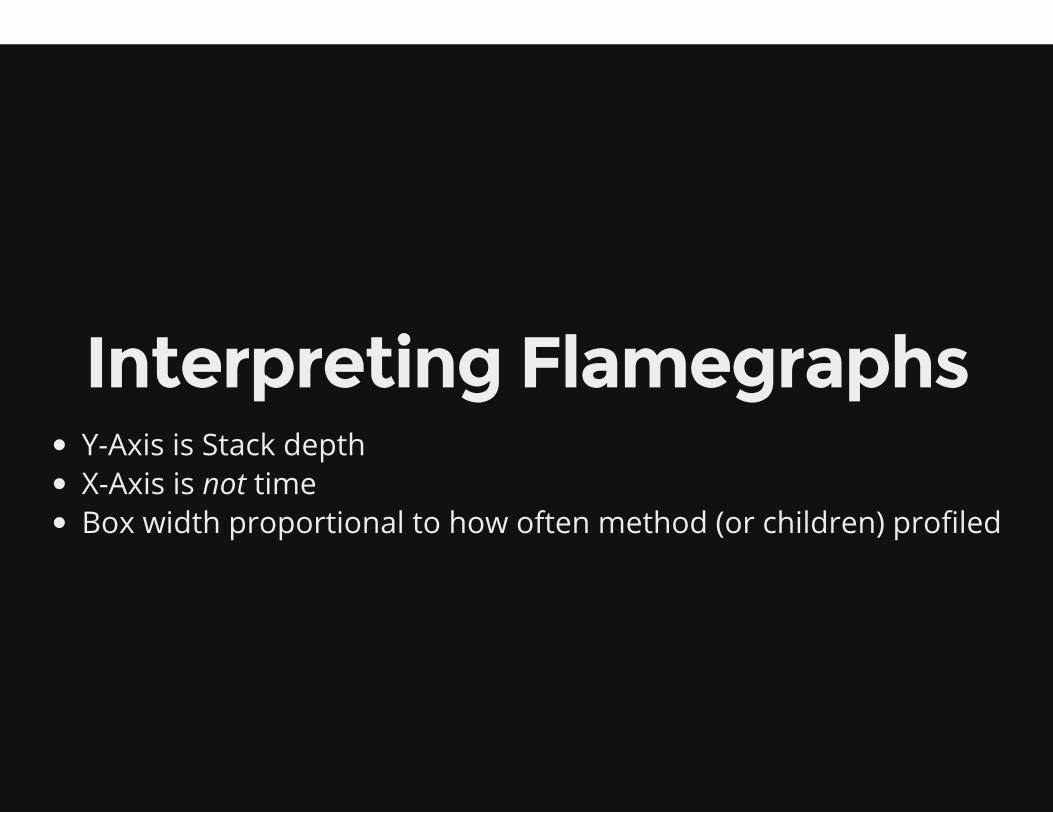
Interpreting FlamegraphsY-Axis is Stack depthX-Axis is not timeBox width proportional to how often method (or children) profiled

Stackprof Flamegraphspass in raw:true (Rack middleware requires patching)stackprof --flamegraph stack.dump > flame_outputstackprof --flamegraph-viewer flame_output (Safari /Chrome only)stackprof --stackcollapse stack.dump (classicalFlamegraph)
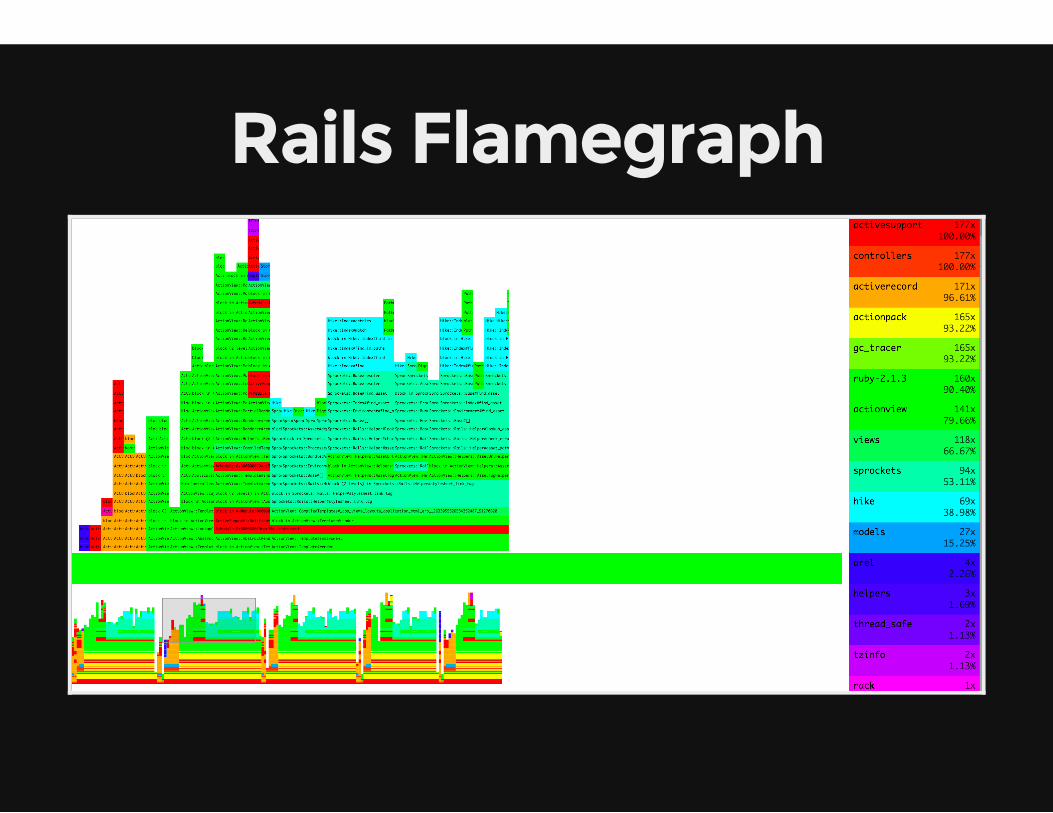
Rails Flamegraph
Rails FlamegraphDefault Stackprof flamegraphs show repeated calls to samemethodsCan hide patternsGregg's flamegraph includes a 'collapse' preprocessing phase tocombine repeated calls
Another exampleWorking on a pure Ruby application'Why is it running so slow?''Can we see any quick way of shaving off some execution time?'
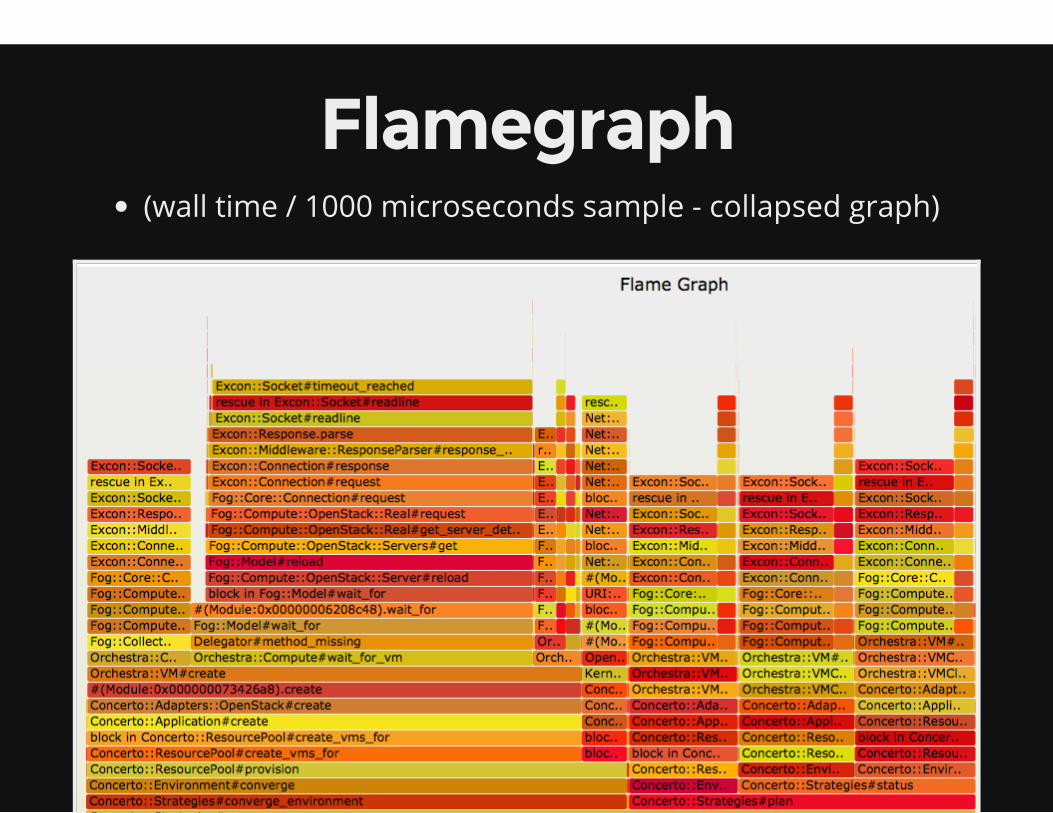
Flamegraph(wall time / 1000 microseconds sample - collapsed graph)
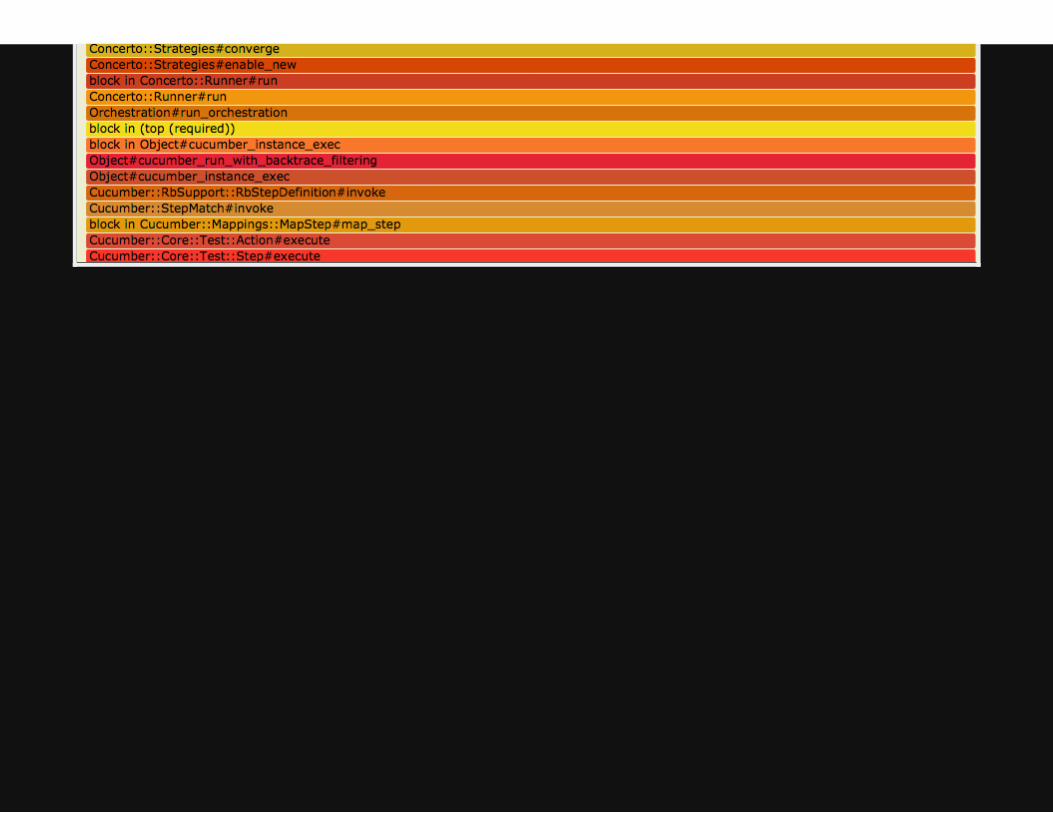
InterpretationMost of the execution time is spent in Excon and Fog methods
These are talking to network (OpenStack / Puppet)
Caching some results provided a quick win that shaved ~30s
Most of execution time still network-based
Medium / Long-term solution to move to pre-baked images and
thus eliminate need for Puppet run
Result: Runtime of 8 minutes (!) down to 20s.

MemoryWhere did it all go?

ObjectSpace
require 'objspace'
ObjectSpace.trace_object_allocations_start
ObjectSpace.dump/dump_all

dump & dump_allJSON representation of object (more info provided if allocationtracing is on)GIVE ME THE ENTIRE HEAP! ObjectSpace.dump_allDump is multiple lines of JSON(Obviously, can be large!)

Example - pryQ. How many STRINGS are there in my pry session?
require 'objspace'
ObjectSpace.dump_all(output: File.open('heap.dump','w'))
$> grep '"type":"STRING"' heap.dump | wc -l
A. ???
Hunting for leaks with
rbtrace
wabbit seasonIdea - GC, dump, repeat, and compare
Remove objects from dump 2 that are in dump 1(Remove missing objects in dump 3 from dump 2)
Not necessarily leaks but a great place to start looking

Rbtrace & LeaksHow to get the dumps from a live server?
rbtrace -e
e.g. rbtrace -p $PID -e 'Rails.root.to_s'
watch out for eval timeouts
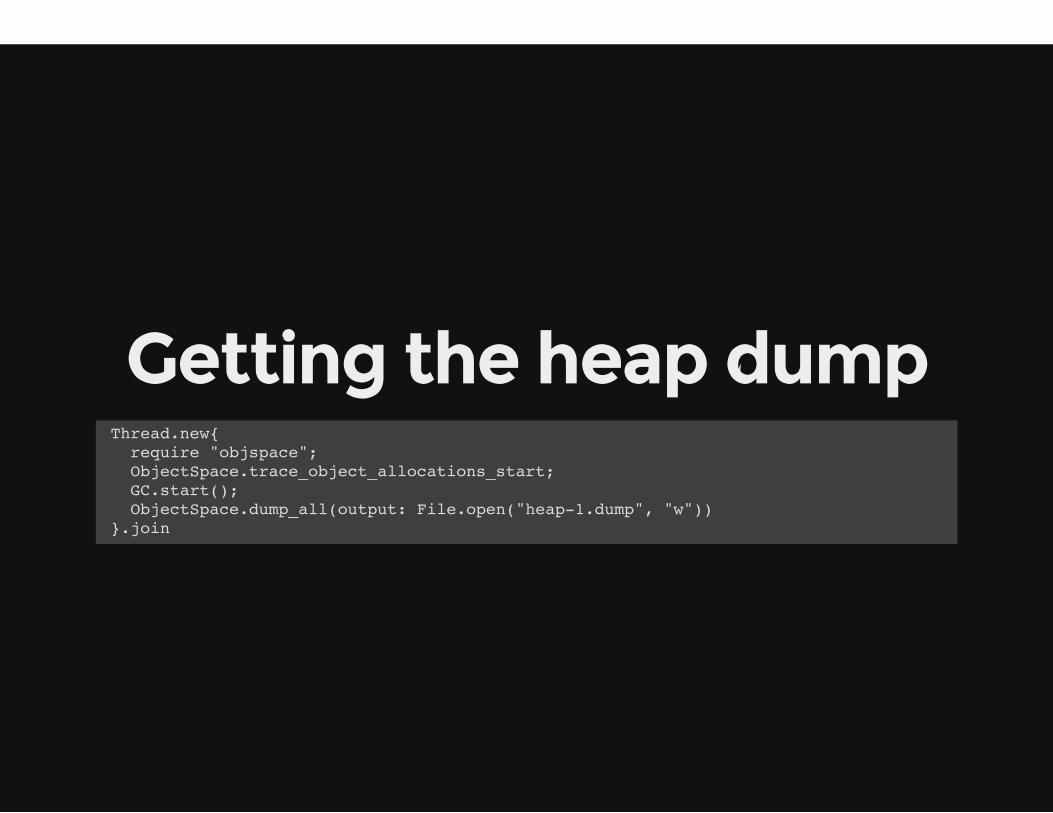
Getting the heap dump Thread.new{
require "objspace";
ObjectSpace.trace_object_allocations_start;
GC.start();
ObjectSpace.dump_all(output: File.open("heap-1.dump", "w"))
}.join
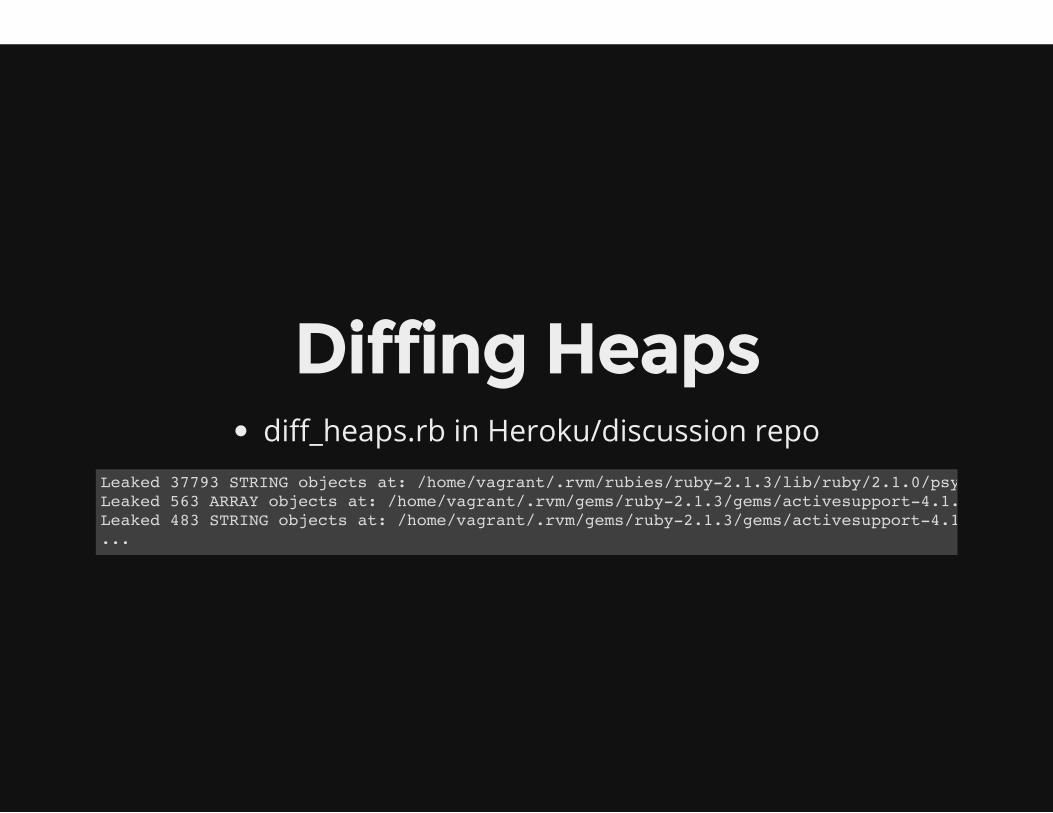
Diffing Heaps
diff_heaps.rb in Heroku/discussion repo
Leaked 37793 STRING objects at: /home/vagrant/.rvm/rubies/ruby-2.1.3/lib/ruby/2.1.0/psych.rb:370Leaked 563 ARRAY objects at: /home/vagrant/.rvm/gems/ruby-2.1.3/gems/activesupport-4.1.8/lib/active_support/core_ext/hash/keys.rb:142Leaked 483 STRING objects at: /home/vagrant/.rvm/gems/ruby-2.1.3/gems/activesupport-4.1.8/lib/active_support/dependencies.rb:443...
MemoryProfilerUses new 2.1+ hooksShows allocated / retained memoryCan be slow
DemoLet's look at SinatraMemoryProfiler.report { require 'sinatra' }.pretty_printFreeze your strings!
GCGC is in a state of flux
1.9.x, 2.0, 2.1, 2.2 all have different GC strategies.
Mostly worked with 2.1 (2.2 is improvement on 2.1 strategy)
Tuning? Here be dragons…
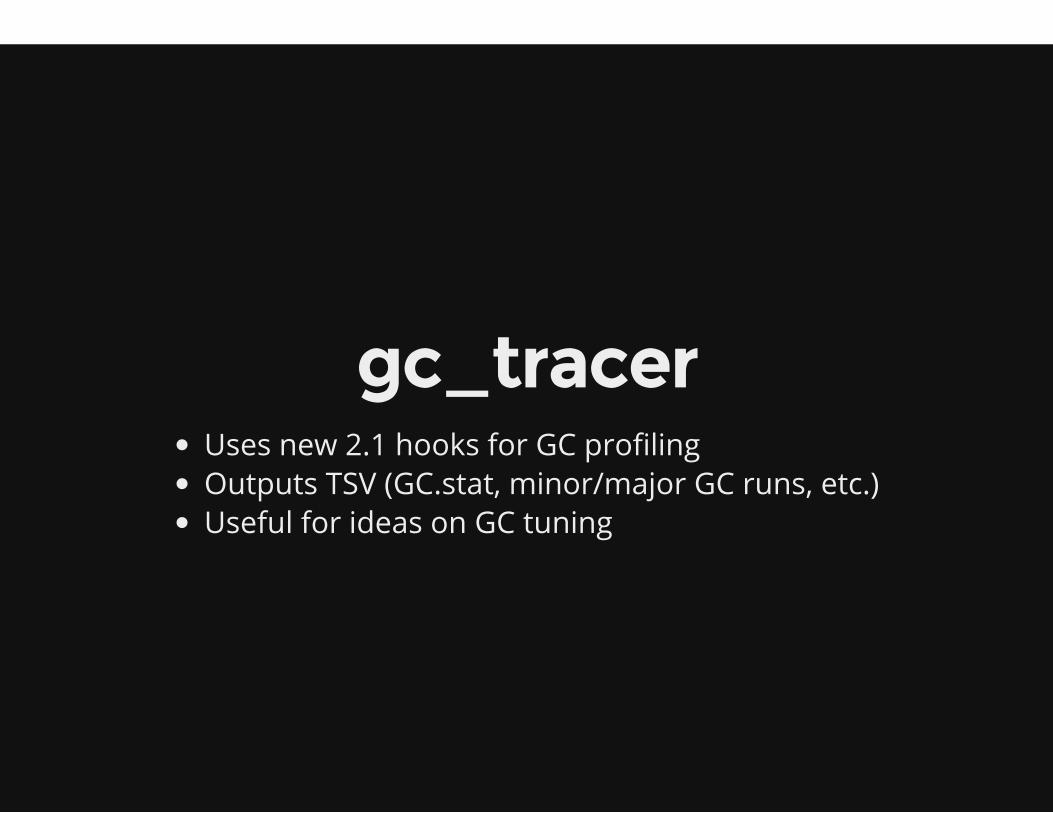
gc_tracerUses new 2.1 hooks for GC profiling
Outputs TSV (GC.stat, minor/major GC runs, etc.)
Useful for ideas on GC tuning
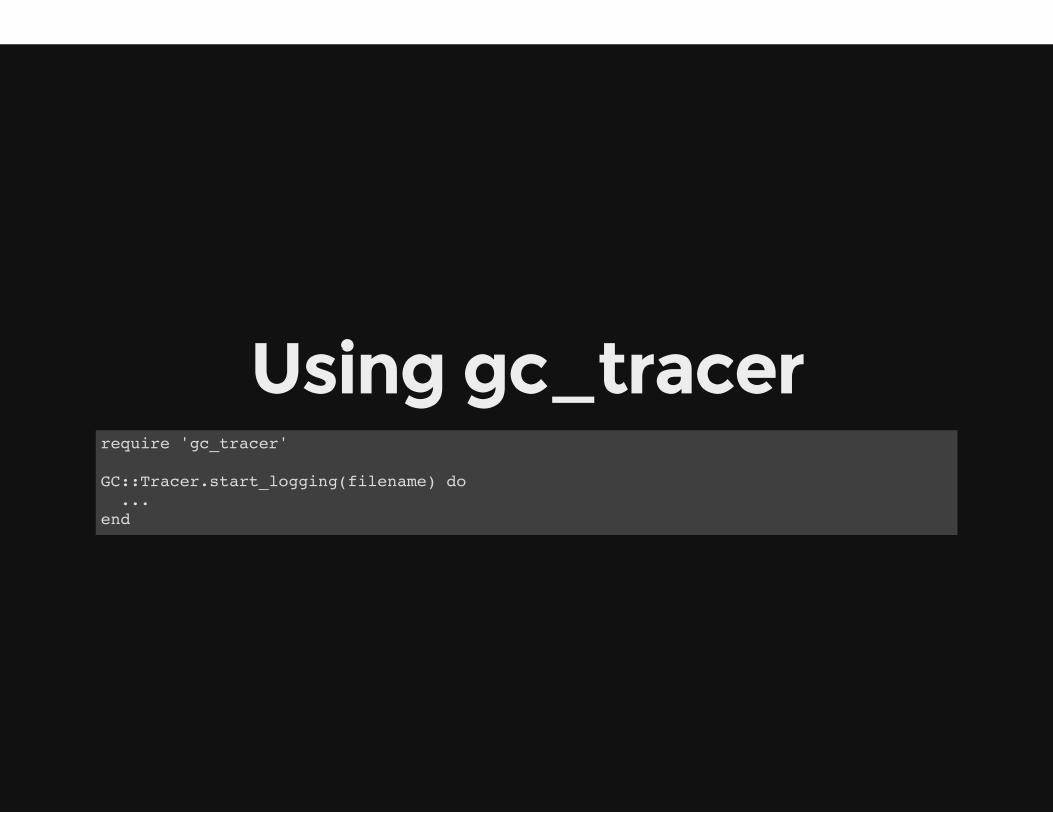
Using gc_tracerrequire 'gc_tracer'
GC::Tracer.start_logging(filename) do ...end
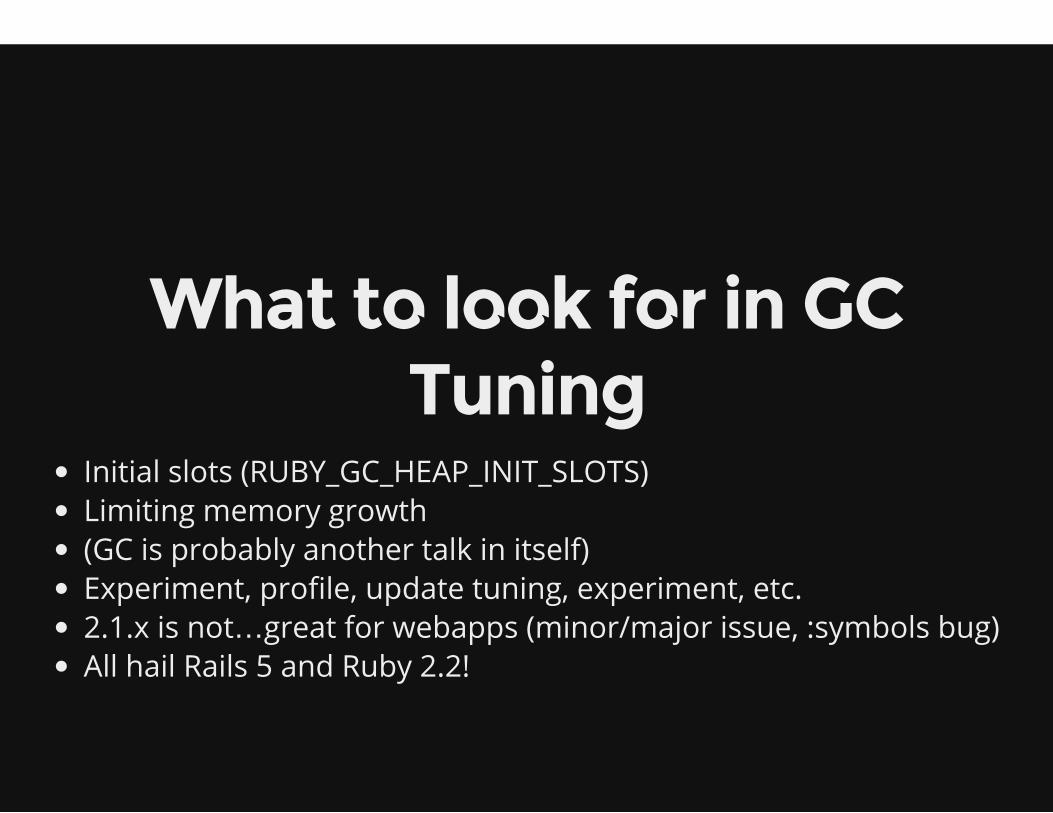
What to look for in GCTuning
Initial slots (RUBY_GC_HEAP_INIT_SLOTS)Limiting memory growth(GC is probably another talk in itself)Experiment, profile, update tuning, experiment, etc.2.1.x is not…great for webapps (minor/major issue, :symbols bug)All hail Rails 5 and Ruby 2.2!

Summing UpThings are getting better!Still a bunch of separate tools (with some overlap)(more things abound - ruby-prof, rack-mini-profiler, etc)Good idea to send some of this to logging / graphite / etc.Lower level - SystemTap, DTrace, perf
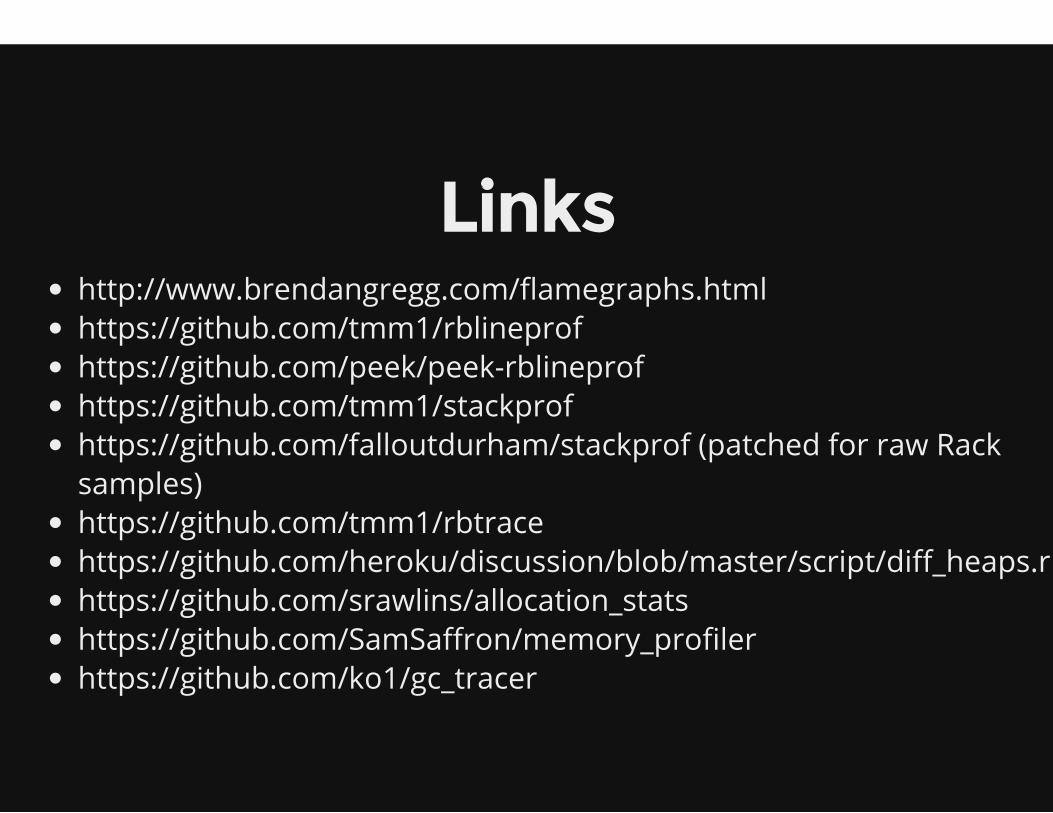
Linkshttp://www.brendangregg.com/flamegraphs.htmlhttps://github.com/tmm1/rblineprofhttps://github.com/peek/peek-rblineprofhttps://github.com/tmm1/stackprofhttps://github.com/falloutdurham/stackprof (patched for raw Racksamples)https://github.com/tmm1/rbtracehttps://github.com/heroku/discussion/blob/master/script/diff_heaps.rbhttps://github.com/srawlins/allocation_statshttps://github.com/SamSaffron/memory_profilerhttps://github.com/ko1/gc_tracer

Questions?
Related Documents


![Ruby on Rails [ Ruby On Rails.ppt ] - [Ruby-Doc.org: Documenting ...](https://static.cupdf.com/doc/110x72/554f9e1eb4c9057b298b4732/ruby-on-rails-ruby-on-railsppt-ruby-docorg-documenting-.jpg)


