PROFILES OF GSE MORTGAGE PURCHASES IN 1999 AND 2000 U.S. Department of Housing and Urban Development Office of Policy Development and Research April, 2002

Welcome message from author
This document is posted to help you gain knowledge. Please leave a comment to let me know what you think about it! Share it to your friends and learn new things together.
Transcript
PROFILES OF GSE MORTGAGE PURCHASES IN 1999 AND 2000
U.S. Department of Housing and Urban Development Office of Policy Development and Research
April, 2002

PREFACE The Federal Housing Enterprises Financial Safety and Soundness Act of 1992 requires that the Department of Housing and Urban Development publicly release data–in forms useful to the public–on mortgages purchased by Fannie Mae and Freddie Mac. These government sponsored enterprises (GSEs) operate in the secondary market for residential mortgages. In keeping with HUD’s mandate, this compendium of tables presents profiles of mortgages purchased by the GSEs (mainly in 1999-2000, but also in some cases covering previous years). Some of these tables update tables included in appendixes to the Department’s October 2000 Final Rule (which established goals that began in 2001 for the GSEs’ purchases of mortgages for low- and moderate-income families, Special Affordable mortgages, and mortgages on properties in underserved geographical areas). Other tables are available for the first time in this compendium. Their release results from Departmental decisions in 2000 and 2001 to treat certain aggregations of data as non-proprietary. Release of these tables augments the scope of information that the Department makes available on Fannie Mae’s and Freddie Mac’s mortgage purchases, which already includes an annual loan-level public use data base and various analytical reports and working papers.

CONTENTS Discussion of the Tables Table 1: Overview of the GSEs’ Housing Goal Performance, 1993-2000, and Goals for 1996-2003 Table 2: Annual Trends in GSE Purchases and Single-Family Lending in Metropolitan Areas 2a: Goal-Qualifying Home Purchase and Refinance Mortgages, 1992-2000 2b: Goal-Qualifying Home Purchase Mortgages, 1992-2000 Table 3: Affordable Lending Shares for Major Sectors of the Mortgage Market in Metropolitan Areas 3a: Home Purchase and Refinance Mortgages, 1997-2000 3b: Home Purchase Mortgages, 1997-2000 Table 4: Number of Units Financed by Fannie Mae and Freddie Mac Purchases by Year of Mortgage Origination (1999; 1998) Table 5: GSEs’ Single-Family Owner-Occupied 1-Unit Mortgage Purchases by Housing Goal and Mortgagor’s Income (2000; 1999) 5a: Fannie Mae 5b: Freddie Mac Table 6: Fannie Mae and Freddie Mac Acquisitions of Single-Family and Multifamily Units in Underserved Metropolitan and Non-metropolitan Areas in 1998, 1999, and 2000 Table 7: Loan and Borrower Characteristics of Single-Family Mortgages Purchased by the GSEs (2000; 1999) 7a: Metropolitan Areas, All Mortgages 7b: Non-metropolitan Areas, All Mortgages 7c: Metropolitan Areas, Home Purchase Mortgages 7d: Non-metropolitan Areas, Home Purchase Mortgages Table 8: GSEs' Goal-Qualifying Loans by Metropolitan Area (2000; 1999) Table 9: Single-Family Mortgages by Goal Category: GSE Purchases and Conventional Conforming Market Originations, Metropolitan Areas (2000)
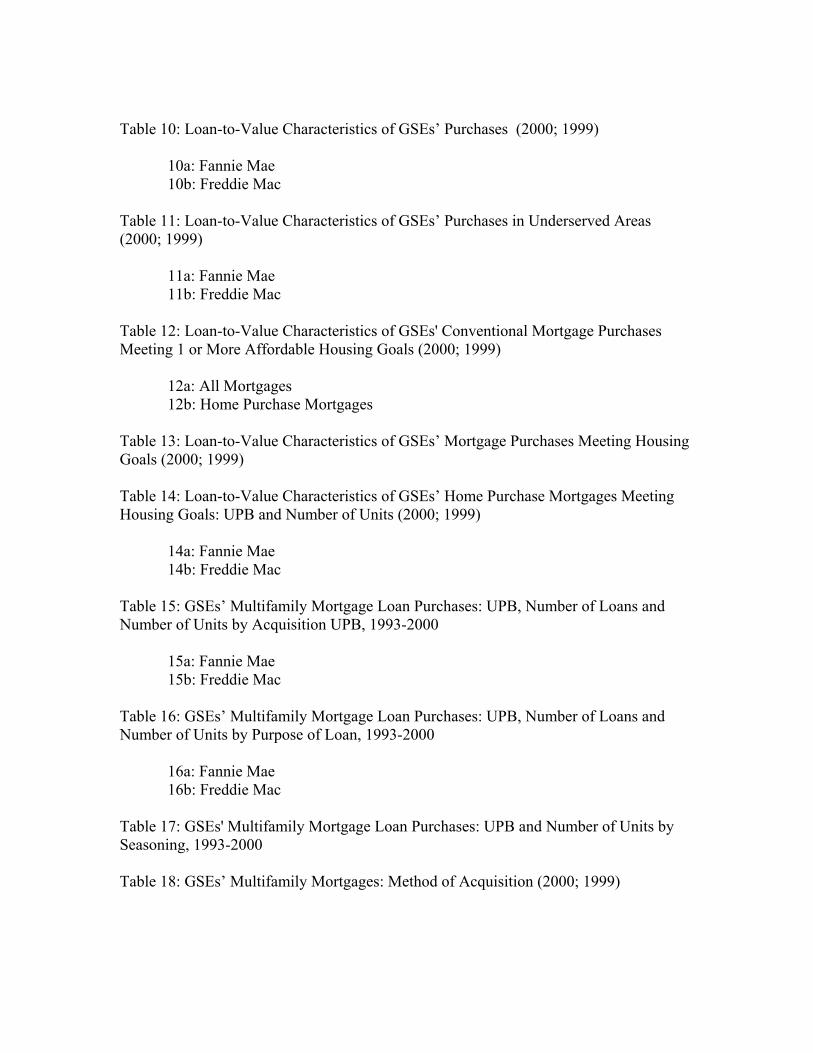
Table 10: Loan-to-Value Characteristics of GSEs’ Purchases (2000; 1999) 10a: Fannie Mae 10b: Freddie Mac Table 11: Loan-to-Value Characteristics of GSEs’ Purchases in Underserved Areas (2000; 1999) 11a: Fannie Mae 11b: Freddie Mac Table 12: Loan-to-Value Characteristics of GSEs' Conventional Mortgage Purchases Meeting 1 or More Affordable Housing Goals (2000; 1999) 12a: All Mortgages 12b: Home Purchase Mortgages Table 13: Loan-to-Value Characteristics of GSEs’ Mortgage Purchases Meeting Housing Goals (2000; 1999) Table 14: Loan-to-Value Characteristics of GSEs’ Home Purchase Mortgages Meeting Housing Goals: UPB and Number of Units (2000; 1999) 14a: Fannie Mae 14b: Freddie Mac Table 15: GSEs’ Multifamily Mortgage Loan Purchases: UPB, Number of Loans and Number of Units by Acquisition UPB, 1993-2000 15a: Fannie Mae 15b: Freddie Mac Table 16: GSEs’ Multifamily Mortgage Loan Purchases: UPB, Number of Loans and Number of Units by Purpose of Loan, 1993-2000 16a: Fannie Mae 16b: Freddie Mac Table 17: GSEs' Multifamily Mortgage Loan Purchases: UPB and Number of Units by Seasoning, 1993-2000 Table 18: GSEs’ Multifamily Mortgages: Method of Acquisition (2000; 1999)

DISCUSSION OF THE TABLES Tables 1-7 describe the GSEs’ mortgage purchases at the national level. Specifically, table 1 presents figures on the GSEs’ performance relative to the affordable housing goals which are established for the GSEs by the Department, and tables 2-7 describe characteristics of the mortgages purchased by the GSEs that qualify under the goals, including comparisons between the GSEs’ single-family purchases and aggregate single-family mortgage originations in the conventional conforming market. Table 8 shows percentages of housing units that qualify under each of the affordable housing goals by metropolitan statistical area (MSA), and Table 9 compares GSE single-family mortgage purchases with mortgage originations by housing goal category for MSAs. Tables 10-14 give profiles of the GSEs’ purchases of mortgages on one-unit properties by loan-to-value ratio. Tables 15-18 present information on the GSEs’ purchases of mortgages on multifamily rental properties. Each table includes explanatory notes. Each of the three GSE housing goals – Low- and Moderate-Income, Special Affordable, and Geographically-Targeted – is based on the number of dwelling units that qualify to count toward the goal as a percentage of the number of units eligible to count. Eligible units are limited to properties where the mortgages are conforming (currently, less than or equal to $300,700) and conventional and which satisfy other counting rules. The calculation (used in computing the figures in Table 1) includes mortgages that were originated either prior to or during the year of purchase by the GSE, and it is based on purchases of refinance as well as home purchase loans. Through 2000, dwelling units originated after December 31, 1992 that are missing information necessary to determine whether the unit qualifies were required to be included in the denominator and excluded from the numerator, but effective January 1, 2001, new rules have been in effect which allow some missing-data units to be excluded from the denominator or to be included in the numerator and the denominator based on estimation techniques. In establishing the goals, HUD is statutorily required to consider the ability of the GSEs to lead the industry in making mortgage credit available for families whose mortgages, if purchased by the GSEs, would be eligible to count toward each goal. HUD has developed a particular methodology to compare the percentages of goal-qualifying mortgages in the GSEs’ mortgage purchases with corresponding market percentages (see HUD October 2000 Final Rule). Tables 2 and 3 compare the racial and income characteristics of single-family-owner loans purchased by the GSEs with loans originated in the primary market. HUD calculates the various GSE percentages in Tables 2 and 3 from data submitted to HUD by the GSEs. HUD computes the corresponding market percentages in tables 2 and 3 based on mortgage origination data compiled in accordance with the Home Mortgage Disclosure Act (HMDA) from reports submitted annually by primary lenders. The following explains steps HUD took to standardize for differences between the GSE and HMDA data reporting concepts:

1. The analysis is based on numbers of mortgages for single-family (1 to 4 unit)
owner-occupied properties, even though official goal performance is based on number of units in owner properties. HMDA data do not include the number of units in the property. Mortgages for single-family investor properties are excluded from Tables 2 and 3.
2. The conventional conforming market is defined as all loans below the conforming loan limit; thus, no jumbo loans are included. (Of course, government loans—FHA-insured, VA-guaranteed, and RHS loans--are not included in the conventional conforming market totals.)
3. Only HMDA mortgages reported as “originated” are counted in the market definition; mortgages recorded as “purchased” in HMDA are not included in the market data.
4. Because HMDA coverage is less complete outside than inside of metropolitan areas, the analysis is based on mortgages for properties in metropolitan areas only.
5. As explained in HUD’s October 2000 Final Rule, HUD includes the A-minus portion of the subprime market in its estimates for the conventional conforming market (thus, market estimates are presented that exclude so-called “B&C” loans, which are presumed to be one-half of loans originated by subprime lenders that report to HMDA). The market concept used in HUD’s analysis is otherwise inclusive. For example, loans originated in metropolitan areas by lenders identified as manufactured home lenders are included.
6. The GSE ratio is based on purchases of mortgages originated in the current year or any prior year, consistent with the definition of the housing goals. In contrast, the HMDA-based market ratio is limited to mortgages originated in the current year. The effect of this is demonstrated in Table 2, which distinguishes prior-year from current-year originations in GSE purchases.
7. There is missing data in both the HMDA and GSE data. Mortgages with missing data are excluded from the numerator and denominator in both the GSE ratio and the market ratio.
Some of these tables update tables that appeared in Appendixes A and B of the Department’s October 2000 Final Rule, “HUD’s Regulation of the Federal National Mortgage Association (Fannie Mae) and the Federal Home Loan Mortgage Corporation (Freddie Mac).”1 The correspondence of table numbers is as follows:
Table 2a corresponds to Table A.4.c in Appendix A the Final Rule. Table 2b corresponds to Final Rule Table A.4a.
1 Federal Register, vol. 68, no. 211, October 31, 2000, pp. 65089-65170.

Table 3b corresponds to Final Rule Table A.1a. Table 3a corresponds to Final Rule Table A.1b.2 Table 4 corresponds to Final Rule Tables A.7a and A.7b. Table 6 corresponds to Table B.5 in Final Rule Appendix B. Tables 7a and 7b correspond to Final Rule Tables B.7 and B.8.
2 The mortgage market definitions in Tables 2 and 3 are also discussed in a paper by Harold L. Bunce entitled The GSEs’ Funding of Affordable Loans: A 1999 Update, Working Paper No. HF-012, U.S. Department of Housing and Urban Development, Office of Policy Development and Research, December 2000 (http://www.huduser.org/publications/hsgfin/workpapr.html).
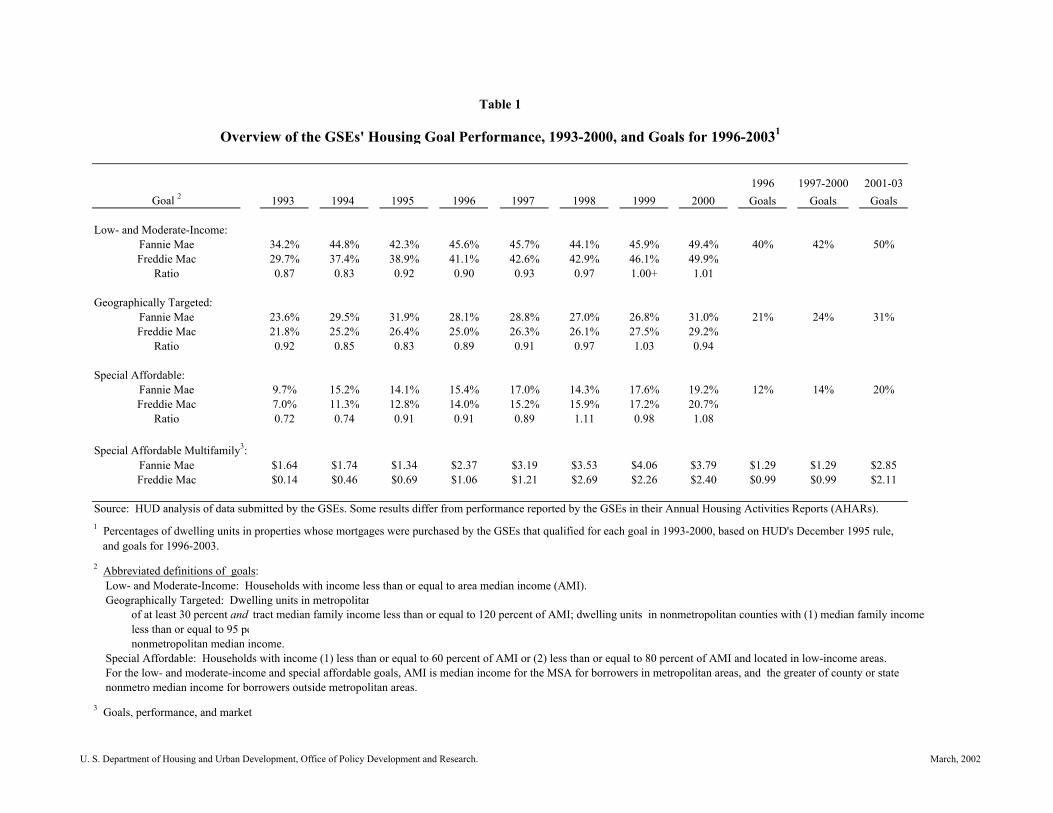
Table 1
Overview of the GSEs' Housing Goal Performance, 1993-2000, and Goals for 1996-20031
1996 1997-2000 2001-03Goal 2 1993 1994 1995 1996 1997 1998 1999 2000 Goals Goals Goals
Low- and Moderate-Income: Fannie Mae 34.2% 44.8% 42.3% 45.6% 45.7% 44.1% 45.9% 49.4% 40% 42% 50%Freddie Mac 29.7% 37.4% 38.9% 41.1% 42.6% 42.9% 46.1% 49.9%
Ratio 0.87 0.83 0.92 0.90 0.93 0.97 1.00+ 1.01
Geographically Targeted:Fannie Mae 23.6% 29.5% 31.9% 28.1% 28.8% 27.0% 26.8% 31.0% 21% 24% 31%Freddie Mac 21.8% 25.2% 26.4% 25.0% 26.3% 26.1% 27.5% 29.2%
Ratio 0.92 0.85 0.83 0.89 0.91 0.97 1.03 0.94
Special Affordable:Fannie Mae 9.7% 15.2% 14.1% 15.4% 17.0% 14.3% 17.6% 19.2% 12% 14% 20%Freddie Mac 7.0% 11.3% 12.8% 14.0% 15.2% 15.9% 17.2% 20.7%
Ratio 0.72 0.74 0.91 0.91 0.89 1.11 0.98 1.08
Special Affordable Multifamily3:Fannie Mae $1.64 $1.74 $1.34 $2.37 $3.19 $3.53 $4.06 $3.79 $1.29 $1.29 $2.85Freddie Mac $0.14 $0.46 $0.69 $1.06 $1.21 $2.69 $2.26 $2.40 $0.99 $0.99 $2.11
Source: HUD analysis of data submitted by the GSEs. Some results differ from performance reported by the GSEs in their Annual Housing Activities Reports (AHARs).1 Percentages of dwelling units in properties whose mortgages were purchased by the GSEs that qualified for each goal in 1993-2000, based on HUD's December 1995 rule, and goals for 1996-2003.
2 Abbreviated definitions of goals: Low- and Moderate-Income: Households with income less than or equal to area median income (AMI). Geographically Targeted: Dwelling units in metropolitan of at least 30 percent and tract median family income less than or equal to 120 percent of AMI; dwelling units in nonmetropolitan counties with (1) median family income less than or equal to 95 pe nonmetropolitan median income. Special Affordable: Households with income (1) less than or equal to 60 percent of AMI or (2) less than or equal to 80 percent of AMI and located in low-income areas. For the low- and moderate-income and special affordable goals, AMI is median income for the MSA for borrowers in metropolitan areas, and the greater of county or state nonmetro median income for borrowers outside metropolitan areas.
3 Goals, performance, and market
U. S. Department of Housing and Urban Development, Office of Policy Development and Research. March, 2002
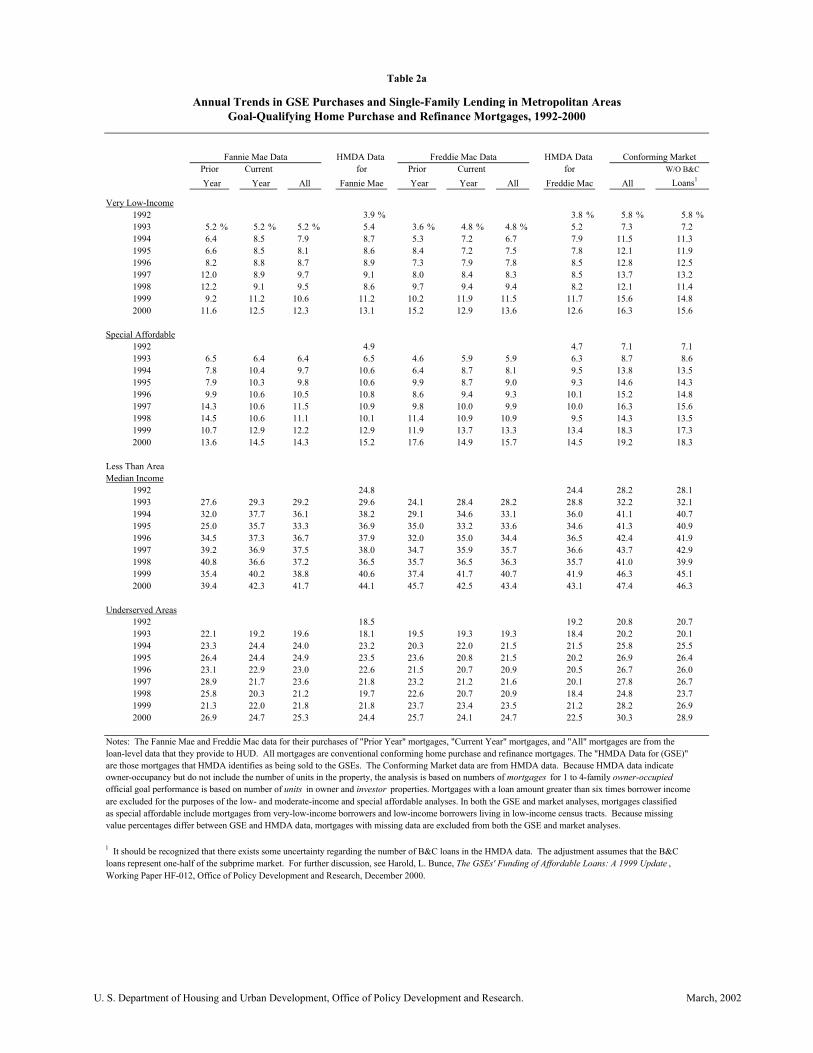
Table 2a
Annual Trends in GSE Purchases and Single-Family Lending in Metropolitan AreasGoal-Qualifying Home Purchase and Refinance Mortgages, 1992-2000
HMDA Data Freddie Mac Data Conforming MarketPrior Current for Prior Current for W/O B&C
Year Year All Fannie Mae Year Freddie Mac All Loans1
Very Low-Income1992 3.9 % 3.8 % 5.8 % 5.8 %1993 5.2 % 5.2 % 5.2 % 5.4 3.6 % 4.8 % 4.8 % 5.2 7.3 7.21994 6.4 8.5 7.9 8.7 5.3 7.2 6.7 7.9 11.5 11.31995 6.6 8.5 8.1 8.6 8.4 7.2 7.5 7.8 12.1 11.91996 8.2 8.8 8.7 8.9 7.3 7.9 7.8 8.5 12.8 12.51997 12.0 8.9 9.7 9.1 8.0 8.4 8.3 8.5 13.7 13.21998 12.2 9.1 9.5 8.6 9.7 9.4 9.4 8.2 12.1 11.41999 9.2 11.2 10.6 11.2 10.2 11.9 11.5 11.7 15.6 14.82000 11.6 12.5 12.3 13.1 15.2 12.9 13.6 12.6 16.3 15.6
Special Affordable1992 4.9 4.7 7.1 7.11993 6.5 6.4 6.4 6.5 4.6 5.9 5.9 6.3 8.7 8.61994 7.8 10.4 9.7 10.6 6.4 8.7 8.1 9.5 13.8 13.51995 7.9 10.3 9.8 10.6 9.9 8.7 9.0 9.3 14.6 14.31996 9.9 10.6 10.5 10.8 8.6 9.4 9.3 10.1 15.2 14.81997 14.3 10.6 11.5 10.9 9.8 10.0 9.9 10.0 16.3 15.61998 14.5 10.6 11.1 10.1 11.4 10.9 10.9 9.5 14.3 13.51999 10.7 12.9 12.2 12.9 11.9 13.7 13.3 13.4 18.3 17.32000 13.6 14.5 14.3 15.2 17.6 14.9 15.7 14.5 19.2 18.3
Less Than Area Median Income
1992 24.8 24.4 28.2 28.11993 27.6 29.3 29.2 29.6 24.1 28.4 28.2 28.8 32.2 32.11994 32.0 37.7 36.1 38.2 29.1 34.6 33.1 36.0 41.1 40.71995 25.0 35.7 33.3 36.9 35.0 33.2 33.6 34.6 41.3 40.91996 34.5 37.3 36.7 37.9 32.0 35.0 34.4 36.5 42.4 41.91997 39.2 36.9 37.5 38.0 34.7 35.9 35.7 36.6 43.7 42.91998 40.8 36.6 37.2 36.5 35.7 36.5 36.3 35.7 41.0 39.91999 35.4 40.2 38.8 40.6 37.4 41.7 40.7 41.9 46.3 45.12000 39.4 42.3 41.7 44.1 45.7 42.5 43.4 43.1 47.4 46.3
Underserved Areas1992 18.5 19.2 20.8 20.71993 22.1 19.2 19.6 18.1 19.5 19.3 19.3 18.4 20.2 20.11994 23.3 24.4 24.0 23.2 20.3 22.0 21.5 21.5 25.8 25.51995 26.4 24.4 24.9 23.5 23.6 20.8 21.5 20.2 26.9 26.41996 23.1 22.9 23.0 22.6 21.5 20.7 20.9 20.5 26.7 26.01997 28.9 21.7 23.6 21.8 23.2 21.2 21.6 20.1 27.8 26.71998 25.8 20.3 21.2 19.7 22.6 20.7 20.9 18.4 24.8 23.71999 21.3 22.0 21.8 21.8 23.7 23.4 23.5 21.2 28.2 26.92000 26.9 24.7 25.3 24.4 25.7 24.1 24.7 22.5 30.3 28.9
Notes: The Fannie Mae and Freddie Mac data for their purchases of "Prior Year" mortgages, "Current Year" mortgages, and "All" mortgages are from the loan-level data that they provide to HUD. All mortgages are conventional conforming home purchase and refinance mortgages. The "HMDA Data for (GSE)" are those mortgages that HMDA identifies as being sold to the GSEs. The Conforming Market data are from HMDA data. Because HMDA data indicateowner-occupancy but do not include the number of units in the property, the analysis is based on numbers of mortgages for 1 to 4-family owner-occupied official goal performance is based on number of units in owner and investor properties. Mortgages with a loan amount greater than six times borrower income are excluded for the purposes of the low- and moderate-income and special affordable analyses. In both the GSE and market analyses, mortgages classified as special affordable include mortgages from very-low-income borrowers and low-income borrowers living in low-income census tracts. Because missing value percentages differ between GSE and HMDA data, mortgages with missing data are excluded from both the GSE and market analyses.
1 It should be recognized that there exists some uncertainty regarding the number of B&C loans in the HMDA data. The adjustment assumes that the B&C loans represent one-half of the subprime market. For further discussion, see Harold, L. Bunce, The GSEs' Funding of Affordable Loans: A 1999 Update , Working Paper HF-012, Office of Policy Development and Research, December 2000.
Fannie Mae Data
Year All
HMDA Data
U. S. Department of Housing and Urban Development, Office of Policy Development and Research. March, 2002
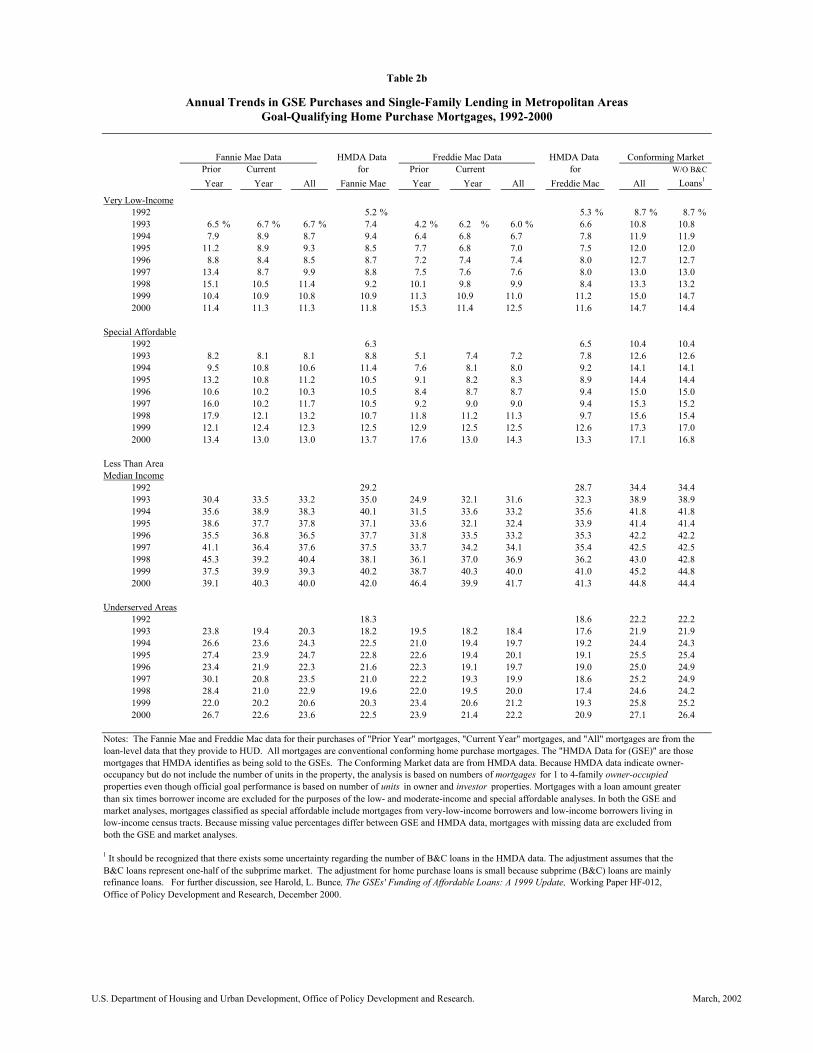
Table 2b
Annual Trends in GSE Purchases and Single-Family Lending in Metropolitan AreasGoal-Qualifying Home Purchase Mortgages, 1992-2000
Fannie Mae Data HMDA Data Freddie Mac Data HMDA Data Conforming MarketPrior Current for Prior for W/O B&C
Year Year All Fannie Mae Year All Freddie Mac All Loans1
Very Low-Income1992 5.2 % 5.3 % 8.7 % 8.7 %1993 6.5 % 6.7 % 6.7 % 7.4 4.2 % 6.2 % 6.0 % 6.6 10.8 10.81994 7.9 8.9 8.7 9.4 6.4 6.8 6.7 7.8 11.9 11.91995 11.2 8.9 9.3 8.5 7.7 6.8 7.0 7.5 12.0 12.01996 8.8 8.4 8.5 8.7 7.2 7.4 7.4 8.0 12.7 12.71997 13.4 8.7 9.9 8.8 7.5 7.6 7.6 8.0 13.0 13.01998 15.1 10.5 11.4 9.2 10.1 9.8 9.9 8.4 13.3 13.21999 10.4 10.9 10.8 10.9 11.3 10.9 11.0 11.2 15.0 14.72000 11.4 11.3 11.3 11.8 15.3 11.4 12.5 11.6 14.7 14.4
Special Affordable1992 6.3 6.5 10.4 10.41993 8.2 8.1 8.1 8.8 5.1 7.4 7.2 7.8 12.6 12.61994 9.5 10.8 10.6 11.4 7.6 8.1 8.0 9.2 14.1 14.11995 13.2 10.8 11.2 10.5 9.1 8.2 8.3 8.9 14.4 14.41996 10.6 10.2 10.3 10.5 8.4 8.7 8.7 9.4 15.0 15.01997 16.0 10.2 11.7 10.5 9.2 9.0 9.0 9.4 15.3 15.21998 17.9 12.1 13.2 10.7 11.8 11.2 11.3 9.7 15.6 15.41999 12.1 12.4 12.3 12.5 12.9 12.5 12.5 12.6 17.3 17.02000 13.4 13.0 13.0 13.7 17.6 13.0 14.3 13.3 17.1 16.8
Less Than AreaMedian Income
1992 29.2 28.7 34.4 34.41993 30.4 33.5 33.2 35.0 24.9 32.1 31.6 32.3 38.9 38.91994 35.6 38.9 38.3 40.1 31.5 33.6 33.2 35.6 41.8 41.81995 38.6 37.7 37.8 37.1 33.6 32.1 32.4 33.9 41.4 41.41996 35.5 36.8 36.5 37.7 31.8 33.5 33.2 35.3 42.2 42.21997 41.1 36.4 37.6 37.5 33.7 34.2 34.1 35.4 42.5 42.51998 45.3 39.2 40.4 38.1 36.1 37.0 36.9 36.2 43.0 42.81999 37.5 39.9 39.3 40.2 38.7 40.3 40.0 41.0 45.2 44.82000 39.1 40.3 40.0 42.0 46.4 39.9 41.7 41.3 44.8 44.4
Underserved Areas1992 18.3 18.6 22.2 22.21993 23.8 19.4 20.3 18.2 19.5 18.2 18.4 17.6 21.9 21.91994 26.6 23.6 24.3 22.5 21.0 19.4 19.7 19.2 24.4 24.31995 27.4 23.9 24.7 22.8 22.6 19.4 20.1 19.1 25.5 25.41996 23.4 21.9 22.3 21.6 22.3 19.1 19.7 19.0 25.0 24.91997 30.1 20.8 23.5 21.0 22.2 19.3 19.9 18.6 25.2 24.91998 28.4 21.0 22.9 19.6 22.0 19.5 20.0 17.4 24.6 24.21999 22.0 20.2 20.6 20.3 23.4 20.6 21.2 19.3 25.8 25.22000 26.7 22.6 23.6 22.5 23.9 21.4 22.2 20.9 27.1 26.4
Notes: The Fannie Mae and Freddie Mac data for their purchases of "Prior Year" mortgages, "Current Year" mortgages, and "All" mortgages are from the loan-level data that they provide to HUD. All mortgages are conventional conforming home purchase mortgages. The "HMDA Data for (GSE)" are those mortgages that HMDA identifies as being sold to the GSEs. The Conforming Market data are from HMDA data. Because HMDA data indicate owner-occupancy but do not include the number of units in the property, the analysis is based on numbers of mortgages for 1 to 4-family owner-occupied properties even though official goal performance is based on number of units in owner and investor properties. Mortgages with a loan amount greater than six times borrower income are excluded for the purposes of the low- and moderate-income and special affordable analyses. In both the GSE and market analyses, mortgages classified as special affordable include mortgages from very-low-income borrowers and low-income borrowers living in low-income census tracts. Because missing value percentages differ between GSE and HMDA data, mortgages with missing data are excluded from both the GSE and market analyses.
1 It should be recognized that there exists some uncertainty regarding the number of B&C loans in the HMDA data. The adjustment assumes that the B&C loans represent one-half of the subprime market. The adjustment for home purchase loans is small because subprime (B&C) loans are mainly refinance loans. For further discussion, see Harold, L. Bunce, The GSEs' Funding of Affordable Loans: A 1999 Update, Working Paper HF-012, Office of Policy Development and Research, December 2000.
Current Year
U.S. Department of Housing and Urban Development, Office of Policy Development and Research. March, 2002

Table 3a
Affordable Lending Shares for Major Sectors of the Mortgage Market in Metropolitan Areas Home Purchase and Refinance Mortgages, 1997-2000
Conventional Conforming Market Conforming Market
Borrower Characteristics Total Market FHA Freddie Mac Fannie Mae Both GSEsLow-Income:
1997 31.1 % 47.1 %1 20.5 % 22.3 % 21.6 % 26.0 % 28.0 % 28.1 % 27.4 %1998 28.0 48.2 21.6 22.2 21.9 24.0 26.2 25.7 24.81999 33.2 49.0 25.2 23.9 24.4 29.3 28.1 30.9 29.82000 34.4 48.6 28.6 26.4 27.4 31.4 29.0 32.1 31.0
African American:1997 8.0 14.2 3.2 4.1 3.7 4.8 4.8 6.3 5.61998 6.5 13.7 3.0 3.1 3.0 3.9 4.4 5.0 4.31999 8.0 14.8 3.7 3.4 3.5 5.4 5.1 6.5 5.72000 8.9 15.6 4.7 4.4 4.5 6.6 5.8 7.4 6.5
Hispanic:1997 7.4 17.8 4.8 5.7 5.3 4.7 4.6 5.4 5.31998 6.7 17.2 4.4 4.8 4.6 4.4 4.5 5.2 5.01999 8.6 18.7 5.6 5.6 5.6 6.1 6.1 6.8 6.72000 10.2 20.4 6.7 7.9 7.4 7.6 7.2 8.3 8.1
Minority: 1997 20.1 35.6 13.1 16.2 14.9 14.4 13.4 16.7 16.01998 18.0 34.8 12.2 13.8 13.1 13.2 13.1 15.3 14.51999 21.8 37.3 15.1 16.3 15.8 16.9 16.1 19.0 18.02000 24.7 40.0 17.3 19.4 18.4 20.2 18.6 21.7 20.6
Neighborhood CharacteristicsLow-Income Tract:
1997 13.6 % 18.9 % 8.6 % 9.5 % 9.1 % 10.9 % 11.9 % 12.7 % 11.9 %1998 11.5 17.4 8.1 8.2 8.1 9.5 10.9 10.7 10.01999 13.4 17.9 9.2 8.5 8.8 11.8 12.0 12.8 11.92000 14.7 19.2 10.4 10.5 10.5 13.5 13.1 14.0 13.1
High-Minority Tract:1997 17.8 27.5 11.8 14.9 13.7 13.0 12.2 15.9 14.91998 16.2 27.2 11.5 12.9 12.3 12.2 12.2 14.5 13.61999 18.3 26.6 14.2 13.6 13.8 15.0 13.8 17.0 15.92000 19.5 26.8 14.3 15.8 15.1 17.0 15.4 18.3 17.2
High African-American Tract:1997 7.1 9.7 3.5 4.5 4.1 4.9 5.1 6.6 5.91998 5.8 9.1 3.6 3.3 3.4 4.2 4.7 5.3 4.61999 6.9 9.3 4.0 3.5 3.7 5.6 5.1 6.6 5.72000 7.5 9.6 4.9 4.3 4.6 6.6 5.6 7.2 6.3
Underserved Areas:1997 30.0 41.1 21.5 23.6 22.8 25.0 26.5 27.8 26.71998 26.8 39.9 20.9 21.2 21.1 22.6 25.0 24.8 23.71999 30.0 40.4 23.5 21.8 22.5 26.4 26.6 28.2 26.92000 32.0 42.2 24.7 25.3 25.0 29.2 28.5 30.3 28.9
Notes: The FHA, depositories, and market percentages are derived from 1997-2000 HMDA data. The GSE percentages are derived from the loan-level data that Fannie Mae and Freddie Mac provide to HUD. The GSE data include conventional loans purchased during 1997, 1998, 1999, and 2000; thus, these data include their purchases of seasoned loans (i.e., mortgages originated prior to 1997 or 1998 or 1999 or 2000) as well as their purchases of mortgages originated during 1997, 1998, 1999, and 2000. The "Total Market" combines the government sector (FHA and VA loans) and the conventional conforming market. Thus, it includes all loans except "jumbo" loans above the conforming loan limit which was $252,700 in 2000. "Total Depositories" data are loans originated by HMDA reporters regulated by FDIC, OTS, OCC, FRB, and The National Credit Union Administration; they consist mainly of banks, thrifts, and their subsidieries. The "Portfolio Depositories" data refer to new originations that are not sold by banks and thrift institutions during 1997-2000 and thus are retained in depository portfolios. Because HMDA data indicate owner-occupancy but do not include the number of units in the property, the analysis is based on numbers of mortgages for 1 to 4-family owner-occupied properties even though official goal performance is based on number of units in owner and investor properties. Mortgages with a loan amount greater than six times borrower income are excluded for the purposes of the low- and moderate-income and special affordable analyses. Because missing value percentages differ between GSE and HMDA data, mortgages with missing data are excluded from both the GSE and market analyses.
1 Each percentage represents the share of a sector's portfolio accounted for by the borrower or neighborhood characteristic. For example, 47.1 percent of FHA-insured home loans were loans for low-income borrowers. It should be noted that due to FHA's streamline refinance program, borrower income data were not available for almost 70 percent of FHA's refinance loans.
2 HMDA-based market shares have been adjusted to exclude the B&C portion of the subprime market. It should be recognized that there exists some uncertainty regarding the number of B&C loans in the HMDA data. The adjustment assumes that the B&C loans represent one-half of the subprime market; for further discussion, see Harold, L. Bunce, The GSEs' Funding of Affordable Loans: A 1999 Update , Working Paper HF-012, Office of Policy Development and Research, December 2000.
Total W/O B&C 2Depositories
Total Portfolio
U.S. Department of Housing and Urban Development, Office of Policy Development and Research. March, 2002

Table 3b
Affordable Lending Shares for Major Sectors of the Mortgage Market in Metropolitan AreasHome Purchase Mortgages, 1997-2000
Conventional Conforming Market Conforming Market
Borrower Characteristics Total Market FHA Freddie Mac Fannie Mae Both GSEsLow-Income:
1997 32.1 % 47.6 %1 19.2 % 22.6 % 21.2 % 26.0 % 29.2 % 27.3 % 27.3 %1998 32.3 49.1 22.3 25.0 23.9 26.4 29.1 27.8 27.61999 34.4 49.5 24.5 24.3 24.4 29.2 28.5 30.1 29.82000 33.8 48.7 27.1 24.9 25.9 29.7 28.7 29.8 29.4
African American:1997 7.8 14.4 3.2 4.5 4.0 4.4 4.7 5.1 4.91998 7.4 14.2 3.2 3.8 3.6 4.1 4.8 4.9 4.61999 7.9 14.6 3.5 3.4 3.4 4.7 4.7 5.4 5.02000 8.3 15.5 4.3 4.1 4.2 5.4 5.0 5.9 5.4
Hispanic:1997 8.7 17.8 5.1 6.3 5.8 5.2 5.1 5.9 5.81998 8.6 18.6 4.7 6.0 5.5 5.3 5.5 6.1 5.91999 9.7 19.3 5.5 6.0 5.8 6.5 6.6 7.1 6.92000 10.9 20.7 6.6 8.0 7.3 7.9 7.7 8.3 8.1
Minority: 1997 21.4 35.8 14.0 17.7 16.2 15.3 14.6 16.5 16.31998 21.0 36.5 13.1 16.3 15.0 15.0 15.2 16.6 16.11999 23.4 37.7 14.9 17.3 16.3 17.7 17.3 19.0 18.42000 25.4 40.2 17.4 20.1 18.9 20.4 19.6 21.2 20.4
Neighborhood CharacteristicsLow-Income Tract:
1997 12.8 % 19.1 % 7.9 % 9.5 % 8.9 % 10.2 % 12.0 % 10.9 10.8 %1998 12.3 18.7 7.9 9.4 8.8 9.8 12.1 10.7 10.41999 12.7 18.2 8.4 8.1 8.2 10.8 11.6 11.3 10.92000 13.4 19.2 9.1 9.6 9.4 11.9 12.4 12.0 11.5
High-Minority Tract:1997 17.3 27.1 11.4 15.3 13.8 12.5 12.2 14.1 13.91998 16.9 27.0 10.8 14.0 12.7 12.2 12.6 14.1 13.61999 17.5 26.0 12.3 12.7 12.5 13.9 13.5 15.1 14.62000 18.5 26.5 12.7 15.1 14.1 15.7 14.9 16.4 15.8
High African-American Tract:1997 5.8 9.6 3.0 4.8 4.1 4.1 4.7 4.6 4.51998 5.5 9.2 3.2 3.8 3.6 3.9 4.7 4.5 4.31999 5.7 8.9 3.4 3.0 3.2 4.3 4.4 4.8 4.42000 6.0 9.4 3.8 3.6 3.7 5.0 4.8 5.1 4.8
Underserved Areas:1997 29.1 41.3 19.9 23.5 22.1 23.6 26.3 25.2 24.91998 28.2 41.2 20.0 22.9 21.7 22.7 26.1 24.6 24.21999 29.1 40.5 21.2 20.6 20.9 24.6 25.6 25.8 25.22000 30.3 42.1 22.2 23.6 23.0 26.7 27.1 27.1 26.4
Notes: All the data are for home purchase mortgages. The FHA, depositories, and market percentages are derived from 1997, 1998, 1999 and 2000 HMDA data. The GSE percentages are derived from the loan-level data that Fannie Mae and Freddie Mac provide to HUD. The GSE data include conventional home loans purchased during 1997, 1998, 1999 and 2000; thus, these data include their purchases of seasoned loans (i.e., mortgages originated prior to 1997 or 1998 or 1999 or 2000) as well as their purchases of mortgages originated during 1997, 1998,1999 and 2000. The "Total Market" combines the government sector (FHA and VA loans) and the conventional conforming market. Thus, it includes all loans except "jumbo" loans above the conforming loan limit which was $252,700 in 2000. "Total Depositories" data are loans originated by HMDA reporters regulated by FDIC, OTS, OCC, FRB, and The National Credit Union Administration; they consist mainly of banks, thrifts, and their subsidieries. The "Portfolio Depositories" data refer to new originations that are not sold by banks and thrift institutions during 1997-2000 and thus are retained in depository portfolios. Because HMDA data indicate owner-occupancy but do not include the number of units in the property, the analysis is based on numbers of mortgages for 1 to 4-family owner-occupied properties even though official goal performance is based on number of units in owner and investor properties. Mortgages with a loan amount greater than six times borrower income are excluded for the purposes of the low- and moderate-income and special affordable analyses. Because missing value percentages differ between GSE and HMDA data, mortgages with missing data are excluded from both the GSE and market analyses.
1 Each percentage represents the share of a sector's portfolio accounted for by the borrower or neighborhood characteristic. For example, 47.5 percent of FHA-insured home loans were loans for low-income borrowers.
2 HMDA-based market shares have been adjusted to exclude the B&C portion of the subprime market. It should be recognized that there exists some uncertainty regarding the number of B&C loans in the HMDA data. The adjustment assumes that the B&C loans represent one-half of the subprime market. The adjustment for home purchase loans is samll because subprime (B&C) loans are mainly refinance loans. For further discussion, see Harold, L. Bunce, The GSEs' Funding of Affordable Loans: A 1999 Update, Working Paper HF-012, Office of Policy Development and Research, December 2000.
DepositoriesTotal Portfolio Total W/O B&C 2
U. S. Department of Housing and Urban Development, Office of Policy Development and Research. March, 2002

Table 4-1999
Number of Units Financed by Fannie Mae and Freddie Mac Mortgage Purchases Originated During 1999
Single-Family Single-Family Small LargeOwner Rental Multifamily Multifamily Total
Total UnitsFannie Mae 2,032,971 171,469 8,586 235,161 2,448,187Freddie Mac 1,728,075 123,223 4,188 187,985 2,043,471
Low-Mod UnitsFannie Mae 776,489 127,794 7,403 223,553 1,135,239Freddie Mac 684,361 105,862 3,352 170,811 964,386
Underserved Area UnitsFannie Mae 483,490 82,415 4,637 94,888 665,430Freddie Mac 434,537 58,641 2,113 65,073 560,364
Special Affordable UnitsFannie Mae 243,662 67,253 4,656 137,433 453,004Freddie Mac 229,296 56,752 1,646 85,658 373,352
Source: Loan-level data that the GSEs provide to HUD, covering financed units from conventional mortgages originated during 1999 and purchased by one of the GSEs during 1999-2000. Data are adjusted for participation percent and REMIC weight.
U.S. Department of Housing and Urban Development, Office of Policy Development and Research. March, 2002

Table 4-1998
Number of Units Financed by Fannie Mae and Freddie Mac Mortgage Purchases Originated During 1998
Single-Family Single-Family Small LargeOwner Rental Multifamily Multifamily Total
Total UnitsFannie Mae 3,188,333 189,902 11,395 270,968 3,660,598Freddie Mac 2,515,100 117,995 8,561 204,920 2,846,576
Low-Mod UnitsFannie Mae 1,115,416 145,449 9,216 250,218 1,520,299Freddie Mac 882,728 102,706 7,801 195,109 1,188,344
Underserved Area UnitsFannie Mae 704,802 86,367 5,075 109,610 905,854Freddie Mac 581,500 53,627 4,851 85,456 725,434
Special Affordable UnitsFannie Mae 318,283 72,485 4,191 132,680 527,639Freddie Mac 264,835 55,224 4,616 108,307 432,982
Source: Loan-level data that the GSEs provide to HUD, covering financed units from conventional mortgages originated during 1998 and purchased by one of the GSEs during 1998-1999. Data are adjusted for participation percent and REMIC weight.
U. S. Department of Housing and Urban Development, Office of Policy Development and Research. March, 2002

Table 5a-2000
Fannie Mae's Single-Family Owner-Occupied 1-Unit Mortgage Purchases by Housing Goal and Mortgagor's Income, 2000
(In Units)
Type of Mortgage
Goals*
(1) Low- and Moderate-Income 423,319 206,915 630,23467.2 % 32.8 % 100.0 %
(2) Special Affordable (Total) 129,539 68,335 197,87465.5 % 34.5 % 100.0 %
Low-Income Families (But Not Very Low-Income) 15,139 9,324 24,463 In Low-Income Areas 61.9 % 38.1 % 100.0 %
Very Low-Income Families 18,921 12,734 31,655 In Low-Income Areas 59.8 % 40.2 % 100.0 %
Very Low-Income Families 95,479 46,277 141,756 Not In Low-Income Areas 67.4 % 32.6 % 100.0 %
(3) Underserved Areas 270,158 158,212 428,37063.1 % 36.9 % 100.0 %
Served Areas 851,271 355,622 1,206,89370.5 % 29.5 % 100.0 %
(4) All Mortgages 1,204,792 525,228 1,730,02069.6 % 30.4 % 100.0 %
Mortgagor's Income***
Income No More Than 71,026 37,852 108,87850% of Area Median Income 5.9 % 7.2 % 6.3 %
Income More Than 50% But No 57,577 28,438 86,015More Than 60% of Area Median Income 4.8 % 5.4 % 5.0 %
Income More Than 60% But No 148,758 70,027 218,785More Than 80% of Area Median Income 12.3 % 13.3 % 12.6 %
Income More Than 80% But No 164,556 72,356 236,912More Than 100% of Area Median Income 13.7 % 13.8 % 13.7 %
Income More Than 100% But No 155,894 65,814 221,708More Than 120% of Area Median Income 12.9 % 12.5 % 12.8 %
Income More Than 120% of 511,488 197,677 709,165Area Median Income 42.5 % 37.6 % 41.0 %
Missing 95,493 53,064 148,5577.9 % 10.1 % 8.6 %
Total 1,204,792 525,228 1,730,020100.0 % 100.0 % 100.0 %
Data are adjusted for participation percent and REMIC weight.* Units may count toward more than one category.** Includes missing and not applicable*** Percentages are by column.
AllPurchaseRefinance,
Second and Other**
������������������������������������������������������������������������������������������������������
U.S. Department of Housing and Urban Development, Office of Policy Development and Research. March, 2002

Table 5b-2000
Freddie Mac's Single-Family Owner-Occupied 1-Unit Mortgage Purchases by Housing Goal and Mortgagor's Income, 2000
(In Units)
Type of Mortgage
Goals*
(1) Low- and Moderate-Income 345,245 187,405 532,65064.8 % 35.2% % 100.0 %
(2) Special Affordable (Total) 117,639 72,490 190,12961.9 % 38.1% % 100.0 %
Low-Income Families (But Not Very Low-Income) 14,233 9,937 24,170 In Low-Income Areas 58.9 % 41.1% % 100.0 %
Very Low-Income Families 18,710 15,321 34,031 In Low-Income Areas 55.0 % 45.0% % 100.0 %
Very Low-Income Families 84,696 47,231 131,927 Not In Low-Income Areas 64.2 % 35.8% % 100.0 %
(3) Underserved Areas 198,218 140,232 338,45058.6 % 41.4% % 100.0 %
Served Areas 660,988 300,180 961,16868.8 % 31.2% % 100.0 %
(4) All Mortgages 923,095 451,800 1,374,89567.1 % 32.9% % 100.0 %
Mortgagor's Income***
Income No More Than 55,631 36,443 92,07450% of Area Median Income 6.0 % 8.1 % 6.7 %
Income More Than 50% But No 49,065 26,427 75,492More Than 60% of Area Median Income 5.3 % 5.8 % 5.5 %
Income More Than 60% But No 123,482 62,445 185,927More Than 80% of Area Median Income 13.4 % 13.8 % 13.5 %
Income More Than 80% But No 124,817 63,195 188,012More Than 100% of Area Median Income 13.5 % 14.0 % 13.7 %
Income More Than 100% But No 116,290 55,804 172,094More Than 120% of Area Median Income 12.6 % 12.4 % 12.5 %
Income More Than 120% of 391,799 169,772 561,571Area Median Income 42.4 % 37.6 % 40.8 %
Missing 62,010 37,714 99,7246.7 % 8.3 % 7.3 %
Total 923,095 451,800 1,374,895100.0 % 100.0 % 100.0 %
Data are adjusted for participation percent and REMIC weight.* Units may count toward more than one category.** Includes missing and not applicable*** Percentages are by column.
AllPurchaseRefinance,
Second and Other**
����������������������������������������������������������������������������������������������������������
U.S. Department of Housing and Urban Development, Office of Policy Development and Research. March, 2002

Table 5a-1999
Fannie Mae's Single-Family Owner-Occupied 1-Unit Mortgage Purchases by Housing Goal and Mortgagor's Income, 1999
(In Units)
Type of Mortgage
Goals*
(1) Low- and Moderate-Income 415,740 494,778 910,51845.7 % 54.3 % 100.0 %
(2) Special Affordable (Total) 128,929 147,110 276,03946.7 % 53.3 % 100.0 %
Low-Income Families (But Not Very Low-Income) 14,315 19,525 33,840 In Low-Income Areas 42.3 % 57.7 % 100.0 %
Very Low-Income Families 17,717 21,932 39,649 In Low-Income Areas 44.7 % 55.3 % 100.0 %
Very Low-Income Families 96,896 105,653 202,549 Not In Low-Income Areas 47.8 % 52.2 % 100.0 %
(3) Underserved Areas 233,938 328,386 562,32441.6 % 58.4 % 100.0 %
Served Areas 841,274 1,019,605 1,860,87945.2 % 54.8 % 100.0 %
(4) All Mortgages 1,181,159 1,385,381 2,566,54046.0 % 54.0 % 100.0 %
Mortgagor's Income***
Income No More Than 70,803 72,914 143,71750% of Area Median Income 6.0 % 5.3 % 5.6 %
Income More Than 50% But No 58,321 62,907 121,228More Than 60% of Area Median Income 4.9 % 4.5 % 4.7 %
Income More Than 60% But No 152,695 170,849 323,544More Than 80% of Area Median Income 12.9 % 12.3 % 12.6 %
Income More Than 80% But No 169,681 195,780 365,461More Than 100% of Area Median Income 14.4 % 14.1 % 14.2 %
Income More Than 100% But No 163,757 191,036 354,793More Than 120% of Area Median Income 13.9 % 13.8 % 13.8 %
Income More Than 120% of 515,523 645,091 1,160,614Area Median Income 43.6 % 46.6 % 45.2 %
Missing 50,379 46,804 97,1834.3 % 3.4 % 3.8 %
Total 1,181,159 1,385,381 2,566,540100.0 % 100.0 % 100.0 %
Data are adjusted for participation percent and REMIC weight.* Units may count toward more than one category.** Includes missing and not applicable*** Percentages are by column.
Second and Other**Refinance,
AllPurchase
���������������������������������������������������������������������������������������������������������
U. S. Department of Housing and Urban Development, Office of Policy Development and Research. March, 2002

Table 5b-1999
Freddie Mac's Single-Family Owner-Occupied 1-Unit Mortgage Purchases by Housing Goal and Mortgagor's Income, 1999
(In Units)
Type of Mortgage
Goals*
(1) Low- and Moderate-Income 295,289 425,241 720,53041.0 % 59.0 % 100.0 %
(2) Special Affordable (Total) 93,397 138,590 231,98740.3 % 59.7 % 100.0 %
Low-Income Families (But Not Very Low-Income) 11,107 18,490 29,597 In Low-Income Areas 37.5 % 62.5 % 100.0 %
Very Low-Income Families 13,069 22,692 35,761 In Low-Income Areas 36.5 % 63.5 % 100.0 %
Very Low-Income Families 69,221 97,409 166,630 Not In Low-Income Areas 41.5 % 58.5 % 100.0 %
(3) Underserved Areas 177,568 293,640 471,20837.7 % 62.3 % 100.0 %
Served Areas 609,297 808,473 1,417,77043.0 % 57.0 % 100.0 %
(4) All Mortgages 848,612 1,121,071 1,969,68343.1 % 56.9 % 100.0 %
Mortgagor's Income***
Income No More Than 44,074 65,826 109,90050% of Area Median Income 5.2 % 5.9 % 5.6 %
Income More Than 50% But No 39,591 54,887 94,478More Than 60% of Area Median Income 4.7 % 4.9 % 4.8 %
Income More Than 60% But No 103,298 143,899 247,197More Than 80% of Area Median Income 12.2 % 12.8 % 12.6 %
Income More Than 80% But No 117,535 162,818 280,353More Than 100% of Area Median Income 13.9 % 14.5 % 14.2 %
Income More Than 100% But No 110,201 150,977 261,178More Than 120% of Area Median Income 13.0 % 13.5 % 13.3 %
Income More Than 120% of 355,836 491,860 847,696Area Median Income 41.9 % 43.9 % 43.0 %
Missing 78,077 50,804 128,8819.2 % 4.5 % 6.5 %
Total 848,612 1,121,071 1,969,683100.0 % 100.0 % 100.0 %
Data are adjusted for participation percent and REMIC weight.* Units may count toward more than one category.** Includes missing and not applicable*** Percentages are by column.
AllSecond and Other**Refinance,
Purchase
���������������������������������������������������������������������������������������������������
U. S. Department of Housing and Urban Development, Office of Policy Development and Research. March, 2002

Table 6
Fannie Mae and Freddie Mac Acquisitions ofSingle-Family and Multifamily Units in Underserved
Metropolitan and Non-metropolitan Areas in 1998, 1999, and 2000
Fannie Mae Freddie Mac
Metropolitan Number of Underserved Units 799,426 670,901 595,595 548,510 505,716 392,230 Percent of Total Units 25.5 % 25.4 % 30.1 % 24.2 % 26.2 % 27.9 %
Total 3,132,066 2,637,508 1,975,505 2,265,333 1,930,976 1,404,797
Non-metropolitan Number of Underserved Units 158,806 120,693 85,170 145,237 112,669 74,628 Percent of Total Units 38.6 % 38.1 % 39.0 % 36.9 % 37.7 % 39.0 %
Total 410,911 316,855 218,434 393,120 298,964 191,406
Overall Number of Underserved Units 958,232 791,594 680,765 693,747 618,385 466,858 Percent of Total Units 27.0 % 26.8 % 31.0 % 26.1 % 27.5 % 29.2 %
Total Eligible* 3,546,302 2,956,155 2,195,321 2,658,556 2,245,087 1,600,684
* Overall totals may exceed the metro/nonmetro sum due to units in unidentified census tracts.
2000199919981998 1999 2000
U. S. Department of Housing and Urban Development, Office of Policy Development and Research. March, 2002

Table 7a-2000
Loan and Borrower Characteristics of Single-FamilyMortgages Purchased by the GSEs in Metropolitan Areas, 2000
Fannie Mae Freddie Mac TotalLoan and Borrower
Characteristics
Number of Loans 376,125 1,130,804 286,196 882,093 662,321 2,012,897
Loan Purpose Home Purchase 66.7% 72.3% 62.5% 70.8% 64.9% 71.6% All Other 33.3% 27.7% 37.5% 29.2% 35.1% 28.4%
Prior/Current Year Origination Prior Year 30.0% 26.9% 37.2% 34.0% 33.1% 30.0% Current Year 70.0% 73.1% 62.8% 66.0% 66.9% 70.0%
Loan-to-Value Ratio 60% or Less 14.4% 17.7% 14.2% 18.2% 14.4% 17.9% 61-80% 50.1% 51.7% 46.6% 50.1% 48.6% 51.0% 81-90% 16.0% 14.5% 15.9% 14.2% 16.0% 14.4% 91-95% 14.3% 13.2% 15.9% 14.1% 15.0% 13.6% Over 95% 5.0% 2.9% 7.3% 3.4% 6.0% 3.1%
Income of Borrower(s) 60% of Area Median or Below 20.4% 10.1% 23.5% 10.4% 21.8% 10.3% 61-100% of Median 34.4% 27.6% 35.8% 27.9% 35.0% 27.7% Over 100% of Median 45.1% 62.3% 40.7% 61.7% 43.2% 62.0%
Below Area Median 54.9% 37.7% 59.3% 38.3% 56.8% 38.0%
First-Time Home Buyer 18.9% 16.8% 17.4% 16.0% 18.3% 16.4%
Race/National Origin of Borrower American Indian or Alaskan Native 0.4% 0.4% 0.5% 0.4% 0.4% 0.4% Asian or Pacific Islander 6.7% 4.1% 5.3% 3.7% 6.1% 3.9% African American 9.1% 2.9% 9.9% 3.0% 9.5% 2.9% Hispanic 17.0% 4.5% 14.5% 4.0% 15.9% 4.3% White 64.9% 86.2% 68.3% 87.5% 66.4% 86.8% Other 1.9% 1.9% 1.5% 1.4% 1.7% 1.6%
Age of Borrower Under 30 15.6% 14.3% 17.2% 15.1% 16.2% 14.6% 30-39 30.6% 33.3% 31.3% 34.2% 30.9% 33.7% 40 and Over 53.7% 52.4% 51.5% 50.7% 52.9% 51.7%
Gender of Borrower(s) All Male 27.3% 22.2% 27.2% 21.6% 27.3% 21.9% All Female 24.7% 19.6% 24.2% 18.9% 24.5% 19.3% Male and Female 47.9% 58.2% 48.6% 59.6% 48.2% 58.8%
Source: GSE loan-level data on mortgages on owner-occupied one-unit properties. Percentages are relative to numbers of mortgages in the top row. Missing data are excluded. The data are adjusted for participation percent and REMIC weight.
Underserved ServedUnderserved Served Underserved Served
U. S. Department of Housing and Urban Development, Office of Policy Development and Research. March, 2002

Table 7b-2000
Loan and Borrower Characteristics of Single-FamilyMortgages Purchased by the GSEs in Non-Metropolitan Areas, 2000
Fannie Mae Freddie Mac TotalLoan and Borrower
Characteristics
Number of Loans 88,191 130,699 80,425 118,697 168,616 249,396
Loan Purpose Home Purchase 57.5% 63.7% 53.5% 60.1% 55.6% 62.0% All Other 42.5% 36.3% 46.5% 39.9% 44.4% 38.0%
Prior/Current Year Origination Prior Year 22.6% 24.9% 32.8% 29.3% 27.5% 27.0% Current Year 77.4% 75.1% 67.2% 70.7% 72.5% 73.0%
Loan-to-Value Ratio 60% or Less 16.1% 17.6% 17.3% 18.3% 16.7% 18.0% 61-80% 50.4% 50.7% 50.5% 50.8% 50.5% 50.8% 81-90% 15.9% 14.9% 15.9% 14.5% 15.9% 14.7% 91-95% 14.1% 13.3% 13.0% 13.1% 13.6% 13.2% Over 95% 3.4% 3.5% 3.3% 3.4% 3.4% 3.4%
Income of Borrower(s) 60% of Area Median or Below 9.5% 10.9% 10.4% 11.0% 9.9% 11.0% 61-100% of Median 23.7% 27.4% 25.4% 27.9% 24.5% 27.6% Over 100% of Median 66.8% 61.6% 64.2% 61.1% 65.6% 61.4%
Below Area Median 33.2% 38.4% 35.8% 38.9% 34.4% 38.6%
First-Time Home Buyer 12.1% 13.4% 10.0% 12.5% 11.1% 13.0%
Race/National Origin of Borrower American Indian or Alaskan Native 0.6% 0.4% 0.8% 0.5% 0.7% 0.5% Asian or Pacific Islander 1.2% 0.7% 0.7% 0.6% 1.0% 0.7% African American 2.9% 1.1% 2.6% 1.2% 2.7% 1.2% Hispanic 4.2% 1.9% 3.4% 1.9% 3.8% 1.9% White 90.2% 95.0% 91.7% 95.0% 91.0% 95.0% Other 0.9% 0.8% 0.8% 0.7% 0.9% 0.8%
Age of Borrower Under 30 13.6% 14.6% 14.4% 15.4% 14.0% 15.0% 30-39 27.6% 29.7% 27.3% 29.9% 27.5% 29.8% 40 and Over 58.7% 55.8% 58.3% 54.7% 58.5% 55.3%
Gender of Borrower(s) All Male 20.8% 21.2% 19.6% 20.1% 20.2% 20.7% All Female 15.5% 15.7% 15.0% 15.4% 15.3% 15.6% Male and Female 63.7% 63.1% 65.5% 64.5% 64.5% 63.8%
Source: GSE loan-level data on mortgages on owner-occupied one-unit properties. Percentages are relative to numbers of mortgages in the top row. Missing data are excluded. The data are adjusted for participation percent and REMIC weight.
Underserved ServedUnderserved Served Underserved Served
U.S. Department of Housing and Urban Development, Office of Policy Development and Research. March, 2002

Table 7c-2000
Loan and Borrower Characteristics of Single-Family Home PurchaseMortgages Purchased by the GSEs in Metropolitan Areas, 2000
Fannie Mae Freddie Mac TotalLoan and Borrower
Characteristics
Number of Loans 250,974 817,048 178,872 624,503 429,846 1,441,551
Prior/Current Year Origination Prior Year 29.4% 23.8% 34.7% 29.6% 31.6% 26.3% Current Year 70.6% 76.2% 65.3% 70.4% 68.4% 73.7%
Loan-to-Value Ratio 60% or Less 9.3% 13.2% 8.4% 13.5% 8.9% 13.3% 61-80% 45.2% 49.9% 39.9% 48.0% 43.0% 49.1% 81-90% 17.6% 15.6% 16.1% 14.9% 17.0% 15.3% 91-95% 20.9% 17.7% 24.2% 19.0% 22.3% 18.3% Over 95% 7.0% 3.5% 11.4% 4.7% 8.8% 4.0%
Income of Borrower(s) 60% of Area Median or Below 19.3% 9.6% 22.0% 9.9% 20.4% 9.7% 61-100% of Median 34.1% 27.1% 35.7% 27.5% 34.8% 27.2% Over 100% of Median 46.6% 63.3% 42.3% 62.7% 44.8% 63.0%
Below Area Median 53.4% 36.7% 57.7% 37.3% 55.2% 37.0%
First-Time Home Buyer 27.4% 22.3% 27.9% 22.6% 27.6% 22.4%
Race/National Origin of Borrower American Indian or Alaskan Native 0.4% 0.3% 0.4% 0.4% 0.4% 0.4% Asian or Pacific Islander 7.8% 4.8% 6.1% 4.2% 7.1% 4.5% African American 8.3% 3.0% 8.5% 3.1% 8.3% 3.1% Hispanic 16.5% 5.0% 13.9% 4.4% 15.4% 4.7% White 65.0% 84.8% 69.6% 86.5% 67.0% 85.6% Other 2.1% 2.0% 1.5% 1.4% 1.8% 1.8%
Age of Borrower Under 30 19.8% 17.3% 21.6% 18.2% 20.5% 17.7% 30-39 33.0% 35.6% 33.2% 36.2% 33.1% 35.8% 40 and Over 47.2% 47.1% 45.2% 45.6% 46.5% 46.5%
Gender of Borrower(s) All Male 28.5% 22.6% 29.2% 22.5% 28.8% 22.5% All Female 24.9% 19.8% 24.7% 19.3% 24.9% 19.6% Male and Female 46.5% 57.6% 46.1% 58.2% 46.3% 57.9%
Source: GSE loan-level data on mortgages on owner-occupied one-unit properties. Percentages are relative to numbers of mortgages in the top row. Missing data are excluded. The data are adjusted for participation percent and REMIC weight.
Underserved ServedUnderserved Served Underserved Served
U.S. Department of Housing and Urban Development, Office of Policy Development and Research. March, 2002

Table 7d-2000
Loan and Borrower Characteristics of Single-Family Home PurchaseMortgages Purchased by the GSEs in Non-Metropolitan Areas, 2000
Fannie Mae Freddie Mac TotalLoan and Borrower
Characteristics
Number of Loans 50,742 83,192 43,061 71,392 93,803 154,584
Prior/Current Year Origination Prior Year 21.4% 23.9% 28.7% 25.0% 24.7% 24.4% Current Year 78.6% 76.1% 71.3% 75.0% 75.3% 75.6%
Loan-to-Value Ratio 60% or Less 10.7% 13.0% 10.9% 12.6% 10.8% 12.8% 61-80% 42.8% 45.6% 43.7% 45.9% 43.2% 45.7% 81-90% 17.2% 16.2% 16.9% 15.6% 17.1% 15.9% 91-95% 23.5% 20.1% 22.6% 20.4% 23.1% 20.2% Over 95% 5.8% 5.1% 5.9% 5.5% 5.8% 5.3%
Income of Borrower(s) 60% of Area Median or Below 9.2% 10.4% 9.5% 10.3% 9.3% 10.4% 61-100% of Median 22.7% 26.5% 24.3% 27.1% 23.4% 26.7% Over 100% of Median 68.1% 63.2% 66.3% 62.6% 67.2% 62.9%
Below Area Median 31.9% 36.8% 33.7% 37.4% 32.8% 37.1%
First-Time Home Buyer 20.5% 20.6% 18.7% 20.8% 19.7% 20.7%
Race/National Origin of Borrower American Indian or Alaskan Native 0.6% 0.4% 0.8% 0.5% 0.7% 0.5% Asian or Pacific Islander 1.3% 0.9% 0.8% 0.8% 1.1% 0.9% African American 2.7% 1.1% 2.2% 1.1% 2.5% 1.1% Hispanic 3.7% 2.2% 3.1% 2.3% 3.4% 2.3% White 90.7% 94.4% 92.2% 94.5% 91.4% 94.5% Other 1.0% 0.9% 0.9% 0.8% 1.0% 0.8%
Age of Borrower Under 30 16.2% 17.7% 17.5% 18.9% 16.8% 18.2% 30-39 28.0% 30.7% 27.2% 30.7% 27.6% 30.7% 40 and Over 55.8% 51.6% 55.3% 50.5% 55.6% 51.1%
Gender of Borrower(s) All Male 21.9% 21.6% 21.1% 21.3% 21.6% 21.4% All Female 16.4% 16.5% 16.2% 16.4% 16.3% 16.5% Male and Female 61.7% 61.9% 62.6% 62.4% 62.1% 62.1%
Source: GSE loan-level data on mortgages on owner-occupied one-unit properties. Percentages are relative to numbers of mortgages in the top row. Missing data are excluded. The data are adjusted for participation percent and REMIC weight.
Underserved ServedUnderserved Served Underserved Served
U.S. Department of Housing and Urban Development, Office of Policy Development and Research. March, 2002

Table 7a-1999
Loan and Borrower Characteristics of Single-FamilyMortgages Purchased by the GSEs in Metropolitan Areas, 1999
Fannie Mae Freddie Mac TotalLoan and Borrower
Characteristics
Number of Loans 486,391 1,748,967 382,331 1,261,970 868,722 3,010,937
Loan Purpose Home Purchase 45.4% 47.1% 40.4% 44.5% 43.2% 46.0% All Other 54.6% 52.9% 59.6% 55.5% 56.8% 54.0%
Prior/Current Year Origination Prior Year 30.1% 30.2% 29.1% 27.6% 29.7% 29.1% Current Year 69.9% 69.8% 70.9% 72.4% 70.3% 70.9%
Loan-to-Value Ratio 60% or Less 15.9% 19.8% 17.1% 21.1% 16.5% 20.3% 61-80% 52.6% 53.6% 53.7% 54.0% 53.1% 53.7% 81-90% 15.2% 13.5% 15.0% 13.1% 15.1% 13.3% 91-95% 12.2% 10.8% 10.8% 10.0% 11.6% 10.4% Over 95% 4.0% 2.3% 3.4% 1.9% 3.7% 2.1%
Income of Borrower(s) 60% of Area Median or Below 19.0% 8.8% 19.3% 9.2% 19.2% 9.0% 61-100% of Median 35.2% 26.4% 35.2% 27.4% 35.2% 26.8% Over 100% of Median 45.7% 64.7% 45.5% 63.4% 45.6% 64.2%
Below Area Median 54.3% 35.3% 54.5% 36.6% 54.4% 35.8%
First-Time Home Buyer 14.1% 11.2% 9.4% 9.3% 12.0% 10.4%
Race/National Origin of Borrower American Indian or Alaskan Native 0.4% 0.4% 0.4% 0.3% 0.4% 0.4% Asian or Pacific Islander 7.1% 3.6% 6.0% 3.5% 6.6% 3.6% African American 7.8% 2.3% 8.1% 2.3% 7.9% 2.3% Hispanic 13.3% 3.4% 12.8% 3.4% 13.1% 3.4% White 68.8% 87.9% 71.3% 89.3% 69.9% 88.5% Other 2.6% 2.3% 1.4% 1.2% 2.0% 1.9%
Age of Borrower Under 30 12.9% 11.2% 11.6% 10.5% 12.4% 10.9% 30-39 30.8% 33.2% 30.4% 32.2% 30.6% 32.8% 40 and Over 56.4% 55.6% 58.0% 57.3% 57.0% 56.2%
Gender of Borrower(s) All Male 24.5% 18.8% 22.0% 17.6% 23.4% 18.3% All Female 22.1% 16.7% 21.7% 17.3% 21.9% 16.9% Male and Female 53.4% 64.5% 56.3% 65.1% 54.6% 64.8%
Source: GSE loan-level data on mortgages on owner-occupied one-unit properties. Percentages are relative to numbers of mortgages in the top row. Missing data are excluded. The data are adjusted for participation percent and REMIC weight.
Underserved ServedUnderserved Served Underserved Served
U.S. Department of Housing and Urban Development, Office of Policy Development and Research. March, 2002
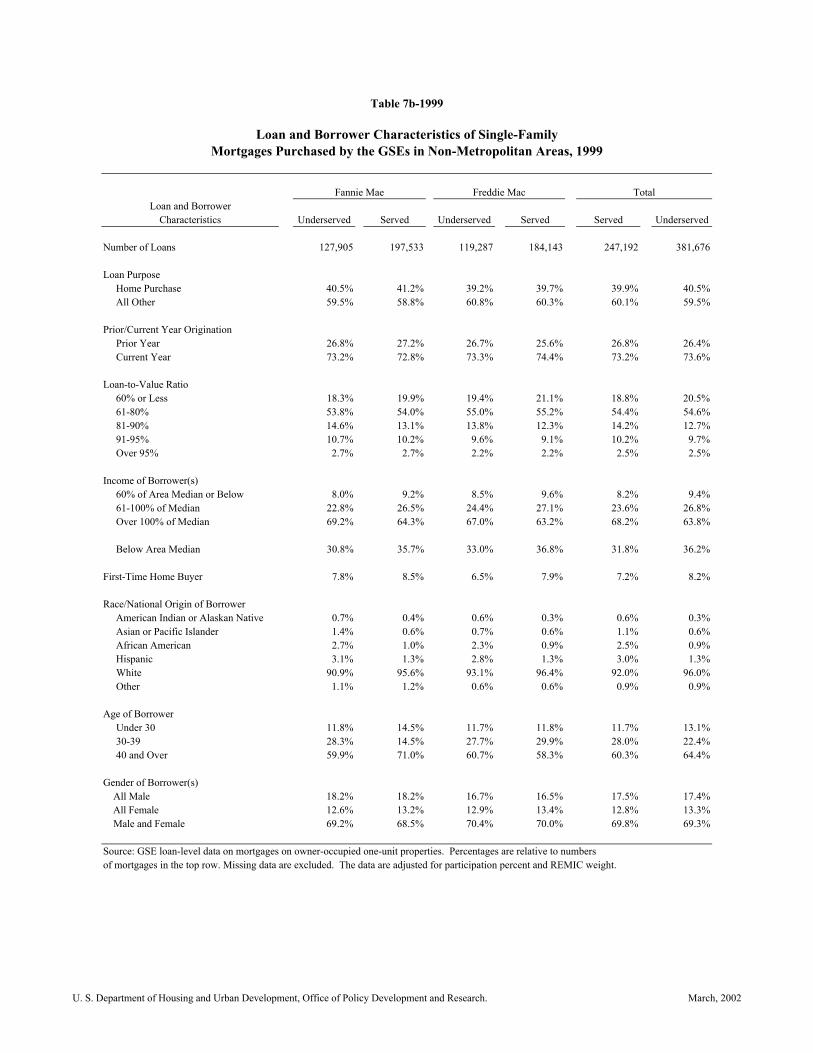
Table 7b-1999
Loan and Borrower Characteristics of Single-FamilyMortgages Purchased by the GSEs in Non-Metropolitan Areas, 1999
Fannie Mae Freddie Mac TotalLoan and Borrower
Characteristics
Number of Loans 127,905 197,533 119,287 184,143 247,192 381,676
Loan Purpose Home Purchase 40.5% 41.2% 39.2% 39.7% 39.9% 40.5% All Other 59.5% 58.8% 60.8% 60.3% 60.1% 59.5%
Prior/Current Year Origination Prior Year 26.8% 27.2% 26.7% 25.6% 26.8% 26.4% Current Year 73.2% 72.8% 73.3% 74.4% 73.2% 73.6%
Loan-to-Value Ratio 60% or Less 18.3% 19.9% 19.4% 21.1% 18.8% 20.5% 61-80% 53.8% 54.0% 55.0% 55.2% 54.4% 54.6% 81-90% 14.6% 13.1% 13.8% 12.3% 14.2% 12.7% 91-95% 10.7% 10.2% 9.6% 9.1% 10.2% 9.7% Over 95% 2.7% 2.7% 2.2% 2.2% 2.5% 2.5%
Income of Borrower(s) 60% of Area Median or Below 8.0% 9.2% 8.5% 9.6% 8.2% 9.4% 61-100% of Median 22.8% 26.5% 24.4% 27.1% 23.6% 26.8% Over 100% of Median 69.2% 64.3% 67.0% 63.2% 68.2% 63.8%
Below Area Median 30.8% 35.7% 33.0% 36.8% 31.8% 36.2%
First-Time Home Buyer 7.8% 8.5% 6.5% 7.9% 7.2% 8.2%
Race/National Origin of Borrower American Indian or Alaskan Native 0.7% 0.4% 0.6% 0.3% 0.6% 0.3% Asian or Pacific Islander 1.4% 0.6% 0.7% 0.6% 1.1% 0.6% African American 2.7% 1.0% 2.3% 0.9% 2.5% 0.9% Hispanic 3.1% 1.3% 2.8% 1.3% 3.0% 1.3% White 90.9% 95.6% 93.1% 96.4% 92.0% 96.0% Other 1.1% 1.2% 0.6% 0.6% 0.9% 0.9%
Age of Borrower Under 30 11.8% 14.5% 11.7% 11.8% 11.7% 13.1% 30-39 28.3% 14.5% 27.7% 29.9% 28.0% 22.4% 40 and Over 59.9% 71.0% 60.7% 58.3% 60.3% 64.4%
Gender of Borrower(s) All Male 18.2% 18.2% 16.7% 16.5% 17.5% 17.4% All Female 12.6% 13.2% 12.9% 13.4% 12.8% 13.3% Male and Female 69.2% 68.5% 70.4% 70.0% 69.8% 69.3%
Source: GSE loan-level data on mortgages on owner-occupied one-unit properties. Percentages are relative to numbers of mortgages in the top row. Missing data are excluded. The data are adjusted for participation percent and REMIC weight.
Served UnderservedUnderserved Served Underserved Served
U. S. Department of Housing and Urban Development, Office of Policy Development and Research. March, 2002

Table 7c-1999
Loan and Borrower Characteristics of Single-Family Home PurchaseMortgages Purchased by the GSEs in Metropolitan Areas, 1999
Fannie Mae Freddie Mac TotalLoan and Borrower
Characteristics
Number of Loans 220,904 824,418 154,383 561,556 375,287 1,385,974
Prior/Current Year Origination Prior Year 26.7% 23.3% 28.5% 22.7% 27.4% 23.0% Current Year 73.3% 76.7% 71.5% 77.3% 72.6% 77.0%
Loan-to-Value Ratio 60% or Less 7.9% 11.5% 9.1% 13.0% 8.4% 12.1% 61-80% 41.6% 46.9% 40.2% 45.7% 41.0% 46.4% 81-90% 17.6% 16.4% 17.2% 15.8% 17.5% 16.1% 91-95% 25.9% 21.6% 24.9% 21.2% 25.5% 21.4% Over 95% 7.0% 3.6% 8.5% 4.2% 7.6% 3.9%
Income of Borrower(s) 60% of Area Median or Below 20.2% 9.4% 18.7% 9.1% 19.6% 9.3% 61-100% of Median 35.2% 27.2% 34.6% 27.6% 35.0% 27.4% Over 100% of Median 44.5% 63.4% 46.6% 63.3% 45.3% 63.4%
Below Area Median 55.5% 36.6% 53.4% 36.7% 54.7% 36.6%
First-Time Home Buyer 30.9% 23.7% 23.3% 20.8% 27.8% 22.5%
Race/National Origin of Borrower American Indian or Alaskan Native 0.5% 0.4% 0.4% 0.3% 0.4% 0.4% Asian or Pacific Islander 7.8% 4.1% 6.3% 3.8% 7.2% 4.0% African American 7.4% 2.7% 6.7% 2.6% 7.1% 2.7% Hispanic 13.4% 4.1% 11.4% 3.8% 12.6% 4.0% White 68.6% 86.3% 73.9% 88.3% 70.8% 87.1% Other 2.4% 2.3% 1.2% 1.1% 1.9% 1.8%
Age of Borrower Under 30 20.3% 17.6% 19.2% 17.2% 19.9% 17.4% 30-39 33.2% 36.6% 33.2% 36.0% 33.2% 36.4% 40 and Over 46.5% 45.8% 47.6% 46.9% 46.9% 46.2%
Gender of Borrower(s) All Male 27.0% 20.6% 25.8% 20.3% 26.6% 20.5% All Female 23.4% 18.1% 22.4% 18.1% 23.0% 18.1% Male and Female 49.6% 61.3% 51.7% 61.7% 50.4% 61.5%
Source: GSE loan-level data on mortgages on owner-occupied one-unit properties. Percentages are relative to numbers of mortgages in the top row. Missing data are excluded. The data are adjusted for participation percent and REMIC weight.
Underserved ServedUnderserved Served Underserved Served
U. S. Department of Housing and Urban Development, Office of Policy Development and Research. March, 2002

Table 7d-1999
Loan and Borrower Characteristics of Single-Family Home PurchaseMortgages Purchased by the GSEs in Non-Metropolitan Areas, 1999
Fannie Mae Freddie Mac TotalLoan and Borrower
Characteristics
Number of Loans 51,782 81,358 46,740 73,129 98,522 154,487
Prior/Current Year Origination Prior Year 23.6% 20.7% 27.0% 23.2% 25.2% 21.9% Current Year 76.4% 79.3% 73.0% 76.8% 74.8% 78.1%
Loan-to-Value Ratio 60% or Less 8.9% 10.4% 10.5% 12.2% 9.6% 11.3% 61-80% 40.3% 44.0% 42.0% 43.4% 41.1% 43.7% 81-90% 20.4% 18.0% 19.0% 17.0% 19.7% 17.5% 91-95% 25.5% 22.9% 23.1% 21.7% 24.4% 22.4% Over 95% 4.9% 4.7% 5.5% 5.6% 5.2% 5.2%
Income of Borrower(s) 60% of Area Median or Below 9.8% 10.1% 9.0% 10.1% 9.4% 10.1% 61-100% of Median 24.0% 26.9% 25.1% 27.3% 24.5% 27.0% Over 100% of Median 66.2% 63.0% 65.8% 62.6% 66.0% 62.8%
Below Area Median 33.8% 37.0% 34.2% 37.4% 34.0% 37.2%
First-Time Home Buyer 19.2% 20.6% 16.6% 19.8% 18.0% 20.2%
Race/National Origin of Borrower American Indian or Alaskan Native 0.8% 0.4% 0.7% 0.3% 0.8% 0.4% Asian or Pacific Islander 1.3% 0.8% 0.7% 0.8% 1.0% 0.8% African American 3.8% 1.2% 2.7% 1.0% 3.3% 1.1% Hispanic 3.0% 1.6% 2.7% 1.7% 2.9% 1.7% White 90.0% 94.8% 92.5% 95.5% 91.2% 95.2% Other 1.1% 1.2% 0.6% 0.6% 0.9% 0.9%
Age of Borrower Under 30 17.5% 18.3% 17.2% 18.8% 17.4% 18.5% 30-39 28.6% 31.3% 28.3% 31.2% 28.4% 31.3% 40 and Over 53.9% 50.4% 54.5% 50.0% 54.2% 50.2%
Gender of Borrower(s) All Male 20.3% 20.2% 20.4% 19.8% 20.3% 20.0% All Female 14.7% 15.0% 14.9% 15.3% 14.8% 15.1% Male and Female 65.0% 64.8% 64.7% 65.0% 64.9% 64.9%
Source: GSE loan-level data on mortgages on owner-occupied one-unit properties. Percentages are relative to numbers of mortgages in the top row. Missing data are excluded. The data are adjusted for participation percent and REMIC weight.
Underserved ServedUnderserved Served Underserved Served
U.S. Department of Housing and Urban Development, Office of Policy Development and Research. March, 2002

MSA Single-Family Multifamily Single-Family Multifamily
ABILENE, TX 402 0 29.4 % 16.8 % 6.2 % 234 1 30.3 % 27.1 % 13.7 %AKRON, OH 7,597 0 50.8 28.2 15.2 3,618 6 57.3 19.3 15.3ALBANY, GA 502 0 24.5 16.1 6.9 341 0 29.9 25.4 13.4ALBANY-SCHENECTADY-TROY, NY 4,673 1 34.4 17.2 10.4 1,697 0 47.2 25.0 22.2ALBUQUERQUE, NM 4,664 2 48.4 48.4 19.5 3,852 10 60.2 37.6 14.4ALEXANDRIA, LA 664 1 28.7 13.5 14.8 122 0 28.4 17.2 10.3ALLENTOWN-BETHLEHEM-EASTON, PA 3,482 2 48.7 18.7 11.9 3,963 2 42.5 22.9 19.6ALTOONA, PA 279 1 41.4 16.5 7.0 437 0 35.6 24.7 11.3AMARILLO, TX 1,169 0 32.2 16.2 10.9 605 0 26.9 15.4 8.5ANCHORAGE, AK 947 0 37.5 22.3 12.7 911 0 37.3 16.9 11.9ANN ARBOR, MI 7,012 3 55.6 17.7 19.7 4,916 3 57.6 17.0 33.6ANNISTON, AL 437 0 40.3 8.3 12.9 363 0 58.2 10.3 23.5APPLETON-OSHKOSH-NEENAH, WI 2,905 0 48.6 15.2 13.1 2,123 0 55.1 18.4 21.5ASHEVILLE, NC 1,460 0 43.0 20.8 15.0 1,563 1 49.3 15.0 12.4ATHENS, GA 1,108 0 39.7 24.1 13.5 772 0 41.5 22.1 13.1ATLANTA, GA 42,513 65 62.0 31.7 29.4 37,347 42 60.5 29.0 27.4ATLANTIC-CAPE MAY, NJ 3,497 0 44.6 27.0 16.4 3,235 0 45.5 25.0 15.8AUBURN-OPELIKA, AL 712 0 38.6 19.2 13.3 400 1 59.9 18.9 18.4AUGUSTA-AIKEN, GA-SC 3,242 1 37.5 25.1 10.3 2,292 1 49.9 29.7 21.5AUSTIN-SAN MARCOS, TX 10,303 30 62.4 28.1 32.6 10,715 12 41.3 25.7 19.0BAKERSFIELD, CA 3,842 4 47.6 27.8 10.1 1,916 0 38.2 25.9 15.1BALTIMORE, MD 13,283 22 59.5 30.3 35.3 14,948 17 56.8 29.9 33.7BANGOR, ME 382 0 36.6 11.0 10.8 227 0 36.0 8.6 9.0BARNSTABLE-YARMOUTH, MA 1,706 0 40.6 39.3 10.3 1,142 0 36.1 32.5 9.3BATON ROUGE, LA 4,009 7 52.8 29.9 18.2 1,643 3 48.5 37.0 13.4BEAUMONT-PORT ARTHUR, TX 939 3 57.6 26.1 6.5 1,205 2 38.4 19.8 14.3BELLINGHAM, WA 1,516 3 57.2 34.2 15.9 1,402 1 48.6 25.7 13.7BENTON HARBOR, MI 1,030 0 49.0 13.6 21.8 983 1 50.0 17.1 26.0BERGEN-PASSAIC, NJ 7,258 1 48.8 31.5 16.4 5,684 6 56.6 37.9 21.3BILLINGS, MT 729 1 61.6 12.5 39.8 507 0 44.1 15.1 18.2BILOXI-GULFPORT-PASCAGOULA, MS 1,878 3 49.3 23.0 8.1 701 2 48.4 28.2 15.3BINGHAMTON, NY 558 0 40.9 23.9 10.7 507 0 43.8 23.1 20.0BIRMINGHAM, AL 5,885 5 48.1 15.4 23.8 5,048 5 58.8 16.8 13.3BISMARCK, ND 348 3 59.0 15.2 45.3 277 0 41.8 22.6 16.0BLOOMINGTON, IN 960 0 41.5 20.5 9.3 440 2 68.8 40.3 48.2BLOOMINGTON-NORMAL, IL 749 0 58.8 30.8 24.6 1,464 3 56.9 29.7 27.3BOISE CITY, ID 4,594 0 43.7 25.3 15.4 3,152 1 45.6 23.7 17.7
Percent PercentPercent Percent Percent PercentNumber of Properties Low-Mod Geo-Targeted Special AffordableNumber of Properties Low-Mod Geo-Targeted Special Affordable
Table 8-2000
GSEs' Goal Qualifying Loans byMetropolitan Area, 2000
Fannie Mae Freddie Mac
U. S. Department of Housing and Urban Development, Office of Policy Development and Research. March, 2002

MSA Single-Family Multifamily Single-Family Multifamily Percent PercentPercent Percent Percent PercentNumber of Properties Low-Mod Geo-Targeted Special AffordableNumber of Properties Low-Mod Geo-Targeted Special Affordable
Fannie Mae Freddie Mac
BOSTON, MA-NH 28,963 23 51.8 37.4 17.3 14,648 11 50.7 37.0 18.9BOULDER-LONGMONT, CO 4,249 3 61.4 22.7 30.6 2,959 3 61.2 26.0 23.9BRAZORIA, TX 1,399 5 47.3 24.2 33.0 1,301 1 30.4 26.1 11.6BREMERTON, WA 2,215 0 38.4 17.8 8.5 1,100 0 41.8 15.0 14.0BRIDGEPORT, CT 3,397 0 55.6 25.4 21.6 2,542 1 50.2 25.9 20.2BROCKTON, MA 2,081 1 54.3 28.3 15.3 1,130 0 50.1 17.9 18.7BROWNSVILLE-HARLINGEN-SAN BENITO, TX 733 1 41.0 63.8 3.9 720 0 16.3 56.3 4.0BRYAN-COLLEGE STATION, TX 592 1 50.3 12.1 7.1 673 4 39.6 17.5 15.2BUFFALO-NIAGARA FALLS, NY 6,430 0 36.5 12.3 9.1 3,309 0 43.1 16.7 17.3BURLINGTON, VT 1,189 1 41.1 21.5 14.1 1,210 0 46.3 21.5 16.1CANTON-MASSILLON, OH 4,493 2 54.9 18.5 15.9 1,577 1 57.5 19.6 27.9CASPER, WY 342 0 44.8 22.2 20.1 250 0 43.0 23.8 20.7CEDAR RAPIDS, IA 1,710 1 45.8 16.7 21.9 1,477 0 52.6 15.1 20.8CHAMPAIGN-URBANA, IL 664 0 45.9 15.3 18.1 1,162 0 52.0 14.6 20.1CHARLESTON-NORTH CHARLESTON, SC 4,144 2 41.4 22.5 8.7 4,351 4 37.9 32.7 14.4CHARLESTON, WV 997 0 37.4 25.9 13.7 692 3 35.3 22.8 14.5CHARLOTTE-GASTONIA-ROCK HILL, NC-SC 11,842 4 50.1 24.1 15.4 15,116 6 50.0 21.1 20.4CHARLOTTESVILLE, VA 916 0 46.7 22.6 17.2 1,652 1 49.5 23.1 21.2CHATTANOOGA, TN-GA 3,172 2 45.2 19.3 14.6 1,949 1 54.0 20.4 19.1CHEYENNE, WY 556 0 42.4 21.3 17.4 355 0 37.6 19.4 12.0CHICAGO, IL 66,713 26 55.1 27.1 20.7 57,419 18 53.5 22.1 20.6CHICO-PARADISE, CA 1,888 0 37.4 31.6 7.6 1,125 0 34.5 30.9 11.3CINCINNATI, OH-KY-IN 16,839 6 47.7 26.1 15.0 12,029 4 52.4 21.8 23.5CLARKSVILLE-HOPKINSVILLE, TN-KY 559 0 33.4 12.4 8.3 627 0 46.5 16.1 17.3CLEVELAND-LORAIN-ELYRIA, OH 21,913 4 54.5 25.2 18.8 9,459 5 57.5 26.5 29.8COLORADO SPRINGS, CO 4,820 4 49.2 25.5 17.5 4,024 9 51.8 27.2 14.4COLUMBIA, MO 666 0 48.6 14.8 17.2 1,266 0 54.1 17.5 23.2COLUMBIA, SC 3,297 3 50.1 26.9 13.7 4,606 0 47.3 27.0 18.9COLUMBUS, GA-AL 1,287 1 61.7 9.5 6.1 1,197 0 46.4 22.8 16.0COLUMBUS, OH 11,687 9 55.8 23.2 32.4 9,324 25 61.3 26.9 33.0CORPUS CHRISTI, TX 1,266 4 59.8 12.8 2.8 1,121 1 27.7 42.7 7.4CORVALLIS, OR 650 1 36.5 36.1 9.3 401 2 58.2 54.0 11.3CUMBERLAND, MD-WV 279 0 33.5 11.5 10.6 197 0 38.5 10.5 15.5DALLAS, TX 23,198 68 60.8 25.6 35.5 21,390 50 46.7 24.4 25.8DANBURY, CT 2,066 0 63.8 28.5 25.8 1,350 1 58.2 26.4 28.8DANVILLE, VA 289 0 32.3 29.4 12.4 231 0 37.5 20.7 12.0DAVENPORT-MOLINE-ROCK ISLAND, IA-IL 1,712 3 52.9 25.3 29.0 2,160 6 52.8 24.4 24.6DAYTON-SPRINGFIELD, OH 6,510 3 55.6 20.1 19.4 5,993 9 60.3 22.6 33.1DAYTONA BEACH, FL 5,129 3 48.7 11.8 13.0 4,374 0 45.8 12.7 16.8DECATUR, AL 842 0 42.3 24.5 17.7 502 0 47.6 23.8 20.1DECATUR, IL 414 0 46.2 21.8 20.6 473 0 53.7 28.8 26.1DENVER, CO 28,815 40 61.4 37.4 32.4 20,448 11 52.0 29.4 20.9DES MOINES, IA 3,009 3 56.3 16.4 19.8 3,474 4 59.4 18.1 30.0DETROIT, MI 47,259 27 55.7 21.1 25.4 35,961 12 51.5 22.1 22.3DOTHAN, AL 469 0 43.0 13.4 12.0 370 0 40.9 12.3 11.6
U. S. Department of Housing and Urban Development, Office of Policy Development and Research. March, 2002

MSA Single-Family Multifamily Single-Family Multifamily Percent PercentPercent Percent Percent PercentNumber of Properties Low-Mod Geo-Targeted Special AffordableNumber of Properties Low-Mod Geo-Targeted Special Affordable
Fannie Mae Freddie Mac
DOVER, DE 560 0 36.1 19.8 9.6 549 0 46.8 27.8 17.0DUBUQUE, IA 516 0 58.9 19.3 25.7 353 0 63.7 22.7 26.8DULUTH-SUPERIOR, MN-WI 1,148 0 47.4 19.9 18.2 1,157 1 52.8 19.5 20.0DUTCHESS COUNTY, NY 2,150 1 44.7 25.0 11.3 1,273 1 62.2 54.8 7.9EAU CLAIRE, WI 421 0 44.8 25.7 14.1 1,031 0 45.1 21.1 15.8EL PASO, TX 1,756 8 44.3 51.9 15.9 1,661 2 50.3 39.0 11.0ELKHART-GOSHEN, IN 898 0 61.9 15.9 29.3 1,472 0 55.8 9.9 20.7ELMIRA, NY 195 1 35.2 8.9 7.8 265 0 36.2 15.2 11.5ENID, OK 164 0 13.6 8.8 4.8 174 0 36.1 15.1 13.4ERIE, PA 654 0 45.0 20.7 17.0 1,021 0 41.1 20.5 16.0EUGENE-SPRINGFIELD, OR 3,027 3 40.6 38.6 9.3 2,082 4 51.8 24.6 8.0EVANSVILLE-HENDERSON, IN-KY 1,948 0 45.5 19.3 14.1 1,860 1 48.0 15.3 18.9FARGO-MOORHEAD, ND-MN 589 0 41.1 22.6 14.7 682 1 49.3 18.7 14.2FAYETTEVILLE, NC 724 0 35.3 47.7 12.4 1,352 0 28.9 49.7 7.7FAYETTEVILLE-SPRINGDALE-ROGERS, AR 2,792 0 36.2 17.0 9.8 1,232 0 36.6 17.8 13.4FITCHBURG-LEOMINSTER, MA 865 1 53.1 19.1 28.0 584 0 49.5 15.0 20.6FLAGSTAFF, AZ-UT 1,096 0 39.6 20.6 11.5 902 1 42.2 19.2 9.0FLINT, MI 4,139 2 49.5 17.8 24.2 1,991 1 47.7 13.4 20.3FLORENCE, AL 700 0 39.4 15.6 12.3 438 0 61.2 17.9 22.6FLORENCE, SC 759 0 33.8 26.1 8.3 600 0 32.2 27.3 10.3FORT COLLINS-LOVELAND, CO 3,759 0 42.8 29.5 14.2 2,479 2 48.3 29.8 16.3FORT LAUDERDALE, FL 19,302 8 49.8 20.5 15.1 13,873 10 52.9 22.0 21.1FORT MYERS-CAPE CORAL, FL 6,250 4 55.5 18.6 12.9 5,102 3 50.8 18.4 17.1FORT PIERCE-PORT ST. LUCIE, FL 2,740 0 45.4 9.0 17.1 2,419 3 55.2 21.6 28.2FORT SMITH, AR-OK 897 0 29.0 16.2 6.7 507 0 25.6 23.0 6.0FORT WALTON BEACH, FL 1,239 1 46.0 19.1 25.2 892 0 38.9 21.3 15.8FORT WAYNE, IN 2,602 3 66.4 25.6 42.7 3,977 3 66.2 10.2 30.1FORT WORTH-ARLINGTON, TX 10,339 32 66.1 29.6 44.4 8,943 18 54.2 27.1 26.1FRESNO, CA 5,813 6 44.6 43.2 7.5 2,857 4 41.5 40.2 12.3GADSDEN, AL 241 0 34.1 14.9 10.6 475 0 36.9 16.0 13.5GAINESVILLE, FL 1,279 1 45.2 15.0 10.9 1,076 1 35.1 20.1 13.6GALVESTON-TEXAS CITY, TX 1,868 0 31.1 20.3 10.7 1,503 1 31.1 19.3 11.6GARY, IN 3,126 0 49.4 12.4 20.3 3,198 1 50.0 16.7 21.6GLENS FALLS, NY 948 0 35.3 21.4 8.8 186 0 40.2 17.8 11.2GOLDSBORO, NC 214 0 37.0 24.0 11.9 401 0 34.5 23.8 8.1GRAND FORKS, ND-MN 226 0 35.2 17.2 11.4 187 1 67.4 8.8 55.4GRAND JUNCTION, CO 1,295 0 39.6 37.3 11.4 1,144 0 42.2 36.6 11.0GRAND RAPIDS-MUSKEGON-HOLLAND, MI 10,094 9 54.1 21.1 24.7 10,107 7 62.2 14.0 38.0GREAT FALLS, MT 283 0 38.2 17.5 15.5 319 0 35.4 16.3 12.5GREELEY, CO 2,613 0 31.9 22.7 9.5 1,636 1 29.9 22.9 8.8GREEN BAY, WI 1,588 0 50.7 16.7 19.1 1,703 0 55.0 18.9 22.6GREENSBORO--WINSTON-SALEM--HIGH POINT, NC 5,901 1 43.9 22.4 15.5 8,715 5 48.7 18.5 18.1GREENVILLE, NC 604 1 39.5 22.1 10.5 780 0 33.0 23.0 9.8GREENVILLE-SPARTANBURG-ANDERSON, SC 5,013 1 45.5 18.9 17.6 7,486 2 46.0 17.3 15.2HAGERSTOWN, MD 453 1 69.8 54.2 54.7 553 0 43.7 15.9 17.8
U. S. Department of Housing and Urban Development, Office of Policy Development and Research. March, 2002

MSA Single-Family Multifamily Single-Family Multifamily Percent PercentPercent Percent Percent PercentNumber of Properties Low-Mod Geo-Targeted Special AffordableNumber of Properties Low-Mod Geo-Targeted Special Affordable
Fannie Mae Freddie Mac
HAMILTON-MIDDLETOWN, OH 3,107 2 51.4 20.6 22.9 2,505 1 49.6 21.4 23.4HARRISBURG-LEBANON-CARLISLE, PA 3,093 0 47.4 20.9 15.3 2,680 2 47.3 19.9 16.7HARTFORD, CT 6,946 8 62.2 23.5 22.6 5,947 15 54.5 25.1 25.0HATTIESBURG, MS 730 0 31.3 13.2 7.7 232 0 28.3 15.6 7.4HICKORY-MORGANTON-LENOIR, NC 1,559 0 46.2 12.5 14.2 2,555 1 45.2 10.0 14.3HONOLULU, HI 3,965 0 43.6 64.8 16.2 1,669 0 43.2 67.2 16.3HOUMA, LA 884 3 39.4 42.0 20.4 181 1 37.0 32.4 19.2HOUSTON, TX 27,510 64 56.8 33.7 32.1 22,365 46 52.6 37.3 29.4HUNTINGTON-ASHLAND, WV-KY-OH 978 0 35.0 25.7 10.8 956 0 31.3 22.5 8.1HUNTSVILLE, AL 2,843 1 44.6 36.1 13.3 1,724 0 56.0 29.4 24.1INDIANAPOLIS, IN 13,226 8 57.9 26.9 34.0 8,777 6 50.5 18.0 22.9IOWA CITY, IA 734 1 39.1 21.6 11.7 679 0 48.6 25.3 14.8JACKSON, MI 1,145 1 53.2 12.3 24.6 1,330 0 44.1 13.5 15.0JACKSON, MS 2,658 2 54.2 19.6 21.4 1,005 2 43.4 20.7 14.8JACKSON, TN 505 0 31.6 17.3 7.2 447 0 39.6 24.1 12.2JACKSONVILLE, FL 8,157 9 56.1 20.3 21.6 7,373 18 53.7 16.4 18.6JACKSONVILLE, NC 395 0 29.6 21.1 6.2 534 0 28.7 17.2 5.6JAMESTOWN, NY 283 0 40.0 9.6 13.4 301 0 39.1 12.1 10.4JANESVILLE-BELOIT, WI 957 0 61.6 21.5 24.5 893 1 58.7 23.5 23.6JERSEY CITY, NJ 2,669 4 36.7 69.2 10.1 1,866 4 45.7 63.4 8.7JOHNSON CITY-KINGSPORT-BRISTOL, TN-VA 1,621 1 43.2 26.8 17.7 1,277 0 43.5 30.8 17.4JOHNSTOWN, PA 366 0 29.9 17.6 9.1 318 0 32.5 15.9 8.3JONESBORO, AR 344 0 37.5 15.5 9.1 166 0 31.4 10.9 9.6JOPLIN, MO 824 0 44.3 13.2 16.3 1,593 0 42.0 12.8 15.7KALAMAZOO-BATTLE CREEK, MI 3,109 0 49.3 26.6 19.0 3,903 3 40.2 19.0 15.3KANKAKEE, IL 262 0 51.3 13.9 17.4 548 0 46.0 10.1 17.9KANSAS CITY, MO-KS 12,730 11 56.9 21.2 30.2 11,493 16 57.7 23.4 30.4KENOSHA, WI 1,353 1 56.2 14.0 16.6 731 1 43.7 11.3 17.1KILLEEN-TEMPLE, TX 666 1 39.3 20.9 11.6 471 0 32.1 28.2 11.9KNOXVILLE, TN 4,195 3 45.6 18.9 22.4 2,554 2 46.9 20.6 16.7KOKOMO, IN 687 0 57.2 29.6 22.8 764 1 63.9 22.5 20.4LA CROSSE, WI-MN 582 0 50.7 17.1 19.0 584 0 48.1 15.5 14.6LAFAYETTE, LA 1,177 5 44.7 22.6 19.0 548 1 27.8 22.4 9.0LAFAYETTE, IN 1,240 0 50.6 11.7 20.8 632 2 77.9 7.7 54.9LAKE CHARLES, LA 807 1 38.5 27.0 17.6 367 0 34.4 22.5 12.5LAKELAND-WINTER HAVEN, FL 2,405 0 44.9 15.1 15.5 2,826 0 42.4 23.7 17.3LANCASTER, PA 2,376 1 50.1 10.6 13.2 2,533 0 48.1 10.7 16.2LANSING-EAST LANSING, MI 4,531 3 44.8 27.3 20.1 2,937 2 54.9 27.7 28.7LAREDO, TX 279 0 20.7 55.2 2.8 227 2 26.1 42.8 4.1LAS CRUCES, NM 1,079 0 24.0 63.9 3.6 476 1 33.3 66.9 7.6LAS VEGAS, NV-AZ 16,234 16 56.1 13.4 12.9 11,955 25 53.6 15.4 16.3LAWRENCE, KS 800 0 47.8 33.0 17.1 564 0 45.2 27.3 16.5LAWRENCE, MA-NH 3,740 1 40.4 18.0 14.8 2,375 0 48.4 25.3 20.5LAWTON, OK 256 0 36.2 38.0 12.3 205 0 27.1 29.8 6.9LEWISTON-AUBURN, ME 235 0 37.3 10.2 8.2 283 0 31.6 16.4 9.9
U. S. Department of Housing and Urban Development, Office of Policy Development and Research. March, 2002

MSA Single-Family Multifamily Single-Family Multifamily Percent PercentPercent Percent Percent PercentNumber of Properties Low-Mod Geo-Targeted Special AffordableNumber of Properties Low-Mod Geo-Targeted Special Affordable
Fannie Mae Freddie Mac
LEXINGTON, KY 2,794 3 55.5 27.1 29.2 3,557 3 51.9 24.1 24.5LIMA, OH 768 2 61.0 22.3 31.9 785 0 55.6 14.8 26.3LINCOLN, NE 2,437 2 55.1 13.9 33.0 992 1 56.5 27.4 17.1LITTLE ROCK-NORTH LITTLE ROCK, AR 3,196 4 49.0 15.7 20.3 2,494 2 43.7 13.1 20.5LONGVIEW-MARSHALL, TX 698 0 27.9 18.2 6.7 292 1 41.2 27.7 22.6LOS ANGELES-LONG BEACH, CA 63,729 53 38.5 52.2 9.3 24,995 25 40.8 46.3 14.8LOUISVILLE, KY-IN 6,077 4 57.4 20.5 33.2 8,347 0 46.2 18.2 19.8LOWELL, MA-NH 2,828 2 51.9 23.4 16.3 1,883 0 50.2 19.4 20.3LUBBOCK, TX 1,006 3 49.0 35.0 23.2 806 0 29.5 15.1 10.4LYNCHBURG, VA 979 0 43.3 11.5 16.2 1,268 0 41.6 13.6 14.0MACON, GA 1,877 1 40.0 14.6 11.2 1,414 0 40.5 23.2 16.5MADISON, WI 3,041 3 55.0 22.0 22.3 2,858 2 63.8 20.9 35.4MANCHESTER, NH 1,769 1 41.4 22.6 13.6 1,226 2 55.3 39.7 36.9MANSFIELD, OH 736 0 55.8 28.1 25.5 588 0 54.9 26.2 22.8MCALLEN-EDINBURG-MISSION, TX 834 0 14.2 44.8 2.3 1,147 0 16.3 53.1 6.0MEDFORD-ASHLAND, OR 2,090 0 31.7 29.9 6.6 1,136 0 37.4 32.3 10.9MELBOURNE-TITUSVILLE-PALM BAY, FL 4,446 2 56.8 21.2 18.2 3,837 6 58.4 31.1 28.8MEMPHIS, TN-AR-MS 6,219 5 45.6 21.7 15.3 3,857 4 46.9 19.3 27.6MERCED, CA 1,175 0 34.7 68.9 6.3 776 0 31.5 70.0 9.9MIAMI, FL 17,009 16 39.0 40.1 9.1 11,932 10 40.5 44.9 11.0MIDDLESEX-SOMERSET-HUNTERDON, NJ 8,112 4 62.0 27.7 30.9 8,629 6 63.5 33.5 34.2MILWAUKEE-WAUKESHA, WI 9,671 2 53.0 17.4 23.0 6,641 6 57.3 18.2 24.8MINNEAPOLIS-ST. PAUL, MN-WI 23,491 17 64.8 29.2 31.4 29,266 13 58.2 22.9 23.0MISSOULA, MT 846 0 36.3 26.6 13.1 402 0 41.3 24.9 15.8MOBILE, AL 3,431 3 54.6 6.6 29.8 2,640 0 45.0 11.7 15.4MODESTO, CA 3,609 1 40.3 33.7 7.2 2,518 2 38.0 29.8 10.1MONMOUTH-OCEAN, NJ 9,382 4 48.3 34.0 20.5 9,184 12 54.6 39.4 20.3MONROE, LA 888 0 27.8 10.2 9.6 167 0 32.3 14.2 16.8MONTGOMERY, AL 1,988 3 59.2 15.4 40.1 684 0 48.9 24.4 16.8MUNCIE, IN 435 1 69.9 22.1 22.8 506 0 60.2 26.8 30.6MYRTLE BEACH, SC 3,105 1 43.8 27.6 9.3 2,578 0 39.7 31.8 11.6NAPLES, FL 3,336 2 55.4 29.5 13.3 3,739 1 55.2 20.3 20.0NASHUA, NH 1,932 0 50.2 24.4 17.4 1,565 1 49.0 28.6 15.2NASHVILLE, TN 8,791 11 64.2 24.2 38.3 7,533 10 61.6 22.6 33.7NASSAU-SUFFOLK, NY 18,312 2 51.1 34.4 15.2 11,331 8 54.4 32.2 17.4NEW BEDFORD, MA 922 2 57.3 25.8 12.1 398 0 44.1 31.5 10.4NEW HAVEN-MERIDEN, CT 3,877 0 47.8 25.1 18.2 2,544 1 47.0 25.9 19.8NEW LONDON-NORWICH, CT-RI 1,771 2 58.0 31.8 29.4 1,378 1 44.9 22.3 19.9NEW ORLEANS, LA 7,422 12 52.7 42.8 31.3 2,646 4 48.5 37.4 24.4NEW YORK, NY 34,737 41 45.1 31.0 11.7 15,044 77 48.9 38.7 19.7NEWARK, NJ 10,304 9 48.6 28.1 20.8 10,792 19 60.1 22.8 24.0NEWBURGH, NY-PA 3,129 0 36.3 23.5 9.8 1,937 2 43.7 18.3 9.3NORFOLK-VIRGINIA BEACH-NEWPORT NEWS, VA-NC 6,503 5 47.7 33.2 15.5 8,530 5 47.1 35.4 23.9OAKLAND, CA 26,185 16 46.5 55.3 13.3 12,650 4 47.0 52.7 19.8OCALA, FL 2,128 1 39.2 31.5 13.9 1,508 0 44.3 20.7 16.3
U. S. Department of Housing and Urban Development, Office of Policy Development and Research. March, 2002

MSA Single-Family Multifamily Single-Family Multifamily Percent PercentPercent Percent Percent PercentNumber of Properties Low-Mod Geo-Targeted Special AffordableNumber of Properties Low-Mod Geo-Targeted Special Affordable
Fannie Mae Freddie Mac
ODESSA-MIDLAND, TX 646 0 23.2 9.1 4.8 659 1 24.9 20.3 7.9OKLAHOMA CITY, OK 7,531 11 52.2 25.6 36.2 4,590 1 49.8 15.4 32.3OLYMPIA, WA 2,091 0 39.8 33.2 7.2 951 2 50.6 48.8 10.3OMAHA, NE-IA 7,295 2 38.7 16.3 18.7 3,986 4 55.9 19.7 26.7ORANGE COUNTY, CA 26,088 30 52.5 41.8 18.9 12,418 20 52.2 28.8 15.2ORLANDO, FL 17,507 16 53.6 27.7 18.2 12,155 20 55.0 27.3 17.8OWENSBORO, KY 291 0 49.1 23.0 13.9 859 0 45.8 19.0 16.0PANAMA CITY, FL 1,326 2 41.3 12.5 17.2 618 0 41.2 16.5 14.0PARKERSBURG-MARIETTA, WV-OH 372 0 45.1 29.9 23.5 411 0 42.5 21.6 15.3PENSACOLA, FL 2,649 3 50.1 13.8 9.9 2,162 0 45.6 24.3 19.1PEORIA-PEKIN, IL 1,983 2 63.1 22.5 24.9 1,828 0 49.9 18.1 20.6PHILADELPHIA, PA-NJ 29,408 12 44.5 16.1 17.5 26,961 60 49.2 22.9 24.4PHOENIX-MESA, AZ 30,830 55 57.1 36.2 26.4 29,181 30 52.2 30.8 20.3PINE BLUFF, AR 212 0 24.5 20.8 8.7 180 0 26.2 23.1 9.5PITTSBURGH, PA 9,090 0 36.6 19.4 13.7 8,173 3 36.9 18.3 13.5PITTSFIELD, MA 284 0 45.6 15.5 9.4 86 0 30.6 14.2 14.0POCATELLO, ID 659 0 44.9 27.4 16.4 384 1 51.8 27.7 26.9PORTLAND, ME 2,115 3 40.5 18.3 10.8 1,221 0 43.0 19.9 14.9PORTLAND-VANCOUVER, OR-WA 21,125 16 46.7 27.7 14.3 12,990 8 44.2 25.7 13.5PORTSMOUTH-ROCHESTER, NH-ME 2,453 0 35.3 14.6 9.4 1,418 1 50.0 10.8 9.4PROVIDENCE-FALL RIVER-WARWICK, RI-MA 8,724 0 42.6 19.1 13.6 4,955 3 48.1 24.1 20.3PROVO-OREM, UT 3,299 0 36.2 16.0 7.2 2,304 1 39.5 17.5 8.5PUEBLO, CO 1,392 0 36.7 35.7 13.6 705 0 38.2 41.7 14.7PUNTA GORDA, FL 2,870 0 35.9 14.1 11.9 1,339 0 43.6 19.7 16.6RACINE, WI 1,320 0 54.4 15.8 22.3 1,035 0 52.6 19.7 23.3RALEIGH-DURHAM-CHAPEL HILL, NC 8,780 8 54.5 24.9 27.7 12,290 6 54.8 22.2 23.1RAPID CITY, SD 436 1 48.4 18.5 11.4 290 0 36.8 22.0 18.3READING, PA 2,392 0 43.3 7.8 12.3 2,336 0 40.8 9.7 16.0REDDING, CA 1,413 1 33.6 20.9 6.1 877 0 36.8 19.2 12.3RENO, NV 3,027 8 66.3 28.5 28.9 2,576 1 49.3 20.0 19.5RICHLAND-KENNEWICK-PASCO, WA 1,465 1 42.9 19.2 10.4 926 0 45.2 29.0 21.7RICHMOND-PETERSBURG, VA 6,097 6 52.2 23.6 28.7 8,621 7 52.2 25.6 25.5RIVERSIDE-SAN BERNARDINO, CA 28,266 20 38.3 40.6 11.4 14,626 18 44.3 41.5 14.7ROANOKE, VA 1,159 0 47.4 18.5 18.6 2,131 1 57.5 20.6 31.1ROCHESTER, MN 699 0 65.9 22.9 27.3 1,620 1 61.0 21.3 28.2ROCHESTER, NY 6,586 4 39.2 15.3 10.7 3,435 2 47.5 18.0 14.9ROCKFORD, IL 2,524 2 55.8 18.1 29.3 3,124 0 54.7 19.3 24.1ROCKY MOUNT, NC 466 0 40.4 45.4 13.4 649 0 30.5 45.1 8.4SACRAMENTO, CA 19,467 15 45.5 33.6 11.1 10,100 3 38.3 28.8 15.2SAGINAW-BAY CITY-MIDLAND, MI 2,074 1 51.4 24.1 23.4 2,354 0 39.2 19.6 15.6ST. CLOUD, MN 732 2 56.3 29.0 25.1 1,252 0 46.7 18.8 13.7ST. JOSEPH, MO 508 0 45.2 19.8 14.3 497 0 43.9 19.1 17.7ST. LOUIS, MO-IL 17,988 3 52.4 21.8 24.3 24,231 6 48.9 21.4 21.6SALEM, OR 3,163 1 37.1 13.6 7.9 1,509 2 40.4 14.3 9.9SALINAS, CA 3,151 1 27.8 68.4 5.8 1,691 0 29.9 69.8 8.3
U. S. Department of Housing and Urban Development, Office of Policy Development and Research. March, 2002

MSA Single-Family Multifamily Single-Family Multifamily Percent PercentPercent Percent Percent PercentNumber of Properties Low-Mod Geo-Targeted Special AffordableNumber of Properties Low-Mod Geo-Targeted Special Affordable
Fannie Mae Freddie Mac
SALT LAKE CITY-OGDEN, UT 12,868 8 50.0 28.8 19.7 6,375 3 49.9 27.7 21.1SAN ANGELO, TX 304 0 29.2 22.6 7.3 288 0 34.8 31.4 10.9SAN ANTONIO, TX 6,054 16 54.0 34.5 14.2 5,102 11 38.3 33.2 9.5SAN DIEGO, CA 31,151 33 39.0 36.9 8.8 12,473 14 42.4 39.6 14.4SAN FRANCISCO, CA 10,080 7 42.1 55.8 9.4 4,666 5 42.9 56.2 15.9SAN JOSE, CA 11,440 16 64.8 70.5 18.7 5,237 2 61.3 57.3 20.6SAN LUIS OBISPO-ATASCADERO-PASO ROBLES, CA 3,266 0 31.5 26.9 5.1 1,627 0 30.9 22.5 7.9SANTA BARBARA-SANTA MARIA-LOMPOC, CA 2,830 3 39.5 47.4 17.4 1,183 4 43.1 44.4 21.3SANTA CRUZ-WATSONVILLE, CA 2,186 0 37.5 48.7 5.7 1,287 0 37.7 46.9 12.4SANTA FE, NM 1,437 0 44.9 60.6 18.7 926 0 52.3 71.7 22.9SANTA ROSA, CA 6,490 2 35.0 22.2 8.1 3,100 2 36.7 22.1 8.6SARASOTA-BRADENTON, FL 7,987 5 47.9 15.8 11.7 4,821 3 46.0 16.5 16.0SAVANNAH, GA 1,978 2 45.4 15.5 8.8 2,147 3 40.7 18.8 12.3SCRANTON--WILKES-BARRE--HAZLETON, PA 4,345 0 42.4 19.3 7.6 1,696 0 40.8 15.8 15.6SEATTLE-BELLEVUE-EVERETT, WA 28,229 32 53.7 35.1 18.8 13,948 20 57.7 37.4 23.2SHARON, PA 572 0 34.3 11.8 9.1 366 0 38.2 10.0 11.1SHEBOYGAN, WI 720 0 52.7 15.0 18.5 609 0 56.4 18.4 23.7SHERMAN-DENISON, TX 630 0 29.6 11.0 7.1 384 2 39.7 10.4 25.6SHREVEPORT-BOSSIER CITY, LA 1,887 5 38.9 18.5 14.4 486 3 46.0 11.6 28.4SIOUX CITY, IA-NE 678 1 57.4 39.1 14.3 231 0 45.3 27.5 19.1SIOUX FALLS, SD 1,299 0 44.0 22.1 16.6 780 1 45.5 27.9 11.5SOUTH BEND, IN 1,412 2 62.0 25.9 31.2 2,080 0 47.9 18.6 19.6SPOKANE, WA 4,344 2 44.4 29.4 16.5 1,676 2 48.8 25.2 16.9SPRINGFIELD, IL 1,639 1 57.6 18.1 19.9 1,340 0 52.2 18.9 19.0SPRINGFIELD, MO 1,776 0 47.3 19.1 16.8 2,979 0 49.7 20.4 19.1SPRINGFIELD, MA 2,403 1 47.9 28.0 18.2 1,144 1 54.1 26.0 16.6STAMFORD-NORWALK, CT 2,420 1 70.6 68.3 39.7 1,921 3 64.9 63.7 37.0STATE COLLEGE, PA 413 0 34.4 38.0 8.7 631 0 30.5 42.7 8.7STEUBENVILLE-WEIRTON, OH-WV 453 0 41.9 24.5 12.1 293 1 45.8 23.0 19.5STOCKTON-LODI, CA 4,937 4 33.4 34.0 6.3 3,256 2 39.7 32.3 14.0SUMTER, SC 285 0 40.0 32.3 13.8 312 0 28.0 37.8 9.7SYRACUSE, NY 3,875 2 34.9 13.5 5.8 1,583 1 40.8 22.6 16.5TACOMA, WA 7,765 7 47.3 21.1 11.6 3,835 1 41.9 20.0 10.9TALLAHASSEE, FL 1,318 5 71.1 27.3 46.9 1,384 1 47.8 34.0 21.4TAMPA-ST. PETERSBURG-CLEARWATER, FL 22,341 16 52.1 23.0 14.4 19,323 15 54.1 25.7 25.5TERRE HAUTE, IN 835 0 36.9 16.5 9.2 635 1 51.0 16.9 21.0TEXARKANA, TX-TEXARKANA, AR 319 0 29.2 16.4 8.2 158 0 36.5 22.7 6.2TOLEDO, OH 6,855 0 57.7 20.9 19.0 4,273 3 50.1 15.6 22.8TOPEKA, KS 820 3 62.1 9.8 40.2 613 1 49.9 17.5 22.7TRENTON, NJ 2,234 0 49.4 18.6 19.9 2,060 3 61.0 19.0 32.8TUCSON, AZ 7,190 8 50.2 18.2 11.3 6,717 15 55.1 23.2 18.8TULSA, OK 4,950 6 51.1 24.2 32.9 3,933 3 38.3 15.1 9.8TUSCALOOSA, AL 914 0 31.5 18.6 10.5 729 0 40.1 17.5 12.0TYLER, TX 621 2 57.0 7.6 40.5 732 0 33.5 20.3 12.1UTICA-ROME, NY 949 0 32.4 14.9 5.8 494 0 41.8 17.0 14.3
U. S. Department of Housing and Urban Development, Office of Policy Development and Research. March, 2002

MSA Single-Family Multifamily Single-Family Multifamily Percent PercentPercent Percent Percent PercentNumber of Properties Low-Mod Geo-Targeted Special AffordableNumber of Properties Low-Mod Geo-Targeted Special Affordable
Fannie Mae Freddie Mac
VALLEJO-FAIRFIELD-NAPA, CA 5,962 2 31.4 43.7 8.7 2,856 1 40.2 49.4 14.5VENTURA, CA 7,988 10 49.4 42.7 18.5 3,733 1 46.2 40.5 18.1VICTORIA, TX 117 0 38.0 34.3 10.2 202 0 26.5 38.6 10.3VINELAND-MILLVILLE-BRIDGETON, NJ 476 0 49.4 27.0 18.7 377 0 49.5 27.1 15.3VISALIA-TULARE-PORTERVILLE, CA 2,183 1 38.9 55.2 9.0 967 0 36.7 51.8 13.5WACO, TX 762 2 55.0 21.7 9.3 508 1 32.7 28.6 20.2WASHINGTON, DC-MD-VA-WV 35,374 44 62.7 44.0 31.8 37,095 39 71.0 46.6 38.9WATERBURY, CT 1,225 3 58.6 9.7 21.1 821 2 59.5 14.0 40.7WATERLOO-CEDAR FALLS, IA 511 0 49.1 30.0 20.3 769 0 53.7 33.2 28.1WAUSAU, WI 467 0 45.2 14.1 10.4 508 0 50.4 15.0 15.3WEST PALM BEACH-BOCA RATON, FL 14,526 8 51.3 25.1 19.3 9,364 2 52.5 26.7 22.8WHEELING, WV-OH 352 0 37.5 23.6 10.9 284 0 37.8 24.7 11.4WICHITA, KS 4,279 1 39.3 16.0 19.1 2,579 2 56.1 22.4 25.0WICHITA FALLS, TX 483 1 53.6 9.7 5.2 208 0 29.7 23.4 8.0WILLIAMSPORT, PA 309 0 38.3 20.3 10.3 290 0 36.0 21.2 11.0WILMINGTON-NEWARK, DE-MD 4,103 1 53.7 22.0 24.1 3,983 5 60.1 22.0 29.2WILMINGTON, NC 2,128 0 41.5 24.2 13.6 2,581 0 40.6 28.7 15.4WORCHESTER, MA-CT 3,577 3 49.2 14.5 15.3 2,284 0 43.4 17.3 18.1YAKIMA, WA 1,441 0 35.8 37.1 9.9 749 0 45.0 47.1 21.7YOLO, CA 1,414 4 53.8 31.2 23.9 662 0 39.9 31.7 16.4YORK, PA 2,183 2 60.0 10.1 34.2 2,394 0 42.4 12.1 15.7YOUNGSTOWN-WARREN, OH 6,337 0 40.0 15.5 7.2 2,200 0 50.8 20.8 23.9YUBA CITY, CA 713 0 38.6 34.2 6.3 550 0 35.8 30.2 13.3YUMA, AZ 621 1 44.8 45.6 28.6 474 2 51.4 29.5 12.1
Note: This table gives Low- and Moderate-Income, Geographically Targeted, and Special Affordable percentages based on application of housing goal counting rules to units in properties covered by GSE mortgage purchases in each MSA. The table also gives total numbers of single-family (1- to 4-unit) and multifamily (5 or more unit) properties covered by GSE mortgage purchases in each MSA.The Housing Goals are defined on a national level. The GSEs are not required to meet the Housing Goals in individual MSAs.
U. S. Department of Housing and Urban Development, Office of Policy Development and Research. March, 2002

Table 8-1999
MSA Single-Family Multifamily Single-Family Multifamily
ABILENE, TX 741 0 28.9 % 24.2 % 9.5 % 388 1 41.1 % 23.5 % 9.7 %AKRON, OH 12,382 8 45.4 23.6 15.3 4,469 0 47.2 22.8 18.5ALBANY-SCHENECTADY-TROY, NY 770 0 35.8 17.5 14.2 816 1 52.8 13.4 36.3ALBANY, GA 4,916 2 25.1 11.5 5.9 3,415 7 34.2 32.7 20.5ALBUQUERQUE, NM 7,580 14 62.0 29.2 13.4 5,874 1 44.1 50.0 16.8ALEXANDRIA, LA 1,027 0 19.1 14.4 5.9 339 0 28.5 15.4 9.5ALLENTOWN-BETHLEHEM-EASTON, PA 4,914 1 39.4 14.5 15.3 3,565 1 40.0 20.7 14.4ALTOONA, PA 366 1 24.6 20.5 6.0 498 0 30.4 25.0 9.8AMARILLO, TX 1,894 1 43.1 10.8 26.7 800 2 40.7 11.6 24.0ANCHORAGE, AK 2,926 0 36.5 16.7 12.2 1,126 0 36.6 15.7 11.3ANN ARBOR, MI 12,675 3 48.8 18.9 16.3 6,647 4 50.6 14.7 16.6ANNISTON, AL 785 0 37.1 5.8 11.0 484 0 40.9 6.6 12.9APPLETON-OSHKOSH-NEENAH, WI 4,645 1 49.9 14.9 14.3 2,696 1 51.9 14.9 19.9ASHEVILLE, NC 2,148 0 43.1 18.9 13.8 2,428 1 48.5 13.1 10.4ATHENS, GA 1,603 0 36.8 19.4 10.7 925 1 41.7 19.6 12.4ATLANTA, GA 57,108 45 53.5 27.3 23.7 42,121 53 54.3 27.5 21.6ATLANTIC-CAPE MAY, NJ 4,698 0 40.3 20.8 12.7 3,759 0 40.3 20.6 11.3AUGUSTA-AIKEN, GA-SC 3,356 3 40.9 25.3 15.7 3,622 4 32.2 27.4 10.9AUSTIN-SAN MARCOS, TX 13,955 30 59.1 30.9 35.2 10,814 12 43.6 25.5 15.7BAKERSFIELD, CA 3,853 1 28.5 17.7 11.6 3,119 0 35.0 25.8 13.5BALTIMORE, MD 23,598 18 47.3 18.2 23.0 16,153 36 58.4 23.6 33.0BANGOR, ME 643 1 38.9 8.8 8.3 417 0 39.6 12.3 12.5BARNSTABLE-YARMOUTH, MA 2,963 0 37.9 28.6 10.6 2,079 0 36.4 25.8 9.3BATON ROUGE, LA 7,206 5 40.8 23.0 19.1 2,995 0 40.0 24.9 14.9BEAUMONT-PORT ARTHUR, TX 1,808 0 30.0 18.3 8.4 1,411 1 32.4 16.5 7.7BELLINGHAM, WA 2,125 2 46.5 24.5 16.3 1,984 0 50.7 24.2 16.0BENTON HARBOR, MI 1,799 0 39.0 10.3 12.0 1,451 0 45.5 8.9 16.9BERGEN-PASSAIC, NJ 11,714 2 44.3 26.4 14.7 7,465 9 47.0 25.2 15.9BILLINGS, MT 1,407 0 40.9 14.5 14.0 852 1 53.3 12.8 29.7BILOXI-GULFPORT-PASCAGOULA, MS 2,642 1 33.6 26.6 12.6 1,241 4 34.0 25.7 8.6BINGHAMTON, NY 992 0 35.2 17.3 11.8 854 1 63.2 10.4 50.0BIRMINGHAM, AL 8,133 4 38.4 18.4 15.2 7,604 2 42.1 18.9 15.8BISMARCK, ND 813 1 39.8 20.2 17.4 637 2 43.9 34.2 9.0BLOOMINGTON-NORMAL, IL 1,084 3 60.0 25.0 36.9 683 0 54.6 21.9 29.2BLOOMINGTON, IN 1,909 2 56.6 35.9 34.8 1,723 2 42.4 15.2 16.9BOISE CITY, ID 4,879 3 50.1 24.3 18.8 5,156 3 48.7 22.2 18.1BOSTON, MA-NH 45,317 26 48.2 31.0 18.1 25,464 28 50.5 31.0 19.2
Number of Properties
GSEs' Goal-Qualifying Loans byMetropolitan Area, 1999
Fannie Mae Freddie MacNumber of PropertiesLow-Mod Special Affordable
PercentPercentGeo-Targeted
PercentGeo-Targeted
PercentPercentSpecial Affordable Low-Mod
Percent
U. S. Department of Housing and Urban Development, Office of Policy Development and Research. March, 2002

MSA Single-Family Multifamily Single-Family MultifamilyNumber of Properties
Fannie Mae Freddie MacNumber of PropertiesLow-Mod Special Affordable
PercentPercentGeo-Targeted
PercentGeo-Targeted
PercentPercentSpecial Affordable Low-Mod
Percent
BOULDER-LONGMONT, CO 6,607 1 52.8 22.6 21.8 4,320 1 55.9 19.7 21.9BRAZORIA, TX 2,071 2 39.8 14.7 20.7 1,500 0 28.6 36.6 10.6BREMERTON, WA 2,910 0 34.2 11.4 9.0 2,120 2 48.1 21.1 21.5BRIDGEPORT, CT 3,843 2 50.2 18.0 20.6 2,945 4 58.6 22.2 22.9BROCKTON, MA 3,506 1 45.6 13.1 15.1 1,403 1 50.8 9.7 11.9BROWNSVILLE-HARLINGEN-SAN BENITO, TX 896 2 35.4 51.6 1.4 883 1 18.3 56.9 1.9BRYAN-COLLEGE STATION, TX 1,048 0 31.4 18.3 11.2 862 3 59.4 16.0 42.2BUFFALO-NIAGARA FALLS, NY 5,452 4 46.8 10.0 23.5 5,161 6 42.4 14.5 15.8BURLINGTON, VT 1,988 0 38.1 20.0 10.4 2,106 0 47.0 20.2 16.9CANTON-MASSILLON, OH 7,594 2 44.7 14.5 11.4 2,431 0 51.2 17.8 19.8CASPER, WY 598 0 42.3 20.7 17.2 511 1 44.4 24.6 18.5CEDAR RAPIDS, IA 2,492 0 47.3 16.6 15.5 1,930 0 51.2 17.9 21.3CHAMPAIGN-URBANA, IL 1,637 1 43.1 17.5 15.3 1,476 8 49.5 17.1 18.9CHARLESTON-NORTH CHARLESTON, SC 5,132 1 35.5 23.7 10.3 3,898 3 34.1 31.1 10.9CHARLESTON, WV 1,373 0 29.4 21.1 10.2 1,569 0 25.6 20.7 6.8CHARLOTTE-GASTONIA-ROCK HILL, NC-SC 17,937 7 47.2 19.0 18.2 15,847 18 48.4 23.2 17.8CHARLOTTESVILLE, VA 1,673 0 46.6 20.9 17.7 1,383 3 62.7 16.7 36.4CHATTANOOGA, TN-GA 3,699 2 49.5 24.9 16.3 2,928 0 36.7 18.9 12.3CHEYENNE, WY 918 0 40.4 16.9 14.4 671 0 39.6 16.2 13.8CHICAGO, IL 100,354 34 51.5 23.8 18.4 73,886 22 53.2 21.9 20.0CHICO-PARADISE, CA 2,125 2 38.0 19.9 7.8 1,744 0 33.4 26.3 9.1CINCINNATI, OH-KY-IN 19,088 3 47.6 26.5 19.8 21,124 6 47.4 21.0 20.2CLARKSVILLE-HOPKINSVILLE, TN-KY 754 0 33.7 14.4 8.3 927 2 30.0 13.6 8.8CLEVELAND-LORAIN-ELYRIA, OH 40,138 33 47.0 17.9 12.7 11,083 13 59.7 24.0 33.3COLORADO SPRINGS, CO 8,372 12 51.1 19.9 12.1 5,285 4 50.7 30.2 18.6COLUMBIA, MO 963 1 52.4 14.1 23.0 1,685 0 44.9 13.5 17.0COLUMBIA, SC 5,142 3 46.5 20.9 13.3 4,840 1 40.0 33.3 18.4COLUMBUS, GA-AL 1,559 0 30.5 18.0 10.1 1,647 0 33.6 21.8 11.8COLUMBUS, OH 21,115 13 45.6 18.2 17.9 14,284 9 50.3 22.1 23.6CORPUS CHRISTI, TX 1,796 2 29.8 23.9 5.0 1,403 3 30.0 35.5 3.6CUMBERLAND, MD-WV 417 0 30.4 11.8 10.0 298 0 33.6 12.1 12.4DALLAS, TX 34,412 57 49.9 21.0 28.9 25,094 43 48.3 21.7 28.0DANBURY, CT 2,822 0 59.6 22.2 25.7 1,652 0 56.2 21.7 20.9DANVILLE, VA 467 0 35.8 19.1 11.9 418 0 33.2 29.1 9.8DAVENPORT-MOLINE-ROCK ISLAND, IA-IL 3,455 1 43.1 18.9 13.4 4,032 0 44.9 20.8 19.1DAYTON-SPRINGFIELD, OH 10,475 3 48.3 20.4 19.0 8,391 2 56.0 24.5 27.7DAYTONA BEACH, FL 4,765 0 42.4 10.3 14.7 5,813 2 38.3 12.8 13.1DECATUR, AL 1,046 0 37.4 24.1 10.9 1,040 0 42.4 22.7 13.2DECATUR, IL 675 1 48.7 15.7 13.3 709 0 38.5 17.8 11.8DENVER, CO 43,585 34 57.3 24.8 25.9 28,500 18 56.8 24.6 22.9DES MOINES, IA 5,664 4 53.7 19.9 27.4 5,108 0 47.5 17.5 17.3DETROIT, MI 82,021 26 48.6 17.7 18.5 47,439 9 52.5 20.3 21.3DOTHAN, AL 783 0 36.1 12.6 10.9 696 2 49.8 11.0 34.1DOVER, DE 939 0 38.8 19.6 9.3 615 0 43.8 17.8 13.3DUBUQUE, IA 940 0 50.7 13.3 18.1 791 0 52.3 15.9 20.9
U. S. Department of Housing and Urban Development, Office of Policy Development and Research. March, 2002

MSA Single-Family Multifamily Single-Family MultifamilyNumber of Properties
Fannie Mae Freddie MacNumber of PropertiesLow-Mod Special Affordable
PercentPercentGeo-Targeted
PercentGeo-Targeted
PercentPercentSpecial Affordable Low-Mod
Percent
DULUTH-SUPERIOR, MN-WI 1,790 0 37.6 15.9 11.3 1,819 2 45.2 17.8 14.6DUTCHESS COUNTY, NY 2,310 0 38.4 20.9 11.7 1,999 2 44.5 21.9 13.6EAU CLAIRE, WI 823 0 44.4 19.7 13.3 1,347 0 43.8 23.8 13.7EL PASO, TX 2,503 3 43.7 44.4 9.3 1,949 2 33.0 45.0 5.8ELKHART-GOSHEN, IN 2,112 0 52.6 9.9 17.9 1,398 0 56.3 7.6 20.7ELMIRA, NY 178 0 29.1 12.6 13.0 458 0 27.1 9.8 6.5ENID, OK 211 0 29.1 14.4 15.3 158 0 35.1 13.6 12.3ERIE, PA 1,091 0 30.9 14.7 9.6 1,496 1 34.0 14.7 10.6EUGENE-SPRINGFIELD, OR 4,220 5 43.4 29.5 12.3 3,777 7 54.2 26.6 10.0EVANSVILLE-HENDERSON, IN-KY 1,352 4 60.3 40.0 39.1 4,313 0 48.5 16.9 22.6FARGO-MOORHEAD, ND-MN 1,144 3 38.1 23.8 12.2 1,129 5 58.1 25.8 33.9FAYETTEVILLE-SPRINGDALE-ROGERS, AR 1,379 0 37.1 13.8 10.8 1,387 2 38.4 19.5 13.2FAYETTEVILLE, NC 3,900 0 32.2 45.4 8.3 1,372 2 36.3 58.2 6.7FITCHBURG-LEOMINSTER, MA 1,354 1 47.9 15.9 16.3 906 0 49.3 13.4 19.2FLAGSTAFF, AZ-UT 1,812 0 36.8 16.8 9.1 1,304 0 37.5 36.7 10.9FLINT, MI 6,451 1 43.8 11.3 15.6 3,460 0 46.4 10.3 16.4FLORENCE, AL 750 1 44.2 13.1 24.0 719 0 35.5 21.1 9.2FLORENCE, SC 913 0 32.0 29.9 9.2 851 2 51.4 22.1 18.8FORT COLLINS-LOVELAND, CO 5,860 1 47.8 26.6 16.4 3,614 0 51.2 27.6 17.1FORT LAUDERDALE, FL 19,858 10 49.3 17.1 16.5 18,789 31 53.8 26.0 20.8FORT MYERS-CAPE CORAL, FL 5,221 1 49.4 16.9 21.2 6,027 3 41.9 18.9 13.4FORT PIERCE-PORT ST. LUCIE, FL 2,550 1 47.2 6.9 21.2 3,419 0 39.3 10.6 14.2FORT SMITH, AR-OK 1,262 0 28.1 15.3 6.9 728 1 30.5 20.2 6.8FORT WALTON BEACH, FL 1,549 0 36.3 23.0 12.9 1,604 0 35.6 20.3 13.9FORT WAYNE, IN 5,931 1 48.8 18.2 19.2 4,202 1 53.4 16.0 19.2FORT WORTH-ARLINGTON, TX 14,944 49 67.5 17.5 48.0 10,495 10 44.4 26.3 20.3FRESNO, CA 5,499 3 29.6 38.5 8.6 5,376 4 28.9 34.8 8.4GADSDEN, AL 444 0 29.6 14.9 6.5 678 0 29.6 11.5 8.5GAINESVILLE, FL 1,712 1 44.0 14.5 9.8 1,695 0 27.5 16.7 9.4GALVESTON-TEXAS CITY, TX 2,284 5 59.2 17.9 41.1 1,904 4 37.1 31.5 22.4GARY, IN 5,919 1 47.5 14.0 19.3 4,701 2 55.4 13.0 19.8GLENS FALLS, NY 609 0 33.5 18.6 11.0 366 0 47.1 21.5 18.3GOLDSBORO, NC 599 0 35.6 28.4 11.2 484 0 29.4 23.0 9.2GRAND FORKS, ND-MN 505 0 26.1 15.7 6.2 367 1 45.2 9.2 7.4GRAND JUNCTION, CO 1,883 0 40.6 33.1 11.7 1,759 0 42.5 32.9 10.5GRAND RAPIDS-MUSKEGON-HOLLAND, MI 18,316 10 51.8 17.1 22.7 11,229 1 51.4 17.5 18.5GREAT FALLS, MT 609 0 36.8 20.1 13.1 604 0 40.4 16.6 12.6GREELEY, CO 3,624 1 39.2 20.4 10.3 1,973 0 39.6 24.4 11.1GREEN BAY, WI 3,164 0 47.5 17.8 17.3 2,440 0 51.9 20.5 21.2GREENSBORO--WINSTON-SALEM--HIGH POINT, NC 11,468 4 44.0 22.5 18.1 10,992 5 38.6 20.2 12.8GREENVILLE-SPARTANBURG-ANDERSON, SC 1,038 0 44.8 16.7 16.4 1,034 0 48.1 15.5 11.0GREENVILLE, NC 9,590 2 36.7 27.8 10.9 7,865 5 31.9 24.3 9.5HAGERSTOWN, MD 816 0 39.5 11.3 14.6 728 1 35.3 13.8 11.5HAMILTON-MIDDLETOWN, OH 4,925 3 46.9 17.0 21.0 4,347 1 45.3 16.0 18.7HARRISBURG-LEBANON-CARLISLE, PA 6,042 1 41.7 16.3 10.9 3,948 2 47.2 17.1 16.6
U. S. Department of Housing and Urban Development, Office of Policy Development and Research. March, 2002

MSA Single-Family Multifamily Single-Family MultifamilyNumber of Properties
Fannie Mae Freddie MacNumber of PropertiesLow-Mod Special Affordable
PercentPercentGeo-Targeted
PercentGeo-Targeted
PercentPercentSpecial Affordable Low-Mod
Percent
HARTFORD, CT 8,719 1 45.0 16.3 17.5 7,367 11 52.4 15.4 18.1HATTIESBURG, MS 1,076 0 24.2 11.4 5.5 478 0 34.6 10.2 8.5HICKORY-MORGANTON-LENOIR, NC 3,225 0 43.4 11.9 11.9 3,145 0 37.1 11.8 10.9HONOLULU, HI 8,255 0 42.9 58.2 14.8 2,450 1 44.1 58.1 12.3HOUMA, LA 1,791 0 19.6 32.5 5.1 415 1 52.2 21.9 5.3HOUSTON, TX 35,950 40 47.6 32.7 25.8 25,787 52 47.1 37.4 24.5HUNTINGTON-ASHLAND, WV-KY-OH 1,516 0 23.0 18.6 5.8 1,370 0 24.9 23.4 8.3HUNTSVILLE, AL 3,452 1 43.7 24.4 20.0 2,459 0 43.4 36.7 17.3INDIANAPOLIS, IN 25,455 7 46.3 18.4 19.5 13,325 6 50.8 21.1 22.0IOWA CITY, IA 1,134 0 42.2 20.0 13.6 1,162 0 44.8 23.4 14.5JACKSON, MI 2,036 1 50.6 23.2 25.3 1,591 1 45.7 13.0 15.7JACKSON, MS 3,994 3 37.5 19.6 12.2 1,413 3 43.1 21.5 12.7JACKSON, TN 745 0 30.3 20.5 8.6 647 0 31.2 17.8 9.6JACKSONVILLE, FL 8,901 7 50.8 14.4 19.7 10,876 10 40.8 18.5 16.6JACKSONVILLE, NC 705 0 29.0 19.6 6.9 660 0 19.1 21.6 5.0JAMESTOWN, NY 380 0 34.3 6.2 8.5 454 0 32.5 8.4 9.6JANESVILLE-BELOIT, WI 1,737 0 53.2 20.5 19.1 1,333 0 50.4 19.9 19.2JERSEY CITY, NJ (PMSA) 2,687 1 39.6 66.8 10.0 1,692 8 38.3 60.4 8.5JOHNSON CITY-KINGSPORT-BRISTOL, TN-VA 2,267 0 32.1 21.1 10.0 2,323 0 27.9 26.9 9.0JOHNSTOWN, PA 409 0 18.7 13.4 3.4 583 0 29.0 14.7 6.2JONESBORO, AR 513 0 28.6 9.8 7.1 413 0 32.3 20.7 8.0JOPLIN, MO 1,300 1 41.3 15.8 16.1 871 4 35.8 9.8 11.1KALAMAZOO-BATTLE CREEK, MI 5,507 1 39.2 19.3 15.3 3,847 0 42.2 22.2 16.2KANKAKEE, IL 379 0 44.4 12.5 18.7 892 0 43.9 8.3 15.5KANSAS CITY, MO-KS 20,835 11 48.9 18.5 21.2 16,376 13 48.5 17.7 18.1KENOSHA, WI 2,135 0 41.7 11.5 13.7 1,350 1 47.0 12.6 13.9KILLEEN-TEMPLE, TX 1,005 0 27.2 21.0 6.8 630 1 29.8 22.7 4.6KNOXVILLE, TN 6,118 1 38.2 17.3 14.8 4,529 4 44.8 23.1 20.7KOKOMO, IN 1,211 0 47.9 26.9 18.4 977 0 50.4 24.6 20.3LA CROSSE, WI-MN 1,143 0 44.0 16.6 14.5 1,060 0 45.5 16.8 14.8LAFAYETTE, IN 2,396 1 51.2 8.8 27.1 1,124 1 52.6 20.7 26.6LAFAYETTE, LA 1,942 1 20.7 22.8 5.0 1,418 1 18.5 20.1 4.8LAKE CHARLES, LA 1,601 0 25.3 21.6 7.5 540 1 39.9 29.1 9.8LAKELAND-WINTER HAVEN, FL 2,712 0 43.6 10.8 14.9 3,361 1 36.9 24.7 17.6LANCASTER, PA 3,698 0 40.4 8.3 10.4 3,230 0 42.5 7.9 12.9LANSING-EAST LANSING, MI 6,794 3 48.2 17.1 15.9 4,260 0 46.1 16.8 14.9LAREDO, TX 495 0 18.3 43.6 6.2 273 0 16.5 58.3 6.3LAS CRUCES, NM 949 1 38.1 68.2 19.5 840 1 29.0 57.4 6.2LAS VEGAS, NV-AZ 18,807 16 52.6 15.5 14.9 15,443 15 52.3 19.7 15.2LAWRENCE, KS 1,383 0 46.0 28.4 13.4 886 3 61.9 16.2 19.9LAWRENCE, MA-NH (PMSA) 6,177 0 33.5 12.4 12.0 3,933 1 47.4 17.8 18.6LAWTON, OK 498 1 45.5 21.7 34.3 237 0 29.8 36.2 8.1LEWISTON-AUBURN, ME 578 0 32.2 9.3 7.8 437 0 38.3 11.2 10.5LEXINGTON, KY 4,780 9 50.0 26.3 18.8 5,469 4 43.5 25.8 18.6LIMA, OH 1,260 0 45.0 12.7 15.3 1,290 0 42.9 7.2 13.8
U. S. Department of Housing and Urban Development, Office of Policy Development and Research. March, 2002

MSA Single-Family Multifamily Single-Family MultifamilyNumber of Properties
Fannie Mae Freddie MacNumber of PropertiesLow-Mod Special Affordable
PercentPercentGeo-Targeted
PercentGeo-Targeted
PercentPercentSpecial Affordable Low-Mod
Percent
LINCOLN, NE 3,158 0 43.8 15.6 15.1 1,962 7 56.8 23.6 22.5LITTLE ROCK-NORTH LITTLE ROCK, AR 5,717 4 38.6 10.7 19.9 2,783 2 45.7 10.3 17.0LONGVIEW-MARSHALL, TX 1,096 0 28.9 23.6 7.8 542 3 28.1 18.5 6.5LOS ANGELES-LONG BEACH, CA 76,983 131 37.0 43.9 10.5 54,487 65 37.6 39.6 10.3LOUISVILLE, KY-IN 12,004 5 45.8 21.8 19.3 12,974 5 47.3 21.4 21.8LOWELL, MA-NH 4,366 1 47.1 12.6 15.8 3,181 1 48.6 15.3 16.1LUBBOCK, TX 1,546 1 31.9 13.4 8.3 1,124 1 21.6 22.1 6.7LYNCHBURG, VA 1,423 0 39.1 12.0 12.9 1,290 0 36.0 9.7 9.7MACON, GA 2,584 0 32.5 14.0 10.1 2,280 1 41.1 19.8 11.0MADISON, WI 5,124 5 57.9 31.7 29.7 4,020 2 54.0 25.4 21.7MANCHESTER, NH 2,822 3 42.4 16.0 17.9 1,782 1 40.4 18.4 16.0MANSFIELD, OH 1,573 1 45.0 21.8 13.5 974 0 48.0 23.1 17.4MCALLEN-EDINBURG-MISSION, TX 1,292 0 13.4 41.5 2.9 1,590 0 9.3 60.2 2.5MEDFORD-ASHLAND, OR 2,327 2 46.6 32.4 8.8 1,897 0 45.2 30.8 12.7MELBOURNE-TITUSVILLE-PALM BAY, FL 4,891 5 53.1 19.5 18.5 5,173 1 42.8 22.4 18.1MEMPHIS, TN-AR-MS 8,497 5 39.2 12.8 17.7 5,369 17 47.5 21.2 16.2MERCED, CA 1,256 2 42.1 71.4 13.7 1,117 0 33.7 66.9 10.1MIAMI, FL 20,407 10 42.7 40.3 8.5 15,982 11 34.2 43.4 7.9MIDDLESEX-SOMERSET-HUNTERDON, NJ 12,179 5 54.9 23.0 16.2 9,194 6 54.1 19.0 19.5MILWAUKEE-WAUKESHA, WI 20,125 5 46.1 12.9 16.4 10,282 6 49.5 15.4 19.1MINNEAPOLIS-ST. PAUL, MN-WI 43,455 32 55.5 20.9 23.4 40,659 26 56.3 20.9 22.0MISSOULA, MT 1,249 1 40.5 26.7 18.1 904 0 40.8 25.2 15.2MOBILE, AL 5,041 5 46.2 7.0 26.2 3,566 2 42.6 8.6 8.1MODESTO, CA 3,583 1 38.1 32.2 12.1 3,469 2 42.6 24.5 11.7MONMOUTH-OCEAN, NJ 13,883 1 39.0 27.8 13.7 9,888 11 41.3 29.6 14.2MONROE, LA 1,381 0 26.2 10.2 7.6 411 1 25.1 10.1 6.1MONTGOMERY, AL 3,064 1 45.4 19.4 24.4 1,344 2 54.5 16.6 10.6MUNCIE, IN 820 0 49.7 24.4 21.4 651 0 48.7 25.0 23.3MYRTLE BEACH, SC 2,981 0 37.3 25.0 10.0 2,847 0 37.4 23.2 10.2NAPLES, FL 3,611 0 54.1 17.2 19.6 4,438 0 49.5 19.2 19.6NASHUA, NH (PMSA) 3,103 0 46.1 21.6 16.1 2,227 1 45.7 26.0 16.3NASHVILLE, TN 12,771 3 47.7 14.8 21.8 10,973 10 44.6 16.7 19.3NASSAU-SUFFOLK, NY 30,083 14 49.3 27.8 15.8 18,796 6 49.8 28.9 14.5NEW BEDFORD, MA 1,545 2 50.7 21.7 13.2 640 0 41.5 21.4 15.8NEW HAVEN-MERIDEN, CT 4,485 1 44.6 19.7 15.3 3,580 9 56.7 34.3 28.8NEW LONDON-NORWICH, CT-RI 2,330 0 43.4 15.8 16.0 1,670 1 48.2 17.7 14.8NEW ORLEANS, LA 12,672 12 38.7 29.9 16.2 5,622 11 43.5 24.4 12.9NEW YORK, NY 44,791 285 43.3 34.3 16.2 24,044 102 38.3 31.4 10.1NEWARK, NJ 15,809 4 42.4 17.9 15.0 12,287 30 49.2 20.8 21.1NEWBURGH, NY-PA 3,561 0 36.2 19.1 10.6 2,610 3 37.9 21.0 11.5NORFOLK-VIRGINIA BEACH-NEWPORT NEWS, VA-NC 11,245 6 44.1 28.0 24.6 8,716 15 52.2 37.6 28.9OAKLAND, CA 31,841 29 50.6 51.6 19.6 26,172 4 47.4 42.7 16.2OCALA, FL 1,897 10 51.1 8.7 5.8 1,852 1 34.0 19.8 8.0ODESSA-MIDLAND, TX 1,382 1 30.0 11.7 17.8 941 0 18.9 20.7 5.7OKLAHOMA CITY, OK 10,685 11 47.4 17.5 25.4 5,499 18 42.6 18.4 20.6
U. S. Department of Housing and Urban Development, Office of Policy Development and Research. March, 2002

MSA Single-Family Multifamily Single-Family MultifamilyNumber of Properties
Fannie Mae Freddie MacNumber of PropertiesLow-Mod Special Affordable
PercentPercentGeo-Targeted
PercentGeo-Targeted
PercentPercentSpecial Affordable Low-Mod
Percent
OLYMPIA, WA 2,847 1 44.9 29.8 9.9 1,921 1 49.8 30.3 13.8OMAHA, NE-IA 7,772 25 63.7 8.6 42.9 5,379 14 52.2 19.7 20.3ORANGE COUNTY, CA 37,809 40 51.4 34.5 19.1 25,722 27 54.7 30.1 16.8ORLANDO, FL 19,871 20 51.1 27.9 17.0 17,374 20 49.8 31.9 15.7OWENSBORO, KY 723 0 38.9 18.7 12.4 937 0 36.9 12.8 12.1PANAMA CITY, FL 1,375 0 32.8 14.5 11.2 1,435 0 37.4 15.8 10.4PARKERSBURG-MARIETTA, WV-OH 574 0 44.0 30.5 18.1 827 0 29.6 20.5 10.5PENSACOLA, FL 3,266 0 36.2 18.6 11.5 3,007 1 33.9 21.8 12.0PEORIA-PEKIN, IL 3,427 0 45.3 17.1 15.7 1,939 2 46.0 15.4 16.6PHILADELPHIA, PA-NJ 42,320 13 39.5 14.8 13.4 29,319 36 46.9 18.2 18.5PHOENIX-MESA, AZ 53,939 31 46.1 25.9 18.3 35,324 27 50.0 24.0 20.0PINE BLUFF, AR 292 0 25.8 14.3 10.3 183 0 25.4 17.8 7.1PITTSBURGH, PA 14,178 10 30.1 14.6 8.4 10,313 4 35.8 15.5 10.0PITTSFIELD, MA 450 0 39.4 10.8 8.6 182 0 37.1 8.3 10.4POCATELLO, ID 842 0 45.6 29.2 16.8 599 0 47.3 31.5 19.3PORTLAND-VANCOUVER, OR-WA 3,703 5 47.8 27.0 16.8 2,350 1 50.0 25.3 17.2PORTLAND, ME 27,712 25 40.7 22.9 16.5 24,814 11 42.3 16.0 11.7PORTSMOUTH-ROCHESTER, NH-ME 3,695 0 35.3 9.7 8.9 2,078 0 36.2 10.5 9.5PROVIDENCE-FALL RIVER-WARWICK, RI-MA 12,094 7 42.6 18.1 15.4 6,244 4 48.3 15.6 14.8PROVO-OREM, UT 5,004 1 37.5 18.2 8.0 4,813 3 42.9 15.5 10.3PUEBLO, CO 2,019 0 34.1 31.4 10.0 1,223 0 39.9 35.2 12.5PUNTA GORDA, FL 1,546 1 53.1 14.5 14.4 1,653 0 42.1 18.9 14.8RACINE, WI 2,225 1 50.1 19.9 22.3 1,910 0 49.4 15.1 16.9RALEIGH-DURHAM-CHAPEL HILL, NC 15,642 24 61.2 16.0 17.5 13,609 14 49.3 22.5 16.7RAPID CITY, SD 765 0 30.9 20.3 13.4 505 0 32.3 15.8 9.3READING, PA 3,648 0 38.6 7.1 10.7 2,026 2 45.2 6.6 20.6REDDING, CA 1,534 0 31.9 17.6 8.9 1,763 0 36.1 15.9 10.7RENO, NV 4,117 5 56.0 23.4 23.7 4,123 6 51.9 16.7 15.5RICHLAND-KENNEWICK-PASCO, WA 1,639 1 37.0 17.4 18.3 1,471 0 48.0 29.6 17.9RICHMOND-PETERSBURG, VA 10,341 12 59.7 17.4 29.5 8,034 2 45.1 21.9 20.0RIVERSIDE-SAN BERNARDINO, CA 32,695 23 37.2 36.1 9.8 23,706 15 37.6 36.6 11.5ROANOKE, VA 2,059 0 43.2 15.4 15.1 2,105 1 46.3 20.3 17.4ROCHESTER, MN 1,316 0 54.9 23.7 24.2 2,014 0 57.3 21.9 23.7ROCHESTER, NY 7,029 3 42.8 14.3 13.3 6,176 7 45.4 16.4 14.8ROCKFORD, IL 4,921 0 45.9 16.0 17.0 5,392 1 48.9 15.2 18.3ROCKY MOUNT, NC 736 1 51.4 32.7 10.4 1,016 0 29.3 40.1 9.0SACRAMENTO, CA 23,376 19 44.7 24.4 17.0 17,388 6 43.8 25.1 17.3SAGINAW-BAY CITY-MIDLAND, MI 4,211 2 50.2 24.0 22.7 2,347 2 53.6 15.4 15.2SALEM, OR 1,481 3 39.0 12.7 9.9 1,667 1 45.6 12.2 9.3SALINAS, CA 812 0 32.6 56.8 9.4 778 0 42.3 60.4 10.4SALT LAKE CITY-OGDEN, UT 34,345 12 48.8 24.2 18.3 25,201 4 51.7 22.2 19.1SAN ANGELO, TX 3,842 0 46.9 16.2 5.4 3,542 8 31.8 24.4 12.4SAN ANTONIO, TX 3,628 0 44.3 38.6 19.1 3,035 5 40.8 42.5 16.9SAN DIEGO, CA 19,968 3 37.0 29.9 11.6 16,359 5 37.7 27.2 11.4SAN FRANCISCO, CA 495 1 51.2 55.0 14.5 359 0 61.8 60.7 13.5
U. S. Department of Housing and Urban Development, Office of Policy Development and Research. March, 2002

MSA Single-Family Multifamily Single-Family MultifamilyNumber of Properties
Fannie Mae Freddie MacNumber of PropertiesLow-Mod Special Affordable
PercentPercentGeo-Targeted
PercentGeo-Targeted
PercentPercentSpecial Affordable Low-Mod
Percent
SAN JOSE, CA 9,102 17 60.6 64.9 20.7 6,730 13 64.0 63.0 24.7SAN LUIS OBISPO-ATASCADERO-PASO ROBLES, CA 15,969 16 34.7 21.6 8.1 10,986 17 36.2 20.8 10.5SANTA BARBARA-SANTA MARIA-LOMPOC, CA 20,936 19 44.5 39.0 13.4 15,122 9 43.0 31.3 15.0SANTA CRUZ-WATSONVILLE, CA 7,600 0 38.5 42.3 11.3 5,628 0 44.9 42.4 13.1SANTA FE, NM 3,729 3 59.9 61.1 42.0 3,354 0 54.4 71.6 19.3SANTA ROSA, CA 3,734 10 43.9 21.3 10.1 2,565 1 39.9 17.6 10.2SARASOTA-BRADENTON, FL 3,284 1 51.0 13.4 17.0 3,168 1 49.7 18.4 16.3SAVANNAH, GA 2,355 5 45.4 13.3 8.4 1,541 0 33.3 19.8 10.1SCRANTON--WILKES-BARRE--HAZLETON, PA 7,258 3 39.6 16.3 14.4 6,142 2 38.4 14.0 13.7SEATTLE-BELLEVUE-EVERETT, WA 7,191 2 54.7 36.1 22.1 6,615 7 56.4 33.7 22.0SHARON, PA 2,455 2 26.2 7.8 5.3 2,840 0 30.8 10.8 6.3SHEBOYGAN, WI 2,852 0 51.1 14.0 17.1 2,370 1 56.5 16.7 22.8SHERMAN-DENISON, TX 44,001 63 40.3 9.5 24.8 29,546 26 47.0 7.5 35.3SHREVEPORT-BOSSIER CITY, LA 753 0 34.0 9.6 5.5 356 0 23.0 12.1 8.4SIOUX CITY, IA-NE 1,839 0 50.3 27.5 14.6 1,016 0 41.6 15.3 16.5SIOUX FALLS, SD 874 1 40.2 19.7 12.7 519 1 44.3 24.4 10.8SOUTH BEND, IN 3,355 2 46.6 16.2 21.7 824 1 54.4 15.3 20.3SPOKANE, WA 946 1 41.7 22.5 13.7 410 0 47.5 24.6 18.4SPRINGFIELD, IL 2,138 0 50.2 21.5 17.9 1,374 2 56.5 32.9 30.3SPRINGFIELD, MA 2,693 1 41.0 15.6 9.8 1,767 1 46.3 20.4 15.9SPRINGFIELD, MO 4,911 2 43.4 21.0 17.7 4,214 0 44.4 20.0 16.0ST. CLOUD, MN 2,792 0 50.1 32.0 23.8 1,853 1 44.5 20.3 12.8ST. JOSEPH, MO 2,924 1 36.0 15.6 11.4 3,395 0 40.2 15.1 14.6ST. LOUIS, MO-IL 4,154 1 45.9 17.6 19.5 1,971 1 43.8 20.9 17.0STAMFORD-NORWALK, CT 2,929 1 66.0 58.4 36.6 2,013 1 69.7 53.7 39.1STATE COLLEGE, PA 1,022 0 24.8 34.7 5.1 1,036 2 40.6 30.2 5.6STEUBENVILLE-WEIRTON, OH-WV 538 0 37.8 23.8 10.9 436 0 33.7 19.4 8.3STOCKTON-LODI, CA 4,970 5 34.8 28.6 14.9 4,491 2 38.6 32.5 9.3SUMTER, SC 477 0 33.5 26.2 9.6 412 0 29.6 32.4 8.5SYRACUSE, NY 3,580 1 34.1 14.8 13.0 2,750 1 40.2 15.5 19.3TACOMA, WA 10,067 5 38.6 19.3 12.0 6,781 1 44.3 18.8 12.1TALLAHASSEE, FL 1,856 2 52.1 23.8 32.0 2,525 7 53.2 44.7 30.1TAMPA-ST. PETERSBURG-CLEARWATER, FL 25,950 9 47.5 19.7 17.4 23,011 20 45.0 27.9 16.2TERRE HAUTE, IN 342 0 37.0 19.7 11.6 1,266 0 41.1 16.2 16.2TEXARKANA, TX-TEXARKANA, AR 560 0 20.2 20.3 5.1 251 0 29.4 22.6 6.4TOLEDO, OH 9,101 2 43.8 16.4 15.6 4,865 7 51.1 15.3 21.9TOPEKA, KS 1,297 2 47.8 13.6 17.0 999 3 66.5 7.1 19.1TRENTON, NJ 2,990 0 39.3 13.2 13.2 2,063 4 56.6 34.6 35.7TUCSON, AZ 11,802 11 46.4 21.4 17.4 7,705 6 44.3 23.3 16.1TULSA, OK 7,807 8 43.8 12.6 21.4 4,144 3 41.4 12.5 10.9TUSCALOOSA, AL 1,119 0 33.5 14.4 7.9 1,186 2 46.3 28.8 11.8TYLER, TX 1,128 0 29.6 12.6 7.1 814 0 21.6 17.8 5.4UTICA-ROME, NY 970 1 34.7 15.1 8.3 693 0 38.0 17.4 12.2VALLEJO-FAIRFIELD-NAPA, CA 6,291 8 47.3 37.4 7.5 4,801 0 36.9 37.4 10.5VENTURA, CA 10,798 4 43.9 33.8 14.4 8,408 7 52.1 30.2 15.2
U. S. Department of Housing and Urban Development, Office of Policy Development and Research. March, 2002

MSA Single-Family Multifamily Single-Family MultifamilyNumber of Properties
Fannie Mae Freddie MacNumber of PropertiesLow-Mod Special Affordable
PercentPercentGeo-Targeted
PercentGeo-Targeted
PercentPercentSpecial Affordable Low-Mod
Percent
VICTORIA, TX 252 0 22.5 26.1 10.5 381 1 27.4 33.4 7.3VINELAND-MILLVILLE-BRIDGETON, NJ 625 0 38.0 24.6 11.4 471 1 44.2 25.7 12.9VISALIA-TULARE-PORTERVILLE, CA 2,459 1 31.9 36.0 6.4 2,031 0 30.2 44.9 7.1WACO, TX 1,028 1 44.4 32.2 13.3 854 0 21.3 20.9 5.8WASHINGTON, DC-MD-VA-WV 52,934 49 61.4 34.3 34.8 38,846 55 64.6 38.4 34.8WATERBURY, CT 1,422 0 43.8 9.7 15.7 1,264 2 47.4 9.8 14.3WATERLOO-CEDAR FALLS, IA 1,043 0 44.5 18.8 15.8 1,165 0 51.7 28.9 26.7WAUSAU, WI 1,039 1 54.5 11.1 22.3 983 0 47.0 12.6 15.4WEST PALM BEACH-BOCA RATON, FL 15,301 3 49.8 19.9 19.1 12,785 6 50.8 25.0 20.1WHEELING, WV-OH 490 0 36.1 18.9 10.8 549 0 29.7 18.1 7.5WICHITA FALLS, TX 3,479 3 44.2 16.2 6.1 3,158 2 33.7 21.6 12.8WICHITA, KS 662 1 58.8 12.0 38.2 469 0 51.7 17.6 16.7WILLIAMSPORT, PA 677 0 27.9 19.4 5.5 555 0 31.1 12.4 7.6WILMINGTON-NEWARK, DE-MD 5,913 0 49.1 18.0 16.6 4,735 3 58.6 21.6 28.8WILMINGTON, NC 3,540 1 41.5 18.3 11.7 3,185 1 40.6 22.1 18.8WORCHESTER, MA-CT 5,930 2 41.3 14.8 16.4 3,652 2 43.9 14.0 15.6YAKIMA, WA 1,649 0 33.2 27.4 10.8 1,511 0 42.3 33.9 13.9YOLO, CA 2,038 3 50.1 42.2 31.7 1,341 1 47.0 36.1 11.9YORK, PA 3,969 1 42.8 9.3 11.4 3,108 1 42.3 11.4 11.6YOUNGSTOWN-WARREN, OH 4,939 1 39.7 16.9 10.4 1,936 0 42.9 19.1 14.8YUBA CITY, CA 951 0 28.6 20.5 7.1 1,016 0 30.1 30.5 8.1YUMA, AZ 954 0 29.2 38.1 9.8 748 1 28.4 39.0 9.4
Note: This table gives Low- and Moderate-Income, Geographically Targeted, and Special Affordable percentages based on application of housing goal counting rules to units in properties covered by GSE mortgage purchases in each MSA. The table also gives total numbers of single-family (1- to 4-unit) and multifamily (5 or more unit) properties covered by GSE mortgage purchases in each MSA.The Housing Goals are defined on a national level. The GSEs are not required to meet the Housing Goals in individual MSAs.
U. S. Department of Housing and Urban Development, Office of Policy Development and Research. March, 2002
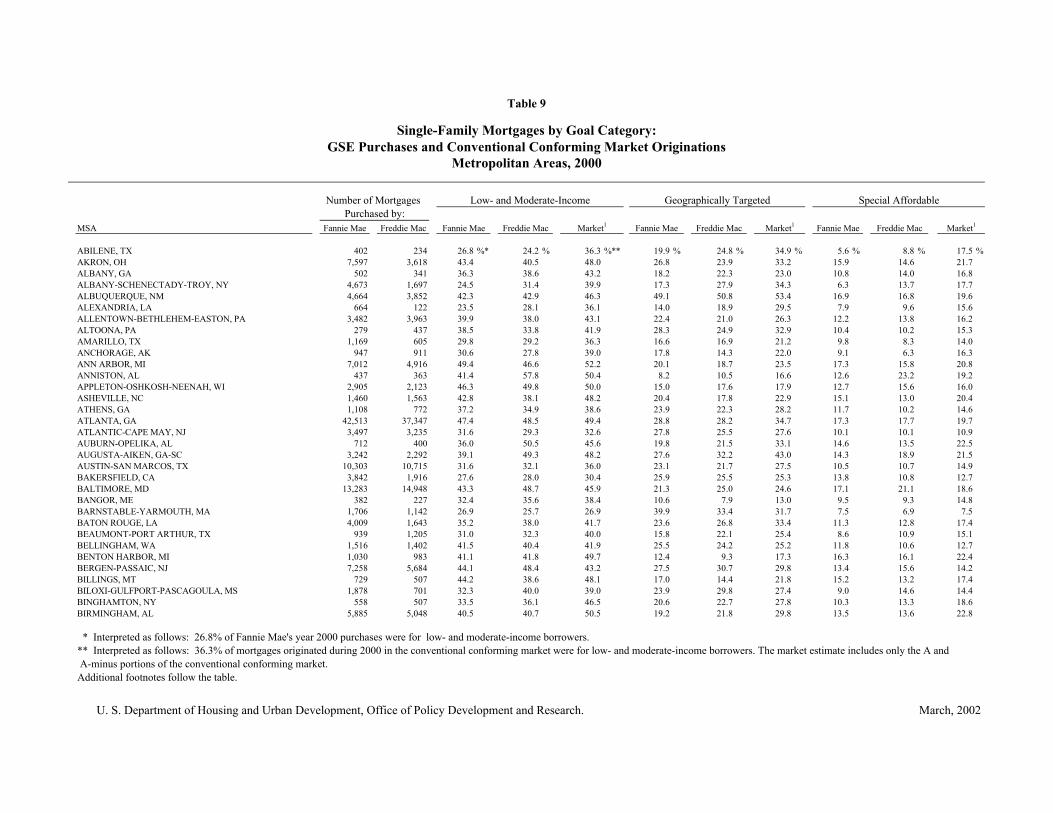
MSA Fannie Mae Freddie Mac
ABILENE, TX 402 234 26.8 %* 24.2 % 36.3 %** 19.9 % 24.8 % 34.9 % 5.6 % 8.8 % 17.5 %AKRON, OH 7,597 3,618 43.4 40.5 48.0 26.8 23.9 33.2 15.9 14.6 21.7ALBANY, GA 502 341 36.3 38.6 43.2 18.2 22.3 23.0 10.8 14.0 16.8ALBANY-SCHENECTADY-TROY, NY 4,673 1,697 24.5 31.4 39.9 17.3 27.9 34.3 6.3 13.7 17.7ALBUQUERQUE, NM 4,664 3,852 42.3 42.9 46.3 49.1 50.8 53.4 16.9 16.8 19.6ALEXANDRIA, LA 664 122 23.5 28.1 36.1 14.0 18.9 29.5 7.9 9.6 15.6ALLENTOWN-BETHLEHEM-EASTON, PA 3,482 3,963 39.9 38.0 43.1 22.4 21.0 26.3 12.2 13.8 16.2ALTOONA, PA 279 437 38.5 33.8 41.9 28.3 24.9 32.9 10.4 10.2 15.3AMARILLO, TX 1,169 605 29.8 29.2 36.3 16.6 16.9 21.2 9.8 8.3 14.0ANCHORAGE, AK 947 911 30.6 27.8 39.0 17.8 14.3 22.0 9.1 6.3 16.3ANN ARBOR, MI 7,012 4,916 49.4 46.6 52.2 20.1 18.7 23.5 17.3 15.8 20.8ANNISTON, AL 437 363 41.4 57.8 50.4 8.2 10.5 16.6 12.6 23.2 19.2APPLETON-OSHKOSH-NEENAH, WI 2,905 2,123 46.3 49.8 50.0 15.0 17.6 17.9 12.7 15.6 16.0ASHEVILLE, NC 1,460 1,563 42.8 38.1 48.2 20.4 17.8 22.9 15.1 13.0 20.4ATHENS, GA 1,108 772 37.2 34.9 38.6 23.9 22.3 28.2 11.7 10.2 14.6ATLANTA, GA 42,513 37,347 47.4 48.5 49.4 28.8 28.2 34.7 17.3 17.7 19.7ATLANTIC-CAPE MAY, NJ 3,497 3,235 31.6 29.3 32.6 27.8 25.5 27.6 10.1 10.1 10.9AUBURN-OPELIKA, AL 712 400 36.0 50.5 45.6 19.8 21.5 33.1 14.6 13.5 22.5AUGUSTA-AIKEN, GA-SC 3,242 2,292 39.1 49.3 48.2 27.6 32.2 43.0 14.3 18.9 21.5AUSTIN-SAN MARCOS, TX 10,303 10,715 31.6 32.1 36.0 23.1 21.7 27.5 10.5 10.7 14.9BAKERSFIELD, CA 3,842 1,916 27.6 28.0 30.4 25.9 25.5 25.3 13.8 10.8 12.7BALTIMORE, MD 13,283 14,948 43.3 48.7 45.9 21.3 25.0 24.6 17.1 21.1 18.6BANGOR, ME 382 227 32.4 35.6 38.4 10.6 7.9 13.0 9.5 9.3 14.8BARNSTABLE-YARMOUTH, MA 1,706 1,142 26.9 25.7 26.9 39.9 33.4 31.7 7.5 6.9 7.5BATON ROUGE, LA 4,009 1,643 35.2 38.0 41.7 23.6 26.8 33.4 11.3 12.8 17.4BEAUMONT-PORT ARTHUR, TX 939 1,205 31.0 32.3 40.0 15.8 22.1 25.4 8.6 10.9 15.1BELLINGHAM, WA 1,516 1,402 41.5 40.4 41.9 25.5 24.2 25.2 11.8 10.6 12.7BENTON HARBOR, MI 1,030 983 41.1 41.8 49.7 12.4 9.3 17.3 16.3 16.1 22.4BERGEN-PASSAIC, NJ 7,258 5,684 44.1 48.4 43.2 27.5 30.7 29.8 13.4 15.6 14.2BILLINGS, MT 729 507 44.2 38.6 48.1 17.0 14.4 21.8 15.2 13.2 17.4BILOXI-GULFPORT-PASCAGOULA, MS 1,878 701 32.3 40.0 39.0 23.9 29.8 27.4 9.0 14.6 14.4BINGHAMTON, NY 558 507 33.5 36.1 46.5 20.6 22.7 27.8 10.3 13.3 18.6BIRMINGHAM, AL 5,885 5,048 40.5 40.7 50.5 19.2 21.8 29.8 13.5 13.6 22.8
* Interpreted as follows: 26.8% of Fannie Mae's year 2000 purchases were for low- and moderate-income borrowers.** Interpreted as follows: 36.3% of mortgages originated during 2000 in the conventional conforming market were for low- and moderate-income borrowers. The market estimate includes only the A and A-minus portions of the conventional conforming market.Additional footnotes follow the table.
Market1
Special Affordable
Fannie Mae Freddie MacMarket1Fannie Mae
Number of Mortgages Low- and Moderate-Income
Table 9
Single-Family Mortgages by Goal Category:GSE Purchases and Conventional Conforming Market Originations
Geographically Targeted
Metropolitan Areas, 2000
Freddie MacPurchased by:
Fannie Mae Freddie Mac Market1
U. S. Department of Housing and Urban Development, Office of Policy Development and Research. March, 2002

MSA Fannie Mae Freddie Mac Market1
Special Affordable
Fannie Mae Freddie MacMarket1Fannie Mae
Number of Mortgages Low- and Moderate-Income Geographically Targeted
Freddie MacPurchased by:
Fannie Mae Freddie Mac Market1
BISMARCK, ND 348 277 33.3 37.3 45.0 23.9 23.1 24.1 11.0 12.7 16.6BLOOMINGTON, IN 960 440 40.4 47.5 48.1 20.1 14.3 20.4 15.1 16.4 19.6BLOOMINGTON-NORMAL, IL 749 1,464 58.4 52.7 55.4 29.8 27.6 32.9 24.1 21.0 24.9BOISE CITY, ID 4,594 3,152 40.9 37.4 44.5 25.6 23.2 29.0 14.9 12.7 18.0BOSTON, MA-NH 28,963 14,648 43.7 40.7 43.9 31.5 31.1 33.8 15.5 12.9 15.6BOULDER-LONGMONT, CO 4,249 2,959 49.9 48.6 51.6 23.5 24.1 24.2 19.3 17.1 19.4BRAZORIA, TX 1,399 1,301 24.5 27.4 34.4 16.2 25.1 22.4 4.7 8.2 12.0BREMERTON, WA 2,215 1,100 34.7 37.9 36.2 16.5 13.6 16.0 9.7 11.4 10.4BRIDGEPORT, CT 3,397 2,542 50.3 55.7 51.7 19.6 22.5 19.5 18.5 19.3 19.3BROCKTON, MA 2,081 1,130 44.7 46.9 42.9 15.5 13.4 16.0 12.8 12.9 13.1BROWNSVILLE-HARLINGEN-SAN BENITO, TX 733 720 18.4 14.8 23.8 48.6 54.6 57.5 5.7 3.9 8.4BRYAN-COLLEGE STATION, TX 592 673 23.9 19.2 26.7 16.6 21.7 25.4 8.7 4.7 9.8BUFFALO-NIAGARA FALLS, NY 6,430 3,309 32.7 34.9 46.0 10.6 15.0 18.5 9.3 11.6 18.6BURLINGTON, VT 1,189 1,210 38.9 38.2 42.7 18.8 17.9 20.7 11.5 10.8 14.3CANTON-MASSILLON, OH 4,493 1,577 48.5 50.2 55.8 18.1 19.8 27.6 16.1 20.0 25.3CASPER, WY 342 250 37.9 36.9 50.1 21.6 24.0 25.8 12.7 13.6 23.2CEDAR RAPIDS, IA 1,710 1,477 52.9 49.4 56.4 17.8 14.7 21.0 20.7 17.2 25.0CHAMPAIGN-URBANA, IL 664 1,162 48.8 49.0 46.8 14.6 14.5 16.7 15.8 17.0 18.5CHARLESTON-NORTH CHARLESTON, SC 4,144 4,351 32.0 31.1 41.1 24.6 30.2 36.4 9.2 8.6 16.2CHARLESTON, WV 997 692 34.9 28.5 43.8 25.6 22.0 32.2 11.0 9.3 18.2CHARLOTTE-GASTONIA-ROCK HILL, NC-SC 11,842 15,116 43.8 44.5 50.4 21.3 20.5 29.1 15.0 16.2 21.6CHARLOTTESVILLE, VA 916 1,652 45.6 45.4 47.6 22.6 21.3 26.2 16.6 17.0 19.7CHATTANOOGA, TN-GA 3,172 1,949 42.9 48.7 52.7 21.9 22.6 33.0 15.1 18.3 23.8CHEYENNE, WY 556 355 36.5 32.5 46.6 21.2 20.0 30.5 13.6 9.7 20.0CHICAGO, IL 66,713 57,419 51.9 50.8 53.0 24.7 21.9 28.3 19.3 18.0 21.0CHICO-PARADISE, CA 1,888 1,125 27.7 26.5 26.6 30.0 29.7 30.0 11.5 8.5 9.3CINCINNATI, OH-KY-IN 16,839 12,029 43.6 45.7 51.5 24.2 21.4 31.4 17.5 16.2 21.8CLARKSVILLE-HOPKINSVILLE, TN-KY 559 627 34.3 47.1 43.1 13.1 16.9 21.6 8.7 17.3 16.5CLEVELAND-LORAIN-ELYRIA, OH 21,913 9,459 49.8 49.4 53.7 21.1 24.6 31.1 18.8 18.9 24.2COLORADO SPRINGS, CO 4,820 4,024 36.0 33.1 36.7 24.6 21.7 28.5 13.2 10.5 13.0COLUMBIA, MO 666 1,266 47.9 50.6 49.2 14.1 16.9 20.7 15.7 19.6 20.6COLUMBIA, SC 3,297 4,606 44.7 45.5 52.1 26.8 27.5 38.1 16.2 17.2 23.7COLUMBUS, GA-AL 1,287 1,197 31.4 44.5 41.0 18.5 23.5 37.0 11.5 15.7 18.8COLUMBUS, OH 11,687 9,324 42.8 45.2 49.5 18.9 21.1 28.0 16.9 18.1 21.7CORPUS CHRISTI, TX 1,266 1,121 19.9 25.1 29.6 26.4 40.6 38.9 5.0 8.9 10.8CORVALLIS, OR 650 401 36.6 35.9 38.3 41.7 36.4 43.5 11.7 12.3 12.2CUMBERLAND, MD-WV 279 197 32.8 33.2 39.6 11.5 10.2 15.9 8.9 9.6 14.5DALLAS, TX 23,198 21,390 33.3 34.6 36.6 17.4 19.1 22.7 11.0 12.4 15.2DANBURY, CT 2,066 1,350 62.7 61.6 63.6 25.5 25.3 25.9 25.8 23.8 27.5DANVILLE, VA 289 231 33.0 36.8 47.7 28.7 22.2 32.0 11.6 12.3 22.7DAVENPORT-MOLINE-ROCK ISLAND, IA-IL 1,712 2,160 47.2 49.0 51.7 22.1 23.9 31.5 19.0 19.4 23.9DAYTON-SPRINGFIELD, OH 6,510 5,993 48.9 51.9 56.8 21.0 21.6 32.7 19.3 22.6 27.5DAYTONA BEACH, FL 5,129 4,374 39.3 43.3 42.5 10.8 12.1 14.4 13.7 16.8 15.5DECATUR, AL 842 502 43.6 47.3 55.9 24.7 24.5 37.0 17.8 18.8 27.1DECATUR, IL 414 473 45.5 50.1 48.3 21.7 27.5 29.9 20.4 21.0 22.3DENVER, CO 28,815 20,448 48.0 44.6 48.0 28.9 26.5 30.9 19.5 16.6 18.8DES MOINES, IA 3,009 3,474 52.5 53.3 55.9 20.7 19.9 23.4 19.6 20.4 24.3
U. S. Department of Housing and Urban Development, Office of Policy Development and Research. March, 2002

MSA Fannie Mae Freddie Mac Market1
Special Affordable
Fannie Mae Freddie MacMarket1Fannie Mae
Number of Mortgages Low- and Moderate-Income Geographically Targeted
Freddie MacPurchased by:
Fannie Mae Freddie Mac Market1
DETROIT, MI 47,259 35,961 50.4 50.1 55.4 23.2 21.5 29.9 19.0 19.0 24.0DOTHAN, AL 469 370 43.8 35.9 50.8 14.1 12.7 22.3 12.1 8.2 24.1DOVER, DE 560 549 36.3 45.8 47.9 20.4 27.0 21.9 10.5 15.7 18.3DUBUQUE, IA 516 353 57.1 58.1 56.1 17.8 18.7 18.4 22.2 17.8 19.3DULUTH-SUPERIOR, MN-WI 1,148 1,157 44.0 45.6 47.1 19.2 21.1 23.9 14.1 15.6 18.3DUTCHESS COUNTY, NY 2,150 1,273 38.8 32.6 39.6 23.9 19.2 22.6 10.2 10.0 11.5EAU CLAIRE, WI 421 1,031 38.5 40.1 44.8 27.3 21.4 29.2 11.5 11.9 17.4EL PASO, TX 1,756 1,661 26.1 35.9 36.1 46.1 52.9 54.9 10.1 16.6 16.0ELKHART-GOSHEN, IN 898 1,472 58.8 54.4 63.0 13.3 9.2 12.7 23.8 17.8 26.2ELMIRA, NY 195 265 39.6 30.6 43.1 12.3 17.4 20.0 10.7 6.5 15.0ENID, OK 164 174 24.0 35.7 44.6 9.1 15.5 29.3 9.3 12.5 22.1ERIE, PA 654 1,021 38.6 35.1 38.5 19.4 18.0 22.3 11.1 10.8 14.0EUGENE-SPRINGFIELD, OR 3,027 2,082 29.8 32.3 32.3 34.5 31.7 35.9 9.1 9.1 9.9EVANSVILLE-HENDERSON, IN-KY 1,948 1,860 44.0 45.3 52.5 18.3 15.6 23.6 16.7 17.4 24.1FARGO-MOORHEAD, ND-MN 589 682 39.5 40.9 44.4 21.9 19.9 24.0 13.2 12.2 16.3FAYETTEVILLE, NC 724 1,352 33.4 33.3 39.7 16.9 18.5 21.3 10.4 11.9 15.3FAYETTEVILLE-SPRINGDALE-ROGERS, AR 2,792 1,232 32.5 25.4 41.4 49.7 51.7 52.1 9.8 7.2 17.8FITCHBURG-LEOMINSTER, MA 865 584 44.3 46.4 43.1 16.2 11.3 13.9 14.5 12.0 13.2FLAGSTAFF, AZ-UT 1,096 902 30.5 25.5 31.6 25.7 28.4 27.8 7.4 7.3 9.8FLINT, MI 4,139 1,991 43.7 47.6 48.7 14.8 14.1 20.8 15.9 17.0 20.9FLORENCE, AL 700 438 41.8 59.8 48.2 16.0 17.6 21.2 13.5 21.6 20.6FLORENCE, SC 759 600 32.6 31.7 53.9 26.9 28.2 48.8 10.7 9.9 27.3FORT COLLINS-LOVELAND, CO 3,759 2,479 40.8 35.8 39.8 29.4 27.4 29.9 13.8 10.6 13.1FORT LAUDERDALE, FL 19,302 13,873 46.4 48.4 45.9 20.7 22.5 23.9 17.7 20.4 18.3FORT MYERS-CAPE CORAL, FL 6,250 5,102 36.6 37.7 36.2 17.3 19.5 21.2 13.1 14.1 13.1FORT PIERCE-PORT ST. LUCIE, FL 2,740 2,419 43.1 46.5 45.9 8.2 11.9 12.1 17.5 18.0 18.5FORT SMITH, AR-OK 897 507 26.0 23.4 38.3 16.7 23.9 32.4 6.1 5.8 14.4FORT WALTON BEACH, FL 1,239 892 31.6 28.9 35.2 17.6 17.2 24.4 13.1 11.3 15.6FORT WAYNE, IN 2,602 3,977 52.9 48.6 56.6 16.6 15.7 26.1 20.3 18.6 25.9FORT WORTH-ARLINGTON, TX 10,339 8,943 38.0 39.0 43.3 23.5 24.1 29.5 12.9 15.1 18.9FRESNO, CA 5,813 2,857 25.5 27.4 24.9 45.0 37.3 40.3 11.1 9.8 8.9GADSDEN, AL 241 475 37.6 36.0 43.9 15.4 16.4 25.2 10.7 12.6 16.0GAINESVILLE, FL 1,279 1,076 32.4 35.0 39.2 19.3 16.3 23.7 10.9 12.5 16.1GALVESTON-TEXAS CITY, TX 1,868 1,503 27.9 26.5 31.6 21.6 20.9 26.2 8.9 10.1 12.2GARY, IN 3,126 3,198 45.8 46.5 47.8 12.0 15.7 19.6 15.8 17.5 19.9GLENS FALLS, NY 948 186 30.7 37.1 39.1 23.2 21.5 24.5 9.5 8.0 11.6GOLDSBORO, NC 214 401 36.3 33.6 50.9 25.2 24.9 35.5 11.8 7.8 20.5GRAND FORKS, ND-MN 226 187 31.3 33.1 42.4 16.4 18.7 20.1 9.0 11.4 17.8GRAND JUNCTION, CO 1,295 1,144 33.7 34.0 36.2 35.5 35.1 37.4 10.4 9.3 11.2GRAND RAPIDS-MUSKEGON-HOLLAND, MI 10,094 10,107 51.6 46.6 56.6 20.8 17.5 25.5 18.5 15.2 23.0GREAT FALLS, MT 283 319 32.6 30.4 35.3 16.6 14.7 20.9 12.2 9.1 13.4GREELEY, CO 2,613 1,636 29.2 25.5 28.7 21.2 21.8 25.6 7.8 7.3 8.7GREEN BAY, WI 1,588 1,703 48.9 51.3 52.3 15.9 17.9 20.7 16.6 17.9 19.3GREENSBORO--WINSTON-SALEM--HIGH POINT, NC 5,901 8,715 43.2 42.7 50.7 22.8 20.4 31.9 15.1 14.8 21.5GREENVILLE, NC 604 780 37.4 30.2 50.9 24.2 22.7 40.4 11.1 8.9 26.2GREENVILLE-SPARTANBURG-ANDERSON, SC 5,013 7,486 44.2 43.4 52.2 19.9 18.3 28.8 15.1 15.0 23.3HAGERSTOWN, MD 453 553 40.4 40.9 40.5 11.0 14.6 16.4 11.5 14.1 12.8HAMILTON-MIDDLETOWN, OH 3,107 2,505 46.6 44.7 49.6 20.9 17.6 27.5 18.7 17.5 22.7
U. S. Department of Housing and Urban Development, Office of Policy Development and Research. March, 2002

MSA Fannie Mae Freddie Mac Market1
Special Affordable
Fannie Mae Freddie MacMarket1Fannie Mae
Number of Mortgages Low- and Moderate-Income Geographically Targeted
Freddie MacPurchased by:
Fannie Mae Freddie Mac Market1
HARRISBURG-LEBANON-CARLISLE, PA 3,093 2,680 46.4 41.5 48.2 20.0 20.0 27.3 14.3 13.0 18.3HARTFORD, CT 6,946 5,947 44.7 46.1 45.7 15.9 16.2 18.0 14.8 15.3 15.3HATTIESBURG, MS 730 232 29.1 21.1 36.8 13.2 16.4 21.8 7.2 7.2 14.7HICKORY-MORGANTON-LENOIR, NC 1,559 2,555 46.0 43.4 53.2 12.9 10.7 15.7 14.4 14.5 20.9HONOLULU, HI 3,965 1,669 42.6 38.8 36.7 65.5 66.6 65.4 15.7 13.9 12.3HOUMA, LA 884 181 29.2 28.8 36.0 33.0 35.9 40.8 7.7 8.2 13.0HOUSTON, TX 27,510 22,365 33.0 37.8 40.9 28.6 31.9 35.5 10.6 15.4 17.6HUNTINGTON-ASHLAND, WV-KY-OH 978 956 33.3 30.1 40.8 24.8 22.1 31.9 11.3 8.3 16.1HUNTSVILLE, AL 2,843 1,724 42.5 53.8 50.9 31.9 30.1 38.1 16.1 21.7 23.7INDIANAPOLIS, IN 13,226 8,777 46.2 43.3 50.9 18.2 18.4 26.8 17.6 16.4 23.0IOWA CITY, IA 734 679 47.4 45.2 50.0 23.0 25.7 28.6 14.3 12.8 18.1JACKSON, MI 1,145 1,330 45.6 43.7 50.8 13.4 12.9 17.2 14.0 13.9 19.1JACKSON, MS 2,658 1,005 43.5 33.7 48.4 24.2 25.3 33.0 19.9 10.5 25.2JACKSON, TN 505 447 31.7 37.5 47.4 17.6 24.4 34.5 7.3 10.2 20.1JACKSONVILLE, FL 8,157 7,373 38.7 40.5 46.8 18.9 19.9 28.2 13.8 15.5 20.3JACKSONVILLE, NC 395 534 24.2 20.3 35.8 18.7 12.9 23.1 6.4 3.0 12.6JAMESTOWN, NY 283 301 30.0 30.4 38.0 8.8 10.3 11.1 5.7 7.7 12.7JANESVILLE-BELOIT, WI 957 893 58.9 54.3 58.0 21.2 21.7 28.2 21.3 20.1 22.7JERSEY CITY, NJ 2,669 1,866 26.1 26.4 28.3 60.7 60.7 63.2 6.0 5.8 6.6JOHNSON CITY-KINGSPORT-BRISTOL, TN-VA 1,621 1,277 39.4 44.1 50.8 23.3 31.1 31.1 13.2 17.6 23.5JOHNSTOWN, PA 366 318 26.1 29.6 34.8 18.6 15.1 21.3 6.5 7.7 11.0JONESBORO, AR 344 166 36.5 32.1 39.8 16.6 12.0 24.4 8.5 10.5 16.8JOPLIN, MO 824 1,593 45.0 40.0 45.7 13.6 12.8 20.7 15.9 14.7 18.0KALAMAZOO-BATTLE CREEK, MI 3,109 3,903 45.3 39.2 48.8 26.3 19.2 32.9 17.4 14.0 22.2KANKAKEE, IL 262 548 51.5 43.6 50.1 12.6 9.7 12.8 16.5 15.0 19.5KANSAS CITY, MO-KS 12,730 11,493 47.1 47.5 49.6 20.1 23.1 27.5 17.5 18.7 21.5KENOSHA, WI 1,353 731 46.7 37.9 43.3 12.1 8.2 15.0 13.7 11.1 14.7KILLEEN-TEMPLE, TX 666 471 21.8 27.9 33.1 23.9 29.3 31.4 5.0 9.7 9.5KNOXVILLE, TN 4,195 2,554 40.3 40.2 52.4 21.9 23.8 32.4 13.7 14.6 26.7KOKOMO, IN 687 764 55.4 50.7 54.4 29.1 27.1 34.9 21.7 20.6 24.5LA CROSSE, WI-MN 582 584 47.0 43.8 48.6 15.6 14.0 18.0 14.6 10.2 17.8LAFAYETTE, LA 1,177 548 25.2 22.9 39.0 24.2 23.9 41.0 8.5 7.5 17.1LAFAYETTE, IN 1,240 632 47.1 51.3 51.1 11.1 17.6 19.7 17.6 22.7 21.9LAKE CHARLES, LA 807 367 33.5 31.3 38.9 23.3 23.4 31.8 12.2 10.5 16.8LAKELAND-WINTER HAVEN, FL 2,405 2,826 41.0 41.7 44.1 14.9 20.9 23.4 14.3 16.3 18.3LANCASTER, PA 2,376 2,533 44.9 45.6 44.1 11.1 10.3 11.4 14.0 13.5 14.2LANSING-EAST LANSING, MI 4,531 2,937 43.2 47.0 52.7 18.4 19.6 25.7 12.6 16.2 19.8LAREDO, TX 279 227 20.5 10.4 31.1 54.1 50.2 60.1 3.5 2.5 12.7LAS CRUCES, NM 1,079 476 20.4 25.6 39.3 63.6 69.3 70.5 6.1 7.8 18.6LAS VEGAS, NV-AZ 16,234 11,955 39.7 37.7 39.2 14.3 15.2 16.8 12.0 12.8 13.0LAWRENCE, KS 800 564 42.6 34.3 38.8 31.8 26.8 33.1 13.5 11.3 12.8LAWRENCE, MA-NH 3,740 2,375 42.7 45.1 45.4 14.8 20.9 21.8 13.8 14.9 16.3LAWTON, OK 256 205 30.6 24.6 40.0 39.5 31.7 40.1 10.3 5.5 15.5LEWISTON-AUBURN, ME 235 283 31.7 28.9 39.0 7.3 9.2 9.1 5.8 5.1 12.1LEXINGTON, KY 2,794 3,557 44.5 38.6 46.0 31.3 27.7 35.9 16.7 14.0 19.9LIMA, OH 768 785 48.6 50.0 49.1 14.6 14.8 19.2 16.4 20.3 19.4LINCOLN, NE 2,437 992 53.5 46.5 53.5 17.1 16.3 24.7 19.7 15.7 22.5LITTLE ROCK-NORTH LITTLE ROCK, AR 3,196 2,494 32.6 33.6 43.2 12.3 15.6 25.1 11.4 12.2 19.8
U. S. Department of Housing and Urban Development, Office of Policy Development and Research. March, 2002

MSA Fannie Mae Freddie Mac Market1
Special Affordable
Fannie Mae Freddie MacMarket1Fannie Mae
Number of Mortgages Low- and Moderate-Income Geographically Targeted
Freddie MacPurchased by:
Fannie Mae Freddie Mac Market1
LONGVIEW-MARSHALL, TX 698 292 24.7 30.4 40.8 16.9 18.5 29.8 5.6 10.7 17.7LOS ANGELES-LONG BEACH, CA 63,729 24,995 28.8 31.9 28.6 47.8 45.3 46.5 9.3 10.3 8.4LOUISVILLE, KY-IN 6,077 8,347 46.8 41.5 49.8 21.9 17.8 30.4 19.2 15.9 22.7LOWELL, MA-NH 2,828 1,883 46.0 47.5 46.6 14.4 16.8 18.2 15.5 15.8 15.7LUBBOCK, TX 1,006 806 23.5 27.2 31.1 14.8 17.1 24.0 6.3 9.8 13.2LYNCHBURG, VA 979 1,268 40.5 41.2 47.4 11.5 12.9 15.8 15.8 12.8 19.0MACON, GA 1,877 1,414 34.2 38.9 45.0 16.5 23.8 30.7 10.8 14.2 20.2MADISON, WI 3,041 2,858 48.3 50.3 51.5 21.0 23.1 24.2 15.1 16.6 17.8MANCHESTER, NH 1,769 1,226 36.2 34.2 40.2 15.5 14.4 20.4 10.0 8.4 12.4MANSFIELD, OH 736 588 50.9 55.3 53.6 27.7 26.4 31.8 19.8 21.7 23.0MCALLEN-EDINBURG-MISSION, TX 834 1,147 13.9 20.0 27.8 44.8 52.8 58.6 2.6 7.1 8.2MEDFORD-ASHLAND, OR 2,090 1,136 27.4 29.3 29.9 29.3 30.9 32.9 7.1 9.0 8.5MELBOURNE-TITUSVILLE-PALM BAY, FL 4,446 3,837 46.2 47.4 45.9 25.3 22.8 26.3 22.1 20.7 20.4MEMPHIS, TN-AR-MS 6,219 3,857 35.1 34.7 45.6 20.9 23.3 34.4 12.8 13.0 21.5MERCED, CA 1,175 776 19.9 24.5 20.8 68.6 71.0 69.3 6.5 7.1 5.2MIAMI, FL 17,009 11,932 32.9 34.1 31.7 42.5 44.7 46.0 9.4 11.2 10.1MIDDLESEX-SOMERSET-HUNTERDON, NJ 8,112 8,629 56.6 58.0 56.0 23.2 25.0 24.1 20.5 22.3 21.0MILWAUKEE-WAUKESHA, WI 9,671 6,641 48.5 48.4 51.4 15.2 16.9 22.8 14.9 17.3 20.2MINNEAPOLIS-ST. PAUL, MN-WI 23,491 29,266 58.9 54.9 58.2 26.2 22.3 27.8 23.2 20.2 23.5MISSOULA, MT 846 402 29.4 31.6 35.8 23.8 23.1 25.1 9.9 10.1 12.8MOBILE, AL 3,431 2,640 33.0 37.7 43.7 8.7 10.5 17.8 10.9 12.5 17.1MODESTO, CA 3,609 2,518 30.3 30.5 28.5 34.2 30.1 34.5 10.0 8.3 8.3MONMOUTH-OCEAN, NJ 9,382 9,184 40.0 43.9 41.1 36.8 37.1 37.6 15.2 17.6 15.9MONROE, LA 888 167 25.0 27.1 33.9 10.4 17.4 22.4 8.6 14.8 15.3MONTGOMERY, AL 1,988 684 43.3 46.4 51.4 21.9 27.2 36.8 15.5 15.7 24.3MUNCIE, IN 435 506 52.7 48.5 51.7 27.8 25.5 34.5 21.4 20.1 24.4MYRTLE BEACH, SC 3,105 2,578 30.5 25.6 37.1 26.0 27.6 29.7 9.1 7.0 13.9NAPLES, FL 3,336 3,739 40.5 42.5 39.9 18.9 20.4 21.9 14.7 15.1 13.5NASHUA, NH 1,932 1,565 46.6 43.7 47.2 22.4 22.6 25.7 14.6 14.4 15.9NASHVILLE, TN 8,791 7,533 49.5 51.1 54.4 16.6 18.3 25.0 19.2 19.8 25.4NASSAU-SUFFOLK, NY 18,312 11,331 50.5 47.2 50.8 34.7 33.4 36.1 16.7 13.0 16.1NEW BEDFORD, MA 922 398 30.9 29.9 30.1 14.3 19.3 19.6 9.3 6.3 8.4NEW HAVEN-MERIDEN, CT 3,877 2,544 43.9 47.7 46.3 20.6 21.7 25.1 15.2 16.9 17.4NEW LONDON-NORWICH, CT-RI 1,771 1,378 39.3 38.6 40.8 15.4 18.4 17.0 13.3 12.9 12.9NEW ORLEANS, LA 7,422 2,646 32.5 32.9 34.5 28.6 31.6 34.3 11.8 12.4 13.7NEW YORK, NY 34,737 15,044 28.7 24.6 31.5 27.8 25.1 30.1 6.5 4.5 7.4NEWARK, NJ 10,304 10,792 44.6 45.3 45.0 21.6 21.1 24.9 14.3 15.5 16.2NEWBURGH, NY-PA 3,129 1,937 32.4 31.1 36.5 25.5 23.2 24.9 7.9 7.7 11.1NORFOLK-VIRGINIA BEACH-NEWPORT NEWS, VA-NC 6,503 8,530 34.2 38.2 39.8 27.4 29.5 33.7 12.9 14.6 15.5OAKLAND, CA 26,185 12,650 42.7 41.9 38.7 52.8 50.8 52.8 15.2 14.0 13.2OCALA, FL 2,128 1,508 35.7 44.8 44.4 27.3 20.2 26.9 10.9 16.4 14.9ODESSA-MIDLAND, TX 646 659 22.7 26.1 36.4 10.5 20.5 28.9 5.1 8.8 19.0OKLAHOMA CITY, OK 7,531 4,590 33.3 33.0 41.3 18.9 20.3 28.8 11.3 12.1 17.3OLYMPIA, WA 2,091 951 35.2 36.4 36.7 34.2 36.6 37.0 9.0 10.5 9.7OMAHA, NE-IA 7,295 3,986 48.2 48.2 51.0 15.5 22.2 27.4 17.7 19.9 23.3ORANGE COUNTY, CA 26,088 12,418 41.5 45.9 39.1 35.2 31.1 33.2 14.0 15.9 12.3ORLANDO, FL 17,507 12,155 38.1 40.6 40.1 30.6 31.6 35.5 13.0 14.8 14.7OWENSBORO, KY 291 859 42.8 43.5 51.7 23.4 18.7 24.8 12.6 14.0 20.0
U. S. Department of Housing and Urban Development, Office of Policy Development and Research. March, 2002

MSA Fannie Mae Freddie Mac Market1
Special Affordable
Fannie Mae Freddie MacMarket1Fannie Mae
Number of Mortgages Low- and Moderate-Income Geographically Targeted
Freddie MacPurchased by:
Fannie Mae Freddie Mac Market1
PANAMA CITY, FL 1,326 618 26.9 31.4 36.9 11.4 14.2 20.2 8.5 10.8 15.3PARKERSBURG-MARIETTA, WV-OH 372 411 42.6 42.1 48.8 29.3 21.9 30.7 21.7 14.4 22.5PENSACOLA, FL 2,649 2,162 34.9 40.9 39.6 16.5 23.3 25.7 12.1 17.2 16.4PEORIA-PEKIN, IL 1,983 1,828 53.2 48.6 53.2 20.1 18.3 22.6 21.7 18.4 22.2PHILADELPHIA, PA-NJ 29,408 26,961 38.7 41.9 43.3 16.3 22.1 24.2 12.8 16.7 18.3PHOENIX-MESA, AZ 30,830 29,181 39.8 41.0 42.3 30.2 31.5 33.3 14.6 16.3 16.4PINE BLUFF, AR 212 180 20.6 27.2 38.4 22.2 25.6 32.5 8.5 9.9 15.4PITTSBURGH, PA 9,090 8,173 34.5 31.1 38.3 18.9 18.5 27.1 11.8 10.4 15.7PITTSFIELD, MA 284 86 37.5 29.6 41.9 10.6 14.0 12.4 14.2 12.3 16.4POCATELLO, ID 659 384 42.1 42.5 48.3 27.8 30.2 29.2 15.4 16.6 19.1PORTLAND, ME 2,115 1,221 34.7 35.5 39.9 19.2 18.3 22.8 10.1 10.8 12.9PORTLAND-VANCOUVER, OR-WA 21,125 12,990 37.0 37.1 38.3 28.9 24.8 28.1 12.2 11.9 13.0PORTSMOUTH-ROCHESTER, NH-ME 2,453 1,418 31.9 30.5 36.9 13.2 11.2 15.3 8.4 7.7 11.1PROVIDENCE-FALL RIVER-WARWICK, RI-MA 8,724 4,955 35.2 36.7 36.8 13.9 15.1 17.2 10.0 9.4 10.9PROVO-OREM, UT 3,299 2,304 32.7 33.3 32.7 15.3 16.8 16.6 5.7 6.4 6.3PUEBLO, CO 1,392 705 29.3 34.1 35.8 35.0 41.7 43.7 10.8 12.8 16.3PUNTA GORDA, FL 2,870 1,339 37.0 38.6 40.2 14.1 20.8 19.1 12.4 14.4 13.6RACINE, WI 1,320 1,035 51.8 48.7 52.9 13.9 18.5 18.3 17.2 18.2 19.7RALEIGH-DURHAM-CHAPEL HILL, NC 8,780 12,290 44.2 46.8 48.5 25.1 25.0 31.6 15.8 16.3 22.2RAPID CITY, SD 436 290 31.6 32.3 44.6 20.9 20.3 32.1 10.5 13.4 22.0READING, PA 2,392 2,336 41.9 40.1 46.8 7.5 9.7 16.3 11.3 14.2 19.6REDDING, CA 1,413 877 26.0 30.1 26.5 21.2 18.6 19.3 10.6 8.5 7.7RENO, NV 3,027 2,576 40.9 42.2 44.5 18.2 18.4 22.8 13.6 14.4 16.9RICHLAND-KENNEWICK-PASCO, WA 1,465 926 34.3 37.1 37.2 21.2 28.7 25.2 11.4 14.7 14.3RICHMOND-PETERSBURG, VA 6,097 8,621 42.9 43.9 47.8 21.3 19.7 27.4 16.6 17.4 20.7RIVERSIDE-SAN BERNARDINO, CA 28,266 14,626 26.1 27.7 26.5 36.3 38.3 39.0 9.0 10.1 8.5ROANOKE, VA 1,159 2,131 45.5 52.1 52.9 19.9 22.9 29.0 16.7 22.2 23.2ROCHESTER, MN 699 1,620 65.2 56.6 61.0 22.6 22.0 25.5 26.1 21.1 26.9ROCHESTER, NY 6,586 3,435 37.5 37.9 48.7 15.3 20.8 22.9 12.3 12.6 19.5ROCKFORD, IL 2,524 3,124 49.2 51.3 52.5 16.2 18.4 21.7 18.2 19.1 21.6ROCKY MOUNT, NC 466 649 44.5 25.4 53.0 46.4 45.6 53.6 15.4 6.1 25.3SACRAMENTO, CA 19,467 10,100 33.2 31.9 31.4 29.9 27.0 29.2 11.7 10.0 10.0SAGINAW-BAY CITY-MIDLAND, MI 2,074 2,354 51.0 46.2 51.4 24.7 20.0 28.3 21.9 17.5 24.9ST. CLOUD, MN 732 1,252 49.6 45.3 49.3 27.7 19.2 23.5 15.8 12.5 16.2ST. JOSEPH, MO 508 497 43.5 43.9 43.9 19.5 18.3 23.5 12.4 17.3 18.7ST. LOUIS, MO-IL 17,988 24,231 47.5 44.8 52.5 22.3 20.9 31.8 17.9 16.8 23.9SALEM, OR 3,163 1,509 31.7 33.4 35.0 13.7 15.1 15.5 9.1 8.5 9.2SALINAS, CA 3,151 1,691 24.6 28.3 24.3 66.0 69.6 70.8 6.8 7.5 6.4SALT LAKE CITY-OGDEN, UT 12,868 6,375 46.4 44.0 46.4 22.4 23.1 24.7 15.0 14.1 16.2SAN ANGELO, TX 304 288 26.0 35.5 37.1 24.0 32.3 37.2 6.5 10.7 13.1SAN ANTONIO, TX 6,054 5,102 21.8 26.1 33.3 22.5 29.6 33.3 5.8 9.6 13.8SAN DIEGO, CA 31,151 12,473 30.2 31.0 27.1 36.1 34.2 36.2 10.0 10.2 8.0SAN FRANCISCO, CA 10,080 4,666 45.8 44.5 37.7 57.4 51.2 54.1 16.2 14.0 12.1SAN JOSE, CA 11,440 5,237 57.8 59.2 52.7 68.4 67.2 69.6 23.2 22.8 20.7SAN LUIS OBISPO-ATASCADERO-PASO ROBLES, CA 3,266 1,627 23.5 24.6 22.6 23.6 21.5 24.5 6.5 6.5 4.6SANTA BARBARA-SANTA MARIA-LOMPOC, CA 2,830 1,183 30.7 35.0 33.1 37.3 32.0 36.1 10.8 12.7 11.5SANTA CRUZ-WATSONVILLE, CA 2,186 1,287 33.6 35.9 33.2 46.7 46.0 48.2 9.4 11.1 10.3SANTA FE, NM 1,437 926 42.0 47.5 46.3 59.9 70.4 63.3 16.9 19.6 21.1
U. S. Department of Housing and Urban Development, Office of Policy Development and Research. March, 2002

MSA Fannie Mae Freddie Mac Market1
Special Affordable
Fannie Mae Freddie MacMarket1Fannie Mae
Number of Mortgages Low- and Moderate-Income Geographically Targeted
Freddie MacPurchased by:
Fannie Mae Freddie Mac Market1
SANTA ROSA, CA 6,490 3,100 33.2 32.4 30.6 22.1 22.5 23.9 9.0 7.3 6.9SARASOTA-BRADENTON, FL 7,987 4,821 39.6 38.5 38.1 15.7 15.2 18.8 14.5 14.1 14.2SAVANNAH, GA 1,978 2,147 34.2 33.3 39.9 17.6 20.0 28.0 10.6 11.1 15.6SCRANTON--WILKES-BARRE--HAZLETON, PA 4,345 1,696 45.0 37.3 43.4 17.8 14.3 20.2 14.5 12.2 15.5SEATTLE-BELLEVUE-EVERETT, WA 28,229 13,948 48.4 47.7 46.8 33.2 33.7 34.0 16.3 14.9 15.2SHARON, PA 572 366 31.9 33.7 39.7 10.5 10.7 14.1 9.4 9.7 13.3SHEBOYGAN, WI 720 609 49.2 48.6 54.2 12.9 16.3 20.3 12.8 14.5 20.1SHERMAN-DENISON, TX 630 384 25.3 22.6 32.7 11.3 13.0 13.4 6.3 6.5 12.2SHREVEPORT-BOSSIER CITY, LA 1,887 486 25.2 32.9 37.1 10.4 18.9 26.0 7.6 13.0 16.6SIOUX CITY, IA-NE 678 231 50.0 41.4 47.6 21.8 26.4 29.2 19.4 14.1 19.5SIOUX FALLS, SD 1,299 780 40.6 34.2 48.4 20.9 15.6 27.0 12.0 10.4 17.0SOUTH BEND, IN 1,412 2,080 52.7 47.2 56.3 24.9 18.8 32.1 22.5 17.4 27.5SPOKANE, WA 4,344 1,676 38.2 39.7 41.7 29.4 28.4 28.5 14.6 16.6 17.0SPRINGFIELD, IL 1,639 1,340 53.7 51.2 55.3 19.3 19.0 27.0 20.9 18.1 24.3SPRINGFIELD, MO 1,776 2,979 45.7 45.7 48.2 18.8 20.5 27.8 15.4 16.8 20.1SPRINGFIELD, MA 2,403 1,144 38.3 43.7 41.8 16.8 22.3 22.1 11.1 11.5 13.3STAMFORD-NORWALK, CT 2,420 1,921 69.4 75.0 68.4 65.0 61.6 62.0 39.5 41.4 37.3STATE COLLEGE, PA 413 631 32.6 27.0 35.5 37.5 40.9 44.3 7.3 8.2 11.4STEUBENVILLE-WEIRTON, OH-WV 453 293 40.6 41.6 45.3 24.7 22.2 31.6 12.6 13.3 16.5STOCKTON-LODI, CA 4,937 3,256 24.3 27.4 22.9 33.8 35.1 35.3 8.2 10.8 7.7SUMTER, SC 285 312 40.1 28.6 50.9 34.4 38.1 52.8 17.2 10.4 26.4SYRACUSE, NY 3,875 1,583 30.9 34.4 42.1 13.3 21.0 23.4 8.4 10.0 15.6TACOMA, WA 7,765 3,835 32.8 34.8 34.6 22.8 19.9 23.4 8.7 9.1 9.1TALLAHASSEE, FL 1,318 1,384 40.6 42.0 47.1 33.2 33.7 42.1 14.6 17.2 22.7TAMPA-ST. PETERSBURG-CLEARWATER, FL 22,341 19,323 39.4 44.0 43.3 26.3 27.2 31.5 16.0 19.1 19.2TERRE HAUTE, IN 835 635 36.4 47.9 50.2 15.9 17.5 26.4 15.8 20.6 22.6TEXARKANA, TX-TEXARKANA, AR 319 158 24.9 33.3 38.8 16.6 23.4 34.4 7.3 6.3 17.5TOLEDO, OH 6,855 4,273 51.2 46.3 54.1 20.4 16.0 24.9 20.9 16.7 24.7TOPEKA, KS 820 613 56.1 46.8 52.7 16.1 14.5 23.8 25.2 16.2 23.0TRENTON, NJ 2,234 2,060 47.9 49.3 49.1 17.9 23.6 25.2 17.6 21.2 22.2TUCSON, AZ 7,190 6,717 35.0 38.6 40.3 21.0 22.4 27.5 12.4 14.8 16.2TULSA, OK 4,950 3,933 32.9 29.2 39.3 17.6 17.0 28.3 10.6 9.9 16.8TUSCALOOSA, AL 914 729 34.1 38.7 46.3 18.6 18.1 21.9 12.0 11.4 21.5TYLER, TX 621 732 31.5 35.9 42.9 11.3 20.5 23.5 7.2 12.7 16.1UTICA-ROME, NY 949 494 29.8 37.7 40.6 14.2 15.2 19.1 7.1 11.1 13.8VALLEJO-FAIRFIELD-NAPA, CA 5,962 2,856 27.5 28.1 25.2 41.7 43.6 43.7 7.2 7.6 5.6VENTURA, CA 7,988 3,733 41.6 41.8 41.8 40.6 37.2 41.2 14.9 12.8 14.4VICTORIA, TX 117 202 30.0 26.1 36.9 35.0 42.6 41.4 7.3 7.9 15.7VINELAND-MILLVILLE-BRIDGETON, NJ 476 377 42.5 46.5 44.5 26.7 27.6 29.3 14.5 13.2 16.7VISALIA-TULARE-PORTERVILLE, CA 2,183 967 24.3 29.3 26.6 51.1 52.1 49.6 11.6 9.7 10.2WACO, TX 762 508 30.2 25.8 36.1 13.0 21.9 26.6 9.0 10.6 16.1WASHINGTON, DC-MD-VA-WV 35,374 37,095 54.8 60.4 54.5 35.6 37.5 36.5 21.7 25.6 22.4WATERBURY, CT 1,225 821 43.2 46.9 47.7 9.1 12.4 12.8 16.5 17.9 17.0WATERLOO-CEDAR FALLS, IA 511 769 47.2 49.0 51.3 30.3 33.0 33.6 19.6 24.3 25.4WAUSAU, WI 467 508 45.0 47.8 52.7 13.5 14.8 15.8 9.4 12.4 17.2WEST PALM BEACH-BOCA RATON, FL 14,526 9,364 47.2 49.0 46.0 24.0 26.4 26.2 19.9 22.0 18.8WHEELING, WV-OH 352 284 34.4 36.7 41.9 23.3 23.9 26.4 10.9 11.4 15.0WICHITA, KS 4,279 2,579 50.9 49.2 31.2 17.0 18.2 21.6 19.5 19.3 10.3
U. S. Department of Housing and Urban Development, Office of Policy Development and Research. March, 2002

MSA Fannie Mae Freddie Mac Market1
Special Affordable
Fannie Mae Freddie MacMarket1Fannie Mae
Number of Mortgages Low- and Moderate-Income Geographically Targeted
Freddie MacPurchased by:
Fannie Mae Freddie Mac Market1
WICHITA FALLS, TX 483 208 23.8 29.3 54.8 15.1 22.1 26.1 7.6 7.3 24.5WILLIAMSPORT, PA 309 290 34.8 33.8 39.7 18.4 20.7 26.1 7.5 10.7 13.0WILMINGTON-NEWARK, DE-MD 4,103 3,983 53.7 56.4 59.3 22.3 21.3 27.7 22.3 22.7 27.9WILMINGTON, NC 2,128 2,581 34.6 33.1 38.9 26.8 30.5 36.1 10.7 11.7 16.6WORCHESTER, MA-CT 3,577 2,284 38.2 36.6 39.6 10.9 12.4 14.7 11.3 9.9 11.6YAKIMA, WA 1,441 749 32.8 40.5 37.4 36.2 45.0 38.7 11.5 16.7 14.0YOLO, CA 1,414 662 32.7 34.0 34.2 30.0 30.5 35.1 12.0 12.3 11.3YORK, PA 2,183 2,394 46.6 40.9 42.6 12.4 11.1 14.1 12.9 12.7 13.3YOUNGSTOWN-WARREN, OH 6,337 2,200 38.0 47.5 48.8 15.3 21.2 26.3 11.4 20.1 20.0YUBA CITY, CA 713 550 26.2 29.2 26.8 30.9 28.4 30.1 11.6 11.6 8.7YUMA, AZ 621 474 35.4 31.1 36.8 38.6 38.6 45.6 17.9 12.9 16.9
Notes: The GSE percentages are derived from the GSE Public Use Database. The GSE data include all single-family loans purchased in metropolitan areas in 2000, regardless of year of origination. The market percentages are derived from HMDA data on mortgages originated in metropolitan areas in 2000. The "Market" is defined as the conventional conforming market for home purchase andrefinance loans. Thus it includes all conventional loans except "jumbo" loans above the conforming loan limit, which was $252,700 in 2000. Mortgages with a loan amount greater than six times borrowerincome are excluded for purposes of the low- and moderate-income and special affordable analyses. Because missing value percentages differ between GSE and HMDA data, mortgages with missing data are excluded from both the GSE and market analyses. Neither HMDA data nor the GSE data available at the MSA level include the number of units in the property; therefore, the analysis is based on numbers of mortgages for 1 to 4-family owner-occupied and investor properties, even though official goal performance is based on numbers of units. In both the GSE and market analyses, mortgages classified as special affordable include mortgages from very-low-income borrowers and low-income borrowers living in low-income census tracts. The Housing Goals are defined on a national level. The GSEs are not required to meet the Housing Goals in individual MSAs.
1 HMDA-based market shares have been adjusted to exclude the B&C portion of the subprime market. It should be recognized that there exists some uncertainty regarding the number of B&C loans in the HMDA data. The adjustment assumes that the B&C loans represent one-half of the subprime market; for further discussion, see Harold, L. Bunce, The GSEs' Funding of Affordable Loans: A 1999 Update , Working Paper HF-012, Office of Policy Development and Research, December 2000.
U. S. Department of Housing and Urban Development, Office of Policy Development and Research. March, 2002

Table 10a-2000
Loan-to-Value Characteristics of Fannie Mae's Purchases, 2000
Loan-to-Value Ratio
90% < LTV 80% < LTVHome Purchase LTV >95% < 95% < 90% LTV < 80% Total 1
All Loans 51,855 219,891 189,021 711,178 1,171,9454.4 % 18.8 % 16.1 % 60.7 % 100.0 %
Very- Low-Income 10,181 20,329 16,471 73,449 120,430 Borrower Loans 8.5 % 16.9 % 13.7 % 61.0 % 100.0 %
Less- Than-Median 31,257 86,756 67,833 243,084 428,930 Income Borrower Loans 7.3 % 20.2 % 15.8 % 56.7 % 100.0 %
All Other LoansAll Loans 5,967 9,019 64,112 444,385 523,483
1.1 % 1.7 % 12.2 % 84.9 % 100.0 %
Very- Low-Income 47 528 5,565 59,900 66,040 Borrower Loans 0.1 % 0.8 % 8.4 % 90.7 % 100.0 %
Less- Than-Median 124 2,598 24,181 181,172 208,075 Income Borrower Loans 0.1 % 1.2 % 11.6 % 87.1 % 100.0 %
Entries include all owner-occupied one-unit mortgages purchased by Fannie Mae in 2000. The data are adjusted for participation percent and REMIC weight.1 Excludes loans missing LTV information.
U.S. Department of Housing and Urban Development, Office of Policy Development and Research. March, 2002

Table 10b-2000
Loan-to-Value Characteristics of Freddie Mac's Purchases, 2000
Loan-to-Value Ratio
90% < LTV 80% < LTVHome Purchase LTV >95% < 95% < 90% LTV < 80% Total 1
All Loans 54,543 181,996 136,968 525,454 898,9616.1 % 20.2 % 15.2 % 58.5 % 100.0 %
Very- Low-Income 12,601 17,109 12,687 56,968 99,365 Borrower Loans 12.7 % 17.2 % 12.8 % 57.3 % 100.0 %
Less- Than-Median 36,241 69,836 49,605 184,632 340,314 Income Borrower Loans 10.6 % 20.5 % 14.6 % 54.3 % 100.0 %
All Other LoansAll Loans 2,324 10,453 61,051 376,222 450,050
0.5 % 2.3 % 13.6 % 83.6 % 100.0 %
Very- Low-Income 87 947 6,651 54,998 62,683 Borrower Loans 0.1 % 1.5 % 10.6 % 87.7 % 100.0 %
Less- Than-Median 276 3,901 25,362 158,540 188,079 Income Borrower Loans 0.1 % 2.1 % 13.5 % 84.3 % 100.0 %
Entries include all owner-occupied one-unit mortgages purchased by Freddie Mac in 2000. The data are adjusted for participation percent and REMIC weight.1 Excludes loans missing LTV information.
U.S. Department of Housing and Urban Development, Office of Policy Development and Research. March, 2002

Table 10a-1999
Loan-to-Value Characteristics of Fannie Mae's Purchases, 1999
Loan-to-Value Ratio
90% < LTV 80% < LTVHome Purchase LTV >95% < 95% < 90% LTV < 80% Total 1
All Loans 48,337 253,117 189,471 629,425 1,120,3504.3 % 22.6 % 16.9 % 56.2 % 100.0 %
Very- Low-Income 8,353 21,551 16,958 68,343 115,205 Borrower Loans 7.3 % 18.7 % 14.7 % 59.3 % 100.0 %
Less- Than-Median 29,419 95,399 69,841 226,715 421,374 Income Borrower Loans 7.0 % 22.6 % 16.6 % 53.8 % 100.0 %
All Other LoansAll Loans 18,284 19,967 155,865 1,177,267 1,371,383
1.3 % 1.5 % 11.4 % 85.8 % 100.0 %
Very- Low-Income 1,608 1,394 10,738 119,955 133,695 Borrower Loans 1.2 % 1.0 % 8.0 % 89.7 % 100.0 %
Less- Than-Median 7,293 6,869 54,979 428,367 497,508 Income Borrower Loans 1.5 % 1.4 % 11.1 % 86.1 % 100.0 %
Entries include all owner-occupied one-unit mortgages purchased by Fannie Mae in 1999. The data are adjusted for participation percent and REMIC weight.1 Excludes loans missing LTV information.
U.S. Department of Housing and Urban Development, Office of Policy Development and Research. March, 2002

Table 10b-1999
Loan-to-Value Characteristics of Freddie Mac's Purchases, 1999
Loan-to-Value Ratio
90% < LTV 80% < LTVHome Purchase LTV >95% < 95% < 90% LTV < 80% Total 1
All Loans 43,601 184,971 137,117 474,156 839,8455.2 % 22.0 % 16.3 % 56.5 % 100.0 %
Very- Low-Income 5,706 14,985 11,381 51,043 83,115 Borrower Loans 6.9 % 18.0 % 13.7 % 61.4 % 100.0 %
Less- Than-Median 20,672 68,758 47,228 165,898 302,556 Income Borrower Loans 6.8 % 22.7 % 15.6 % 54.8 % 100.0 %
All Other LoansAll Loans 427 12,427 125,938 981,513 1,120,305
0.0 % 1.1 % 11.2 % 87.6 % 100.0 %
Very- Low-Income 43 856 9,551 110,104 120,554 Borrower Loans 0.0 % 0.7 % 7.9 % 91.3 % 100.0 %
Less- Than-Median 126 3,663 45,815 377,479 427,083 Income Borrower Loans 0.0 % 0.9 % 10.7 % 88.4 % 100.0 %
Entries include all owner-occupied one-unit mortgages purchased by Freddie Mac in 1999. The data are adjusted for participation percent and REMIC weight.1 Excludes loans missing LTV information.
U.S. Department of Housing and Urban Development, Office of Policy Development and Research. March, 2002

Table 11a-2000
Loan-to-Value Characteristics of Fannie Mae's Purchases in Underserved Areas, 2000
Loan-to-Value Ratio
Home Purchase
All Loans 51,855 219,891 189,021 711,178 1,171,9454.4 % 18.8 % 16.1 % 60.7 % 100.0 %
Loans in Underserved Areas 19,487 61,285 50,362 155,943 287,0776.8 % 21.3 % 17.5 % 54.3 % 100.0 %
Very- Low-Income 5,303 9,105 6,296 23,115 43,819 Borrower Loans 12.1 % 20.8 % 14.4 % 52.8 % 100.0 %
Less- Than-Median 13,341 29,845 20,682 64,442 128,310 Income Borrower Loans 10.4 % 23.3 % 16.1 % 50.2 % 100.0 %
All Other LoansAll Loans 5,967 9,019 64,112 444,385 523,483
1.1 % 1.7 % 12.2 % 84.9 % 100.0 %
Loans in Underserved Areas 1,671 2,876 21,572 135,702 161,8211.0 % 1.8 % 13.3 % 83.9 % 100.0 %
Very- Low-Income 25 254 2,772 25,575 28,626 Borrower Loans 0.1 % 0.9 % 9.7 % 89.3 % 100.0 %
Less- Than-Median 51 1,015 9,670 65,860 76,596 Income Borrower Loans 0.1 % 1.3 % 12.6 % 86.0 % 100.0 %
Entries include all owner-occupied one-unit mortgages purchased by Fannie Mae in underserved areas (both metropolitan and non-metropolitan) in 1999. The data are adjusted for participation percent and REMIC weight.1 Excludes loans missing LTV information.
Total 190% < LTV 80% < LTV
LTV >95% < 95% < 90% LTV < 80%
U.S. Department of Housing and Urban Development, Office of Policy Development and Research. March, 2002

Table 11b-2000
Loan-to-Value Characteristics of Freddie Mac's Purchases in Underserved Areas, 2000
Loan-to-Value Ratio
Home Purchase
All Loans 54,543 181,996 136,968 525,454 898,9616.1 % 20.2 % 15.2 % 58.5 % 100.0 %
Loans in Underserved Areas 21,807 50,322 34,243 104,431 210,80310.3 % 23.9 % 16.2 % 49.5 % 100.0 %
Very- Low-Income 6,541 7,927 4,985 17,240 36,693 Borrower Loans 17.8 % 21.6 % 13.6 % 47.0 % 100.0 %
Less- Than-Median 15,390 15,854 9,970 34,480 75,694 Income Borrower Loans 20.3 % 20.9 % 13.2 % 45.6 % 100.0 %
All Other LoansAll Loans 2,324 10,453 61,051 376,222 450,050
0.5 % 2.3 % 13.6 % 83.6 % 100.0 %
Loans in Underserved Areas 1,008 3,793 22,226 117,272 144,2990.7 % 2.6 % 15.4 % 81.3 % 100.0 %
Very- Low-Income 48 515 3,588 25,300 29,451 Borrower Loans 0.2 % 1.7 % 12.2 % 85.9 % 100.0 %
Less- Than-Median 145 1,748 11,160 60,877 73,930 Income Borrower Loans 0.2 % 2.4 % 15.1 % 82.3 % 100.0 %
Entries include all owner-occupied one-unit mortgages purchased by Fannie Mae in underserved areas (both metropolitan and non-metropolitan) in 1999. The data are adjusted for participation percent and REMIC weight.1 Excludes loans missing LTV information.
Total 190% < LTV 80% < LTV
LTV >95% < 95% < 90% LTV < 80%
U.S. Department of Housing and Urban Development, Office of Policy Development and Research. March, 2002

Table 11a-1999
Loan-to-Value Characteristics of Fannie Mae's Purchases in Underserved Areas, 1999
Loan-to-Value Ratio
Home Purchase
All Loans 48,337 253,117 189,471 629,425 1,120,3504.3 % 22.6 % 16.9 % 56.2 % 100.0 %
Loans in Underserved Areas 16,248 64,062 45,125 122,571 248,0066.6 % 25.8 % 18.2 % 49.4 % 100.0 %
Very- Low-Income 4,056 9,406 6,767 20,099 40,328 Borrower Loans 10.1 % 23.3 % 16.8 % 49.8 % 100.0 %
Less- Than-Median 11,430 31,423 21,009 55,017 118,879 Income Borrower Loans 9.6 % 26.4 % 17.7 % 46.3 % 100.0 %
All Other LoansAll Loans 18,284 19,967 155,865 1,177,267 1,371,383
1.3 % 1.5 % 11.4 % 85.8 % 100.0 %
Loans in Underserved Areas 5,598 5,418 42,924 282,247 336,1871.7 % 1.6 % 12.8 % 84.0 % 100.0 %
Very- Low-Income 903 646 4,836 43,959 50,344 Borrower Loans 1.8 % 1.3 % 9.6 % 87.3 % 100.0 %
Less- Than-Median 2,953 2,514 19,349 130,823 155,639 Income Borrower Loans 1.9 % 1.6 % 12.4 % 84.1 % 100.0 %
Entries include all owner-occupied one-unit mortgages purchased by Fannie Mae in underserved areas (both metropolitan and non-metropolitan) in 1999. The data are adjusted for participation percent and REMIC weight.1 Excludes loans missing LTV information.
Total 190% < LTV 80% < LTV
LTV >95% < 95% < 90% LTV < 80%
U.S. Department of Housing and Urban Development, Office of Policy Development and Research. March, 2002

Table 11b-1999
Loan-to-Value Characteristics of Freddie Mac's Purchases in Underserved Areas, 1999
Loan-to-Value Ratio
Home Purchase
All Loans 43,601 184,971 137,117 474,156 839,8455.2 % 22.0 % 16.3 % 56.5 % 100.0 %
Loans in Underserved Areas 15,317 48,239 34,719 98,621 196,8967.8 % 24.5 % 17.6 % 50.1 % 100.0 %
Very- Low-Income 2,543 6,527 4,497 15,161 28,728 Borrower Loans 8.9 % 22.7 % 15.7 % 52.8 % 100.0 %
Less- Than-Median 7,441 22,516 14,237 41,153 85,347 Income Borrower Loans 8.7 % 26.4 % 16.7 % 48.2 % 100.0 %
All Other LoansAll Loans 427 12,427 125,938 981,513 1,120,305
0.0 % 1.1 % 11.2 % 87.6 % 100.0 %
Loans in Underserved Areas 195 4,018 38,273 258,081 300,5670.1 % 1.3 % 12.7 % 85.9 % 100.0 %
Very- Low-Income 19 413 4,735 42,810 47,977 Borrower Loans 0.0 % 0.9 % 9.9 % 89.2 % 100.0 %
Less- Than-Median 57 1,449 17,340 121,794 140,640 Income Borrower Loans 0.0 % 1.0 % 12.3 % 86.6 % 100.0 %
Entries include all owner-occupied one-unit mortgages purchased by Freddie Mac in underserved areas (both metropolitan and non-metropolitan) in 1999. The data are adjusted for participation percent and REMIC weight.1 Excludes loans missing LTV information.
Total 190% < LTV 80% < LTV
LTV >95% < 95% < 90% LTV < 80%
U. S. Department of Housing and Urban Development, Office of Policy Development and Research. March, 2002

Table 12a-2000
Loan-to-Value Characteristics of GSEs' Conventional Mortgage Purchases
Meets 1 or More Affordable Housing Goals
Fannie Mae
Loan-to-Value Ratio
0% < LTV <= 80% 589,589 70.2% 565,974 66.1% 1,155,563 68.1%
80% < LTV <= 90% 123,899 14.7% 129,234 15.1% 253,133 14.9%
90% < LTV <= 100% 126,553 15.1% 160,179 18.7% 286,732 16.9%
Missing 103 0.0% 909 0.1% 1,012 0.1%
Total 840,144 100.0% 856,296 100.0% 1,696,440 100.0%
Meets 1 or More Affordable Housing Goals
Freddie Mac
Loan-to-Value Ratio
0% < LTV <= 80% 460,573 69.7% 440,540 63.5% 901,113 66.5%
80% < LTV <= 90% 96,344 14.6% 101,010 14.6% 197,354 14.6%
90% < LTV <= 100% 101,365 15.3% 138,651 20.0% 240,016 17.7%
Missing 2,566 0.4% 13,240 1.9% 15,806 1.2%
Total 660,848 100.0% 693,441 100.0% 1,354,289 100.0%
Entries are numbers of owner-occupied one-unit mortgages. The data are adjusted for participation percent and REMIC weight.
Meeting 1 or More Affordable Housing Goals, 2000
No Yes Total
No Yes Total
U.S. Department of Housing and Urban Development, Office of Policy Development and Research. March, 2002

Table 12b-2000
Loan-to-Value Characteristics of GSEs' Purchases of
Meets 1 or More Affordable Housing Goals
Fannie Mae
Loan-to-Value Ratio
0% < LTV <= 80% 392,145 64.7% 319,033 56.2% 711,178 60.6%
80% < LTV <= 90% 95,683 15.8% 93,338 16.5% 189,021 16.1%
90% < LTV <= 100% 117,752 19.4% 153,994 27.1% 271,746 23.2%
Missing 100 0.0% 898 0.2% 998 0.1%
Total 605,680 100.0% 567,263 100.0% 1,172,943 100.0%
Meets 1 or More Affordable Housing Goals
Freddie Mac
Loan-to-Value Ratio
0% < LTV <= 80% 295,571 63.5% 229,352 52.2% 524,923 58.0%
80% < LTV <= 90% 71,389 15.3% 64,970 14.8% 136,359 15.1%
90% < LTV <= 100% 96,692 20.8% 132,448 30.2% 229,140 25.3%
Missing 1,600 0.3% 12,513 2.8% 14,113 1.6%
Total 465,252 100.0% 439,283 100.0% 904,535 100.0%
Entries are numbers of owner-occupied one-unit mortgages. The data are adjusted for participation percent and REMIC weight.
Conventional Home Purchase Mortgages
TotalNo Yes
No Yes Total
Meeting 1 or More Affordable Housing Goals, 2000
U.S. Department of Housing and Urban Development, Office of Policy Development and Research. March, 2002

Table 12a-1999
Loan-to-Value Characteristics of GSEs' Conventional Mortgage Purchases
Meets 1 or More Affordable Housing Goals
Fannie Mae
Loan-to-Value Ratio
0% < LTV <= 80% 939,716 74.4% 844,020 71.4% 1,783,736 72.9%
80% < LTV <= 90% 174,937 13.8% 165,830 14.0% 340,767 13.9%
90% < LTV <= 100% 148,707 11.8% 171,994 14.5% 320,701 13.1%
Missing 119 0.0% 795 0.1% 914 0.0%
Total 1,263,479 100.0% 1,182,639 100.0% 2,446,118 100.0%
Meets 1 or More Affordable Housing Goals
Freddie Mac
Loan-to-Value Ratio
0% < LTV <= 80% 736,523 75.4% 716,345 74.0% 1,452,868 74.7%
80% < LTV <= 90% 132,472 13.6% 129,903 13.4% 262,375 13.5%
90% < LTV <= 100% 107,921 11.0% 121,148 12.5% 229,069 11.8%
Missing 503 0.1% 708 0.1% 1,211 0.1%
Total 977,419 100.0% 968,104 100.0% 1,945,523 100.0%
Entries are numbers of owner-occupied one-unit mortgages. The data are adjusted for participation percent and REMIC weight.
Meeting 1 or More Affordable Housing Goals, 1999
No Yes Total
No Yes Total
U. S. Department of Housing and Urban Development, Office of Policy Development and Research. March, 2002

Table 12b-1999
Loan-to-Value Characteristics of GSEs' Purchases of
Meets 1 or More Affordable Housing Goals
Fannie Mae
Loan-to-Value Ratio
0% < LTV <= 80% 348,964 59.3% 280,461 52.6% 629,425 56.1%
80% < LTV <= 90% 99,708 16.9% 89,763 16.8% 189,471 16.9%
90% < LTV <= 100% 139,688 23.7% 161,765 30.4% 301,453 26.9%
Missing 100 0.0% 774 0.1% 874 0.1%
Total 588,460 100.0% 532,763 100.0% 1,121,223 100.0%
Meets 1 or More Affordable Housing Goals
Freddie Mac
Loan-to-Value Ratio
0% < LTV <= 80% 262,214 60.0% 211,385 54.2% 473,599 57.3%
80% < LTV <= 90% 72,874 16.7% 63,625 16.3% 136,499 16.5%
90% < LTV <= 100% 101,591 23.3% 114,759 29.4% 216,350 26.2%
Missing 232 0.1% 336 0.1% 568 0.1%
Total 436,911 100.0% 390,105 100.0% 827,016 100.0%
Entries are numbers of owner-occupied one-unit mortgages. The data are adjusted for participation percent and REMIC weight.
Conventional Home Purchase Mortgages
TotalNo Yes
No Yes Total
Meeting 1 or More Affordable Housing Goals, 1999
U.S. Department of Housing and Urban Development, Office of Policy Development and Research. March, 2002

Table 13-2000
Loan-to-Value Characteristics of GSEs' Purchases Meeting Housing Goals, 2000
Fannie Mae
Loan-to-Value Ratio
0% < LTV <= 80% 711,178 59.0% 238,394 56.3% 143,493 53.1% 71,551 55.2% 444,385 84.6% 180,060 87.0% 132,257 83.6% 61,208 89.6%
80% < LTV <= 90% 189,021 15.7% 66,609 15.7% 46,889 17.4% 17,156 13.2% 64,112 12.2% 24,129 11.7% 21,417 13.5% 6,458 9.5%
90% < LTV <= 100% 271,746 22.6% 117,497 27.8% 79,465 29.4% 34,272 26.5% 14,986 2.9% 2,718 1.3% 4,531 2.9% 644 0.9%
Missing 32,847 2.7% 819 0.2% 311 0.1% 6,560 5.1% 1,745 0.3% 8 0.0% 7 0.0% 25 0.0%
Total 1,204,792 100.0% 423,319 100.0% 270,158 100.0% 129,539 100.0% 525,228 100.0% 206,915 100.0% 158,212 100.0% 68,335 100.0%
Freddie Mac
Home Purchase
Loan-to-Value Ratio
0% < LTV <= 80% 525,455 56.9% 180,823 52.4% 93,898 47.4% 61,646 52.4% 376,223 83.3% 157,566 84.1% 113,967 81.3% 62,557 86.3%
80% < LTV <= 90% 136,968 14.8% 48,653 14.1% 31,061 15.7% 14,497 12.3% 61,051 13.5% 25,267 13.5% 21,861 15.6% 8,393 11.6%
90% < LTV <= 100% 236,539 25.6% 104,081 30.1% 67,439 34.0% 35,408 30.1% 12,777 2.8% 4,147 2.2% 3,934 2.8% 1,338 1.8%
Missing 24,134 2.6% 11,688 3.4% 5,820 2.9% 6,089 5.2% 1,750 0.4% 425 0.2% 470 0.3% 201 0.3%
Total 923,096 100.0% 345,245 100.0% 198,218 100.0% 117,640 100.0% 451,801 100.0% 187,405 100.0% 140,232 100.0% 72,489 100.0%
Entries are numbers of owner-occupied one-unit mortgages. Missing data for the three goal-qualifying categories are excluded.The data are adjusted for participation percent and REMIC weight.
Low- and
Special Low- and All Other
Special Low- and
AffordableUnderservedAll
Moderate-Income Underserved AffordableAllAll Moderate-Income Underserved Affordable
Home Purchase All Other
All Moderate-Income Underserved AffordableSpecial Special Low- and
Moderate-Income
U. S. Department of Housing and Urban Development, Office of Policy Development and Research. March, 2002

Table 13-1999
Loan-to-Value Characteristics of GSEs' Purchases Meeting Housing Goals, 1999
Fannie Mae
Loan-to-Value Ratio
0% < LTV <= 80% 629,425 53.3% 222,308 53.5% 111,781 47.8% 69,730 54.1% 1,177,267 85.0% 425,704 86.0% 274,619 83.6% 130,887 89.0%
80% < LTV <= 90% 189,471 16.0% 68,282 16.4% 41,833 17.9% 17,808 13.8% 155,865 11.3% 54,900 11.1% 42,741 13.0% 12,985 8.8%
90% < LTV <= 100% 301,453 25.5% 124,443 29.9% 79,993 34.2% 33,832 26.2% 38,251 2.8% 14,155 2.9% 11,011 3.4% 3,186 2.2%
Missing 60,810 5.1% 707 0.2% 331 0.1% 7,559 5.9% 13,998 1.0% 19 0.0% 15 0.0% 52 0.0%
Total 1,181,159 100.0% 415,740 100.0% 233,938 100.0% 128,929 100.0% 1,385,381 100.0% 494,778 100.0% 328,386 100.0% 147,110 100.0%
Freddie Mac
Home Purchase
Loan-to-Value Ratio
0% < LTV <= 80% 474,156 55.9% 162,309 55.0% 88,973 50.1% 55,109 59.0% 981,513 87.6% 375,478 88.3% 251,457 85.6% 125,293 90.4%
80% < LTV <= 90% 137,117 16.2% 46,148 15.6% 31,272 17.6% 13,020 13.9% 125,938 11.2% 45,686 10.7% 37,863 12.9% 12,039 8.7%
90% < LTV <= 100% 228,572 26.9% 86,606 29.3% 57,092 32.2% 24,802 26.6% 12,854 1.1% 3,753 0.9% 4,132 1.4% 1,101 0.8%
Missing 8,767 1.0% 226 0.1% 230 0.1% 466 0.5% 766 0.1% 323 0.1% 188 0.1% 157 0.1%
Total 848,612 100.0% 295,289 100.0% 177,567 100.0% 93,397 100.0% 1,121,071 100.0% 425,240 100.0% 293,640 100.0% 138,590 100.0%
Entries are numbers of owner-occupied one-unit mortgages. Missing data for the three goal-qualifying categories are excluded.The data are adjusted for participation percent and REMIC weight.
Low- and
Special Low- and All Other
Special Low- and
AffordableUnderservedAll
Moderate-Income Underserved AffordableAllAll Moderate-Income Underserved Affordable
Home Purchase All Other
All Moderate-Income Underserved AffordableSpecial Special Low- and
Moderate-Income
U.S. Department of Housing and Urban Development, Office of Policy Development and Research. March, 2002

Table 14a-2000
Loan-to-Value Characteristics of Fannie Mae's Home Purchase Mortgages MeetingHousing Goals
UPBs and Number of Units, 2000
Home Purchase Loans Only*
0% < LTV <= 60%$ UPB (Millions) 4,022 1,937 1,286 13,963 26,287Number of Units 55,338 25,428 21,225 144,301 287,329Portion of Total: 13.1 % 9.4 % 16.4 % 12.0 % 16.6 %
60% < LTV <= 80%$ UPB (Millions) 19,176 13,945 4,286 76,133 112,103Number of Units 183,056 118,065 50,326 566,877 868,234Portion of Total: 43.2 % 43.7 % 38.9 % 47.1 % 50.2 %
80% < LTV <= 90%$ UPB (Millions) 6,914 5,230 1,447 24,202 31,612Number of Units 66,609 46,889 17,156 189,021 253,133Portion of Total: 15.7 % 17.4 % 13.2 % 15.7 % 14.6 %
90% < LTV <= 95%$ UPB (Millions) 8,577 6,508 1,826 27,510 28,476Number of Units 86,254 60,023 23,365 219,891 228,910Portion of Total: 20.4 % 22.2 % 18.0 % 18.3 % 13.2 %
95% < LTV$ UPB (Millions) 2,786 1,829 796 5,586 5,809Number of Units 31,243 19,442 10,907 51,855 57,822Portion of Total: 7.4 % 7.2 % 8.4 % 4.3 % 3.3 %
Missing LTV$ UPB (Millions) 83 25 531 2,597 2,744Number of Units 819 311 6,560 32,847 34,592Portion of Total: 0.2 % 0.1 % 5.1 % 2.7 % 2.0 %
Total$ UPB (Millions) 41,559 29,475 10,172 149,991 207,031Number of Units 423,319 270,158 129,539 1,204,792 1,730,020Portion of Total: 100.0 % 100.0 % 100.0 % 100.0 % 100.0 %
Unit counts exclude 2-4 unit properties. The data are adjusted for participation percent and REMIC weight.* Does not include refinancings, second mortgages, and non-applicable categories.
AcquiredPurchase Purchase Purchase Purchase
TotalModerate-Income Targeted Affordable All Home Mortgages
Qualifying Qualifying Qualifying Low- and Geographically Special
U.S. Department of Housing and Urban Development, Office of Policy Development and Research. March, 2002

Table 14b-2000
Loan-to-Value Characteristics of Freddie Mac's Home Purchase Mortgages MeetingHousing Goals
UPBs and Number of Units, 2000
Home Purchase Loans Only*
0% < LTV <= 60%$ UPB (Millions) 3,285 1,376 1,131 11,360 21,236Number of Units 44,340 16,868 18,861 111,161 234,637Portion of Total: 12.8 % 8.5 % 16.0 % 12.0 % 17.1 %
60% < LTV <= 80%$ UPB (Millions) 13,936 8,702 3,399 55,553 83,543Number of Units 136,483 77,030 42,785 414,294 667,040Portion of Total: 39.5 % 38.9 % 36.4 % 44.9 % 48.5 %
80% < LTV <= 90%$ UPB (Millions) 4,889 3,341 1,121 17,269 24,076Number of Units 48,653 31,061 14,497 136,968 198,019Portion of Total: 14.1 % 15.7 % 12.3 % 14.8 % 14.4 %
90% < LTV <= 95%$ UPB (Millions) 6,683 5,153 1,519 22,446 23,623Number of Units 69,304 48,831 20,570 181,996 192,449Portion of Total: 20.1 % 24.6 % 17.5 % 19.7 % 14.0 %
95% < LTV$ UPB (Millions) 3,098 1,724 1,085 5,301 5,484Number of Units 34,777 18,608 14,838 54,543 56,867Portion of Total: 10.1 % 9.4 % 12.6 % 5.9 % 4.1 %
Missing LTV$ UPB (Millions) 913 427 400 1,669 1,744Number of Units 11,688 5,820 6,089 24,134 25,883Portion of Total: 3.4 % 2.9 % 5.2 % 2.6 % 1.9 %
Total$ UPB (Millions) 32,804 20,723 8,656 113,599 159,706Number of Units 345,245 198,218 117,639 923,095 1,374,895Portion of Total: 100.0 % 100.0 % 100.0 % 100.0 % 100.0 %
Unit counts exclude 2-4 unit properties. The data are adjusted for participation percent and REMIC weight.* Does not include refinancings, second mortgages, and non-applicable categories.
AcquiredPurchase Purchase Purchase Purchase
TotalModerate-Income Targeted Affordable All Home Mortgages
Qualifying Qualifying Qualifying Low- and Geographically Special
U.S. Department of Housing and Urban Development, Office of Policy Development and Research. March, 2002
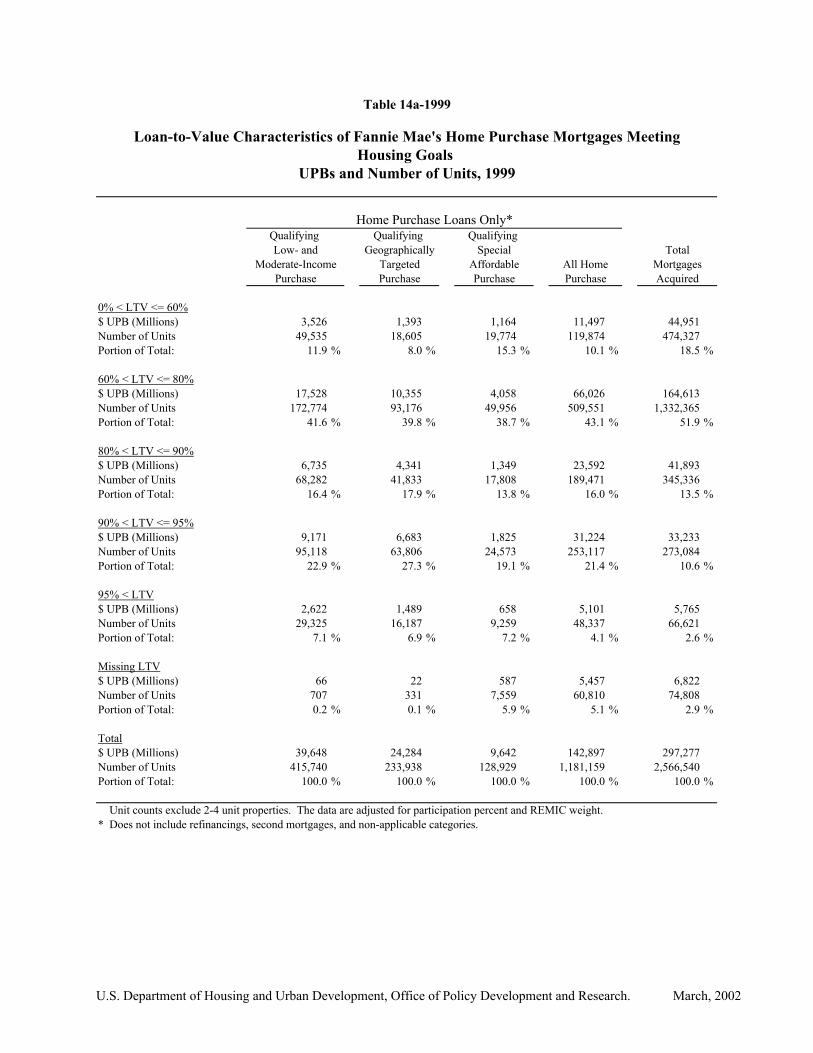
Table 14a-1999
Loan-to-Value Characteristics of Fannie Mae's Home Purchase Mortgages MeetingHousing Goals
UPBs and Number of Units, 1999
Home Purchase Loans Only*
0% < LTV <= 60%$ UPB (Millions) 3,526 1,393 1,164 11,497 44,951Number of Units 49,535 18,605 19,774 119,874 474,327Portion of Total: 11.9 % 8.0 % 15.3 % 10.1 % 18.5 %
60% < LTV <= 80%$ UPB (Millions) 17,528 10,355 4,058 66,026 164,613Number of Units 172,774 93,176 49,956 509,551 1,332,365Portion of Total: 41.6 % 39.8 % 38.7 % 43.1 % 51.9 %
80% < LTV <= 90%$ UPB (Millions) 6,735 4,341 1,349 23,592 41,893Number of Units 68,282 41,833 17,808 189,471 345,336Portion of Total: 16.4 % 17.9 % 13.8 % 16.0 % 13.5 %
90% < LTV <= 95%$ UPB (Millions) 9,171 6,683 1,825 31,224 33,233Number of Units 95,118 63,806 24,573 253,117 273,084Portion of Total: 22.9 % 27.3 % 19.1 % 21.4 % 10.6 %
95% < LTV$ UPB (Millions) 2,622 1,489 658 5,101 5,765Number of Units 29,325 16,187 9,259 48,337 66,621Portion of Total: 7.1 % 6.9 % 7.2 % 4.1 % 2.6 %
Missing LTV$ UPB (Millions) 66 22 587 5,457 6,822Number of Units 707 331 7,559 60,810 74,808Portion of Total: 0.2 % 0.1 % 5.9 % 5.1 % 2.9 %
Total$ UPB (Millions) 39,648 24,284 9,642 142,897 297,277Number of Units 415,740 233,938 128,929 1,181,159 2,566,540Portion of Total: 100.0 % 100.0 % 100.0 % 100.0 % 100.0 %
Unit counts exclude 2-4 unit properties. The data are adjusted for participation percent and REMIC weight.* Does not include refinancings, second mortgages, and non-applicable categories.
AcquiredPurchase Purchase Purchase Purchase
TotalModerate-Income Targeted Affordable All Home Mortgages
Qualifying Qualifying Qualifying Low- and Geographically Special
U.S. Department of Housing and Urban Development, Office of Policy Development and Research. March, 2002

Table 14b-1999
Loan-to-Value Characteristics of Freddie Mac's Home Purchase Mortgages MeetingHousing Goals
UPBs and Number of Units, 1999
Home Purchase Loans Only*
0% < LTV <= 60%$ UPB (Millions) 2,778 1,199 965 9,329 36,572Number of Units 39,569 16,981 16,959 101,915 396,284Portion of Total: 13.4 % 9.6 % 18.2 % 12.0 % 20.1 %
60% < LTV <= 80%$ UPB (Millions) 12,113 7,493 2,960 46,595 126,414Number of Units 122,740 71,992 38,150 372,241 1,059,385Portion of Total: 41.6 % 40.5 % 40.8 % 43.9 % 53.8 %
80% < LTV <= 90%$ UPB (Millions) 4,559 3,167 976 16,517 30,995Number of Units 46,148 31,272 13,020 137,117 263,055Portion of Total: 15.6 % 17.6 % 13.9 % 16.2 % 13.4 %
90% < LTV <= 95%$ UPB (Millions) 6,508 4,828 1,308 22,189 23,534Number of Units 68,393 47,233 18,123 184,971 197,398Portion of Total: 23.2 % 26.6 % 19.4 % 21.8 % 10.0 %
95% < LTV$ UPB (Millions) 1,678 943 474 4,237 4,275Number of Units 18,212 9,859 6,679 43,601 44,028Portion of Total: 6.2 % 5.6 % 7.2 % 5.1 % 2.2 %
Missing LTV$ UPB (Millions) 18 19 26 532 570Number of Units 226 230 466 8,767 9,533Portion of Total: 0.1 % 0.1 % 0.5 % 1.0 % 0.5 %
Total$ UPB (Millions) 27,652 17,650 6,709 99,400 222,361Number of Units 295,289 177,568 93,397 848,612 1,969,683Portion of Total: 100.0 % 100.0 % 100.0 % 100.0 % 100.0 %
Unit counts exclude 2-4 unit properties. The data are adjusted for participation percent and REMIC weight.* Does not include refinancings, second mortgages, and non-applicable categories.
AcquiredPurchase Purchase Purchase Purchase
TotalModerate-Income Targeted Affordable All Home Mortgages
Qualifying Qualifying Qualifying Low- and Geographically Special
U.S. Department of Housing and Urban Development, Office of Policy Development and Research. Mach, 2002

Table 15a
Fannie Mae's Multifamily Mortgage Loan PurchasesUPB, Number of Loans and Number of Units by Acquisition UPB
1993-2000
Acquisition UPB 1993 1994 1995 1996 1997 1998 1999 2000
Less Than or Equal to $500,000 UPB ($ Thousands) 66,248 41,668 604,422 20,937 34,376 895,349 50,302 20,953 Number of Units 3,554 5,471 26,280 2,212 2,358 42,250 3,532 5,512 Number of Loans 267 162 2,310 76 127 4402 177 65
>$500,000 - <= $1M UPB ($ Thousands) 92,924 137,719 503,630 90,220 106,507 540,851 146,981 85,824 Number of Units 5,342 10,129 22,637 7,163 7,648 24,052 10,530 6,678 Number of Loans 125 186 710 116 137 777 165 111
> $1M - <=$2M UPB ($ Thousands) 290,678 470,912 605,971 33,039 402,684 840,226 558,191 314,427 Number of Units 15,808 31,108 27,986 21,984 23,751 38,887 33,659 22,715 Number of Loans 194 315 429 222 262 568 349 208
>$2M - <=$4M UPB ($ Thousands) 1,077,814 1,064,621 957,442 1,133,540 1,184,937 1,798,308 1,302,385 775,443 Number of Units 50,432 61,973 47,776 52,988 51,277 73,102 55,969 38,532 Number of Loans 370 371 336 378 403 613 416 254
Above $4M UPB ($ Thousands) 3,074,792 3,019,673 3,286,749 5,456,078 5,167,878 8,428,387 7,334,698 8,880,864 Number of Units 111,335 112,740 110,678 188,585 168,032 215,106 190,400 216,072 Number of Loans 418 387 378 625 618 887 602 652
Total UPB ($ Thousands) 4,602,457 4,734,593 5,958,215 7,036,813 6,896,382 12,503,120 9,392,557 10,077,511 Number of Units 186,471 221,420 235,357 272,931 253,065 393,397 294,091 289,509 Number of Loans 1,374 1,421 4,163 1,444 1,548 7,247 1,708 1,289
The data are adjusted for participation percent and REMIC weight.
U.S. Department of Housing and Urban Development, Office of Policy Development and Research. March, 2002

Table 15b
Freddie Mac's Multifamily Mortgage Loan PurchasesUPB, Number of Loans and Number of Units by Acquisition UPB
1993-2000
Acquisition UPB 1993 1994 1995 1996 1997 1998 1999 2000
Less Than or Equal to $500,000 UPB ($ Thousands) 2,351 7,037 14,020 6,712 11,633 42,760 11,493 15,265 Number of Units 200 599 1,457 652 1,083 1,240 233 546 Number of Loans 7 16 40 19 33 122 32 44
>$500,000 - <= $1M UPB ($ Thousands) 12,942 20,193 40,916 60,927 75,489 233,331 119,447 74,308 Number of Units 890 1,486 3,072 3,575 3,875 6,163 2,382 2,262 Number of Loans 18 26 55 73 96 309 156 99
> $1M - <=$2M UPB ($ Thousands) 29,191 93,998 139,364 217,546 243,353 802,591 368,341 265,517 Number of Units 1,968 6,146 8,019 10,513 11,200 21,613 10,392 6,850 Number of Loans 20 65 90 145 163 543 251 175
>$2M - <=$4M UPB ($ Thousands) 56,129 248,510 280,813 532,441 584,400 1,889,883 1,004,893 646,868 Number of Units 3,264 13,680 13,146 26,290 22,467 52,299 23,158 17,354 Number of Loans 20 89 96 179 201 652 341 213
Above $4M UPB ($ Thousands) 90,548 543,378 1,107,055 1,532,712 2,285,332 7,157,172 8,318,937 7,750,926 Number of Units 4,472 23,627 42,687 57,544 60,844 140,004 155,327 136,567 Number of Loans 13 77 126 206 243 776 713 605
Total UPB ($ Thousands) 191,161 913,116 1,582,170 2,350,337 3,200,207 10,125,738 9,823,111 8,752,884 Number of Units 10,794 45,538 68,381 98,574 99,470 221,319 191,492 163,580 Number of Loans 78 273 407 622 736 2,402 1,511 1,174
The data are adjusted for participation percent and REMIC weight.
U. S. Department and of Housing and Urban Development, Office of Policy Development and Research. March, 2002

Table 16a
Fannie Mae's Multifamily Mortgage Loan PurchasesUPB, Number of Loans and Number of Units by Purpose of Loan
1993-2000
Loan Purpose 1993 1994 1995 1996 1997 1998 1999 2000
Purchase UPB ($ Thousands) 397,339 148,533 952,488 581,443 657,655 4,140,088 3,723,910 4,945,092 Number of Units 17,243 6,470 28,316 22,370 26,012 136,637 117,615 136,508 Number of Loans 92 47 122 103 176 5,538 783 455
Refinance UPB ($ Thousands) 4,101,706 4,256,774 3,133,361 5,204,544 4,509,816 7,097,885 4,410,796 4,563,019 Number of Units 164,317 196,140 134,330 197,169 161,240 209,808 142,286 136,433 Number of Loans 1,256 1,234 1,067 1,058 906 1,346 839 729
New Construction UPB ($ Thousands) 101,372 329,287 440,932 661,100 1,065,093 779,793 269,228 489,159 Number of Units 4,807 18,810 19,220 34,161 39,313 28,001 8,434 14,234 Number of Loans 25 140 348 192 358 231 68 96
Rehabilitation UPB ($ Thousands) 2,040 9,360 15,351 131,534 48,756 304,526 80,241 Number of Units 104 757 463 5,475 1,890 4,732 2,334 Number of Loans 1 1 3 28 5 13 9
Total UPB ($ Thousands) 4,602,457 4,734,593 5,958,215 7,036,813 6,896,382 12,503,120 9,392,557 9,392,557 Number of Units 186,471 221,420 235,357 272,931 253,065 393,397 294,091 294,091 Number of Loans 1,374 1,421 4,163 1,444 1,548 7,247 1,708 1,708
Adjusted for participation percent and REMIC weight
U. S. Department of Housing and Urban Development, Office of Policy Development and Research. March, 2002

Table 16b
Freddie Mac's Multifamily Mortgage Loan PurchasesUPB, Number of Loans and Number of Units by Purpose of Loan
1993-2000
Loan Purpose 1993 1994 1995 1996 1997 1998 1999 2000
Purchase UPB ($ Thousands) 19,684 190,710 227,501 318,166 312,901 613,417 1,952,720 1,843,836 Number of Units 1,402 9,381 10,099 13,141 12,870 15,493 43,744 38,708 Number of Loans 22 48 52 75 58 75 172 158
Refinance UPB ($ Thousands) 171,477 632,381 1,315,805 1,999,051 2,008,004 3,263,390 5,060,786 3,558,767 Number of Units 9,392 33,503 57,074 84,630 72,900 102,829 129,089 94,200 Number of Loans 56 204 343 540 470 622 659 395
New Construction UPB ($ Thousands) 940 38,863 33,120 34,155 78,945 191,685 492,644 Number of Units 48 1,208 803 884 1,318 2,469 5,647 Number of Loans 1 12 7 10 8 19 37
Rehabilitation UPB ($ Thousands) 9,500 5,725 6,430 Number of Units 328 6,417 331 Number of Loans 1 2 3
Total UPB ($ Thousands) 191,161 833,531 1,582,169 2,350,337 2,355,060 3,961,477 7,205,191 5,901,677 Number of Units 10,794 43,260 68,381 98,574 86,654 126,057 175,302 138,886 Number of Loans 78 254 407 622 538 707 850 593
Adjusted for participation percent and REMIC weight
U. S. Department of Housing and Urban Development, Office of Policy Development and Research. March, 2002

Table 17
GSEs' Multifamily Mortgage Loan PurchasesUPB and Number of Units by Seasoning
1993-2000
Fannie Mae Freddie Mac
Seasoned* Non-Seasoned All Seasoned* Non-Seasoned All1993 Number of Units 23,407 163,065 186,472 10,794 10,794 UPB ($ Thousands) 486,454 4,116,002 4,602,456 191,161 191,161
1994 Number of Units 28,240 193,180 221,420 2,083 43,455 45,538 UPB ($ Thousands) 494,039 4,240,554 4,734,593 71,275 841,841 913,116
1995 Number of Units 78,983 156,374 235,357 6,971 61,410 68,381 UPB ($ Thousands) 1,928,759 4,029,456 5,958,215 145,368 1,436,802 1,582,170
1996 Number of Units 43,294 229,637 272,931 11,343 87,231 98,574 UPB ($ Thousands) 826,651 6,210,162 7,036,813 306,384 2,043,953 2,350,337
1997 Number of Units 16,191 236,874 253,065 16,645 82,825 99,470 UPB ($ Thousands) 415,463 6,480,919 6,896,382 503,449 2,696,758 3,200,207
1998 Number of Units 98,883 294,514 393,397 4,213 217,106 221,319 UPB ($ Thousands) 2,629,702 9,873,418 12,503,120 208,107 9,917,631 10,125,738
1999 Number of Units 16,333 277,758 294,091 6,673 184,819 191,492 UPB ($ Thousands) 544,158 8,848,398 9,392,556 1,867,661 7,955,449 9,823,110
2000 Number of Units 14,751 274,758 289,509 8,668 154,912 163,580 UPB ($ Thousands) 444,701 9,632,810 10,077,511 532,269 8,220,615 8,752,884
The data are adjusted for participation percent and REMIC weight* Loans originated earlier than 12 months prior to purchase.
U. S. Department of Housing and Urban Development, Office of Policy Development and Research. March, 2002

Table 18-2000
Fannie Mae's Multifamily MortgagesMethod of Acquisition
During Calendar Year 2000
TotalLow- And Geographically Special Mortgages
Moderate-Income Targeted Affordable AcquiredMortgages Acquired By:
Cash and Swap$ UPB (Millions) 5,902 2,601 2,645 6,781Number of Units 196,523 87,516 111,821 212,644Percent of Units 92.4% 41.2% 52.6% 100.0%
Other$ UPB (Millions) 2,594 710 1,118 3,296Number of Units 69,887 20,087 35,437 76,865Percent of Units 90.9% 26.1% 46.1% 100.0%
Data are adjusted for participation percent and REMIC weight.
Freddie Mac's Multifamily MortgagesMethod of Acquisition
During Calendar Year 2000
TotalLow- And Geographically Special Mortgages
Moderate-Income Targeted Affordable AcquiredMortgages Acquired By:
Cash and Swap$ UPB (Millions) 3,905 1,119 1,711 4,775Number of Units 109,376 36,614 58,353 118,470Percent of Units 92.3% 30.9% 49.3% 100.0%
Other$ UPB (Millions) 1,655 866 671 2,005Number of Units 41,790 22,144 21,022 45,110Percent of Units 92.6% 49.1% 46.6% 100.0%
Data are adjusted for participation percent and REMIC weight.
U. S. Department of Housing and Urban Development, Office of Policy Development and Research. March, 2002

Table 18-1999
Fannie Mae's Multifamily MortgagesMethod of Acquisition
During Calendar Year 1999
TotalLow- And Geographically Special Mortgages
Moderate-Income Targeted Affordable AcquiredMortgages Acquired By:
Cash and Swap$ UPB (Millions) 5,994 2,480 2,964 6,633Number of Units 210,520 93,020 127,368 226,977Percent of Units 92.7% 41.0% 56.1% 100.0%
Other$ UPB (Millions) 2,198 769 1,074 2,582Number of Units 63,506 17,512 34,556 67,114Percent of Units 94.6% 26.1% 51.5% 100.0%
Data are adjusted for participation percent and REMIC weight.
Freddie Mac's Multifamily MortgagesMethod of Acquisition
During Calendar Year 1999
TotalLow- And Geographically Special Mortgages
Moderate-Income Targeted Affordable AcquiredMortgages Acquired By:
Cash and Swap$ UPB (Millions) 4,875 2,008 1,952 5,994Number of Units 141,285 57,355 70,840 156,960Percent of Units 90.0% 36.5% 45.1% 100.0%
Other$ UPB (Millions) 1,235 356 289 1,627Number of Units 31,132 11,820 12,142 34,532Percent of Units 90.2% 34.2% 35.2% 100.0%
Data are adjusted for participation percent and REMIC weight.
U. S. Department of Housing and Urban Development, Office of Policy Development and Research. March, 2002
Related Documents

![Reverse Mortgage For Home Purchases[1]](https://static.cupdf.com/doc/110x72/545cecccaf7959be0e8b4a03/reverse-mortgage-for-home-purchases1.jpg)