PROFILE ON THE PRODUCTION OF TOMATO SAUCE AND KETCHUP

Welcome message from author
This document is posted to help you gain knowledge. Please leave a comment to let me know what you think about it! Share it to your friends and learn new things together.
Transcript
PROFILE ON THE PRODUCTION OF TOMATO
SAUCE AND KETCHUP
1
Table of Contents I. SUMMARY....................................................................................................................... 2
II. PRODUCT DESCRIPTION AND APPLICATION ......................................................... 2
III. MARKET STUDY AND PLANT CAPACITY ............................................................ 3
IV. MATERIALS AND INPUTS ........................................................................................ 8
V. TECHNOLOGY AND ENGINEERING ........................................................................ 10
VI. HUMAN RESOURCE AND TRAINING REQUIREMENT ..................................... 16
VII. FINANCIAL ANALYSIS .......................................................................................... 17
FINANCIAL ANALYSES SUPPORTING TABLES ........................................................... 24
2
I. SUMMARY
This profile envisages the establishment of a plant for the production of tomato sauce and
ketchup with a capacity of 300 tons per annum. Tomato ketchup is mainly used as an
appetizer during consumption of other food staffs whereas tomato sauce is used for food
coloring, seasoning, soup preparation.
The country`s requirement of tomato sauce and ketchup is met through local production and
import. The present (2012) demand for tomato sauce and ketchup is estimated at 8,799 tons.
The local and export demand for the products is projected to reach 12,481 tones and 15,757
tones by the year 2018 and year 2022, respectively.
The principal raw materials required are fresh wholesome tomato fruit, salt, sugar, vinegar,
spices which are locally available.
The total investment cost of the project including working capital is estimated at Birr 24.514
million. From the total investment cost the highest share (Birr 16.80 million or 68.53%) is
accounted by fixed investment cost followed by initial working capital (Birr 5.19 million or
21.18%) and pre operation cost (Birr 2.52 million or 10.29%). From the total investment cost
Birr 9.89 million or 40.34% is required in foreign currency.
The project is financially viable with an internal rate of return (IRR) of 18.25% and a net
present value (NPV) of Birr 10.24 million, discounted at 10%.
The project can create employment for 34 persons. The establishment of such factory will
have a foreign exchange saving effect to the country by substituting the current imports. The
project will also create backward linkage with the horticulture farming and salt, sugar,
vinegar produces and forward linkage with food processing sub sector and also generates
income for the Government in terms of tax revenue and payroll tax.
II. PRODUCT DESCRIPTION AND APPLICATION
Tomato sauce and ketchup are flavored products processed from sorted, washed and fresh
wholesome tomatoes and hot fruits. Tomatoes are one of the most widely grown vegetable
3
crops which are used in processing of different food products. Tomatoes are valuable sources
of vitamins and minerals. Studies have shown that people who consume large amount of
tomato products may be at or lower risk of especially cancer of prostate gland, lung and
stomach. Thus, tomato sauce and ketchup are produced from fresh and wholesome tomatoes
of intensive red color by washing, crushing into pulp, concentrating and seasoning with
different ingredients and bottling or canning.
Tomato ketchup is mainly used as an appetizer during consumption of other food staffs
whereas tomato sauce is used for food coloring, seasoning, soup preparation and also for
reducing the amount of ground hot pepper in “Wot” (traditional hot sauce) without affecting
the attractive red color of same. Tomato sauce and ketchup are consumed mainly by
households, restaurants, hotels and by public institutions like hospitals, training centers,
boarding schools, orphanages, etc.
III. MARKET STUDY AND PLANT CAPACITY
A. MARKET STUDY
1. Past supply and present Demand
Tomatoes are one of the most widely grown and commercially important vegetable crops and
are valuable sources of food minerals and vitamins, particularly vitamins A and C. Processed
and canned tomato sauces and ketchups are consumed by urban households, restaurants,
hotels, hospitals and the like. The demand for tomato sauce and ketchup in Ethiopia is met
both by domestic production and through import (see table 3.1 & 3.2).

4
Table 3.1
DOMESTIC PRODUCTION OF TOMATO SAUCE AND KETCHUP
Year Production
2000/01 1,730
2001/02 555
2002/03 2,116
2003/04 1,846
2004/05 1,846
2005/06 1,790
2006/07 1,837
2007/08 2,343
2008/09 2,923
2009/10 4,292
Source: - CSA, Large and Medium Scale Manufacturing and Electricity Industries Survey,
Various Issues.
As can be from Table 3.1, production of tomato sauce and ketch up which was 1,730 tons at
the beginning of the period (2001/02) has grown to 4,292 tons at the end of the period
(2009/10). A closer observation at the data set reveals that production of tomato ketchup and
sauce over the study period has shown varying patterns that is, fluctuation (2000/01-
2003/02), almost constant (2003/04- 2006/07) and then moderate rise (2007/08-2009/10). So,
it was found more appropriate to take the average growth of the recent phase (33%) and
apply it on the 2009/10 production in estimating the level of production in 2012.
Accordingly, domestic production of tomato ketchup and sauce for 2012 is estimated at
7,591 tons.
Import of tomato sauce & ketchup covering the period 2001--2011 is shown in Table 3.2.
5
Table 3.2
IMPORT OF TOMATO SAUCE & KETCHUP (TONS)
Year Import
2001 57
2002 235
2003 521
2004 478
2005 841
2006 248
2007 377
2008 44
2009 784
2010 1,365
2011 1,476
Source: - Ethiopian Revenue and Customs Authority.
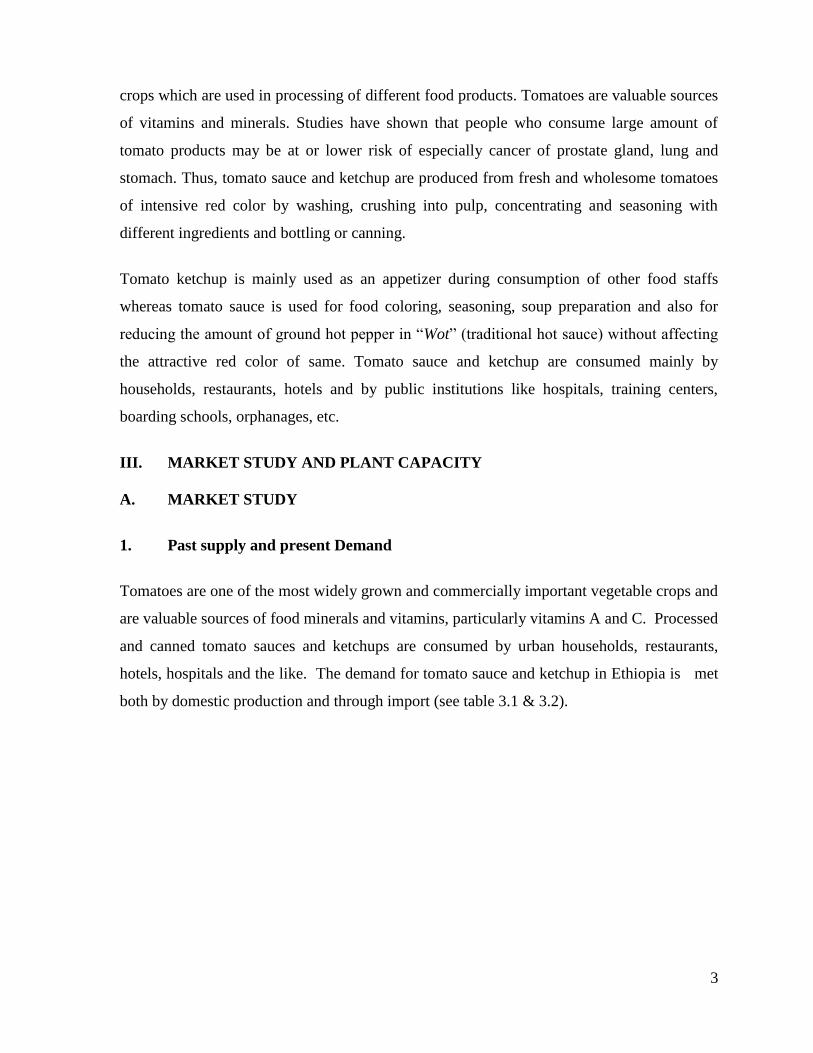
As could be seen from Table 3.2, import of tomato sauce and ketchup which was 57 tons at
the beginning of the period (2001) has grown to 1,476 tons by the end of the period (2011). A
closer examination of the data set reveals that import of tomato ketch up and sauce has been
fluctuating for most of the time. In the year 2001 the annual level of import was about 57
tons, it reached 521 tons by 2003 then declined to 248 tons in 2006 and this increased to
1,476 tons by the year 2011. During the recent three years i.e. 2009-2011 the annual average
import has reached to a level of about 1,208 tons. This average of the recent three years
import, that is 1,208 tons, has been taken as estimate of year 2012 import.
Therefore, summing the domestic production and import levels, the current effective demand
for tomato ketchup and sauce is estimated at 8,799 tons.
2. Projected Demand
Demand for processed and canned tomato sauce and ketchup is mainly influenced by
urbanization, income and change in the consumption habit of the population. As income rises
6
and urbanization progresses, a shift towards relatively expensive but conveniently packed
foods is inevitable. Urban population in Ethiopia is growing by about 4% while GDP in the
last few years has been growing by more the 7%. In addition, average growth rate of import
in the last three years has been 41%. Considering these facts that demand for tomato souses
and Ketchups can be expected to grow more rapidly. However, for the sake of conservatism,
it is forecasted to grow by 6% per annum. Domestic production is expected to remain at 2012
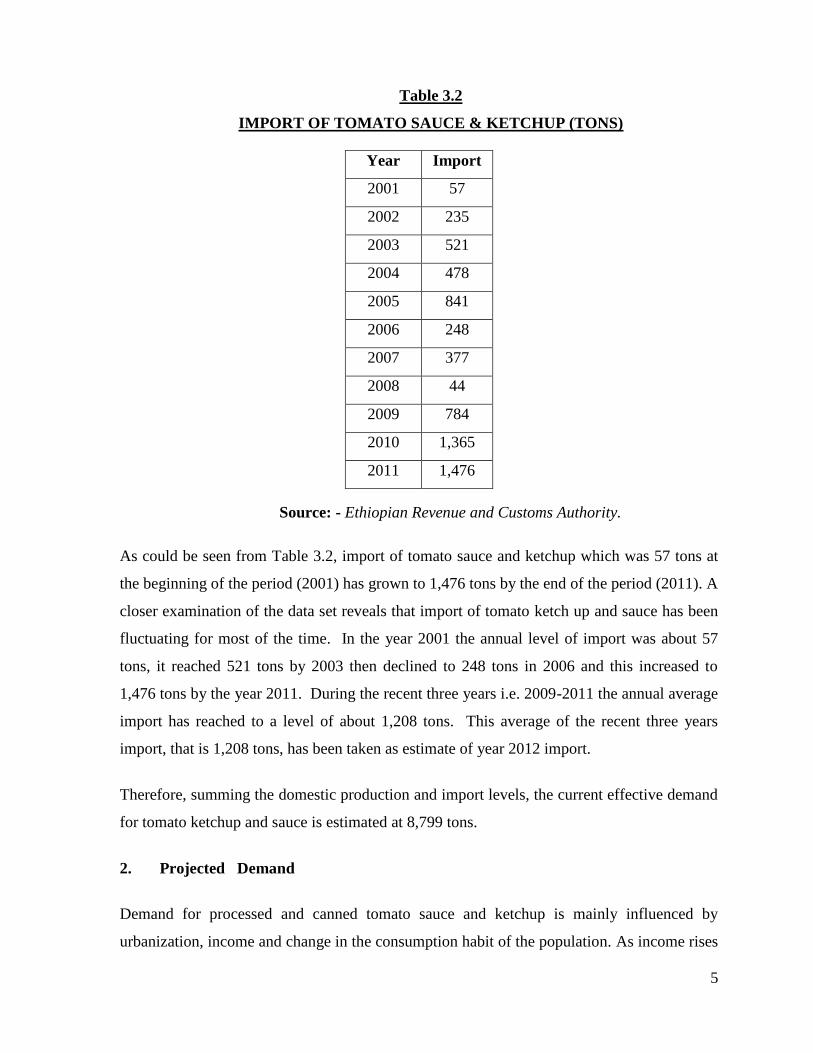
estimated level i.e., 7,591 tons. The resulting total projected demand, production by existing
domestic firms and the residual is shown in Table 3.3.
Table 3.3
PROJECTED DEMAND FOR TOMATO KETCHUP & SAUCE (TONS)
Year Projected
Demand
Existing
production
Gap
(Unsatisfied
Demand)
2013 9,327 7,591 1,736
2014 9,886 7,591 2,295
2015 10,479 7,591 2,888
2016 11,108 7,591 3,517
2017 11,775 7,591 4,184
2018 12,481 7,591 4,890
2019 13,230 7,591 5,639
2020 14,024 7,591 6,433
2021 14,865 7,591 7,274
2022 15,757 7,591 8,166
3. Pricing and Distribution
Retail price of locally produced tomato sauce is Birr 50 per 850 grams in retail shops. This
gives a retail price of Birr 58.82 per kg or Birr 58,820 per tone. Allowing 25% margin for
distributors, a factory gate price of Birr 47,056 per tone is proposed as a factory gate price.
7
Experienced wholesalers in food staffs can be appointed to distribute the product. The end
users of the product i.e. households and hospitality industries such as hotels and the like can
obtain it at different general retail merchandised shops and super markets.
B. PLANT CAPACITY AND PRODUCTION PROGRAM
1. Plant Capacity
Based on the market study and assuming the lowest share of the unsatisfied demand
projection, the envisaged plant will have a capacity of producing 600 tons of tomato ketchup
and sauce per annum, out of which 150 tons will be tomato ketchup and 450 tons tomato
sauce. A capacity of 2 tones per day is considered on the basis of single shift of 8 hours per
day and 300 working days per annum. This capacity, upon requirement, can be increased by
increasing the number of shifts per day.
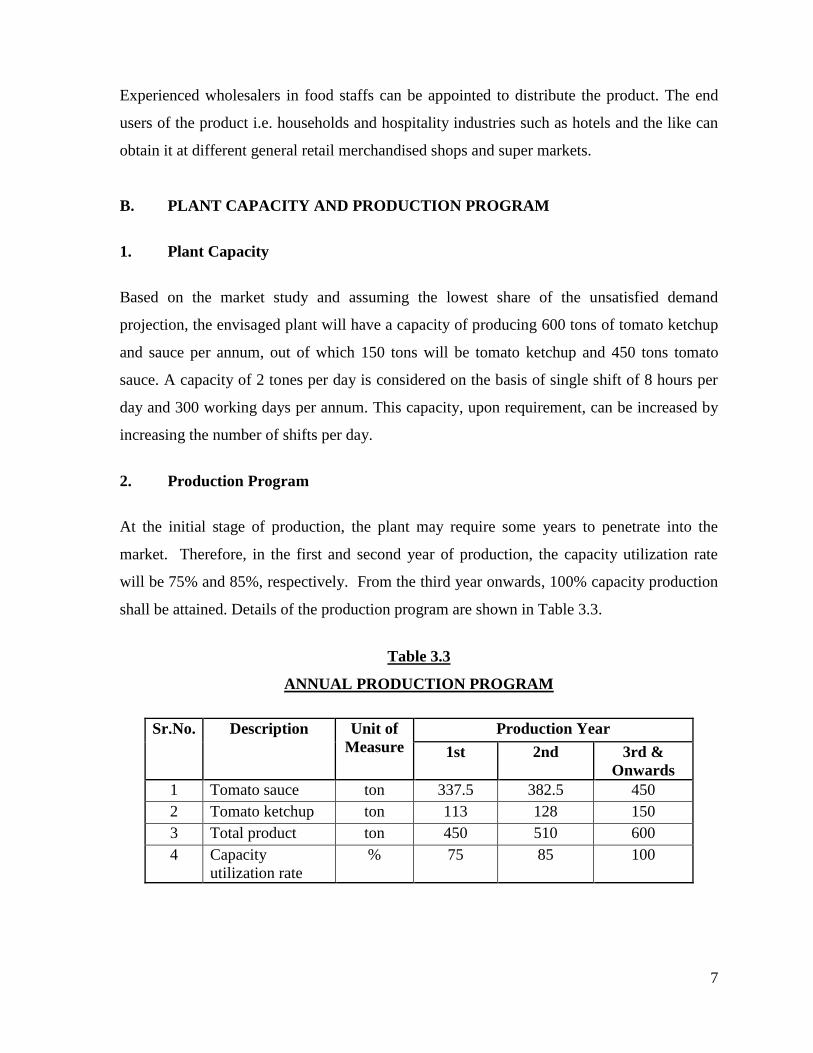
2. Production Program
At the initial stage of production, the plant may require some years to penetrate into the
market. Therefore, in the first and second year of production, the capacity utilization rate
will be 75% and 85%, respectively. From the third year onwards, 100% capacity production
shall be attained. Details of the production program are shown in Table 3.3.
Table 3.3
ANNUAL PRODUCTION PROGRAM
Sr.No. Description Unit of
Measure
Production Year
1st 2nd 3rd &
Onwards
1 Tomato sauce ton 337.5 382.5 450
2 Tomato ketchup ton 113 128 150
3 Total product ton 450 510 600
4 Capacity
utilization rate
% 75 85 100
8
IV. MATERIALS AND INPUTS
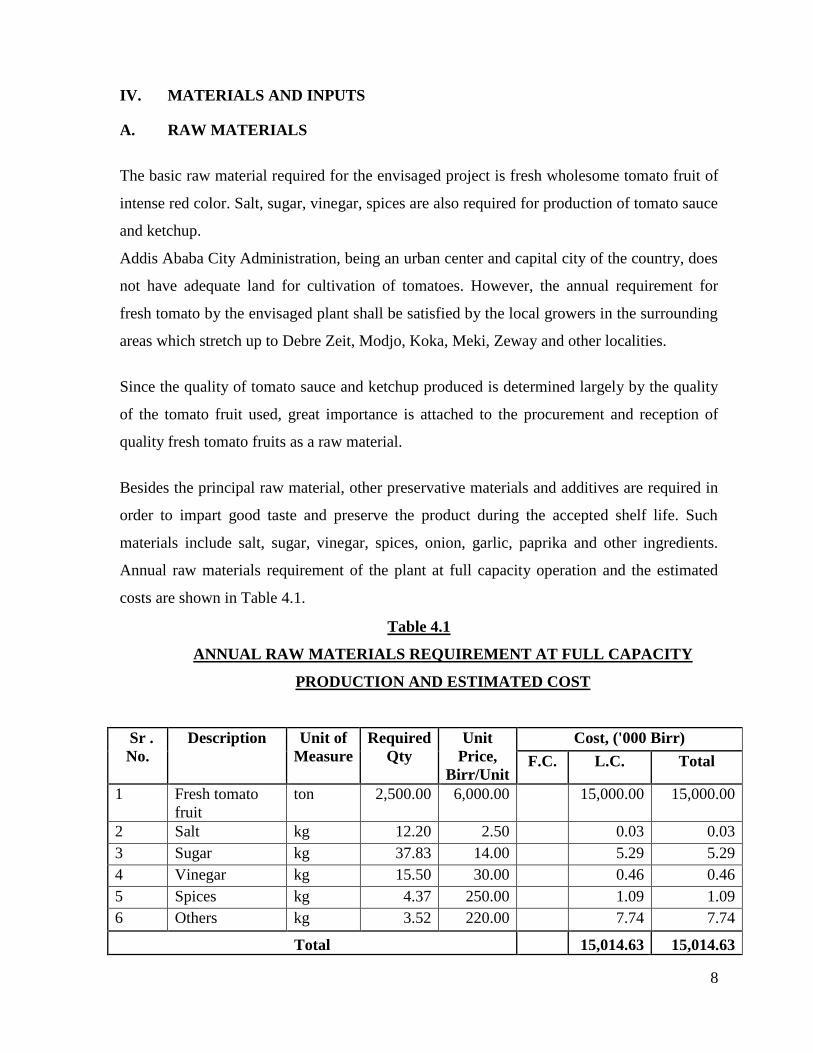
A. RAW MATERIALS
The basic raw material required for the envisaged project is fresh wholesome tomato fruit of
intense red color. Salt, sugar, vinegar, spices are also required for production of tomato sauce
and ketchup.
Addis Ababa City Administration, being an urban center and capital city of the country, does
not have adequate land for cultivation of tomatoes. However, the annual requirement for
fresh tomato by the envisaged plant shall be satisfied by the local growers in the surrounding
areas which stretch up to Debre Zeit, Modjo, Koka, Meki, Zeway and other localities.
Since the quality of tomato sauce and ketchup produced is determined largely by the quality
of the tomato fruit used, great importance is attached to the procurement and reception of
quality fresh tomato fruits as a raw material.
Besides the principal raw material, other preservative materials and additives are required in
order to impart good taste and preserve the product during the accepted shelf life. Such
materials include salt, sugar, vinegar, spices, onion, garlic, paprika and other ingredients.
Annual raw materials requirement of the plant at full capacity operation and the estimated
costs are shown in Table 4.1.
Table 4.1
ANNUAL RAW MATERIALS REQUIREMENT AT FULL CAPACITY
PRODUCTION AND ESTIMATED COST
Sr .
No.
Description Unit of
Measure
Required
Qty
Unit
Price,
Birr/Unit
Cost, ('000 Birr)
F.C. L.C. Total
1 Fresh tomato
fruit
ton 2,500.00 6,000.00 15,000.00 15,000.00
2 Salt kg 12.20 2.50 0.03 0.03
3 Sugar kg 37.83 14.00 5.29 5.29
4 Vinegar kg 15.50 30.00 0.46 0.46
5 Spices kg 4.37 250.00 1.09 1.09
6 Others kg 3.52 220.00 7.74 7.74
Total
15,014.63 15,014.63
9
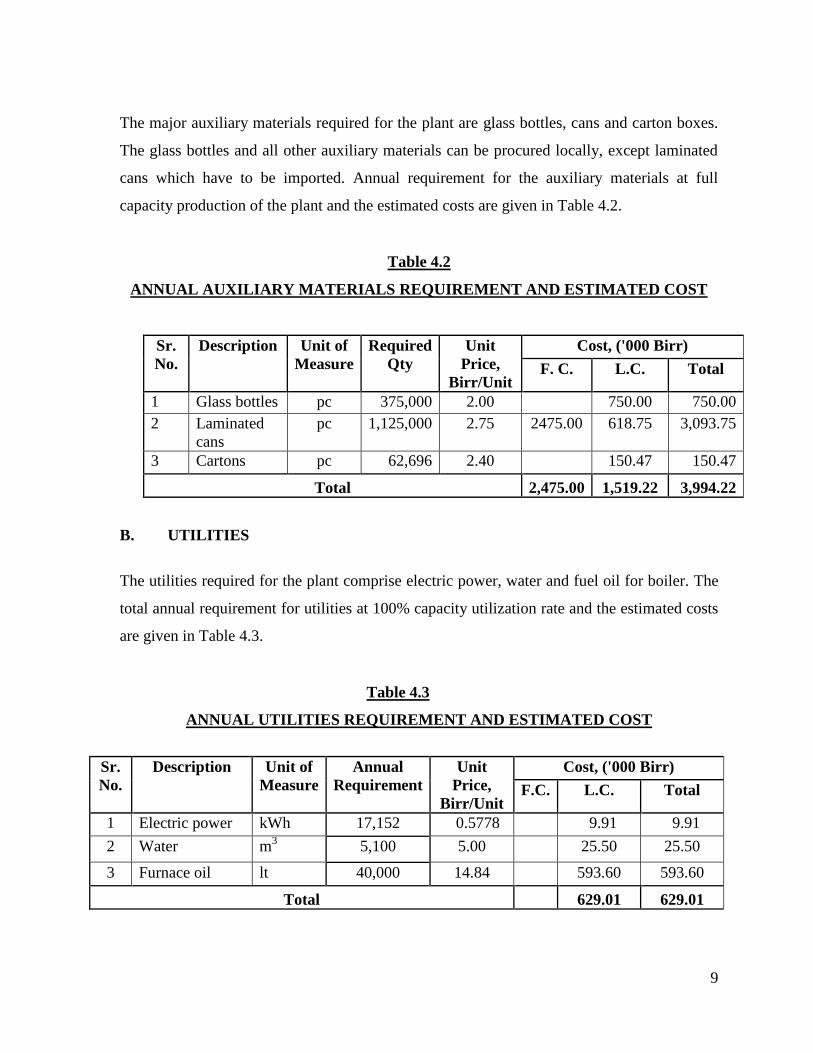
The major auxiliary materials required for the plant are glass bottles, cans and carton boxes.
The glass bottles and all other auxiliary materials can be procured locally, except laminated
cans which have to be imported. Annual requirement for the auxiliary materials at full
capacity production of the plant and the estimated costs are given in Table 4.2.
Table 4.2
ANNUAL AUXILIARY MATERIALS REQUIREMENT AND ESTIMATED COST
Sr.
No.
Description Unit of
Measure
Required
Qty
Unit
Price,
Birr/Unit
Cost, ('000 Birr)
F. C. L.C. Total
1 Glass bottles pc 375,000 2.00 750.00 750.00
2 Laminated
cans
pc 1,125,000 2.75 2475.00 618.75 3,093.75
3 Cartons pc 62,696 2.40 150.47 150.47
Total 2,475.00 1,519.22 3,994.22
B. UTILITIES
The utilities required for the plant comprise electric power, water and fuel oil for boiler. The
total annual requirement for utilities at 100% capacity utilization rate and the estimated costs
are given in Table 4.3.
Table 4.3
ANNUAL UTILITIES REQUIREMENT AND ESTIMATED COST
Sr.
No.
Description Unit of
Measure
Annual
Requirement
Unit
Price,
Birr/Unit
Cost, ('000 Birr)
F.C. L.C. Total
1 Electric power kWh 17,152 0.5778 9.91 9.91
2 Water m3 5,100 5.00 25.50 25.50
3 Furnace oil lt 40,000 14.84 593.60 593.60
Total
629.01 629.01
10
V. TECHNOLOGY AND ENGINEERING
A. TECHNOLOGY
1. Production Process
The major operations involved in the production of tomato sauce and ketchup include
washing, crushing, concentrating, homogenizing, flavoring, bottling and/or canning, packing
and dispatching. Each operation is discussed briefly as follows.
Washing: The incoming fresh tomato is cleaned by washing in water. This task is
accomplished using a special washing technique that enables the preservation of the fresh,
natural qualities of ripe tomato.
Crushing: Washed tomato is crushed into tomato pulp (Juice) which is then strained and
filtered.
Concentration: After crushing the filtered tomato pulp becomes preheated and
concentrated to about one - third of its original volume by means of a continuous
concentrator, for which a boiler plant is used. Since the concentration would be achieved
in a very short time, a special technical know - how shall be employed. Instantaneous
concentration is necessary since; otherwise, heating the tomato pulp would cause oxidation
giving it a dark - reddish disagreeable color, which is different from the normal color of
ripe natural tomato.
Homogenization: Concentrated tomato pulp (juice) is homogenized.
Flavoring: Salt, sugar, spices, vinegar & other ingredients are added in the seasoning
room to give the tomato sauce & tomato ketchup the flavor associated with the products.
Bottling/canning: The products are then filled into bottles and cans.
Packing and dispatching: After bottling/canning, the products will be packed in carton
box and dispatched.
11
There are various recipes employed for production of tomato ketchup and sauce. The recipe
applied for tomato ketchup shows a considerable variation from the recipe used to produce
tomato sauce. For production of tomato ketchup, spices are added to the vinegar and cooked
at about 85oC, covered in a dried kettle for about 2-3 hours. Onion, garlic and paprika are
then added directly to the ketchup.
2. Environmental Impact
The envisaged plant does not have any pollutant emitted except the washing water which has
to be connected to a proper drainage line. Thus the project is environment friendly.
B. ENGINEERING
1. Machinery and Equipment
The plant machinery and equipment required for the envisaged project include tomato
charging machine, washing and sorting machine, continuous concentrator, filter,
homogenizer, mixer, bottling machine and boiler. The total cost of machinery and equipment
is estimated at Birr 12,362,546, of which Birr 9,890,037 will be required in foreign currency.
Details of the machinery and equipment and the estimated costs are indicated in Table 5.1.

12
Table 5.1
LIST OF MACHINERY AND EQUIPMENT AND ESTIMATED COSTS
Item
No.
Description Unit of
Measure
Required
Qty Cost, ('000 Birr)
F.C. L.C. Total
1 Tomato charging
machine
set 1 494.50 123.63 618.13
2 Tomato washing
and sorting
machine
set 1
1,186.80 296.70 1,483.51
3 Continuous
concentrator
set 1 1,087.90 271.98 1,359.88
4 Filter set 1 593.40 148.35 741.75
5 Homogenizer set 1 692.30 173.08 865.38
6 Seasoning mixer set 1 692.30 173.08 865.38
7 Bottling machine set 1 890.10 222.53 1,112.63
8 Cooler set 1 890.10 222.53 1,112.63
9 Labeler set 1 593.40 148.35 741.75
10 Packing machine set 1 791.20 197.80 989.00
11 Water treatment
facility
set 1 692.30 173.08 865.38
12 Boiler set 1 791.20 197.80 989.00
13 Other auxiliary
equipment
set 1 494.50 123.63 618.13
Total 9,890.03 2,472.50 12,362.54
2. Land, Buildings and Civil Works
The total area of land required for the project is 1,400 m2. The total built-up area is 700 m
2.
This includes production hall, finished products and raw materials stores, offices and social
facilities. The total cost of buildings and civil work at a unit cost of Birr 4,500 per m2, is
estimated at Birr 3.15 million.
According to the Federal Legislation on the Lease Holding of Urban Land (Proclamation No
721/2004) in principle, urban land permit by lease is on auction or negotiation basis,
however, the time and condition of applying the proclamation shall be determined by the
concerned regional or city government depending on the level of development.
13
The legislation has also set the maximum on lease period and the payment of lease prices.
The lease period ranges from 99 years for education, cultural research health, sport, NGO ,
religious and residential area to 80 years for industry and 70 years for trade while the lease
payment period ranges from 10 years to 60 years based on the towns grade and type of
investment.
Moreover, advance payment of lease based on the type of investment ranges from 5% to
10%.The lease price is payable after the grace period annually. For those that pay the entire
amount of the lease will receive 0.5% discount from the total lease value and those that pay
in installments will be charged interest based on the prevailing interest rate of banks.
Moreover, based on the type of investment, two to seven years grace period shall also be
provided.
However, the Federal Legislation on the Lease Holding of Urban Land apart from setting the
maximum has conferred on regional and city governments the power to issue regulations on
the exact terms based on the development level of each region.
In Addis Ababa the City’s Land Administration and Development Authority is directly
responsible in dealing with matters concerning land. However, regarding the manufacturing
sector, industrial zone preparation is one of the strategic intervention measures adopted by
the City Administration for the promotion of the sector and all manufacturing projects are
assumed to be located in the developed industrial zones.
Regarding land allocation of industrial zones if the land requirement of the project is below
5000 m2, the land lease request is evaluated and decided upon by the Industrial Zone
Development and Coordination Committee of the City’s Investment Authority. However, if
the land request is above 5,000 m2 the request is evaluated by the City’s Investment
Authority and passed with recommendation to the Land Development and Administration
Authority for decision, while the lease price is the same for both cases.
Moreover, the Addis Ababa City Administration has recently adopted a new land lease floor
price for plots in the city. The new prices will be used as a benchmark for plots that are going
14
to be auctioned by the city government or transferred under the new “Urban Lands Lease
Holding Proclamation.”
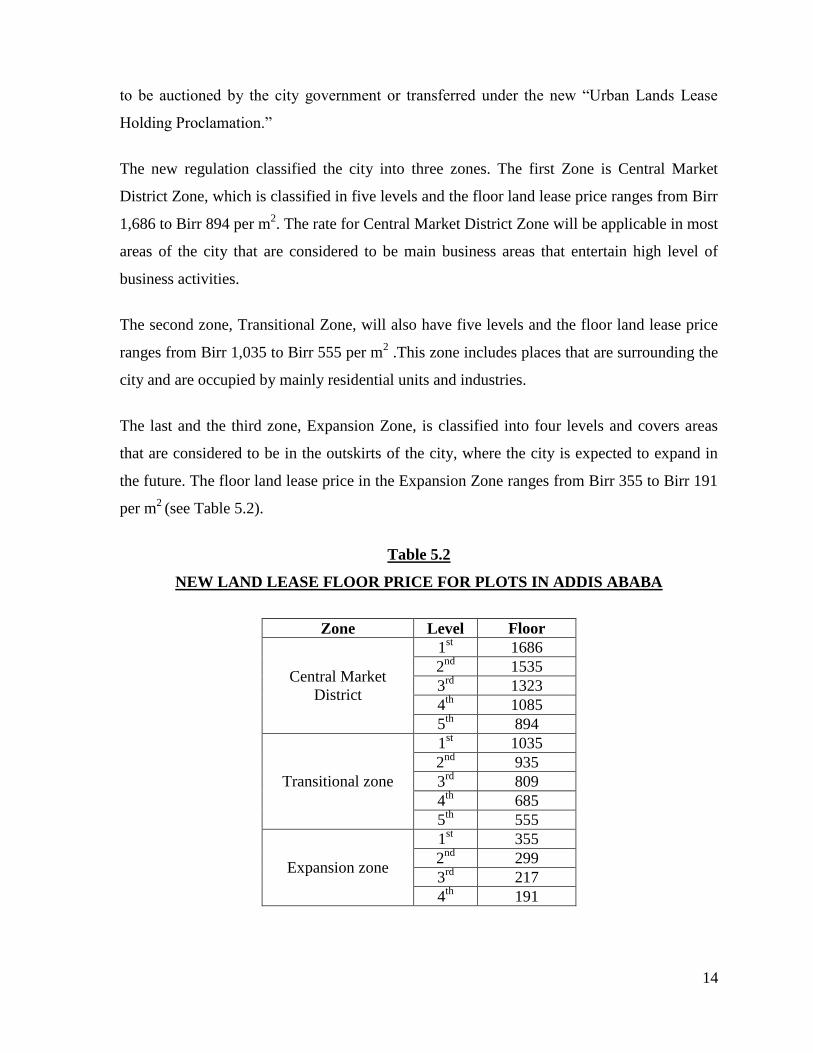
The new regulation classified the city into three zones. The first Zone is Central Market
District Zone, which is classified in five levels and the floor land lease price ranges from Birr
1,686 to Birr 894 per m2. The rate for Central Market District Zone will be applicable in most
areas of the city that are considered to be main business areas that entertain high level of
business activities.
The second zone, Transitional Zone, will also have five levels and the floor land lease price
ranges from Birr 1,035 to Birr 555 per m2 .This zone includes places that are surrounding the
city and are occupied by mainly residential units and industries.
The last and the third zone, Expansion Zone, is classified into four levels and covers areas
that are considered to be in the outskirts of the city, where the city is expected to expand in
the future. The floor land lease price in the Expansion Zone ranges from Birr 355 to Birr 191
per m2
(see Table 5.2).
Table 5.2
NEW LAND LEASE FLOOR PRICE FOR PLOTS IN ADDIS ABABA
Zone Level Floor
price/m2
Central Market
District
1st 1686
2nd
1535
3rd
1323
4th
1085
5th
894
Transitional zone
1st 1035
2nd
935
3rd
809
4th
685
5th
555
Expansion zone
1st 355
2nd
299
3rd
217
4th
191
15
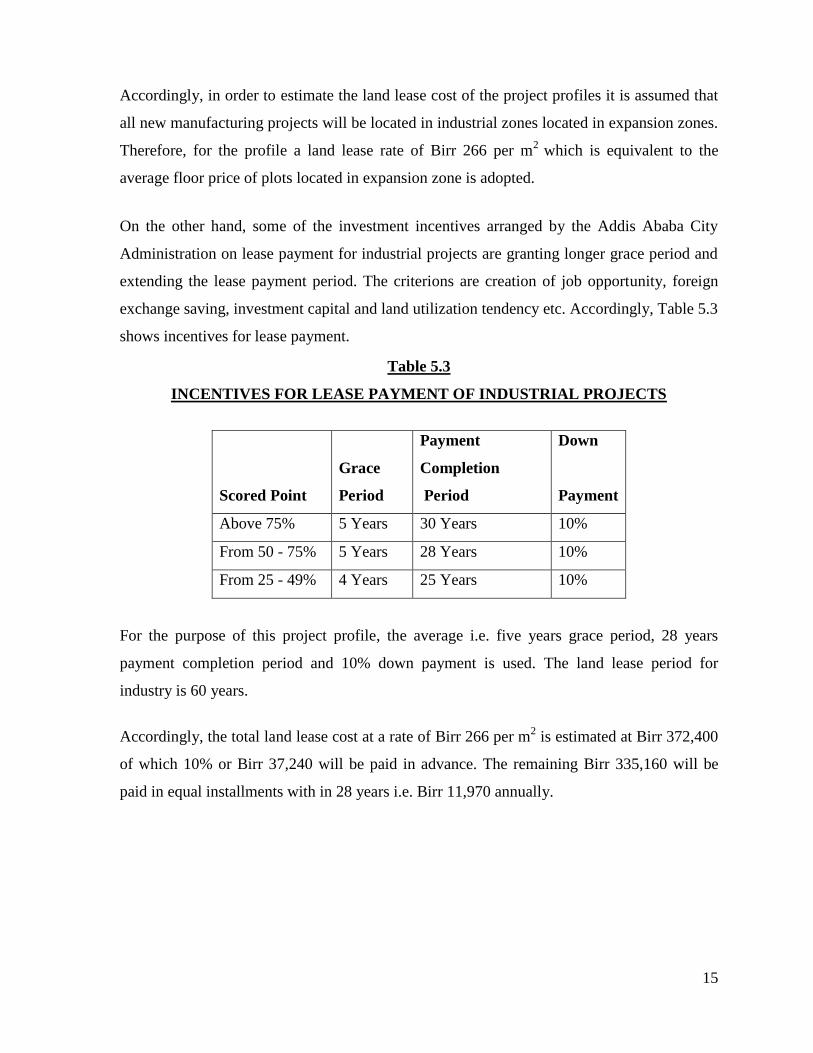
Accordingly, in order to estimate the land lease cost of the project profiles it is assumed that
all new manufacturing projects will be located in industrial zones located in expansion zones.
Therefore, for the profile a land lease rate of Birr 266 per m2
which is equivalent to the
average floor price of plots located in expansion zone is adopted.
On the other hand, some of the investment incentives arranged by the Addis Ababa City
Administration on lease payment for industrial projects are granting longer grace period and
extending the lease payment period. The criterions are creation of job opportunity, foreign
exchange saving, investment capital and land utilization tendency etc. Accordingly, Table 5.3
shows incentives for lease payment.
Table 5.3
INCENTIVES FOR LEASE PAYMENT OF INDUSTRIAL PROJECTS
Scored Point
Grace
Period
Payment
Completion
Period
Down
Payment
Above 75% 5 Years 30 Years 10%
From 50 - 75% 5 Years 28 Years 10%
From 25 - 49% 4 Years 25 Years 10%
For the purpose of this project profile, the average i.e. five years grace period, 28 years
payment completion period and 10% down payment is used. The land lease period for
industry is 60 years.
Accordingly, the total land lease cost at a rate of Birr 266 per m2 is estimated at Birr 372,400
of which 10% or Birr 37,240 will be paid in advance. The remaining Birr 335,160 will be
paid in equal installments with in 28 years i.e. Birr 11,970 annually.
16
NB: The land issue in the above statement narrates or shows only Addis Ababa’s city
administration land lease price, policy and regulations.
Accordingly the project profile prepared based on the land lease price of Addis Ababa
region.
To know land lease price, police and regulation of other regional state of the country updated
information is available at Ethiopian Investment Agency’s website www.eia.gov.et on the
factor cost.
VI. HUMAN RESOURCE AND TRAINING REQUIREMENT
A. HUMAN RESOURCE REQUIREMENT
The total human resource required for the project is 34 persons. The total human resource
requirement along with annual estimated labor cost, including fringe benefits, is presented in
Table 6.1.
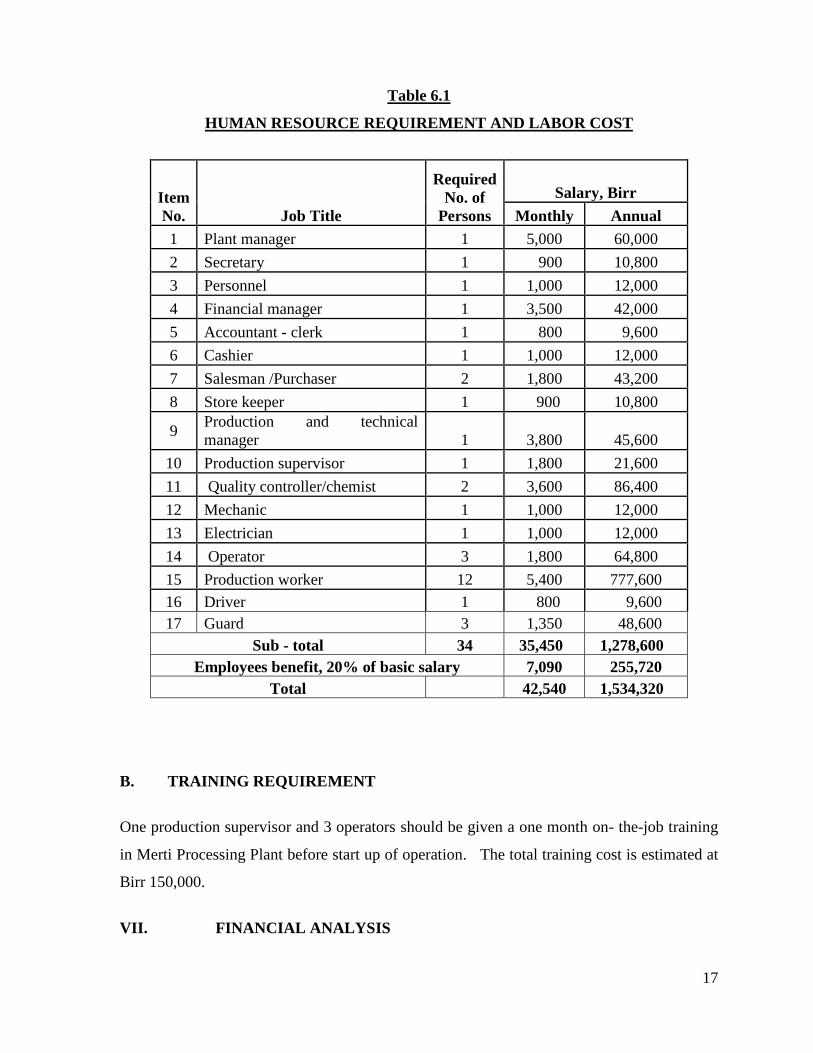
17
Table 6.1
HUMAN RESOURCE REQUIREMENT AND LABOR COST
Item
No. Job Title
Required
No. of
Persons
Salary, Birr
Monthly Annual
1 Plant manager 1 5,000 60,000
2 Secretary 1 900 10,800
3 Personnel 1 1,000 12,000
4 Financial manager 1 3,500 42,000
5 Accountant - clerk 1 800 9,600
6 Cashier 1 1,000 12,000
7 Salesman /Purchaser 2 1,800 43,200
8 Store keeper 1 900 10,800
9 Production and technical
manager 1 3,800 45,600
10 Production supervisor 1 1,800 21,600
11 Quality controller/chemist 2 3,600 86,400
12 Mechanic 1 1,000 12,000
13 Electrician 1 1,000 12,000
14 Operator 3 1,800 64,800
15 Production worker 12 5,400 777,600
16 Driver 1 800 9,600
17 Guard 3 1,350 48,600
Sub - total 34 35,450 1,278,600
Employees benefit, 20% of basic salary 7,090 255,720
Total 42,540 1,534,320
B. TRAINING REQUIREMENT
One production supervisor and 3 operators should be given a one month on- the-job training
in Merti Processing Plant before start up of operation. The total training cost is estimated at
Birr 150,000.
VII. FINANCIAL ANALYSIS
18
The financial analysis of the tomato sauce and ketchup project is based on the data presented
in the previous chapters and the following assumptions:-
Construction period 1 year
Source of finance 30 % equity
70 % loan
Tax holidays 5 years
Bank interest 10%
Discount cash flow 10%
Accounts receivable 30 days
Raw material local 30 days
Raw material imported 120 days
Work in progress 1 day
Finished products 30 days
Cash in hand 5 days
Accounts payable 30 days
Repair and maintenance 5% of machinery cost
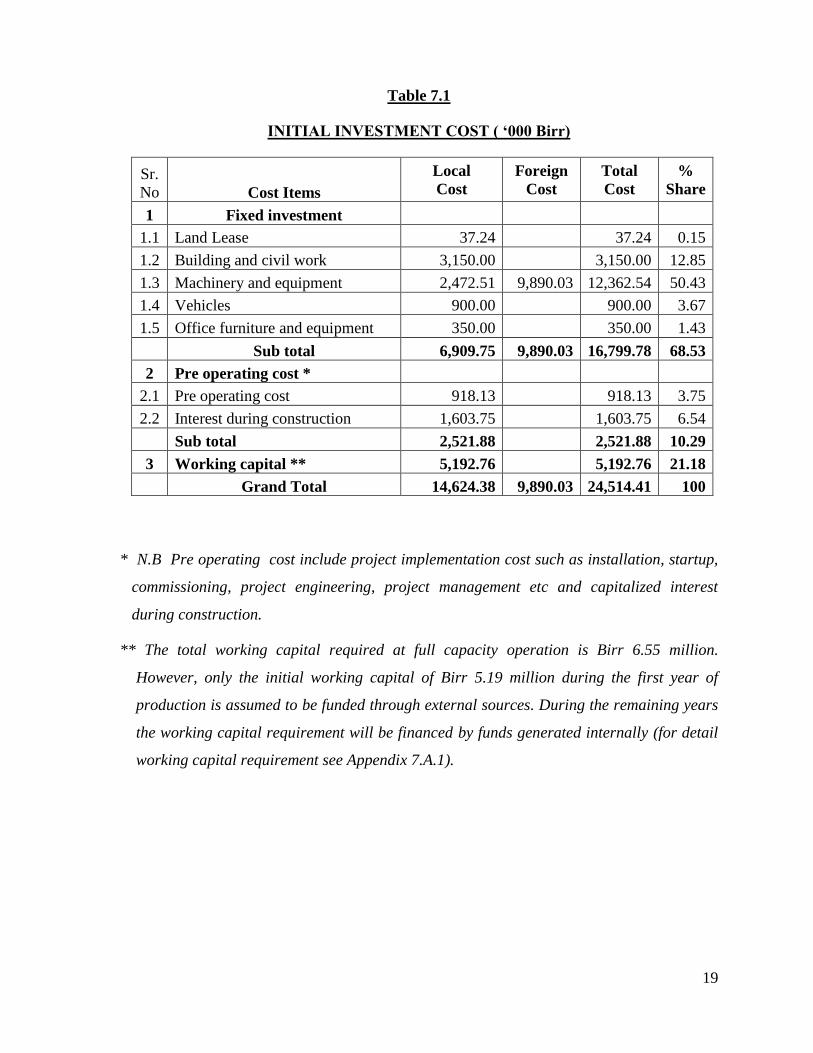
A. TOTAL INITIAL INVESTMENT COST
The total investment cost of the project including working capital is estimated at Birr 24.514
million (see Table 7.1). From the total investment cost the highest share (Birr 16.80 million
or 68.53%) is accounted by fixed investment cost followed by initial working capital (Birr
5.19 million or 21.18%) and pre operation cost (Birr 2.52 million or 10.29%). From the total
investment cost Birr 9.89 million or 40.34% is required in foreign currency.
19
Table 7.1
INITIAL INVESTMENT COST ( ‘000 Birr)
Sr.
No Cost Items
Local
Cost
Foreign
Cost
Total
Cost
%
Share
1 Fixed investment
1.1 Land Lease 37.24 37.24 0.15
1.2 Building and civil work 3,150.00 3,150.00 12.85
1.3 Machinery and equipment 2,472.51 9,890.03 12,362.54 50.43
1.4 Vehicles 900.00 900.00 3.67
1.5 Office furniture and equipment 350.00 350.00 1.43
Sub total 6,909.75 9,890.03 16,799.78 68.53
2 Pre operating cost *
2.1 Pre operating cost 918.13 918.13 3.75
2.2 Interest during construction 1,603.75 1,603.75 6.54
Sub total 2,521.88 2,521.88 10.29
3 Working capital ** 5,192.76 5,192.76 21.18
Grand Total 14,624.38 9,890.03 24,514.41 100
* N.B Pre operating cost include project implementation cost such as installation, startup,
commissioning, project engineering, project management etc and capitalized interest
during construction.
** The total working capital required at full capacity operation is Birr 6.55 million.
However, only the initial working capital of Birr 5.19 million during the first year of
production is assumed to be funded through external sources. During the remaining years
the working capital requirement will be financed by funds generated internally (for detail
working capital requirement see Appendix 7.A.1).
20
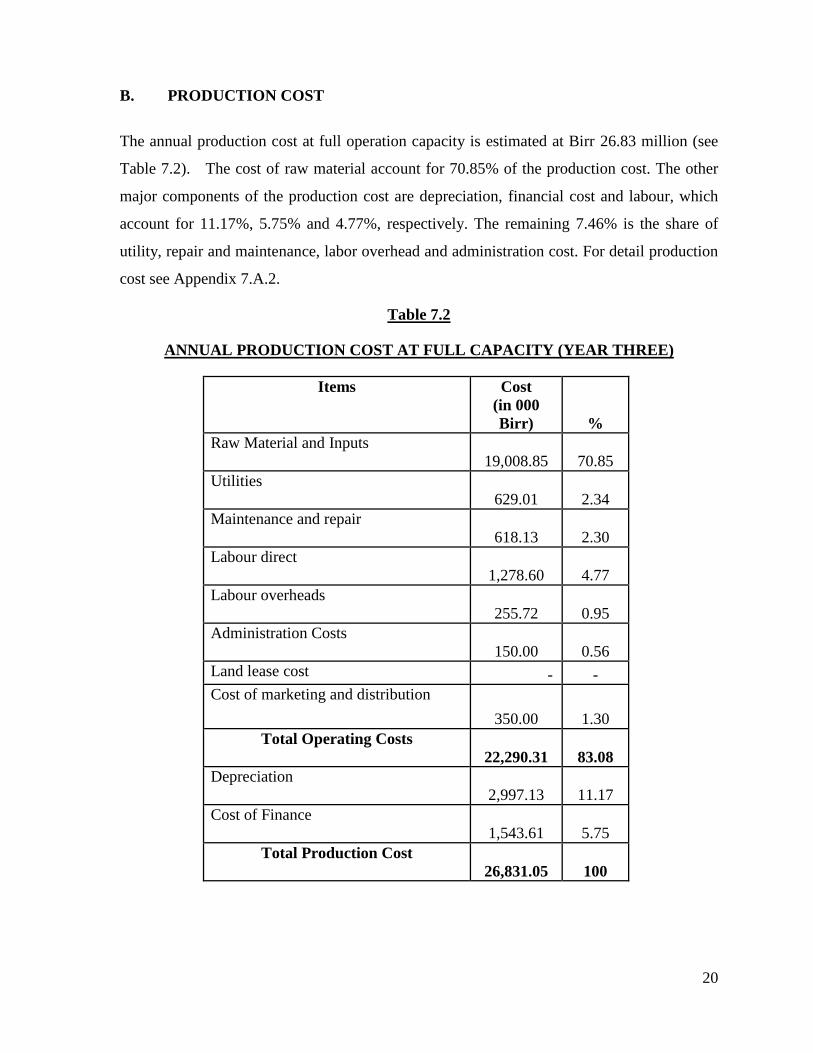
B. PRODUCTION COST
The annual production cost at full operation capacity is estimated at Birr 26.83 million (see
Table 7.2). The cost of raw material account for 70.85% of the production cost. The other
major components of the production cost are depreciation, financial cost and labour, which
account for 11.17%, 5.75% and 4.77%, respectively. The remaining 7.46% is the share of
utility, repair and maintenance, labor overhead and administration cost. For detail production
cost see Appendix 7.A.2.
Table 7.2
ANNUAL PRODUCTION COST AT FULL CAPACITY (YEAR THREE)
Items Cost
(in 000
Birr) %
Raw Material and Inputs
19,008.85 70.85
Utilities
629.01 2.34
Maintenance and repair
618.13 2.30
Labour direct
1,278.60 4.77
Labour overheads
255.72 0.95
Administration Costs
150.00 0.56
Land lease cost - -
Cost of marketing and distribution
350.00 1.30
Total Operating Costs
22,290.31 83.08
Depreciation
2,997.13 11.17
Cost of Finance
1,543.61 5.75
Total Production Cost
26,831.05 100
21
C. FINANCIAL EVALUATION
1. Profitability
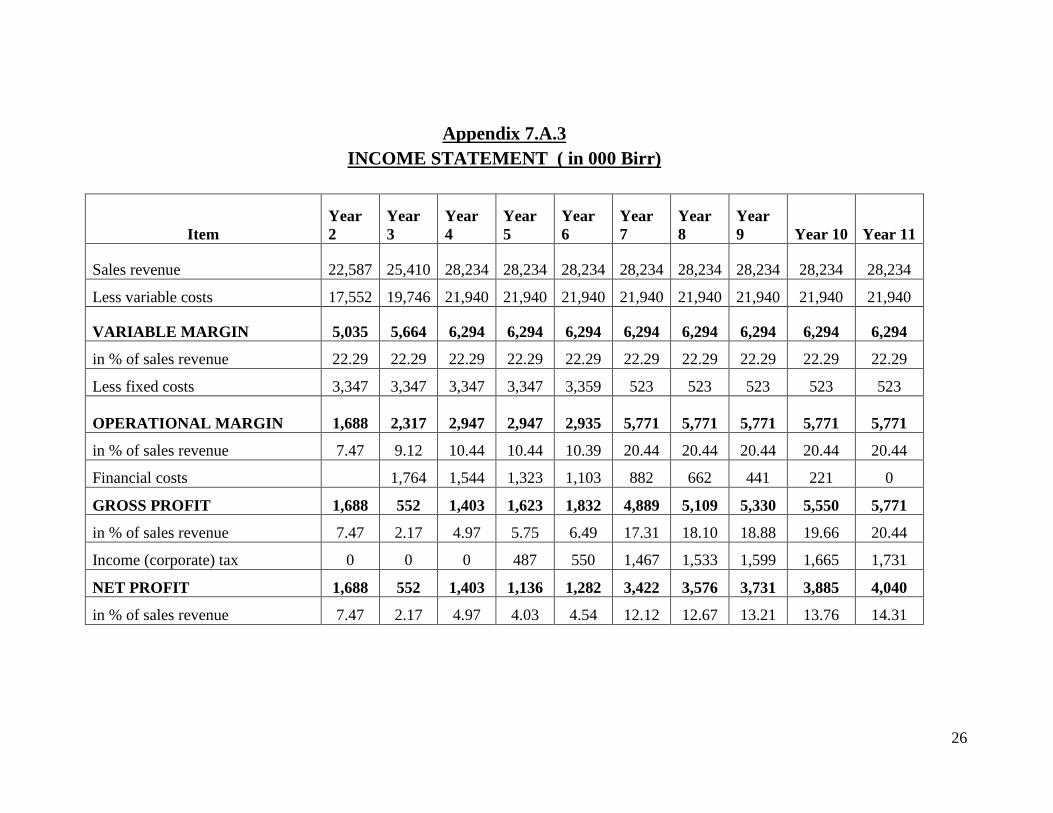
Based on the projected profit and loss statement, the project will generate a profit throughout
its operation life. Annual net profit after tax will grow from Birr 1.136 million to Birr 4.04
million during the life of the project. Moreover, at the end of the project life the accumulated
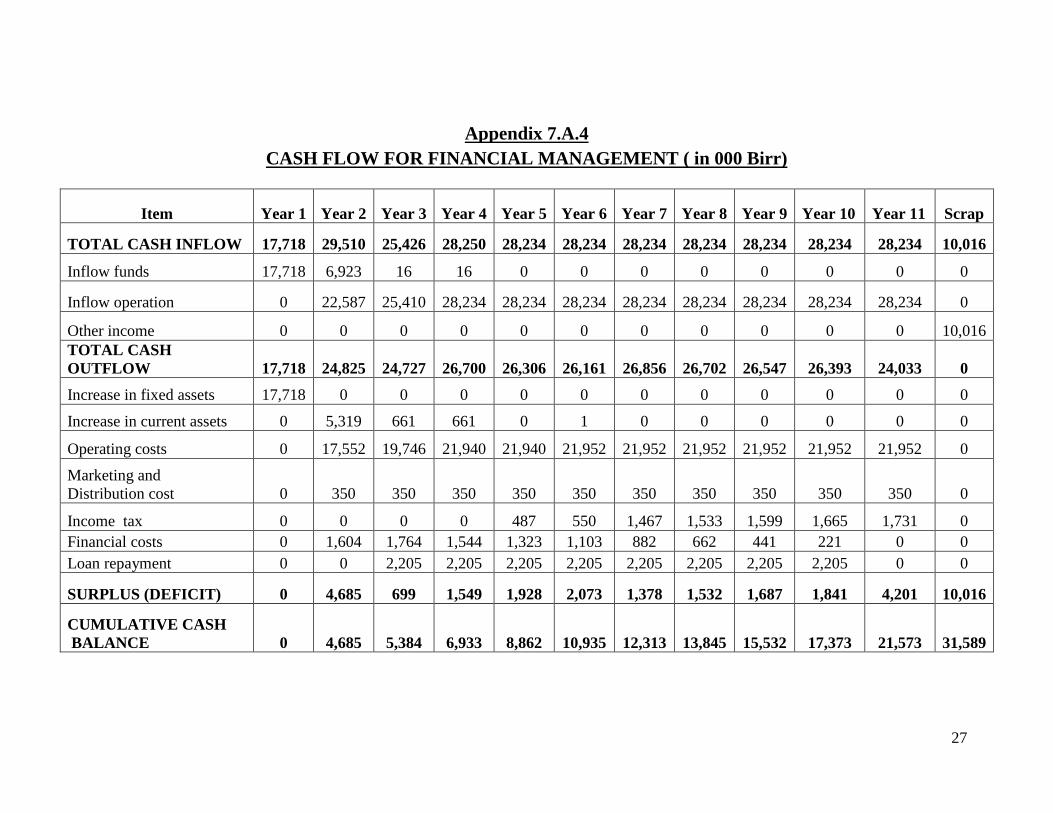
net cash flow amounts to Birr 31.60 million. For profit and loss statement and cash flow
projection see Appendix 7.A.3 and 7.A.4, respectively.
2. Ratios
In financial analysis financial ratios and efficiency ratios are used as an index or yardstick for
evaluating the financial position of a firm. It is also an indicator for the strength and
weakness of the firm or a project. Using the year-end balance sheet figures and other
relevant data, the most important ratios such as return on sales which is computed by
dividing net income by revenue, return on assets (operating income divided by assets), return
on equity (net profit divided by equity) and return on total investment (net profit plus interest
divided by total investment) has been carried out over the period of the project life and all the
results are found to be satisfactory.
3. Break-even Analysis
The break-even analysis establishes a relationship between operation costs and revenues. It
indicates the level at which costs and revenue are in equilibrium. To this end, the break-even
point for capacity utilization and sales value estimated by using income statement projection
are computed as followed.
Break -Even Sales Value = Fixed Cost + Financial Cost = Birr 11,858,280
Variable Margin ratio (%)
Break -Even Capacity utilization = Break -even Sales Value X 100 = 53.18 %
Sales revenue

22
4. Pay-back Period
The pay-back period, also called pay – off period is defined as the period required for
recovering the original investment outlay through the accumulated net cash flows earned by
the project. Accordingly, based on the projected cash flow it is estimated that the project’s
initial investment will be fully recovered within 6 years.
5. Internal Rate of Return
The internal rate of return (IRR) is the annualized effective compounded return rate that can
be earned on the invested capital, i.e., the yield on the investment. Put another way, the
internal rate of return for an investment is the discount rate that makes the net present value
of the investment's income stream total to zero. It is an indicator of the efficiency or quality
of an investment. A project is a good investment proposition if its IRR is greater than the rate
of return that could be earned by alternate investments or putting the money in a bank
account. Accordingly, the IRR of this project is computed to be 18.25% indicating the
viability of the project.
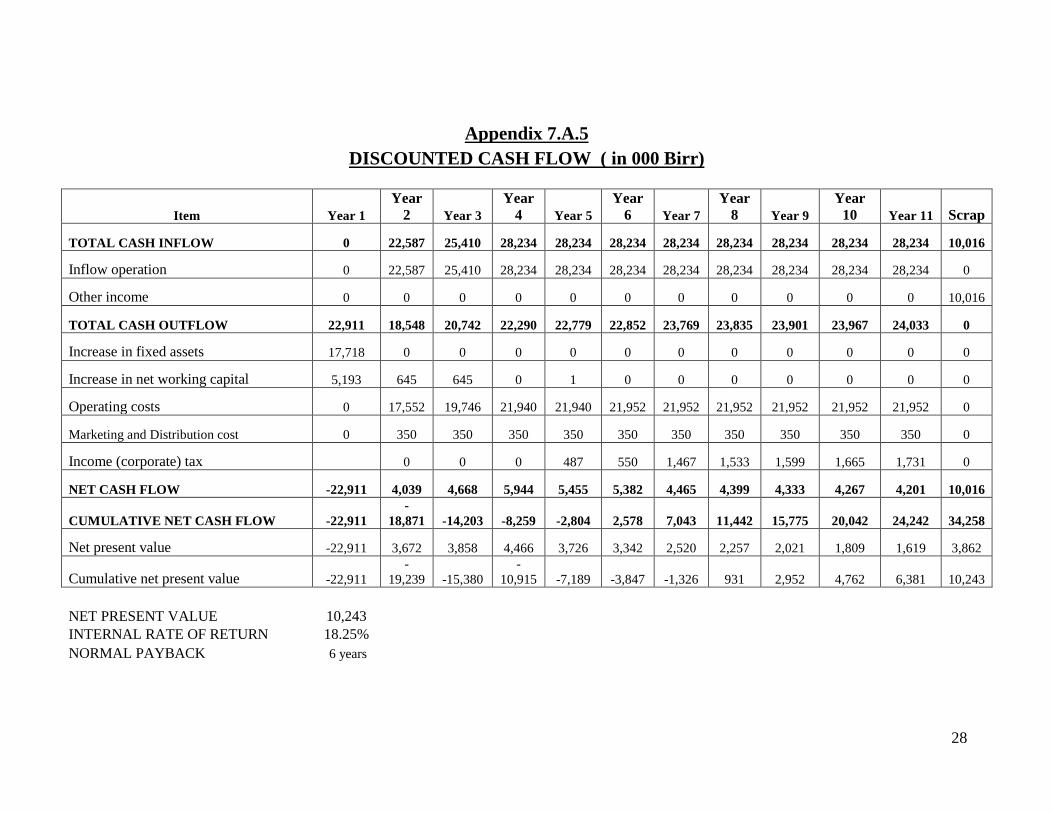
6. Net Present Value
Net present value (NPV) is defined as the total present (discounted) value of a time series of
cash flows. NPV aggregates cash flows that occur during different periods of time during the
life of a project in to a common measuring unit i.e. present value. It is a standard method for
using the time value of money to appraise long-term projects. NPV is an indicator of how
much value an investment or project adds to the capital invested. In principle, a project is
accepted if the NPV is non-negative.
Accordingly, the net present value of the project at 10% discount rate is found to be Birr
10.24 million which is acceptable. For detail discounted cash flow see Appendix 7.A.5.
D. ECONOMIC AND SOCIAL BENEFITS
The project can create employment for 34 persons. The project will generate Birr 9.031
million in terms of tax revenue. The establishment of such factory will have a foreign
23
exchange saving effect to the country by substituting the current imports. The project will
also create backward linkage with the horticulture farming and salt mining sectors and
forward linkage with food processing sub sector and also generates income for the
Government in terms of payroll tax.

24
Appendix 7.A
FINANCIAL ANALYSES SUPPORTING TABLES
24
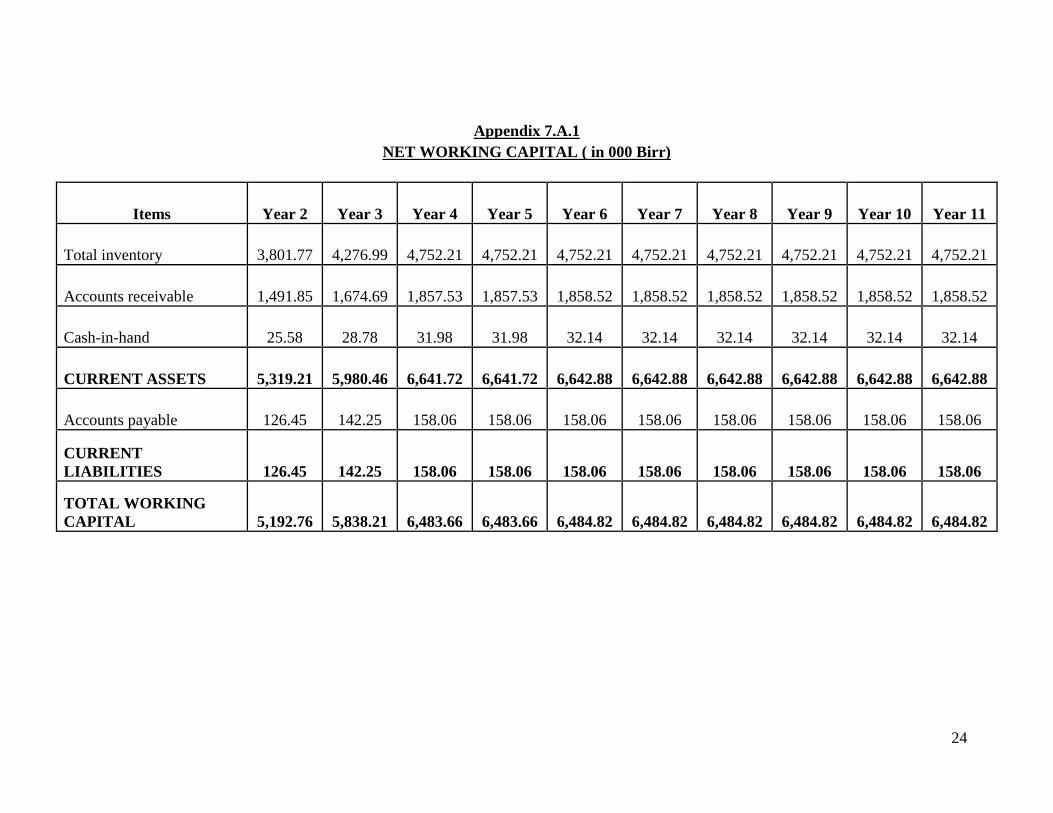
Appendix 7.A.1
NET WORKING CAPITAL ( in 000 Birr)
Items Year 2 Year 3 Year 4 Year 5 Year 6 Year 7 Year 8 Year 9 Year 10 Year 11
Total inventory 3,801.77 4,276.99 4,752.21 4,752.21 4,752.21 4,752.21 4,752.21 4,752.21 4,752.21 4,752.21
Accounts receivable 1,491.85 1,674.69 1,857.53 1,857.53 1,858.52 1,858.52 1,858.52 1,858.52 1,858.52 1,858.52
Cash-in-hand 25.58 28.78 31.98 31.98 32.14 32.14 32.14 32.14 32.14 32.14
CURRENT ASSETS 5,319.21 5,980.46 6,641.72 6,641.72 6,642.88 6,642.88 6,642.88 6,642.88 6,642.88 6,642.88
Accounts payable 126.45 142.25 158.06 158.06 158.06 158.06 158.06 158.06 158.06 158.06
CURRENT
LIABILITIES 126.45 142.25 158.06 158.06 158.06 158.06 158.06 158.06 158.06 158.06
TOTAL WORKING
CAPITAL 5,192.76 5,838.21 6,483.66 6,483.66 6,484.82 6,484.82 6,484.82 6,484.82 6,484.82 6,484.82
25
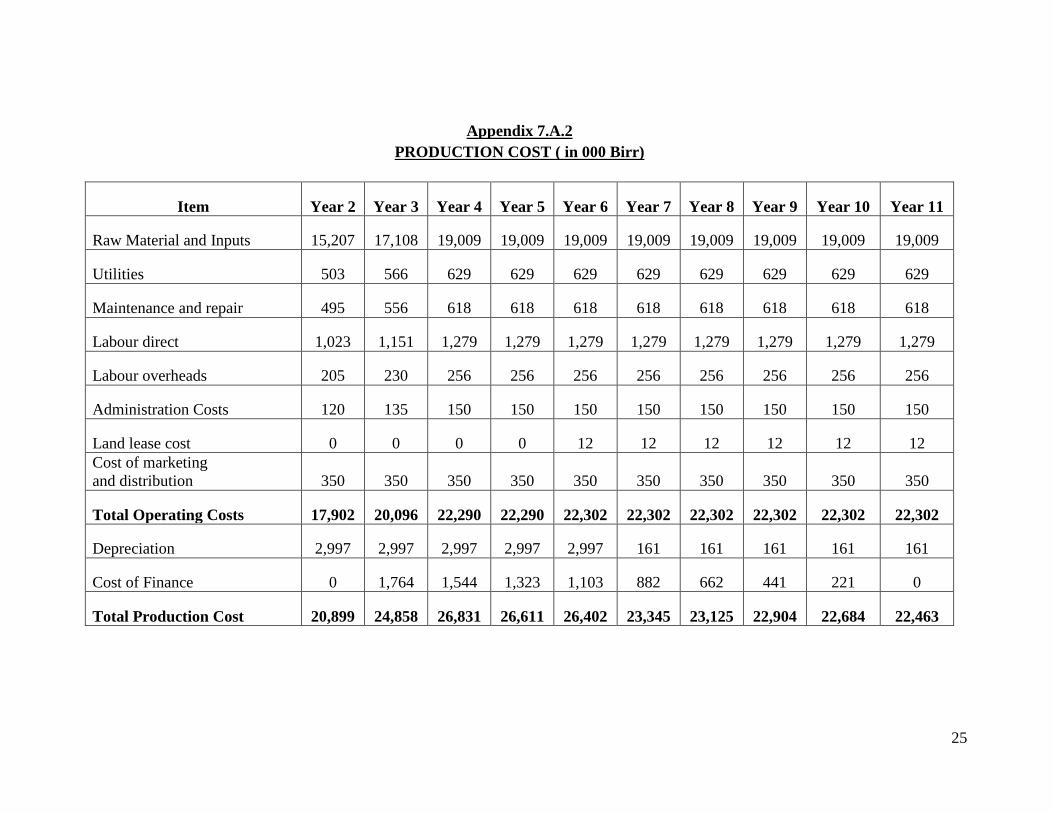
Appendix 7.A.2
PRODUCTION COST ( in 000 Birr)
Item Year 2 Year 3 Year 4 Year 5 Year 6 Year 7 Year 8 Year 9 Year 10 Year 11
Raw Material and Inputs 15,207 17,108 19,009 19,009 19,009 19,009 19,009 19,009 19,009 19,009
Utilities 503 566 629 629 629 629 629 629 629 629
Maintenance and repair 495 556 618 618 618 618 618 618 618 618
Labour direct 1,023 1,151 1,279 1,279 1,279 1,279 1,279 1,279 1,279 1,279
Labour overheads 205 230 256 256 256 256 256 256 256 256
Administration Costs 120 135 150 150 150 150 150 150 150 150
Land lease cost 0 0 0 0 12 12 12 12 12 12
Cost of marketing
and distribution 350 350 350 350 350 350 350 350 350 350
Total Operating Costs 17,902 20,096 22,290 22,290 22,302 22,302 22,302 22,302 22,302 22,302
Depreciation 2,997 2,997 2,997 2,997 2,997 161 161 161 161 161
Cost of Finance 0 1,764 1,544 1,323 1,103 882 662 441 221 0
Total Production Cost 20,899 24,858 26,831 26,611 26,402 23,345 23,125 22,904 22,684 22,463
26
Appendix 7.A.3
INCOME STATEMENT ( in 000 Birr)
Item
Year
2
Year
3
Year
4
Year
5
Year
6
Year
7
Year
8
Year
9 Year 10 Year 11
Sales revenue 22,587 25,410 28,234 28,234 28,234 28,234 28,234 28,234 28,234 28,234
Less variable costs 17,552 19,746 21,940 21,940 21,940 21,940 21,940 21,940 21,940 21,940
VARIABLE MARGIN 5,035 5,664 6,294 6,294 6,294 6,294 6,294 6,294 6,294 6,294
in % of sales revenue 22.29 22.29 22.29 22.29 22.29 22.29 22.29 22.29 22.29 22.29
Less fixed costs 3,347 3,347 3,347 3,347 3,359 523 523 523 523 523
OPERATIONAL MARGIN 1,688 2,317 2,947 2,947 2,935 5,771 5,771 5,771 5,771 5,771
in % of sales revenue 7.47 9.12 10.44 10.44 10.39 20.44 20.44 20.44 20.44 20.44
Financial costs 1,764 1,544 1,323 1,103 882 662 441 221 0
GROSS PROFIT 1,688 552 1,403 1,623 1,832 4,889 5,109 5,330 5,550 5,771
in % of sales revenue 7.47 2.17 4.97 5.75 6.49 17.31 18.10 18.88 19.66 20.44
Income (corporate) tax 0 0 0 487 550 1,467 1,533 1,599 1,665 1,731
NET PROFIT 1,688 552 1,403 1,136 1,282 3,422 3,576 3,731 3,885 4,040
in % of sales revenue 7.47 2.17 4.97 4.03 4.54 12.12 12.67 13.21 13.76 14.31
27
Appendix 7.A.4
CASH FLOW FOR FINANCIAL MANAGEMENT ( in 000 Birr)
Item Year 1 Year 2 Year 3 Year 4 Year 5 Year 6 Year 7 Year 8 Year 9 Year 10 Year 11 Scrap
TOTAL CASH INFLOW 17,718 29,510 25,426 28,250 28,234 28,234 28,234 28,234 28,234 28,234 28,234 10,016
Inflow funds 17,718 6,923 16 16 0 0 0 0 0 0 0 0
Inflow operation 0 22,587 25,410 28,234 28,234 28,234 28,234 28,234 28,234 28,234 28,234 0
Other income 0 0 0 0 0 0 0 0 0 0 0 10,016
TOTAL CASH
OUTFLOW 17,718 24,825 24,727 26,700 26,306 26,161 26,856 26,702 26,547 26,393 24,033 0
Increase in fixed assets 17,718 0 0 0 0 0 0 0 0 0 0 0
Increase in current assets 0 5,319 661 661 0 1 0 0 0 0 0 0
Operating costs 0 17,552 19,746 21,940 21,940 21,952 21,952 21,952 21,952 21,952 21,952 0
Marketing and
Distribution cost 0 350 350 350 350 350 350 350 350 350 350 0
Income tax 0 0 0 0 487 550 1,467 1,533 1,599 1,665 1,731 0
Financial costs 0 1,604 1,764 1,544 1,323 1,103 882 662 441 221 0 0
Loan repayment 0 0 2,205 2,205 2,205 2,205 2,205 2,205 2,205 2,205 0 0
SURPLUS (DEFICIT) 0 4,685 699 1,549 1,928 2,073 1,378 1,532 1,687 1,841 4,201 10,016
CUMULATIVE CASH
BALANCE 0 4,685 5,384 6,933 8,862 10,935 12,313 13,845 15,532 17,373 21,573 31,589
28
Appendix 7.A.5
DISCOUNTED CASH FLOW ( in 000 Birr)
Item Year 1
Year
2 Year 3
Year
4 Year 5
Year
6 Year 7
Year
8 Year 9
Year
10 Year 11 Scrap
TOTAL CASH INFLOW 0 22,587 25,410 28,234 28,234 28,234 28,234 28,234 28,234 28,234 28,234 10,016
Inflow operation 0 22,587 25,410 28,234 28,234 28,234 28,234 28,234 28,234 28,234 28,234 0
Other income 0 0 0 0 0 0 0 0 0 0 0 10,016
TOTAL CASH OUTFLOW 22,911 18,548 20,742 22,290 22,779 22,852 23,769 23,835 23,901 23,967 24,033 0
Increase in fixed assets 17,718 0 0 0 0 0 0 0 0 0 0 0
Increase in net working capital 5,193 645 645 0 1 0 0 0 0 0 0 0
Operating costs 0 17,552 19,746 21,940 21,940 21,952 21,952 21,952 21,952 21,952 21,952 0
Marketing and Distribution cost 0 350 350 350 350 350 350 350 350 350 350 0
Income (corporate) tax 0 0 0 487 550 1,467 1,533 1,599 1,665 1,731 0
NET CASH FLOW -22,911 4,039 4,668 5,944 5,455 5,382 4,465 4,399 4,333 4,267 4,201 10,016
CUMULATIVE NET CASH FLOW -22,911
-
18,871 -14,203 -8,259 -2,804 2,578 7,043 11,442 15,775 20,042 24,242 34,258
Net present value -22,911 3,672 3,858 4,466 3,726 3,342 2,520 2,257 2,021 1,809 1,619 3,862
Cumulative net present value -22,911
-
19,239 -15,380
-
10,915 -7,189 -3,847 -1,326 931 2,952 4,762 6,381 10,243
NET PRESENT VALUE 10,243
INTERNAL RATE OF RETURN 18.25%
NORMAL PAYBACK 6 years
Related Documents