Profile of Short Line Railroads in High Grain Production States Michael W. Babcock Department of Economics Kansas State University Manhattan, KS 66506 Author Contact: Michael W. Babcock, [email protected], 785-532-4571 USDA Contacts: Jesse Gastelle, [email protected], 202-690-1144 Adam Sparger, [email protected], 202-205-8701 Peter Caffarelli, [email protected], 202-690-3244 Recommended Citation: Babcock, Michael W. Profile of Short Line Railroads in High Grain Production States. January 2018. Kansas State University. Acknowledgements: This work was supported by Cooperative Agreement Number Agreement 16-TMTSD-KS-0005, with the Agricultural Marketing Service (AMS) of the U.S. Department of Agriculture (USDA). Sidonia McKenzie provided valuable technical support and Crystal Strauss typed the manuscript. Thanks go to the short line managers and State DOT personnel whose cooperation made this project possible. Disclaimer: The opinions and conclusions expressed do not necessarily represent the views of USDA or AMS.

Profile of Short Line Railroads in High Grain Production ... of Short... · Profile of Short Line Railroads in High ... Adam Sparger, [email protected], 202-205-8701 Peter
Aug 29, 2018
Welcome message from author
This document is posted to help you gain knowledge. Please leave a comment to let me know what you think about it! Share it to your friends and learn new things together.
Transcript

Profile of Short Line Railroads in High
Grain Production States
Michael W. Babcock
Department of Economics
Kansas State University
Manhattan, KS 66506
Author Contact:
Michael W. Babcock, [email protected], 785-532-4571
USDA Contacts:
Jesse Gastelle, [email protected], 202-690-1144
Adam Sparger, [email protected], 202-205-8701
Peter Caffarelli, [email protected], 202-690-3244
Recommended Citation: Babcock, Michael W. Profile of Short Line Railroads in High Grain
Production States. January 2018. Kansas State University.
Acknowledgements: This work was supported by Cooperative Agreement Number Agreement
16-TMTSD-KS-0005, with the Agricultural Marketing Service (AMS) of the U.S. Department of
Agriculture (USDA). Sidonia McKenzie provided valuable technical support and Crystal Strauss
typed the manuscript. Thanks go to the short line managers and State DOT personnel whose
cooperation made this project possible.
Disclaimer: The opinions and conclusions expressed do not necessarily represent the views of
USDA or AMS.

1
EXECUTIVE SUMMARY
What is the issue and how does the study address it?
Historically, short line railroads have played an important role in the transportation of
agricultural products. Additional, up-to-date information is needed about the current short line
rail industry and its relationship to agricultural transportation. The purpose of this study is to
assess the state of the short line railroad industry and its role in the grain logistics system,
including who they are, where they are, which agricultural products they ship in major grain
corridors, and in what amounts. Specific objectives include: (1) developing a list of Federal and
State short line assistance programs, (2) surveying the operating characteristics of short line
railroads, (3) assessing the characteristics of short line agricultural carload traffic, and (4)
identifying managers’ perceptions on which service characteristics are most important in
determining short line success.
How was the study conducted?
The methodology involves personal interviews and surveys of executives of short line railroads
and State Department of Transportation (DOT) railroad personnel from 17 States: Iowa, Illinois,
Nebraska, Minnesota, Kansas, South Dakota, Indiana, North Dakota, Ohio, Missouri, Wisconsin,
Texas, Michigan, Montana, Oklahoma, Idaho, and Washington. The study area was selected on
the basis of large crop production and geographic diversity. There is at least one agriculturally-
oriented short line in each of these States. In some cases, a short line will own other short lines,
in which case each was counted separately, so altogether the sample includes 47 agriculture-
oriented short lines.
In the summer of 2016, personal interviews of short line personnel were conducted in the States
of Kansas, Oklahoma, Missouri, Nebraska, Iowa, and Illinois. The rest of the sample short lines
were contacted by phone. Eighty-six percent of the railroads contacted completed a detailed
survey.
DOT personnel from the 17 States were contacted by phone. Fourteen of them completed a
separate survey that included questions on the characteristics of the State short line assistance
programs, eligibility requirements, benefits and costs, and the impact of short line assistance
programs on short line profitability and rural economic development. Three of the contacted
States – South Dakota, Missouri, and Texas – do not have railroad assistance programs and
therefore did not complete the survey.
What did the study find?
The study examines characteristics of agricultural carload data for four types of traffic by
commodity—originated, terminated, local, and overhead, which are outlined below.
1. Originated – Carload shipments of a commodity loaded on a respondent’s railroad
that have not had previous rail transportation and which terminate on another railroad.
2. Terminated – Carload shipments of a commodity that originated on another railroad
but are unloaded off the respondent’s railroad with no further rail transportation to
follow.
2
3. Local – Carload shipments of a commodity that both originate and terminate on a
respondent’s railroad.
4. Overhead – Carload shipments of a commodity that both originate and terminate on
other railroads but that are carried by the respondent’s railroad in between.
Of the total carload traffic moving by short line railroad in 2015, 273,317 were originated
carloads, 54,584 were terminated carloads, 38,263 were local carloads, and 90,358 were
overhead carloads. For originated traffic, corn, soybeans, wheat, and distillers dried grains with
solubles (DDGs) account for 95 percent of carloads, with corn comprising 43 percent of the total.
For terminated traffic, corn, wheat, and fertilizer accounted for nearly 90 percent of carloads,
with corn comprising 46 percent of the total. For local traffic, corn, wheat, and soybeans
collectively accounted for nearly all carloads, with corn comprising 65 percent of the total. For
overhead traffic, corn, wheat, sorghum, and oats accounted for 62 percent of carloads.
The majority of the sampled short lines are “not dependent” on Class I railroads for locomotives,
but half the short lines said they are “very dependent” on Class I’s for rail cars. The study also
found that 66 percent of the total short line track miles in the sample are capable of handling
286,000 pound rail cars.
Managers of sampled short lines cited motor carriers as competition, more often than other
modes of transport, for all four carload traffic types. The commodities most subject to intermodal
competition are corn, wheat, and soybeans for originated traffic; corn, wheat, and fertilizers for
terminated traffic; corn, wheat, and soybeans for local traffic; and wheat and corn for overhead
traffic.
Managers answered four open ended questions about competition facing short line railroads and
are evenly split on whether changes in the grain logistics system (e.g., the increased use of Class
I shuttle trains) are a threat or an opportunity to their railroad’s competitiveness. For example,
managers of short lines were asked whether their agricultural traffic will increase or decrease if
current trends continue (i.e. focus on shuttle trains and increased ethanol production). Only six
railroads expected their agriculture-related traffic to decrease, while 18 railroads expected an
increase, and 17 expected no change.
In addition, the sampled short line managers were asked if Class I railroad policy (i.e. shuttle
train loaders) affect competition between trucks and short lines. Of the 39 short lines that
answered the question, 77 percent responded they “agree” that Class I policy affects competition
between trucks and short lines.
Short line managers were asked how other transportation modes are becoming more of a
challenge to short line success. The short lines pointed to lower truck fuel prices and, thus, lower
truck rates. Also, increased truck size and weight were frequently mentioned. The short lines
mentioned that shuttle trains on Class I railroads have resulted in increased trucking to these
locations as opposed to increased short line shipments.
The study includes a profile of successful (profitable) short lines based on survey responses from
short line managers. Collectively, they chose strong shipper support levels as the single most
important factor followed by adequate traffic levels and access to more than one connecting
carrier.
3
TABLE OF CONTENTS
Executive Summary ........................................................................................................................ 1
What is the issue and how does the study address it? ................................................................. 1
How was the study conducted? ................................................................................................... 1
What did the study find? ............................................................................................................. 1
Table of Contents ............................................................................................................................ 3
List of Tables .................................................................................................................................. 5
List of Figures ................................................................................ Error! Bookmark not defined.
Introduction ..................................................................................................................................... 7
Definition of Short Lines ............................................................................................................ 7
Objectives ................................................................................................................................... 8
Literature Review........................................................................................................................ 8
Methodology ............................................................................................................................. 11
Overview of the Short Line Role in Major Grain Supply Chains............................................. 12
The Structure of the U.S. Short Line Railroad Industry ............................................................... 13
Federal and State Short Line Financial Assistance Programs ...................................................... 13
Federal Programs ...................................................................................................................... 13
State Programs .......................................................................................................................... 13
Idaho ..................................................................................................................................... 14
Indiana................................................................................................................................... 14
Illinois ................................................................................................................................... 15
Iowa....................................................................................................................................... 16
Kansas ................................................................................................................................... 16
Michigan ............................................................................................................................... 17
Minnesota .............................................................................................................................. 17
Montana ................................................................................................................................ 18
North Dakota ......................................................................................................................... 19
Ohio....................................................................................................................................... 19
Oklahoma .............................................................................................................................. 20
Washington ........................................................................................................................... 20
Wisconsin .............................................................................................................................. 21
Results of the Short Line Railroads and Agriculture Survey ........................................................ 22

4
Results – Part A – General Information .................................................................................... 22
Results – Part B –Traffic........................................................................................................... 26
Results – Part C – Equipment ................................................................................................... 29
Results – Part D – Markets and Competition............................................................................ 32
Results – Part E – Open Ended Questions ................................................................................ 36
Question 1: Are shifts in Class I pricing and the move to shuttle trains in grain transport
creating an opportunity or a threat to your railroad’s competiveness? ................................. 36
Question 2: Will your agricultural traffic increase or decrease if current trends continue (i.e.,
focus on shuttle trains and increased ethanol production)? .................................................. 36
Question 3: Does Class I railroad policy (i.e., shuttle train loaders) affect competition
between trucks and short lines? ............................................................................................ 36
Question 4: What modes are becoming more of a challenge to short line success? Why is
this so? .................................................................................................................................. 36
Short Line Success Profile ............................................................................................................ 37
Conclusion .................................................................................................................................... 38
References ..................................................................................................................................... 40
Appendix A: Short Line Railroads and Agriculture Survey ......................................................... 42
Appendix B: Survey of State Assistance Programs for Short Line Railroads .............................. 48
Appendix C: Selected Survey Data and Question Responses ...................................................... 49
Question 1 ............................................................................................................................. 55
Question 2 ............................................................................................................................. 57
Question 3 ............................................................................................................................. 57
Question 4 ............................................................................................................................. 58

5
LIST OF TABLES
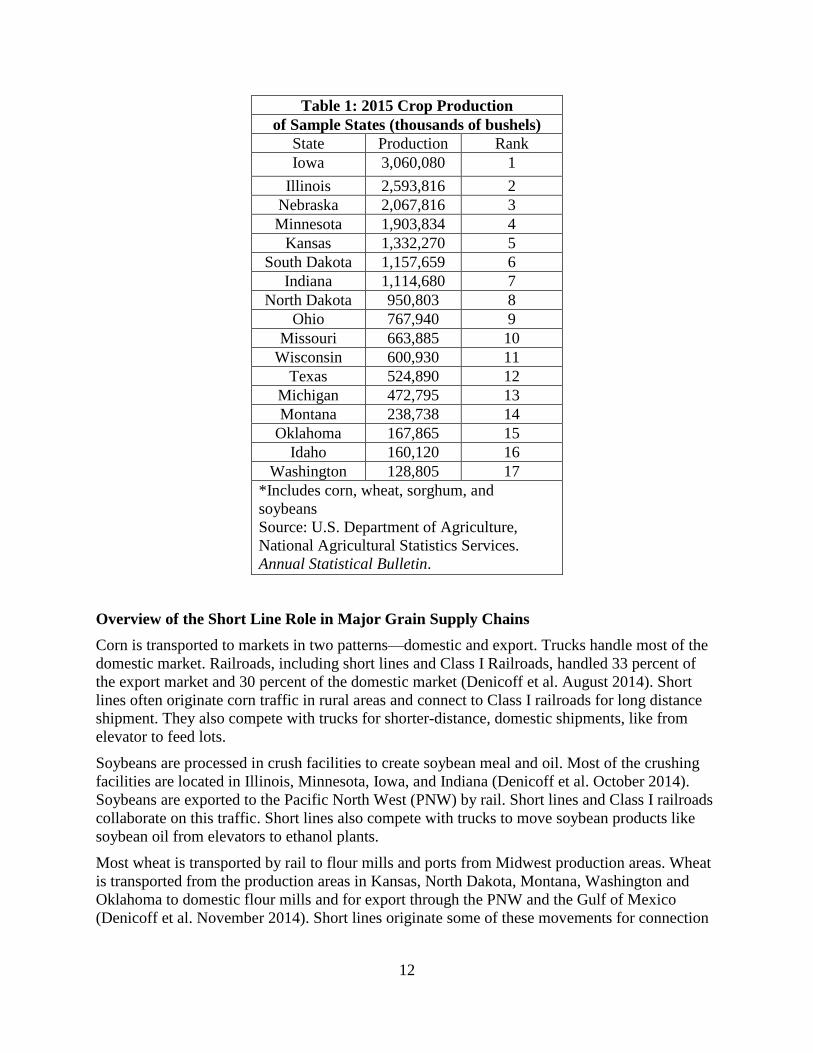
Table 1: 2015 Crop Production ..................................................................................................... 12
Table 2: Decade of Start of Operations of Agriculture Oriented Short Lines .............................. 23
Table 3: Distribution of Total Track Miles and 286K Track Miles .............................................. 24
Table 4: 2015 Originated Agricultural Carloads by Commodity ................................................. 27
Table 5: 2015 Terminated Agricultural Carloads by Commodity ................................................ 27
Table 6: 2015 Local Agricultural Carloads by Commodity ......................................................... 28
Table 7: 2015 Overhead Carloads by Commodity Including Outlier Railroad ............................ 28
Table 8: Total Carloads With and Without Outlier Overhead Carloads by Type of Traffic ........ 29
Table 9: Short Line Dependence on Connecting Class I Railroads for Locomotives and Rail Cars
....................................................................................................................................................... 32
Table 10: Number of Railroads Identifying Agricultural Commodities as Subject to Intermodal
Competition – Originated Traffic ................................................................................................. 33
Table 11: Number of Railroads Identifying Agricultural Commodities as Subject to Intermodal
Competition – Terminated Traffic ................................................................................................ 34
Table 12: Number of Short Lines Identifying Agricultural Commodities as Subject to Intermodal
Competition – Local Traffic ......................................................................................................... 35
Table 13: Number of Short Lines Identifying Agricultural Commodities as Subject to Intermodal
Competition – Overhead Traffic ................................................................................................... 35
Table 14: Characteristics of Short Line Railroads Ranked by Rail Managers ............................. 38
Table 15: 2015 Employment Distribution by Size in Sample Short Lines ................................... 49
Table 16: Percent of Total Track Miles That Are Capable of Handling 286,000 Pound Rail Cars
....................................................................................................................................................... 50
Table 17: Number of Sample Short Line Connections to Other Railroads, Ranked the Highest to
the Lowest ..................................................................................................................................... 51
Table 18: Sample Short Lines Leased and Owned Locomotives, 2015 ....................................... 52
Table 19: Sample Short Lines Leased and Owned Rail Cars, 2015 ............................................. 53
Table 20: Sample Short Line Annual Investment to Maintain Rail Tracks and Road Bed,
Maintenance Expenditure Per Mile .............................................................................................. 54
6
Figure 1: Distribution of Short Line Railroads by Short Line Size .............................................. 23
Figure 2: Distribution of Total Employment by Short Line Size ................................................. 24
Figure 3: Distribution of Short Line Railroads by Percent of Track that is 286K Capable .......... 25
Figure 4: Distribution of Total Short Line Track Miles by Percent of Track that is 286K Capable
....................................................................................................................................................... 25
Figure 5: Distribution of Short Line Railroads by Connections to Other Railroads .................... 26
Figure 6: Distribution of Short Lines by Locomotives Owned and Leased ................................. 30
Figure 7: Distribution of Short Lines by the Percentage of Locomotives Owned........................ 30
Figure 8: Distribution of Short Lines by Total Rail Cars ............................................................. 31
Figure 9: Distribution of Short Lines by Percentage of Railcars Owned ..................................... 31
Figure 10: Distribution of Short Lines by Investment Expenditure per Mile ............................... 32
7
INTRODUCTION
The Central Plains region leads the Nation in many areas of agricultural activity. In terms of total
production of corn, wheat, sorghum, and soybeans, Iowa leads the Nation and is followed by
Illinois, Nebraska, Minnesota, and Kansas. Because many locations in these States are remote
from markets and processing centers, they are dependent on railroads for transport of their grain.
Following the deregulation of railroad markets with the passage of the Staggers Rail Act in 1980,
Class I railroads adopted a cost reduction strategy that involved the sale or lease of their branch
lines to short line railroads rather than abandon the lines altogether. Today, in the eight leading
wheat producing States, short lines collectively account for about one-third of the total track
miles in that region. These short lines provide rail service to many rural shippers whose access to
rail service might otherwise have been lost. Abandonment of rail lines has several potential
negative effects on rural areas, such as lower grain prices received by farmers, higher
transportation costs and reduced profits for rail shippers, loss of market options for rural
shippers, foreclosed economic development options in rural communities, and higher road
maintenance and reconstruction costs.
Short lines play a critical role in originating and terminating grain transported by rail and
promoting economic development along these lines. Particularly important is providing rail
service to rural America with the ability to access the Class I rail network. In the decade
following 1980, more than 250 short lines were formed, adding to the approximately 220 short
lines that existed as of 1980 (Llorens and Richardson 2014). Their numbers continue to increase
with 562 short lines operating in 2016 (AAR 2016).
Many changes have occurred in the grain logistics system since deregulation in 1980, and this
paper seeks to explain how those changes have affected short line railroad viability.
Definition of Short Lines
The Surface Transportation Board (STB)—the Federal regulatory agency charged with
overseeing railroad rate and service disputes—defines railroads into three classes based on their
operating revenue. For 2016:
Class I railroads have operating revenues of $447.62 million or more.
Class II railroads have $35.81 million or more but less than the Class I threshold.
Class III railroads have less than the Class II minimum.
These thresholds are adjusted annually for inflation (AAR 2017). In addition, all switching and
terminal railroads are classified as Class III railroads.
The term “short line” refers to all Class II and III railroads. The AAR identifies two groups of
non-Class I railroads based on revenue and mileage characteristics. Regional railroads are line-
haul railroads below the Class I revenue threshold operating at least 350 miles of road and
earning at least $20 million in revenue or earning revenue between $40 million and the Class I
revenue threshold regardless of mileage operated. Local railroads are line-haul railroads below
the Regional criteria plus switching and terminal railroads (AAR 2017).
8
Objectives
The overall objective of this study is to assess the state of the short line industry and its role in
the grain logistics system, including who they are, where they are, which agricultural products
they ship in major grain corridors, and in what amounts. The specific objectives are: (1)
developing a list of Federal and State short line assistance programs, (2) surveying the operating
characteristics of short line railroads, (3) assessing the characteristics of short line agricultural
carload traffic, and (4) identifying managers’ perceptions on which service characteristics are
most important in determining short line success.
Literature Review
Most short line railroad research in the last 20 years focuses on the economic benefits of short
line railroads and the difficulty they face in maintaining their tracks and bridges.
Resor et al. (2000) conducted a study on the effects of 286,000 pound railcars on the U.S short
line and regional railroad system. The objectives of the study were to estimate the amount of
short line and regional railroad trackage which met minimum standards for the use of heavy axle
load (HAL) rail cars, and to estimate the investment in components required to bring the entire
short line and regional railroad system up to the minimum standard. Resor et al. (2000)
developed a survey of track conditions and characteristics for the U.S. short line and regional
railroad industry. A questionnaire was sent to all American Short Line and Regional Railroad
Association members and 46 railroads responded. The study found that the U.S. 50,000-mile
short line and regional railroad system would need 10 thousand miles of new rail and 20 million
ties to bring the entire system up to minimum standard. The total cost to upgrade the system to
handle HAL cars was estimated at $6.80 billion.
A study by Casavant and Tolliver (2001) was designed to provide information on the potential
impact of 286,000 pound railcars on light density track and short lines railroads in Washington
State. The study assessed the likelihood of heavier cars being used, and it examined the condition
of the track in the State. The study included technical analysis using railroad track models and it
was determined that 90 pounds per yard rail may perform marginally at slow speed if there is
good tie and ballast support. The authors concluded that 480 miles of track would need to be
upgraded to handle the 286,000-pound rail cars at a cost of between $250,000 and $300,000 per
mile with the total cost ranging $117 to $140 million.
Bitzan and Tolliver (2001) contains a discussion of the economics of heavy covered hopper cars.
The authors performed simulations of HAL cars to determine what track weight would be able to
handle HAL cars. Engineering equations were used to simulate track performance for light rail
and for heavier rail. The authors found that any track of less than 90 pounds per yard to be
inadequate for HAL rail car traffic.
In 2003, Bitzan and Tolliver provided insights into specific areas where abandonment was likely
to occur. Abandonment was treated as a result of an inability to handle 286,000-pound rail cars
and insufficient returns from investment in track upgrades. The study modeled a railroad’s
decision to upgrade as an investment decision. A firm will invest in a project as long as the
internal rate of return to the project exceeds the return available from alternative investments.
The investment decision approach to line upgrading was a unique aspect of this study. The
authors concluded that railroads were unlikely to upgrade a short line with traffic of less than 200
cars per mile. However, the study also discussed alternatives to abandonment. Longer term
9
financing may allow short lines to upgrade track with traffic density of 150 cars per mile. They
said increased revenue splits with Class I railroads and partial subsidies in the amount of avoided
highway damage would also provide greater incentives to upgrade track.
Martens (1999) examined the effects of 286,000 pound rail cars on U.S. short line and regional
railroads. He developed a 16 question survey which was sent to 88 railroads and 39 were
returned. The survey requested information on the amount of track miles likely to be closed or
upgraded due to use of HAL cars. It also requested the effects of HAL cars on train speed and
how shippers would be affected. In addition Martens (1999) analyzed the impacts of rail line
abandonments attributable to use of HAL railcars. The study found that 38 percent of the U.S.
short line rail system was incapable of handling 286,000 pound rail cars even at the slowest
operating speeds. It was also determined that the average track upgrading cost for lines which
would otherwise be abandoned due to increased use of HAL cars would be $118,662 per mile.
Babcock and Sanderson (2006) published a study titled “Should Short line Railroads Upgrade
Their Systems to Handle Heavy Axle Load Cars?” Motivated by lower costs per ton-mile, U.S.
Class I railroads have been replacing 263,000 pound covered hopper cars with 286,000 pound
cars. In many cases, short line railroads would have to upgrade their tracks and bridges to handle
the heavier cars. The authors used rate of return analysis for a sample of U.S. short lines to
determine if short line owners will likely upgrade their infrastructure or abandon the railroad.
Analysis revealed that the total cost to upgrade 1,583 miles of mainline track and 1,352 bridges
of five short lines in Kansas was estimated to be $308.7 million. None of the short lines in the
analysis can earn an adequate rate of return on upgrading track and bridge investment. If the
short lines in the study are abandoned, the annual road damage cost will increase by over $58
million.
The Iowa Department of Transportation study (2002) was motivated by the State’s recognition of
the need to assess the potential magnitude of rail line abandonment due to increasing use of HAL
railcars. An important aspect of the study was the physical inspection of 97 percent of the short
line track in Iowa. Track information, such as weight and general condition, was recorded during
the inspection. Data was collected on the number of good ties per 39 feet rail length and depth
and condition of ballast. Logic tables from Resor (2000) were used to evaluate track components
and necessary upgrading costs were calculated. Costs were calculated using material and labor
costs from railroads. The minimum short term cost reflected immediate needs utilizing
“marginal” rail and upgrading of ties and ballast to an “OK” status. The minimum short term
upgrade cost was estimated at $117,000 per mile or a total of $297 million for the State. The
study also determined a long term cost of $154,000 per mile.
Sage et al. (2015) develop an inventory of short line rail infrastructure that can be used to support
a data-driven approach to identifying rail system needs. The study provided an inventory of
existing infrastructure conditions on short line railroads in Washington State. It developed a
detailed, preliminary estimate of the total investment needed to bring the system up to modern
industry standards. The study contained case studies highlighting the role short line railroads and
regional transload centers play within the State’s regional economies. The study provided a
review of funding strategies employed by other States to support short line railroads. They found
that more than 55 percent of all short line miles within Washington are not able to efficiently
handle 286,000-pound rail cars. Overcoming this deficiency would require infrastructure
investments of about $610 million. The authors said that this need exceeds the current funding

10
support by the state even if considered over a 20-year horizon with private industry and/or local
jurisdictions providing significant matching funds. The study also found that much of the
existing short line system in Washington does not meet the state’s current or future capacity and
velocity needs for efficient operations. Productivity and safety of the system suffers from
deferred maintenance. For example, over 55 percent of the short lines’ road miles are less than
112-pound rail, the recommended weight to efficiently operate 286,000-pound rail cars.
Jared Llorens and James A. Richardson (2015) assessed the economic role and impact of short
line railroads in the state of Louisiana in “Economic Impact of Short Line Railroads.” According
to the authors, short line railroads are small but significant components of the state’s business
connections. They describe the scope and presence of the 11 short line railroads currently
operating in Louisiana paying attention to their role in facilitating the transportation of goods to
and from Class I railroads. Next they provide a detailed description of the broader economic
contribution of short line railroads focusing on employment levels and industries served as well
as estimates of the economic impact of the short line railroads on the State and selected regions
of the State. The authors found that short lines account for about 1,821 direct and indirect jobs in
the State. They found that short lines directly support the State’s leading industries (agriculture,
oil, and gas) which represent the major drivers of the State’s overall economy. These major
industries support over 260,000 jobs or close to 15 percent of all jobs in the State, and these core
industries create the opportunity for other businesses to be successful. Also, they discuss short
line policies that should be considered by Louisiana. These include: (1) State rehabilitation
grants, (2) State loan programs, (3) State loan/grant hybrid programs.
U.S. Department of Transportation, Federal Railroad Administration examined short line capital
needs and government assistance programs in Summary of Class II and Class III Railroad
Capital Needs and Funding Sources (2014). The report says short line railroads have relied on
State and Federal programs to invest in infrastructure and maintain facilities. Many States have
robust programs to assist short line railroads. At the Federal level short lines can access loans
through the Railroad Rehabilitation and Improvement Financing (RRIF) program. Also the
Transportation Infrastructure Generating Economic Recovery (TIGER) Program has a
competitive grants program. The 456 tax credit is another Federal assistance program. The report
notes that many States have implemented short line railroad assistance programs that provide
low interest loans and grants to improve service, upgrade tracks and bridges, and add capacity.
Local benefits of the assistance programs include increased farm and business opportunities,
shipper cost saving and avoided business closures.
Qiao et al. authored Transportation and Economic Impact of Texas Short Line Railroads (2010).
The authors sent survey invitations to 43 Texas short line railroads and 20 responses were
received. The software IMPLAN was used to measure the economic impact of short line
railroads at both the state and county levels. Transportation impact analysis was conducted to
estimate the cost by rail and the cost by truck. Shipping cost, safety cost, maintenance cost,
highway congestion costs, and emission cost were calculated in the analysis. Results indicated
that on average, the shipping cost of a short line is 7.5 percent less than truck. The total
transportation cost of short lines is 24.3 percent less than that of truck. The estimation also shows
that the operation of 14 surveyed short lines took 417,177 trucks off Texas highways in 2015.
The economic impact analysis results indicate that, at the state-level, the operation of short line
railroads in Texas contribute about 1,416 jobs, $113,769,627 in labor compensation, and
$354,443,588 in economic output. The report also found that Texas short lines have substantial

11
infrastructure needs. The need for more State funding was mentioned by several railroads during
the survey and interviews. As Texas short lines play a significant role in the State economy there
is a necessity to establish assistance programs for short lines to help maintain and improve the
existing infrastructure according to the authors. However, most Texas short lines do not have
sufficient revenues or access to the large amounts of capital that are necessary to rehabilitate
their infrastructure. Track and bridge conditions often cause short lines to operate at minimal
train speed which reduces operating efficiency and limits their ability to attract new business to
the line.
Methodology
This study’s methodology involves personal interviews and surveys of executives of short line
railroads and State Department of Transportation (DOT) rail personnel. The sample States are
listed in Table 1. They were selected on the basis of large crop production and geographic
diversity. In addition, there is at least one agriculturally-oriented short line in each of these
States. In some cases, a short line will own other short lines, in which case each was counted
individually, so all together the sample includes 47 agriculturally-oriented short lines. The survey
(Appendix A) has five parts: (1) General Questions, (2) Traffic by Commodity, (3) Equipment,
(4) Markets and Competition, and (5) Short Line success profile.
In the summer of 2016, personal interviews of short line personnel were conducted in the States
of Kansas, Oklahoma, Missouri, Nebraska, Iowa, and Illinois. The rest of the sampled short lines
were contacted by phone. Eighty six percent of the railroads contacted completed the detailed
survey.
DOT personnel from the 17 States were contacted by phone. Fourteen of them completed a
separate survey that included questions on the characteristics of the State short line assistance
programs, eligibility requirements, benefits and costs, and the impact of short line assistance
programs on short line profitability and rural economic development (Appendix B). Three of the
contacted States – South Dakota, Missouri, and Texas – do not have railroad assistance programs
and therefore did not complete the survey.
Data was supplied on the condition that the railroad’s data not be identified by the railroad’s
name in the final report. Since the study is focused on the agriculturally-oriented railroads as a
group, no individual railroad was identified in this report.
Carload survey responses were categorized according to the base agricultural commodity. The
“corn” category encompasses corn, corn oil, corn syrup, corn gluten, corn starch, corn germ, and
wet corn milling. The category labeled “soybeans” encompasses soybeans, soy bean meal,
soybean cake, soybean oil, soybean flour and soybean flake. The category labeled “fruits and
vegetables” encompasses vegetable oil, vegetable oil seed cake, canned fruits, frozen vegetables,
vegetable meal, and catsup/tomato sauce.
12
Table 1: 2015 Crop Production
of Sample States (thousands of bushels)
State Production Rank
Iowa 3,060,080 1
Illinois 2,593,816 2
Nebraska 2,067,816 3
Minnesota 1,903,834 4
Kansas 1,332,270 5
South Dakota 1,157,659 6
Indiana 1,114,680 7
North Dakota 950,803 8
Ohio 767,940 9
Missouri 663,885 10
Wisconsin 600,930 11
Texas 524,890 12
Michigan 472,795 13
Montana 238,738 14
Oklahoma 167,865 15
Idaho 160,120 16
Washington 128,805 17
*Includes corn, wheat, sorghum, and
soybeans
Source: U.S. Department of Agriculture,
National Agricultural Statistics Services.
Annual Statistical Bulletin.
Overview of the Short Line Role in Major Grain Supply Chains
Corn is transported to markets in two patterns—domestic and export. Trucks handle most of the
domestic market. Railroads, including short lines and Class I Railroads, handled 33 percent of
the export market and 30 percent of the domestic market (Denicoff et al. August 2014). Short
lines often originate corn traffic in rural areas and connect to Class I railroads for long distance
shipment. They also compete with trucks for shorter-distance, domestic shipments, like from
elevator to feed lots.
Soybeans are processed in crush facilities to create soybean meal and oil. Most of the crushing
facilities are located in Illinois, Minnesota, Iowa, and Indiana (Denicoff et al. October 2014).
Soybeans are exported to the Pacific North West (PNW) by rail. Short lines and Class I railroads
collaborate on this traffic. Short lines also compete with trucks to move soybean products like
soybean oil from elevators to ethanol plants.
Most wheat is transported by rail to flour mills and ports from Midwest production areas. Wheat
is transported from the production areas in Kansas, North Dakota, Montana, Washington and
Oklahoma to domestic flour mills and for export through the PNW and the Gulf of Mexico
(Denicoff et al. November 2014). Short lines originate some of these movements for connection

13
to Class I railroads, particularly with exports, and for shorter-distance, domestic shipments to
flour mills.
THE STRUCTURE OF THE U.S. SHORT LINE RAILROAD INDUSTRY
Short line railroads have grown from 8,000 miles of track in 1980 to 47,500 miles in 2017
(ASLRRA 2017). In 2015, there were 24 Class II railroads and 579 Class III railroads (ASLRRA
2017, p. 12) that transport agriculture, chemicals, coal, lumber, paper, metal products, motor
vehicles, petroleum products, and trailers and containers. In 2015, carloads of grain and food
products ranked second behind intermodal for short line carload traffic with slightly more than 1
million carloads, 12 percent of total 2015 carloads (ASLRRA 2017, p. 11).
A notable change in the short line industry has been the consolidation of the Class III railroads
under the control of holding companies. In 2014, there were 27 holding companies that control
nearly 270 short lines (Federal Railroad Administration 2014). Holding companies have
geographic and commodity diversity resulting in a lower risk of default on loans. Holding
companies have relied on multiple sources of funds to finance infrastructure projects, but have
identified many remaining investments to be made, particularly the upgrade of track to handle
286,000 pound rail cars as well as the repair and replacement of bridges.
FEDERAL AND STATE SHORT LINE FINANCIAL ASSISTANCE PROGRAMS
Many short lines defer maintenance on their tracks because they do not have enough revenue
(Sage et al. 2015). Given the significant public benefits of short lines, the Federal government
and many States have instituted financial assistance programs to help them develop their
infrastructure. Many States have short line assistance programs with the goal of ensuring
transportation options and maintaining a balanced transportation program.
Federal Programs
Since 1998, the Railroad Rehabilitation and Improvement Financing (RRIF) program has
provided over $70 million in loans to Class II and III railroads (Sage et al. 2015). The act and its
amendments provided loans to improve or rehabilitate intermodal facilities and railroad
equipment of Class II and III railroads.
In 2004, a Federal short line tax credit, commonly known as a 45G, was passed to enable and
encourage private investment in rail line rehabilitation. The 45G is a Federal tax credit for up to
50 percent of track maintenance and qualified infrastructure expenses. The maximum credit
available to a short line is determined by the product of the short line’s total track miles
multiplied by $3,500. Total track miles includes the number of miles of railroad track owned or
leased by the short line, as well as the number of miles of railroad track assigned to the short line
by a Class II or Class III railroad which owns or leases such railroad track.
In 2009, the American Recovery and Reinvestment Act (ARRA) was passed. It is more
commonly known as the law that authorized the very popular Transportation Investment
Generating Economic Recovery (TIGER) grants. TIGER grants are typically used to leverage
other funds for larger projects (Sage et al. 2015).
State Programs
State assistance to short lines can be classified into three categories: (1) rehabilitation grants, (2)
loan programs, and (3) loan/grant hybrid programs. Rehabilitation grants award funds on a
14
competitive basis for capital improvements that directly benefit economic development interests
(Llorens and Richardson 2014). This would include construction of a new line, existing track
upgrades, or construction of rail yards. State loan programs are intended to provide financing
alternatives for short line railroads where there may not be viable financing for capital
improvements. This would include rail track upgrades, as well as purchasing or rehabilitating rail
equipment necessary to maintain essential rail service. Loan/grant hybrid programs combine
elements of both grants and loans.
While the State programs differ in form, they all support the goal of maintaining a viable short
line network in their State, given the challenge of handling 286,000 pound rail cars (Llorens and
Richardson 2014). Questions 1 and 2 of the DOT survey (Appendix B) deal with the
characteristics and eligibility requirement aspects of short line assistance programs of the sample
States with the exception of Nebraska, South Dakota, and Texas which don’t have assistance
programs for short lines. Questions 3 and 4 deal with the economic effects of State short line
assistance programs (Appendix B).
Idaho
Idaho established the Rural Economic Development and Integrated Freight (REDIFiT) program
in 2006, which is administered by the Idaho State Department of Agriculture (ISDA). The
program serves the State’s interest in maintaining competitive transportation services for Idaho’s
freight shippers, reducing public road maintenance and repair costs, increasing economic
development opportunities, increasing domestic and international trade, creating and preserving
jobs, and enhancing safety.
To qualify for a loan, the project must assist qualified rail lines or intermodal freight shippers to
upgrade, expand, rehabilitate, purchase, or modernize equipment and facilities for freight
shipping infrastructure. Loans are administered through a revolving loan fund by ISDA. The loan
amount can be up to 90 percent of the total project cost with 10 percent supplied by the
applicant, who must demonstrate to the satisfaction of ISDA and an interagency working group
the ability to repay the loan and provide one or more forms of collateral. The main costs are
associated with loan administration.
Grants are capped at $100,000 annually with the intent to support planning and development of
Intermodal Commerce Authorities. Grants are limited to projects that support the planning and
development of Intermodal Commerce Authorities.
According to survey responses, the primary benefit of the assistance programs is in facilitating a
short line railroad’s ability to upgrade aging tracks while maintaining profitability with low
profit margins. The program allows short lines to upgrade tracks and make essential connections
to Class I railroads in southern Idaho which have a positive effect on the railroads’ profitability.
In particular, this has allowed one short line to serve the agricultural community in southern
Idaho, and its track upgrades have enhanced its ability to connect to a Class I railroad.
Indiana
Indiana has two short line assistance programs, the Grade Crossing Fund (GCF) and the
Industrial Rail Service Fund (IRSF), started in 1999. Because the GCF is a safety program, the
grant requirement is simplified by requiring only a completed application from either a railroad
or port authority that is in good standing with the Indiana Department of Transportation
(INDOT). Local public agencies, in addition to short line railroads and port authorities, are

15
eligible to receive grants from the GCF. Eligible grant projects include LED installation, signage,
sight obstruction removal, and crossing service maintenance. The State pays 100 percent of
material costs for LEDs and signage and 50 percent of the cost for sight obstruction removal and
crossing surface.
Under the IRSF, eligible short line railroads and port authorities can apply for loans and grants
for tie and/or ballast replacement, rail replacement, bridge construction/repair, rail spur or siding
projects, or other types of rail infrastructure projects. The State pays 75 percent of the total
project cost, not to exceed $300,000. The IRSF program requires a more detailed application – a
project outline and description, management information, detailed project budget, and annual
report data -- and that the railroad be current on INDOT reporting requirements. Railroads are
encouraged to provide more than 25 percent of project costs.
Reported benefits of the GCF are safety improvements at rail-highway intersections with the
goal of reducing accidents. The benefits of IRSF have been the preservation of rail service, and
infrastructure improvement on short line railroads.
Indiana legislators, industry specialists, and local units of government believe that since railroads
are the most capital intensive industry, programs like the IRSF and GCF allow railroads to be
more competitive in their rate structure through publically shared capital expenditures to include
upgrading their lines to handle 286,000 pound rail cars.
Illinois
Illinois has the Rail Freight Program administered by the Illinois DOT. The program provides
assistance for freight rail capital improvements to railroads, rail shippers, as well as local
communities. The project must provide a public benefit (i.e. job creation/retention or transport
cost saving) and show a benefit cost ratio of 1.0 or greater to be eligible. However, it doesn’t
provide assistance for maintenance expenses or equipment purchases. Program-funded
improvements must be maintained for a minimum of five years (or in the case of loans, for the
duration of the loan period) by the applicant to ensure benefits are achieved that justify the
project. The State reviews the financial condition of the applicant before a loan or grant is
awarded to verify the ability of the applicant to meet the requirements of the loan/grant
agreement.
The program can provide both loans and grants. The State’s share of short line assistance varies
depending on the project. The program can provide up to 100 percent of the project cost if
warranted by the specifics of the project. Between 1983 and 2007 State assistance to short lines
amounted to $2,751,097 in loans, $25,671,897 in grants, and $4,725,737 in combination of
grants/loans. According to Illinois DOT personnel, total assistance was $33,148,731 to 16
railroads.
Respondents described the primary purpose behind the Rail Freight Program as the preservation
of private sector rail service on freight lines and the promotion of economic development of a
rail-dependent industry. Within those parameters, the program provides assistance to short lines
even though it is not the primary purpose.
16
Iowa
Iowa has the Railroad Revolving Loan and Grant (RRLG) program, which is the current iteration
of a program that began in 2006. However, Iowa DOT (IDOT) has had some type of rail
assistance program since 1974. The RRLG program has three types of loans or grants.
1. Target job creation (grant of up to $12,000/job created or retained).
2. Rail network improvement loans at zero interest for up to 10 years. These are
normally directed towards railroad rehabilitation, bridge repairs or replacement, or
rail capacity improvements but can also be industrial sites without job creation.
3. Rail port feasibility studies (grant of up to $100,000) to determine the feasibility of
rail-served, shared facilities.
The selection process takes into consideration such things as increased traffic estimates and
operating or efficiency improvements. Industries, railroads, communities, and economic
development organizations are eligible to apply, but the programs require a private match
conducted on a reimbursement basis.
For targeted job creation, the State’s share is 50 percent for a grant up to the limit, but a loan is
available for any remaining balance. For rail network improvement, the State’s share is 80
percent of the loan, requiring a 20 percent match. For a rail port feasibility study, the State’s
share is 80 percent of the grant, requiring a 20 percent match up to $100,000. The amount
awarded depends on loan repayments and legislative appropriation.
For fiscal years 2016 through 2017, IDOT awarded nearly $18 million in grants and $23.7
million in loans. Of the $18 million in grants, 5.1 million was awarded to short lines. Of the
$23.7 million in loans, $12.5 million was loaned to short lines.
One of the most significant impacts of the RRLG program occurred in 2009 when severe
flooding drastically affected Iowa railroads. Short lines were asked to provide an abbreviated
application for assistance, and as a result, nearly $4 million in immediate assistance helped the
short lines speed repairs so they could service customers and reinstate revenues. The following
year, an additional $1 million was provided to one short line that had been bisected by a
destroyed bridge. Additionally, another short line accelerated a bridge replacement program and
was awarded funds in subsequent years to add resiliency from flooding. Bridge replacement and
yard and line rehabilitation for short lines have all been assisted by the RRLG program. Since
2006, the RRLG program has provided $5.1 million in grants to short lines and $17.5 million in
loans.
Short lines have been able to make improvements to serve or encourage business development,
increase yard efficiency, and improve resiliency in the event of future flooding that they may not
have been able to make happen without RRLF funding. Several of the short lines have made
good use of the funding, creating opportunities for rural economic development while increasing
revenue. Other short lines have been able to increase the level of service to customers with yard
or line improvements.
Kansas
Kansas has the State Rail Service Improvement Fund (SRSIF), which is funded annually at the
beginning of each State fiscal year. Types of assistance include track rehabilitation/maintenance,
17
track construction, and capacity improvement. Applicants have to provide estimated traffic
counts, a project description, and the cost of the project. Applications are graded on a benefit-
cost analysis and estimate of economic benefits. Railroads, port authorities, shippers, and local
units of government in coordination with the serving railroad are eligible to apply. The program
includes loans or grants or both. For loans, the State has a 40 percent loan at a 2 percent interest
rate with a 10-year payback. Kansas also provides a 30 percent reimbursable grant with a 30
percent recipient match.
The short line railroad assistance plan has had many benefits including continued rail service
(lines that would have been abandoned were not) and improved customer service (improved car
delivery times and service schedules). Other benefits include improved operating efficiencies
(increased operating speeds, improved use of crew time, and removal of slow orders), which
improves railroad profitability and allows the railroads to put additional funds into their capital
maintenance programs. The program also resulted in an increase in rail carloads, resulting in
fewer trucks on the highways and less highway maintenance costs.
The SRSIF has had a positive economic impact on rural economic development by preventing
the abandonment of many short line segments. As a result, continued service has provided rural
shippers (primarily agriculture--grain and fertilizer) a more cost effective shipping method for
both outbound and inbound carloads.
Michigan
The Michigan Rail Loan Assistance Program (MiRLAP) started in 1997. Any Michigan railroad
is eligible to apply but the program was created specifically with short lines in mind. The focus
of the program is track rehabilitation and maintenance. The funds can be used for any type of
construction or rehabilitation work that is associated with track materials and related structures
such as bridges and culverts. Projects are evaluated based on traffic volumes impacted by the
project and operational benefits.
The State’s share of short line assistance projects is 90 percent of the project costs, up to a
maximum of $1 million. Loan funds on private infrastructure are protected with collateral. The
program provides no-interest loans through a revolving loan fund that has loaned about $10.3
million to short lines and $18 million in total.
The fund has about a $7.2 million appropriation from the State. Because it is a self-sustaining
revolving loan, that appropriation has allowed MDOT to loan $18 million for preservation
investments. MiRLAP is designed to help railroads spread infrastructure costs over a 10 year
period. However, it has been under-utilized since borrowing in the private sector has become
more affordable for short lines.
For the railroads that have used the loan program, it has allowed them to make investments they
otherwise would not have the capital to do. Some projects have been directly related to increased
traffic volumes associated with new or expanding customers.
Minnesota
The Minnesota Rail Service Improvement Plan (MRSIP) was established in 1976 to preserve and
improve essential rail service. The program has 3 components:
1. Rail line rehabilitation – a no-interest loan program providing up to 70 percent (80
percent if the applicant is a regional railroad authority) of total project cost for rail

18
line rehabilitation. Rail shippers must provide 10 percent of the cost and rail carriers
must provide at least 20 percent of total project cost. This part of the program was last
used in 2002 to provide the Minnesota Valley Regional Rail Authority a $4.8 million
loan as part of a $7 million project to rehabilitate the 94-mile rail line. Projects are
eligible for funding if (a) the track does not meet FRA Class I track safety standards
or does not have the required structural capacity to support rail cars of 263,000
pounds and (b) is within the physical boundaries of, or predominantly serves rail
users in Minnesota.
2. Rail purchasing assistance – involves no interest loans to regional railroad authorities
to purchase rail corridors either abandoned or in danger of abandonment. Loans are
typically made for up to 50 percent of the lines value. Repayment of the loan is not
required as long as the rail line remains in operation and is not sold. If rail operations
cease for one year or the rail authority sells any part of the line, repayment is due on
negotiated terms.
3. Capital improvement projects – the most common use of the MRSI program involves
no interest loan funding to rail users for capital improvement projects up to 100
percent of the total project cost with a maximum amount of $200,000. These funds
are subject to a fixed quarterly payment schedule over 10 years.
Projects are then prioritized based on the following criteria: (a) the availability of State or
Federal program funds, (b) the probability of the rail line continuing in profitable service after
the project is completed, (c) the costs of the project compared to the benefits resulting from the
project, (d) financial participation by the rail carrier and rail users in the projects, (e) the
significance of the line in relationship to the entire State rail system, and (f) the impact on State,
county, and city access to roadways if funding is not provided.
Typical benefits of rail rehabilitation projects are decreased travel time for rail shipments
resulting in lower costs for customers, decreased railroad maintenance costs, and operational
efficiencies that can be realized and passed on to shippers such as increasing the maximum rail
car weight that can be shipped on a line. Another benefit is decreased wear and tear on highways
when highway shipments are diverted to rail or existing rail shipments are not lost to trucks
because of a more competitive rail service.
Costs generally include capital costs that can be tracked at the project level. Other components of
cost are operations and maintenance costs, but these costs are not usually reported.
Many small communities have medium-sized businesses that are rail dependent to both ship and
receive goods. The loss of rail service would be detrimental to many of these businesses because
the higher cost of other modes might be unsustainable. The MRSIP program provides short lines,
regional rail authorities, and shippers with financing tools to improve rail service and, in some
cases, prevent rail lines from embargo (service closure) due to track condition and capital needs.
Often times, the availability of such financing tools is otherwise either absent in the private
market or has an unrealistic cost for the viability of the line.
Montana
Montana’s Essential Freight Rail Loan Program (MEFRLP) funds projects that are directly
related to the Montana railroad transportation system. Eligible activities include preserving and
continuing viable railroad branch lines through development, improvement, construction,

19
purchase, maintenance, or rehabilitation of intermodal transportation facilities, branch line or
short lines sidings, light density railroad lines, and rolling stock, including rail cars. Eligible
applicants include railroads, cities, counties, companies, regional railroad authorities, and port
authorities.
The MEFRLP is a low interest revolving loan fund administered by Montana DOT. Recipients
pay back zero interest loans over 10 years. Matching requirements vary between 30 percent and
50 percent. No loans have been made since 2013.
Rural economic development has been enhanced by the MEFRL program through the improved
transportation of rail freight and resulting economic prosperity. Costs are minimal and include
programs administration.
North Dakota
The North Dakota Department of Transportation (NDDOT) administers the Rail Loan Program,
which comprises the Freight Rail Improvement Program (FRIP) and the Local Rail Freight
Assistance (LRFA) program. Loans are available to short line railroads (and other entities such
as cities, counties, and users of freight railroad service, but not Class I railroads) for system
critical, infrastructure improvement, or economic development projects. The LRFA program
evolved from a federal program, the Local Rail Service Assistance (LRSA) program, where
North Dakota awarded its first loan in 1979. LRFA funds were considered federal funds until
October 2008, when a change in federal law transferred these funds to the States. Between 1982
and 2014, North Dakota LRSA/LRFA activity was $27.6 million with $20.8 million matching
for a total of $48.3 million involving 548.4 track miles. NDDOT established the FRIP in 1995,
using interest from repaid LRFA loans as a funding source.
The only available assistance to short line railroads from NDDOT is the Railroad Loan Program,
but it is not exclusive to short lines. The program adopts a tiered system where the loaned terms
depend on whether the project is considered to be mission critical, relating to infrastructure
improvement or economic development. This program offers available funding for all types of
projects within those categories. NDDOT requests a benefit-cost analysis including the number
of carloads per mile, system connectivity, economic development impact, safety issues, and
environmental/community benefits.
The benefits of these programs are fewer abandonments, rail system service connectivity to
outlying elevators, and strengthening short line railroads so that they may offer competitive rates
for transportation services. Other benefits include economic growth of the State as industry is
able to get its goods to market.
The North Dakota Rail Loan Program replenishes itself via loan and interest payments. Despite a
recent $7 million infusion, the program has not needed outside funding throughout its duration.
To date, the program has not seen a default on any loan provided to a short line.
Ohio
The Ohio Rail Development Commission (ORDC) has a grant and loan program consisting of
about $3 million in grant funding and $2 million in loan funding available annually. ORDC
solicits railroads in March for the projects but accepts projects on a rolling basis throughout the
year. Project eligibility includes track rehabilitation, bridge/culvert/tunnel repair, spur tracks,
sidings, and rail infrastructure that can be linked to economic development opportunities in the
20
State. Grant amounts are based on need, job creation, carload commitments, and outside
investment but are usually no more than 50 percent of project costs. For loan projects, ORDC
will consider providing more than 50 percent of total project cost.
ORDC believes a good short line project is one that would not be done without State help.
Ideally, if a short line has a list of 6 projects that it has decided to fund from its own resources,
ORDC strives to fund projects 7 and 8 on the list with State resources. In addition to due
diligence prior to approval, ORDC has performance metrics in its contracts which delineate a
project’s scope, required private investment, infrastructure maintenance post completion, as well
as investment and job creation/retention. If a grantee fails to meet grant requirements ORDC
requires repayment of grant funding.
By assisting short line railroads, ORDC has ensured companies remain in Ohio, spurred millions
of dollars in private investment in Ohio industries resulting in a more profitable short line
industry, guaranteed access to shippers resulting in transportation savings to their companies, and
reduced highway maintenance costs to the State.
ORDC’s assistance programs have been a vital component to keeping hundreds of miles of short
lines operational, which in turn has helped preserve thousands of jobs. These lines are essential
to a robust and competitive transportation network for Ohio shippers. The existence of short lines
in Ohio has allowed transportation options for new and existing companies, ones that attract and
retain rural businesses.
Oklahoma
Oklahoma has a long history of purchasing lines to preserve them. At one time, Oklahoma
owned 818 miles of railroad and used the lease payments to rehabilitate many of the lines. Today
Oklahoma owns 135 miles and is in the process of selling another 40 miles of line. Of the 135
miles, 25 miles are out of service. The Oklahoma loan program is similar to that in Kansas, but it
has not been used since passage in 2003. If Oklahoma used a loan program, the applicant project
would need to have a benefit-cost ratio of 1.0 or better to qualify for a loan.
The State-owned construction and maintenance work plan provides an annual projection for
construction and maintenance needs of the State-owned railroad infrastructure. Railroads are
required to comply with the agreement between Oklahoma Department of Transportation
(ODOT) and the operators to maintain State owned rail property. Only the lessee of the State
owned rail property is eligible for assistance.
Respondents said the Oklahoma program has preserved the economy of rural Oklahoma. It has
preserved the business that existed before and allowed the growth of oil, gas, sand, rock, and
agriculture to continue in rural Oklahoma.
Washington
The State of Washington administers both a grant program and a loan program designed to
support freight rail capital needs. The grant and loan programs are administered by Washington
DOT and require applicants to provide a business plan for the project and are subject to a
benefit-cost calculation to ensure they are generating public benefits.
The Freight Rail Investment Bank (FRIB) is a loan program available to the public sector. This
program is intended for either smaller projects or as a smaller part of a larger project where State

21
funds would enable the project to be completed. The loan program is open to organizations in the
public sector only.
The Freight Rail Assistance Program (FRAP) is a grant program open to applicants in both the
public and private sectors. This program is directed toward larger projects where it is difficult to
obtain sufficient funding and where the rail location or project is of strategic importance to the
local community and the State. The grant program is open to cities, county railroad districts,
counties, economic development councils, port districts, and privately and publicly owned
railroads. Projects must be shown to maintain or improve the freight rail system. The application
process for loans allows the applicant to self-score 80 percent of their marks which are based on
their own financial contribution and the number of jobs that the project will bring to the area. All
applicants for a loan must provide a minimum 20 percent match, and the loan maximum is
$250,000.
Wisconsin
The Freight Railroad Preservation Program (FRPP) is a grant program that provides up to 100
percent funding for line acquisition (typically when a line is abandoned or threatened with
abandonment) and up to 80 percent funding toward the cost of rehabilitation of publically-owned
lines to preserve essential freight rail service. Eligible projects are scored on transportation
efficiency, railroad system (e.g. connections to other railroads), and location criteria (e.g. rural
vs. urban). A local partner, such as local government, rail commission, shipper, and/or a railroad,
is required. FRPP does not fund normal maintenance activities. Since 1980, Wisconsin DOT has
provided grants totaling $265 million for acquisition of rail lines and rehabilitation of tracks and
bridges.
The Freight Railroad Infrastructure and Improvement Program (FRIIP) provides loans that
enable the State to encourage a broader array of improvements to the rail system. The FRIIP
provides up to 100 percent loans for rail projects that connect an industry to the national rail
system; make improvements that enhance transportation efficiency, safety, and intermodal
movement; accomplish line rehabilitation; or develop the economy. Available funding is from
the repayment of prior loans. It also provides for rail-related projects such as loading and trans-
loading facilities.
Assistance is usually limited to no more than $3 million and is provided in the form of a loan
requiring payment of a minimum of 2 percent interest per year. The total amount of any loan
committed to non-rail purposes is limited to $1.5 million dollars. To be eligible for loans, the
applicant must be a city, county, railroad, or a current or potential user of freight rail service.
The FRPP has benefitted the State by rehabilitation of rail lines and preserving essential freight
rail service. The FRIIP has resulted in a broader array of improvements to the rail system with
rail-related projects such as loading and trans-loading facilitates. Wisconsin’s programs are
designed to provide capital that enhances transport efficiency. Thus, the assistance programs
succeeded in preserving freight railroad lines that are economically feasible. The programs
reduce the railroads’ cost of capital for facilities, improving their profitability and reliability in
servicing shippers. Since 1980, the number and size of shippers on assisted lines have grown
substantially based on the increase in gross carloads and carloads per mile. Anecdotally,
Wisconsin DOT personnel hear that when farmers use a railroad instead of a truck, they obtain
higher prices for their agricultural products due to lower shipping costs.
22
RESULTS OF THE SHORT LINE RAILROADS AND AGRICULTURE SURVEY
The principal data source for this study is the survey (Appendix A) administered to 47 short line
railroads (Class II and III railroads). A few railroads had incomplete surveys, but additional
information needed to complete the survey was obtained for the railroads through on-site visits in
the summer of 2016. These visits occurred in Kansas, Missouri, Arkansas, Oklahoma, Nebraska,
Iowa, and Illinois. The survey contains five parts which are:
Part A – General Questions
Part B – Traffic
Part C – Equipment
Part D – Markets and Competition
Part E – Short Line Success Profile
Results – Part A – General Information
Part A contains general information about the agriculture oriented railroads. Part A requests the
following information:
When did the railroad begin operating?
Employment?
Ownership?
Route Miles?
How many track miles can handle 286,000 pound rail cars?
Connecting railroads?
Received State government financial assistance?
Received Federal government financial assistance?
Table 2 contains the results for initiation of operations. As indicated by the data in Table 2, about
42 percent of the sample railroads began operating in the 1990s. The 2000s accounted for about
29 percent and the 1980s for about 27 percent. Therefore, 98 percent of the sample railroads
began operations after the Staggers Rail Act was passed in October 1980.
23
Table 2: Decade of Start of Operations
of Agriculture Oriented Short Lines
Decade Number of
Railroads
Percent
of Total
2000s 12 29
1990s 17 42
1980s 11 27
1970s and
earlier 1 2
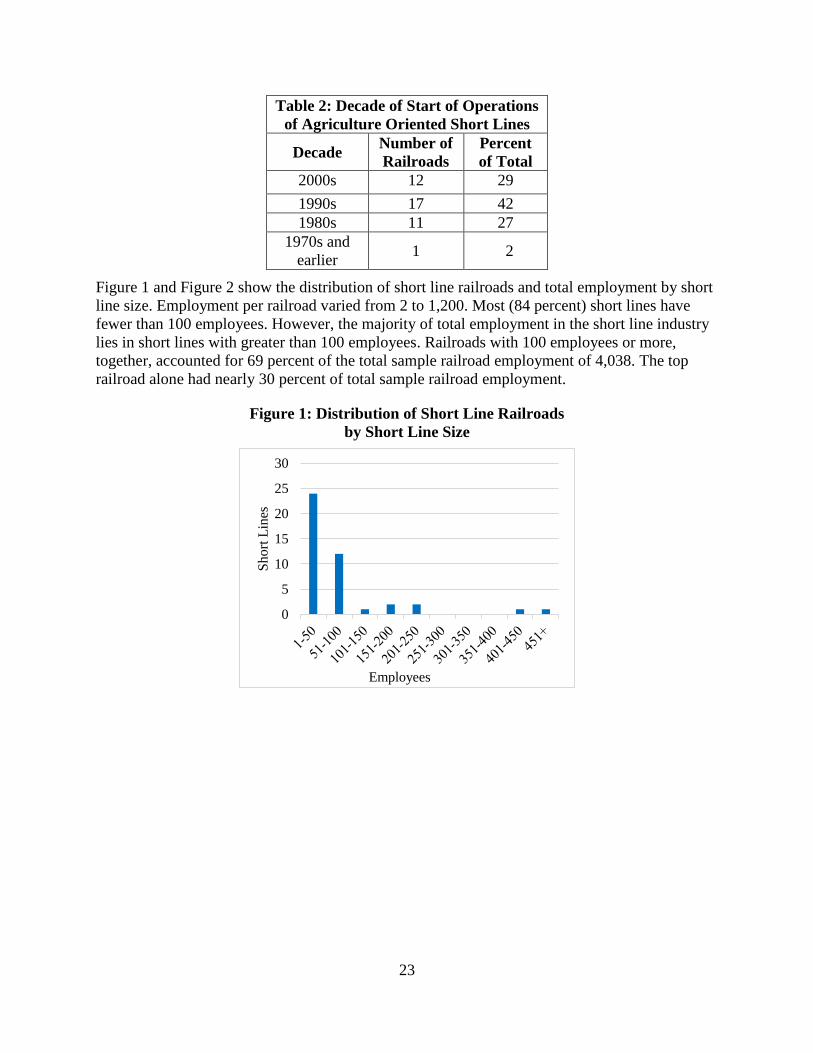
Figure 1 and Figure 2 show the distribution of short line railroads and total employment by short
line size. Employment per railroad varied from 2 to 1,200. Most (84 percent) short lines have
fewer than 100 employees. However, the majority of total employment in the short line industry
lies in short lines with greater than 100 employees. Railroads with 100 employees or more,
together, accounted for 69 percent of the total sample railroad employment of 4,038. The top
railroad alone had nearly 30 percent of total sample railroad employment.
Figure 1: Distribution of Short Line Railroads
by Short Line Size
0
5
10
15
20
25
30
Short
Lin
es
Employees

24
Figure 2: Distribution of Total Employment by
Short Line Size
Table 3 contains total track mile data and miles of track capable of handling 286,000 pound rail
cars. The track miles of the sample short lines vary widely from a low of 29 to a high of 937. For
the 39 short line sample railroads, total track miles are 11,091, while track miles capable of
handling Heavy Axle Load (HAL) cars are 7,358 or 66 percent of the total miles. The table
shows that most (79 percent) short line railroads have less than 500 miles of track, while 35
percent of short line track miles are accounted for by short lines with more than 500 miles of
track.
Figure 3 and Figure 4 show the distribution of the short lines and track miles that are capable of
handling 286,000 pound rail cars. Most short lines are close to being able to fully handle 286,000
pound cars. Fifty-one percent of the responses said that at least 85 percent of their track could
0
200
400
600
800
1000
1200
1400
To
tal
Em
plo
ym
ent
Employees
Table 3: Distribution of Total Track Miles and 286K Track Miles
Category
(Miles)
Railroads
in
Category
by Total
Track
Percent
of
Sampled
Railroads
Miles of
Total
Track in
Category
Percent of
Total
Track
Miles
Railroads
in
Category
by 286K
Track
Percent of
Sampled
Railroads
Miles of
286K
Track in
Category
Percent
of
286K
Track
Miles
0-100 12 31 716 6 19 49 710 10
101-200 7 18 936 8 8 21 1,226 17
201-300 7 18 1,802 16 5 13 1,275 17
301-400 4 10 1,462 13 3 8 1,065 14
401-500 1 3 433 4 0 0 0 0
501-600 4 10 2,249 20 1 3 555 8
601-700 0 0 0 0 0 0 0 0
701-800 0 0 0 0 0 0 0 0
801-900 2 5 1652 15 3 8 2527 34
901-1000 2 5 1841 17 0 0 0 0
Total 39 100 11091 100 39 100 7358 100
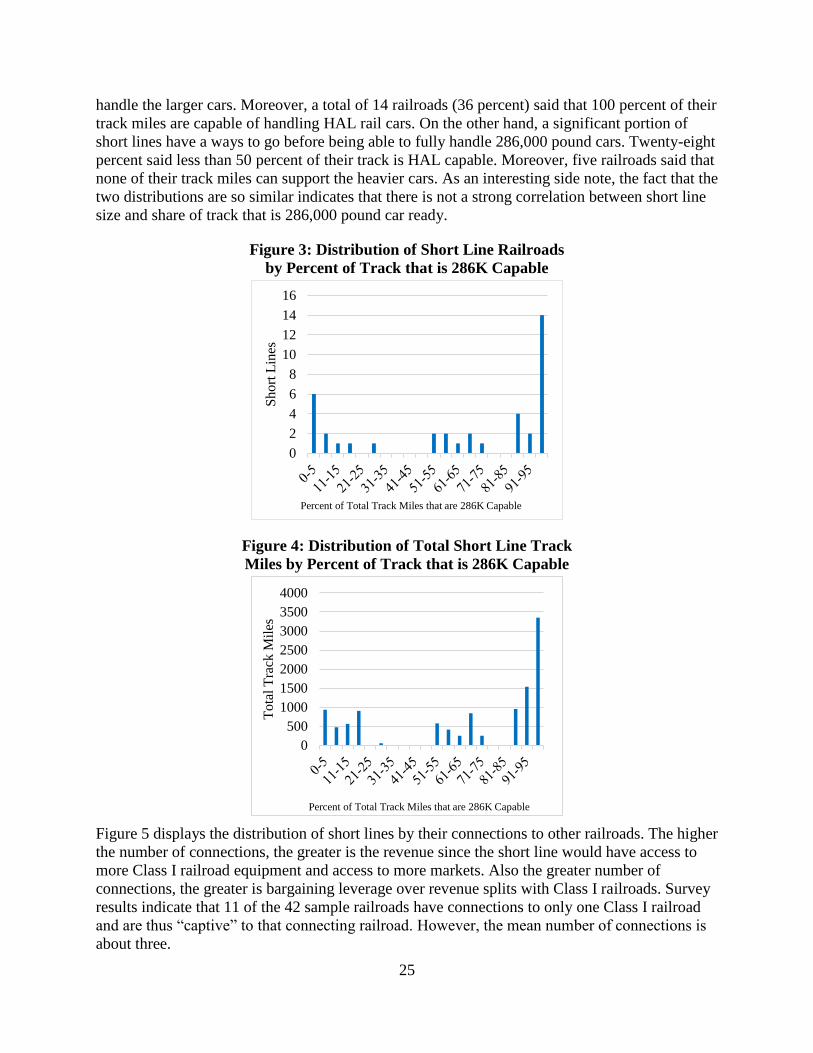
25
handle the larger cars. Moreover, a total of 14 railroads (36 percent) said that 100 percent of their
track miles are capable of handling HAL rail cars. On the other hand, a significant portion of
short lines have a ways to go before being able to fully handle 286,000 pound cars. Twenty-eight
percent said less than 50 percent of their track is HAL capable. Moreover, five railroads said that
none of their track miles can support the heavier cars. As an interesting side note, the fact that the
two distributions are so similar indicates that there is not a strong correlation between short line
size and share of track that is 286,000 pound car ready.
Figure 3: Distribution of Short Line Railroads
by Percent of Track that is 286K Capable
Figure 4: Distribution of Total Short Line Track
Miles by Percent of Track that is 286K Capable
Figure 5 displays the distribution of short lines by their connections to other railroads. The higher
the number of connections, the greater is the revenue since the short line would have access to
more Class I railroad equipment and access to more markets. Also the greater number of
connections, the greater is bargaining leverage over revenue splits with Class I railroads. Survey
results indicate that 11 of the 42 sample railroads have connections to only one Class I railroad
and are thus “captive” to that connecting railroad. However, the mean number of connections is
about three.
0
2
4
6
8
10
12
14
16
Short
Lin
es
Percent of Total Track Miles that are 286K Capable
0
500
1000
1500
2000
2500
3000
3500
4000
Tota
l T
rack
Mil
es
Percent of Total Track Miles that are 286K Capable
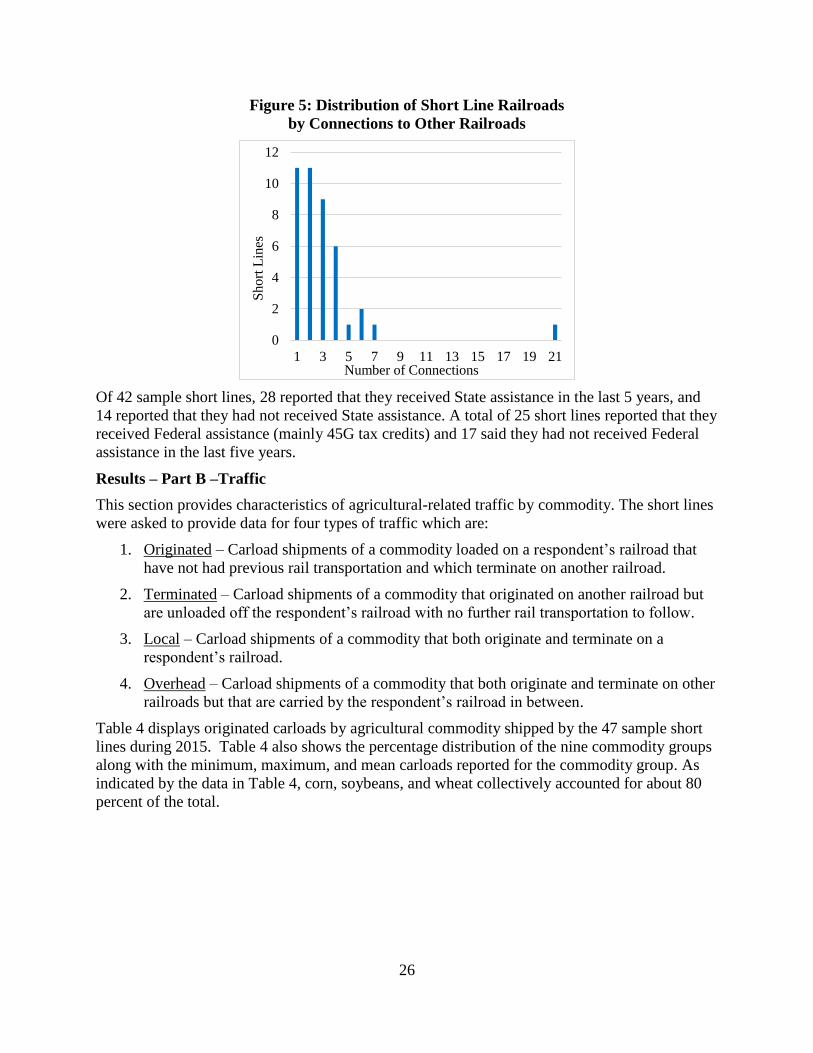
26
Figure 5: Distribution of Short Line Railroads
by Connections to Other Railroads
Of 42 sample short lines, 28 reported that they received State assistance in the last 5 years, and
14 reported that they had not received State assistance. A total of 25 short lines reported that they
received Federal assistance (mainly 45G tax credits) and 17 said they had not received Federal
assistance in the last five years.
Results – Part B –Traffic
This section provides characteristics of agricultural-related traffic by commodity. The short lines
were asked to provide data for four types of traffic which are:
1. Originated – Carload shipments of a commodity loaded on a respondent’s railroad that
have not had previous rail transportation and which terminate on another railroad.
2. Terminated – Carload shipments of a commodity that originated on another railroad but
are unloaded off the respondent’s railroad with no further rail transportation to follow.
3. Local – Carload shipments of a commodity that both originate and terminate on a
respondent’s railroad.
4. Overhead – Carload shipments of a commodity that both originate and terminate on other
railroads but that are carried by the respondent’s railroad in between.
Table 4 displays originated carloads by agricultural commodity shipped by the 47 sample short
lines during 2015. Table 4 also shows the percentage distribution of the nine commodity groups
along with the minimum, maximum, and mean carloads reported for the commodity group. As
indicated by the data in Table 4, corn, soybeans, and wheat collectively accounted for about 80
percent of the total.
0
2
4
6
8
10
12
1 3 5 7 9 11 13 15 17 19 21
Sh
ort
Lin
es
Number of Connections
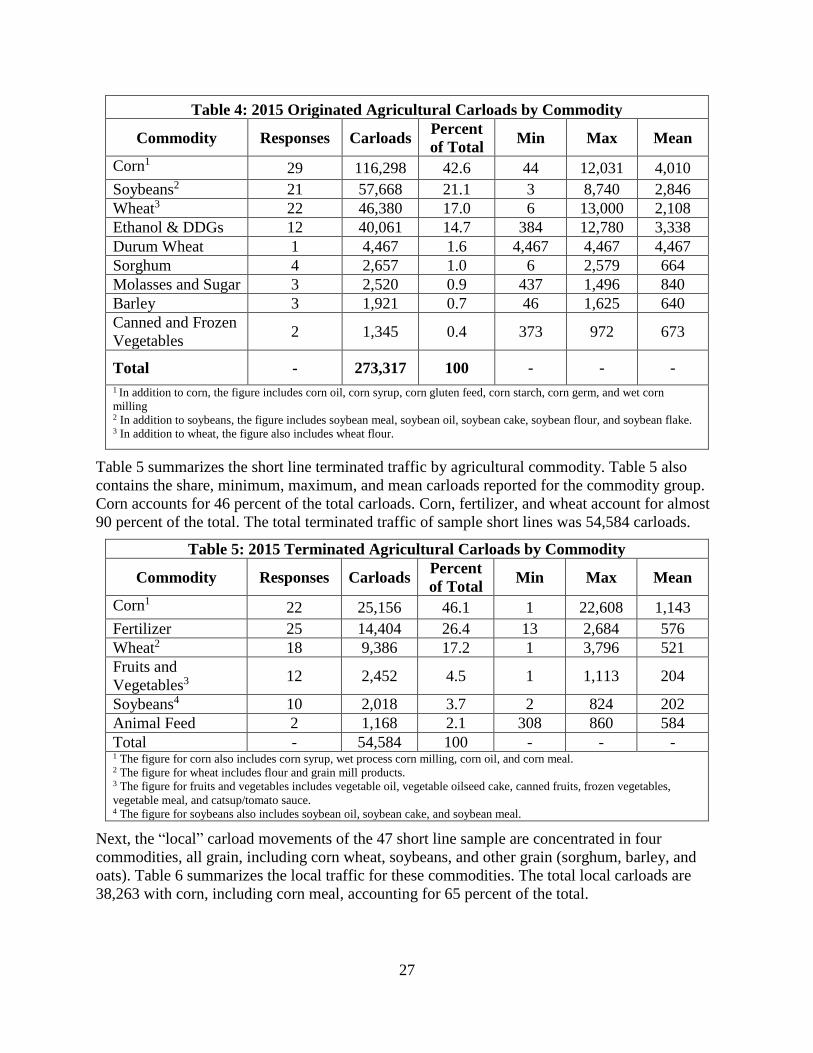
27
Table 4: 2015 Originated Agricultural Carloads by Commodity
Commodity Responses Carloads Percent
of Total Min Max Mean
Corn1 29 116,298 42.6 44 12,031 4,010
Soybeans2 21 57,668 21.1 3 8,740 2,846
Wheat3 22 46,380 17.0 6 13,000 2,108
Ethanol & DDGs 12 40,061 14.7 384 12,780 3,338
Durum Wheat 1 4,467 1.6 4,467 4,467 4,467
Sorghum 4 2,657 1.0 6 2,579 664
Molasses and Sugar 3 2,520 0.9 437 1,496 840
Barley 3 1,921 0.7 46 1,625 640
Canned and Frozen
Vegetables 2 1,345 0.4 373 972 673
Total - 273,317 100 - - -
1 In addition to corn, the figure includes corn oil, corn syrup, corn gluten feed, corn starch, corn germ, and wet corn
milling 2 In addition to soybeans, the figure includes soybean meal, soybean oil, soybean cake, soybean flour, and soybean flake. 3 In addition to wheat, the figure also includes wheat flour.
Table 5 summarizes the short line terminated traffic by agricultural commodity. Table 5 also
contains the share, minimum, maximum, and mean carloads reported for the commodity group.
Corn accounts for 46 percent of the total carloads. Corn, fertilizer, and wheat account for almost
90 percent of the total. The total terminated traffic of sample short lines was 54,584 carloads.
Table 5: 2015 Terminated Agricultural Carloads by Commodity
Commodity Responses Carloads Percent
of Total Min Max Mean
Corn1 22 25,156 46.1 1 22,608 1,143
Fertilizer 25 14,404 26.4 13 2,684 576
Wheat2 18 9,386 17.2 1 3,796 521
Fruits and
Vegetables3 12 2,452 4.5 1 1,113 204
Soybeans4 10 2,018 3.7 2 824 202
Animal Feed 2 1,168 2.1 308 860 584
Total - 54,584 100 - - - 1 The figure for corn also includes corn syrup, wet process corn milling, corn oil, and corn meal. 2 The figure for wheat includes flour and grain mill products. 3 The figure for fruits and vegetables includes vegetable oil, vegetable oilseed cake, canned fruits, frozen vegetables,
vegetable meal, and catsup/tomato sauce. 4 The figure for soybeans also includes soybean oil, soybean cake, and soybean meal.
Next, the “local” carload movements of the 47 short line sample are concentrated in four
commodities, all grain, including corn wheat, soybeans, and other grain (sorghum, barley, and
oats). Table 6 summarizes the local traffic for these commodities. The total local carloads are
38,263 with corn, including corn meal, accounting for 65 percent of the total.

28
Table 6: 2015 Local Agricultural Carloads by Commodity
Commodity Responses Carloads Percent
of Total Min Max Mean
Corn1 16 24,949 65.2 3 6,509 1,559
Wheat 12 6,916 18.1 6 3,132 576
Soybeans2 10 5,671 14.8 1 1,386 567
Other Grains3 6 727 1.9 19 304 121
Total - 38,263 100 - - - 1 In addition to corn, the figure also includes corn meal. 2 In addition to soybeans, the figure also includes soybean meal. 3 Other grains include sorghum, barley, and oats.
Overhead carloads for corn and soybeans are complicated by the presence of a relatively large
outlier railroad that identified 92,846 overhead carloads. On the survey, the 92,846 carloads were
evenly split between corn and soybeans, resulting in 46,423 carloads for each of the two
commodities. This figure is 12 times higher than the mean corn carloads and 11 times higher
than the mean soybean carloads. Therefore, the overhead carloads for corn and soybeans are
calculated with and without the outlier carloads included in the analysis.
Overhead carloads in 2015 are summarized in Table 7, which includes the large outlier railroads’
corn and soybean traffic. Corn and soybeans have the largest carloads and the largest percentages
among the top 8 overhead commodities with 38 percent and 29 percent respectively.
However, if the outlier railroad carloads are removed from the analysis, the corn and soybean
carloads are significantly reduced. Corn carloads decline to 23,397 (69,820 total carloads less
46,423 of the “outlier” respondent) and soybean carloads fall to 7,182 (53,605 total carloads less
46,423).Table 7 data indicates that corn is still the top commodity if the outlier is removed, but
its percentage share of the combined commodities falls from 38 percent to 26 percent. A similar
effect occurs with overhead soybean carloads whose percentage share of overhead commodities
Table 7: 2015 Overhead Carloads by Commodity Including Outlier Railroad
Commodity Responses
Carloads
(without
outlier)
Percent
of Total Min Max Mean
Corn1 25 69,820 38.1 2 46,423 2,793
Soybeans2 13 53,605 29.3 4 46,423 4,123
Wheat3 21 22,318 12.2 1 10,743 1,063
Sorghum and Oats 6 10,060 5.5 3 7,895 1,676
Fruit and Vegetables4 14 8,299 4.5 3 3,559 593
Fertilizer 9 8,105 4.4 5 5,487 901
Molasses and Sugar5 13 6,979 3.8 3 5,331 537
Barley 3 4,018 2.2 185 3,368 1,339
Total - 183,204 100 - - - 1 In addition to corn, the figure in the above table includes corn syrup, corn starch, cornmeal, and wet corn milling products. 2 In addition to soybeans, the figure in the above table includes soybean oil and soybean cake. 3 In addition to wheat, the figure in the above table includes wheat flour, wheat bran, and grain mill products. 4 The figure in the above table includes frozen vegetables, vegetable oil, and vegetable see cake. 5 The figure in the above table includes molasses, blackstrap molasses, sugar mill products, sugar refining byproducts and
granulated sugar powder.

29
falls from 29 percent to 8 percent. The share of overhead carloads for wheat rises from 12
percent to 25 percent.
Table 8 summarizes sample short line carloads by type of traffic with and without the outlier
overhead carloads. The distribution of carloads with the outlier overhead carloads results in
about half of the total carloads in the originated category, about 10 percent in terminated
carloads, 7 percent in local traffic, and 33 percent in overhead carloads. When the outlier
overhead carloads are removed from the analysis, the originated traffic share of the total carloads
rises from 50 percent to 60 percent. The terminated and local shares rise slightly while the
overhead share falls to about 20 percent. Originated traffic is the major traffic type (with and
without the outlier overhead carloads in the analysis), and local traffic has the fewest carloads of
the 4 types of traffic.
Table 8: Total Carloads With and Without
Outlier Overhead Carloads by Type of Traffic
Total Carloads With Outlier Overhead
Carloads
Type of Traffic Carloads Percent of
Total
Originated Carloads 273,317 49.8
Terminated Carloads 54,584 9.9
Local Carloads 38,263 7.0
Overhead Carloads 183,204 33.3
Total 549,368 100
Total Carloads Without Outlier Overhead
Carloads
Type of Traffic Carloads Percent of
Total
Originated Carloads 273,317 59.9
Terminated Carloads 54,584 11.9
Local Carloads 38,263 8.4
Overhead Carloads 90,358 19.8
Total 456,522 100
Results – Part C – Equipment
The first four questions of Part C of the questionnaire deal with the number of locomotives and
rail cars owned and leased.
Figure 6 and Figure 7 show the distributions of short lines by total owned and leased locomotives
and by the share of locomotives owned. The number of locomotives owned totaled 874, ranging
from low of zero to a high of 96. The top 7 railroads (those which own 30 or above locomotives)
accounted for 47 percent of the owned locomotives. Twenty-four of the 42 sample short lines
leased no locomotives. The other 18 short lines leased 75 locomotives. In total, owned and/or
leased locomotives were 949 in 2015. Figure 7 reflects the fact that the large majority of
locomotives are owned rather than leased by short line railroads.
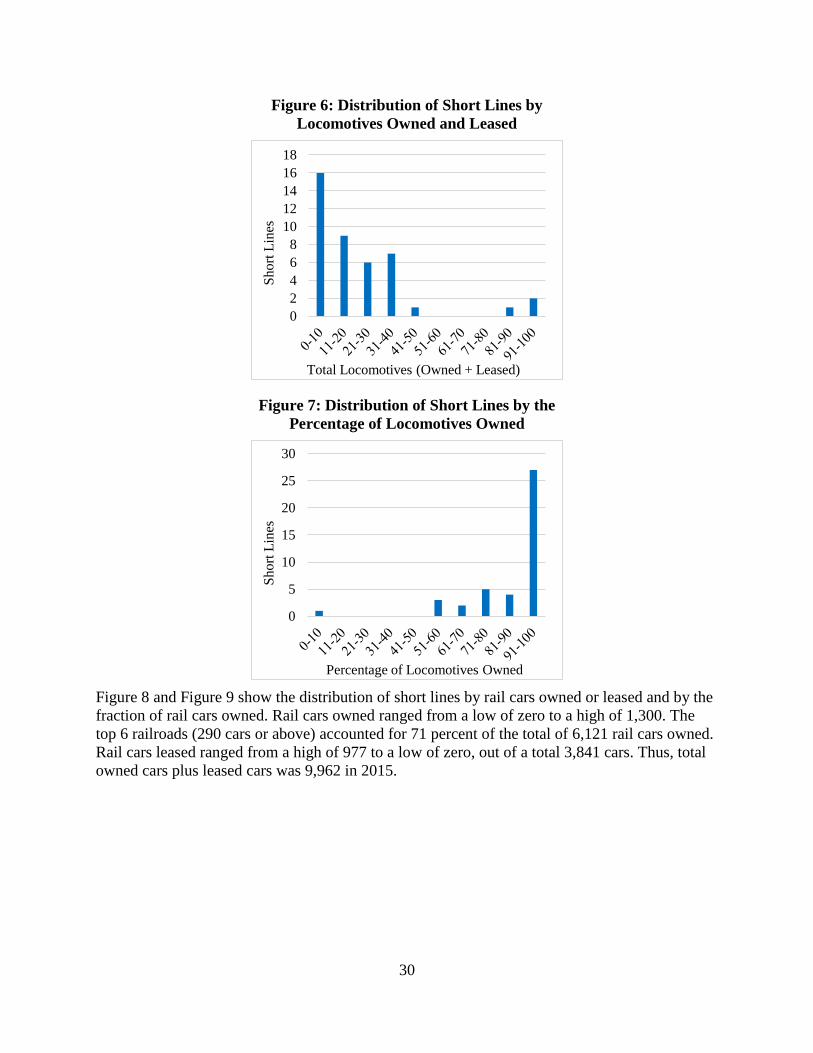
30
Figure 6: Distribution of Short Lines by
Locomotives Owned and Leased
Figure 7: Distribution of Short Lines by the
Percentage of Locomotives Owned
Figure 8 and Figure 9 show the distribution of short lines by rail cars owned or leased and by the
fraction of rail cars owned. Rail cars owned ranged from a low of zero to a high of 1,300. The
top 6 railroads (290 cars or above) accounted for 71 percent of the total of 6,121 rail cars owned.
Rail cars leased ranged from a high of 977 to a low of zero, out of a total 3,841 cars. Thus, total
owned cars plus leased cars was 9,962 in 2015.
0
2
4
6
8
10
12
14
16
18
Sh
ort
Lin
es
Total Locomotives (Owned + Leased)
0
5
10
15
20
25
30
Short
Lin
es
Percentage of Locomotives Owned

31
Figure 8: Distribution of Short Lines by Total
Rail Cars
Figure 9: Distribution of Short Lines by
Percentage of Railcars Owned
In addition, Part C asks the short lines if they are dependent on Class I railroads for locomotives
and rail cars. For locomotives, only 13 percent said they were “very dependent,” 23 percent said
they were “somewhat dependent,” and 65 percent said they were “not dependent” (Table 9). A
few of the short lines qualified their response by stating that they were somewhat dependent on
Class I unit trains but not dependent for non-unit trains.
Regarding the dependence on Class I railroads for rail cars, 50 percent of the sample short lines
said they were “very dependent,” 25 percent responded that they were “somewhat dependent,”
and 25 percent said they were “not dependent” (Table 9). A few short lines said they were very
dependent on unit trains but not dependent on non-unit trains.
Part C of the survey also asked the short lines if they had trouble obtaining needed equipment
(locomotives and rail cars) during peak periods, such as grain harvests if their railroad was
dependent on Class I railroads for that equipment. Only about 3 percent said “all of the time,” 61
percent replied “some of the time,” and about 37 percent said “none of the time.” Thus, the
0
1
2
3
4
5
6
7
8
Sh
ort
Lin
es
Total Railcars (Owned + Leased)
0
2
4
6
8
10
12
Sh
ort
Lin
es
Percentage of Rail Cars Owned
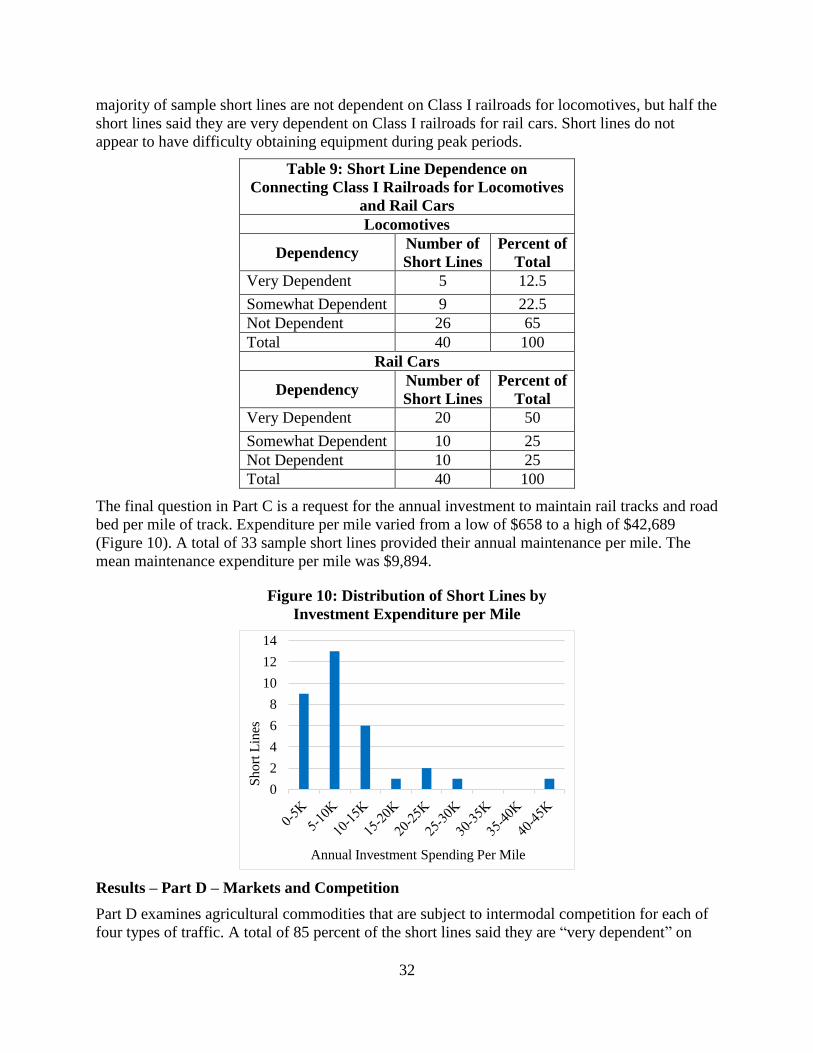
32
majority of sample short lines are not dependent on Class I railroads for locomotives, but half the
short lines said they are very dependent on Class I railroads for rail cars. Short lines do not
appear to have difficulty obtaining equipment during peak periods.
Table 9: Short Line Dependence on
Connecting Class I Railroads for Locomotives
and Rail Cars
Locomotives
Dependency Number of
Short Lines
Percent of
Total
Very Dependent 5 12.5
Somewhat Dependent 9 22.5
Not Dependent 26 65
Total 40 100
Rail Cars
Dependency Number of
Short Lines
Percent of
Total
Very Dependent 20 50
Somewhat Dependent 10 25
Not Dependent 10 25
Total 40 100
The final question in Part C is a request for the annual investment to maintain rail tracks and road
bed per mile of track. Expenditure per mile varied from a low of $658 to a high of $42,689
(Figure 10). A total of 33 sample short lines provided their annual maintenance per mile. The
mean maintenance expenditure per mile was $9,894.
Figure 10: Distribution of Short Lines by
Investment Expenditure per Mile
Results – Part D – Markets and Competition
Part D examines agricultural commodities that are subject to intermodal competition for each of
four types of traffic. A total of 85 percent of the short lines said they are “very dependent” on
0
2
4
6
8
10
12
14
Short
Lin
es
Annual Investment Spending Per Mile
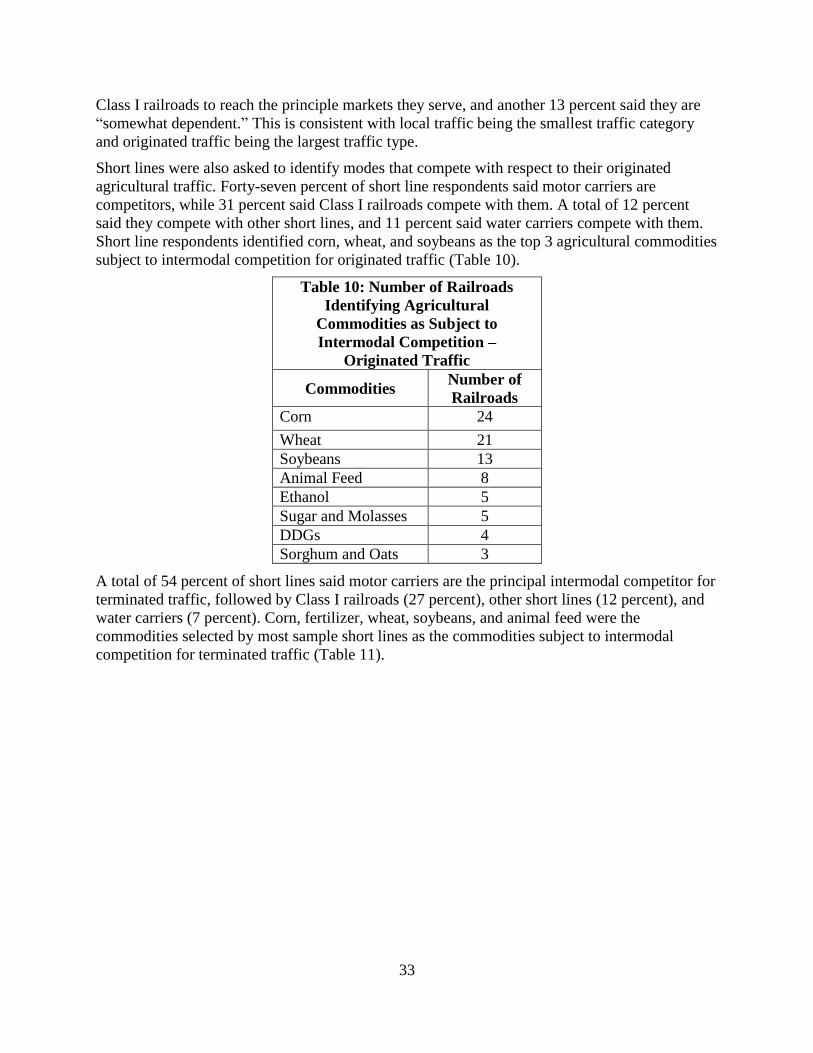
33
Class I railroads to reach the principle markets they serve, and another 13 percent said they are
“somewhat dependent.” This is consistent with local traffic being the smallest traffic category
and originated traffic being the largest traffic type.
Short lines were also asked to identify modes that compete with respect to their originated
agricultural traffic. Forty-seven percent of short line respondents said motor carriers are
competitors, while 31 percent said Class I railroads compete with them. A total of 12 percent
said they compete with other short lines, and 11 percent said water carriers compete with them.
Short line respondents identified corn, wheat, and soybeans as the top 3 agricultural commodities
subject to intermodal competition for originated traffic (Table 10).
Table 10: Number of Railroads
Identifying Agricultural
Commodities as Subject to
Intermodal Competition –
Originated Traffic
Commodities Number of
Railroads
Corn 24
Wheat 21
Soybeans 13
Animal Feed 8
Ethanol 5
Sugar and Molasses 5
DDGs 4
Sorghum and Oats 3
A total of 54 percent of short lines said motor carriers are the principal intermodal competitor for
terminated traffic, followed by Class I railroads (27 percent), other short lines (12 percent), and
water carriers (7 percent). Corn, fertilizer, wheat, soybeans, and animal feed were the
commodities selected by most sample short lines as the commodities subject to intermodal
competition for terminated traffic (Table 11).
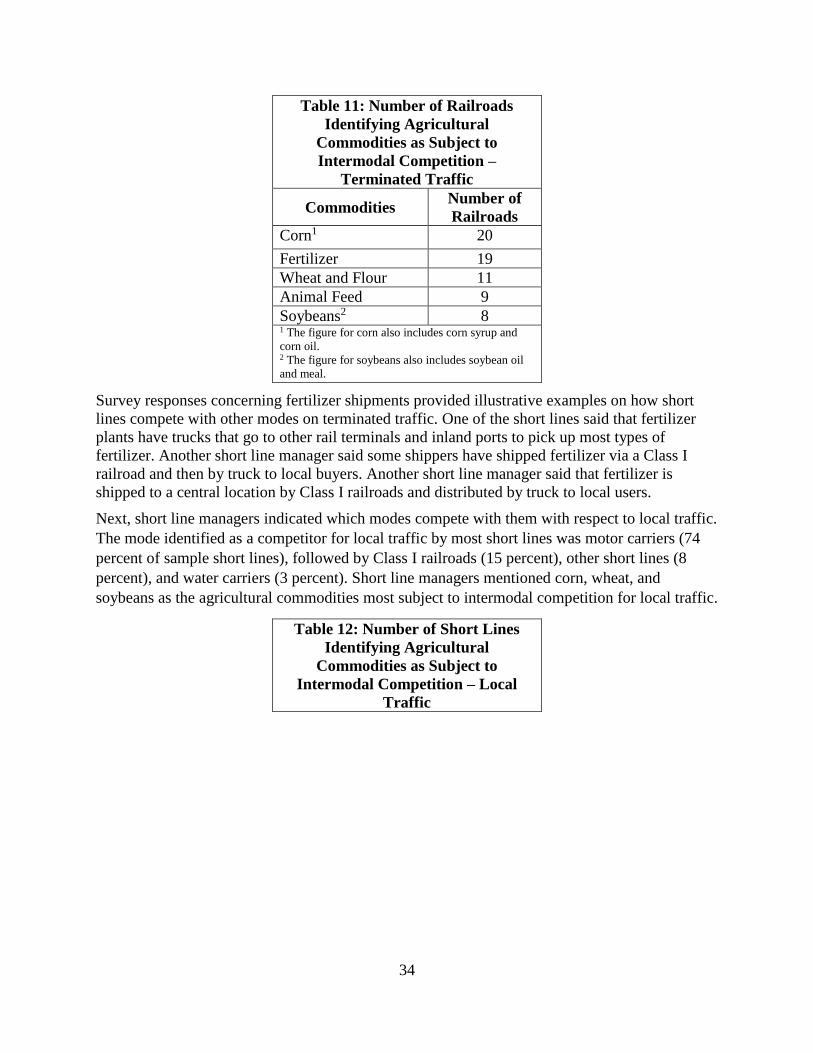
34
Table 11: Number of Railroads
Identifying Agricultural
Commodities as Subject to
Intermodal Competition –
Terminated Traffic
Commodities Number of
Railroads
Corn1 20
Fertilizer 19
Wheat and Flour 11
Animal Feed 9
Soybeans2 8 1 The figure for corn also includes corn syrup and
corn oil. 2 The figure for soybeans also includes soybean oil
and meal.
Survey responses concerning fertilizer shipments provided illustrative examples on how short
lines compete with other modes on terminated traffic. One of the short lines said that fertilizer
plants have trucks that go to other rail terminals and inland ports to pick up most types of
fertilizer. Another short line manager said some shippers have shipped fertilizer via a Class I
railroad and then by truck to local buyers. Another short line manager said that fertilizer is
shipped to a central location by Class I railroads and distributed by truck to local users.
Next, short line managers indicated which modes compete with them with respect to local traffic.
The mode identified as a competitor for local traffic by most short lines was motor carriers (74
percent of sample short lines), followed by Class I railroads (15 percent), other short lines (8
percent), and water carriers (3 percent). Short line managers mentioned corn, wheat, and
soybeans as the agricultural commodities most subject to intermodal competition for local traffic.
Table 12: Number of Short Lines
Identifying Agricultural
Commodities as Subject to
Intermodal Competition – Local
Traffic
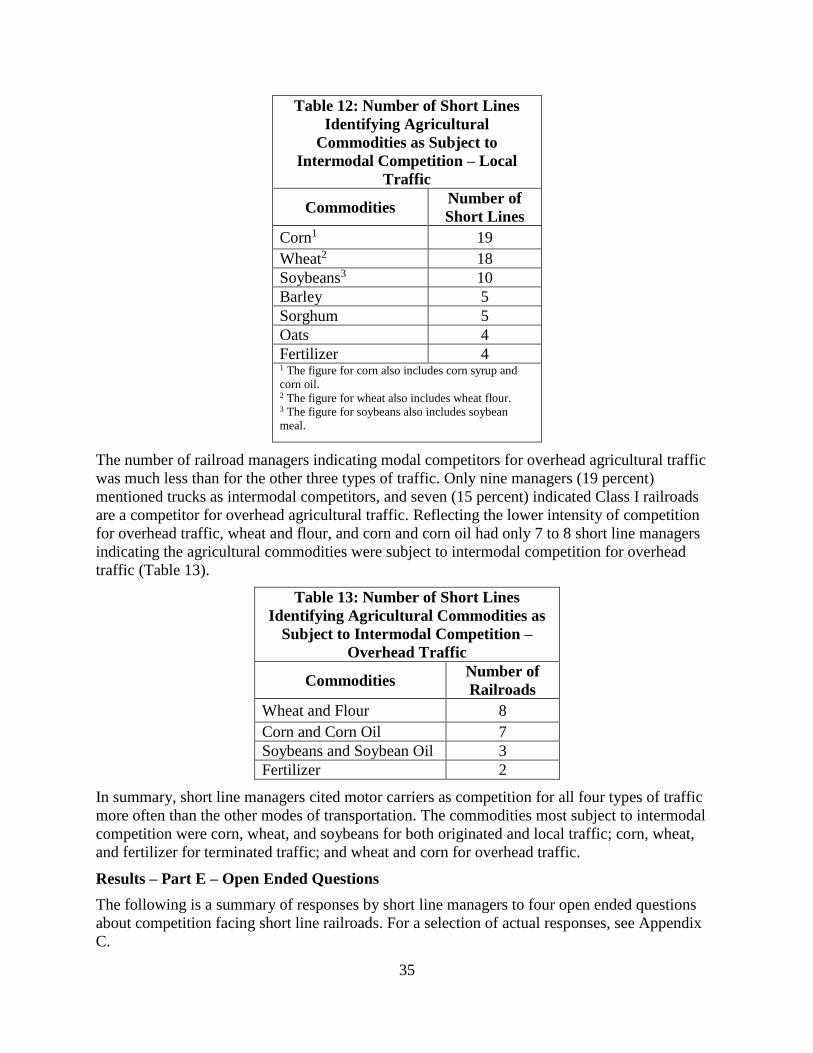
35
Table 12: Number of Short Lines
Identifying Agricultural
Commodities as Subject to
Intermodal Competition – Local
Traffic
Commodities Number of
Short Lines
Corn1 19
Wheat2 18
Soybeans3 10
Barley 5
Sorghum 5
Oats 4
Fertilizer 4 1 The figure for corn also includes corn syrup and
corn oil. 2 The figure for wheat also includes wheat flour. 3 The figure for soybeans also includes soybean
meal.
The number of railroad managers indicating modal competitors for overhead agricultural traffic
was much less than for the other three types of traffic. Only nine managers (19 percent)
mentioned trucks as intermodal competitors, and seven (15 percent) indicated Class I railroads
are a competitor for overhead agricultural traffic. Reflecting the lower intensity of competition
for overhead traffic, wheat and flour, and corn and corn oil had only 7 to 8 short line managers
indicating the agricultural commodities were subject to intermodal competition for overhead
traffic (Table 13).
Table 13: Number of Short Lines
Identifying Agricultural Commodities as
Subject to Intermodal Competition –
Overhead Traffic
Commodities Number of
Railroads
Wheat and Flour 8
Corn and Corn Oil 7
Soybeans and Soybean Oil 3
Fertilizer 2
In summary, short line managers cited motor carriers as competition for all four types of traffic
more often than the other modes of transportation. The commodities most subject to intermodal
competition were corn, wheat, and soybeans for both originated and local traffic; corn, wheat,
and fertilizer for terminated traffic; and wheat and corn for overhead traffic.
Results – Part E – Open Ended Questions
The following is a summary of responses by short line managers to four open ended questions
about competition facing short line railroads. For a selection of actual responses, see Appendix
C.

36
Question 1: Are shifts in Class I pricing and the move to shuttle trains in grain transport
creating an opportunity or a threat to your railroad’s competiveness?
Short line managers that said the changes are a threat stressed the intensity of the competition for
grain and fertilizer traffic. One manager, for instance, said Class I pricing favors Class I grain
shippers and is putting short lines at a disadvantage. Another said that 20 years ago, their short
line had 10 origin wheat shippers and now the railroad has only one. A general theme of the
managers viewing changes as a threat is that they have to compete for grain that is trucked to the
nearest shuttle facility.
Question 2: Will your agricultural traffic increase or decrease if current trends continue (i.e.,
focus on shuttle trains and increased ethanol production)?
The comments of short line managers for this question on whether they expect their agricultural
traffic to increase or decrease depends on market conditions. They said that their traffic is
dependent on crop yields and development of drought resistant corn. Another manager
emphasized location. He said “our grain shippers are far enough from ethanol producers so as not
to lose market share.” He also noted that their primary grain shipper participates in the express
load programs of two Class I railroads. Another manager also emphasized location, noting that
his railroad does not see any new unit trains around him or new ethanol or soybean plants.
However, another manager said he expected agricultural traffic to decrease because ethanol
plants are expanding in his area.
Only six railroads expected their agriculture-related traffic to decrease, while 18 expected an
increase, and 17 expected no change. Of the 41 railroads, 44 percent expected an increase, 42
percent expected no change, and 15 percent expected a decrease.
Question 3: Does Class I railroad policy (i.e., shuttle train loaders) affect competition between
trucks and short lines?
One manager said his connecting Class I railroad recognizes all three of his 85-car unit train
loaders as “direct origins,” so truck competition is not an issue. Another manager said that low
fuel prices for some shippers make it cheaper to ship their product by truck than rail. He says this
pertains to small customers that do not load shuttles. A third manager said that Class I policy
affects competition between trucks and short lines, particularly for loads of less than 50 miles to
the shuttle loader. Based on the comments, the impact of truck competition on short lines
depends on the distance of the shipper to the nearest shuttle loader or ethanol plant.
Question 4: What modes are becoming more of a challenge to short line success? Why is this
so?
Most of the short line managers focused on factors that have enhanced truck competition
including the following:
Low fuel prices resulting in lower truck prices
Trucks have greater scheduling and routing flexibility resulting in competition based on
price
Heavy trucks allowed outside harvest season
Delivery of grain to shuttle train locations as opposed to shipping by short line
37
The trend to increase size and weight of trucks makes it more difficult for short lines to
compete with them
Managers of short line railroads indicated the main factors behind motor carriers’
competitiveness with short lines were lower truck fuel prices relative to railroads in recent years,
translating into lower rates, and increases in the size and weights of trucks, which lower a truck’s
operating cost through increased load sizes. Also, because trucks have greater scheduling and
routing flexibility than short lines, short lines’ must compete against trucks using their
competitive advantage on price. Despite falling truck fuel prices, railroads still remain the most
efficient land-based transporter of goods on a per ton-mile basis.
The short lines mentioned that shuttle trains on Class I railroads have resulted in increased
trucking to these locations as opposed to short line shipment. Also, the short lines mentioned
their dependency on Class I’s for rail cars, switching rates, and price structures.
SHORT LINE SUCCESS PROFILE
The survey contained a dozen service characteristics of a profitable short line railroad obtained
from previous research (Babcock 1993 & 1994). From the choices given, the short line managers
were asked to select the three most important determinants of success (profits). They were asked
to put a 1 next to the most important, 2 next to the next important, and 3 to the third most
important. The characteristics were ranked by the number of short lines selecting the
characteristic with a 1, 2, or 3 importance ranks.
The total points for a profitability characteristic were obtained by multiplying each first in
importance “vote” by three points, each second in importance “vote” by two points and each
third in importance “vote” by one point.
Short line managers ranked the top three most important characteristics for a short line’s success
as “strong shipper support,” “adequate traffic levels,” and “access to more than one connecting
carrier.” The complete set of characteristics and their rankings are shown below in Table 14.
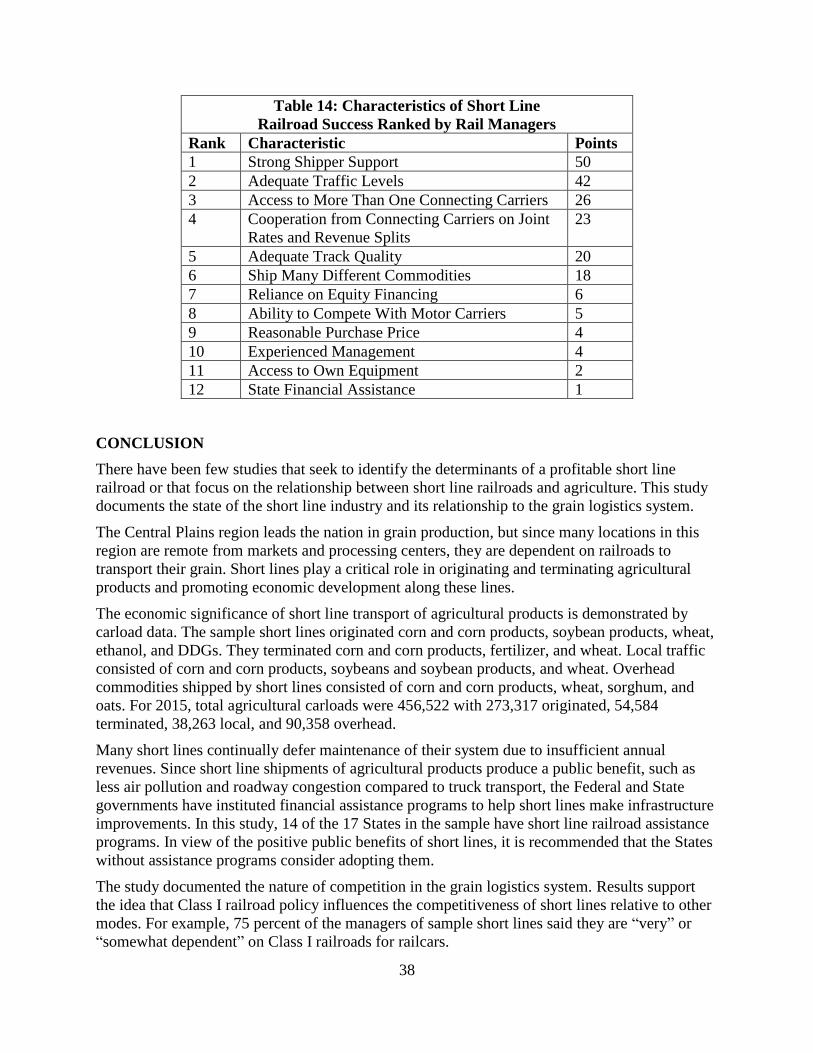
38
Table 14: Characteristics of Short Line
Railroad Success Ranked by Rail Managers
Rank Characteristic Points
1 Strong Shipper Support 50
2 Adequate Traffic Levels 42
3 Access to More Than One Connecting Carriers 26
4 Cooperation from Connecting Carriers on Joint
Rates and Revenue Splits
23
5 Adequate Track Quality 20
6 Ship Many Different Commodities 18
7 Reliance on Equity Financing 6
8 Ability to Compete With Motor Carriers 5
9 Reasonable Purchase Price 4
10 Experienced Management 4
11 Access to Own Equipment 2
12 State Financial Assistance 1
CONCLUSION
There have been few studies that seek to identify the determinants of a profitable short line
railroad or that focus on the relationship between short line railroads and agriculture. This study
documents the state of the short line industry and its relationship to the grain logistics system.
The Central Plains region leads the nation in grain production, but since many locations in this
region are remote from markets and processing centers, they are dependent on railroads to
transport their grain. Short lines play a critical role in originating and terminating agricultural
products and promoting economic development along these lines.
The economic significance of short line transport of agricultural products is demonstrated by
carload data. The sample short lines originated corn and corn products, soybean products, wheat,
ethanol, and DDGs. They terminated corn and corn products, fertilizer, and wheat. Local traffic
consisted of corn and corn products, soybeans and soybean products, and wheat. Overhead
commodities shipped by short lines consisted of corn and corn products, wheat, sorghum, and
oats. For 2015, total agricultural carloads were 456,522 with 273,317 originated, 54,584
terminated, 38,263 local, and 90,358 overhead.
Many short lines continually defer maintenance of their system due to insufficient annual
revenues. Since short line shipments of agricultural products produce a public benefit, such as
less air pollution and roadway congestion compared to truck transport, the Federal and State
governments have instituted financial assistance programs to help short lines make infrastructure
improvements. In this study, 14 of the 17 States in the sample have short line railroad assistance
programs. In view of the positive public benefits of short lines, it is recommended that the States
without assistance programs consider adopting them.
The study documented the nature of competition in the grain logistics system. Results support
the idea that Class I railroad policy influences the competitiveness of short lines relative to other
modes. For example, 75 percent of the managers of sample short lines said they are “very” or
“somewhat dependent” on Class I railroads for railcars.

39
The effect of Class I policy (i.e. focus on shuttle trains) appears to vary with location, with those
located 50 miles or more from a shuttle-loading location experiencing less of an impact on
carloadings than those facilities located close to shuttle loading locations where truck
competition is more intense. This is reinforced by the fact that 77 percent of the short line
managers stated that Class I policy affects competition between trucks and short lines. The
managers of short lines mentioned that shuttle trains on Class I railroads have resulted in
increased trucking to shuttle-loading locations as opposed to short line shipment.
Short line managers mentioned truck competition has intensified due to several developments
such as lower fuel costs (thus lower rates) as well as increased truck size and weights, which
lowers motor carrier costs per ton-mile.
Another short line competition issue is the number of connections to other railroads. If a short
line railroad has several connections, it increases the number of markets that agricultural shippers
using short lines can reach. If the connecting railroad is a Class I, it may increase the number of
rail cars available to the short line. Although the mean number of connections is 3, 26 percent
(11 railroads) of sampled short line railroads have connections to only one railroad.
Another issue affecting shippers of agricultural products is the quality of the short line’s track.
The railroad industry is moving toward an industry standard of 286,000 pound cars to ship grain
and other products. The study found that one-third of the track miles of the sample short lines are
not capable of handling 286,000 pound cars.
Possible areas of future research are measuring the determinants of short line agricultural
carloads versus truck traffic and examining the characteristics of multi-short line holding
companies, such as their strengths and weaknesses, and how these impact the performance of
short line railroads.

40
REFERENCES
Association of American Railroads (AAR). Railroad Facts, September 2016.
Association of American Railroad (AAR). Railroad Facts, 2017.
American Short Line and Regional Railroad Association (ASLRRA). Short Line and Regional
Railroad Facts and Figures, 2017.
Babcock, Michael W and James Sanderson. “Should Short Line Railroads Upgrade Their
Systems to Handle Heavy Axle Load Cars?” Transportation Research, Part E (2006): 149-166.
Babcock, Michael W., Eugene R. Russell, Marvin Prater and John Morrill. State Short Line
Railroads and the Rural Economy. Report No. K-Tran: KSU-92-2, June 1993, pp 144-158,
Kansas Department of Transportation.
Babcock Michael W., Marvin Prater and John Morrill. A Profile of Short Line Railroad Success.
Transportation Journal 34(1), (1994): 22-31.
Bitzan, John D. and Denver D. Tolliver. “Heavier Loading Rail Cars.” Upper Great Plains
Transportation Institute, MPC Report No. 01-127.4, Fargo, ND, 2001.
Bitzan John D. and Denver D. Tolliver. “The Impacts of an Industry Switch to Larger Rail Grain
Hopper Cars on Local Infrastructure: A Case Study of North Dakota.” Journal of the
Transportation Research Forum 59(2), (2003): 135-154.
Casavant, Kenneth and Denver D. Tolliver. “Impacts Heavy Axle Loads on Light Density Lines
in the State of Washington.” Washington Department of Transportation, Olympia, WA, 2001.
Denicoff, Marina R., Marvin E. Prater, and Pierre Bahizi. Corn Transportation Profile, U.S.
Department of Agriculture, Agricultural Marketing Service, August 2014.
Denicoff, Marina R., Marvin E. Prater, and Pierre Bahizi. Soybean Transportation Profile, U.S.
Department of Agriculture, Agricultural Marketing Service, October 2014.
Denicoff, Marina R., Marvin E. Prater, and Pierre Bahizi. Wheat Transportation Profile, U.S.
Department of Agriculture, Agricultural Marketing Service, November 2014.
Federal Railroad Administration. Summary of Class II and Class III Railroad Capital Needs and
Funding Sources – A Report to Congress, October 2014.
Iowa Department of Transportation, Office of Rail Transportation, Heavy Axle Load Upgrade
Report, Des Moines, Iowa, 2002.
Llorens, Jared J. and James A. Richardson. Economic Impact Analysis of Short Line Railroads.
Federal Report 527, National Center for Intermodal Transportation, 2015.
Martens, B. J. “An Economic Analysis of Heavy Axle Loads: The Effects on Short Line
Railroads and the Tradeoffs Associated with Heavy Cars.” Master’s thesis, Department of
Agricultural Economics, North Dakota State University, Fargo, ND. 1999.
Qiao, Fengxiang. Transportation and Economic Impact of Texas Short Line Railroads. Texas
Department of Transportation, Research and Technology Office, Austin, TX, September 2016.

41
Resor, R. R., A. M. Zarembski and P.K. Patel. “An Estimation of the Investment in Track and
Structures Needed to Handle 286,000 Pound Rail Cars on Short Line Railroads.” Zeta-Tech
Associates Inc., Chevvy Hill, NJ, 2000.
Sage, Jeremy, Ken Casavant, and J. Bradley Eustice. Washington State Short Line Rail Inventory
and Needs Assessment. Washington State Department of Transportation, June 2015.
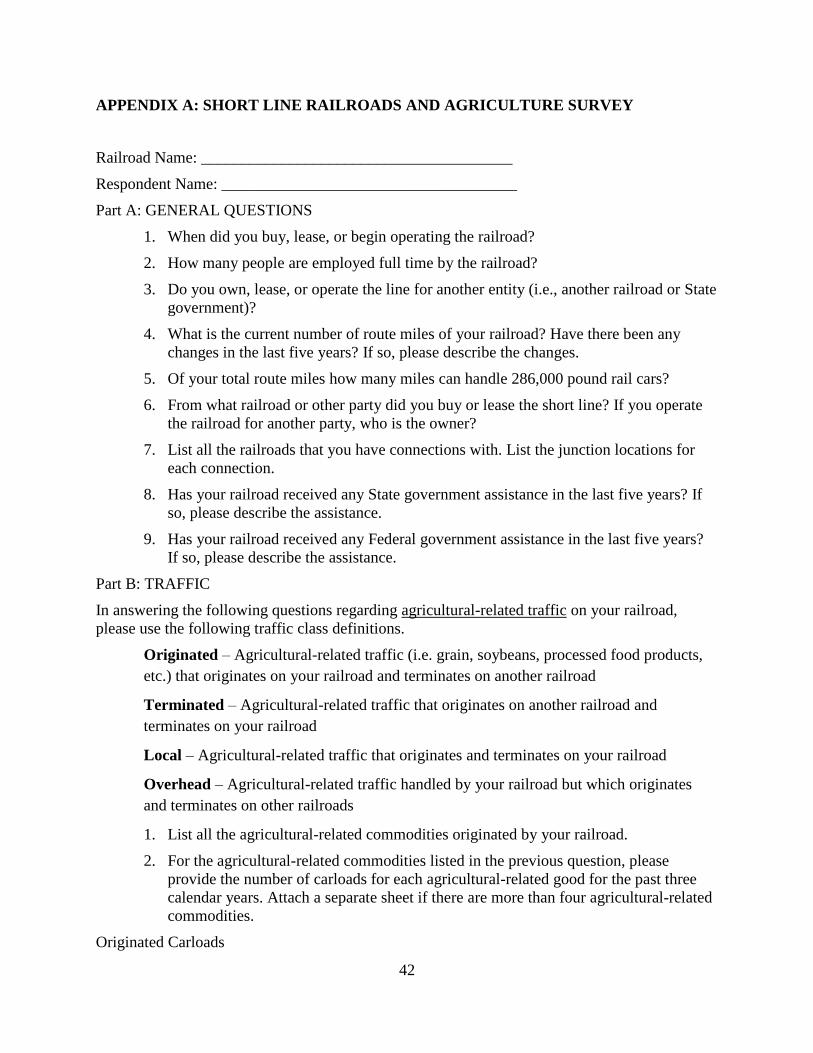
42
APPENDIX A: SHORT LINE RAILROADS AND AGRICULTURE SURVEY
Railroad Name: _______________________________________
Respondent Name: _____________________________________
Part A: GENERAL QUESTIONS
1. When did you buy, lease, or begin operating the railroad?
2. How many people are employed full time by the railroad?
3. Do you own, lease, or operate the line for another entity (i.e., another railroad or State
government)?
4. What is the current number of route miles of your railroad? Have there been any
changes in the last five years? If so, please describe the changes.
5. Of your total route miles how many miles can handle 286,000 pound rail cars?
6. From what railroad or other party did you buy or lease the short line? If you operate
the railroad for another party, who is the owner?
7. List all the railroads that you have connections with. List the junction locations for
each connection.
8. Has your railroad received any State government assistance in the last five years? If
so, please describe the assistance.
9. Has your railroad received any Federal government assistance in the last five years?
If so, please describe the assistance.
Part B: TRAFFIC
In answering the following questions regarding agricultural-related traffic on your railroad,
please use the following traffic class definitions.
Originated – Agricultural-related traffic (i.e. grain, soybeans, processed food products,
etc.) that originates on your railroad and terminates on another railroad
Terminated – Agricultural-related traffic that originates on another railroad and
terminates on your railroad
Local – Agricultural-related traffic that originates and terminates on your railroad
Overhead – Agricultural-related traffic handled by your railroad but which originates
and terminates on other railroads
1. List all the agricultural-related commodities originated by your railroad.
2. For the agricultural-related commodities listed in the previous question, please
provide the number of carloads for each agricultural-related good for the past three
calendar years. Attach a separate sheet if there are more than four agricultural-related
commodities.
Originated Carloads

43
Commodity Name Commodity Name Commodity Name Commodity Name
Year _______________ _______________ _______________ _______________
2015 _______________ _______________ _______________ _______________
2014 _______________ _______________ _______________ _______________
2013 _______________ _______________ _______________ _______________
3. What are the principal destination markets for each of your originated agricultural-
related commodities?
4. List all the agricultural-related commodities terminated by your railroad.
5. For each of the agricultural-related commodities listed in the previous question,
please provide the number of carloads for each agriculture-related commodity for the
past three calendar years. Attach a separate sheet if there are more than four
agriculture-related terminated commodities.
Terminated Carloads
Commodity Name Commodity Name Commodity Name Commodity Name
Year _______________ _______________ _______________ _______________
2015 _______________ _______________ _______________ _______________
2014 _______________ _______________ _______________ _______________
2013 _______________ _______________ _______________ _______________
6. What are the principal origins of each of the agricultural-related commodities
terminated on your railroad?
7. List all the local agricultural-related commodities handled by your railroad.
8. For the agriculture-related commodities listed in the previous question, please provide
the number of carloads for each commodity for the following three calendar years.
Attach a separate sheet in there are more than four local agricultural-related
commodities.
Local Carloads
Commodity Name Commodity Name Commodity Name Commodity Name
Year _______________ _______________ _______________ _______________
2015 _______________ _______________ _______________ _______________
2014 _______________ _______________ _______________ _______________
2013 _______________ _______________ _______________ _______________
9. What are the principle destination markets for each of your agriculture-related local
traffic?
10. List all the agricultural-related overhead commodities handled by your railroad.
44
11. For the agricultural-related commodities listed in the previous question, please
provide the number of carloads for each commodity for the following three calendar
years. Attach a separate sheet if there are more than four overhead agricultural-related
commodities.
Overhead Carloads
Commodity Name Commodity Name Commodity Name Commodity Name
Year _______________ _______________ _______________ _______________
2015 _______________ _______________ _______________ _______________
2014 _______________ _______________ _______________ _______________
2013 _______________ _______________ _______________ _______________
12. If you know the ultimate destinations of overhead agricultural-related traffic shipped
on your railroad please provide that information.
Part C: EQUIPMENT
1. How many locomotives does your railroad own? Please list the number of
locomotives by type.
2. How many locomotives does your railroad lease? From whom do you lease
locomotives?
3. How many rail cars does your railroad own? Please give the number of cars by type
of rail car (i.e., covered hopper cars etc.).
4. How many rail cars does your railroad lease? From whom do you lease rail cars?
5. How dependent is your railroad on connecting Class I railroads for locomotives?
Check one of the following:
Very Dependent ______
Somewhat Dependent ______
Not Dependent ______
6. How dependent is your railroad on connecting Class I railroads for rail cars? Check
one of the following:
Very Dependent ______
Somewhat Dependent ______
Not Dependent ______
7. If your railroad is dependent on other Class I railroads for locomotives and rail cars,
do you have trouble obtaining the equipment you need during peak periods such as
grain harvest? Check one of the following:
All of the time ______
Some of the time ______
45
None of the time ______
8. How much money does the railroad typically invest on an annual basis to maintain
the rail tracks and road bed on your railroad?
Part D: MARKETS AND COMPETITION
1. How dependent is your railroad on connecting Class I railroads to reach the principal
markets that you serve? Check one of the following:
Very Dependent ______
Somewhat Dependent ______
Not Dependent ______
2. With respect to your originated traffic, which of the following does your railroad
compete against? Check all that apply:
Motor Carriers ______
Class I railroads ______
Short line railroads ______
Water Carriers ______
Other (Specify) ______
None of the above ______
3. In the preceding question, if your railroad has competition, which agriculture-related
commodities are subject to competition?
With respect to your terminated traffic which of the following does your railroad
compete against? Check all that apply.
Motor Carriers ______
Class I railroads ______
Short line railroads ______
Water Carriers ______
Other (Specify) ______
None of the above ______
4. In the preceding question, if your railroad has competition, which agriculture-related
commodities are subject to competition?
5. With respect to your local traffic, which of the following does your short line
compete against? Check all that apply.
Motor Carriers ______
46
Class I railroads ______
Short line railroads ______
Water Carriers ______
Other (Specify) ______
None of the above ______
6. In the preceding question, if your railroad has competition, which agriculture-related
commodities are subject to competition?
7. With respect to your overhead traffic, which of the following does your railroad
compete against? Check all that apply.
Motor Carriers ______
Class I railroads ______
Short line railroads ______
Water Carriers ______
Other (Specify) ______
None of the above ______
8. In the preceding question, if your railroad has competition which agriculture-related
commodities are subject to competition?
9. Are shifts in Class I pricing and the move to shuttle trains in grain transport creating
an opportunity or a threat to your railroad competitiveness? Please explain.
10. Will your agriculture-related traffic increase or decrease if current trends continue
(i.e., focus on shuttle trains and increased ethanol production)?
11. Does Class I railroad policy (i.e., shuttle train loaders) affect competition between
trucks and short lines?
12. What modes are becoming more of a challenge to short line success? Why is this so?
Part E: SHORT LINE SUCCESS PROFILE
1. Below are listed several potential ingredients for a profitable short line railroad. From
the choices given, select what you feel to be the three most important determinates of
success (profits). Put 1 next to most important, 2 next to the second most important
and 3 next to the third most important.
Strong Shipper Support ______
Adequate Track Quality ______
Reasonable Purchase Price ______
Adequate Traffic Levels ______
Ship Many Different Commodities ______
47
Access to More Than One Connecting Carrier ______
State Financial Assistance ______
Ability to Compete With Motor Carriers ______
Experienced Management ______
Reliance on Equity Financing ______
Access to Own Equipment ______
Cooperation From Connecting Railroads on
Joint Rates and Revenue Splits ______
2. If the above list omits something you feel is important to short line profitability,
please explain and discuss in detail.
48
APPENDIX B: SURVEY OF STATE ASSISTANCE PROGRAMS FOR SHORT LINE
RAILROADS
Name and State___________________________________________________
1. What are the characteristics of short line assistance programs in your State including
the following:
Program Names and Start Dates
What types of assistance are available (i.e. track rehab/maintenance)
Loans or grants or both
States share of short line assistance projects
Total dollar annual amounts of assistance
Which railroad received assistance in what amounts
2. To minimize the risk of loss of State funds it is important to have criteria for a
profitable short line assistance project such as realistic estimates of traffic, revenue,
operating expense, and track maintenance expense. Also required equity investment
by both shippers and the railroad. What criteria do your assistance programs have for
eligibility for assistance?
3. What have been benefits of short line railroad assistance programs and what have
been the costs?
4. In your opinion what impact have the short line assistance programs had on short line
profitability and rural economic development in your State? Explain.
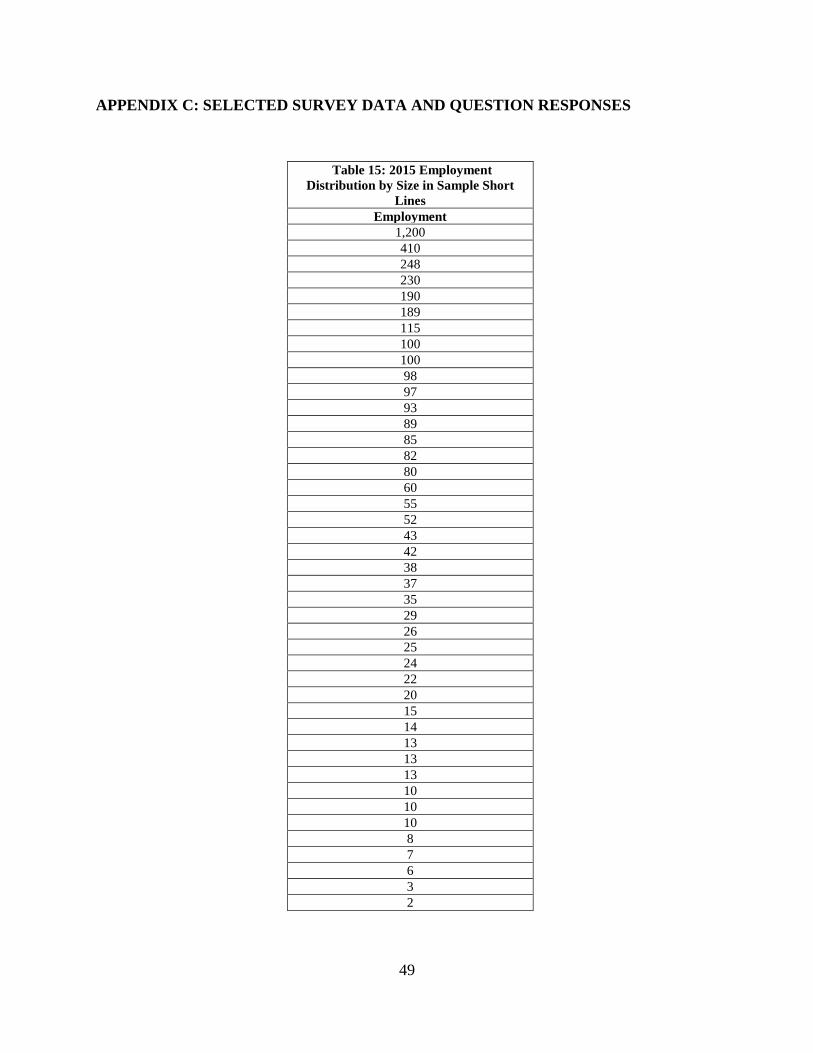
49
APPENDIX C: SELECTED SURVEY DATA AND QUESTION RESPONSES
Table 15: 2015 Employment
Distribution by Size in Sample Short
Lines Employment
1,200
410
248
230
190
189
115
100
100
98
97
93
89
85
82
80
60
55
52
43
42
38
37
35
29
26
25
24
22
20
15
14
13
13
13
10
10
10
8
7
6
3
2
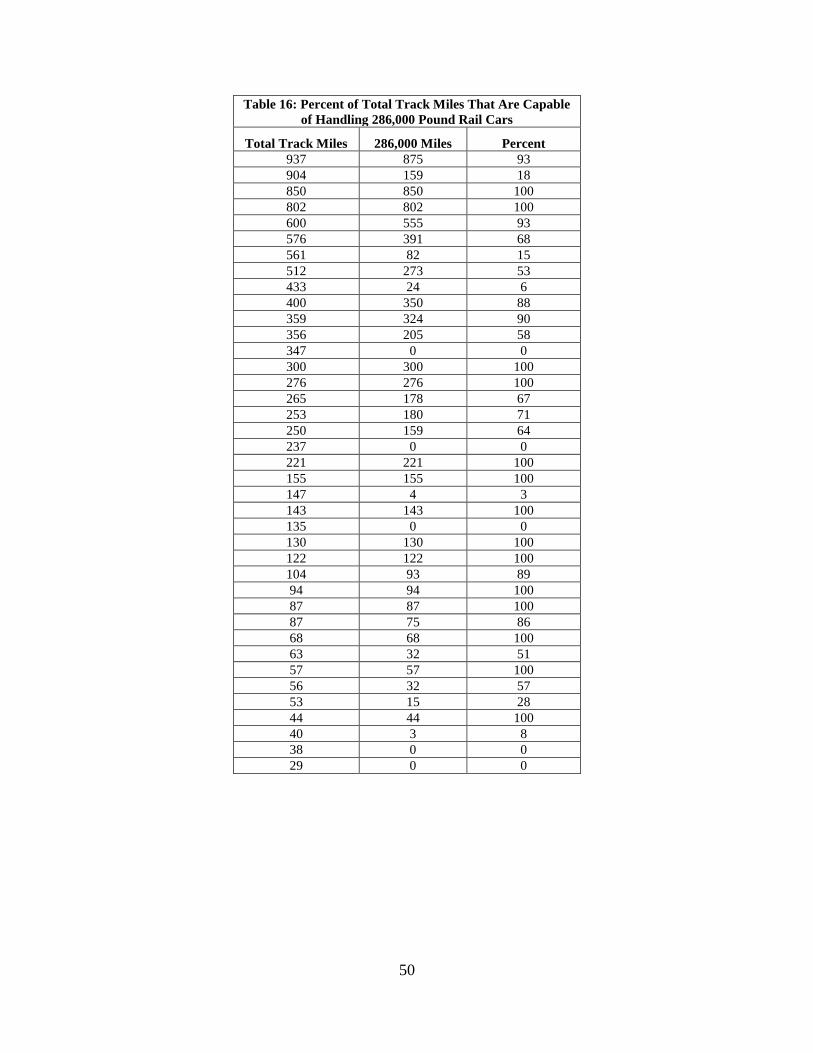
50
Table 16: Percent of Total Track Miles That Are Capable
of Handling 286,000 Pound Rail Cars
Total Track Miles 286,000 Miles Percent
937 875 93
904 159 18
850 850 100
802 802 100
600 555 93
576 391 68
561 82 15
512 273 53
433 24 6
400 350 88
359 324 90
356 205 58
347 0 0
300 300 100
276 276 100
265 178 67
253 180 71
250 159 64
237 0 0
221 221 100
155 155 100
147 4 3
143 143 100
135 0 0
130 130 100
122 122 100
104 93 89
94 94 100
87 87 100
87 75 86
68 68 100
63 32 51
57 57 100
56 32 57
53 15 28
44 44 100
40 3 8
38 0 0
29 0 0

51
Table 17: Number of Sample Short Line Connections to
Other Railroads, Ranked the Highest to the Lowest
21
7
6
6
5
4
4
4
4
4
4
3
3
3
3
3
3
3
3
3
2
2
2
2
2
2
2
2
2
2
2
1
1
1
1
1
1
1
1
1
1
1
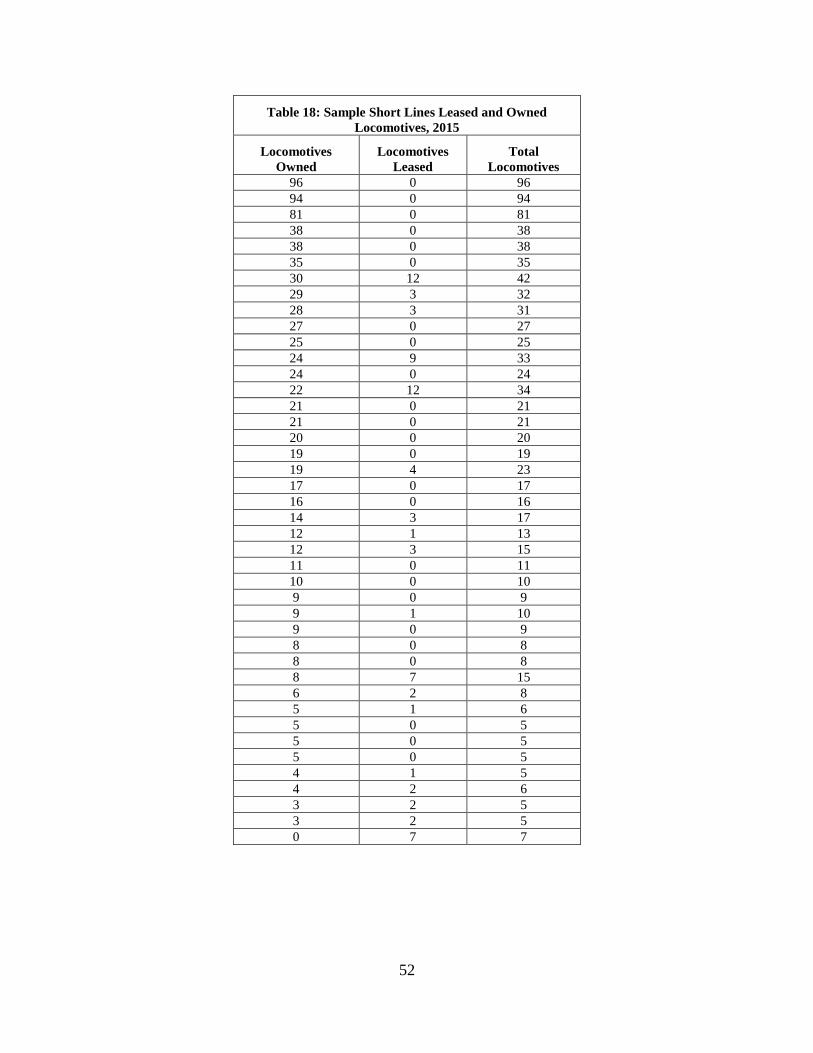
52
Table 18: Sample Short Lines Leased and Owned
Locomotives, 2015
Locomotives
Owned
Locomotives
Leased
Total
Locomotives
96 0 96
94 0 94
81 0 81
38 0 38
38 0 38
35 0 35
30 12 42
29 3 32
28 3 31
27 0 27
25 0 25
24 9 33
24 0 24
22 12 34
21 0 21
21 0 21
20 0 20
19 0 19
19 4 23
17 0 17
16 0 16
14 3 17
12 1 13
12 3 15
11 0 11
10 0 10
9 0 9
9 1 10
9 0 9
8 0 8
8 0 8
8 7 15
6 2 8
5 1 6
5 0 5
5 0 5
5 0 5
4 1 5
4 2 6
3 2 5
3 2 5
0 7 7
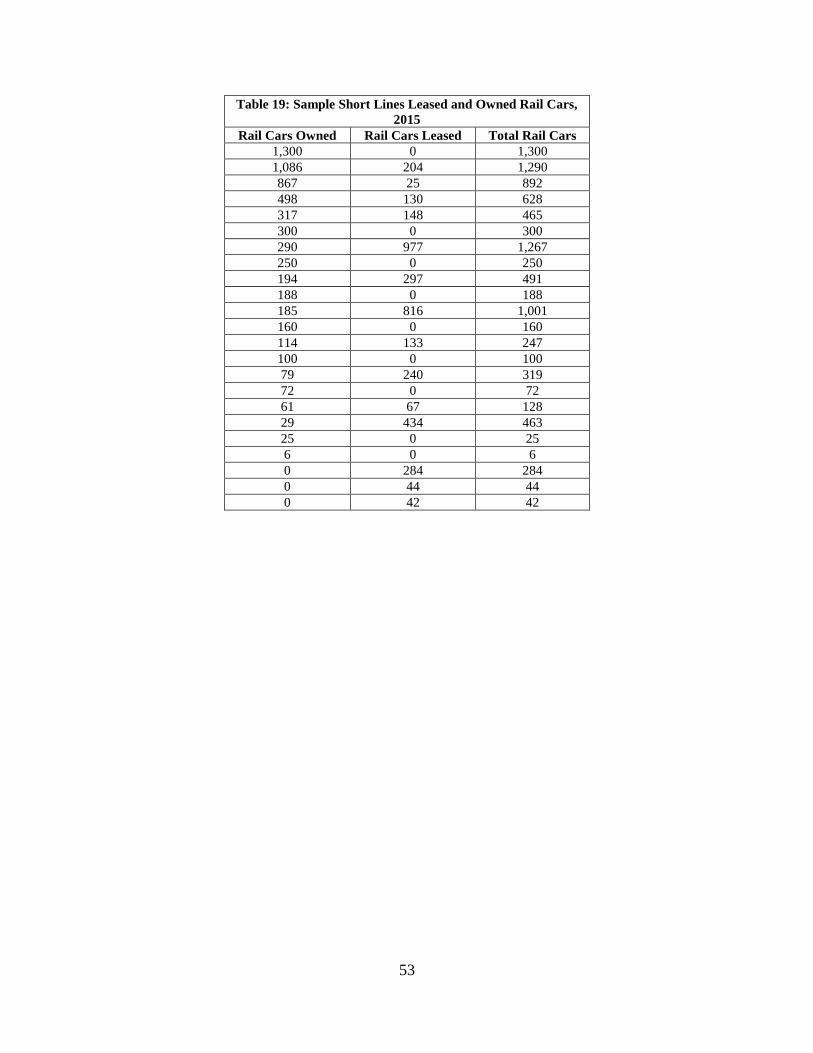
53
Table 19: Sample Short Lines Leased and Owned Rail Cars,
2015
Rail Cars Owned Rail Cars Leased Total Rail Cars
1,300 0 1,300
1,086 204 1,290
867 25 892
498 130 628
317 148 465
300 0 300
290 977 1,267
250 0 250
194 297 491
188 0 188
185 816 1,001
160 0 160
114 133 247
100 0 100
79 240 319
72 0 72
61 67 128
29 434 463
25 0 25
6 0 6
0 284 284
0 44 44
0 42 42

54
Table 20: Sample Short Line Annual Investment to
Maintain Rail Tracks and Road Bed, Maintenance
Expenditure Per Mile
$42,689
29,412
25,000
21,277
15,810
14,666
12,500
12,445
11,905
11,783
10,143
10,000
8,413
8,133
7,813
7,606
7,240
6,902
6,751
6,522
6,492
6,024
5,660
5,122
4,213
4,000
4,000
3,748
3,472
2,500
2,041
1,575
658
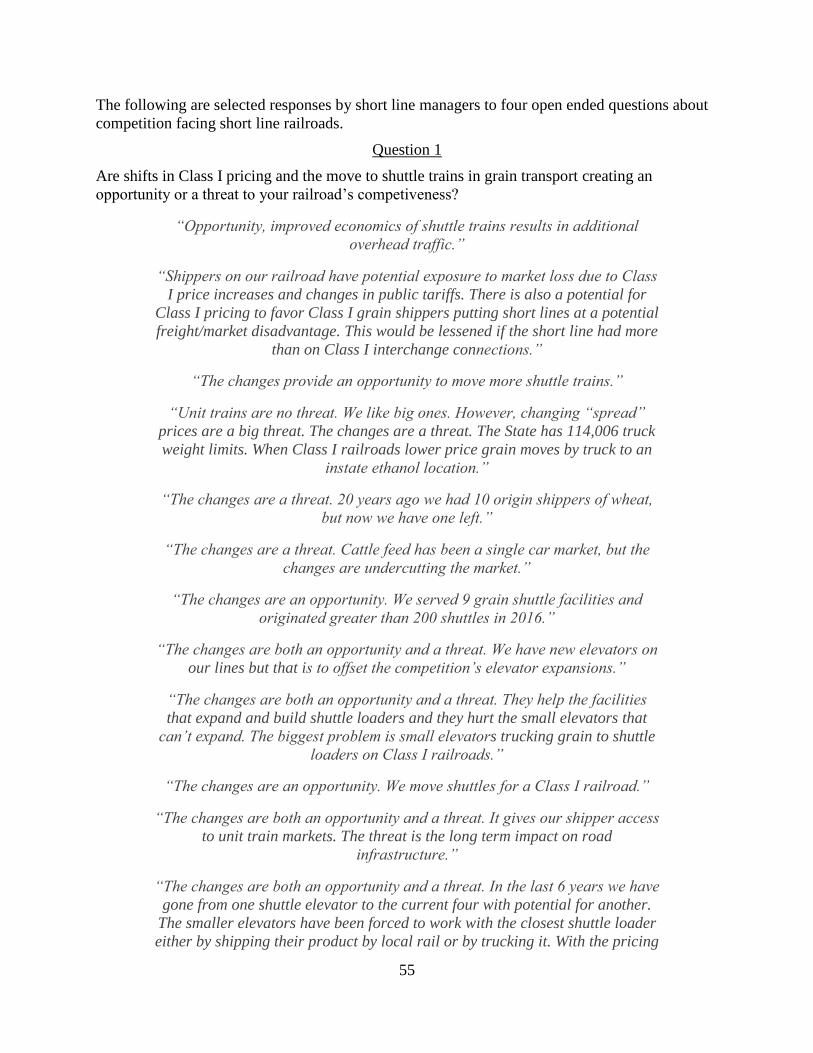
55
The following are selected responses by short line managers to four open ended questions about
competition facing short line railroads.
Question 1
Are shifts in Class I pricing and the move to shuttle trains in grain transport creating an
opportunity or a threat to your railroad’s competiveness?
“Opportunity, improved economics of shuttle trains results in additional
overhead traffic.”
“Shippers on our railroad have potential exposure to market loss due to Class
I price increases and changes in public tariffs. There is also a potential for
Class I pricing to favor Class I grain shippers putting short lines at a potential
freight/market disadvantage. This would be lessened if the short line had more
than on Class I interchange connections.”
“The changes provide an opportunity to move more shuttle trains.”
“Unit trains are no threat. We like big ones. However, changing “spread”
prices are a big threat. The changes are a threat. The State has 114,006 truck
weight limits. When Class I railroads lower price grain moves by truck to an
instate ethanol location.”
“The changes are a threat. 20 years ago we had 10 origin shippers of wheat,
but now we have one left.”
“The changes are a threat. Cattle feed has been a single car market, but the
changes are undercutting the market.”
“The changes are an opportunity. We served 9 grain shuttle facilities and
originated greater than 200 shuttles in 2016.”
“The changes are both an opportunity and a threat. We have new elevators on
our lines but that is to offset the competition’s elevator expansions.”
“The changes are both an opportunity and a threat. They help the facilities
that expand and build shuttle loaders and they hurt the small elevators that
can’t expand. The biggest problem is small elevators trucking grain to shuttle
loaders on Class I railroads.”
“The changes are an opportunity. We move shuttles for a Class I railroad.”
“The changes are both an opportunity and a threat. It gives our shipper access
to unit train markets. The threat is the long term impact on road
infrastructure.”
“The changes are both an opportunity and a threat. In the last 6 years we have
gone from one shuttle elevator to the current four with potential for another.
The smaller elevators have been forced to work with the closest shuttle loader
either by shipping their product by local rail or by trucking it. With the pricing
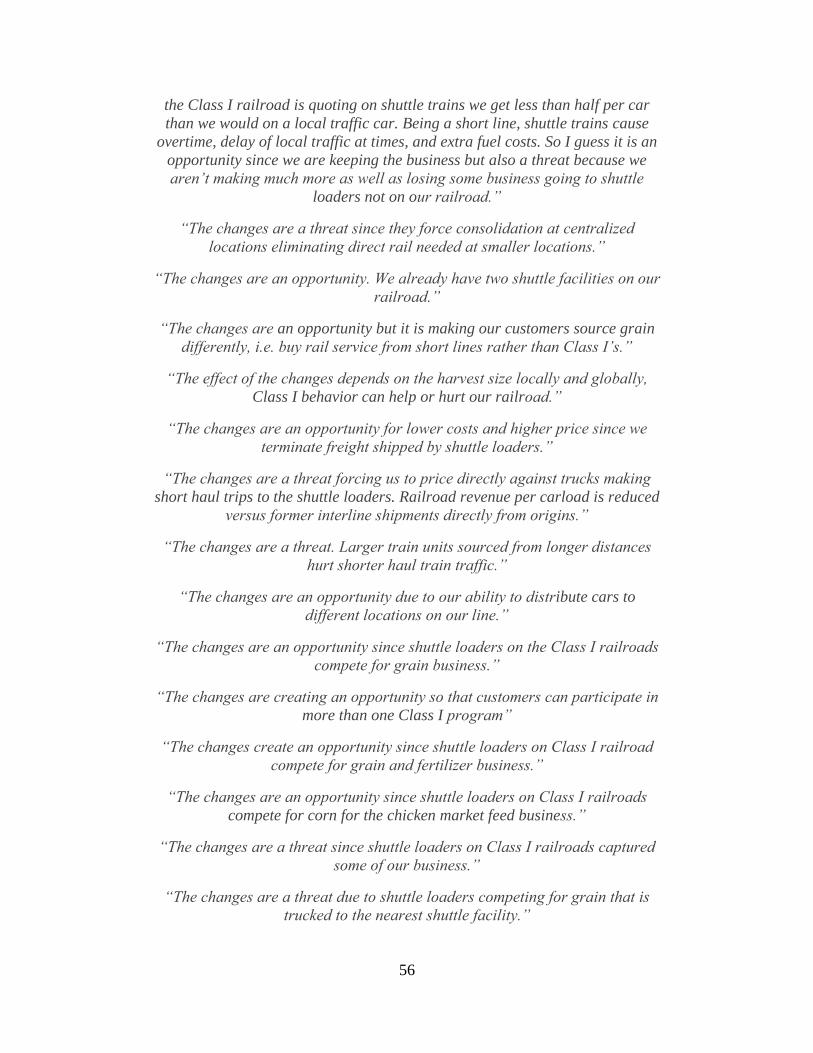
56
the Class I railroad is quoting on shuttle trains we get less than half per car
than we would on a local traffic car. Being a short line, shuttle trains cause
overtime, delay of local traffic at times, and extra fuel costs. So I guess it is an
opportunity since we are keeping the business but also a threat because we
aren’t making much more as well as losing some business going to shuttle
loaders not on our railroad.”
“The changes are a threat since they force consolidation at centralized
locations eliminating direct rail needed at smaller locations.”
“The changes are an opportunity. We already have two shuttle facilities on our
railroad.”
“The changes are an opportunity but it is making our customers source grain
differently, i.e. buy rail service from short lines rather than Class I’s.”
“The effect of the changes depends on the harvest size locally and globally,
Class I behavior can help or hurt our railroad.”
“The changes are an opportunity for lower costs and higher price since we
terminate freight shipped by shuttle loaders.”
“The changes are a threat forcing us to price directly against trucks making
short haul trips to the shuttle loaders. Railroad revenue per carload is reduced
versus former interline shipments directly from origins.”
“The changes are a threat. Larger train units sourced from longer distances
hurt shorter haul train traffic.”
“The changes are an opportunity due to our ability to distribute cars to
different locations on our line.”
“The changes are an opportunity since shuttle loaders on the Class I railroads
compete for grain business.”
“The changes are creating an opportunity so that customers can participate in
more than one Class I program”
“The changes create an opportunity since shuttle loaders on Class I railroad
compete for grain and fertilizer business.”
“The changes are an opportunity since shuttle loaders on Class I railroads
compete for corn for the chicken market feed business.”
“The changes are a threat since shuttle loaders on Class I railroads captured
some of our business.”
“The changes are a threat due to shuttle loaders competing for grain that is
trucked to the nearest shuttle facility.”

57
“The changes create a threat since shuttle loaders on Class I railroads
compete with our railroad for grain and fertilizer business.”
“The changes are a threat since shuttle location on the Class I railroad
captured the inbound corn business.”
Question 2
Will your agricultural traffic increase or decrease if current trends continue (i.e., focus on shuttle
trains and increased ethanol production)?
“Wheat production has been so erratic that it is hard to say. We have been
able to increase inbound corn and feed grains as animal feed.”
“Our agriculture-related traffic is very dependent on yields per acre of grain.”
“Whether our traffic decreases or increases depends on market conditions.”
“Our agriculture related traffic would correlate with crop yields. Development
of drought resistant corn had a significant positive impact on our traffic.”
“Our agricultural-related traffic will probably stay the same. Many of the
small elevators have either gone out of business or have agreements with
nearby shuttle loaders.”
“Our grain shippers are far enough from ethanol producers so as not to lose
market share. The railroads primary grain shipper already participates in the
express load programs of two Class I railroads.”
“We don’t see any new unit grain trains around us or new ethanol or soybean
plants. So we expect traffic to remain steady, dependent on the size of the local
grain crop.”
“We expect our agricultural traffic to decrease as ethanol plants are
expanding in our area.”
Question 3
Does Class I railroad policy (i.e., shuttle train loaders) affect competition between trucks and
short lines?
“The Class I railroad recognizes all three of our 85 car unit train loaders as
“direct origins” so truck competition is not an issues at this point.”
“Truck competition is not much in our markets.”
“If the Class I sets pricing it does affect competition between short lines and
trucks.”
“We are seeing a trend with low fuel prices that for some customers it is
cheaper to truck their product than ship via rail. This pertains to small
customers that don’t load shuttles.”
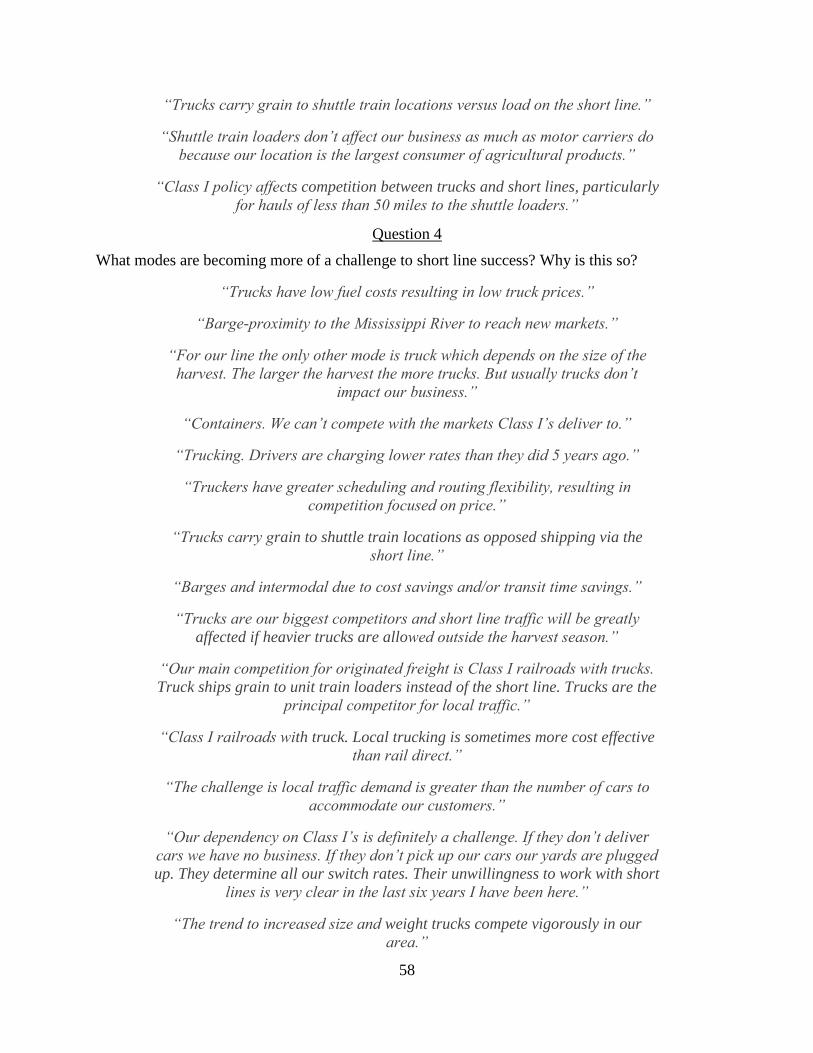
58
“Trucks carry grain to shuttle train locations versus load on the short line.”
“Shuttle train loaders don’t affect our business as much as motor carriers do
because our location is the largest consumer of agricultural products.”
“Class I policy affects competition between trucks and short lines, particularly
for hauls of less than 50 miles to the shuttle loaders.”
Question 4
What modes are becoming more of a challenge to short line success? Why is this so?
“Trucks have low fuel costs resulting in low truck prices.”
“Barge-proximity to the Mississippi River to reach new markets.”
“For our line the only other mode is truck which depends on the size of the
harvest. The larger the harvest the more trucks. But usually trucks don’t
impact our business.”
“Containers. We can’t compete with the markets Class I’s deliver to.”
“Trucking. Drivers are charging lower rates than they did 5 years ago.”
“Truckers have greater scheduling and routing flexibility, resulting in
competition focused on price.”
“Trucks carry grain to shuttle train locations as opposed shipping via the
short line.”
“Barges and intermodal due to cost savings and/or transit time savings.”
“Trucks are our biggest competitors and short line traffic will be greatly
affected if heavier trucks are allowed outside the harvest season.”
“Our main competition for originated freight is Class I railroads with trucks.
Truck ships grain to unit train loaders instead of the short line. Trucks are the
principal competitor for local traffic.”
“Class I railroads with truck. Local trucking is sometimes more cost effective
than rail direct.”
“The challenge is local traffic demand is greater than the number of cars to
accommodate our customers.”
“Our dependency on Class I’s is definitely a challenge. If they don’t deliver
cars we have no business. If they don’t pick up our cars our yards are plugged
up. They determine all our switch rates. Their unwillingness to work with short
lines is very clear in the last six years I have been here.”
“The trend to increased size and weight trucks compete vigorously in our
area.”

59
“Class I railroads set our prices.”
“Truck prices are cheap making it difficult to compete with them.”
“Motor carriers increased size and weight changes make it difficult to
compete.”
“Class I operational changes and service problems can create issues for short
line success. In our service area our trains operation on track age rights of
Class I carriers. If interchange yards with Class I carriers become too
congested traffic to or from our customers can be delayed.”
“Being captive to a single Class I railroad is a concern as our grain traffic is
dependent on rates and service that they set. The Class I requirement that we
equip our interchange locomotives with PTC (Positive Train Control) by early
2018 will be a big financial burden to our railroad and likely continuing
financial commitment with zero financial benefit for our railroad.”
“Class I rate structures are the biggest factor.”
“Class I rates and increased size and weight of trucks are the biggest
challenges.”
“Class I’s are the biggest factor since they view short lines as a competitor.”
Related Documents


![Schmale, Valerie - AMS · 3 Thanks for your understanding! Albrecht Benzing, CERES GmbH Von: Valerie.Schmale@ams.usda.gov [mailto:Valerie.Schmale@ams.usda.gov]](https://static.cupdf.com/doc/110x72/5b786d197f8b9a331e8b9bfe/schmale-valerie-ams-3-thanks-for-your-understanding-albrecht-benzing-ceres.jpg)

