Profile of Parkia speciosa Hassk Metabolites Extracted with SFE using FTIR- PCA Method Nik Norulaini Nik Abd. Rahman, b * Salman Zhari, a Md. Zaidul Islam Sarker, c * Sahena Ferdosh, d Mohd Azizi Che Yunus a and Mohd Omar Abd Kadir d a Faculty of Chemical Engineering, Universiti Teknologi Malaysia, Skudai, Johor Bharu, Malaysia b School of Distant Education, Universiti Sains Malaysia, 11800 Minden, Penang Malaysia c Department of Pharmaceutical Technology, Faculty of Pharmacy, International Islamic University Malaysia, Kuantan Campus, Badar Indera Mahkota, 25200, Kuantan, Pahang D/M, Malaysia d School of Industrial Technology, Universiti Sains Malaysia, 11800 Minden, Penang Malaysia Received February 22, 2011; Accepted July 4, 2011; Published Online August 5, 2011 A rapid identification, classification and discrimination tool, using Fourier Transform Infrared (FTIR) spectroscopy combined with Principal Component Analysis (PCA), was developed and applied to determine the profile of the Supercritical Fluid Extraction (SFE) of Parkia speciosa seeds under various temperature and pressure conditions (313, 323, 333, 343, 353 and 363 K and 20.68, 27.58, 34.47, 41.37, 48.26, and 55.16 MPa). The separation and identification of the compounds was carried out by Gas Chro- matography coupled with Time of Flight Mass Spectrometry (GC/TOF-MS). This technique has made it possible to detect the variability obtained under different SFE conditions and the separation of different chemical compounds in P. speciosa seeds. The FTIR-PCA results were verified by GC/TOF-MS, and the FTIR-PCA method successfully identified the unsaturated carboxylic acids with the highest percentage area under the different conditions. Keywords: SC-CO 2 extraction; FTIR-PCA identification; Parkia speciosa Hassk seeds; Finger- printing; Retrograde vaporisation. INTRODUCTION Parkia speciosa Hassk is a tropical leguminous tree in the family of Leguminosae found in most Southeast Asian countries. The seeds are used as food, either cooked or raw, due to their high nutritional value. The seeds are known to have important chemical and medicinal com- pounds, such as several cyclic polysulphides, which are used for the treatment of antibacterial activity in kidney, ureter and urinary bladder infections, 1 and thiazolidine-4- carboxylic acid, which is used for its anticancer activity. 2 The seeds also have a hypoglycaemic effect, due to the syn- ergistic action of 8-sitosterol and stigmasterol. 3 The important chemical and medicinal compounds in P. speciosa have not been systematically identified. A gas chromatograph can be used to separate the components of a mixture; and the fractions containing single components can be directed into an FTIR spectrometer, to provide the infrared spectrum of the sample Initially, the use of infrared (IR) spectroscopic methods was restricted to the structural elucidation of isolated compounds from herbal matrices. It was also found to be useful in phytochemical studies as a fingerprinting device, for comparing natural and synthetic samples. 4 Due to the inherent complexity of the IR spec- trum, the actual interpretation may be difficult and the op- eration requires much experience. Indeed, slight differ- ences in the spectra within the same plant species may not be obvious and are generally not visible to the naked eye. Thus, the application of IR spectroscopy in herbal analysis is still very limited as compared to its application in other areas (food and beverage industry, microbiology, pharma- ceuticals, etc). Principal Component Analysis (PCA), an unsuper- vised chemometric pattern recognition technique, is fre- quently used in handling multivariate data without prior knowledge of the samples studied. 5 The main advantage of chemometrics is its ability to analyse very complex multi- Metabolites Extracted with Supercritical Fluid J. Chin. Chem. Soc., Vol. 58, No. 6, 2011 1 * Corresponding author. Tel: +604-6532108; +609-5716687; Fax: +604-6585435; +609-5716775; E-mail: [email protected] (Nik Norulaini Nik Abd Rahman), [email protected] (Md. Zaidul Islam Sarker)

Welcome message from author
This document is posted to help you gain knowledge. Please leave a comment to let me know what you think about it! Share it to your friends and learn new things together.
Transcript
Profile of Parkia speciosa Hassk Metabolites Extracted with SFE using
FTIR- PCA Method
Nik Norulaini Nik Abd. Rahman,b* Salman Zhari,a Md. Zaidul Islam Sarker,c* Sahena Ferdosh,d
Mohd Azizi Che Yunusa and Mohd Omar Abd Kadird
aFaculty of Chemical Engineering, Universiti Teknologi Malaysia, Skudai, Johor Bharu, MalaysiabSchool of Distant Education, Universiti Sains Malaysia, 11800 Minden, Penang Malaysia
cDepartment of Pharmaceutical Technology, Faculty of Pharmacy, International Islamic University
Malaysia, Kuantan Campus, Badar Indera Mahkota, 25200, Kuantan, Pahang D/M, MalaysiadSchool of Industrial Technology, Universiti Sains Malaysia, 11800 Minden, Penang Malaysia
Received February 22, 2011; Accepted July 4, 2011; Published Online August 5, 2011
A rapid identification, classification and discrimination tool, using Fourier Transform Infrared
(FTIR) spectroscopy combined with Principal Component Analysis (PCA), was developed and applied to
determine the profile of the Supercritical Fluid Extraction (SFE) of Parkia speciosa seeds under various
temperature and pressure conditions (313, 323, 333, 343, 353 and 363 K and 20.68, 27.58, 34.47, 41.37,
48.26, and 55.16 MPa). The separation and identification of the compounds was carried out by Gas Chro-
matography coupled with Time of Flight Mass Spectrometry (GC/TOF-MS). This technique has made it
possible to detect the variability obtained under different SFE conditions and the separation of different
chemical compounds in P. speciosa seeds. The FTIR-PCA results were verified by GC/TOF-MS, and the
FTIR-PCA method successfully identified the unsaturated carboxylic acids with the highest percentage
area under the different conditions.
Keywords: SC-CO2 extraction; FTIR-PCA identification; Parkia speciosa Hassk seeds; Finger-
printing; Retrograde vaporisation.
INTRODUCTION
Parkia speciosa Hassk is a tropical leguminous tree
in the family of Leguminosae found in most Southeast
Asian countries. The seeds are used as food, either cooked
or raw, due to their high nutritional value. The seeds are
known to have important chemical and medicinal com-
pounds, such as several cyclic polysulphides, which are
used for the treatment of antibacterial activity in kidney,
ureter and urinary bladder infections,1 and thiazolidine-4-
carboxylic acid, which is used for its anticancer activity.2
The seeds also have a hypoglycaemic effect, due to the syn-
ergistic action of 8-sitosterol and stigmasterol.3
The important chemical and medicinal compounds in
P. speciosa have not been systematically identified. A gas
chromatograph can be used to separate the components of a
mixture; and the fractions containing single components
can be directed into an FTIR spectrometer, to provide the
infrared spectrum of the sample Initially, the use of infrared
(IR) spectroscopic methods was restricted to the structural
elucidation of isolated compounds from herbal matrices. It
was also found to be useful in phytochemical studies as a
fingerprinting device, for comparing natural and synthetic
samples.4 Due to the inherent complexity of the IR spec-
trum, the actual interpretation may be difficult and the op-
eration requires much experience. Indeed, slight differ-
ences in the spectra within the same plant species may not
be obvious and are generally not visible to the naked eye.
Thus, the application of IR spectroscopy in herbal analysis
is still very limited as compared to its application in other
areas (food and beverage industry, microbiology, pharma-
ceuticals, etc).
Principal Component Analysis (PCA), an unsuper-
vised chemometric pattern recognition technique, is fre-
quently used in handling multivariate data without prior
knowledge of the samples studied.5 The main advantage of
chemometrics is its ability to analyse very complex multi-
Metabolites Extracted with Supercritical Fluid J. Chin. Chem. Soc., Vol. 58, No. 6, 2011 1
* Corresponding author. Tel: +604-6532108; +609-5716687; Fax: +604-6585435; +609-5716775; E-mail: [email protected] (Nik
Norulaini Nik Abd Rahman), [email protected] (Md. Zaidul Islam Sarker)
variate datasets, such as those from GC-MS, DAD-HPLC,
NMR, FTIR and NIR, involving overlapping peaks, very
noisy chromatograms, thousands of samples and very simi-
lar profiles, which cannot be handled in a conventional way
in environmental assessment, natural products, food or fo-
rensic analysis.6 Chemometric methods can be applied to
extract information from datasets mainly for signal resolu-
tion, classification, calibration and experimental design.
Many chemometric methods can be used for these pur-
poses; however, PCA is the most commonly used method.
PCA associated with FTIR spectroscopy has been shown to
be an important tool for the rapid identification and classi-
fication of data and has been applied to the analysis of in-
frared spectra in the fields of medicine, biology and foren-
sic science.7
Supercritical fluid extraction (SFE) using carbon di-
oxide is an environmentally friendly and efficient extrac-
tion technique8 for solid materials and has been extensively
studied for the separation of active compounds from natu-
ral products. Due to its good solvent properties, CO2 re-
mains the most commonly used fluid for the extraction of
non-polar components such as hydrocarbons.9 Analysing
SFE data by applying PCA in analysis is still very limited,
with the exception of a study reported by Yang et al.10 on
the application of SFE/FT-IR/PCA in paper analysis. The
researchers found that the significance of applying PCA is,
it enables to rapidly discriminate between extractable com-
pounds that are indigenous and non-indigenous com-
pounds, based on their infrared spectra. The method was
applied with on-line supercritical fluid extraction, capillary
supercritical fluid chromatography and FTIR. They suc-
cessfully detected the presence of a drug, lysergic acid
diethylamide (LSD), on paper by applying this technique.
In this work, FTIR spectroscopy was applied as a quantita-
tive method to study the effects of the SFE condition on the
functional group. The objective of this study is then to use
Fourier Transform Infrared (FTIR) spectroscopy in tandem
with Principal Component Analysis (PCA), as a rapid iden-
tification, classification and discrimination tool, to deter-
mine the profile of the Supercritical Fluid Extraction (SFE)
of Parkia speciosa seeds under extraction conditions.
MATERIALS AND METHODS
Sample Preparation
P. speciosa seeds were obtained locally from Selama,
Perak, Malaysia. The seeds were separated from the pods,
soaked in water overnight to remove the testae and then
dried in an oven at 45 °C until reaching a constant weight.11
The dried seeds were then ground, using a lab blender
(Waring Laboratory, USA), and the particle size distribu-
tions were determined by sieve analysis, with a Vibrator
Sieve Shaker (Retsch, Germany), and stored in a refrigera-
tor at -20 °C in a sealed container.
Supercritical Fluid Extraction (SFE) System
Supercritical fluid extractions were performed using
a system consisting of a CO2 gas cylinder (MOX Gases
Bhd, Selangor, Malaysia), a chiller (Yih Der BL-730), and
an ISCO SFE System (ISCO Inc., Lincoln, NE, USA) con-
sisting of a supercritical fluid extractor (SFX 220), a con-
troller (SFX 200), a syringe pump (model 100DX) and a
restrictor temperature controller associated with two coaxi-
ally heated capillary restrictors.
Method of Extraction
For each extraction process, a 10-mL sample car-
tridge was filled with 1.5 g of dried seeds of P. speciosa.
Static extraction was performed for 5 min before the pump
was turned on, to stabilise the temperature, and for another
5 min after the set pressure was reached, before the exit
valve was opened. A fraction of the extract was collected
every 5 min, and the extraction was carried out for 50 min.
The yield was determined as gram extract per gram sample.
Soxhlet extraction of P. speciosa seeds using hexane
Soxhlet extraction on 20.0 g of ground seeds with
particle sizes < 250 �m was performed for 2 h. After the ex-
traction process, the solvent was removed using a rotary
evaporator. The extract was then dried to remove the re-
maining solvent.
ATR-FTIR Spectroscopy
All the FTIR spectra were collected with a Nicolet
Nexus Spectrometer (ThermoNicolet) coupled with a tem-
perature-regulated DTGS (deuterated tri-glycine sulphate)
detector. The FTIR spectra were recorded in the mid-IR re-
gion, 4000-675 cm-1, at a resolution of 4 cm-1 with 32 scans.
The raw data from the experiment with an extension
file of (spa) were copied to Spectrum v3.02 (Perkin Elmer)
software and saved as an ASCII file for further analysis.
The percentage transmittance data were substituted for the
absorbance data. Baseline correction, spectrum smoothing
and normalisation were carried out. The baseline of the
2 J. Chin. Chem. Soc., Vol. 58, No. 6, 2011 Nik Norulaini et al.
spectrometer was removed by auto-correcting the spec-
trum, while normalisation of the absorbance spectra to the
most intense peak removes the differences between the
spectra due to different amounts of sample or path length
variation.12
Chemometrics analysis using principal component
analysis (PCA)
The acquired ASCII extension file spectra were im-
ported into the multivariate statistics program Unscrambler
9.0 (CAMO, India). PCA was carried out using 1712 points
(normalised absorbance) within the spectral region 4000-
700 cm-1. Leverage correction was used as the validation
method while weights were fixed at 1.0. A model size of 10
principal components (PCs) was used. The grouping of P.
speciosa from 36 different SFE extraction conditions and a
hexane extraction were visualised in the two-dimensional
score plot. The structural difference in the dataset from the
PC scores was revealed by the loading plot.
Chromatographic analysis by GC-TOFMS
A sample of 5 �L was taken into a vial, mixed with
995 �L hexane (1:199) and homogenised using a vortex
(IKA-Labortechnik STAUFEN, German) for 2 min. The
sample was then filtered into a 2-mL collection vial for
chromatographic analysis. The gas chromatography analy-
sis was carried out using a system consisting of an Agilent
Technologies 6890N Series and 7683 Series auto sampler
injector with controller, coupled with a LEGO Pegasus III
reflection Time of Flight (TOF) Mass Spectrometer with
element impact ionisation, equipped with a Chrom-TOF
mass data analysis system.
For the mass spectrometer settings, the mass range
chosen was 35-550 atomic mass unit (amu), the spectra
scan rate was 20 spectra per second and the ion source tem-
perature was set to 250 °C. The identification of the oil
compounds was performed by similarity searches in the
NIST (National Institute for Standard and Technology) and
1998 Mass Spectral Wiley Database libraries.
RESULTS AND DISCUSSION
Parkia speciosa seed extracts
The SF extracts of P. speciosa were light to dark
green in colour, and their aroma was similar to that of other
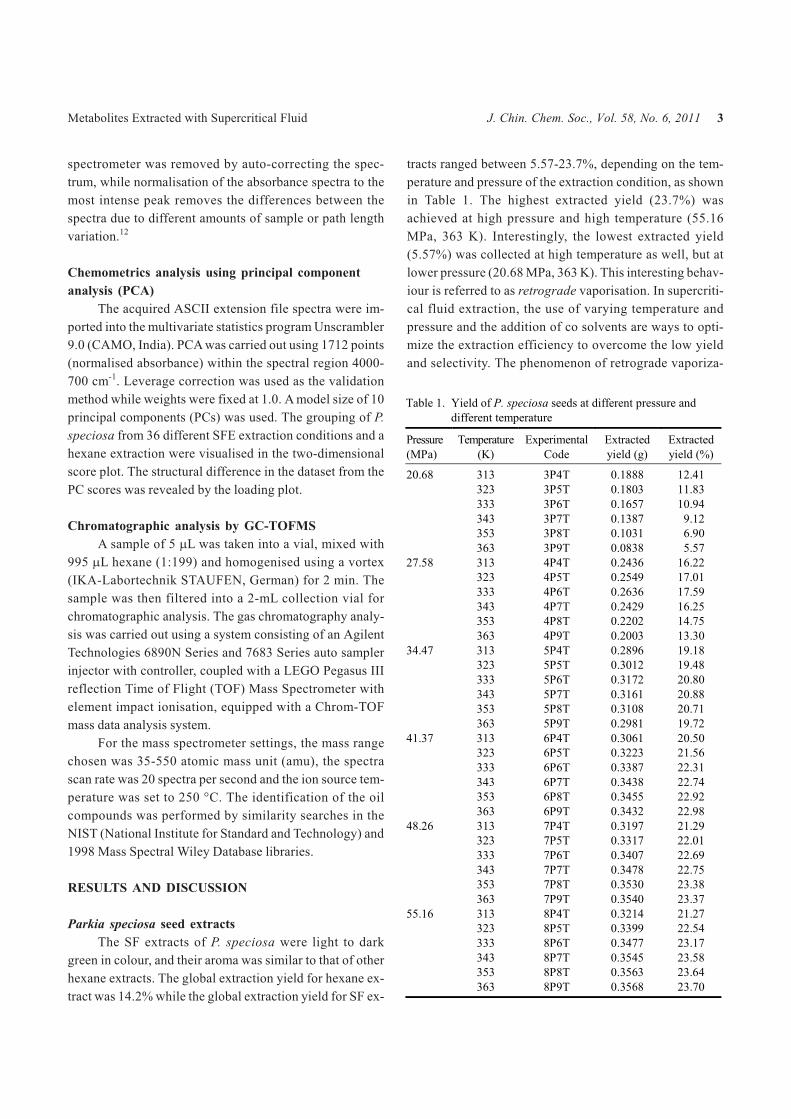
hexane extracts. The global extraction yield for hexane ex-
tract was 14.2% while the global extraction yield for SF ex-
tracts ranged between 5.57-23.7%, depending on the tem-
perature and pressure of the extraction condition, as shown
in Table 1. The highest extracted yield (23.7%) was
achieved at high pressure and high temperature (55.16
MPa, 363 K). Interestingly, the lowest extracted yield
(5.57%) was collected at high temperature as well, but at
lower pressure (20.68 MPa, 363 K). This interesting behav-
iour is referred to as retrograde vaporisation. In supercriti-
cal fluid extraction, the use of varying temperature and
pressure and the addition of co solvents are ways to opti-
mize the extraction efficiency to overcome the low yield
and selectivity. The phenomenon of retrograde vaporiza-
Metabolites Extracted with Supercritical Fluid J. Chin. Chem. Soc., Vol. 58, No. 6, 2011 3
Table 1. Yield of P. speciosa seeds at different pressure and
different temperature
Pressure
(MPa)
Temperature
(K)
Experimental
Code
Extracted
yield (g)
Extracted
yield (%)
20.68 313 3P4T 0.1888 12.41
323 3P5T 0.1803 11.83
333 3P6T 0.1657 10.94
343 3P7T 0.1387 9.12
353 3P8T 0.1031 6.90
363 3P9T 0.0838 5.57
27.58 313 4P4T 0.2436 16.22
323 4P5T 0.2549 17.01
333 4P6T 0.2636 17.59
343 4P7T 0.2429 16.25
353 4P8T 0.2202 14.75
363 4P9T 0.2003 13.30
34.47 313 5P4T 0.2896 19.18
323 5P5T 0.3012 19.48
333 5P6T 0.3172 20.80
343 5P7T 0.3161 20.88
353 5P8T 0.3108 20.71
363 5P9T 0.2981 19.72
41.37 313 6P4T 0.3061 20.50
323 6P5T 0.3223 21.56
333 6P6T 0.3387 22.31
343 6P7T 0.3438 22.74
353 6P8T 0.3455 22.92
363 6P9T 0.3432 22.98
48.26 313 7P4T 0.3197 21.29
323 7P5T 0.3317 22.01
333 7P6T 0.3407 22.69
343 7P7T 0.3478 22.75
353 7P8T 0.3530 23.38
363 7P9T 0.3540 23.37
55.16 313 8P4T 0.3214 21.27
323 8P5T 0.3399 22.54
333 8P6T 0.3477 23.17
343 8P7T 0.3545 23.58
353 8P8T 0.3563 23.64
363 8P9T 0.3568 23.70
tion can be used to explain the increase in the difference in
solubility of the components to be separated, without much
affecting the yield. The retrograde vaporization is the unex-
pected solubility behavior under high temperature and
pressure when the chemical compositions approach nearly
pure volatile component. At low pressure the solvent power
of CO2 decreases with rising temperature; whereas at high
pressures the solubility increases proportionally. The solu-
bility-temperature relationship comes about because den-
sity decreases dramatically with an increase in temperature
at low pressure; whereas at higher pressure, changes in
temperature have much less effect on density. Thus density,
not pressure, to a first approximation is proportional to the
solvent power of the SFE.13
The results from the experiments show that increas-
ing the pressure from 20.68 to 55.16 MPa at constant tem-
perature increases the extracted yield. This may be attrib-
uted to the increased density and solvating power due to
greater attractive forces between the supercritical fluid
(SF) and the solute molecules.14 At lower pressure and tem-
perature, supercritical fluid extraction (SFE) yields were
poor, as compared to the hexane extractions. This indicates
that the solvent strength of carbon dioxide at higher pres-
sure was sufficient to replace hexane as a solvent for ex-
traction. One advantage of SFE over solvent extraction is
the selective extraction and fractionation of desired com-
pounds made possible by altering the density.
Qualitative analysis of SC-CO2 extract of P. speciosa
by FTIR-PCA
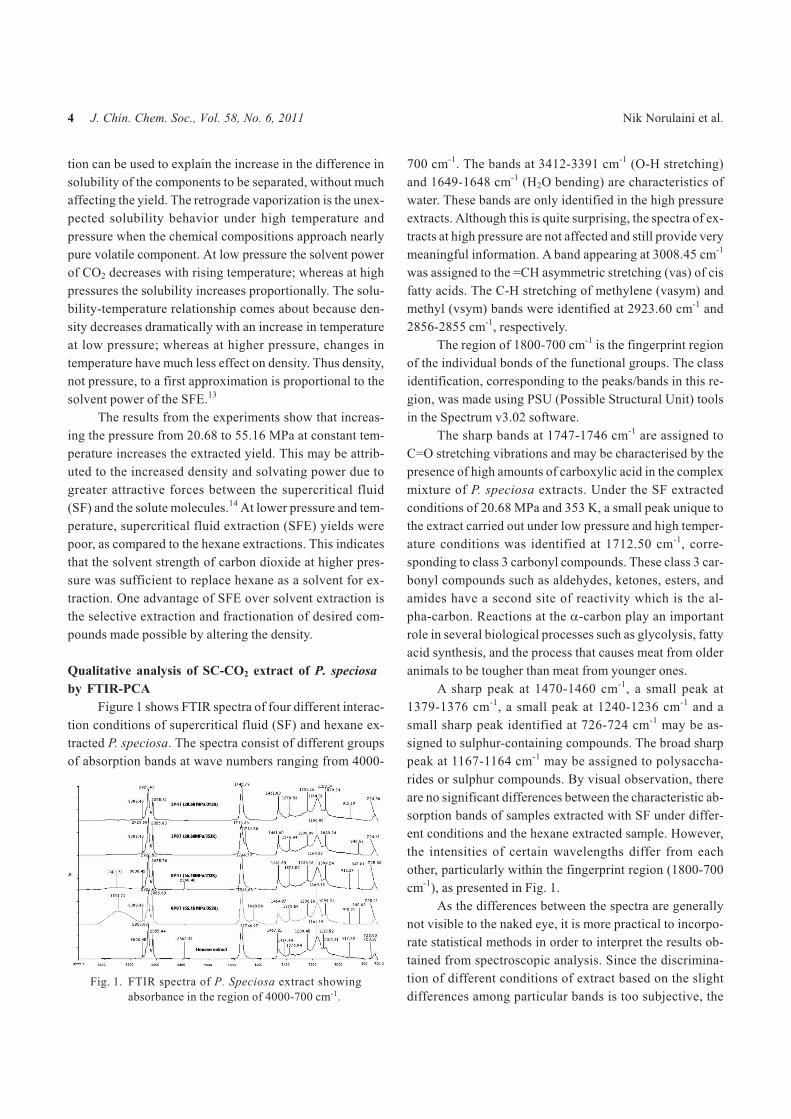
Figure 1 shows FTIR spectra of four different interac-
tion conditions of supercritical fluid (SF) and hexane ex-
tracted P. speciosa. The spectra consist of different groups
of absorption bands at wave numbers ranging from 4000-
700 cm-1. The bands at 3412-3391 cm-1 (O-H stretching)
and 1649-1648 cm-1 (H2O bending) are characteristics of
water. These bands are only identified in the high pressure
extracts. Although this is quite surprising, the spectra of ex-
tracts at high pressure are not affected and still provide very
meaningful information. A band appearing at 3008.45 cm-1
was assigned to the =CH asymmetric stretching (vas) of cis
fatty acids. The C-H stretching of methylene (vasym) and
methyl (vsym) bands were identified at 2923.60 cm-1 and
2856-2855 cm-1, respectively.
The region of 1800-700 cm-1 is the fingerprint region
of the individual bonds of the functional groups. The class
identification, corresponding to the peaks/bands in this re-
gion, was made using PSU (Possible Structural Unit) tools
in the Spectrum v3.02 software.
The sharp bands at 1747-1746 cm-1 are assigned to
C=O stretching vibrations and may be characterised by the
presence of high amounts of carboxylic acid in the complex
mixture of P. speciosa extracts. Under the SF extracted
conditions of 20.68 MPa and 353 K, a small peak unique to
the extract carried out under low pressure and high temper-
ature conditions was identified at 1712.50 cm-1, corre-
sponding to class 3 carbonyl compounds. These class 3 car-
bonyl compounds such as aldehydes, ketones, esters, and
amides have a second site of reactivity which is the al-
pha-carbon. Reactions at the �-carbon play an important
role in several biological processes such as glycolysis, fatty
acid synthesis, and the process that causes meat from older
animals to be tougher than meat from younger ones.
A sharp peak at 1470-1460 cm-1, a small peak at
1379-1376 cm-1, a small peak at 1240-1236 cm-1 and a
small sharp peak identified at 726-724 cm-1 may be as-
signed to sulphur-containing compounds. The broad sharp
peak at 1167-1164 cm-1 may be assigned to polysaccha-
rides or sulphur compounds. By visual observation, there
are no significant differences between the characteristic ab-
sorption bands of samples extracted with SF under differ-
ent conditions and the hexane extracted sample. However,
the intensities of certain wavelengths differ from each
other, particularly within the fingerprint region (1800-700
cm-1), as presented in Fig. 1.
As the differences between the spectra are generally
not visible to the naked eye, it is more practical to incorpo-
rate statistical methods in order to interpret the results ob-
tained from spectroscopic analysis. Since the discrimina-
tion of different conditions of extract based on the slight
differences among particular bands is too subjective, the
4 J. Chin. Chem. Soc., Vol. 58, No. 6, 2011 Nik Norulaini et al.
Fig. 1. FTIR spectra of P. Speciosa extract showing
absorbance in the region of 4000-700 cm-1.
results may vary between analysts.15 Hence, a more reliable
method for discrimination of samples, by incorporating
chemometric analysis in interpreting the resultant spectra,
was applied.
The principal component analysis (PCA) fulfils two
objectives; first, it transforms the data into a more relevant
co-ordinate system (which lies directly in the centre of the
data points), and second, it performs a dimensionality re-
duction (using only the first principal components, which
reflect the structure in the data).16
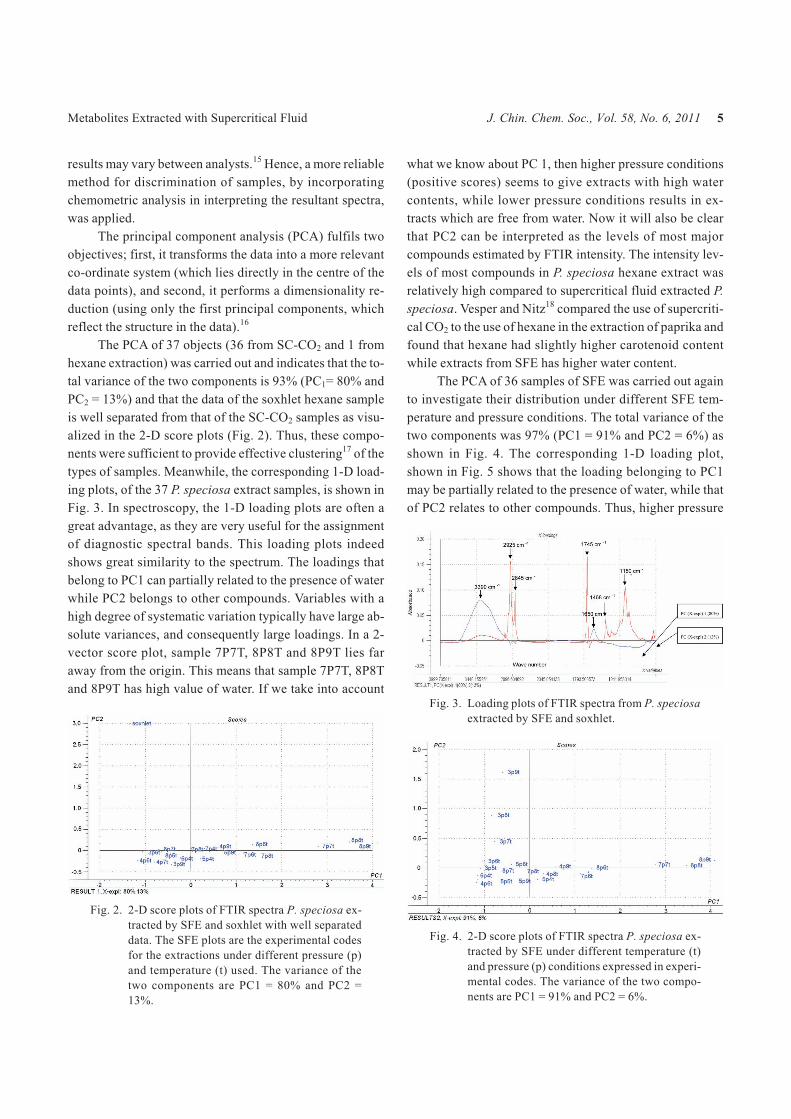
The PCA of 37 objects (36 from SC-CO2 and 1 from
hexane extraction) was carried out and indicates that the to-
tal variance of the two components is 93% (PC1= 80% and
PC2 = 13%) and that the data of the soxhlet hexane sample
is well separated from that of the SC-CO2 samples as visu-
alized in the 2-D score plots (Fig. 2). Thus, these compo-
nents were sufficient to provide effective clustering17 of the
types of samples. Meanwhile, the corresponding 1-D load-
ing plots, of the 37 P. speciosa extract samples, is shown in
Fig. 3. In spectroscopy, the 1-D loading plots are often a
great advantage, as they are very useful for the assignment
of diagnostic spectral bands. This loading plots indeed
shows great similarity to the spectrum. The loadings that
belong to PC1 can partially related to the presence of water
while PC2 belongs to other compounds. Variables with a
high degree of systematic variation typically have large ab-
solute variances, and consequently large loadings. In a 2-
vector score plot, sample 7P7T, 8P8T and 8P9T lies far
away from the origin. This means that sample 7P7T, 8P8T
and 8P9T has high value of water. If we take into account
what we know about PC 1, then higher pressure conditions
(positive scores) seems to give extracts with high water
contents, while lower pressure conditions results in ex-
tracts which are free from water. Now it will also be clear
that PC2 can be interpreted as the levels of most major
compounds estimated by FTIR intensity. The intensity lev-
els of most compounds in P. speciosa hexane extract was
relatively high compared to supercritical fluid extracted P.
speciosa. Vesper and Nitz18 compared the use of supercriti-
cal CO2 to the use of hexane in the extraction of paprika and
found that hexane had slightly higher carotenoid content
while extracts from SFE has higher water content.
The PCA of 36 samples of SFE was carried out again
to investigate their distribution under different SFE tem-
perature and pressure conditions. The total variance of the
two components was 97% (PC1 = 91% and PC2 = 6%) as
shown in Fig. 4. The corresponding 1-D loading plot,
shown in Fig. 5 shows that the loading belonging to PC1
may be partially related to the presence of water, while that
of PC2 relates to other compounds. Thus, higher pressure
Metabolites Extracted with Supercritical Fluid J. Chin. Chem. Soc., Vol. 58, No. 6, 2011 5
Fig. 2. 2-D score plots of FTIR spectra P. speciosa ex-
tracted by SFE and soxhlet with well separated
data. The SFE plots are the experimental codes
for the extractions under different pressure (p)
and temperature (t) used. The variance of the
two components are PC1 = 80% and PC2 =
13%.
Fig. 3. Loading plots of FTIR spectra from P. speciosa
extracted by SFE and soxhlet.
Fig. 4. 2-D score plots of FTIR spectra P. speciosa ex-
tracted by SFE under different temperature (t)
and pressure (p) conditions expressed in experi-
mental codes. The variance of the two compo-
nents are PC1 = 91% and PC2 = 6%.
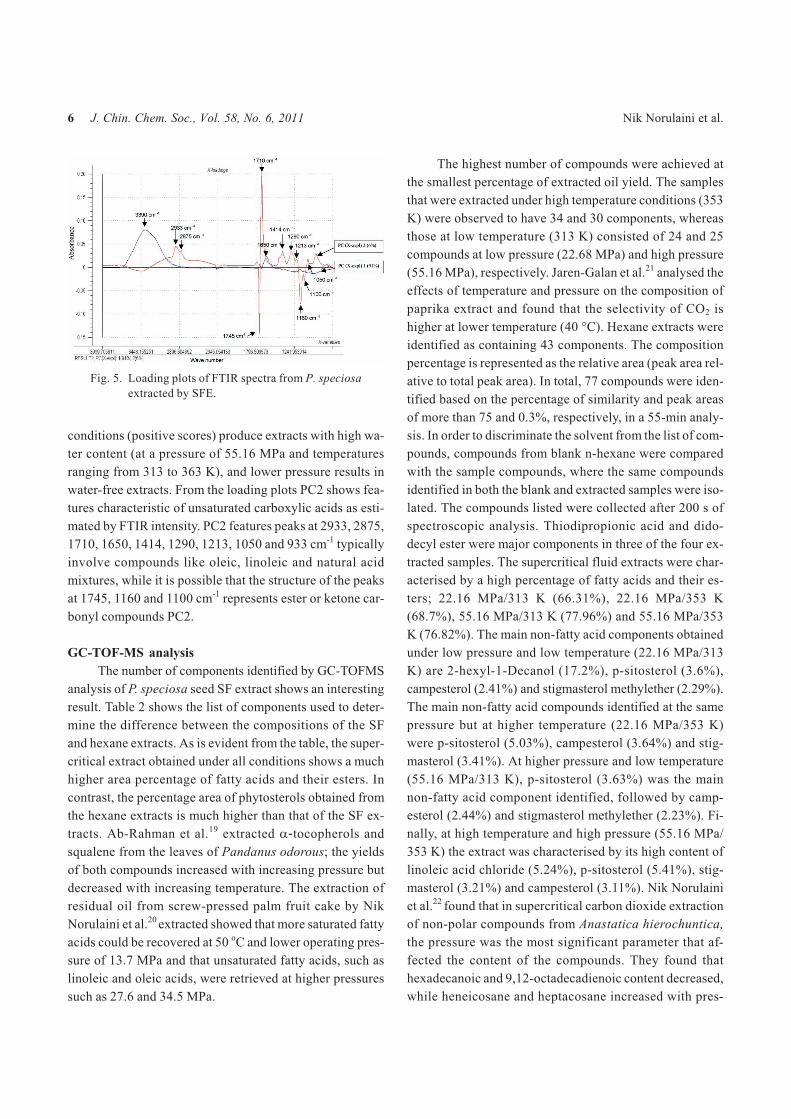
conditions (positive scores) produce extracts with high wa-
ter content (at a pressure of 55.16 MPa and temperatures
ranging from 313 to 363 K), and lower pressure results in
water-free extracts. From the loading plots PC2 shows fea-
tures characteristic of unsaturated carboxylic acids as esti-
mated by FTIR intensity. PC2 features peaks at 2933, 2875,
1710, 1650, 1414, 1290, 1213, 1050 and 933 cm-1 typically
involve compounds like oleic, linoleic and natural acid
mixtures, while it is possible that the structure of the peaks
at 1745, 1160 and 1100 cm-1 represents ester or ketone car-
bonyl compounds PC2.
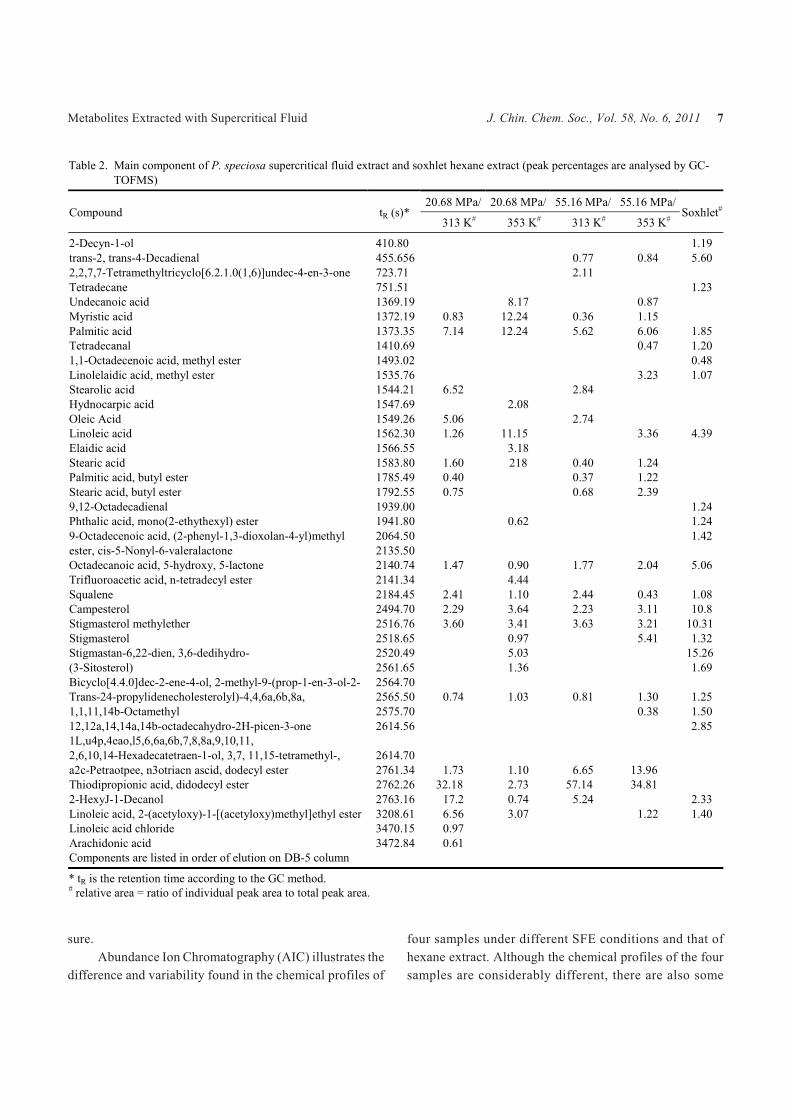
GC-TOF-MS analysis
The number of components identified by GC-TOFMS
analysis of P. speciosa seed SF extract shows an interesting
result. Table 2 shows the list of components used to deter-
mine the difference between the compositions of the SF
and hexane extracts. As is evident from the table, the super-
critical extract obtained under all conditions shows a much
higher area percentage of fatty acids and their esters. In
contrast, the percentage area of phytosterols obtained from
the hexane extracts is much higher than that of the SF ex-
tracts. Ab-Rahman et al.19 extracted �-tocopherols and
squalene from the leaves of Pandanus odorous; the yields
of both compounds increased with increasing pressure but
decreased with increasing temperature. The extraction of
residual oil from screw-pressed palm fruit cake by Nik
Norulaini et al.20 extracted showed that more saturated fatty
acids could be recovered at 50 oC and lower operating pres-
sure of 13.7 MPa and that unsaturated fatty acids, such as
linoleic and oleic acids, were retrieved at higher pressures
such as 27.6 and 34.5 MPa.
The highest number of compounds were achieved at
the smallest percentage of extracted oil yield. The samples
that were extracted under high temperature conditions (353
K) were observed to have 34 and 30 components, whereas
those at low temperature (313 K) consisted of 24 and 25
compounds at low pressure (22.68 MPa) and high pressure
(55.16 MPa), respectively. Jaren-Galan et al.21 analysed the
effects of temperature and pressure on the composition of
paprika extract and found that the selectivity of CO2 is
higher at lower temperature (40 °C). Hexane extracts were
identified as containing 43 components. The composition
percentage is represented as the relative area (peak area rel-
ative to total peak area). In total, 77 compounds were iden-
tified based on the percentage of similarity and peak areas
of more than 75 and 0.3%, respectively, in a 55-min analy-
sis. In order to discriminate the solvent from the list of com-
pounds, compounds from blank n-hexane were compared
with the sample compounds, where the same compounds
identified in both the blank and extracted samples were iso-
lated. The compounds listed were collected after 200 s of
spectroscopic analysis. Thiodipropionic acid and dido-
decyl ester were major components in three of the four ex-
tracted samples. The supercritical fluid extracts were char-
acterised by a high percentage of fatty acids and their es-
ters; 22.16 MPa/313 K (66.31%), 22.16 MPa/353 K
(68.7%), 55.16 MPa/313 K (77.96%) and 55.16 MPa/353
K (76.82%). The main non-fatty acid components obtained
under low pressure and low temperature (22.16 MPa/313
K) are 2-hexyl-1-Decanol (17.2%), p-sitosterol (3.6%),
campesterol (2.41%) and stigmasterol methylether (2.29%).
The main non-fatty acid compounds identified at the same
pressure but at higher temperature (22.16 MPa/353 K)
were p-sitosterol (5.03%), campesterol (3.64%) and stig-
masterol (3.41%). At higher pressure and low temperature
(55.16 MPa/313 K), p-sitosterol (3.63%) was the main
non-fatty acid component identified, followed by camp-
esterol (2.44%) and stigmasterol methylether (2.23%). Fi-
nally, at high temperature and high pressure (55.16 MPa/
353 K) the extract was characterised by its high content of
linoleic acid chloride (5.24%), p-sitosterol (5.41%), stig-
masterol (3.21%) and campesterol (3.11%). Nik Norulaini
et al.22 found that in supercritical carbon dioxide extraction
of non-polar compounds from Anastatica hierochuntica,
the pressure was the most significant parameter that af-
fected the content of the compounds. They found that
hexadecanoic and 9,12-octadecadienoic content decreased,
while heneicosane and heptacosane increased with pres-
6 J. Chin. Chem. Soc., Vol. 58, No. 6, 2011 Nik Norulaini et al.
Fig. 5. Loading plots of FTIR spectra from P. speciosa
extracted by SFE.
sure.
Abundance Ion Chromatography (AIC) illustrates the
difference and variability found in the chemical profiles of
four samples under different SFE conditions and that of
hexane extract. Although the chemical profiles of the four
samples are considerably different, there are also some
Metabolites Extracted with Supercritical Fluid J. Chin. Chem. Soc., Vol. 58, No. 6, 2011 7
Table 2. Main component of P. speciosa supercritical fluid extract and soxhlet hexane extract (peak percentages are analysed by GC-
TOFMS)
20.68 MPa/ 20.68 MPa/ 55.16 MPa/ 55.16 MPa/Compound tR (s)*
313 K# 353 K# 313 K# 353 K#Soxhlet#
2-Decyn-1-ol 410.80 1.19
trans-2, trans-4-Decadienal 455.656 0.77 0.84 5.60
2,2,7,7-Tetramethyltricyclo[6.2.1.0(1,6)]undec-4-en-3-one 723.71 2.11
Tetradecane 751.51 1.23
Undecanoic acid 1369.19 8.17 0.87
Myristic acid 1372.19 0.83 12.24 0.36 1.15
Palmitic acid 1373.35 7.14 12.24 5.62 6.06 1.85
Tetradecanal 1410.69 0.47 1.20
1,1-Octadecenoic acid, methyl ester 1493.02 0.48
Linolelaidic acid, methyl ester 1535.76 3.23 1.07
Stearolic acid 1544.21 6.52 2.84
Hydnocarpic acid 1547.69 2.08
Oleic Acid 1549.26 5.06 2.74
Linoleic acid 1562.30 1.26 11.15 3.36 4.39
Elaidic acid 1566.55 3.18
Stearic acid 1583.80 1.60 218 0.40 1.24
Palmitic acid, butyl ester 1785.49 0.40 0.37 1.22
Stearic acid, butyl ester 1792.55 0.75 0.68 2.39
9,12-Octadecadienal 1939.00 1.24
Phthalic acid, mono(2-ethythexyl) ester 1941.80 0.62 1.24
9-Octadecenoic acid, (2-phenyl-1,3-dioxolan-4-yl)methyl 2064.50 1.42
ester, cis-5-Nonyl-6-valeralactone 2135.50
Octadecanoic acid, 5-hydroxy, 5-lactone 2140.74 1.47 0.90 1.77 2.04 5.06
Trifluoroacetic acid, n-tetradecyl ester 2141.34 4.44
Squalene 2184.45 2.41 1.10 2.44 0.43 1.08
Campesterol 2494.70 2.29 3.64 2.23 3.11 10.8
Stigmasterol methylether 2516.76 3.60 3.41 3.63 3.21 10.31
Stigmasterol 2518.65 0.97 5.41 1.32
Stigmastan-6,22-dien, 3,6-dedihydro- 2520.49 5.03 15.26
(3-Sitosterol) 2561.65 1.36 1.69
Bicyclo[4.4.0]dec-2-ene-4-ol, 2-methyl-9-(prop-1-en-3-ol-2- 2564.70
Trans-24-propylidenecholesterolyl)-4,4,6a,6b,8a, 2565.50 0.74 1.03 0.81 1.30 1.25
1,1,11,14b-Octamethyl 2575.70 0.38 1.50
12,12a,14,14a,14b-octadecahydro-2H-picen-3-one
1L,u4p,4eao,l5,6,6a,6b,7,8,8a,9,10,11,
2614.56 2.85
2,6,10,14-Hexadecatetraen-1-ol, 3,7, 11,15-tetramethyl-, 2614.70
a2c-Petraotpee, n3otriacn ascid, dodecyl ester 2761.34 1.73 1.10 6.65 13.96
Thiodipropionic acid, didodecyl ester 2762.26 32.18 2.73 57.14 34.81
2-HexyJ-1-Decanol 2763.16 17.2 0.74 5.24 2.33
Linoleic acid, 2-(acetyloxy)-1-[(acetyloxy)methyl]ethyl ester 3208.61 6.56 3.07 1.22 1.40
Linoleic acid chloride 3470.15 0.97
Arachidonic acid 3472.84 0.61
Components are listed in order of elution on DB-5 column
* tR is the retention time according to the GC method.# relative area = ratio of individual peak area to total peak area.
common features in these samples. For example, thio-
dipropionic acid, didodecyl ester, �-sitosterol and camp-
esterol were the main chemical compounds found in all the
samples. Comparison of the composition of the SFE prod-
ucts with that of the hexane extracted oil reveals that higher
percentages of phytosterols, b-sitosterol (15.26%), stig-
masterol (10.31%) and campesterol (10.8%) were found in
the hexane extract oil. As for the fatty acid compositions of
the hexane extracts, the percentage is lower than the super-
critical fluid extracted fatty acids at only 16.61%. The veri-
fication of data obtained from the chemometrics analysis
by GC-TOFMS shows that at 20.68 MPa/353 K, the per-
centage area of unsaturated carboxylic acid (linoleic acid)
was very high (11.15%) as compared to the other condi-
tions. This verified the finding from chemometric analysis
that the contents of unsaturated carboxylic acid at lower
pressure and higher temperature were high.
CONCLUSIONS
The study of extraction from P. speciosa seeds shows
that the highest percentage of extracted yields (23.7%) was
obtained at 55.16 MPa and 363 K. Although the highest
percentage yield was obtained at the highest temperature,
the same high temperature but at the lowest pressure (20.68
MPa, 363 K), generated low yield at only 5.57%. These
phenomena may result from the competing effect between
the CO2 density and analyte volatility, also known as retro-
grade vaporisation behaviour. The extractability of the
analyte shows that the CO2 density effects predominate up
to a crossover pressure of 34.47 MPa. At pressures higher
than 34.47 MPa, the volatility effects predominate, result-
ing in an increase in extracted yield (20.5% to 23.7%), al-
though the CO2 density decreases with increasing tempera-
ture at constant pressure.
The FTIR-PCA analysis of the spectra of SC-CO2 ex-
tracts shows that the results obtained at low pressure (20.68
MPa) and higher temperature could be well discriminated
from other samples. From the analysis of loadings in PCA,
the samples could be distinguished by the higher contents
of unsaturated carboxylic acid in the low pressure samples.
The increase in temperature at constant low pressure re-
sulted in higher contents of unsaturated carboxylic acid.
Further analysis by GC-TOFMS verified these results. The
score plots of PCA from the 36 samples further discrimi-
nated the high pressure samples (48.26 MPa and 55.16
MPa) from the other samples. Loading analysis demon-
strated that these samples contain high moisture content, in
accordance to the water peak identified in the PC. Further-
more, the hexane extracted samples were almost free of wa-
ter.
ACKNOWLEDGEMENT
The research facilities and financial help from MOSTI
and Universiti Sains Malaysia (USM) are gratefully ac-
knowledged.
REFERENCES
1. Gmelin, R.; Susilo, R.; Fenwick, G. R. Phytochemistry 1981,
20, 2521-2523.
2. Suvachittanont, W.; Kurashima, Y.; Esumi H.; Tsuda, M.
Food Chem. 1996, 55, 359-363.
3. Fathaiya, J.; Suhaila, M. M.; Nordin, L. Food Chem.1994,
49, 339-345.
4. Harbone, J. B. Phytochemical Methods: A Guide to Modern
Techniques of Plant Analysis, 3rd ed.; Chapman & Hall: Lon-
don, 1998, pp 7-29.
5. Miller, J. N.; Miller, J. C. Statistics and Chemometrics for
Analytical Chemistry, 4th ed.; Prentice Hall: New York, 2000,
pp 217-220.
6. Sukri, H. Buletin Kualiti dan Teknikal 2005, 6(1), 65-69.
7. Razic, S.; Onjia, A.; Dogo, S.; Slavkovic, L.; Popovic, A.
Talanta 2005, 67, 233-239.
8. Goncalves, C.; Carvalho, J. J.; Azentha, M. A.; Alpendurada,
M. F. J. Chromatogr., A 2006, 1110, 6-14.
9. Vagi, E.; Simandi, B.; Suhada, A.; Hetheylyi, U. Food Res.
Intl. 2004, 38, 51-57.
10. Yang, K.; Hasenoehrl, E. J.; Griffiths, P. R. Vibra Spectra
1997, 14, 1-8.
11. Ibáñez, E.; López-Sebastián, S.; Ramos, E.; Tabera, J.;
Raglero, G. J. Agric. Food Chem. 1997, 45, 3940-3943.
12. Mike, J. A. Chemometrics in Analytical Spectroscopy, RSC
Analytical Spectroscopy Monograph; The Royal Society of
Chemistry: Thomas Graham House, Science Park, Cam-
bridge, 1995.
13. Espinosa, S.; Raeissi, S.; Brignole, E. A.; Peters, C. J. J.
Supercrit. Fluids 2004, 32, 63.
14. Taylor, L. T. Supercritical Fluid Extraction: Techniques in
Analytical Chemistry; John Wiley and Sons: New York,
1996; pp 1-11.
15. Wang, Z.; Sun, S. Q.; Li, X. B.; Zhou, Q.; Lin, L.; Du, D. G.
Spectros. Spec. Anal. 2001, 21(3), 311-313.
16. Esbensen, K. H. Multivariate Data Analysis–In Prantice, 5th
ed.; CAMO Process AS: Norway, 2002.
17. Otto, M. Pattern recognition and classification, Chemomet-
rics: Statistics and Computer Application in Analytical
Chemistry; Wiley-VCH: Weinheim, Germany, 1999; pp 128-
8 J. Chin. Chem. Soc., Vol. 58, No. 6, 2011 Nik Norulaini et al.

130.
18. Vesper, H.; Nitz, S. Adv. Food Sci. 1997, 19, 178-183.
19. Ab-Rahman, N. N.; Hassan, M. N.; Ab-Kadir; M. O. Natl.
Prod. Sci. 1999, 5, 75-79.
20. Nik Norulaini, N. A.; Anees, A.; Fatehah, M. O.; Banana, A.
A. S.; Zaidul, I. S. M.; Mohd Omar, A. K. Sep. Purif.
Technol. 2008, 60, 272-277.
21. Jaren-Galan, M.; Carmona-Ramon, C.; Minguez-Mosquera,
M. I. J. Agric. Food Chem. 1999, 47, 2671-2677.
22. Nik Norulaini, N. A.; Anuar, O.; Omar, A. K. M.; AlKarkhi,
A. F. M.; Sahena, F.; Zaidul, I. S. M. Food Bioprod. Process
2009, 87, 152-158.
Metabolites Extracted with Supercritical Fluid J. Chin. Chem. Soc., Vol. 58, No. 6, 2011 9
Related Documents