9 th National Convention on Statistics (NCS) EDSA Shangri-La Hotel October 4-5, 2004 Profile and Determinants of Poverty in the Philippines by Jose Ramon G. Albert and Paula Monina Collado For additional information, please contact: Author’s name: Jose Ramon G. Albert Paula Monina G. Collado Designation: Research Chief Deputy Administrator Agency: Statistical Research and Training Center Philippine National Statistics Office Address: Kalayaan Avenue, Quezon City Sta. Mesa, Manila E-mail: [email protected] [email protected]

Welcome message from author
This document is posted to help you gain knowledge. Please leave a comment to let me know what you think about it! Share it to your friends and learn new things together.
Transcript
9th National Convention on Statistics (NCS) EDSA Shangri-La Hotel
October 4-5, 2004
Profile and Determinants of Poverty in the Philippines by
Jose Ramon G. Albert and Paula Monina Collado
For additional information, please contact: Author’s name: Jose Ramon G. Albert Paula Monina G. Collado Designation: Research Chief
Deputy Administrator
Agency: Statistical Research and Training Center Philippine National Statistics Office Address: Kalayaan Avenue, Quezon City Sta. Mesa, Manila E-mail: [email protected] [email protected]

Profile and Determinants of Poverty in the Philippines
by Jose Ramon G. Albert♣ and Paula Monina Collado♦
ABSTRACT
With the growing interest in reorienting economic development plans and policies toward developing resources for reducing poverty, it is important to summarize information on poverty in the Philippines and identify characteristics of the poor. A poverty profile serves this purpose and also acts as a descriptive tool for giving clues to the underlying determinants of poverty, which include economic, demographic, social and cultural factors. Although poverty profiles are insightful they are also limited by their informational content in the bivariate analysis. Here, we also consider a multivariate analysis of the determinants of per capita income, the official measure of living standards in the Philippines. Using data from the 2000 Family Income and Expenditure Survey (FIES), conducted by the Philippine National Statistics Office (PNSO), we investigate with a regression model how a particular factor affects the poverty situation conditional on the level of other potential determinants of poverty in the Philippines. Then, we generate a simulation model for predicting reductions or increases in poverty statistics that result from unit changes in selected aggregate household or community characteristics. The results described here can help further guide government policy formulation, especially in relation to poverty reduction.
I. Introduction
Over the years, there has been considerable work on a descriptive analysis of poverty in the Philippines (Intal, 1994; Marquez and Virola, 1995). Such interest in poverty analysis has been further sharpened with the decision of a multitude of countries, including the Philippines, to sign the Millennium Declaration during the 2000 United Nations Summit and to work for achieving the Millennium Development Goals (MDGs). One of the eight MDGs is the eradication of extreme poverty and hunger, with two particular poverty reduction targets: (a) to halve, between 1990 and 2015, the proportion of people whose income is less than one dollar a day; (b) to halve, between 1990 and 2015, the proportion of people who suffer from hunger. A number of indicators have been developed for monitoring progress in meeting the MDGs. This work complements the task of closely monitoring the economic and social situation in the country in order to analyze the impact, effectiveness, and efficiency of poverty-oriented policies, programs, and projects.
The formulation of poverty reduction policies, programs and projects ought to consider the available poverty data. Major facts on poverty sourced from the Family Income and Expenditure Survey (FIES), a household survey conducted by the Philippine National Statistics Office (PNSO) every three years, need to be
♣ Research Chief, Statistical Research & Training Center; President, Philippine Statistical Association; email: [email protected] ♦ Deputy Administrator, Philippine National Statistics Office; email: [email protected]
described through tables and charts to show how poverty varies across sub-groups of society. This is known as a poverty profile. Although a poverty profile can be extremely informative and useful in assessing how patterns of economic change are likely to affect aggregate poverty, it is limited by its bivariate content. It is also important to perform a multivariate analysis of the determinants of per capita income, the official measure of living standards in the Philippines. This allows us to infer causality of specific household characteristics on household welfare and to perform a simulation on the extent at which poverty may be reduced by making changes in some poverty determinants conditional on the level of other potential determinants of poverty. A poverty profile, however, is an appropriate starting point for analyzing the determinants of poverty. In the next section, we briefly discuss the official poverty measurement system in the Philippines. Subsequently, we develop a poverty profile and a regression model of per capita income based on household characteristics.
II. Official Poverty Measurement
There are essentially three steps to a poverty measurement system, viz., (a) choosing a welfare indicator, (b) establishing a poverty line, i.e., a minimum acceptable standard of the welfare indicator that separates the poor from the non-poor, and (c) aggregating poverty data (Ravallion, 1992; Deaton, 1997). In the Philippines, the National Statistical Coordination Board (NSCB) is in charge of releasing the official poverty statistics that are based on (per capita) income data sourced from the FIES. The FIES is a household survey conducted by the PNSO every three years currently having regions for its domains. Alternatives to the official methodology, which is currently under review by a Technical Committee on Poverty Statistics, have been espoused, e.g., Balisacan (1999) and Kakwani (2000), that employ consumption data rather than income data.
Official poverty measurement actually started in 1985, but the
measurement system has undergone a number of changes since then. The latest changes in the official methodology involve the generation of poverty lines for urban/rural areas of each province based on estimating per capita minimal food and non-food requirements in order to meet data users’ demands for more disaggregated statistics. Poverty lines were previously generated only up to the urban/rural areas of each region. The Food and Nutrition Research Institute (FNRI) constructs representative food menus for urban and rural areas of each region; these menus consider local consumption patterns and satisfying a minimum nutritional requirement of 2000 calories of energy and 50 grams of protein per person per day, as well as 80 percent sufficiency in daily intake of other nutrients and vitamins. Provincial urban/rural prices are then used to cost the menus, resulting in the food poverty thresholds at urban/rural areas of each province. These food poverty thresholds may be thought of as the minimum level of income needed to meet only food requirements. Since a person also has nonfood requirements in addition to food requirements, the expenditure patterns of households within a plus or minus 10 percentile band of the food poverty thresholds are used to estimate indirectly nonfood per capita requirements, which, are added to the food thresholds to yield the poverty thresholds .The official food poverty thresholds and poverty thresholds in 2000 for urban/rural

areas of each province are given in Table 1.
Using the official poverty thresholds, we may then tag households as poor if their per capita income is less than the poverty threshold. Poverty is measured at the household level since this is the ultimate sampling unit of the FIES. Data does not allow intra-household analysis, so that in consequence, if a household is poor, then all its members are considered poor, and if a household is non-poor, then all its members are non-poor. Note that the food poverty thresholds are also called “subsistence thresholds” since they can also be viewed as another form of poverty line that separates the “food-poor” households, i.e. those that earn less than what is required for subsistence on food alone, from the non-food-poor.
III. Poverty Profile
Various poverty measures can be calculated to aggregate and summarize information on poverty. The most common measure of poverty is the Head-count Index, which gives the proportion of the population with a standard of living below the poverty line. The head-count index (also called the poverty incidence or poverty rate among persons), however, does not indicate how poor the poor are. The Poverty Gap Index, which is the average over all people, of the gaps between poor people’s income and the poverty line, expressed as a ratio to the poverty line, shows the average depth of poverty. However this is not sensitive to the distribution of living standards among the poor. To make the poverty gap index more sensitive to the distribution of income among the poor, the poverty gaps of the poorest people can be given a bigger weight when calculating the index. One such weighted average (that uses the relative gaps as the weights) is the Poverty Severity Index; the higher the value of this index, the more unequal is the distribution of income among the poor. The poverty incidence, the poverty gap index, and the poverty severity index are all members of the Foster, Greer and Thorbecke (FGT) family of measures (1984):
1
1 qj
j
gP
n z
α
α=
=
∑ (1)
Note that in (1), n stands for the total population size; z for the poverty line; gj for the poverty gap pertaining to individual j; and q for the number of poor persons. The poverty gap is zero for a non-poor person while for a poor person, it is the difference z-xj, where xj is the per capita income for the jth person. In the FGT index, when the parameter α is set to zero, we have the head-count index P0; when α is equal to one, we have the poverty gap index P1, and when α is set equal to two, we have the poverty severity index P2.
Using the poverty thresholds in 2000 (found in Table 1), we find that
slightly over one-fourth (27.96 percent) of families in the Philippines have per capita incomes below that of the poverty line. The poverty rate among persons or headcount is estimated at 33.5%. The percentage of poor households is less than the proportion of poor persons since poor households usually have larger family sizes. Since these poverty calculations are based on a sample of households (which are designed to only represent all households), they can

never be exact as information covering everyone in the country, so that consequently, poverty statistics carry a margin of error. For instance, we are 95% confident that the actual percentage of poor persons can be as high as 32.6% or as low as 34.3%.
The FGT indices can be obtained for any subpopulation to get insights on
how poverty varies across subpopulations, and thus provide a poverty profile. One interesting geographical breakdown of poverty is between aggregate urban and rural areas (cf. Table 2). We readily observe that poverty in the Philippines is largely a rural phenomenon. The poverty rate in rural areas is almost three times higher than it is in urban areas. Nearly half of all persons living in rural areas are poor (as compared with a poverty rate of nearly one in five persons in urban areas). About half of all Filipinos are living in rural areas, and the other half are living in urban areas, so that, in consequence more than seven out of ten poor Filipinos are living in rural areas. The overwhelming numerical importance of the rural poor means that poverty programs must be concentrated in improving the plight of people’s living standards in rural areas, and that we ought to promote policies on rural development, which include support for rural entrepreneurial activities and rural cooperatives, as well as enabling the improvement of farmers’ access to markets through infrastructure development and the creation of farmers’ markets in the cities (to ensure that less middle men reap the fruits of farmers’ labors). The major point from the poverty data is that rural development is a major key in poverty reduction, and there is empirical evidence to suggest from neighbors, e.g., Malaysia and Indonesia, that have poured resources into rural development. The degree of rural disadvantage appears even greater if the depth and severity of poverty are considered with the poverty risk levels at 1.51 and 1.54 for rural areas from the poverty gap and severity indices, respectively as compared with the risk level for rural areas from poverty incidence at 1.44.
The national poverty gap index stands at 10.4%. Combining the head-count and poverty gap indices gives the average per capita income level of the poor, 8062, which is just over two-thirds of the value of the national poverty line (11,605). Also, with knowledge of who are poor and who are not, it is necessary to transfer almost 91.6 Billion pesos in 2000 to poor persons to raise the value of their per capita income to the level of the poverty line.
Following Morduch (1998), we can simulate how long it would take on
average for the poor to exit poverty. If z is the poverty line and if the per capita income of a poor person, yj grows at a constant positive rate g per year, the number of years it will take them to reach the poverty line is:
ln( )jgj
z yt
g=
The average exit time of the poor is simply gjt averaged over poor persons. In our
case, however, since there is considerable price variation, we ought to obtain a spatial price index (set for all the urban and rural areas in all the provinces based on the poverty lines and the national poverty line of P 11,605) and apply this to the nominal per capita income estimates for each household, so as to convert them into national average prices. Figure 1 shows the average time to exit poverty among the poor. For a potential growth rate of real income per capita of
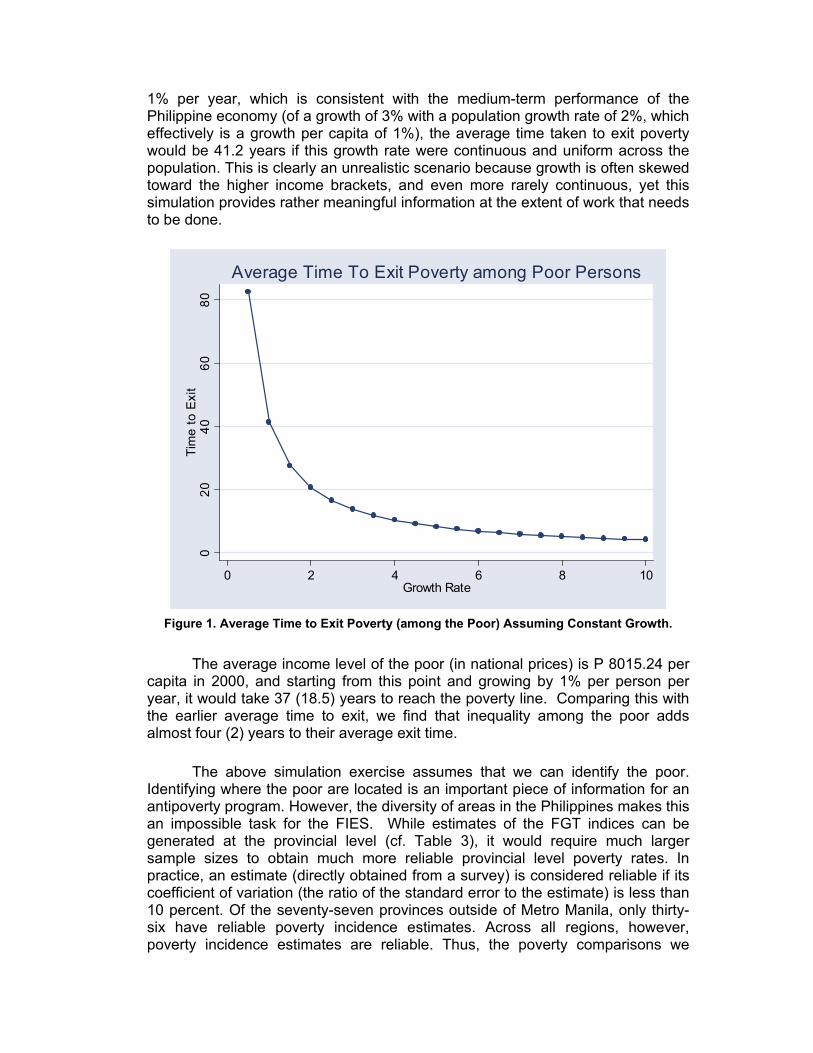
1% per year, which is consistent with the medium-term performance of the Philippine economy (of a growth of 3% with a population growth rate of 2%, which effectively is a growth per capita of 1%), the average time taken to exit poverty would be 41.2 years if this growth rate were continuous and uniform across the population. This is clearly an unrealistic scenario because growth is often skewed toward the higher income brackets, and even more rarely continuous, yet this simulation provides rather meaningful information at the extent of work that needs to be done.
020
4060
80Ti
me
to E
xit
0 2 4 6 8 10Growth Rate
Average Time To Exit Poverty among Poor Persons
Figure 1. Average Time to Exit Poverty (among the Poor) Assuming Constant Growth.
The average income level of the poor (in national prices) is P 8015.24 per
capita in 2000, and starting from this point and growing by 1% per person per year, it would take 37 (18.5) years to reach the poverty line. Comparing this with the earlier average time to exit, we find that inequality among the poor adds almost four (2) years to their average exit time.
The above simulation exercise assumes that we can identify the poor. Identifying where the poor are located is an important piece of information for an antipoverty program. However, the diversity of areas in the Philippines makes this an impossible task for the FIES. While estimates of the FGT indices can be generated at the provincial level (cf. Table 3), it would require much larger sample sizes to obtain much more reliable provincial level poverty rates. In practice, an estimate (directly obtained from a survey) is considered reliable if its coefficient of variation (the ratio of the standard error to the estimate) is less than 10 percent. Of the seventy-seven provinces outside of Metro Manila, only thirty-six have reliable poverty incidence estimates. Across all regions, however, poverty incidence estimates are reliable. Thus, the poverty comparisons we
discuss among geographic areas are only across the regions. While policy-makers prefer to have estimates at the provincial level, it must be pointed out that many of these estimates are not sufficiently reliable. Alternative estimates of poverty rates at the provincial level may, however, be derived that combine results from surveys and other data sources with the aid of small area estimation techniques. (See, e.g., Lahiri, 2003, and Albacea, 2003).
The region with the lowest poverty rate is the National Capital Region,
where 7.6 percent of the population have per capita income below the poverty line. Even with allowance for the sampling errors, it can be confidently concluded that the NCR poverty rate is much lower than in the rest of the regions in the country (t=38.9). The region with the highest poverty rate is the ARMM, where 65.2 percent of the population is classified as poor. Bicol and most regions in the Visayas and Mindanao viz. Central Mindanao, CARAGA, Western Visayas, Eastern Visayas, Western Mindanao have poverty rates considerably higher than the national average. Other regions, such as Northern Mindanao, CAR, Central Visayas, Southern Mindanao, Ilocos (are slightly above the national average rate, while four regions in Luzon, viz., Cagayan Valley, Central Luzon, Southern Tagalog and NCR have poverty rates below the national average ranging from 29.7% to 7.6% .
Regardless of what FGT index we use, we still find that NCR has the lowest regional poverty statistics and ARMM has the highest poverty measures. Although the rankings for the regions are not uniform across the poverty indices, nonparametric correlation coefficients of the regional ranks of the three poverty FGT indices are rather high (cf. Table 4). In consequence, we have a consistent picture of poverty across the regions. Note that ARMM and Bicol are the hotbeds of insurgencies and terrorism.
If a population can be decomposed into mutually exclusive and exhaustive sub-groups 1, 2, …, m with respective population sizes Nj for j =1, 2, …, m, then any FGT poverty index P� can also be decomposed into:
1
1 m
j jj
P N PNα α
=
= ∑ (2)
where jPα is the poverty measure for the sub-group, and the total population N is
equal to the sum1
m
jjN
=∑ . The poverty “share” or contribution of sub-group j to the
poverty index of the population is100 /aj aP P .
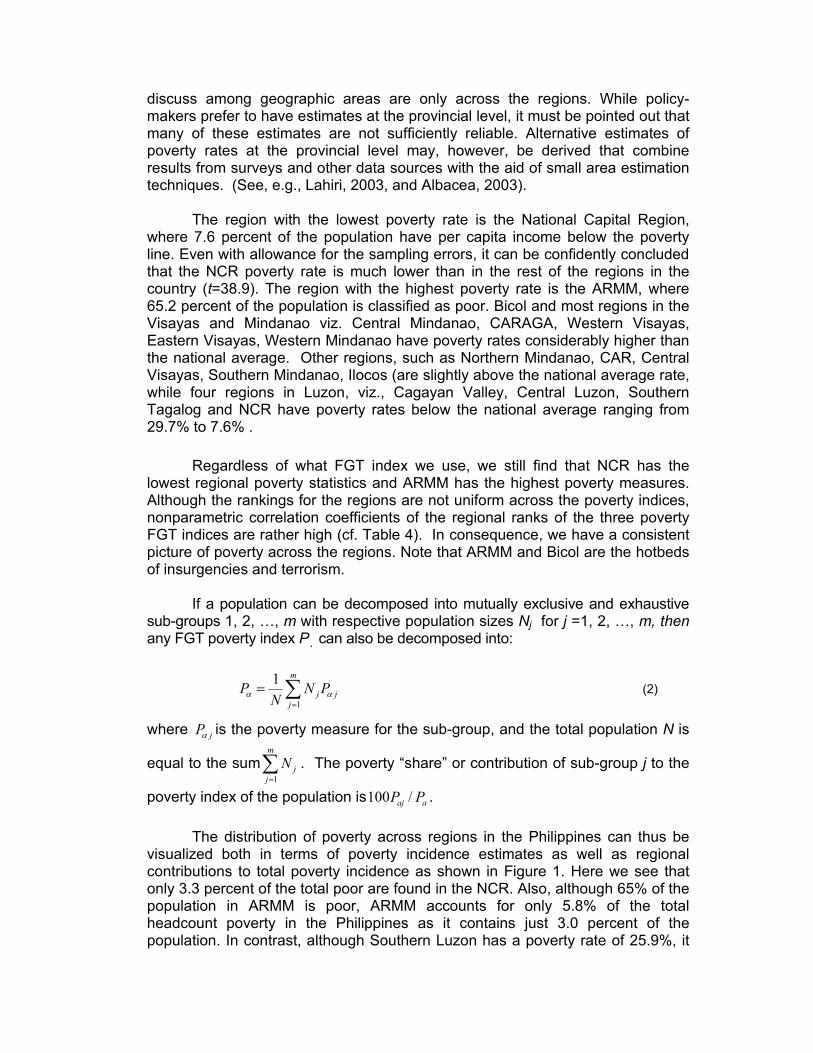
The distribution of poverty across regions in the Philippines can thus be visualized both in terms of poverty incidence estimates as well as regional contributions to total poverty incidence as shown in Figure 1. Here we see that only 3.3 percent of the total poor are found in the NCR. Also, although 65% of the population in ARMM is poor, ARMM accounts for only 5.8% of the total headcount poverty in the Philippines as it contains just 3.0 percent of the population. In contrast, although Southern Luzon has a poverty rate of 25.9%, it
has 14.7% of the entire population, and thus has 11.4 percent of the total poor in the country (the largest share among the regions).
0 .2 .4 .6 .8
Western Visayas Western Mindanao
Southern MindanaoSouthern Luzon
Northern Mindanao NCR
Ilocos Region Eastern Visayas Central Visayas
Central Mindanao Central Luzon
Cagayan Valley CARAGA
CARBicol Region
ARMM
Headcount Contribution to Total Poverty
Figure 2. Regional Poverty Headcount and Shares to Total Poverty Headcount.
In some regions where poverty indices are rather low, e.g., Southern Tagalog, contributions to total poverty are high as the magnitude of poor is high; the poverty rate is low here since the total population is also high. While policy makers ought to be guided by poverty rates, it is clearly oversimplistic to merely develop poverty policies on the basis of poverty incidence estimates alone. The contributions to total poverty must also be considered in resource allocation. Here, more poverty data must be looked into.
Comparisons among households of various subpopulations, as in Table 5,
can also be made to identify characteristics of households that can potentially be used for targeting antipoverty interventions. For instance, we see that single nuclear families tend to be poorer than extended families, and families with two or more non-related family members. Among families classified by marital status of the household head, those headed by married individuals tend to be the poorest. Large families are also more likely to be poor (than small families) especially if most of the members of the family are not of working age. For years, government has tried to work on population management, but it appears that vigorous and aggressive efforts must instead be geared toward population control, discouraging families into having large family sizes. Family sizes themselves are not the problem, but the inability to empower such families into maximizing their human resource potential given their limited financial capacities to provide quality education to children, that, in turn, will help them obtain long term income-earning opportunities.
The relationship between poverty and education is quite evident from
Table 5. The poverty profile shows that people living in households where either the head has never been to school or at most reached grade school, are very likely to be poor. The poverty rate falls further the more schooling a household head gets. This is to be expected as better educated household heads usually have better paying occupations, and thus are less likely to be poor. Thus, efforts must be made toward making human capital investments, helping persons become more educated and/or trained. The private sector could be tapped to partner with government in helping people get more adequate and quality education and training.
Households where the head gets income mainly from agriculture have the highest poverty rate, at nearly 50 percent. In terms of the contribution to total household poverty, almost two-thirds (61 percent) of the poor households have heads engaged mainly in agriculture. Raising the living standards of the rural poor, in a period of rapid population growth, will be possible only if the agricultural modernization and intensification that is underway continues, and even accelerates. With the big discrepancy between farmgate prices and market prices of agricultural commodities, it is clear that farmers do not get the fruits of their labor, thus policies must be directed to improve their welfare status. Investments must be made in farm-to-market roads, in supporting and strengthening agricultural cooperatives, and in developing farmers’ markets in the cities, as is done in other neighboring countries.
Nearly one in ten poor households have heads who are unemployed, and
nearly six in ten poor households have heads who are self-employed. Thus policies that work via the formal employment sector alone may not be very good instruments for reaching poor households.
To look into the disparity among households across different levels of
welfare, we consider further classifying poor households into the severely poor (households with per capita incomes than 60% of the threshold) and not severely poor, and also classifying the non-poor households into the nearly poor (non poor households with per capita incomes less than 120% of the threshold) and the not nearly poor. In Table 6, we see that as the per capita income of households increases, the share of food expenses to total expenses decreases. A similar observation can be noted for the shares of cereals and tobacco to total expenditures. However, we can also observe that the difference between the not severely poor and the nearly poor is not as severe, as that between the nearly poor and the not nearly poor.
In the case of tobacco expenses, the share among the two kinds of poor and the nearly poor is practically the same. Government may, as a matter of policy, want to seriously increase sin taxes to make tobacco and alcohol less affordable especially to low income households in order to protect them against serious long term risks to health. The share of fuel expenses appears uniform across the groups, but for clothing, education, recreation, medical care, and transportation and communication, the shares to total expenditures increase as the household welfare improves.
Table 7 illustrates that the poor appear to be disadvantaged in their access
to basic needs, including housing conditions, safe sources of water supply, sanitation and electricity. Reliance on unprotected water sources is high among all classes, even among the not nearly poor (60.5 percent), although among the ultra poor, the rate is as high as 97%. Only a third of the ultra poor households have access to sanitary toilets and instead rely overwhelmingly on pit toilets In contrast, nearly 9 in 10 of the not nearly poor have access to sanitary toilets. We can also observe that the pattern of usage of electricity is related to the poverty classification above with a similar outline as that of access to sanitary toilets. About one third of the poor families have electricity in their homes, compared with over 90 percent of the population in the richest group.
Ownership of durables is likewise related to the poverty classification,
although even the poor have some access to durable items, such as radios. Since over half of the not nearly poor have refrigerators, and only one in forty ultra poor families have refrigerators, ownership of refrigerators appears to be a good proxy for per capita income. Ownership of information and communications technology devises is quite limited across households, with only a quarter of the not nearly poor families having a telephone/cell phone. IV. Poverty Determinants
While the previous section provided a good description of the poverty situation in the Philippines, it only shows how poverty levels vary one characteristic at a time. We consider now performing a multivariate analysis of the determinants of poverty in the Philippines based on a regression model of the natural logarithm of per capita income (relative to the poverty line) of each household. As in the previous section, the basic data source for the regression model is the 2000 FIES. can be specified as follows:
ln( / )i i i iy z X β ε= + j
where iy is the value of nominal per capita income of household i ; iz is the poverty line in the area where household i resides; iX is a vector of values pertaining to a set of exogenous variables associated with household i and iε is the regression model noise.
1. Variables The set of regressors that we chose as possible determinants of poverty in
the Philippines may be categorized as follows:
Demographic These household composition variables include: • total number of household members • with age less than 1 year old • with age 1 - 6 years old • with age 7 - 14 years old
• with age 15 - 24 years old • with age 25 years old and over • squared value of family size variable (averaged over the two visits to
the household) to capture non-linear relationships between family size and welfare, i.e., the marginal effect on household welfare of one more person or one less person in the household may not necessarily be linear, but dependent on existing family size.
• total numbers of non-relatives • age of the household head • sex of the household head • marital status of the household head
Education
The only education information available is the highest education level attained by household head; This is a categorical variable where the categories are:
0 - No Grade Completed 1 - Elementary Undergraduate 2 - Elementary Graduate
3 - High School Undergraduate 4 - High School Graduate 5 - College Undergraduate 6 - College Grad and Beyond
Housing Characteristics
We include: • the type of building/house • a dummy variable for whether the roof is made of makeshift materials • a dummy variable for whether the walls are made of makeshift
materials • tenure status
Employment, Occupation and other Economic Characteristics
In this category, we intend to capture the effects of a number of economic variables, including:
• total number of family members employed with pay • a dummy variable for whether the head works in agriculture • a dummy variable for whether the head is self employed • a dummy variable for whether the household received cash receipts,
support from abroad • a dummy variable for whether the household received cash receipts,
support from domestic sources • a dummy variable for whether the household head has a job or
business
Access to services and utilities We consider a number of variables, including: • a dummy variable for whether the toilet is sanitary • a dummy variable for whether the household has electricity • a dummy variable for whether the household has safe water

• Distance of Water Source from the House
2 Regression Results
Table 8 presents the parameter estimates of the regression model for the determinants of poverty throughout the Philippines (with 60.2% of total variability explained by the model) as well as separate regressions for NCR, Luzon without NCR, Visayas and Mindanao. Note that because the dependent variable is in natural log form, the estimated regression coefficients measure the percentage change in per capita income (in relation to the poverty line) within the household from a unit change in the independent variable. To address multicollinearity issues, three variables, viz., the squared value of family size variable, a dummy variable for whether the household head has a job or business, and a dummy variable for whether the head works in agriculture, were excluded from the analysis.
As far as the number of household members per age category, the impact on household welfare follows expectations in that the coefficients are more negative for children than for adults in all four areas (and across the country). The broad trends in the percentage reduction in the per capita income of a household (in proportion to the poverty line) with the addition of an individual in the specific age is as follows:
• The marginal effect on household welfare due to the addition of a child aged 1
year and under is negative, with NCR seeing the largest reduction. Here the addition of a child will reduce per capita income (as a ratio of the poverty line) by approximately 16 percent, compared to about 12 percent outside NCR
• The marginal effect on household welfare due to the addition of a child aged
between 1 year and 6 years is negative, with NCR seeing also the largest reduction. Here the addition of a child will reduce per capita income (as a ratio of the poverty line) by approximately 20 percent, compared to about 18 percent in Luzon outside NCR, and 17% in both Visayas and Mindanao
With every addition of a household member in the employment line, per capita income (as a ratio of the poverty line) is found to increase by 32% in NCR as against 26% in areas outside NCR, suggesting higher economic opportunities in highly urbanized areas such as NCR. In fact, the indicator for self employment of the household head is statistically insignificant only for NCR, whereas outside NCR, it is a strongly significant predictor of household welfare (with a negative marginal effect), all other things being equal.
Across the country, we can approximate the differential between urban and rural areas at 7%. Consequently, poverty programs must really be directed toward rural development. The disparity in urban and rural areas can also be seen in differences between the Northern Island of Luzon (which contains NCR) and the rest of the country. In particular, unlike in Visayas and Mindanao, the variable representing distance between the house and water source is not statistically significant in Luzon. Thus improving accessibility to water source

leads to improvements in household welfare only in Visayas and Mindanao.
Poverty status is clearly very much related to housing characteristics, including whether roofs or walls are made of makeshift materials, housing tenure as well as inaccessibility to sanitary toilets, safe water, and electricity. In the latter case, the marginal effect of access to electricity is much larger in NCR than outside NCR, suggesting that potential welfare benefits of electric power are not assured outside NCR.
As far as the household head characteristics, the marginal effect of a male-headed household is negative at -9 percent and strong statistically significant throughout the country, and across all the areas with a slightly more negative marginal effect in NCR. Households headed by younger individuals, holding other variables constant, will tend to be poorer than those headed by older persons. Also, households headed by non-single persons ceteris paribus tend to be poorer than those headed by single individuals.
As expected, the coefficients for the variable for highest grade completed
by the head of the household is consistently positive and significant in all areas: Attainment of higher levels of education for the household head will provide higher levels of household welfare. Thus, it is important to have continuing education programs, including trainings that will increase capacities for persons to have better chances of obtaining higher paying jobs that will lessen their vulnerabilities to shocks. (Tabunda and Albert, 2002).
V. Conclusion
This paper provides another dimension in understanding the determinants of poverty in the Philippines by analyzing data obtained from the 2000 FIES through a bivariate poverty profile as well as multiple regression analysis of the official welfare measure. We should, however, use the results of the regression models as indicative of broad patterns and trends, rather than for the exact numbers resulting from the regression. Future analyses could involve refinements to include more supplementary information. Among possible researches are the generation of small area estimates of poverty and results arising from geo-referencing household welfare information with a Geographic Information System. This might include results of the FIES, the Census of Population and Housing, the Census of Agriculture and Fisheries, administrative records, and information gathered in other household surveys.
Although the poverty profile and the regression model generated here give some idea of key directions for a poverty reduction strategy, the role of equitable economic growth in poverty reduction (given the many inequalities in the country) must also be considered. The analysis here is certainly not of sufficient complexity to allow a comprehensive poverty reduction strategy for the Philippines to be devised entirely from the results of this paper. Nevertheless, it does provide policy planners with objective measures on the impacts of potential poverty reduction programs that might be realized from several key sectoral poverty reduction strategies. Policy planners should view these results as a guide to allocate resources for poverty reduction in a more informed evidenced-based

manner. These results do allow for an objective technical assessment that may be considered in debates which typically guide and dominate government policy formulation and program implementation in poverty reduction. References Albacea, Zita (2003). Targetting the Poor in the Philippines. Research Project
under the ADB Technical Assistance 3566: Improving Poverty Monitoring Surveys Implemented by the National Statistics Office. Manila, National Statistics Office and Asian Development Bank.
Balisacan, A. (1999). Poverty Profile in the Philippines: An Update and Reexamination in the Wake of the Asian Crisis. Quezon City: University of the Philippines.
Deaton, Angus (1997). The Analysis of Household Surveys: A Microeconometric Approach to Development Policy, Published for the World Bank by The John Hopkins University Press.
Foster, J.E., Greer, J., and Thorbecke, E., (1984). "A class of decomposable poverty indices", Econometrica, 52, 761-766.
Intal, P.S. (1994) The State of Poverty in the Philippines: An Overview. In Understanding Poverty and Inequity in the Philippines. (ed. P. S. Intal, Jr. and M. C. S. Bantilan). Pasig: National Economic and Development Authority.
Kakwani, N. (2000). Poverty and Well-being in the Philippines with a Focus on Mindanao. Asian Development Bank Technical Report.
Lahiri, P. (2003). A Review of Empirical Best Linear Unbiased Prediction For the Fay-Herriot Small-Area Model. The Philippine Statistician, 51(1-2). Philippine Statistical Association, Quezon City.
Marquez, N. R. and Virola, R. A. (1995). Monitoring Changes in the Characteristics of the Philippine Poor: 1985 to 1994. Proc. of the Sixth National Convention on Statistics.
Morduch, J. (1998). Poverty, Economic growth and average exit time. Economics Letters, 59 (3), 385-390.
Ravallion, M. (1992). Poverty Comparisons: A Guide to Concepts and Methods. LMSS Working Paper 88. World Bank: Washington, D.C.
Tabunda, A.M.L. and Albert, J. R. G. (2002). Philippine Poverty in the Wake of the Asian Financial Crisis and El Niño. In Impact of the East Asian Financial Crisis: Revisited. (ed. S, Khandker) Makati: World Bank Institute and the Philippine Institute for Development Studies.

Table 1. Food Poverty and Poverty Thresholds, by Provincial Urban/Rural Areas. Food Thresholds Poverty ThresholdsRegion
Province
Urban Rural Urban Rural Ilocos Norte 8,443 9,023 12,155 13,285Ilocos Sur 8,221 9,024 12,096 13,593La Union 8,189 8,893 12,647 13,181
I- Ilocos
Pangasinan 8,471 8,450 12,617 12,421Batanes 10,116 8,029 14,800 12,043II- Cagayan
Cagayan 7,964 7,916 11,760 11,034 Isabela 8,427 7,551 14,222 10,930 Nueva Vizcaya 8,086 7,581 13,119 10,566 Quirino 7,756 7,208 11,662 10,517
Bataan 8,553 7,886 13,209 11,412Bulacan 8,760 8,471 14,089 12,443NuevaEcija 10,192 8,909 16,576 14,137Pampanga 9,804 8,618 15,187 13,560Tarlac 9,130 8,340 13,809 12,281
III- Central Luzon
Zambales 9,167 8,342 13,972 12,109Batangas 9,190 9,598 15,298 15,309Cavite 9,144 9,949 14,142 15,861Laguna 8,914 8,973 13,571 12,800Marinduque 8,675 8,512 12,204 12,108OccidentalMindoro 8,032 8,094 11,653 12,537OrientalMindoro 9,124 9,008 14,916 14,468Palawan 8,523 7,835 12,918 11,214Quezon 8,495 8,676 13,434 12,595Rizal 9,318 9,587 14,817 14,702Romblon 8,446 8,109 12,512 10,823
IV- Southern Tagalog
Aurora 8,326 8,288 11,776 11,246Albay 9,508 7,741 14,970 11,115Camarines Norte 9,006 7,626 13,785 10,817Camarines Sur 9,168 7,862 13,529 10,792Catanduanes 9,211 7,977 13,854 11,226Masbate 9,139 8,414 13,217 11,214
V- Bicol
Sorsogon 9,245 7,955 12,879 10,653Aklan 8,137 8,234 11,730 11,889Antique 7,691 7,947 11,376 10,845Capiz 8,111 8,038 12,532 11,624Iloilo 8,274 8,231 12,432 12,089NegrosOccidental 7,828 8,054 11,107 11,115
VI – Western Visayas
Guimaras 8,261 7,714 11,641 10,663Bohol 7,546 6,659 10,766 9,559Cebu 7,813 6,659 11,287 9,661NegrosOriental 7,425 6,390 11,276 8,262
VII – Central Visayas
Siquijor 7,434 6,419 11,127 8,693

Table1. Food Poverty and Poverty Thresholds, by Provincial Urban/Rural Areas (continued)
Food Thresholds Poverty Thresholds Region
Province Urban Rural Urban Rural EasternSamar 7,365 7,380 10,317 9,277Leyte 7,422 7,137 10,250 9,725NorthernSamar 6,461 6,945 8,844 9,250WesternSamar 7,817 7,146 10,181 9,517SouthernLeyte 7,465 7,116 10,405 9,498
VIII – Eastern Visayas
Biliran 7,685 7,414 9,914 10,116Basilan 8,206 6,662 11,702 8,748ZamboangadelNort 7,903 6,564 11,660 8,794
IX – Western Mindanao
ZamboangadelSur 7,456 6,381 10,894 9,038Bukidnon 7,156 6,489 10,157 8,754Camiguin 8,257 7,697 13,003 11,356MisamisOccidental 7,658 7,121 10,962 9,734
X – Northern Mindanao
MisamisOriental 7,700 6,980 11,739 10,413DavaodelNorte 7,535 7,144 10,638 10,492DavaodelSur 7,716 6,601 11,745 8,848DavaoOriental 8,176 6,913 11,830 9,491SouthCotabato 7,670 7,040 11,543 10,835
XI – Southern Mindanao
Saranggani 7,854 7,188 11,457 10,547LanaodelNorte 8,075 7,746 12,011 11,443NorthCotabato 7,989 7,347 11,072 10,201
XII – Central Mindanao
SultanKudarat 8,390 7,490 12,336 10,4671st District 9,561 16,190 2nd District 9,561 15,710 3rd District 9,561 14,972
NCR
4th District 9,561 16,345 CAR Abra 8,318 8,987 13,010 13,713 Benguet 8,445 8,988 15,092 13,947 Ifugao 8,004 8,513 11,885 11,851 Kalinga 7,828 8,145 11,809 11,375 Mt. Province 10,207 10,111 17,062 15,256ARMM Apayao 7,732 7,903 10,919 11,300 LanaodelSur 8,598 8,737 12,910 14,501 Maguindanao 8,828 8,221 13,907 11,644 Sulu 9,265 9,031 12,790 12,111 Tawitawi 8,680 8,199 12,573 12,790Caraga AgusandelNorte 7,648 7,272 11,697 10,166 AgusandelSur 8,145 7,201 11,729 10,295 SurigaoDelNorte 8,742 7,675 12,695 10,547 SurigaoDelSur 8,445 7,168 11,710 9,818Source: National Statistical Coordination Board

Table 2. Poverty across Urban/Rural Areas
Persons Families Magnitude of Poor
Headcount Index
Share to Total Poverty
Magnitude of Poor
Poverty Incidence
Share to Total Poverty
Rural 18,810,885 48.2 72.8 3,110,152 40.8 73.8Urban 7,022,169 18.4 27.2 1,104,445 14.8 26.2Total 25,833,054 33.5 100.00 4,214,597 28.0 100.00 Table 3. FGT Poverty Measures by Region/Province Region / Province (Sample Size) Headcount
Measure (se*) Poverty
Gap (se*) Poverty
Severity (se*) Region I – Ilocos (1,887) 35.48 (1.95) 10.65 (0.87) 4.34 (0.47) Ilocos Norte (237) 22.80 (4.50) 5.43 (1.32) 1.89 (0.56) Ilocos Sur (378) 35.41 (3.43) 9.95 (1.39) 4.02 (0.74) La Union (427) 38.99 (5.18) 12.25 (2.38) 5.41 (1.43) Pangasinan (845) 37.21 (2.76) 11.46 (1.27) 4.64 (0.67) Region II – Cagayan (1,561) 29.74 (2.36) 7.65 (0.83) 2.81 (0.39) Batanes (93) 13.91 (5.52) 1.01 (0.57) 0.12 (0.08) Cagayan (424) 25.35 (3.90) 5.47 (1.10) 1.65 (0.44) Isabela (571) 34.64 (3.75) 9.88 (1.51) 3.90 (0.73) Nueva Vizcaya (239) 21.64 (6.27) 4.67 (1.55) 1.59 (0.59) Quirino (234) 38.17 (6.18) 10.93 (2.67) 4.40 (1.33) Region III – Central Luzon (3,770) 20.92 (1.14) 4.89 (0.45) 1.71 (0.23) Bataan (326) 12.08 (1.98) 1.92 (0.37) 0.52 (0.13) Bulacan (955) 7.51 (1.15) 1.47 (0.23) 0.44 (0.08) Nueva Ecija (658) 31.96 (2.79) 6.61 (0.84) 1.96 (0.32) Pampanga (887) 18.17(2.22) 4.12 (0.75) 1.38 (0.31) Tarlac (565) 33.62 (5.02) 10.44 (2.48) 4.56 (1.44) Zambales (379) 27.97 (2.94) 6.48 (0.96) 2.24 (0.42) Region IV – Southern Luzon (6168) 25.93 (1.17) 7.69 (0.53) 3.22 (0.30) Batangas (856) 25.94 (2.60) 6.45 (0.86) 2.35 (0.41) Cavite (1058) 12.97 (2.16) 2.88 (0.57) 0.99 (0.26) Laguna (1183) 11.44 (1.54) 2.22 (0.37) 0.66 (0.13) Marinduque (335) 55.48 (3.33) 16.04 (1.76) 6.00 (0.90)
Occidental Mindoro (326) 48.75 (4.83) 14.20 (2.09) 5.72 (1.10)
Oriental Mindoro (230) 51.70 (7.17) 20.95 (4.38) 10.59 (2.80) Palawan (464) 35.88 (4.34) 11.09 (1.93) 4.70 (1.00) Quezon (562) 40.70 (4.92) 13.77 (2.38) 6.08 (1.33) Rizal (583) 11.11 (1.87) 2.09 (0.51) 0.68 (0.22) Romblon (286) 66.53 (5.21) 24.31 (2.80) 11.12 (1.67) Aurora (285) 33.23 (3.06) 9.99 (1.52) 4.15 (0.94) Region V – Bicol (2099) 53.15 (2.08) 17.87 (1.00) 7.73 (0.56) Albay (369) 47.78 (5.46) 13.71 (2.28) 5.43 (1.19) Camarines Norte (280) 57.34 (6.04) 20.05 (2.88) 8.85 (1.63) Camarines Sur (474) 48.72 (3.99) 16.75 (2.06) 7.41 (1.17) Catanduanes (188) 53.18 (5.20) 20.02 (3.42) 9.14 (1.96) Masbate (371) 70.90 (3.17) 27.55 (2.01) 12.92 (1.31) Sorsogon (417) 51.38 (3.38) 15.11 (1.29) 5.56 (0.60)
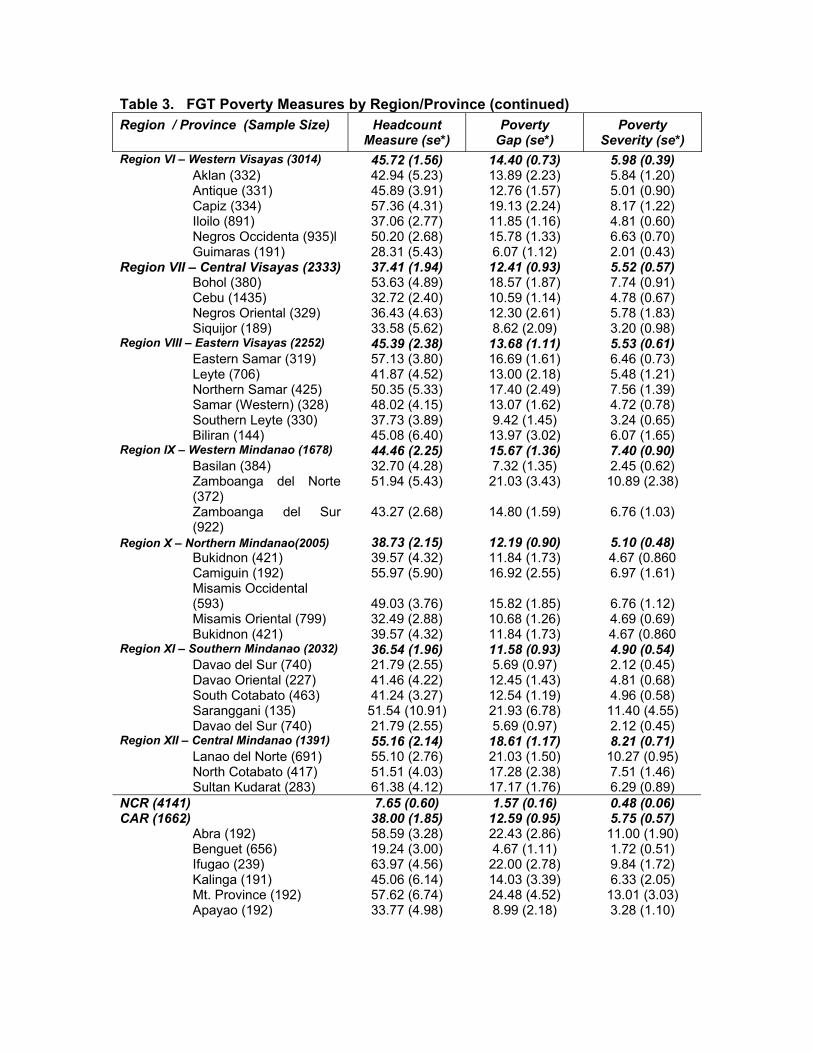
Table 3. FGT Poverty Measures by Region/Province (continued) Region / Province (Sample Size) Headcount
Measure (se*) Poverty
Gap (se*) Poverty
Severity (se*) Region VI – Western Visayas (3014) 45.72 (1.56) 14.40 (0.73) 5.98 (0.39) Aklan (332) 42.94 (5.23) 13.89 (2.23) 5.84 (1.20) Antique (331) 45.89 (3.91) 12.76 (1.57) 5.01 (0.90) Capiz (334) 57.36 (4.31) 19.13 (2.24) 8.17 (1.22) Iloilo (891) 37.06 (2.77) 11.85 (1.16) 4.81 (0.60) Negros Occidenta (935)l 50.20 (2.68) 15.78 (1.33) 6.63 (0.70) Guimaras (191) 28.31 (5.43) 6.07 (1.12) 2.01 (0.43) Region VII – Central Visayas (2333) 37.41 (1.94) 12.41 (0.93) 5.52 (0.57) Bohol (380) 53.63 (4.89) 18.57 (1.87) 7.74 (0.91) Cebu (1435) 32.72 (2.40) 10.59 (1.14) 4.78 (0.67) Negros Oriental (329) 36.43 (4.63) 12.30 (2.61) 5.78 (1.83) Siquijor (189) 33.58 (5.62) 8.62 (2.09) 3.20 (0.98) Region VIII – Eastern Visayas (2252) 45.39 (2.38) 13.68 (1.11) 5.53 (0.61) Eastern Samar (319) 57.13 (3.80) 16.69 (1.61) 6.46 (0.73) Leyte (706) 41.87 (4.52) 13.00 (2.18) 5.48 (1.21) Northern Samar (425) 50.35 (5.33) 17.40 (2.49) 7.56 (1.39) Samar (Western) (328) 48.02 (4.15) 13.07 (1.62) 4.72 (0.78) Southern Leyte (330) 37.73 (3.89) 9.42 (1.45) 3.24 (0.65) Biliran (144) 45.08 (6.40) 13.97 (3.02) 6.07 (1.65) Region IX – Western Mindanao (1678) 44.46 (2.25) 15.67 (1.36) 7.40 (0.90) Basilan (384) 32.70 (4.28) 7.32 (1.35) 2.45 (0.62) Zamboanga del Norte
(372) 51.94 (5.43) 21.03 (3.43) 10.89 (2.38)
Zamboanga del Sur (922)
43.27 (2.68) 14.80 (1.59) 6.76 (1.03)
Region X – Northern Mindanao(2005) 38.73 (2.15) 12.19 (0.90) 5.10 (0.48) Bukidnon (421) 39.57 (4.32) 11.84 (1.73) 4.67 (0.860 Camiguin (192) 55.97 (5.90) 16.92 (2.55) 6.97 (1.61)
Misamis Occidental (593) 49.03 (3.76) 15.82 (1.85) 6.76 (1.12)
Misamis Oriental (799) 32.49 (2.88) 10.68 (1.26) 4.69 (0.69) Bukidnon (421) 39.57 (4.32) 11.84 (1.73) 4.67 (0.860 Region XI – Southern Mindanao (2032) 36.54 (1.96) 11.58 (0.93) 4.90 (0.54) Davao del Sur (740) 21.79 (2.55) 5.69 (0.97) 2.12 (0.45) Davao Oriental (227) 41.46 (4.22) 12.45 (1.43) 4.81 (0.68) South Cotabato (463) 41.24 (3.27) 12.54 (1.19) 4.96 (0.58) Saranggani (135) 51.54 (10.91) 21.93 (6.78) 11.40 (4.55) Davao del Sur (740) 21.79 (2.55) 5.69 (0.97) 2.12 (0.45) Region XII – Central Mindanao (1391) 55.16 (2.14) 18.61 (1.17) 8.21 (0.71) Lanao del Norte (691) 55.10 (2.76) 21.03 (1.50) 10.27 (0.95) North Cotabato (417) 51.51 (4.03) 17.28 (2.38) 7.51 (1.46) Sultan Kudarat (283) 61.38 (4.12) 17.17 (1.76) 6.29 (0.89) NCR (4141) 7.65 (0.60) 1.57 (0.16) 0.48 (0.06) CAR (1662) 38.00 (1.85) 12.59 (0.95) 5.75 (0.57) Abra (192) 58.59 (3.28) 22.43 (2.86) 11.00 (1.90) Benguet (656) 19.24 (3.00) 4.67 (1.11) 1.72 (0.51) Ifugao (239) 63.97 (4.56) 22.00 (2.78) 9.84 (1.72) Kalinga (191) 45.06 (6.14) 14.03 (3.39) 6.33 (2.05) Mt. Province (192) 57.62 (6.74) 24.48 (4.52) 13.01 (3.03) Apayao (192) 33.77 (4.98) 8.99 (2.18) 3.28 (1.10)

Table 3. FGT Poverty Measures by Region/Province (continued) Region / Province (Sample Size)
Headcount Measure (se*)
Poverty Gap (se*)
Poverty Severity (se*)
ARMM (1817) 65.25 (2.48) 21.06 (1.27) 8.70 (0.72) Lanao del Sur (503) 63.99 (4.79) 20.24 (2.14) 7.80 (0.98) Maguindanao (601) 65.99 (3.86) 24.25 (2.54) 11.50 (1.69) Sulu (480) 67.68 (5.61) 19.03 (2.37) 6.63 (1.04) Tawi-tawi (233) 60.25 (5.54) 17.99 (2.60) 6.93 (1.29) Caraga (1490) 50.20 (2.29) 17.13 (1.26) 7.73 (0.73) Agusan del Norte (557) 45.35 (3.47) 16.12 (1.69) 7.87 (1.00) Agusan del Sur (276) 57.99 (5.45) 21.78 (3.12) 10.12 (1.86) Surigao Del Norte (326) 50.83 (4.96) 15.20 (2.55) 6.28 (1.47) Surigao Del Sur (331) 45.68 (3.71) 14.40 (2.14) 6.02 (1.16) PHILIPPINES (39615) 33.49 (0.43) 10.36 (0.20) 4.36 (0.11) *standard errors Table 4. Spearman and Kendall Rank correlations for Regional Ranks from FGT indices Regional Ranks
Headcount Index Poverty Gap Index Poverty Severity Index
Spearman Kendall Spearman Kendall Spearman Kendall Headcount Index
0.9794** 0.9167** 0.9676** 0.8833**
Poverty Gap Index
0.9794** 0.9167** 0.9941** 0.9667**
Poverty Severity Index
0.9676** 0.8833** 0.9941** 0.9667**
**pvalue<0.0001 for testing the null hypothesis that ranks are independent Table 5. Distribution of Poverty by (a) Type of Household; (b) Family Size, (c) Marital Status of Head (d) Education of Head, and (e) Employment of Head.
POVERTY* CONTRIBUTION TO TOTAL
POVERTY * Incidence Depth Severity Incidence Depth Severity
National 28.0 8.2 3.4 100.0 100.0 100.0
Type of Household Single Family 29.6 8.8 3.6 80.1 80.9 81.4Extended Family 23.1 6.5 2.6 19.9 19.1 18.6Two or More Non-related Persons/Members 7.0 0.7 0.1 0.1 0.0 0.0
Family size 1-2 10.3 2.3 0.8 4.3 3.3 2.73-4 17.2 4.1 1.5 19.5 16.0 13.95-6 30.6 8.6 3.3 37.2 35.5 33.77-8 46.9 15.6 6.8 26.8 30.3 32.59 and above 52.3 19.1 8.9 12.1 15.0 17.2

Marital status of Head Single 9.8 2.4 0.9 1.2 1.0 1.0Married 30.3 9.0 3.7 87.4 88.6 89.1Widowed 20.4 5.5 2.1 10.3 9.4 8.9Divorced/Separated 16.4 4.5 1.8 1.1 1.0 1.0Unknown 20.1 4.5 1.0 0.0 0.0 0.0Educational attainment of Head No Grade Completed 52.8 17.8 7.9 7.7 8.8 9.6Elementary Undergraduate 44.0 13.7 5.8 35.2 37.3 38.8Elementary Graduate 34.9 10.0 4.0 26.1 25.5 24.9High School Undergraduate 31.5 9.0 3.6 12.8 12.5 12.2High School Graduate 19.9 5.2 1.9 14.4 12.8 11.7College Undergraduate 8.4 2.1 0.8 3.3 2.7 2.5Degree holder 1.6 0.3 0.1 0.6 0.4 0.3
Employment Status of Head Wage Earner 23.5 6.6 2.6 33.3 31.6 30.7 Agriculture 53.1 16.8 7.1 15.0 16.2 16.9 Non-agriculture 18.7 4.9 1.8 18.2 15.4 13.9Self Employed 36.5 11.2 4.7 57.6 60.2 61.6 Agriculture 47.2 15.1 6.4 46.5 50.5 52.9 Non-agriculture 16.1 4.0 1.5 11.0 9.8 8.8Unemployed 15.7 4.1 1.6 9.1 8.2 7.6
* Rates quoted here use the family as the unit of analysis. Table 6. Average Expenditures (and Share to Total Expenditures in %) of Some Expenditure Items by Poverty Status of Households
Poor Non Poor Average Expenditures (Share to Total Expenditures) Ultra Poor Not Ultra Nearly Poor
Not Nearly Poor
Food 26449 (66.2)
33708 (62.6)
40116 (59.6)
62385 (47.5)
Tobacco 763
(1.81)1031
(1.85)1219
(1.81) 1423
(1.29)
Alcohol 364
(0.92)561
(1.04)716
(1.13) 983
(0.84)
Clothing 871
(2.04)1374
(2.43)1826
(2.61) 4290
(2.79)
Fuel 2626 (6.6)
3586 (6.7)
4632 (6.7)
9668 (6.8)
Education 741
(16.2)1130
(17.7)1653
(20.6) 7284
(34.9)
Recreation 43
(0.09)86
(0.13)141
(0.19) 856
(0.42)
Medical Care 366
(0.88)604
(1.02)848
(1.17) 3267
(1.86)Transportation & Communications
1000 (2.2)
1756 (3.0)
2648 (3.5)
11830 (5.7)

Table 7. Some Characteristics of Ultra Poor, Poor but not Ultra Poor, Nearly Poor and Not Nearly Poor Households
Poor Non Poor Proportion of Households (in %) Ultra Poor Not Ultra Nearly Poor
Not Nearly Poor
Not living in a Single House 1.2 2.7 4.3 9.4Living in a House with Makeshift Roofs 61.8 46.2 36.2 14.0Living in a House with Makeshift Walls 68.2 53.2 42.5 16.7With Access to Sanitary Toilets 34.4 50.7 62.9 85.6With Access to Safe Water 3.0 7.9 15.1 39.5With Electricity 30.5 52.6 69.4 90.1That Own at least one Radio 51.3 64.2 68.3 79.1That Own at least one Television 13.0 31.2 48.3 79.3That Own at least one VTR/VHS/VCD/DVD 1.1 3.3 7.2 37.1That Own at least one Stereo 2.4 6.9 10.7 34.8That Own at least one Refrigerator 2.5 6.9 15.4 56.5That Own at least one Washing Machine 0.9 3.1 9.1 38.5That Own at least one Airconditioner 0.1 0.3 0.6 8.1That Own at least one Sala Set 10.5 22.0 36.3 72.9That Own at least one Dining Set 9.7 17.3 30.0 68.0That Own at least one Car 0.0 0.1 0.2 9.1That Own at least one Landline phone / Cellphone 0.0 0.3 1.3 24.2That Own at least one PC 0.0 0.0 0.0 4.6That Own at least one Microwave oven 0.0 0.0 0.4 7.1That Own at least one Motorcycle 0.2 0.9 1.8 6.7

Table 8. Model of the Determinants of Poverty in the Philippines
NCR (R2=53.9%)
LUZON (R2=57.8%)
VISAYAS (R2=60.2%)
MINDANAO (R2=60.2%) Philippines variable variable label
Coef t statistic coef
t statistic coef
t statistic coef
t statistic coef t statistic
age1
Total members with age less than 1 year
old -0.159 -5.73 -0.123 -9.92 -0.125 -14.81 -0.125 -14.81 -0.125 -14.81
age7 Total members with
age 1 - 6 yrs old -0.196 -18.35 -0.178 -37.99 -0.174 -55.39 -0.174 -55.39 -0.174 -55.39
age15 Total members with
age 7 - 14 yrs old -0.169 -19.94 -0.161 -47.1 -0.155 -67.56 -0.155 -67.56 -0.155 -67.56
age25 Total members with
age 15-24 yrs old -0.111 -14.3 -0.102 -28.03 -0.097 -39.73 -0.097 -39.73 -0.097 -39.73
age99
Total members with age 25 yrs old and
above -0.098 -9.75 -0.075 -14.91 -0.075 -22.26 -0.075 -22.26 -0.075 -22.26Urb00 Lives in urban area (dropped) 0.065 7.4 0.066 10.74 0.066 10.74 0.066 10.74
Non_rel Number of Non-
relatives 0.323 23.69 0.258 20.56 0.264 39.43 0.264 39.43 0.264 39.43bldg_type Type of Building 0.030 2.66 0.024 2.43 0.045 7.17 0.045 7.17 0.045 7.17
mkshftr
Dummy variable for whether roof is made
of makeshift materials -0.133 -2.05 -0.084 -5.82 -0.098 -11.15 -0.098 -11.15 -0.098 -11.15
mkshftw
Dummy variable for whether walls are
made of makeshift materials -0.166 -2.64 -0.163 -11.96 -0.157 -18.23 -0.157 -18.23 -0.157 -18.23
tenure Tenure -0.036 -5.81 -0.017 -5.9 -0.026 -14.37 -0.026 -14.37 -0.026 -14.37
educhh
Highest education level of Household
Head 0.152 23.69 0.141 50.85 0.134 72.31 0.134 72.31 0.134 72.31
Ms Marital Status of Household Head -0.055 -2.98 -0.025 -2.65 -0.032 -4.85 -0.032 -4.85 -0.032 -4.85

Table 8. Model of the Determinants of Poverty in the Philippines (continued)
NCR (R2=53.9%)
LUZON (R2=57.8%)
VISAYAS (R2=60.2%)
MINDANAO (R2=60.2%) Philippines variable variable label
Coef t statistic coef
t statistic coef
t statistic coef
t statistic coef t statistic
employed
Number of Employed Members of Household 0.121 10.92 0.079 15.79 0.083 24.72 0.083 24.72 0.083 24.72
selfemp
Dummy variable for whether head is self
employed 0.019 1.58 -0.020 -3.14 -0.023 -5.27 -0.023 -5.27 -0.023 -5.27
condoyes
Dummy variable for whether HH received
cash from domestic sources -0.118 -5.7 -0.162 -19.79 -0.149 -26.1 -0.149 -26.1 -0.149 -26.1
conabyes
Dummy variable for whether HH received
cash from abroad 0.177 8.79 0.233 23.46 0.245 33.88 0.245 33.88 0.245 33.88
stoilet
Dummy variable for whether household
has sanitary toilet 0.121 3.04 0.145 12.86 0.111 15.42 0.111 15.42 0.111 15.42
swater
Dummy variable for whether household
has safe water 0.174 8.26 0.192 20.68 0.218 33.21 0.218 33.21 0.218 33.21
electric
Dummy variable for whether household
has electricity 0.339 2.47 0.208 16.61 0.219 27.71 0.219 27.71 0.219 27.71
distance Distance of Water
Source from House 0.0001 0.41 0.0000 -0.85 -0.0001 -2.99 -0.0001 -2.99 -0.0001 -2.99sex Household Head Sex -0.117 -4.98 -0.093 -7.56 -0.091 -10.69 -0.091 -10.69 -0.091 -10.69age Household Head Age 0.005 5.62 0.004 10.8 0.003 12.31 0.003 12.31 0.003 12.31_constant Model Intercept Term 0.257 1.64 0.179 4.74 0.259 10.26 0.259 10.26 0.259 10.26
*- statistically significant; **- strongly statistically significant
Related Documents