12/12/2014 1 in partnership with Institute of Epidemiology & Health London, UK Professor Amanda Mocroft Five Nations Conference on HIV and Hepatitis The epidemiology of HIV and viral hepatitis in Europe Amanda Mocroft [email protected]

Welcome message from author
This document is posted to help you gain knowledge. Please leave a comment to let me know what you think about it! Share it to your friends and learn new things together.
Transcript

12/12/2014
1
in partnership
with
Institute of Epidemiology & Health
London, UK
Professor Amanda Mocroft
Five Nations Conference on
HIV and Hepatitis
The epidemiology of HIV and
viral hepatitis in Europe
Amanda Mocroft
12/12/2014
2
Outline
• Epidemiology of HIV, HBV and HCV across Europe
• Outcomes in coinfected persons
• Issues around late presentation for hepatitis
Outline
• Epidemiology of HIV, HBV and HCV across Europe
• Outcomes in coinfected persons
• Issues around late presentation for hepatitis
12/12/2014
3
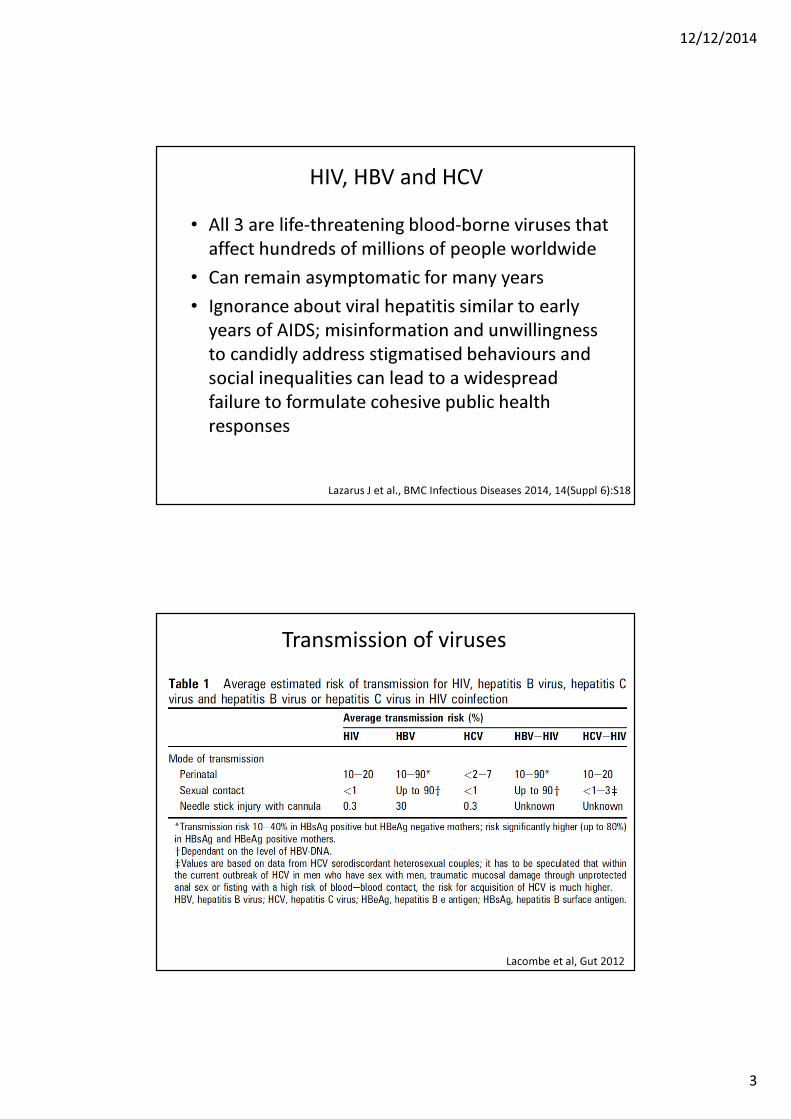
HIV, HBV and HCV
• All 3 are life-threatening blood-borne viruses that
affect hundreds of millions of people worldwide
• Can remain asymptomatic for many years
• Ignorance about viral hepatitis similar to early
years of AIDS; misinformation and unwillingness
to candidly address stigmatised behaviours and
social inequalities can lead to a widespread
failure to formulate cohesive public health
responses
Lazarus J et al., BMC Infectious Diseases 2014, 14(Suppl 6):S18
Transmission of viruses
Lacombe et al, Gut 2012
12/12/2014
4
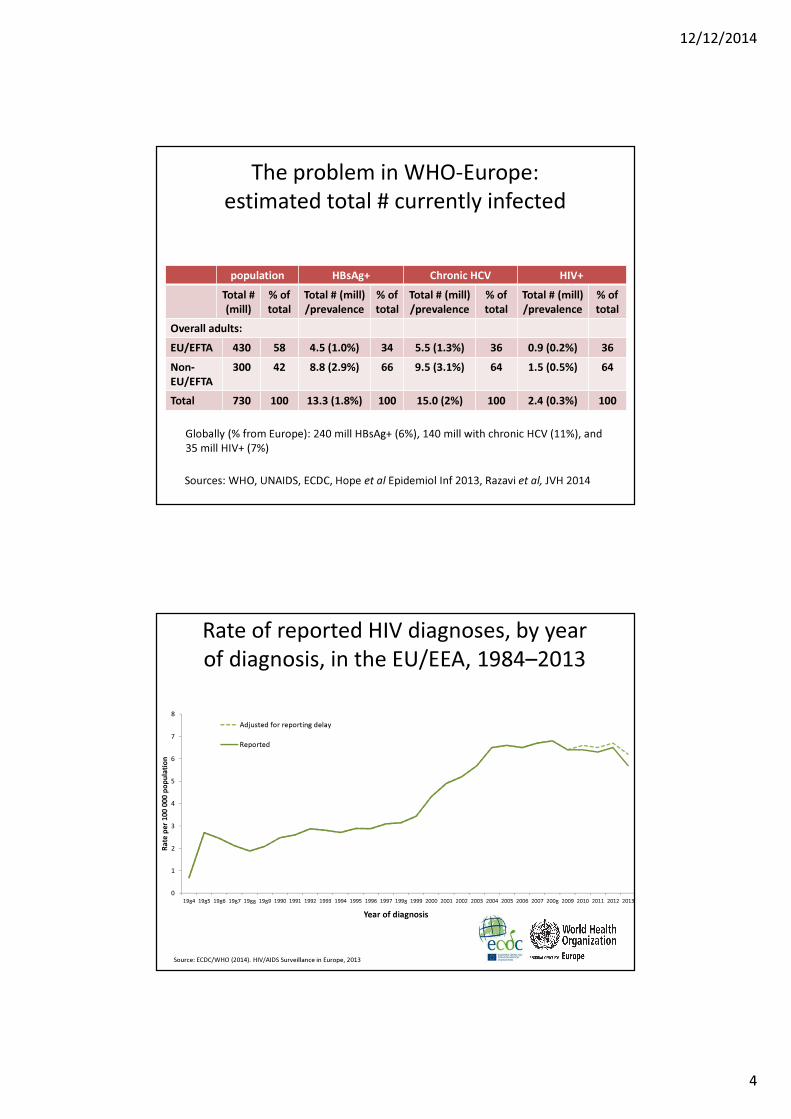
The problem in WHO-Europe:
estimated total # currently infected
population HBsAg+ Chronic HCV HIV+
Total #
(mill)
% of
total
Total # (mill)
/prevalence
% of
total
Total # (mill)
/prevalence
% of
total
Total # (mill)
/prevalence
% of
total
Overall adults:
EU/EFTA 430 58 4.5 (1.0%) 34 5.5 (1.3%) 36 0.9 (0.2%) 36
Non-
EU/EFTA
300 42 8.8 (2.9%) 66 9.5 (3.1%) 64 1.5 (0.5%) 64
Total 730 100 13.3 (1.8%) 100 15.0 (2%) 100 2.4 (0.3%) 100
Globally (% from Europe): 240 mill HBsAg+ (6%), 140 mill with chronic HCV (11%), and
35 mill HIV+ (7%)
Sources: WHO, UNAIDS, ECDC, Hope et al Epidemiol Inf 2013, Razavi et al, JVH 2014
Rate of reported HIV diagnoses, by year
of diagnosis, in the EU/EEA, 1984–2013
Source: ECDC/WHO (2014). HIV/AIDS Surveillance in Europe, 2013
0
1
2
3
4
5
6
7
8
1984 1985 1986 1987 1988 1989 1990 1991 1992 1993 1994 1995 1996 1997 1998 1999 2000 2001 2002 2003 2004 2005 2006 2007 2008 2009 2010 2011 2012 2013
Ra
te p
er
10
0 0
00
po
pu
lati
on
Year of diagnosis
Adjusted for reporting delay
Reported
12/12/2014
5
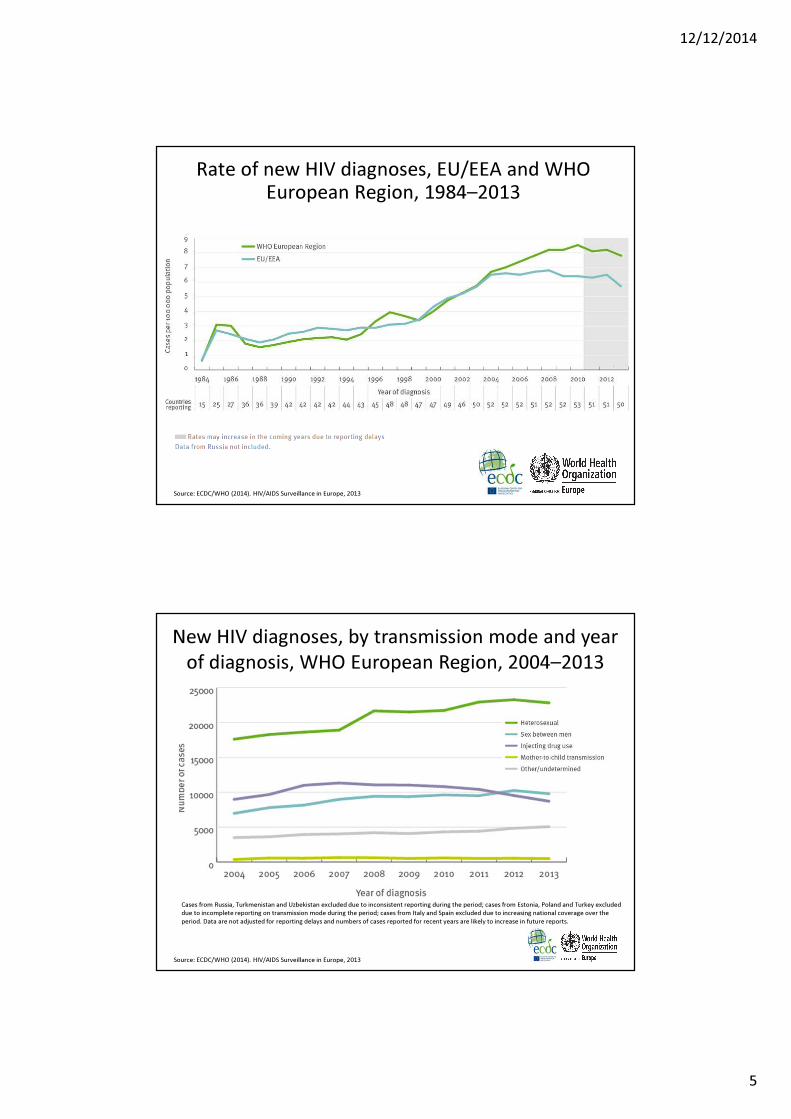
Rate of new HIV diagnoses, EU/EEA and WHO European Region, 1984–2013
Source: ECDC/WHO (2014). HIV/AIDS Surveillance in Europe, 2013
New HIV diagnoses, by transmission mode and year
of diagnosis, WHO European Region, 2004–2013
Cases from Russia, Turkmenistan and Uzbekistan excluded due to inconsistent reporting during the period; cases from Estonia, Poland and Turkey excluded
due to incomplete reporting on transmission mode during the period; cases from Italy and Spain excluded due to increasing national coverage over the
period. Data are not adjusted for reporting delays and numbers of cases reported for recent years are likely to increase in future reports.
Source: ECDC/WHO (2014). HIV/AIDS Surveillance in Europe, 2013
12/12/2014
6
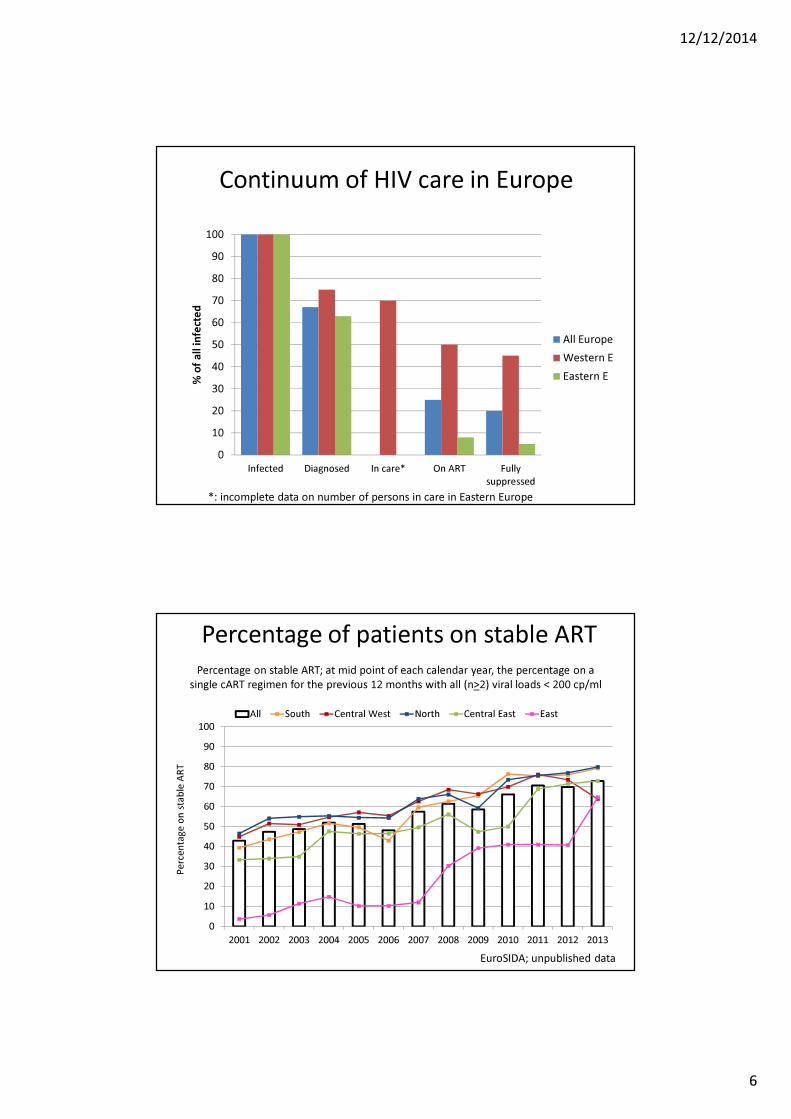
Continuum of HIV care in Europe
0
10
20
30
40
50
60
70
80
90
100
Infected Diagnosed In care* On ART Fully
suppressed
% o
f a
ll i
nfe
cte
d
All Europe
Western E
Eastern E
*: incomplete data on number of persons in care in Eastern Europe
Percentage of patients on stable ART
0
10
20
30
40
50
60
70
80
90
100
2001 2002 2003 2004 2005 2006 2007 2008 2009 2010 2011 2012 2013
All South Central West North Central East East
Pe
rce
nta
ge
on
sta
ble
AR
T
EuroSIDA; unpublished data
Percentage on stable ART; at mid point of each calendar year, the percentage on a
single cART regimen for the previous 12 months with all (n>2) viral loads < 200 cp/ml
12/12/2014
7
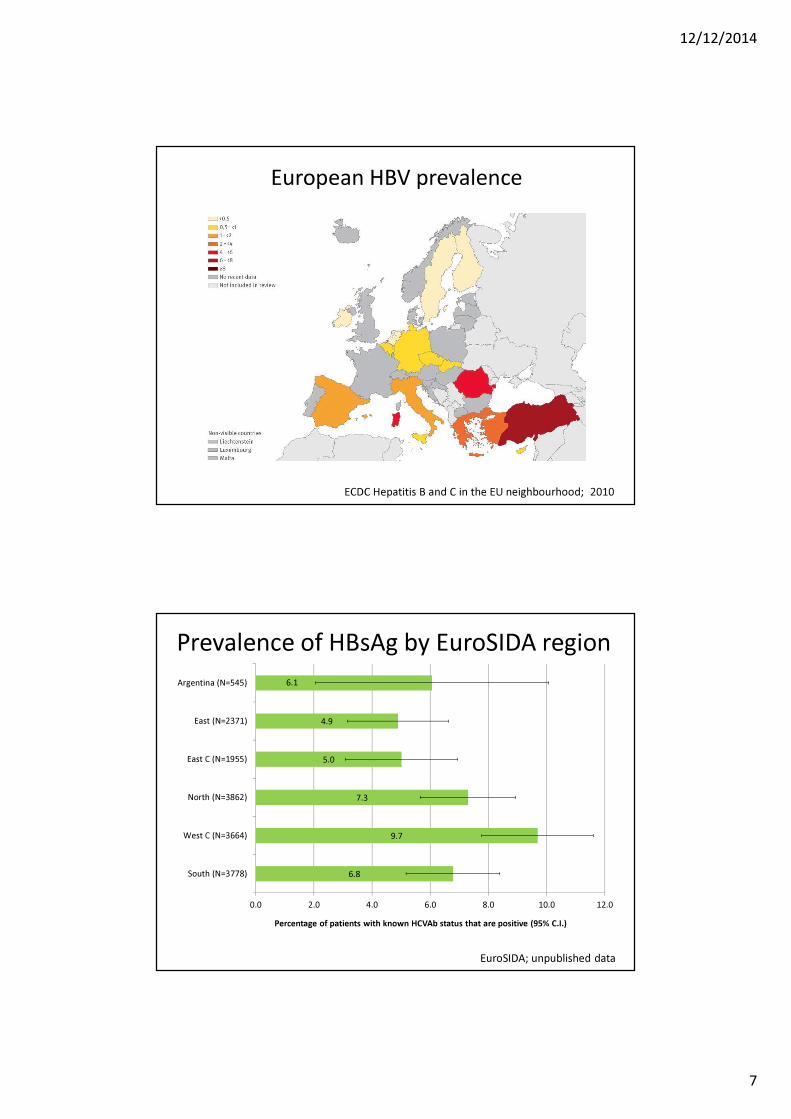
European HBV prevalence
ECDC Hepatitis B and C in the EU neighbourhood; 2010
Prevalence of HBsAg by EuroSIDA region
6.8
9.7
7.3
5.0
4.9
6.1
0.0 2.0 4.0 6.0 8.0 10.0 12.0
South (N=3778)
West C (N=3664)
North (N=3862)
East C (N=1955)
East (N=2371)
Argentina (N=545)
Percentage of patients with known HCVAb status that are positive (95% C.I.)
EuroSIDA; unpublished data
12/12/2014
8
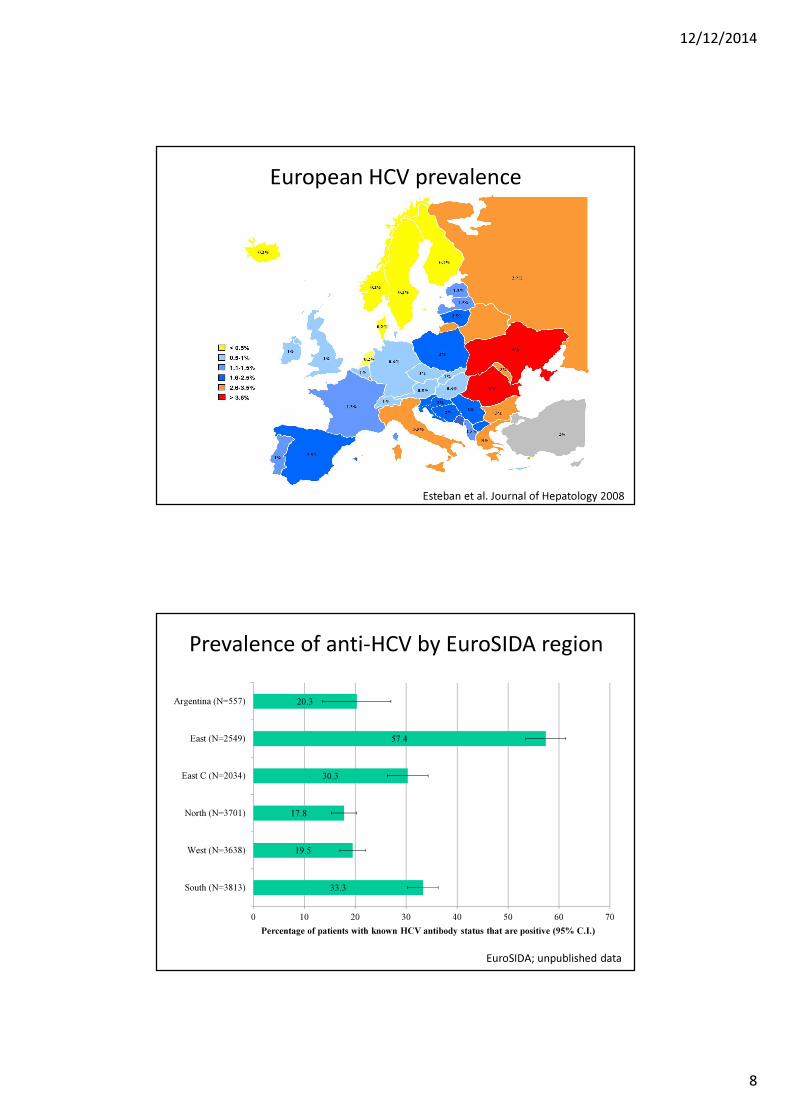
European HCV prevalence
Esteban et al. Journal of Hepatology 2008
Prevalence of anti-HCV by EuroSIDA region
33.3
19.5
17.8
30.3
57.4
20.3
0 10 20 30 40 50 60 70
South (N=3813)
West (N=3638)
North (N=3701)
East C (N=2034)
East (N=2549)
Argentina (N=557)
Percentage of patients with known HCV antibody status that are positive (95% C.I.)
EuroSIDA; unpublished data
12/12/2014
9
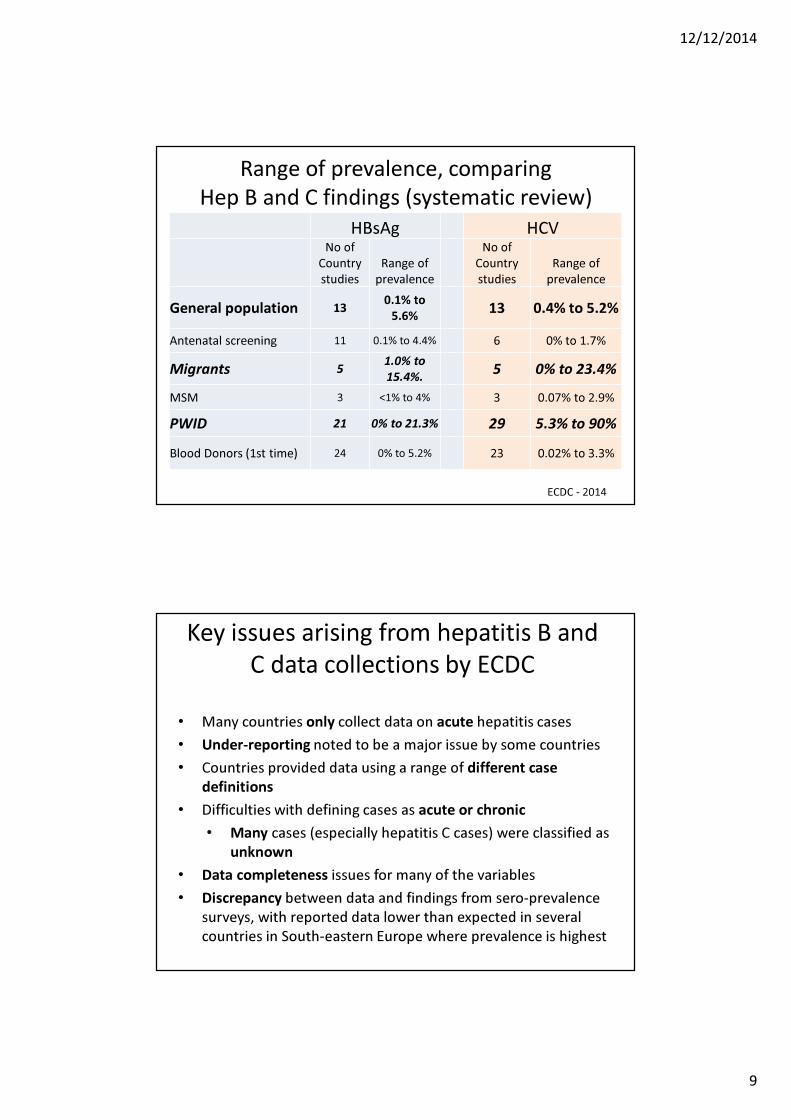
Range of prevalence, comparing
Hep B and C findings (systematic review)
HBsAg HCVNo of
Country
studies
Range of
prevalence
No of
Country
studies
Range of
prevalence
General population 130.1% to
5.6%13 0.4% to 5.2%
Antenatal screening 11 0.1% to 4.4% 6 0% to 1.7%
Migrants 51.0% to
15.4%. 5 0% to 23.4%
MSM 3 <1% to 4% 3 0.07% to 2.9%
PWID 21 0% to 21.3% 29 5.3% to 90%
Blood Donors (1st time) 24 0% to 5.2% 23 0.02% to 3.3%
ECDC - 2014
Key issues arising from hepatitis B and
C data collections by ECDC
• Many countries only collect data on acute hepatitis cases
• Under-reporting noted to be a major issue by some countries
• Countries provided data using a range of different case
definitions
• Difficulties with defining cases as acute or chronic
• Many cases (especially hepatitis C cases) were classified as
unknown
• Data completeness issues for many of the variables
• Discrepancy between data and findings from sero-prevalence
surveys, with reported data lower than expected in several
countries in South-eastern Europe where prevalence is highest
12/12/2014
10
Summary : Epidemiology
• Prevalence of HBV and HCV 5-6 fold higher than for HIV
– Surveillance info better for HIV than HBV / HCV
– 2-3 fold higher in Eastern than in Western region for all 3
– % of infected diagnosed higher for HIV (app 2/3) than for HBV / HCV (projected < 50%)
• Disease burden substantially larger in Eastern regions – limited access to therapy
Outline
• Epidemiology of HIV, HBV and HCV across Europe
• Outcomes in coinfected persons
• Issues around late presentation for hepatitis

12/12/2014
11
Cause of death in the D:A:D study 1999-2011
Smith et al Lancet 2014
3909 deaths among 49,731 pts
0
1
2
3
4
5
6
7
1999/2000 2001/2002 2003/2004 2005/2006 2007/2008 2009-2011
Ra
te o
f d
ea
th p
er
10
00
pe
rso
n-y
ea
rs
Calendar Year
Age standardised incidence rates for
specific causes of death
AIDS-related Liver-related CVD-related
Non-AIDS Cancer Other known Unknown
Smith et al Lancet 2014
3909 deaths among 49,731 pts

12/12/2014
12
Risk factors for liver related death in individuals
with HIV-1 : Coinfection with HBsAg
Thio et al Lancet 2002
From the MACS study including 5293 MSM (2734 HIV-/2559 HIV+)
326 HBsAg+ (6%), 213 (8.3%) of HIV+, 113 (4.1%) of HIV-
Coinfection with HIV/HBV and clinical events
RR 95% CI
AIDS (N=75/759) Univariate 0.98 0.78 – 1.25
Multivariate 0.86 0.63 – 1.18
All deaths (N=95/647) Univariate 1.44 1.16 – 1.79
Multivariate 1.54 1.19 – 1.98
Liver related deaths (N=18/53) Univariate 3.34 1.96 – 2.70
Multivariate 3.31 1.80 – 6.11
Konopnicki et al. AIDS 2005
9802 from 72 European HIV centres; 498 (8.7%) HBsAG +ve;
HBsAg status not related to viral/immunological responses in 1679 started cART

12/12/2014
13
Response to cART and HBV/HIV coinfection
Author Year Region CD4 changes VL response
De Luca 2002 Italy - -
Law 2004 Thailand Early, not
sustained
-
Sheng 2004 Taiwan - Increased
failure
Konopnicki 2005 Europe - -
Sheng 2007 Taiwan Lower Lower
Omland 2008 Denmark - -
Hoffmann 2009 US - -
Moore 2010 Malawi - -
Hawkins 2013 Tanzania Lower Not reported
Thio 2013 Brazil, Haiti, India, Malawi, Peru, South
Africa, Thailand, US, Zimbabwe: Kenya,
Botswana, Zambia, Uganda
- -
Chun 2014 US - -
x 1.5
HCV disease progression remains faster in
coinfected patients, despite effective ART
Lo Re et al. Ann Intern Med 2014
HCV-monoinfected patients (n=6079)
Antiretroviral-treated patients coinfected with HIV/HCV (n=4208)
0.074
0
0.1
0.2
0
Time to hepatic decompensation (years)
1 2 3 4 5 6 7 8 9 10
Cu
mu
lati
ve
in
cid
en
ce
0.048
p<0.001
12/12/2014
14
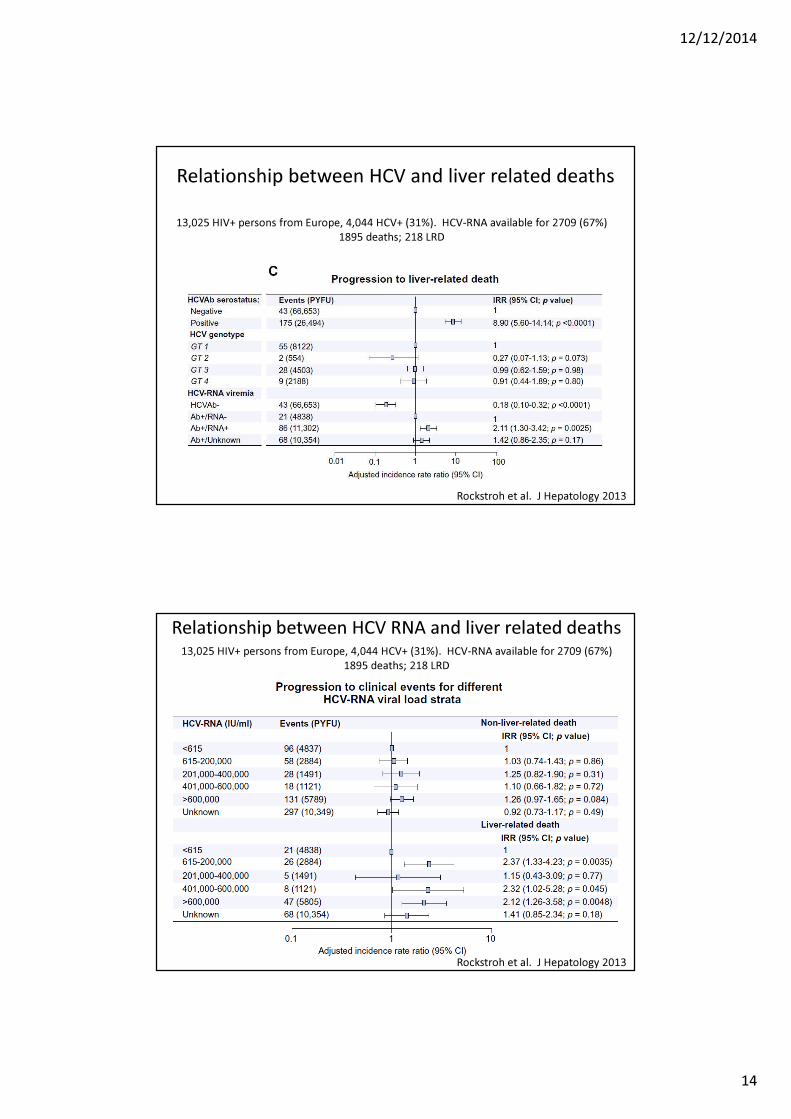
Relationship between HCV and liver related deaths
Rockstroh et al. J Hepatology 2013
13,025 HIV+ persons from Europe, 4,044 HCV+ (31%). HCV-RNA available for 2709 (67%)
1895 deaths; 218 LRD
Rockstroh et al. J Hepatology 2013
Relationship between HCV RNA and liver related deaths13,025 HIV+ persons from Europe, 4,044 HCV+ (31%). HCV-RNA available for 2709 (67%)
1895 deaths; 218 LRD
12/12/2014
15
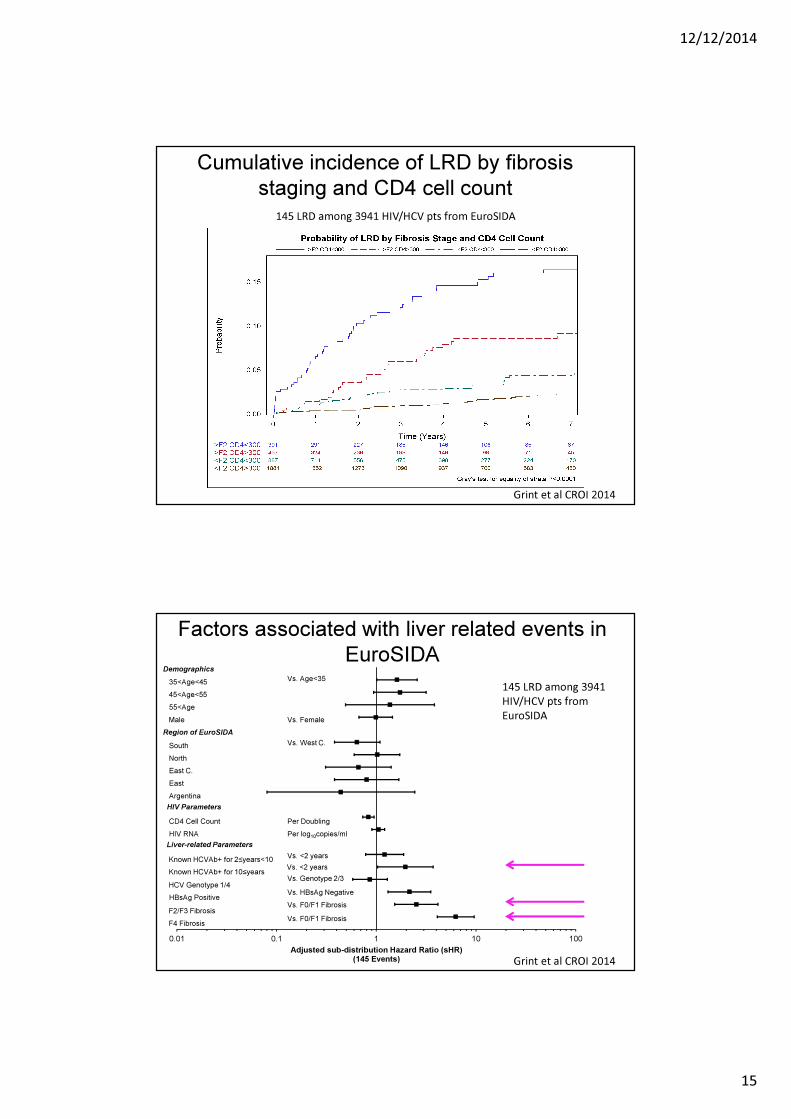
Cumulative incidence of LRD by fibrosis
staging and CD4 cell count
Grint et al CROI 2014
145 LRD among 3941 HIV/HCV pts from EuroSIDA
Factors associated with liver related events in
EuroSIDA
0.01 0.1 1 10 100
Adjusted sub-distribution Hazard Ratio (sHR)(145 Events)
HIV Parameters
Liver-related Parameters
35<Age<45
45<Age<55
55<Age
Male
South
North
East C.
East
Argentina
CD4 Cell Count
HIV RNA
Known HCVAb+ for 2≤years<10
Known HCVAb+ for 10≤years
HCV Genotype 1/4
HBsAg Positive
F4 Fibrosis
Vs. Age<35
Vs. Female
Vs. West C.
Per Doubling
Per log10copies/ml
Vs. <2 years
Vs. <2 years
Vs. Genotype 2/3
Vs. HBsAg Negative
Vs. F0/F1 Fibrosis
Demographics
Region of EuroSIDA
F2/F3 FibrosisVs. F0/F1 Fibrosis
Grint et al CROI 2014
145 LRD among 3941
HIV/HCV pts from
EuroSIDA

12/12/2014
16
Response to cART and HCV/HIV coinfection
Author Year Region CD4 changes VL response
Greub 2000 Switzerland Lower -
Sulkowski 2002 US - -
De Luca 2002 Italy Lower -
Macias 2003 Spain Lower Not reported
Lincoln 2003 Australia Lower -
Rockstroh 2005 Europe - -
Miller 2005 Meta analysis of 8 cohort
studies/trials from Europe, US,
Canada, Australia
Lower Not reported
Seminari 2010 Italy Lower Not reported
Collazos 2011 Spain - -
Hua 2013 4 ACTG studies Lower Poorer
Summary : Outcomes
• Few changes in proportion of deaths due to liver
related events or age-standardised event rates
• Chronic HBV and HCV associated with increased
mortality and specifically liver related mortality
• HCV may be associated with poorer
immunological response following cART, evidence
for HBV more inconsistent

12/12/2014
17
Outline
• Epidemiology of HIV, HBV and HCV across Europe
• Outcomes in coinfected persons
• Issues around late presentation for hepatitis
Late presentation for hepatitis
• Of the estimated 2.3 million PLHIV in the European Region, 1
in 3 remain undiagnosed; only between 10% and 40% of
people with HCV in Europe are aware of their infection
• Undiagnosed HIV, HBV and/or HCV is harmful to the person
infected as appropriate health interventions are delayed
• Also detrimental to society, as persons unaware of their viral
infection may transmit to others more frequently than those
aware of their viral infection
• Late presentation associated with higher medical costs
• Need for innovative approaches to better target testing for
those at risk of being infected
12/12/2014
18
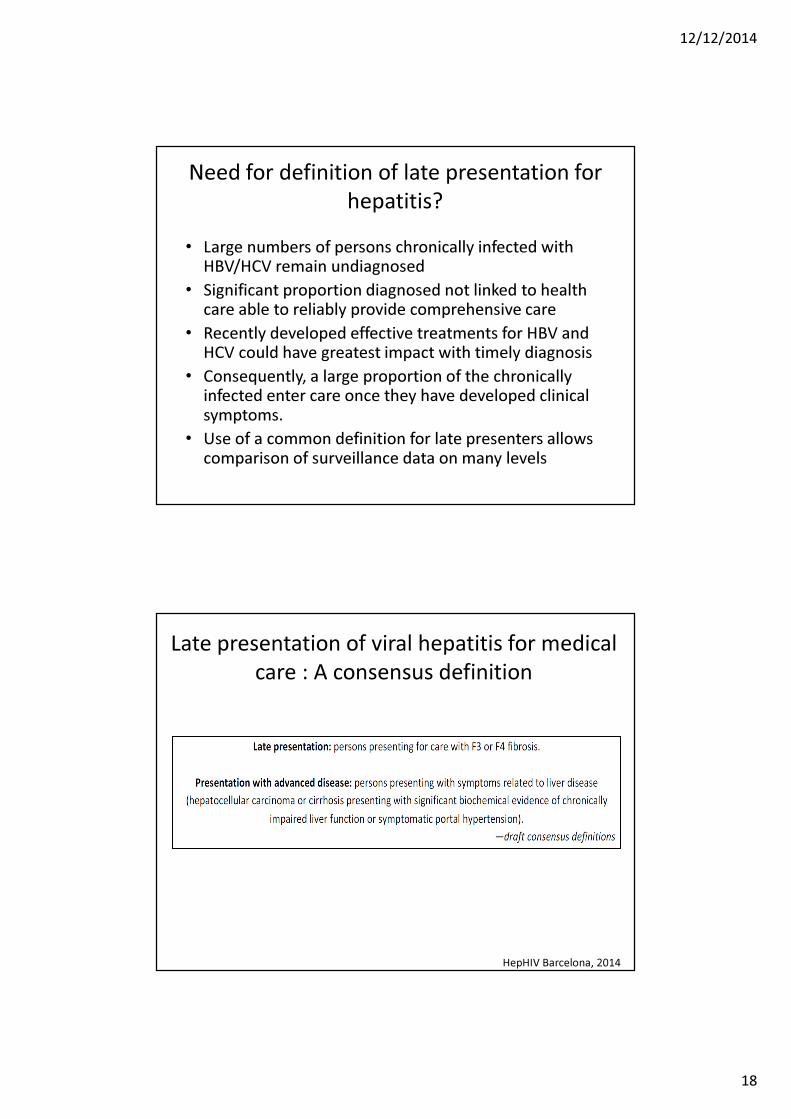
Need for definition of late presentation for
hepatitis?
• Large numbers of persons chronically infected with HBV/HCV remain undiagnosed
• Significant proportion diagnosed not linked to health care able to reliably provide comprehensive care
• Recently developed effective treatments for HBV and HCV could have greatest impact with timely diagnosis
• Consequently, a large proportion of the chronically infected enter care once they have developed clinical symptoms.
• Use of a common definition for late presenters allows comparison of surveillance data on many levels
Late presentation of viral hepatitis for medical
care : A consensus definition
HepHIV Barcelona, 2014

12/12/2014
19
Continuum of care for HBV in Greece
Papatheodoridis et al. J Viral Hepat 2014
• Telephone survey in a
representative sample of
Greek adults
• Prevalence rates age-
standardized for the Greek
adult population and
corrected for high-risk
individuals not included in
the survey
• 9974 participants
Continuum of care for HCV in USA
Yehia et al. PlosOne 2014
Meta analysis studies published 2003 – 2013;
9581 articles identified, 117 full text review and 10 included
12/12/2014
20
Summary : Late Presentation
• Late presentation remains a challenge for HIV as well as HBV and HCV
• Further work on continuum of care for both HBV and HCV needed
• Establishment of common definitions is helpful and can contribute to shape the public health response
• It will be part of the surveillance that each country undertakes as part of the governmental response to addressing HIV and viral hepatitis.
• Broad introduction of non-invasive fibrosis stage assessment will help to better characterize the hepatitis epidemic
Acknowledgements
Thanks to
Lars Peters
Jens Lundgren
Jurgen Rockstroh
Dan Grint
Colette Smith
12/12/2014
21
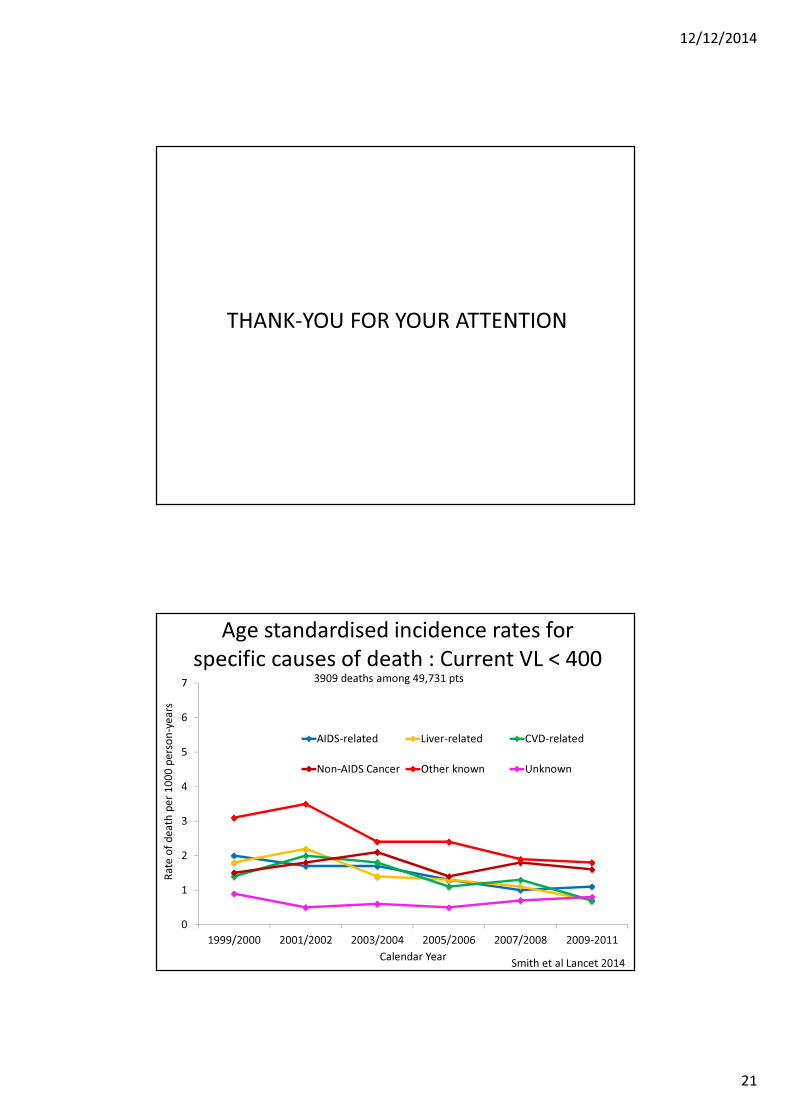
THANK-YOU FOR YOUR ATTENTION
0
1
2
3
4
5
6
7
1999/2000 2001/2002 2003/2004 2005/2006 2007/2008 2009-2011
Ra
te o
f d
ea
th p
er
10
00
pe
rso
n-y
ea
rs
Calendar Year
AIDS-related Liver-related CVD-related
Non-AIDS Cancer Other known Unknown
Age standardised incidence rates for
specific causes of death : Current VL < 400
Smith et al Lancet 2014
3909 deaths among 49,731 pts

12/12/2014
22
Diagnosis increasing faster than treatment:
WHO European Region, 1985–2011
Sources: ECDC/WHO. HIV/AIDS surveillance in Europe 2011. Stockholm: ECDC; 2012; Federal Scientific and
Methodological Center for the Prevention and Control of AIDS, Russian Federation; Ukrainian AIDS Centre, Ukraine;
WHO/UNICEF/UNAIDS monitoring and reporting on the Health Sector Response to HIV/AIDS.
People diagnosed with HIV and receiving
antiretroviral therapy (ART) in Europe (2009-2013)
12/12/2014
23
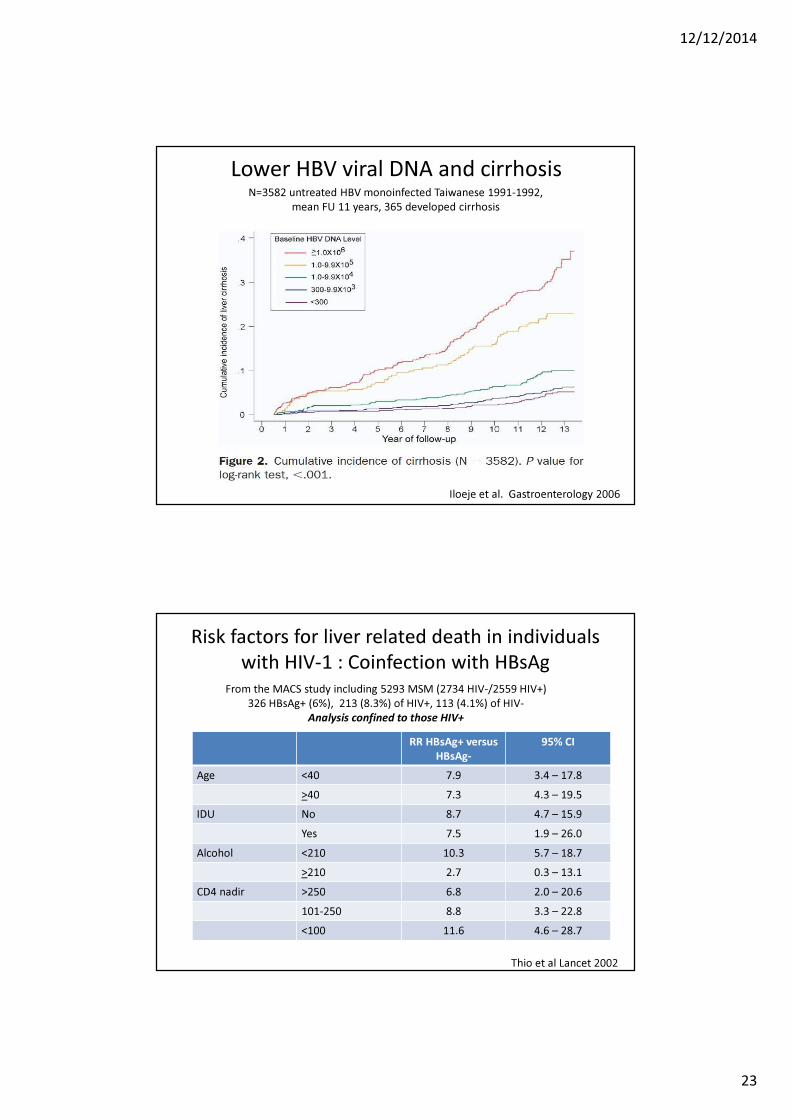
Lower HBV viral DNA and cirrhosis
Iloeje et al. Gastroenterology 2006
N=3582 untreated HBV monoinfected Taiwanese 1991-1992,
mean FU 11 years, 365 developed cirrhosis
Risk factors for liver related death in individuals
with HIV-1 : Coinfection with HBsAg
Thio et al Lancet 2002
RR HBsAg+ versus
HBsAg-
95% CI
Age <40 7.9 3.4 – 17.8
>40 7.3 4.3 – 19.5
IDU No 8.7 4.7 – 15.9
Yes 7.5 1.9 – 26.0
Alcohol <210 10.3 5.7 – 18.7
>210 2.7 0.3 – 13.1
CD4 nadir >250 6.8 2.0 – 20.6
101-250 8.8 3.3 – 22.8
<100 11.6 4.6 – 28.7
From the MACS study including 5293 MSM (2734 HIV-/2559 HIV+)
326 HBsAg+ (6%), 213 (8.3%) of HIV+, 113 (4.1%) of HIV-
Analysis confined to those HIV+
12/12/2014
24
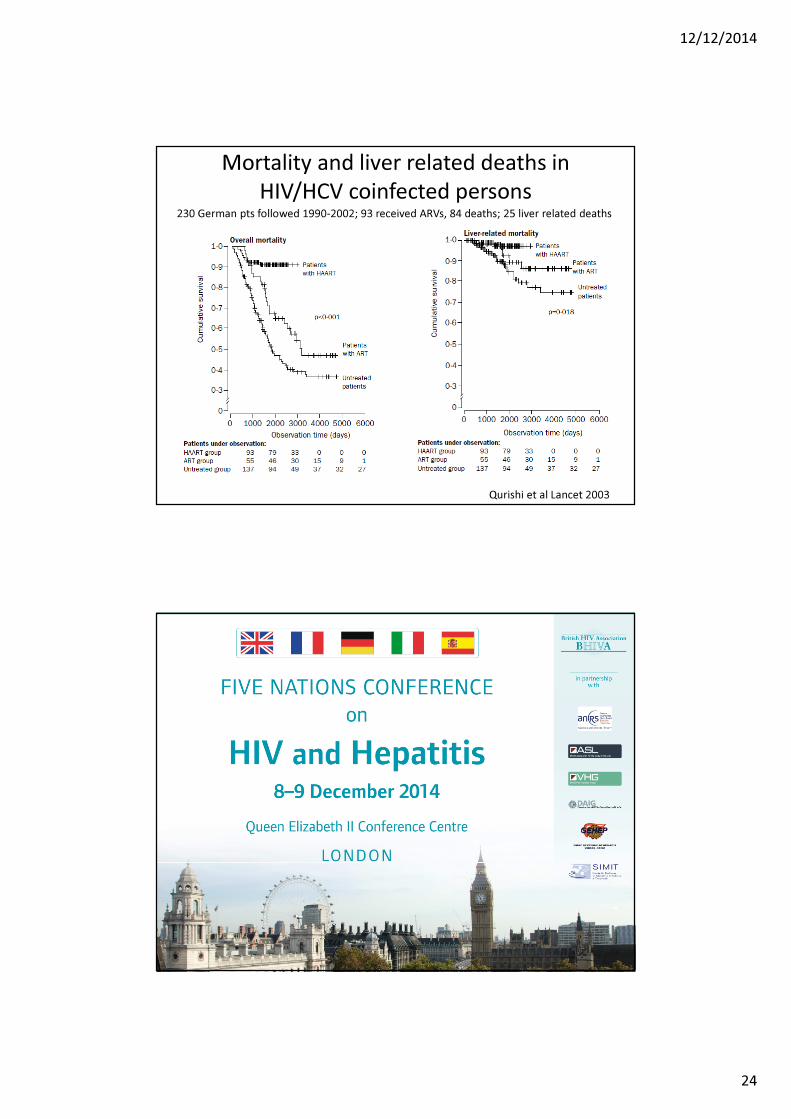
Mortality and liver related deaths in
HIV/HCV coinfected persons
Qurishi et al Lancet 2003
230 German pts followed 1990-2002; 93 received ARVs, 84 deaths; 25 liver related deaths
in partnership
with
21
Related Documents